Embed Size (px)
Citation preview

BARD COLLEGE: Climate Action Plan | i
Climate Action Plan July, 2017
Bard College

BARD COLLEGE: Climate Action Plan | i
Authorized by:
Laurie Husted (Chair) Chief Sustainability Officer, Office of Sustainability
Erin Cannan (Engagement) Dean of Student Affairs, Associate Director of the Center
for Civic Engagement
Felicia Keesing (Academics) David and Rosalie Rose Distinguished Professor of Science,
Mathematics, and Computing
Daniel Smith (Operations) Energy Manager, Office of Sustainability
Taun Toay (Planning & Administration) VP for Enrollment & Strategic Initiatives
Coleen Murphy-Alexander, Vice President for Administration
Timand Bates, Assistant Dean of Students
Jim Brudvig, Vice President for Finance & Administration, Chief Financial Officer
Katie Boyle, Director of Enrollment & Marketing, Bard CEP and MBA in Sustainability
Randy Clum, Director of Buildings & Grounds
Deanna Cochran, Director of Special Projects, Office of the Vice President for Administration
Katrina Light, Supervisor Food & Agricultural Programs, Office of Sustainability
Eliot Meyer, Undergraduate Rep (2018); Bard CEP Intern
Prepared by:
Primary Contributors
Daniel Smith Energy Manager
Laurie Husted Chief Sustainability Officer
Cover Photo: Bartlett Field Solar Array, Hudson River, & Catskills. (by Daniel Smith, 10/2015)

BARD COLLEGE: Climate Action Plan | ii
Table of Contents
1. Introduction ....................................................................................................................................... 1 1.1. Bard’s Climate Commitment ............................................................................................................... 1 1.2. The Path to Carbon-Neutrality: 2035 ............................................................................................... 2 1.3. Milestones at Bard .................................................................................................................................. 3
2. Greenhouse Gas Inventory & Projections ................................................................................ 7 2.1. Overview .................................................................................................................................................... 7 2.2. Inventory Details & Inputs ................................................................................................................... 8 2.3. Results ...................................................................................................................................................... 10 2.4. Emissions Projection .......................................................................................................................... 12 2.5. Financial Exposure to Potential GHG Regulation ..................................................................... 14 2.6. Overview of Mitigation Strategies .................................................................................................. 17
2.6.1. Mitigation Strategy Wedges ...................................................................................................................... 19 2.6.2. Financing Mitigation Strategies ............................................................................................................... 20
3. Institutionalizing The CAP: ......................................................................................................... 21 3.1. Establishing a CAP Oversight Committee .................................................................................... 21 3.2. Metrics and Tracking Progress: STARS ........................................................................................ 21 3.3. New Construction & Renovations: Aiming for Net-zero Energy ......................................... 21 3.4. Restructure Curriculum & Research Efforts to Embody CAP Goals ................................... 22
3.4.1. Undergraduate Curriculum ....................................................................................................................... 23 3.4.2. Graduate Programs in Sustainability: MS, MBA, M.Ed .................................................................... 25 3.4.3. Curricular collaborations with Bard Departments and Campus Committees ...................... 27
3.5. Sustainability and Climate as an Intrinsic Part of Campus Life ........................................... 28 3.5.1. Proposed and Ongoing Measures ............................................................................................................ 32 3.5.2. Community Outreach & Engagement .................................................................................................... 32
4. Facility Emissions ........................................................................................................................... 35 4.1. Overview ................................................................................................................................................. 35 4.2. Energy Conservation Measures in Existing Facilities.............................................................. 36
4.2.1. Milestones and Completed Projects ....................................................................................................... 36 4.3. Renewable Energy Systems .............................................................................................................. 39
4.3.1. On-site, Large-Scale Solar Photovoltaic Systems .............................................................................. 39 4.3.2. Small-scale Solar Photovoltaic Systems ............................................................................................... 41 4.3.3. Large- & Small-scale Solar Thermal Hot Water ................................................................................. 42 4.3.4. Remote-Net-Metering (RNM): Off-site, Large-scale Renewable Systems: ............................. 42 4.3.5. On-site, Micro-hydroelectric generation .............................................................................................. 42
4.4. Alternative Fuels for Heating and Back-up Generation ......................................................... 43 4.5. Reduce Waste Stream Emissions .................................................................................................... 44
4.5.1. Solid Waste Costs ........................................................................................................................................... 44 4.5.2. Reducing Solid Waste ................................................................................................................................... 44 4.5.3. Possible Future Demonstration Projects ............................................................................................. 45
4.6. Refrigerant and Fugitive Emissions .............................................................................................. 46 4.7. Purchase Renewable Electricity from Grid ................................................................................. 46
4.7.1. Direct Purchase of Renewable Electricity through an Energy Service Company................ 46 4.7.2. Indirect Purchase of Renewable Electricity as Grid Becomes Greener ................................... 46
4.8. Strategy Wedges and Timeline ........................................................................................................ 47

BARD COLLEGE: Climate Action Plan | iii
5. Fleet Vehicle Emissions ................................................................................................................ 48 5.1. Overview ................................................................................................................................................. 48 5.2. Fleet Management & Upgrades ....................................................................................................... 49 5.3. Alternative Fuels .................................................................................................................................. 49 5.4. Strategy Wedges and Timeline ........................................................................................................ 50
6. Commuting Emissions .................................................................................................................. 51 6.1. Overview of Commuting Behavior at Bard.................................................................................. 51
6.1.1. Conduct Annual Transportation Survey .................................. Error! Bookmark not defined. 6.1.2. Initial Assessment of Student Commuting Behavior at Bard....................................................... 52 6.1.3. Initial Assessment of Faculty/Staff Commuting Behavior at Bard ............................................ 53
6.2. Transportation Demand Management at Bard ......................................................................... 53 6.3. Parking Fees and Rebates ................................................................................................................. 54
6.3.1. Student Parking Fee ...................................................................................................................................... 54 6.3.2. Faculty and Staff Parking Fee.................................................................................................................... 54 6.3.3. Parking Fee Rebate ....................................................................................................................................... 55
6.4. Restrict Parking Lots and Increase Lot Enforcement .............................................................. 55 6.4.1. Restrict Freshman Parking ........................................................................................................................ 55 6.4.2. Long-term Parking Lot ................................................................................................................................ 56
6.5. Optimize Shuttle Service and Reliability ..................................................................................... 56 6.6. Encourage Bike Use ............................................................................................................................. 57
6.6.1. Expand Bike Co-op at Bard ........................................................................................................................ 57 6.6.2. BikeShare Program ....................................................................................................................................... 57 6.6.3. Make Campus More “Bike-friendly” ....................................................................................................... 58
6.7. Promote Walkability of Campus ..................................................................................................... 58 6.8. Mitigation Strategy Wedges & Timeline ...................................................................................... 59
7. Air Travel Emissions ..................................................................................................................... 60 7.1. Overview of Air Travel at Bard ........................................................................................................ 60 7.2. Reducing Air Travel ............................................................................................................................. 60
7.2.1. Create a Centralized System for Flight Booking ................................................................................ 60 7.2.2. Telecommunicating ...................................................................................................................................... 61 7.2.3. Use Alternative Transportation for Short-haul Trips ..................................................................... 61
7.3. Air Travel Emissions Reduction Timeline ................................................................................... 61
8. Additional Mitigation Actions .................................................................................................... 62 8.1. Purchase Carbon Offsets and RECs ................................................................................................ 62
8.1.1. Carbon Offsets ................................................................................................................................................. 62 8.1.2. Renewable Energy Credits (RECs) .......................................................................................................... 62 8.1.3. Estimated Cost to “Buy-our-way-out” under BAU Scenario......................................................... 63
8.2. Carbon Sequestration with Forest Management ...................................................................... 64
APPENDICES

BARD COLLEGE: Climate Action Plan | iv
ACRONYMS
ACUPCC American Colleges and Universities Climate Commitment
BCEP Bard Center for Environmental Policy
B&G Buildings and Grounds Department
BOS Bard Office of Sustainability
CACP Clean Air – Cool Planet
DOSA Dean of Student Affairs Office
EIA Energy Information Administration
EUS Environmental and Urban Studies
GHG Greenhouse gas
RCx Retro-commission
S&S Safety and Security Department
TDM Transportation Demand Management

BARD COLLEGE: Climate Action Plan | 1
1. INTRODUCTION
1.1. Bard’s Climate Commitment
Carbon Commitment: In January 2008, President Botstein signed
the American College and University Presidents’ Climate
Commitment, now called the Carbon Commitment. In doing so,
Bard College pledged to make climate change aversion an
institutional priority, and to restructure operations to achieve carbon-
neutrality by 2035. The College conducts yearly greenhouse gas
(GHG) emissions inventories using the Carbon Calculator and has
created this Climate Action Plan (CAP), a roadmap document that
describes the actions and developments needed to achieve carbon-
neutrality. In Fiscal Year 2016/2017, Bard generated roughly 15,102
metric tons of carbon dioxide equivalent of greenhouse gases
(tCO2e).
The boundary and scope of the Carbon Commitment pertains to the 550-acre Main Campus in
Annandale, NY, and to Montgomery Place, the historic 380-acre estate located south and
abutting the Annandale campus, acquired in January 2016. Future intentions are to continue to
extend the Commitment to encompass other satellites within the College’s sphere of influence,
including Bard College at Simon’s Rock and the Longy School of Music in Massachusetts.
Resilience Commitment: The College has begun to feel the effects of climate change,
particularly in the greater frequency of intense weather events, and believes that mitigation and
adaptation are complementary strategies for addressing climate risks and identifying
opportunities to flourish. Therefore, the Sustainability Council will provide a recommendation
as to whether we can increase our public pledge by taking the Climate Commitment which
includes “The Resilience Commitment.” Appendix A: Climate Change & Resiliency Planning at
Bard provides a preliminary look at how the College might proceed.

BARD COLLEGE: Climate Action Plan | 2
1.2. The Path to Carbon-Neutrality: 2035
The path to carbon-neutrality is an ongoing process, comprised of short-, medium-, and long-
term goals and strategies. Bard’s CAP is intended to be an evolving document, as milestones are
reached, new ideas and stakeholders take hold, and global economic, technological, and
environmental forces reshape society and the world. Institutionalizing the CAP with
administrative and academic oversight will ensure that mitigation strategies are actively pursued,
and that the goal of carbon-neutrality permeates the Bard community.
While changing policy and behavior is critical to this process, achieving carbon-neutrality will
ultimately rely on a considerable financial investment by Bard in the upgrade of its facilities to
offset energy consumption (roughly 50% of Bard’s emissions are related to its energy use). It
will also rely on external factors such as changes in government regulations and new
developments in technology and economy (e.g. widespread availability of electric vehicles and
charging infrastructure). For these reasons, in January 2010 the Bard Climate Commission
selected the year 2035 as an ambitious deadline to achieve carbon-neutrality— a quarter-century
in which to reshape Bard operations— recognizing the pace and severity of global climate
change while remaining logistically and economically feasible.

BARD COLLEGE: Climate Action Plan | 3
1.3. Milestones at Bard
1992 Recycling Program established
1st geothermal system installed at the original Ravine Dormitories
1995 Campus Composting Program established
1997 Community Garden opens.
2000 Resnick Commons Dorm Complex (Phase 1, buildings A thru I) opens, utilizing geothermal heating and cooling.
2002 Richard B. Fisher Center for the Performing Arts opens, utilizing geothermal heating and cooling.
2004 Bard Free Use Store opens
Re-usable material collection added to recycling and trash stations
2005 EcoRep program begins (BERPs)
Bard becomes a US EPA Energy Star ™ partner
2007 Bard first participates in Recyclemania, the national recycling competition
Operation Save New York, Bard begins participation in energy Demand Response Program to curb energy use during peak power events.
2008 President Botstein signs the American College and University Presidents Climate Commitment (ACUPCC)
US EPA WasteWise Partner
Recyclemania: 2nd Place in Food Scrap Contest
Focus the Nation on Climate Change conference
Bard begins a relationship with Old Saw Mill Farms to bring local Hudson Valley fruits and produce to campus.
First Earth Day celebrated at Bard, highlighting local food and farms, and focused on reducing Energy/ Water / Paper
BARD COLLEGE: Climate Action Plan | 4
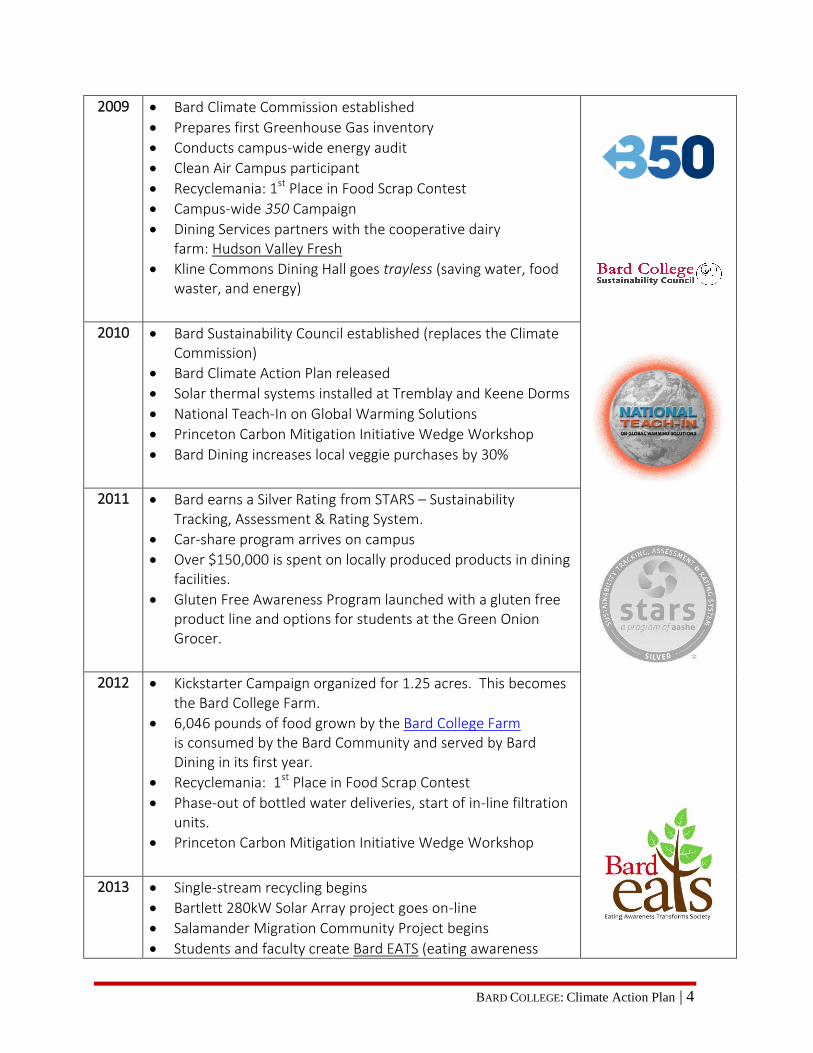
2009 Bard Climate Commission established
Prepares first Greenhouse Gas inventory
Conducts campus-wide energy audit
Clean Air Campus participant
Recyclemania: 1st Place in Food Scrap Contest
Campus-wide 350 Campaign
Dining Services partners with the cooperative dairy farm: Hudson Valley Fresh
Kline Commons Dining Hall goes trayless (saving water, food waster, and energy)
2010 Bard Sustainability Council established (replaces the Climate Commission)
Bard Climate Action Plan released
Solar thermal systems installed at Tremblay and Keene Dorms
National Teach-In on Global Warming Solutions
Princeton Carbon Mitigation Initiative Wedge Workshop
Bard Dining increases local veggie purchases by 30%
2011 Bard earns a Silver Rating from STARS – Sustainability Tracking, Assessment & Rating System.
Car-share program arrives on campus
Over $150,000 is spent on locally produced products in dining facilities.
Gluten Free Awareness Program launched with a gluten free product line and options for students at the Green Onion Grocer.
2012 Kickstarter Campaign organized for 1.25 acres. This becomes the Bard College Farm.
6,046 pounds of food grown by the Bard College Farm is consumed by the Bard Community and served by Bard Dining in its first year.
Recyclemania: 1st Place in Food Scrap Contest
Phase-out of bottled water deliveries, start of in-line filtration units.
Princeton Carbon Mitigation Initiative Wedge Workshop
2013 Single-stream recycling begins
Bartlett 280kW Solar Array project goes on-line
Salamander Migration Community Project begins
Students and faculty create Bard EATS (eating awareness

BARD COLLEGE: Climate Action Plan | 5
transforms society) council which becomes the umbrella term for all that is happening with the Bard Farm, the Real Food Challenge, and the College's commitment to sustainability around food
Real Food Challenge is signed by President Leon Botstein and VP of Finance, Jim Brudvig
Dining Services switches all oil (except for frying oil) to Grapeseed Oil (no trans-fats, non-GMO)
5.1% of Bard's food purchased is 'Real Food' (meets local, fair, ecological, and humane standards)
15,402 lbs of food from the Bard College Farm’s harvest is gleefully devoured by the Bard community.
Partnership with Winter Sun Farms - a local food hub dedicated
2014 Regional Demonstration Project in Green Infrastructure at Olin Parking Lot renovates the compacted gravel lot into stormwater management project, with pervious pavement, reconstructed wetland, and bioswales.
Recyclemania: 1st Place Food Scrap Contest
Top Ten in Campus Conservation Nationals
Soda machine is removed from the all-you-can-eat servery in Kline Commons.
New Composting bins are placed in Kline to highlight the 25% of the post-consumer food waste that is composted (utilized by rge Bard College Horticulture Department).
20,486 lbs of food is harvested from the Bard College Farm and served to the community. The farm also builds a barn with cold storage abilities.
The 4th annual Food Day Celebration
2015 Bard receives a Gold rating from STARS
Purchase of Renewable Energy Credits representing 10% electricity offsets
Reforming the Energy Vision Campus Challenge Achiever
Resnick Commons Dorm Complex complete with 14 geothermal buildings
Bard Dining reaches 22% 'Real Food,' five years ahead of the Real Food Challenge Campus Commitment.
Bard Dining has purchased a total of 60,000 pounds of fresh produce from the Bard Farm since its conception.
Bard Eats creates an elected position in student government
A student club organizes a food donation program linking

BARD COLLEGE: Climate Action Plan | 6
Bard Dining and a soup kitchen in Kingston, NY.
Bard participates in regional Food Waste Audit to strategize food waste reduction efforts.
Bard Celebrates Food Days, expanding food sustainability programming to an entire week including participation in NY’s Campus Crunch event.
2016 Bard purchases historic 380-acre Montgomery Place Estate (includes apple orchard and greenhouse)
NYSERDA Energy to Lead Micro Hydropower Award, to study implementation of electricity generation at small to medium dams at Bard and across NY.
Bard contracts a herd of local goats to “mow” the Blithwood vistas.
Saw Kill Watershed Community established
1st Place in Chartwell's "Carbon Footprint" challenge for increasing plant-based menu engineering and reducing carbon emissions associated with food production
Created student-chosen meals program
Bard celebrates Earth Days, expanding food sustainability programming to an entire week including participation in Bard’s Teach-In.
Student Council purchases the Urban Cultivator to produce microgreens for Down the Road Cafe
Bard Farm produces 22,000 pounds of produce that is served in the dining hall.
Harvest of the Month Program is created to increase seasonal produce offerings.
2017 Bard achieves Gold Rating from STARS
College hires Supervisor of Food & Agricultural Programs
New Bard Master Plan includes sustainability?
Sustainability Starter kits are given to every first year student
The mobile teaching kitchen is created to teach students how to cook.
Green Onion grocer eliminates plastic bags and begins to offer bulk food and beverages.
DOE Better Buildings Challenge: Bard enters Richard B. Fisher Center for the Performing Arts as showcase building

BARD COLLEGE: Climate Action Plan | 7
2. GREENHOUSE GAS INVENTORY & PROJECTIONS
2.1. Overview
GHG emissions from Bard operations come from a variety of direct and indirect sources, which
are categorized into three scopes:
Scope 1: All direct GHG emissions from on-site fuel combustion and fleet operations.
Scope 2: Indirect GHG emissions from consumption of purchased energy (utility electricity,
district heating/cooling).
Scope 3: Other indirect emissions, such as commuting activities in vehicles not owned or
controlled by the reporting entity, upstream electric and fuel distribution losses,
outsourced activities, waste disposal, refrigerant leaks, etc.
Figure 2.1 depicts the range of possible sources of Scope 1, 2, and 3 emissions to be accounted
for when conducting a GHG inventory, based on the type of direct and indirect activities
undertaken by a company or institution.
Figure 2.1 Possible sources of direct and indirect Scope 1, 2, and 3 greenhouse gas emissions.
(SOURCE: Greenhouse Gas Protocol Initiative, www.ghgprotocol.org, 2016)
BARD COLLEGE: Climate Action Plan | 8
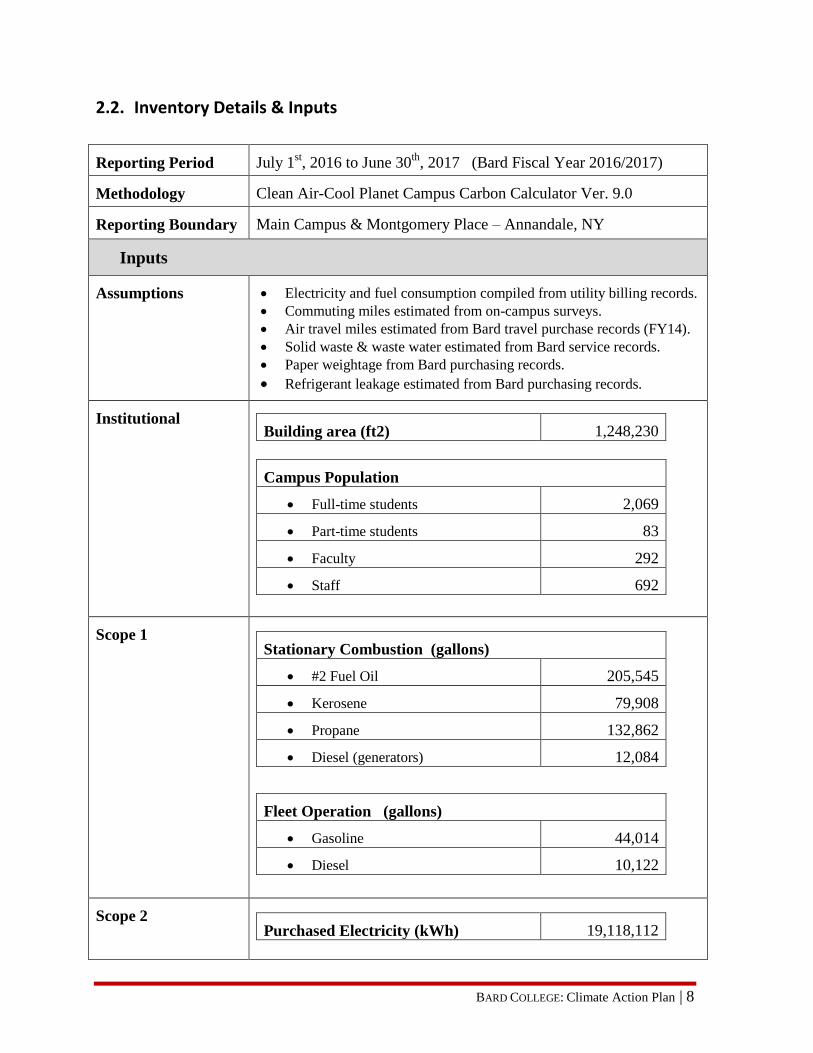
2.2. Inventory Details & Inputs
Reporting Period July 1st, 2016 to June 30
th, 2017 (Bard Fiscal Year 2016/2017)
Methodology Clean Air-Cool Planet Campus Carbon Calculator Ver. 9.0
Reporting Boundary Main Campus & Montgomery Place – Annandale, NY
Inputs
Assumptions Electricity and fuel consumption compiled from utility billing records.
Commuting miles estimated from on-campus surveys.
Air travel miles estimated from Bard travel purchase records (FY14).
Solid waste & waste water estimated from Bard service records.
Paper weightage from Bard purchasing records.
Refrigerant leakage estimated from Bard purchasing records.
Institutional
Building area (ft2) 1,248,230
Campus Population
Full-time students 2,069
Part-time students 83
Faculty 292
Staff 692
Scope 1
Stationary Combustion (gallons)
#2 Fuel Oil 205,545
Kerosene 79,908
Propane 132,862
Diesel (generators) 12,084
Fleet Operation (gallons)
Gasoline 44,014
Diesel 10,122
Scope 2
Purchased Electricity (kWh) 19,118,112

BARD COLLEGE: Climate Action Plan | 9
Scope 3
Faculty / Staff Commuting (travel miles)
Automobile 5,661,311
Bus 10,665
Commuter Rail 126,312
Carbon-free Modes 37,316
Student Commuting (travel miles)
Automobile 1,779,332
Bus / Bard Shuttle 515.424
Commuter Rail 0
Carbon-free Modes 658,485
Air Travel (passenger miles) 7,554,500
Landfilled Waste (short tons)
CH4 Recovery & Flaring 409
Wastewater (gallons)
Central Treatment System (Aerobic) 37,288,323
Paper Purchases (lbs)
0% Recycled 10,988
30% Recycled 11,040
100% Recycled 1,190
Offsets & RECs
On-site Composting (short tons) 214
Renewable Energy Credits (kWh) 2,000,000

BARD COLLEGE: Climate Action Plan | 10
2.3. Results
Figure 2.2 presents the GHG inventory results for the 2016/17 fiscal year. Bard operations
produced total gross emissions of 15,102 metric tons of CO2 equivalent (tCO2e), not accounting
for any carbon offsets. Table 2.1 shows the tabulated net results from the inventory, including
439 tons in carbon offsets, for total net emissions of 14,662 tCO2e.
Excluded from this assessment are emissions associated with food production and procurement
by Chartwells, the College’s food service provider. Using the CarbonMapTM
software,
Chartwells estimated the emissions from menu engineering for 2016 at an additional 1104 tCO2e.
While currently not included in the GHG inventory figures, Bard recognizes this as legitimate
source of emissions to be integrated into future inventories and CAP planning.
GHG Inventory for Fiscal Year 2016/2017 (tCO2e, %)
Figure 2.2 Total Gross Emissions = 15,102 tCO2e

BARD COLLEGE: Climate Action Plan | 11
Table 2.1 Net GHG Emissions for Fiscal Year 2016/17
Emissions Source tCO2e %
Scope 1
Stationary Combustion 3,734.9 24.7
Fleet 492.2 3.3
Refrigerants 212.8 1,4
Sub-total 4,439.9 29.4
Scope 2
Purchased Electricity 3,592.6 23.8
Sub-total 3,592.6 23.8
Scope 3
Student Commuting 814.4 5.4
Faculty / Staff Commuting 2,076.8 13.8
Air Travel 3,644.4 24.1
Solid Waste 126.8 0.8
Waste Water 18.1 0.1
Paper Purchasing 26.0 0.2
Scope 2 T&D Losses 362.7 2.4
Sub-total 7,069.3 46.8
Carbon Offsets
On-site Composting - 62.9 - 0.4
Renewable Energy Credits - 375.8 - 2.6
Sub-total - 438.7 - 2.9
Net Total 14,663.0 97.1%

BARD COLLEGE: Climate Action Plan | 12
2.4. Emissions Projection
Figure 2.3 presents Bard’s GHG inventory projected from 2017 through 2035 under a Business-
As-Usual (BAU) scenario, using net emission totals from the 2016/17 GHG inventory as the
starting value. BAU does not assume the development of new technologies, regulations, or other
major changes in consumption patterns that are difficult to forecast. Table 2.2 provides the
details and assumptions used in the projection.
In summary, Bard as an institution is expected to remain roughly constant in size, population,
and operational scope, with near-, mid-, and long-terms plans for moderate increases in building
area in the lead up to 2035. Under this BAU scenario, annual emissions produced from Bard
operations are expected to grow from 15,102 tCO2e in 2017, to 15,603 tCO2e by 2035, roughly a
500 ton, or 3.3%, increase in annual emissions.
Figure 2.3 BAU Projection of Bard College’s annual GHG emissions. BAU presents a marginal growth in institutional size and operation scope, with annual emissions estimated to reach 15,603 tCO2e by 2035.

BARD COLLEGE: Climate Action Plan | 13
Table 2.2 Details and Assumptions for Growth Projection 2017 - 2035
Building Area Growth
Period Notes Growth Area
Added (ft2)
Total Area (ft2)
2016 Main Campus --- --- 1,204,980
2016/17 Acquisition of Montgomery Place Estate.
3.6 % 43,250 1,248,230
2018 – 2025
Near-term plans for new construction include:
- New Science Center - Kline Addition - Gym Addition - Library Addition
9.1 % 140,000 1,362,230
2026 – 2035
Mid- to long-term plans include several proposed new buildings
4.4 % 60,000 1,422,230
Population
The number of students, faculty, and staff is expected to remain roughly constant through to 2035, with marginal growth. All population-related emissions metrics (e.g. commuting, waste output, energy demand, air travel, etc.) are expected to remain stable.
Energy Consumption
Energy consumption growth is proportional to increases in building square footage.
All new construction is defaulted to electric heat pump heating & cooling (e.g. geothermal, air-to-air, etc.), therefor any increase in energy consumption is expected to be for electricity only (i.e. no growth in oil or gas consumption).
Fleet size is expected to remain stable.

BARD COLLEGE: Climate Action Plan | 14
2.5. Financial Exposure to Potential GHG Regulation
The future of GHG regulation is uncertain. Legislation and financial mechanisms used to curb
emissions could affect colleges and universities, and make GHG emissions a financial liability.
Analysis performed by the World Resources Institute1 can provide an example scenario for the
annual cost of purchasing carbon allowances (or offsets) through 2050. It forecasts the impact of
recent legislative initiatives to cut emissions, summarized in Figure 2.4. Price scenarios for
carbon allowances under H.R. 2454 compiled by EPA (Figure 2.5) show a wide range in
possible cost-per-ton of emissions.
Figure 2.4 World Resources Institute analysis of net emission reductions under current Cap-and-Trade proposals, shown in graphical and tabulated form.
1 World Resources Institute, 2009. “Emission reductions under cap-and-trade proposals in 111
th Congress.”
Retrieved 12/29/09 from http://pdf.wri.org/usclimatetargets_2009-12-17.pdf

BARD COLLEGE: Climate Action Plan | 15
Figure 2.5 Carbon Allowance Price Projection Scenarios. For a complete description of scenario assumptions and methodology, visit webpage:
http://pdf.wri.org/usclimatetargets_2009-12-17.pdf
Assuming that colleges and universities will become regulated and must comply with reduction
benchmarks, the following parameters were used to estimate a potential cost for Bard’s GHG
emissions through 2050:
• Regulations and costs will kick-in as early as 2020.
• A BAU scenario for growth of Bard’s annual emissions over time (see Figure 2.3).
• A reductions timeline as under Waxman-Markey H.R. 2454 with emissions cap only (see
Figure 2.4).
• Prices for carbon allowances under H.R. 2454 follow the “basic” scenario (see Figure 2.5).
• The composition (%-mix) of grid electricity coming from renewable sources follows the
New York State growth scenario (see Section 4.7.2).
This baseline cost scenario is depicted in Figure 2.6, for which the present value cost of
purchasing allowances to meet reduction benchmarks accumulates to roughly $3.06 million
through 2050.

BARD COLLEGE: Climate Action Plan | 16
Figure 2.6 Potential Financial Exposure from Proposed Climate Change Legislation. The present value cost of purchasing allowances to comply with reductions benchmarks accumulates to roughly $3.06 million through 2050.

BARD COLLEGE: Climate Action Plan | 17
2.6. Overview of Mitigation Strategies
Averting or mitigating global climate change may be the greatest challenge humanity has ever
faced. It will require a significant allocation of time, effort, and resources, and pursuit of multiple
mitigation strategies on an accelerated timeline. The task is, no doubt, daunting; but by taking
integral steps, building upon success, and continually resetting the goals for greater emissions
reductions, reaching carbon-neutrality, at an institutional and global scale, is possible.
To date, Bard has had success in completing major initiatives, including the establishment of the
Bard Sustainability Council (2010) and participation in STARS (rated Silver in 2011, and Gold,
2014 and 2017), completing large energy efficiency and renewable energy projects, and
integrating sustainable practices into campus life and academic curriculum. Some strategies
have yet to be fully explored; however, continued collaboration between the Bard Office of
Sustainability, Operations, Sustainability Council, and Administrative and Academic
Departments continue to investigate new technologies, vet proposals, and develop new projects
will ensure a “full hopper” of initiatives to pursue.
Table 2.3 defines the major categories into which individual mitigation strategies are grouped,
while Table 2.4 summarizes, by category, a comprehensive list of near-, mid-, and long-term
strategies to be implemented by Bard to reduce Scope 1, 2, and 3 emissions. The following
chapters and subsections are laid out in this order, and address the status of each strategy in
detail.
Table 2.3 Mitigation Strategies by Category
• Integrate CAP goals into fabric of Bard operations & academic life Institutional
• Reduce building energy consumption and waste streams Facilities
• Reduce emissions from Bard-operated vehicles Fleet
• Transportation demand management to alter commuter behavior Commuting
• Reduce or offset emissions from Bard-funded air travel Air Travel
• Purchase carbon offsets & renewable energy credits Purchase Offsets

BARD COLLEGE: Climate Action Plan | 18
Table 2.4 Summary of Mitigation Strategies
Institutional Actions (Scope 1, 2, & 3) • Continue to support efforts of the Sustainability Council (est. 2010), a mixed-body of
students, faculty, and staff tasked with implementing sustainability initiatives and to continually review and update CAP goals.
• Restructure academic curriculum to embody CAP goals • Institute sustainability as an intrinsic part of student life and Bard Community • Adopt a Green Building Standard for new construction & major renovations.
Facilities Actions (Scope 1 & 2)
• Implement energy conservation measures in all existing facilities, including: o Systematic energy audits and recommissioning of facilities o Weatherize and insulate building envelopes o Upgrade HVAC and controls systems o Install energy efficient lighting o Install energy sub-metering
• Invest in renewable energy systems, including: o On-site solar photovoltaic or solar thermal o Off-site solar photovoltaic (Remote Net Metering)
• Fuel switch from fossil fuels to electric and carbon-neutral biofuels • Reduce waste streams • Develop refrigerant and fugitive emissions reduction measures • Purchase renewable electricity from grid
Fleet Actions (Scope 1)
• Utilize renewable biofuels where possible. • Systematically upgrade fleet to low- and no-emissions vehicles
Commuter Actions (Scope 3)
• Implement Transportation Demand Management (TDM) policy that encourages students, faculty and staff to use alternative forms of transportation to commute to, from, and about campus, including busing, carpool, bicycling or walking.
• Switch to electric vehicles and increase availability of charging infrastructure.
Air Travel Actions (Scope 3)
• Create centralized system for booking air travel to track expenses and emissions • Increase telecommunication and reduce amount of approved flights • Purchase carbon offsets
Additional Actions (Scope 1, 2, & 3)
• Purchase carbon offsets and RECs
BARD COLLEGE: Climate Action Plan | 19
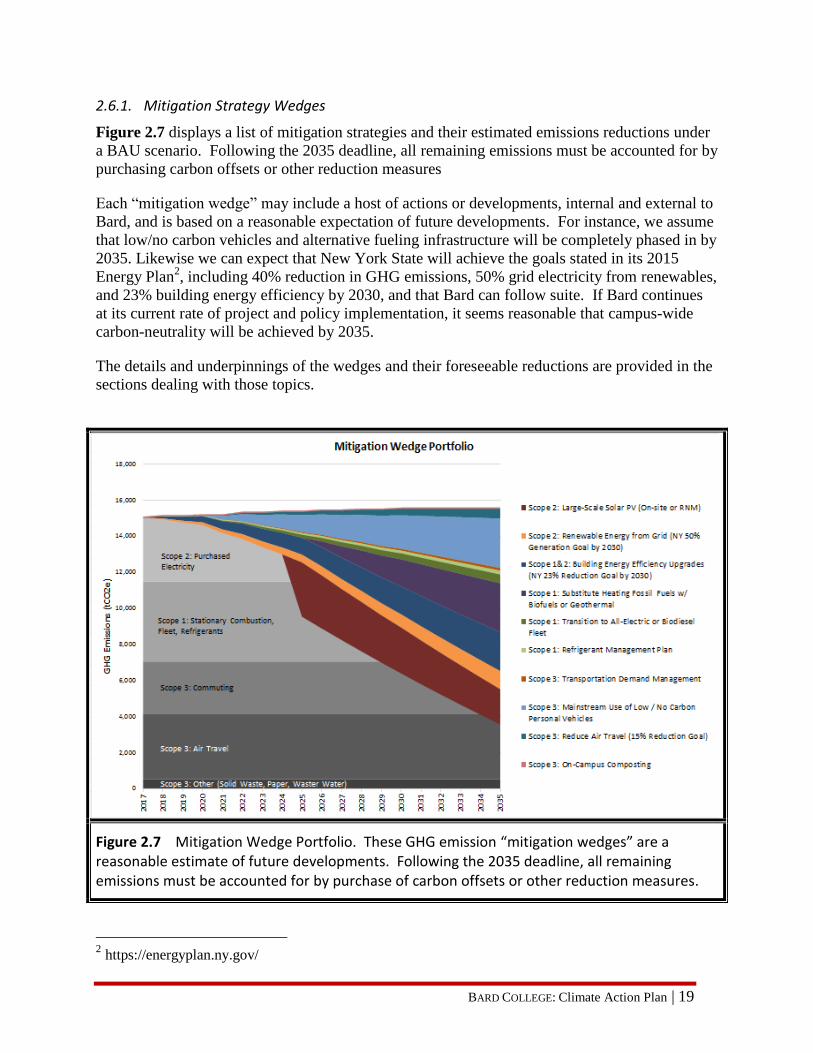
2.6.1. Mitigation Strategy Wedges
Figure 2.7 displays a list of mitigation strategies and their estimated emissions reductions under
a BAU scenario. Following the 2035 deadline, all remaining emissions must be accounted for by
purchasing carbon offsets or other reduction measures
Each “mitigation wedge” may include a host of actions or developments, internal and external to
Bard, and is based on a reasonable expectation of future developments. For instance, we assume
that low/no carbon vehicles and alternative fueling infrastructure will be completely phased in by
2035. Likewise we can expect that New York State will achieve the goals stated in its 2015
Energy Plan2, including 40% reduction in GHG emissions, 50% grid electricity from renewables,
and 23% building energy efficiency by 2030, and that Bard can follow suite. If Bard continues
at its current rate of project and policy implementation, it seems reasonable that campus-wide
carbon-neutrality will be achieved by 2035.
The details and underpinnings of the wedges and their foreseeable reductions are provided in the
sections dealing with those topics.
Figure 2.7 Mitigation Wedge Portfolio. These GHG emission “mitigation wedges” are a reasonable estimate of future developments. Following the 2035 deadline, all remaining emissions must be accounted for by purchase of carbon offsets or other reduction measures.
2 https://energyplan.ny.gov/

BARD COLLEGE: Climate Action Plan | 20
2.6.2. Funding Mitigation Strategies
Bard has several means of funding carbon-reducing projects, particularly energy-saving projects.
Each year, Bard allocates a large portion of its operating budget toward an A-list of large capital
projects, and chooses several projects to implement that year. Generally, a few of the chosen
projects have energy-saving attributes (e.g. upgrades to lighting, HVAC, envelope and
fenestration, etc.). Likewise, the Building & Grounds Department will spend a portion of its
annual budget on small- to medium-size projects with attributable energy savings.
BOS has had success in leveraging government and utility incentive programs to offset the costs
of implementation and shorten paybacks. NYSERDA programs provide cost-share for technical
studies, commissioning, and implementation, while Central Hudson Utility has provided rebates
for high-efficiency lighting and equipment, at times reducing costs by 50% or more. For
example, strategic use of NYSERDA incentives and a pre-paid Power Purchase Agreement
funded development of the 280kW-DC solar array on the Bard campus (see Section 4.3.1).
The Green Fund is an account funded by annual parking registrations fees, revenue from
participation in grid demand response programs, and other various sources. BOS and B&G use
this money to fund energy studies and small sustainability projects, as well as to support projects
with a funding boost to help secure a more sustainable outcome.
A rough tally of Bard’s investment in energy-saving projects is $1.95M from 2010-2016,
securing roughly $787,000 in incentives and an estimated $301,000 in annual energy cost-
savings.
Other future funding opportunities include:
Self-financing energy performance contracts
Revolving funds that are replenished by savings generated by conservation measures
Grants from government, foundations or business partners
Alumni donations and other fundraising
Student activity fees and graduating class gifts
BARD COLLEGE: Climate Action Plan | 21
3. INSTITUTIONALIZING THE CAP:
3.1. Establishing a CAP Oversight Committee
In Fall 2010, Bard established the Sustainability Council: a mixed-body of staff, faculty,
students, and administrators, who meet regularly to discuss all manner of sustainability topics
and to coordinate related efforts. The student position is elected by the student body. One
faculty position is nominated by the Environmental & Urban Studies Program. As part of its
mission, the Sustainability Council (SC) helps review and develop sustainability-related
programs and projects (including research, coordinating events, and spearheading initiatives),
and oversees the college’s participation in STARS and other rating systems.
3.2. Metrics and Tracking Progress: STARS
To establish a method of evaluating and tracking progress towards carbon-neutrality and
Sustainable living, Bard participates in STARS – the Sustainability Tracking, Assessment and
Rating System. Launched by AASHE, STARS is a voluntary, self-reporting framework for
colleges and universities to gauge their progress in sustainability. The STARS reporting system
is robust and covers a wide variety of topics, including energy and operations, dining services
and food sourcing, academic curriculum, and institutional investments. The guidelines and
metrics provide a solid platform for institutions to evaluate their “level of sustainability” and to
track progress without having to invent their own methodology. Although a major undertaking,
the reporting requirements force an institute to take stock of its carbon footprint in a broad sense,
to track success, and learn where to improve.
Bard achieved STARS Silver in 2011, Gold in 2014, and Gold in 2017,
3.3. New Construction & Renovations: Aiming for Net-zero Energy
By designing new construction and renovations projects to maximize energy efficiency from the
onset, Bard can physically grow as an institution while stabilizing and eventually reducing its
energy and carbon footprints. To date, Bard has had success with incorporating “green building
designs” into new construction and renovations, including high-efficiency insulation, lighting,
and HVAC systems. Bard has successfully adopted a de facto standard for using geothermal
technologies for new construction (roughly 40% of total building square footage uses the
technology), and uses the NYSERDA Technical Assistance and New Construction Programs to
help identify and implement energy-saving measures during design and construction phases.
While “net-zero energy” for a building can be difficult to achieve, especially for existing
buildings, it is attainable. To ensure that Bard is on the path to achieving net-zero energy in new
construction, and maximizing energy efficiency in existing buildings, Bard should formally
adopt a “green building standard and design protocol” to incorporate into all major projects. For
instance, use of the US Green Building Council’s LEED (Leadership in Energy Efficiency

BARD COLLEGE: Climate Action Plan | 22
Design) programs for new construction, renovations, and operation and maintenance, can help
provide guidance, metrics, and checklists to ensure a high-performance building.
Bard’s energy efficiency goals are largely supported by New York’s progressive energy code
and building regulations. With its construction code previously updated to 2012 IECC standards,
in October 2016, New York again updated its minimum standards to the 2015 IECC and
ASHRAE 90.1-2013, with all changes demanding even greater efficiency in buildings and
equipment.3 Furthermore, the state is currently undergoing state-wide reform in energy policy,
the New York State Reforming the Energy Vision (REV) program. Two of the overarching
strategies include driving construction practices toward Zero Net Energy and on-site renewable
solutions to reduce fossil fuel consumption. Bard will actively pursue the benefits offered by
assistance programs in these areas. The College’s recent agreement to participate in the DOE
Better Buildings Challenge (to achieve 20% building energy efficiency within 10 years of
signing commitment) and REV Campus Challenge will assist in these efforts.
3.4. Restructure Curriculum & Research Efforts to Embody CAP Goals
(…continued from Section 1)
Bard Sustainability Council has developed, and has oversight responsibility on, a planning
document that integrate sustainability in the curriculum and research efforts of the college
(“Sustainability in Curriculum and Research Plan”). Climate goals will be made explicit in
that document. To help carry out the goals, all staff, faculty and students have access to
Sustainability Council Green Fund mini grant assistance to develop sustainability courses and
research projects
The following are specific places to integrate climate in the currciulum and research:
3
https://www.energycodes.gov/adoption/states/new-york

BARD COLLEGE: Climate Action Plan | 23
Undergraduate Curriculum: Environmental and Urban Studies, Language & Thinking
First Year Seminar, Citizen Science, and other academic programs offer programming
and courses for all students. Graduate programs, includings the Bard Center for Environmental Policy connect
environmental policy graduate students to undergraduate campus, especially through
monthly policy calls and courses
Bard Departments and Campus Committees create a living learning environment that
enhance the student co-curricular educational experience around climate and
sustainability issues
Outside Groups: relationships with outside organizations and institutes including the local
municipal governments, Environmental Consortium of Hudson Valley Colleges &
Universities, Rockefeller University, and Cary Institute offer opportunities for students to
volunteer, work and study in fields related to climate and sustainability.
3.4.1. Undergraduate Curriculum
In recognition of the importance of sustainability in liberal arts education, Bard offers over 70
courses related to the three prongs of sustainability: economic, social, and environmental. Many
of these courses are offered or cross-listed by the Environmental and Urban Studies program
(EUS), which draws on courses from all four divisions—Social Studies, Science, Arts, and
Language & Literature. This currently represents 16% of the Bard curriculum, with a goal to
reach 20% of courses relating to sustainability.
Bard’s Engaged Liberal Arts and Sciences (ELAS) courses are designed to link coursework and
critical thinking skills developed and practiced by Bard undergraduates in the classroom with
civic and other forms of engagement activities that contextualize course materials and enhance
learning. A significant portion of the learning takes place outside of the classroom: students learn
through engagement with different geographies, organizations, and programs in the surrounding
communities or in the national and international venues in which Bard is involved. ELAS
courses challenge students to develop creative approaches to social, cultural and scientific issues.
Students are exposed to an array of perspectives and contexts and given the opportunity to apply
theory to practice.
Engaged liberal arts and sciences classes may involve a variety of activities, but emphasize
reflective learning. Community engagement is not based on “service,” but on respect and
reciprocity. Such an emphasis encourages open exchanges, collaboration, and the potential to
produce new forms of knowledge. There is a particular opportunity to systematically incorporate
sustainability into ELAS courses.
Environmental & Urban Studies
EUS—the standard-bearer for sustainability curriculum at Bard College—is a transdisciplinary
program that examines the interdependence of human societies and the physical environment.
The program strives to ensure that majors have a solid background in the physical sciences, the
humanities, economics, and policy—and understand what sustainability means in the real world.

BARD COLLEGE: Climate Action Plan | 24
EUS aims to enhance students' understanding of the complexities of environmental and urban
issues and their awareness of interrelationships between built and "natural" environments.
The Hudson River forms a laboratory for an integrated understanding of local and global social,
economic, and environmental transformation. EUS professor Dr. Eli Dueker initiated the Saw
Kill Watershed Community (SKWC) to bring the college and community together to protect our
local watershed. The SKWC builds on previous EUS initiatives working with the NYS DEC
Hudson River Estuary Program (HREP) such as the American Eel Monitoring Project, Day in
the Life of the Hudson River, and the Amphibian Migration project. EUS professor Dr. Bruce
Robertson is the director of the Bard Field Station on the shore of the Hudson’s Tivoli Bays
Wildlife Management Area. EUS collaborates with Hudsonia, Riverkeeper, Hudson River Sloop
Clearwater, Hudson River National Estuarine Research Reserve, Scenic Hudson, and the Cary
Institute for Ecosystem studies to provide enhanced educational and research opportunities for
students.
EUS works with the Center for Civic Engagement to provide students volunteer, internship, and
study abroad opportunities. This includes an internships newsletter, collaboration on the Bard
Globalization and International Affairs Program in New York City (BGIA), and a rich variety of
internship and junior-year abroad programs.
Students also draw on resources at the Bard Center for Environmental Policy (Bard CEP). Bard
CEP offers graduate courses to advanced undergraduates, research opportunities on Asia & the
Environment, and a 3+2 program.
The EUS Colloquium, open to all students, faculty and staff, (1) exposes students to disciplinary
and trans-disciplinary research and thinking in environmental and urban studies, especially by
our own faculty; (2) enhances faculty members' awareness of one another's work, with a view to
developing a coherent and integrated EUS program; and (3) provides a forum for EUS students
to present their own work and to develop their rhetorical and collaborative skills via
presentations initiated and designed by themselves. Recent examples have covered
environmentalism, agriculture, and climate change.
The EUS Practicum is open to all students and is intended to (1) expose students to local, real-
world problems, (2) expose students to local sustainability organizations, and (3) give students
experience in solving problems through collaboration with peers and local experts. Recent
examples have covered sea-level rise in the Hudson River, sustainable trail design,
environmental education, disaster management, strengthening the on campus food system and
sustainable urban/regional development.
EUS will work with BOS to address on campus problems in the Practicum and through
independent student projects.
Curricular Goals, Programs and Projects in Development
The Office of the Dean of the College (DOC) sponsors speakers that encourage multi department
collaborations, runs three First Year student experiences—Language & Thinking (L&T), Citizen
Science, and First Year Seminar (FYSEM), as well as the Institute for Writing and Thinking

BARD COLLEGE: Climate Action Plan | 25
(IWT). The DOC has shown commitment to sustainability goals in the Plan through service to
the Sustainability Council and support of sustainability funding. In 2011, the DOC worked with
EUS to secure funding from the Mellon Foundation to enhance the EUS curriculum. The Mellon
Grant helped bring in environmental scientist Dr. Eli Dueker (see SKWC below), helped hire
experienced Hudson River environmental educator Tom O’Dowd (Master of Science) as
Executive Administrator, and helped enhance EUS courses (such as the colloquium and
practicum), EUS internships, and EUS senior projects.
In addition to expanding on existing programs and department efforts, the following measures
remain under evaluation in order to integrate an environmental literacy requirement into the
college curriculum.
The College is assessing whether we can establish an environmental institute to serve as a
coordinating structure for faculty, staff, students and the outside community that will
catalyze new research, outreach and teaching efforts
Establish a January term course for all students to tackle global scientific issues that
require sustainable solutions.
Modify existing successful models already in place at the college including Language &
Thinking requirement and First Year Seminar to incorporate sustainability and climate
theme
Incorporate sustainability and climate projects into existing classes to solve campus
problems
Create an incentive program for faculty members who adapt their curricula to include an
element of climate and sustainability literacy
Consider revisions to tenure review process that reward interdisciplinary work
Coordinate guest lecture series across programs/departments/graduate/undergraduate
groups
Develop multi-disciplinary course, team-taught, and open to non-EUS majors, offered
each semester
Establish a campus ‘curricular trail’ with content contributed by each Division
Provide a campus sustainability project reference list for EUS 101 term projects or for
use in other classes
Re-inventory courses to again identify those with sustainability components, and get
keyword ‘sustainability’ or other code in course descriptions. Use this inventory to
identify patterns of exposure to theme with a goal of filling gaps
Evaluate revision to the College’s mission statement to include climate commitment
Insert new “sustainability” language in job postings
Identify a common reading or readings (Pope’s Encyclical on the Environment was added
to L&T for FY18)
3.4.2. Graduate Programs in Sustainability: MS, MBA, M.Ed
Prior to 20010, undergraduate contact with CEP had taken place informally through campus-
wide teach-ins (Focus the Nation, 2008 and the Global Warming Teach-In, Spring 2009.
Interactions with the undergraduates and campus life were made more formal through the

BARD COLLEGE: Climate Action Plan | 26
leadership of the new Graduate Programs in Sustainability Director, including via a 350
conference (Fall 2009) and the Global Warming Teach-In (Spring 2010), bimonthly climate
calls, a speaker series, term projects for first year students and internship position with BOS and
BardEATS.
BardCEP will work with BOS to address on campus problems in the Practicum and through
independent student projects. Examples include the implications of converting from fuel oil to
biofuels versus propane, carbon reduction associated with menu engineering, etc.
The Center for Environmental Policy (CEP) offers graduate degrees, sponsors national policy
initiatives, and provides a forum for interactions with the undergraduate community. Academic
programs offered include: M.S. in Environmental Policy, M.S. in Climate Science and Policy,
M.S./ J.D. dual-degree with Pace Law School in Environmental Policy/ Environmental Law,
Peace Corps Master's International (M.I.) Program in Environmental Policy, M.S./M.A.T. dual-
degree with the Bard College Master of Arts in Teaching Program, and a Professional Certificate
in Environmental Policy. In conjunction with the M.A.T., CEP intends to begin offering an
M.Ed. in Environmental Policy beginning Fall 2017. Bard undergraduates may pursue a 3+2
degree through CEP, earning an M.S. degree in five years
The Bard MBA Program is one of a select few programs worldwide that fully integrates
sustainability into a core graduate business curriculum. Based in New York City, the low-
residency structure combines weekend-intensive in-person classes supplemented by on-line
instruction.
Bard’s Graduate Programs in Sustainability sponsored the following initiatives with public
impact:
Bard Center for Environmental Policy
Power Dialog: The week of April 4th, 2016, The Power Dialog will support 10,000
students to engage in face-to-face dialog with state-level regulators in all fifty states.
The topic: Implementing the Clean Power Plan, requiring 32% cuts in global warming
pollution by 2030. How will it work? Hundreds of faculty will take their classes on
coordinated field trips to their state capitols. www.powerdialog.net
C2C Fellows Program: Since the end of 2011, more than 500 young leaders have
participated in our intensive weekend workshops focused on leadership skills such as
public speaking and fundraising, geared towards the achievement of high-impact
careers in sustainable business, policy and politics. In 2015, a training for 50 more
undergraduates and recent graduates was held in NYC. http://www.bard.edu/cep/c2c/
National Climate Seminar: Twice-monthly dial-in conversations with leading climate
scientists, policy makers, economists, artists, film-makers and others. Conversations are
all available as podcasts.
http://www.bard.edu/cep/programs/climateseminar/archive/index.php?year=2015

BARD COLLEGE: Climate Action Plan | 27
Asia-Environment Student Research Conference: With support from the Henry Luce
Foundation, Bard CEP hosted the first annual student research conference on Asia and
the Environment, with forty undergraduate and graduate students from across the
country presenting their research. http://www.bard.edu/cep/blog/?p=6964
Hudson Valley Food Systems Conference: This day-long conference convened
business and NGO leaders from the regional food sector for an exploration of how
Bard’s faculty and student research resources could better support the needs of a
sustainable food system.
Bard MBA in Sustainability
Sustainable Business Fridays: Twice-monthly, student hosted dial-in conversations
with top business sustainability leaders, with the transcripts published regularly in
GreenBiz.com. Conversations are all available as podcasts.
http://www.bard.edu/mba/publicprograms/sbfridays/
3.4.3. Curricular collaborations with Bard Departments and Campus Committees
The integration of Sustainability in the curriculum is supported via multiple departments and
committees. The Bard Office of Sustainability (BOS) assists with the College’s STARS rating,
which includes a measurement of how climate and sustainability are incorporated into classroom
and research efforts. Both BOS and the Horticulture Department have helped make campus a
living laboratory, through educational signage and demonstration projects that have been
incorporated into classes. Both departments collaborate with faculty to support opportunities for
independent study, tutorials and/or internships, as well as provide course contributions through
guest appearances.
The Landscape and Arboretum Program is charged with promoting tree conservation and
preservation on the Bard campus, and offers horticultural education, outreach, and research. Bard
considers landscape as the intersection of place and people; natural areas that are part wild, yet
defined by humans. Noncredit, adult education courses—offered at the College through the New
York Botanical Garden—are open to the public and to members of the Bard community. Other
events sponsored by the program include an annual Arbor Day tree celebration, campus garden
tours, and lectures. Additionally, the Arboretum offers a summer internship and work-study
positions to several undergraduate students each year. http://inside.bard.edu/arboretum.
BOS is situation within Buildings & Grounds (B&G). This relationship facilitates the
incorporation of sustainability work into that department. Progress is made during weekly
meetings as BOS collaborates on the daily operations of the College. The Horticulture
department, also part of B&G, has pledged to increase use of electric-powered landscaping
equipment from 0 to 5% during 2017. Bard produces its own water from the Saw Kill. The
Water Plant B&G operator tracks gallons purchased from the Town of Red Hook as well as
gallons processed. He achieves yearly reductions in usage on campus through leak detection.

BARD COLLEGE: Climate Action Plan | 28
The Supervisor of Plumbing and HVAC contributes to these goals through upgrades of faucets,
toilets and waterless urinals. Efforts are tracked through service requests.
3.4.4. Collaborate with Outside Institutions
Bard is a member of the Environmental Consortium of Hudson Valley Colleges & Universities,
an intercollegiate association established to more fully engage its member institutions in the
region’s environment. The mission of the Consortium is to help shape the future of the regional
and global environment through collaboration, education, and research.
The College has a MOU with the Cary Institute for Ecosystem Studies to offer courses and
research opportunities for graduate and undergraduate students. The collaboration draws on our
combined strengths in the fields of environmental studies, environmental policy, and ecosystem
studies. A tie-in to climate and sustainability issues presents itself through the weekly Seminar
Series.
College representatives participate regularly in Red Hook Together meetings that "blend
endeavors in culture, agriculture, education, business, and tourism in order to create a sustainable
community."
The College will reach out to affiliated institutes such as the Bard summer program in New
Orleans and The Bard Rockefeller Semester in Science to incorporate climate goals. The College
has two collaborative programs with Rockefeller University. The “Bard-Rockefeller Summer
Undergraduate Research Fellowship Program” offers students the opportunity to take courses
and work in Rockefeller research laboratories on subjects related to biology and medicine. The
“Bard-Rockefeller Semester in Science” provides advanced science students an intensive one-
semester program in New York City at Rockefeller and Bard Hall.
3.5. Sustainability and Climate as an Intrinsic Part of Campus Life
We recognize that fostering ecologically literate citizens requires that our students’ experiences
outside the classroom be consistent with what they’re being taught inside them. Likewise, the
constructs of the workplace influence the faculty and staff experience. We would like to foster a
dialogue about how our climate neutrality policy statements can be implemented through
innovative policy. For example, the historic purchase of Montgomery Place offers a chance to
create a “low carbon” community or a “zero waste” or “low emission” region. .
The mission of BOS is to enhance the sustainability of the College in its operations, academics,
and outreach, while making Bard carbon neutral by 2035. We seek to enhance our
environmental, social, and economic capital while operating within the limits of the ecosystem.
Our primary work areas involve efficient transportation, flow of goods, and energy use. We
foster dialogue among community members, assess new technology and industry best practices,
coordinate projects, develop policy, and market programs. We believe all community members
have a part in furthering sustainability carries out campus wide sustainability initiatives that
reach across all students. Campus wide recycling, re-use programs, energy curtailment projects,

BARD COLLEGE: Climate Action Plan | 29
an amphibian migration program, movie screenings, talks, contests and renewable energy
projects offer visible reminders of sustainability efforts at the college.
The Bard Center for Civic Engagement involves students in green volunteer opportunities and
internships. With an entrepreneurial spirit and a sense of civic duty inspired by social
consciousness, the Center for Civic Engagement creates and sustains reciprocal programs and
relationships locally, nationally, and globally
The Trustee Leader-Scholar Program supports undergraduate and leadership development in the
context of hands-on, student-initiated community engagement projects. Students propose, design,
and implement civic engagement projects based on their own passionate interests, and provides a
place for students with climate and sustainability interest to channel their energy into a real
world project.
“Wellness” at the College includes combined efforts of a student club and a part time staff
member, to provide Bard students, faculty and staff with wellness-oriented events for bettering
mental and physical health. Climate collaborations are implemented when themes overlap, such
as promoting the walkability of campus.
BardEATS (Education Advocacy Transparency Sustainability) is a collaborative partnership
between Bard students, dining services, faculty and staff, and functions as an umbrella for Bard’s
food sustainability initiatives on campus and beyond. It is committed to increasing food
purchasing transparency, reducing waste, decreasing our carbon footprint, promoting food
access, and supporting local farms and sustainable products. The group makes food-related
decisions and is comprised of leadership from the Bard Farm, Bard Dining, the Environmental
and Urban Studies Department, the Office of the Vice President, the Office of Sustainability and
Bard Student Government Representatives. In March 2013, Bard College signed a commitment
to purchase 20% "real food" (food that is local/community-based, fair, ecologically sound, or
humane as defined by the Real Food Challenge) by 2020. Bard’s baseline value was 5%. In fiscal
year 2017, Bard reached an average of 23% Real Food and met our goal 5 years early. Bard
Dining buys directly from the Bard Farm (1.25 acres located on campus), and during the 2016
growing season, purchased over 22,000 pounds of fresh produce.

BARD COLLEGE: Climate Action Plan | 30
Harvesting greens at the Bard Farm (www.bard.edu/bardeats/, 2017)
The Horticulture Department has made campus a living learning laboratory by initiating the
College’s Landscape & Arboretum Program. Its mission is to preserve and enhance the natural
and landscaped resources of the Bard campus and to promote knowledge and appreciation of
horticulture and conservation. It aims also to provide a campus rich in horticultural diversity and
beauty that can be readily enjoyed by the College and surrounding community.
The sustainability ethos at Bard is enhanced by the network of EcoReps. EcoReps are student
volunteers in the residence halls, coordinated through BOS, who encourage sustainable behavior.
They embody the concept that role modeling and creating social norms around sustainable
behavior is the most effective way to create a community of connected, ecological citizens, who
strive to make sustainability second nature. The EcoReps are creating a document to
commemorate their responsibilities in furthering the mission of the Climate Action Plan. Their
draft goals include renewable energy and building efficiency targets, and assistance with
integrating climate change and sustainability into the curriculum for all students through the
Citizen Science program. They are also codifying a promise to host events with a climate focus.
There were over 200 student clubs at Bard in 2017. The management of the clubs is largely
through Student Government, including substantial budgets. Clubs represents a clear
opportunity to enhance our climate and sustainability goals. The Sustainability Council will
evaluate ways to codify these going forward.
There is generally a club with a sustainability or environmental theme, and activity levels vary
by year. A Sustainability Engagement Intern position is funded yearly through BOS; the goal for
this position is to support the continuity of a student sustainability club as well as advise the
EcoReps.
The Bard Farm and Community Garden connects students to the land. Since 1997, the Bard
College Community Garden has been a haven for agricultural enthusiasts from Bard and beyond.
People gather in the circular garden for weekly potlucks and work parties during the growing
season and help to maintain its fruit, vegetable, and flower crops. The student-initiated Bard

BARD COLLEGE: Climate Action Plan | 31
Farm, established in 2012, is located behind Ward Manor on the North Campus. The 1.25-acre
farm allows students to grow food in ways that are ecologically sound, demonstrate the
methodologies for sustainable food production, and be responsive to the latest scientific and
agricultural practices for growing diversified crops.
The Dean of Student Affairs Office (DOSA), as part of the Office of Student Affairs, and has
pledged to formally integrate sustainability into its departmental missions; where in the past
informal activities have been the norm. DOSA’s environmental mission statement reads:
“Sustainability is achieved when all people on earth can live well without
compromising the quality of life for future generations.“ Rolf Jucker, 2003
The Dean of Student Affairs Office recognizes that we have a responsibility
to future generations to slow the process of global warming. Student
Services can equip and encourage students to participate in building a
socially diverse, just, and sustainable society. We will work to integrate
environmental literacy and sustainability into student life through our
practices and programming.
We seek to incorporate environmental principles and environmentally
responsible practices as fundamental and integrated components of our
programming. Our fundamental principles are to
Incorporate environmental concerns as significant priority in decision-
making
Seek alternative practices and procedures to minimize negative
impacts on the environment
Consider the social, economic, and environmental impacts of our
purchasing decisions
The Socially Responsible Investment Committee (SRIC) provides an important check on
institutional investments. In addition to annual phonathons for our Social Choice Fund (an ESG
screened endowment option for gifts); the Socially Responsible Investment Committee (SRIC) is
charged with reviewing and voting all proxy votes for the College. Additionally, the SRIC
chosen four-six companies annually to review for shareholder engagement over issues of
concern. This translates into a minimum of one shareholder resolution and/or engagement
campaign each calendar year.

BARD COLLEGE: Climate Action Plan | 32
3.5.1. Proposed and Ongoing Measures
Bard continues to develop and codify departmental commitments to incorporate sustainability
across the college. Some of these efforts include:
CAMPUS LIFE & EVENTS
Civic Action Plan under development by the Center for Civic Engagement to codify
sustainable engagement with measurable outcomes
Continued funding for Sustainability Engagement Intern for BOS
Continued participation in climate themed teach-ins (Focus the Nation (2008), Global
Warming Teach-In (2009), 350 (2009) Princeton’s Carbon Wedge Workshop (2010,
2012), and other nationally recognized events that promote sustainability like
Recyclemania (2007-date)
Promotion of pre-college sustainability shopping checklist
Incorporate sustainability into First Year Orientation events during L&T
Sustainability Pledges (First Year and Transfer (existing) Graduation (proposed))
Information in New Hire packages, Administration/Staff Benefit Programs, including
promotion of $10,000 off a 2017 Nissan Leaf for faculty, staff, students and alum.
Insert sustainability language in work-study positions throughout the college
Institutionalize modifications to Residence Life
o Hall programming (Fall – MoveIn; Spring- Recyclemania, MoveOut)
o Creation of sustainability in residence hall, particularly surrounding 17 UN
Sustainable Development Goals
o Model spaces: Green Kitchen, Green Room
o Upgrades to EcoRep program
Add sustainability component to Alumni Weekend, Parents Weekend
Promote sustainability themed opportunities through Career Development Office
Office EcoAmbassador program in administrative and academic buildings.
Water Saving educational signage installed at the Athletic Center to reduce shower times
Propose ballot initiative to fund sustainability projects
Expand service opportunities at Community Garden
Measure attitudes towards re-use culture at FreeUse with before and after surveys at five
DIY events
Create wellness connection using campus grounds with Wellness Committee
Reframe issue (including DOSA pledge bullet 2) – from “being less bad” to “doing good”
FOOD & AGRICULTURE
Increase infrastructure to increase sustainable food procurement for all dining halls
Increase Teaching Kitchen Program Outreach and Engagement
Have the Bard Farm increase sales to become self-sustaining
Integrate Montgomery Place Orchards into Dining options
Reducing our pre- and post- consumer food waste and donating food when able
Working toward enhancing current systems as the technology and resources are available
(ex. Compost, transportation systems etc.)
Ensuring health and wellness in menu engineering

BARD COLLEGE: Climate Action Plan | 33
Promoting in-season, house-made, and local foods
Providing educational opportunities for students and staff in regards to eating
Increasing transparency in our purchasing habits, as well as tracking and expanding
Bard’s “Real Food” percentage
Investing and divesting in food companies based on research
3.5.2. Community Outreach & Engagement
Because ecological, social and economic issues cross political and geographic boundaries, we
seek, create and react to opportunities to work beyond our physical border, particularly with the
Town, Villages, County, State and Federal government and associations. BOS, with the support
of the Center for Civic Engagement (CCE), offers a focal point for these connections.
Bard contributes in kind labor and letters of support for a diverse range of community projects.
Current collaborations include:
Energy
Solarize Northern Dutchess – facilitating adoption of solar energy
Community Distributed Generation (CDG) multi stakeholder project for Red Hook
Advisory Board, Department of Energy Rooftop Solar Challenge , with CUNY and
Town of Red Hook – NY Solar Smart Partner, Permitting & Interconnection
Workforce (2014-2017)
NYSERDA Cleaner, Communities – Energy Plan for Dutchess County focusing on
organics recycling (June 2015-June 2016)
Assist Town and Village of Tivoli in their pledge to be Climate Smart Communities
Land Use and Water
Greenway Conservancy Trails Program grant for development of a town-wide trails
plan (June 2015-June 2016)
Habitat Connectivity Pilot Project, Cornell
Amphibian Migrations (ongoing)
Saw Kill Watershed Community Project, Hudson River Estuary Program
Transportation
Bike Pedestrian Task Force, Dutchess County Planning (ongoing)
Transportation Alternative Program (TAP) grant for Town/Village sidewalk (March
2015-March 2017)
DOT Upper Route 9G Corridor Management Plan, 2015
Resiliency
Town of Red Hook emergency Preparedness Committee and Planning, 2015

BARD COLLEGE: Climate Action Plan | 34
Other Opportunities
Support service learning projects on climate change and sustainability through the
Trustee Leader Scholars program
The College will continue to coordinate and participate in events in the greater Red Hook
Community, especially in collaboration with CCE and including Red Hook Clean Up Day, Red
Hook Recycles Day, and local climate change events such as movie screenings, forums, seminars
and conferences.
We will continue to connect Bard interns with community organizations and governmental
committees. Specifically, Town of Red Hook Conservation Advisory Council has needed
assistance implementing the Town Energy & Climate Action Plan, the 10% Challenge and the
Town’s status as a New York State Climate Smart Community.
We hope that through our strategy to maintain good communication with multiple stakeholders,
to have an “open door” policy for new ideas and initiatives, and to stay up-to-date with best
practices, we will keep Bard positioned at the forefront of sustainability efforts. This in turn can
create an atmosphere of hope on campus for our diverse community and a positive vision for the
future.

BARD COLLEGE: Climate Action Plan | 35
4. FACILITY EMISSIONS
4.1. Overview
According to the GHG inventory for FY 2016/17, roughly half of Bard’s emissions are
attributable to energy consumed by campus facilities, totaling 7,690 tCO2e. Figure 4.1 presents
the breakdown of energy-related emissions, including stationary combustion (Scope 1),
purchased electricity (Scope 2) and electricity transmission and distribution loses (Scope 3).
Reducing facility emissions is likely to be the most challenging obstacle to carbon-neutrality,
given the considerable time, effort, and investment needed to retro-commission existing
buildings and upgrade old systems.
Figure 4.1 Breakdown of energy-related emissions from facilities in FY2017, totaling 7,690 tCO2e from direct consumption (electricity & stationary combustion) and indirect Scope 2 T&D losses.

BARD COLLEGE: Climate Action Plan | 36
4.2. Energy Conservation Measures in Existing Facilities
To reduce Scope 1 & 2 emissions, Bard will continue its efforts to identify and implement cost-
effective energy conservation measures (ECM) in existing facilities, including:
• Weatherize and insulate building envelope
• Upgrade HVAC systems
• Install energy metering and controls upgrades
• Install high-efficiency lighting
In 2008, a campus-wide audit performed by Johnson Controls identified ECM projects
equivalent to an emissions reduction of 2810 tCO2e, or roughly 36% reduction in energy-related
emissions. Subsequent audits and energy studies conducted by BOS continue to identify energy-
saving opportunities. Each year, it is anticipated that one or two big projects, or several small
projects, will be completed, with the hope that Bard can match the reduction goals declared in
the NY 2015 Energy Plan and achieve 23% energy efficiency in buildings by 2030, and continue
that trend to 2035 and onward. Implementation of ECM measures by BOS and the Operations
Team is an ongoing process; however, Bard touts a growing list of successful projects.
4.2.1. Milestones and Completed Projects
Campus-wide Interior Lighting Upgrade
In Summer 2013, Bard upgraded nearly 6,200 indoor fixtures, including roughly 5,000
florescent fixtures (i.e. old T12 to T8 bulbs to high-efficiency T8s, and old magnetic and
electronic ballasts to high-efficiency electronic ballasts) and 1,200 LEDs to replace old
incandescent and CFL technology. With a total project cost of $520,000, Bard took
advantage of incentives and discounts from the Central Hudson Utility’s Commercial
Lighting Program to reduce the overall cost by 51%. In addition to reducing maintenance
costs, the project was calculated to save over 1,000,000 kWh annually and reduce Bard’s
power baseline by 224kW.
Campus-wide Outdoor Lighting Upgrade
In Summer/Fall 2015, Bard upgraded 783 exterior fixtures to LED technology, including
219 exterior building lights and 565 street and path lights. The total project cost of
$127,000, Bard took advantage of incentives from Central Hudson Utility and
NYSERDA rebates to reduce the overall cost by $36,600 (~29%). In addition to
reducing year-to-year maintenance costs, the project is expected to save roughly 375,000
kWh annually and reduce Bard’s power baseline by 82.4 kW.
Various LED Upgrades
In addition to the large, campus-wide lighting upgrades, Bard has also focused on a
variety of small- to medium-size projects, where certain applications require special
design considerations (i.e. gallery and theater lighting, lecture halls, science center, etc.).
Likewise, as existing fixtures and bulbs fail, they are replaced with LED through routine
maintenance, and over 2000 fixtures have been converted to LEDs in this way.

BARD COLLEGE: Climate Action Plan | 37
Building Envelop Projects: Insulation, Weatherization, and Window Upgrades
Since 2011, Bard has undertaken a number of insulation, weatherization, and window
upgrades, especially on some of the oldest residential buildings is owns (namely, 100+
year-old, single-family homes annexed to campus over the decades). Energy savings
from these projects typically reduce building’s energy consumption from 15 - 40%.
Projects to-date include:
Dubois House, Center for Civic Engagement (Spring 2012)
Insulate exterior walls (full interior demo, 3 ½” sprayfoam )
Attic instulation (6” sprayfoam)
Various airsealing, insulate rimjoist
Hopson Cottage, Admissions Center (June, 2012):
Attic insulation (8” dense-pack cellulose)
Crawlspace insulation (2 ½” rigid foamboard)
Wall insulation on addition (3 ½” dense-pack cellulose)
Programmable thermostats
Bostwick House, Daycare Center (June, 2012)
Attic insulation (12” blown-in cellulose)
Crawlspace insulation (rigid foamboard + sprayfoam)
Programmable thermostats
Gahagen House (Fall 2013)
Insulate exterior walls (full strip, 3 ½” sprayfoam )
Attic instulation (6-10” sprayfoam)
Various airsealing, insulate rimjoist
Programmable thermostats
Tewksbury Hall (Summer 2014)
Full window and door replacement of 20,000 ft2 dormitory
Replace old oil boiler with high-efficiency gas condensing boiler
South Hall (Summer 2014)
Attic insulation (combo blown-in cellulose and sprayfoam)
Install new 9kW solar PV system
Cedar Hill House (Summer 2015)
Insulate exterior walls (full strip, 3 ½” sprayfoam )
Attic instulation (6-10” sprayfoam)
Crawlspace insulation (sprayfoam)
Various airsealing, insulate rimjoist

BARD COLLEGE: Climate Action Plan | 38
Building Automation and Equipment Upgrade Projects:
BOS and Bard Operations also implement small- to large-size projects that are cost-effective
with regards to energy savings and reducing maintenance costs, usually with paybacks in the 2-3
year range. Often these projects greatly improve building functionality and performance.
Whole-building Automation Controls upgrades, allowing for HVAC systems to
respond to occupancy conditions and schedule setbacks, and greater ability to diagnose
problems in the system. Whole-building upgrades include:
o Stevenson Gymnasium (Summer 2011)
o Kline Commons Dining Hall (Summer 2012)
o Olin Humanities (Summer 2013)
o Tewksbury Hall (Summer 2014)
o Fisher Center for Performing Arts (Winter 2016/17)
New Dishwashing Flight Machine (Spring 2012) ) for the main dining services hall,
reducing water consumption by 80% and energy use by 50% compared to the old unit.
Heat Recovery Ventilation (Spring 2012) at the gymnasium indoor pool, to reduce
energy from ventilating fresh air as well as help control indoor humidity and air pressure.

BARD COLLEGE: Climate Action Plan | 39
4.3. Renewable Energy Systems
While energy conservation measures will help to reduce the energy footprint of Bard facilities,
they cannot completely offset all demand for energy. Investment in on- and off-site renewably
energy systems can help to fill this gap, and provide other benefits such as security from energy
price fluctuations and resilience in emergencies.
4.3.1. On-site, Large-Scale Solar Photovoltaic Systems
In 2013, Bard completed the installation of a 280 kW-DC solar PV array on campus in Bartlett
Field and the adjacent athletic field. The system generates about 300,000 kWh annually, or
about 1.5% of Bard’s total electricity consumption. The project was financed utilizing a Power
Purchase Agreement, with Bard as the host-site and committing to purchase all generated
electricity. The system was originally planned for 1MW capacity (or 5.4% of energy needs), but
budget restrictions and encroaching archeological sites resulted in a scaled-back project.
Expansion of the array is possible, though would first require archeologic investigation, for
which the costs and uncertainty of a “full stop” make the project risky and less likely to proceed.
Solar arrays at Bartlett Field (top)
and Ferrari Athletic Field (left) (Dan Smith, Spring 2015)

BARD COLLEGE: Climate Action Plan | 40
To estimate the full potential impact and feasibility of large-scale solar PV on Bard grounds, a
2009 graduate study4 conducted by the Bard CEP identified two plausible scenarios that could
supply roughly 10% or 20% of Bard’s 2009 electricity demand, respectively (for the full
feasibility report, see Appendix E). Scenario 1 develops Bartlett Field to its full extent, while
Scenario 2 develops Bartlett Field and also Robbins Field on north campus. Although such
systems would have a notable impact on Bard’s renewable energy composition, the use of
limited campus land in this way may not be the best return on investment and would critically
impact the future of land development at Bard.
By contrast, the development of large off-site solar PV (i.e. remote-net-metering developed on a
brownfield) shows much greater promise to partially or fully provide Bard with electricity from
renewable sources.
Satellite image of Bartlett and Athletic Fields, showing solar arrays. (Google Maps, 2015)
4 Bard CEP, 2009. “Exploring On-site Photovoltaic Options for Achieving Carbon-Neutrality at Bard College.” (See
Appendix E)

BARD COLLEGE: Climate Action Plan | 41
4.3.2. Small-scale Solar Photovoltaic Systems
Distributed small-scale solar PV installations on or near individual buildings are estimated to
have a marginal impact on displacing energy and emissions; likewise, the majority of Bard
building stock is not ideal for roof mounted systems. However, their presence provides an
important signal to the Bard Community about sustainability.
In the summer of 2014, a 9kW roof-mount array was installed on the South Hall Dormitory, and
roof areas at the Physical Plant and Stevenson Athletics Center could potentially support 60kW
and 120kW systems, respectively. Combined, it’s possible such systems could produce a rough
total of 200,000 kWh, or about 1.0% of Bard’s electricity consumption.
South Hall Dorm with 9kW solar PV array (Dan Smith, 2014)

BARD COLLEGE: Climate Action Plan | 42
4.3.3. Large- & Small-scale Solar Thermal Hot Water
In 2010, small-scale solar thermal hot water systems were installed at Tremblay Hall and Keene
dormitories as demonstration projects. The systems continue to operate, but present only a
marginal displacement of the buildings’ total energy consumption (less than 1%). Because of
this marginal impact, and the maintenance requirements the systems present, it is unlikely that
Bard will pursue any additional small, decentralized systems on existing buildings. However, it’s
possible that a large-scale system, installed at a facility with a large, year-round thermal demand,
could be viable return-on-investment. Currently, the only building on campus that meets such
conditions is the Stevenson Athletic Center, which has hot water needs all year long (e.g. indoor
pool, showers, laundry facilities, etc.). The economics and feasibility of such a project are
currently under development.
4.3.4. Remote-Net-Metering: Off-site, Large-scale Renewable Systems
Currently, the greatest opportunity to completely offset Bard’s electricity consumption with
renewable alternatives is through off-site Remote-Net-Metering (RNM). Because the
development of Bard’s limited acreage for on-site systems is in conflict with other needs of the
College, such as green spaces, view sheds and agriculture, the development off-site resources is
an attractive proposition. Such a system could exist elsewhere in the region, and be placed over
an inactive landfill, brownfield, or marginal area where there is less conflict over land use.
4.3.5. On-site, Micro-hydroelectric generation
The acquisition of Montgomery Place in 2016 put the Saw Kill Creek and its two dams in the
hands of the College. Historically a small-scale hydroelectric turbine was in place at the lower
dam; some remnants are still in place. This is the first artificial barrier on the creek, after a
natural water fall at the mouth of the creek. A pre-feasibility study of estimated hydroelectric
production (based on direct observation and hydro engineering algorithms) indicates the
possibility of a 40 kW system. The second dam is located upstream on River Road and has the
potential for a 12 kW system. Both projects are currently in the feasibility stage.
Dam on the lower Saw Kill, showing remnants of the penstock that provided water to the hydroelectric turbine near the mouth of the creek. (Laurie Husted, Fall 2015)

BARD COLLEGE: Climate Action Plan | 43
4.4. Alternative Fuels for Heating and Back-up Generation
ECMs and renewable energy systems will help to reduce the energy footprint of Bard facilities,
but it is unlikely that they will be able to offset all demand for fossil fuels needed for space and
water heating and back-up power generation. In FY 2016/17, Bard facilities consumed 297,537
gallons of distillate fuel oil (#2, kerosene, and diesel) and 132,862 gallons of propane. On-site
combustion of these fuels generated 3,735 tCO2e, or 24.7% of Bard’s total annual emissions.
Finding a viable, carbon-neutral substitute for any or all of these fuels would create a significant
reduction in Bard’s carbon footprint.
BOS has investigated several options for feasibility, including:
Biodiesel to use in diesel-based generators
Refined waste vegetable oil as a substitute for distillate fuel oil for boilers
Synthetic oil from lumber industry bio-waste as a substitute for distillate fuel oil
It appears as if the “age of alternative fuels” is nearly here; however, lack of market maturity has
so far limited these options. Issues with project size/scale, supply chains, equipment
compatibility and warranties, and other economic barriers have stymied attempts to develop a
demonstration or full-scale project. Ultimately, the ability to offset all fuel demands will largely
depend on the growth and maturity of regional markets to provide a consistent quantity and
quality of alternative biofuels at cost-effective prices.

BARD COLLEGE: Climate Action Plan | 44
4.5. Reduce Waste Stream Emissions
A 2009 audit estimated that solid waste and construction and demolition emissions amount to <
1% of the overall emissions. Nevertheless, solid waste operations are a visible part of the
college’s greenhouse gas generating activities. A campus-wide recycling and re-use program
contributed to a 10% reduction in our solid waste production from 2008 to 2009. Recycled
materials include commingled plastic, paper, cardboard, metal, wood scrap, electronics, light
bulbs, ink jet and toner cartridges. The College operates a FreeUse store where clothes and other
materials are sent for re-use across campus.
4.5.1. Solid Waste Costs
In 2015, the College spent approximately $90,000/ year on solid waste and recycling; a decrease
of about 15% since 2008.
4.5.2. Reducing Solid Waste
Solid waste and C&D debris go to the Ontario County Landfill, approximately 250 miles from
the College.
Robust composting operations at our main dining hall have enabled Bard to be a top ten finisher
in the Food Service Organics category of the national Recyclemania contest 2008-2015 with
three first place finishes (2009, 2012 and 2014). The Food Scrap on-site composting program
equates to a greenhouse gas offset of (-63 tons or -0.4% of overall emissions for FY 2016/17).
Kline Commons food scraps become the compost pile. (Laurie Husted, 2014)

BARD COLLEGE: Climate Action Plan | 45
To reduce paper waste, the Bard IT department created a “pay to print” policy, as well as default
double-sided printing on all student printers (Library, Henderson Labs, Campus Center,
Language Lab, Shafter House, Saw Kill), that reduced paper consumption by up to 25% or over
one million pages, as well as decreased ink consumption.
The Bard Bartering Facebook site has 1700 members and has contributed to the culture of reuse
on campus and in the surrounding community. Our FreeUse MoveOut process diverts significant
materials from our May waste stream, as well as during the regular school year.
4.5.3. Possible Future Demonstration Projects
“Green Rooms” – establish a model for more sustainable office, residence hall room or
kitchen.
Contractor Outreach
o Barnes & Noble Bookstore: offer reusable bags (existing program) and charge a
small fee for a disposable bag
o Chartwells: Reusable to-go containers rather than disposables
Organize Green Vendor Fair
Online presence for FreeUse

BARD COLLEGE: Climate Action Plan | 46
4.6. Refrigerant and Fugitive Emissions
Refrigerant and fugitive emissions represent less than 1.5% of total emissions. Because they
derive from leaks in equipment and other difficult-to-detect sources, developing effective
mitigation strategies may be difficult, though not unattainable. Systematic upgrade or repair of
refrigeration equipment, and adoption of substitute refrigerants and chemicals with a lower GHG
impact, can help to mitigate emissions from these sources. Bard should devise a Refrigerant
Management Plan to coordinate the upgrade of equipment and phase-out of old types of
refrigerants over time.
4.7. Purchase Renewable Electricity from Grid
The purchase of renewable electricity from the grid can be accomplished in two ways: (1)
directly, by purchasing renewable electricity through an Energy Service Company (ESCO), and
(2) indirectly, as the grid acquires a greater percentage of electricity from renewable sources.
4.7.1. Direct Purchase of Renewable Electricity through an Energy Service Company
With the deregulation of utilities in New York State, it is possible for Bard to negotiate the price
and fuel-mix of the electricity they purchase. By partnering with an ESCO or energy broker,
Bard can choose from to purchase electricity generated from a mix of renewable and “cleaner”
non-renewable sources. This option is currently in development, and could partially or fully
offset Bard emissions from electricity consumption.
4.7.2. Indirect Purchase of Renewable Electricity as Grid Becomes Greener
As renewable power generation continues to grow in the Unites States, the fuel-mix of the grid
will gain a larger proportion of renewable sources. In 2005, New York State set a Renewable
Portfolio Standard (RPS) benchmark to increase the proportion of electricity generated from
renewable sources from 2005 level of 19.3% to 24% by 2013, an average annual growth of
0.6%5, outpacing the projected annual national growth of 0.3%.
6 New York surpassed that goal,
and in its 2015 Energy Plan declared a goal of 50% grid electricity from renewable sources.
Bard has benefited from this effect (as well as many regional power plants converting to natural
gas), and has seen its calculated Scope 2 emissions fall despite electricity consumption remaining
stable. If trends continue and New York goals are met, Bard could see a nearly 1000 tCO2e
reduction in its Scope 2 emissions by 2035.
5 DSIRE (2009), New York Renewable Portfolio Standard. Retrieved 12/22/09 from
http://www.dsireusa.org/incentives/incentive.cfm?Incentive_Code=NY03R&state=NY&CurrentPageID=1 6 EIA (2009), Annual Energy Outlook 2010 Early Release Presentation. Retrieved 12/22/09 from
http://www.eia.doe.gov/neic/speeches/newell121409.pdf

BARD COLLEGE: Climate Action Plan | 47
4.8. Strategy Wedges and Timeline
Reducing all emissions from facilities will rely on considerable financial investments in energy
efficiency and renewable energy projects between now and 2035. Table 4.1 offers summary of
mitigation strategy wedges to reduce emissions from facilities, relative to 2035 annual emissions
projected under a BAU scenario for Bard growth.
Time
PeriodWedge Description
Emissions
Reduction
(tCO2e)
Emissions
Reduction
(% of total)
Building Energy Efficiency Upgrades
(Scope 1&2)
23% reduction in energy consumed by buildings
by 2030 (as per NY 2015 Energy Plan) and
continue trend thru 2035
Renewable Energy from Grid
(Scope 2)
50% of grid-bought electricity from renewable
sources by 2030 (as per NY 2015 Energy Plan)
and continue trend thru 2035
Large-scale Solar PV Array
(Scope 2)
On-site or Remote Net Meter solar array to
cover remaining eletricity needs.
Substitute Heating Fossil Fuels w/
Biofuels or Geothermal (Scope 1)
Covert all fossil fuel based heating systems to
carbon-neutral biofuel or geothermal
Refrigerant Management Plan
(Scope 1)
Implement plan to fix refrigerant leaks and
phase-out old types with low-impact
substitutes.
8,041 51.5%
15,603 100.0%
7,561 48.5%
Table 4.1 Facility Emissions Reduction Wedges
Total Reductions by 2035
Total Emissions by 2035
Remaining Emissions
2,704 17.3%
213 1.4%
2017 –
2035
1,017 6.5%
1,947 12.5%
2,161 13.8%
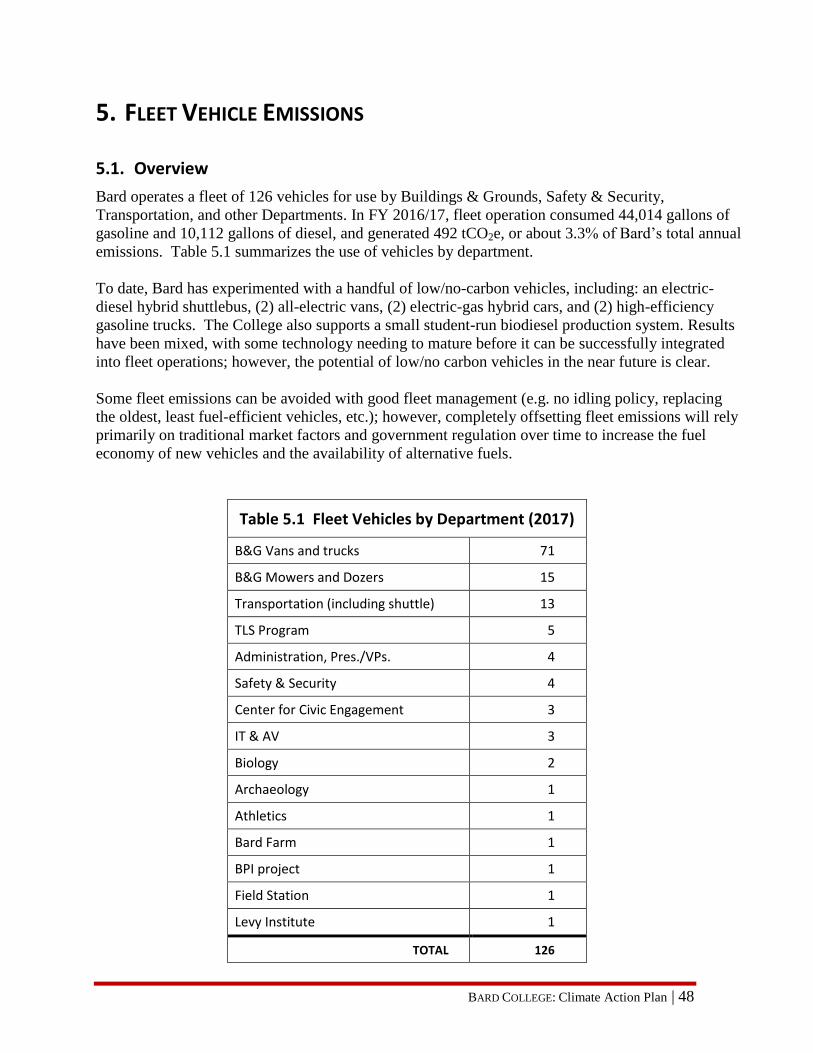
BARD COLLEGE: Climate Action Plan | 48
5. FLEET VEHICLE EMISSIONS
5.1. Overview
Bard operates a fleet of 126 vehicles for use by Buildings & Grounds, Safety & Security,
Transportation, and other Departments. In FY 2016/17, fleet operation consumed 44,014 gallons of
gasoline and 10,112 gallons of diesel, and generated 492 tCO2e, or about 3.3% of Bard’s total annual
emissions. Table 5.1 summarizes the use of vehicles by department.
To date, Bard has experimented with a handful of low/no-carbon vehicles, including: an electric-
diesel hybrid shuttlebus, (2) all-electric vans, (2) electric-gas hybrid cars, and (2) high-efficiency
gasoline trucks. The College also supports a small student-run biodiesel production system. Results
have been mixed, with some technology needing to mature before it can be successfully integrated
into fleet operations; however, the potential of low/no carbon vehicles in the near future is clear.
Some fleet emissions can be avoided with good fleet management (e.g. no idling policy, replacing
the oldest, least fuel-efficient vehicles, etc.); however, completely offsetting fleet emissions will rely
primarily on traditional market factors and government regulation over time to increase the fuel
economy of new vehicles and the availability of alternative fuels.
Table 5.1 Fleet Vehicles by Department (2017)
B&G Vans and trucks 71
B&G Mowers and Dozers 15
Transportation (including shuttle) 13
TLS Program 5
Administration, Pres./VPs. 4
Safety & Security 4
Center for Civic Engagement 3
IT & AV 3
Biology 2
Archaeology 1
Athletics 1
Bard Farm 1
BPI project 1
Field Station 1
Levy Institute 1
TOTAL 126

BARD COLLEGE: Climate Action Plan | 49
5.2. Fleet Management & Upgrades
Some emissions from fleet operation can be avoided with good fleet management, namely:
“No Idling” Policy for B&G vehicles.
Efficient fleet size (i.e. not too many or few vehicles to match worker demand and limit
the number of cross-campus trips)
Systematically upgrade the fleet by replacing the oldest, least efficient vehicles with
newer models with better fuel economy.
Bard administrators and directors should periodically confer with departments to assess vehicle
needs, and whether vehicle sharing, reductions or replacements are possible.
When attempting to replace vehicles with low/no carbon models, at present, the primary challenges
are market based. Depending on vehicle type or application, there may not yet exist an alternative
vehicle that is:
Cost-effective, including availability of parts and repair service
Compatible with existing infrastructure
Suitable for a particular application (i.e. long-range use, mowing/plowing/dumping,
shuttle transport, etc.)
However, as with all new technology, as markets mature and prices for low/no-carbon vehicles and
fuels drop, it will become easier to adopt a green fleet.
5.3. Alternative Fuels
BOS has investigated the potential of several alternative fuels, including biodiesel, grease,
ethanol, electricity, and compressed gas. So far, the costs and logistics of fuel-switching are
prohibitive, although Bard has experimented with the purchase of a few all-electric and hybrid-
electric vehicles that are currently service. In Bard’s experience, the main barriers to adopting an
alternative low/no carbon fuel are:
Cost of alternative fuel is greater than conventional fuel
Prohibitive cost of upgrading alternative fuel infrastructure
Unreliable supply chain for biofuels
Issues with availability of parts and repair services
Voiding of vehicle warranties (i.e. using biodiesel concentrations of B5 thru B100)
As the markets for low/no carbon fuels and vehicles mature, over time Bard can reasonably
expect to adopt new technologies and convert its fleet to 100% carbon-neutral fuels by 2035.

BARD COLLEGE: Climate Action Plan | 50
5.4. Strategy Wedges and Timeline
Based on current market trends and the increasing availability of alternative vehicles and fuels,
Bard can reasonably expect to transition to a carbon-neutral fleet gradually between now and
2035. The transition will rely heavily on traditional market- and regulation-based drivers, the
emergence of new technology, and affordable prices. Table 5.2 offers summary of mitigation
strategy wedges to reduce fleet emissions, relative to 2035 annual emissions projected under a
BAU scenario for Bard growth.
Time
PeriodWedge Description
Emissions
Reduction
(tCO2e)
Emissions
Reduction
(% of total)
Transition to carbon-neutral fleet (Scope
2)
100% fleet emissions offset from the gradual
transition to higher-efficiency vehicles and
low/no carbon fuels.
492 3.2%
15,603 100.0%
15,110 96.8%
Total Emissions by 2035
Table 5.2 Fleet Emissions Reduction Wedges
2017 –
2035492 3.2%
Total Reductions by 2035
Remaining Emissions

BARD COLLEGE: Climate Action Plan | 51
6. COMMUTING EMISSIONS
6.1. Overview of Commuting Behavior at Bard
Based on results from a 2016 Commuting Behavior Survey of the Bard community, it is
estimated that commuting by students, faculty, and staff contributes 2,891 tCO2e, or about 19%,
to Bard’s total annual emissions. Faculty and staff commuting contributed the majority of these
emissions, 2,077 tCO2e, or 13.8% of total emissions, while student commuting contributed about
814 tCO2e, or 5.4% of total emissions.
Reducing emissions from commuting will be a challenge, as these mobile sources are generally
beyond Bard’s control and reflect the choices of many individuals, including vehicle type,
commuting distance, and personal driving habits. Table 6.1 shows the number of vehicles
registered at Bard for FY 2016/17 obtained from S&S records; however, community
noncompliance with vehicle registration is an issue. When compared to known campus
populations and visible conditions, these records likely underestimate the actual number of
vehicles on campus, underscoring the challenge of managing commuter behavior.
By implementing a set of practical policies geared toward altering commuter behavior, generally
known as a Transportation Demand Management (TMD) program, Bard can use incentives and
restrictions to reduce driving and parking congestion on campus and increase the use of bicycles,
walking, and shuttle services.
Table 6.1 Number of Registered Vehicles in FY16/17 7
Freshman 96
Sophomore 116
Junior 113
Senior 87
Graduate 53
STUDENT TOTAL 465
Life Learning Institute 236
Faculty/ Staff 343
Staff 617
BARD TOTAL 1,661
7 Obtained from S&S 2017 vehicle registration records.

BARD COLLEGE: Climate Action Plan | 52
6.1.1. Assessment of Student Commuting Behavior at Bard
BOS has conducted Commuter Behavior Surveys in 2008, 2013, and 2016, and will continue to
conduct periodic assessments of modes of travel on campus. The format of the survey has been
refined over the years to reflect the input parameters of the Clean Air-Cool Planet Campus Carbon
Calculator to capture the number of commuter miles made each week and the modal split (i.e.
proportion of each choice mode of transportation, including walking, bicycling, driving, etc.).
The April 2016 survey had 241 complete respondents, with the majority (151) living with 1 mile of
campus center, 78 between 1 to 4 miles, and the remaining 12 commuting a distance of 6 miles or
more. Figure 6.1 shows the average modal split across all respondents. While survey results are
confounded by missing and imperfect data and potentially other biases, they are a useful estimate
(for complete survey results, see Appendix I.)
Figure 6.1 Modal split of students from April 2016 survey, calculated from the total miles traveled using each mode of transportation.
The results generally show what one would expect— students living on or close to campus tend to
choose carbon-free modes of transport more often (walk, bike, etc.), and students living farther away
tended use the shuttle more, or, most frequently, drive alone in a personal vehicle. Understandably,
the farther from campus a student resides the greater the need to use a car. However, the concerning

BARD COLLEGE: Climate Action Plan | 53
trend is the frequent use of personal vehicles for on-campus or very close travel, pointing to students
using cars to make short trips around campus.
This undesirable commuting pattern, also called “lot hopping”, can be partially explained by
following generalizations, captured by survey comments and by informal student interviews:
Unrestricted use of parking lots make it convenient for students to hop from lot to lot to
cover short distances (for example, from Robbins lot to Kline Commons lot)
Limitation in shuttle capacity and run-times.
Not enough passing time between classes to walk between destinations (note: passing time
was increased from 15 minutes to 20 minutes as a result of student feedback).
Nuisance of congested bike racks and lack of bike storage.
6.1.2. Assessment of Faculty/Staff Commuting Behavior at Bard
Based on results from a faculty/staff commuter behavior survey conducted in April 2016 (see
Appendix O), of 52 faculty and 139 staff respondents, on average they commute 15.7 miles to Bard,
and make roughly 4.8 round trips per week. Nearly all commute to Bard in a personal vehicle—the
vast majority drive alone (90%) or by carpool (3.6%). The remaining (who presumably live on or
close to campus) will walk (5%), bike (1.3%) or ride the bus/shuttle (0.4%). Because faculty/staff
are decentralized, living across the surrounding region (compared to a centralized student
population) and generally 10 miles or mile from campus, organizing alternative forms of
transportation for faculty/staff commuters can be difficult.
6.2. Transportation Demand Management at Bard
A Transportation Demand Management (TDM) program is a complimentary set of policy tools
that encourage students, faculty and staff to use alternative forms of transportation— busing,
carpool and vanpool, bicycling or walking – to commute to and around campus. The size of
Bard campus is well suited for walking and biking, with most buildings within 0.5 mile radius of
the central campus (see Appendix K); however, the campus’ rural locale and distance from
surrounding towns and commercial centers can create a strong incentive for students to want a
vehicle. Every time a student chooses to walk, bike, or use the shuttle rather than a car to make
short trips around campus will displace 2-3 miles of driving and 0.0011 tCO2e per round trip,
which can add up.
Some TMD policies can be implemented independently (e.g. raise parking fees, create bike co-
op), while others are interdependent and need to be implemented simultaneously to work
properly and avoid intended side effects. For example, increasing parking fees and restricting
lots to encourage biking without increasing the number of bike racks for new demand would
create bike parking congestion. Table 6.2 provides a list of recommended TMD policies to be
implemented or expanded at Bard. This list should evolve as feedback and new ideas become
available.

BARD COLLEGE: Climate Action Plan | 54
Table 6.2 TDM Program Recommendations
Changes to parking fees.
Restrict parking lots and increase lot enforcement.
Optimize shuttle service and reliability.
Expand Bard Bike Co-op.
Expand Bard BikeShare program.
Focus efforts on making campus “bike friendly”.
Promote independent ride-sharing resource such as
511NY.
Continue to provide car-sharing program ZIPCar on
campus.
Continue to check AASHE Resource Center and learn
about new ideas and efforts at other institutions.
6.3. Parking Fees and Rebates
6.3.1. Student Parking Fee
Based on simple economic theories of supply and demand, increasing parking fees should reduce
the number of student vehicles on campus. In Fall 2009, Bard enacted a $100 annual parking fee
for student vehicles. This fee was increased to $200/year in 2015. While it is uncertain to what
extent parking fees reduce student vehicles, effects can be maximized by making walking,
bicycling, and shuttle service more desirable modes of transportation.
6.3.2. Faculty and Staff Parking Fee
Currently, there is no faculty/staff parking fee, but Bard may wish to consider a discounted fee to
help absorb the environmental costs of faculty/staff vehicles.

BARD COLLEGE: Climate Action Plan | 55
6.3.3. Parking Fee Rebate
Currently, Bard has parking spaces at Robbins lot reserved for fuel-efficient vehicles. Bard may
wish to investigate the option to expand this program and offer parking fee rebates for students
or faculty/staff who register fuel-efficient vehicles.
6.4. Restrict Parking Lots and Increase Lot Enforcement
Restricting parking lots can reduce lot congestion and ensure spaces are available for commuters
who need them, and prevent students from driving short distances across campus (aka “lot
hopping) while increasing the incentive to walk, bike, and use the shuttle. However, lot
restrictions should be planned carefully to avoid isolating students, and be supported by
enforcement measures (e.g. actively check stickers and issue tickets). A pilot program at the
newly renovated Olin Lot has restricted use for commuters only. Additional changes to parking
policy would be useful; however, enforcement is a hurdle.
Olin Parking Lot, Bard’s 2015 permeable asphalt parking lot designated for Commuters only, with reconstructed wetland and drainage system. (LRC Associates, 2015)
6.4.1. Restrict Freshmen Vehicles
Bard currently does not restrict freshmen from having a vehicle on campus. However, many
other colleges do and have had success with reducing the number of vehicles on their campuses.
The College should weigh the pros and cons of such a policy, and account for the mobility needs
of freshmen and account for the rural conditions and distance from commercial centers

BARD COLLEGE: Climate Action Plan | 56
6.4.2. Long-term Parking Lot
Designating a long-term parking lot and offering students a discounted parking fee for not
parking elsewhere on campus, will provide an incentive to reduce “lot hopping”. Another
possibility is to create residential lots and commuter lots with different associated fees.
6.5. Optimize Shuttle Service and Reliability
The size of Bard campus is well suited for walking and biking, with most buildings located
within 0.5 mile radius of the central campus (see Appendix K); however, the removed nature of
campus from surrounding towns and commercial centers can create a strong incentive for
students to have vehicles. The Bard Shuttle service is a unique offering for such a relatively
small institution as Bard, and provides on- and off-campus students with a mode of mass
transportation adapted to their commuting and excursion needs. Therefore, optimizing shuttle
service and reliability to overcome the need for student vehicles is a crux of TDM at Bard.
Based on feedback, including responses from the Fall 2008 transportation survey, a handful of
actions have been implemented to optimize shuttle service:
Existing shuttle schedule matches classroom passing times
Existing shuttle schedule no longer has an extended “dinner time” gap; instead it has
(3) one-hour gaps (noon-1pm, 4pm-5pm and 8pm-9pm)
Shuttle is supported by outsourced contractor (Tonche) with a 43-passenger bus that
runs Thursday-Saturday 10pm-2am)
Service has expanded to include a 14 passenger van that goes to the Village of
Rhinebeck and Rhinecliff train station Fridays noon-7pm
2nd
shuttle???
The recommendation to make a campus only loop that adds stops near Olin, Rose/Hegeman, and
RKC buildings has been implemented during Citizen Science during the morning and afternoon
only.

BARD COLLEGE: Climate Action Plan | 57
6.6. Encourage Bike Use
Every time a student chooses to use a bike rather than a car to make short trips around campus
can displace 2-3 miles of driving and 0.001 tCO2e per round trip, which can add up. Increased
use of bikes will also help to reduce traffic and parking congestion on campus. To help make
owning a bike on campus easier, where available Bard has created designated areas in dorms for
day-to-day storage, as well as designated long-term storage in Tremblay for students to safely
store bikes during school breaks. Bike rider-ship at Bard is notable, but more can be done to
make campus more “bike-friendly” and boost bike ridership.
1st-year students gather for L&T “Bike to the Village” ride (Laurie Husted, 2014)
6.6.1. Expand Bike Co-op at Bard
Students have organized a Bike Co-op and created a space where students can congregate to
share cycling information, find and exchange parts, and perform tune-ups and repairs. BOS
continues to support the Bike Co-op by hiring students to run the BikeShare and Pedicab
programs.
6.6.2. Bike Programs
At the end of each academic year, the College retrieves abandoned bicycles and offers a bicycle
raffle to students, faculty and staff. About 100 bikes have been redistributed annually since
2013. In 2017, 25 bicycles were donated to local charities, including the Boys & Girls Club of
Hudson and the Alliance for Immigrants and Refugees. To help make bikes more accessible to
students, since 2012 Bard has collected a small fleet of bikes that it can lend to students for a $25
deposit. About twelve bikes are placed into the BikeShare program each year.

BARD COLLEGE: Climate Action Plan | 58
6.6.3. Make Campus More “Bike-friendly”
A handful of projects can be easily implemented to help make campus more bike-friendly,
including:
Increase number of bike racks at social hubs: currently, racks at certain social hubs
become overloaded, especially at peak hours, leading to bike overflow to student’s
locking bikes on lamp posts and trees.
Build covered structures for bike racks: students have given feedback that bikes
are often exposed to the elements, making biking to destinations less desirable.
Work with Dutchess County to enhance Annandale Road’s safety. Currently,
flashing signals and reduced speed signs are at either end of campus is in place.
Paint streets to designate bike lanes or shared roadway (sharrows), where possible.
Continue to check AASHE Resource Center and for more ideas.
6.7. Promote Walkability of Campus
The Bard main campus has a radius of roughly 0.5 miles from the center to the edges of campus, or
roughly a 7 -15 minute walking distance. Based on comments collected from the Fall 2008
transportation survey (see Appendix I) and informal student interviews, Bard increased the 15-
minute passing time to 20 minutes, to give students more time to:
Have quick after-class exchange sometimes necessary between students and/or professor
Walk distances between buildings at s moderate pace, at times having to ascend/descend
floors (especially noted for 1+ mile distance from main campus to Fischer Center)
Be seated and prepared as class begins
It is hoped that this extra time will promote the choice to walk (or bike, skateboard, etc.) amongst
students as a more effective way to traverse campus than “lot hopping” in personal vehicles.
To increase connectivity to the local and regional area, the Office of Sustainability and Landscape &
Arboretum Program participate in Bard, town, village, county and state efforts to enhance trails in
the region.

BARD COLLEGE: Climate Action Plan | 59
6.8. Mitigation Strategy Wedges & Timeline
Table 6.3 summarizes the timeline for neutralizing emissions from commuting. While implementing
a TMD program can improve the campus environment and can make it easier for commuters to
choose carbon-free modes of transportation, this is likely to have only a marginal impact on
commuting emission. Unfortunately, Bard policies cannot displace all demand for commuting or
preference for use of personal vehicles, and reducing emissions from commuting will ultimately rely
on traditional market drivers and regulations to steer the vehicle industry toward carbon-neutrality.
In the long-term, it seems reasonable that low/no-carbon models will become widely available and
affordable to individuals, gradually reducing commuting emissions in the lead up to 2035.
Time
PeriodWedge Description
Emissions
Reduction
(tCO2e)
Emissions
Reduction
(% of
total)Transpotation Demand
Management (Scope 3)
Implement policies that reduce demand
for personal vehicles, and increase
incentive to walk, bike, and use mass
transit.
Mainstream Use of Low/No Carbon
Personal Vehicles (Scope 3)
100% emissions offset from the gradual
transition to higher-efficiency vehicles
and low/no carbon fuels.
2,747 17.6%
15,603 100.0%
12,856 82.4%
Total Reductions by 2035
Total Emissions by 2035
Remaining Emissions
Table 6.3 Commuting Emissions Reduction Wedges
2,747 17.6%
TBD TBD
2017 –
2035

BARD COLLEGE: Climate Action Plan | 60
7. AIR TRAVEL EMISSIONS
7.1. Overview of Air Travel at Bard
Each year, Bard uses funding to book hundreds of flights for academic trips and other
institutional business, equating to millions of miles of air travel. However, it is difficult to
estimate emissions related to air travel funded by Bard. Although Bard makes use of two 3rd
-
party travel booking services to track costs and miles, many flights are booked by individuals
(who are then reimbursed) or department credit cards, which are often not tagged as air travel
alone, or kept in records that are easy to search.
To estimate air travel miles for the 2013/14 fiscal year, BOS workers reviewed several filing
cabinets of travel receipts to tag and tally air travel costs. Since travel miles are not usually
included on receipts, a metric of $0.143/mile was used to estimate roughly 4,000,000 miles. The
3rd
-party travel booking services reported an additional 3,544,000 miles, for a total of nearly 7.55
million miles. This remains the best estimate of Bard-funded air travel miles, until another record
audit can be completed and combined with the 3rd
-party reported miles.
Air travel funded by Bard is therefore estimated to generate 3,644 tCO2e, or 24.1% of total
annual emissions. This represents a significant portion of Bards total annual emission— roughly
as much as the entire Scope 2 emissions from purchased electricity. Understandably, the College
needs to be able to fly staff, faculty, and students, domestic and abroad, for academic enrichment
or institutional business. It seems unlikely that Bard will be able to reduce its demand for air
travel by any significant amount in the near future. Short of major advancements in aviation or
alternative fuels to render air travel carbon-neutral, Bard will likely have to offset air travel
emissions in other ways.
7.2. Reducing Air Travel
Reducing air travel can lead to considerable cost-savings and emissions reductions. The average
round-trip flight approved by Bard in FY 2015/16 in was roughly 2,800 miles, and therefore
every trip that is avoided can potentially save $400 and roughly 1 tCO2e.8 The following
measures could be taken to eliminate trips and to increase the efficiency of necessary air travel.
7.2.1. Create a Centralized System for Booking Flights
For the past several years, the College has utilized two 3rd
-party travel services for booking
domestic flights and some international flights. However, an estimate half of all Bard-funded air
travel is booked using Bard credit cards or by individuals who are reimbursed, making it difficult
to track all air miles and costs, and potentially underreporting emissions. Creating a fully
centralized flight booking process or system can lead to better management, and provide analysis
for ways to reduce air travel or coordinate using the same flights for multiple travelers.
8 Based on metric of $0.143/mile and estimated Bard-funded air miles.

BARD COLLEGE: Climate Action Plan | 61
7.2.2. Telecommunicating
Telecommunicating is a cost-effective and increasingly valid means of conducting business
without traveling. Bard policy should be developed to exhaust all options to telecommunicate
before allowing faculty and staff to book air travel.
7.2.3. Use Alternative Transportation for Short-haul Trips
Short-haul trips of around 250 miles (about 4 hours driving) or less may be able to utilize
alternative transportation, such as railroad, bus, or use of the Transportation Department’s
electric hybrid cars.
7.3. Air Travel Emissions Reduction Timeline
By reducing the number of approved flights each year, Bard can hope to reduce costs and
emissions. However, air travel is a necessity to conduct business and support academic
programs, and it may prove difficult for Bard to reduce its demand for air travel. Therefore, to
allow for emissions generate by air travel and still achieve carbon-neutrality goals, Bard will
likely have to purchase carbon offsets. With regional carbon offsets selling at around $3 to $8
per tCO2e 9, under a BAU scenario this would cost Bard between $10,000 and $30,000 annually
to completely offset all air travel emissions, with future prices for offsets unknown. Table 7.1
displays a preliminary plan to reduce emission from air travel through 2035.
9 Regional Greenhouse Gas Initiative (July, 2017) www.rggi.org/market/co2_auctions/results
Time
PeriodWedge Description
Emissions
Reduction
(tCO2e)
Emissions
Reduction
(% of total)
Increase use of telecommunicating and
reduce amount of approved flights
(Scope 3)
Reduce number of approved flights by 15%.
Continue to reduce # of flights: TBD
Purchase carbon offsets: TBD
547 3.5%
15,603 100.0%
15,056 96.5%Remaining Emissions
Total Reductions by 2035
Total Emissions by 2035
Table 7.1 Air Travel Emissions Reduction Wedges
2017 –
2025
2026 –
2035TBD TBD
547 3.5%

BARD COLLEGE: Climate Action Plan | 62
8. ADDITIONAL MITIGATION ACTIONS
8.1. Purchase Carbon Offsets and RECs
If mitigation strategies cannot account for total emissions reductions by 2035, for Bard to fulfill
its goals and promises, remaining emissions must be accounted for via the purchase of carbon
offset and renewable energy certificate (RECs).
8.1.1. Carbon Offsets
A single carbon offset represents one ton of carbon emissions abated, which is claimed by the
owner of the offset. There are a variety of offsets available on the market, which vary by price
($2 - $100) 10
and in the standards deemed “acceptable” for sources of offsets (for instance,
reforestation vs. trash incineration for energy). Further research is needed to vet vendors and to
determine which standards are appropriate for Bard.
8.1.2. Renewable Energy Credits (RECs)
A single REC represents one MWh of energy generated by a renewable source, which is claimed
by the owner of the certificate and may be used to offset a MWh of electricity from a dirty grid
mix. Similarly to carbon offsets, RECs types vary by price and regulatory standards, and further
research is needed to determine the extent to which purchasing RECs in the future is appropriate
and cost-effective for Bard. However, in 2016 and past years, Bard has purchased RECs
equivalent to 2,000,000 kWh of renewable electricity, enough to offset roughly 10% of Bard’s
electricity production.
Bard has purchased Renewable Energy Credits (RECs) to offset 10% of its electric emissions.
10
Price values come from the range and average of prices displayed by various vendors. Retrieved 12/05/09 from
http://www.ecobusinesslinks.com/carbon_offset_wind_credits_carbon_reduction.htm

BARD COLLEGE: Climate Action Plan | 63
8.1.3. Estimated Cost to “Buy-our-way-out” under BAU Scenario
To estimate the potential cost of completely “buying-our-way-out” of reducing all emissions in
2035 using only offsets, we assume the following:
• BAU Growth Scenario for Bard (see Section 2.3)
• Carbon offsets are chosen over RECs as the most cost-effective means to offset emissions
• An average offset price of $12/certificate11
, remaining constant over time
• The presence of a “greener” electricity grid (see Section 4.7.2, New York renewable
growth scenario)
Figure 8.1 shows a simple projection of the annual cost of “buying-our-way-out” starting at the
neutrality date of 2035 through 2050. Under these assumptions, Bard could be paying around
$200,000 annually (2017 dollars), with a total present value cost of purchasing offsets over 15
year period (from 2035 to 2050) would accumulate to more than $1.1 million.
Figure 8.1 Cost of completely "Buying-our-way-out" by purchasing carbon offsets. Under these assumptions, the present value cost of purchasing offsets for the 15-year period from 2035 to 2050 would accumulate to more than $1,100,000.
11
Price value comes from mean average of prices displayed by listed vendors. Retrieved 12/05/09 from
http://www.ecobusinesslinks.com/carbon_offset_wind_credits_carbon_reduction.htm
BARD COLLEGE: Climate Action Plan | 64
8.2. Carbon Sequestration with Forest Management
Regionally, climate change is making forests more vulnerable by contributing to an increased
number of weakened trees and invasive species, more disease susceptibility, and decreased
regeneration. A healthy forest provides carbon sequestration, biodiversity, pest resistance, and is
a source of bio fuel.
The roughly 550-acre Annandale main campus and 380-acre Montgomery Place property are
heavily forested, including approximately 300 acres of the Annandale campus and the South
Woods, an 80-acre native forest at Montgomery Place (additional woods border the Saw Kill
Creek). Our forests are not actively managed, except in certain landscaped and trail areas.
Locally, invasive insects are contributing to a loss of hemlock and nearly all ash trees. Maple
and oak trees may be next.
According to Cornell, “The annual carbon sequestration rate on 9,500 acres of Cornell forest
land is approximately 11,260 tons of CO2; through active management practices, it is possible to
significantly increase the carbon sequestration rate of these lands. If the university does not
actively plant new trees and manage its mature forest stands, the carbon abatement capacity of
these lands will diminish over time.”
In a 11/16/2015 letter to the White House, and as part of our Climate Leadership Commitments,
President Botstein pledged to enhance the resiliency of our region by maintaining at least 30% of
our land as forest, wetland and/or river frontage. We hope to study how to refine this pledge by
calculating the carbon capture potential of our land, which could involve creating a Forest
Management Plan. Bard’s Landscape & Tree Care Guidelines, Standards & Considerations
Manual currently describes reforestation guidelines for disturbed areas of the campus and is an
appropriate location to codify future updates.