Embed Size (px)
Citation preview
Barclays Select Growth ConferenceNovember 18, 2013
2
Forward-Looking StatementsThis Presentation has been prepared by Calumet Specialty Products Partners, L.P. (the “Company” or “Calumet”) as of November 18, 2013. The information in this Presentation includes certain “forward-looking statements”. These statements can be identified by the use of forward-looking terminology including “may,” “intend,” “believe,” “expect,” “anticipate,” “estimate,” “forecast,” “continue” or other similar words. The statements discussed in this Presentation that are not purely historical data are forward-looking statements. These forward-looking statements discuss future expectations or state other “forward-looking” information and involved risks and uncertainties. When considering forward-looking statements, you should keep in mind the risk factors and other cautionary statements included in our most recent Annual Report on Form 10-K and Quarterly Reports on Form 10-Q. The risk factors and other factors noted in our most recent Annual Report on Form 10-K and Quarterly Reports on Form 10-Q could cause our actual results to differ materially from those contained in any forward-looking statement.
Our forward-looking statements are not guarantees of future performance, and actual results and future performance may differ materially from those suggested in any forward-looking statement. All subsequent written and oral forward-looking statements attributable to us or to persons acting on our behalf are expressly qualified in their entirety by the foregoing. Existing and prospective investors are cautioned not to place undue reliance on such forward-looking statements, which speak only as of the date of this Presentation. We undertake no obligation to publicly release the results of any revisions to any such forward-looking statements that may be made to reflect events or circumstances after the date of this Presentation or to reflect the occurrence of unanticipated events.
The information in this Presentation is strictly confidential and may not be reproduced or redistributed, in whole or in part, to any other person. The information contained herein has been prepared to assist interested parties in making their own evaluation of the Company and does not purport to contain all of the information that an interested party may desire. In all cases, interested parties should conduct their own investigation and analysis of the Company, its assets, financial condition and prospects and of the data set forth in this Presentation. This Presentation shall not be deemed an indication of the state of affairs of the Company, or its businesses described herein, at any time after the date of this Presentation nor an indication that there has been no change in such matters since the date of this Presentation.
This Presentation and any other information which you may be given at the time of presentation, in whatever form, do not constitute or form part of any offer or invitation to sell or issue, or any solicitation of any offer to purchase or subscribe for any securities of the Company, nor shall it or any part of it form the basis of, or be relied upon in connection with, any contract or commitment whatsoever. Neither this Presentation nor any information included herein should be construed as or constitute a part of a recommendation regarding the securities of the Company. Furthermore, no representation or warranty (express or implied) is made as to, and no reliance should be placed on, any information, including projections, estimates, targets and opinions contained herein, and no liability whatsoever is accepted as to any errors, omissions or misstatements contained herein. Neither the Company nor any of its officers or employees accepts any liability whatsoever arising directly or indirectly from the use of this Presentation.
3
Partnership Overview
4
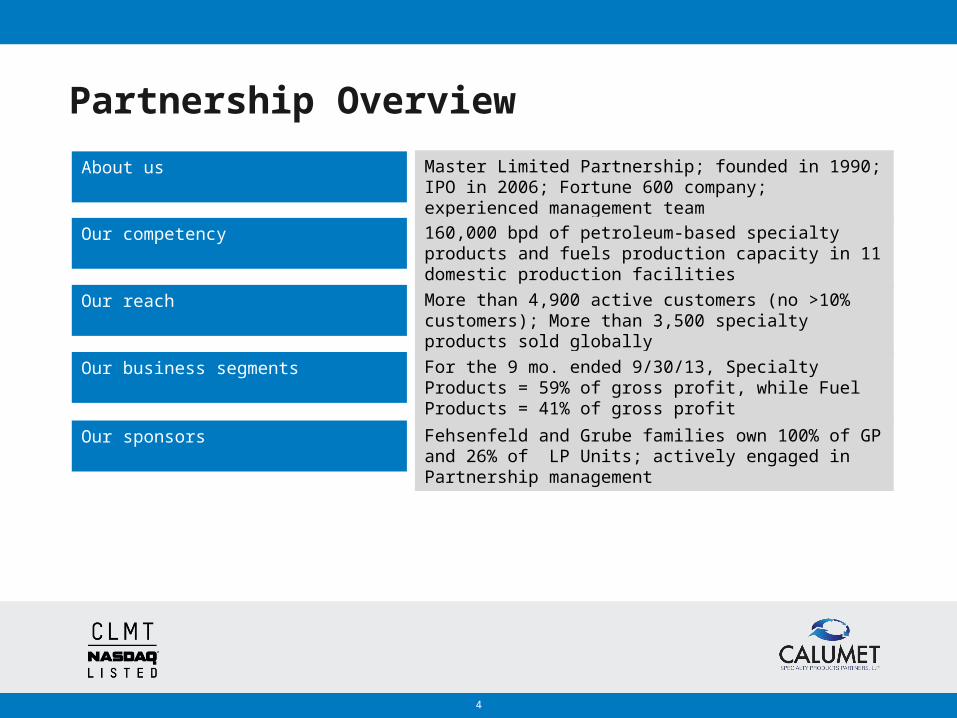
Partnership Overview
About us Master Limited Partnership; founded in 1990; IPO in 2006; Fortune 600 company; experienced management team
Our competency 160,000 bpd of petroleum-based specialty products and fuels production capacity in 11 domestic production facilities
Our reach More than 4,900 active customers (no >10% customers); More than 3,500 specialty products sold globally
Our business segments For the 9 mo. ended 9/30/13, Specialty Products = 59% of gross profit, while Fuel Products = 41% of gross profit
Our sponsors Fehsenfeld and Grube families own 100% of GP and 26% of LP Units; actively engaged in Partnership management
5
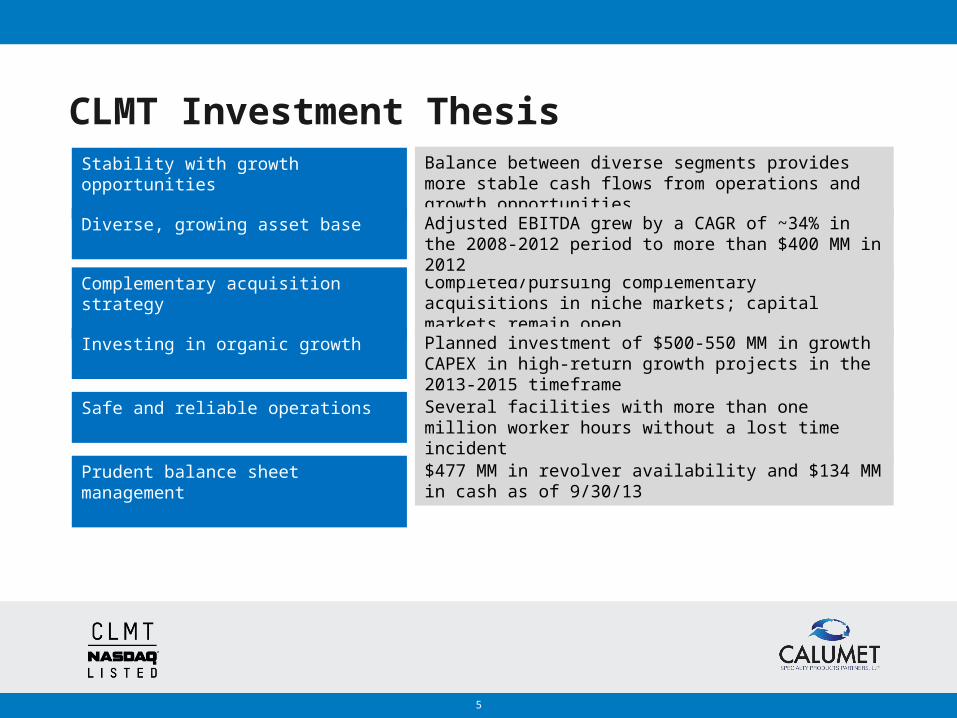
CLMT Investment ThesisStability with growth opportunities Balance between diverse segments provides more stable
cash flows from operations and growth opportunities
Complementary acquisition strategy Completed/pursuing complementary acquisitions in niche markets; capital markets remain open
Investing in organic growth Planned investment of $500-550 MM in growth CAPEX in high-return growth projects in the 2013-2015 timeframe
Prudent balance sheet management $477 MM in revolver availability and $134 MM in cash as of 9/30/13
Diverse, growing asset base Adjusted EBITDA grew by a CAGR of ~34% in the 2008-2012 period to more than $400 MM in 2012
Safe and reliable operations Several facilities with more than one million worker hours without a lost time incident
6
Unlocking Value For Our Unitholders
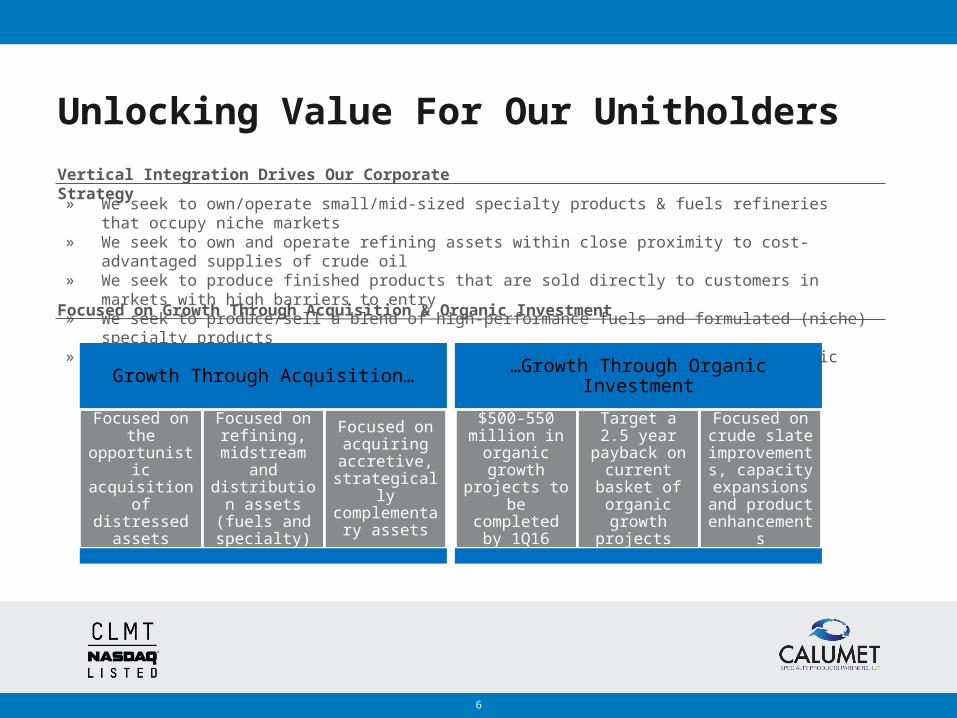
Vertical Integration Drives Our Corporate Strategy
Focused on Growth Through Acquisition & Organic Investment
» We seek to own/operate small/mid-sized specialty products & fuels refineries that occupy niche markets » We seek to own and operate refining assets within close proximity to cost-advantaged supplies of crude oil» We seek to produce finished products that are sold directly to customers in markets with high barriers to entry» We seek to produce/sell a blend of high-performance fuels and formulated (niche) specialty products » We seek to sell finished products to a diverse range of customers in domestic and international markets
Growth Through Acquisition…
Focused on the opportunistic acquisition of
distressed assets
Focused on refining,
midstream and distribution
assets (fuels and specialty)
Focused on acquiring accretive,
strategically complementary
assets
…Growth Through Organic Investment
$500-550 million in
organic growth projects to be completed by
1Q16
Target a 2.5 year payback
on current basket of
organic growth projects
Focused on crude slate
improvements, capacity
expansions and product
enhancements
7
Balanced Niche-Asset Portfolio
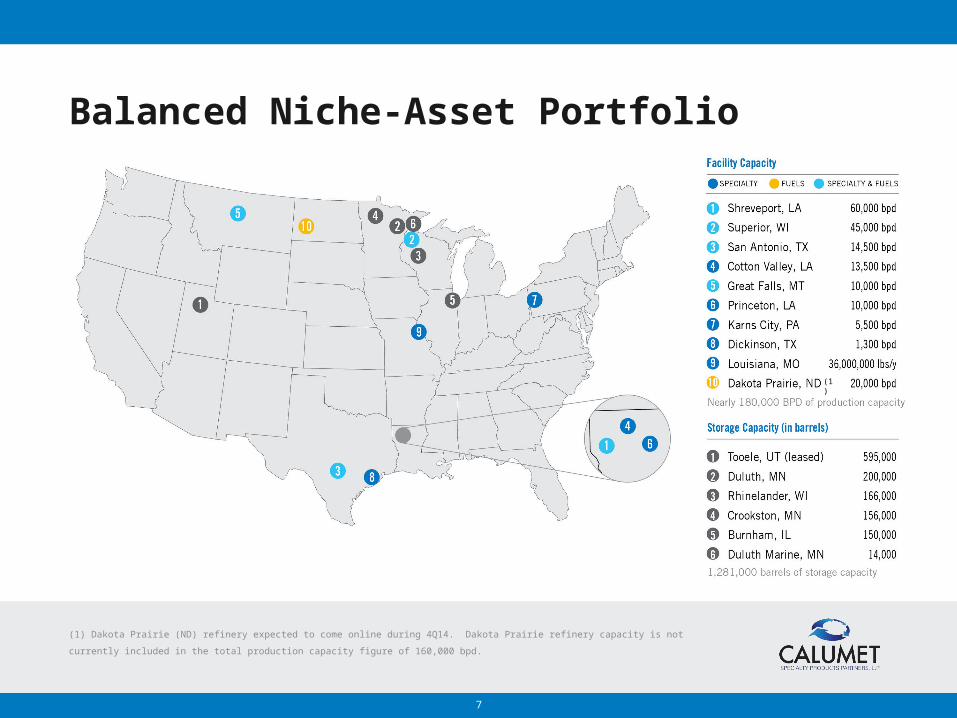
(1) Dakota Prairie (ND) refinery expected to come online during 4Q14. Dakota Prairie refinery capacity is not currently included in the total production capacity
figure of 160,000 bpd.
(1)
8
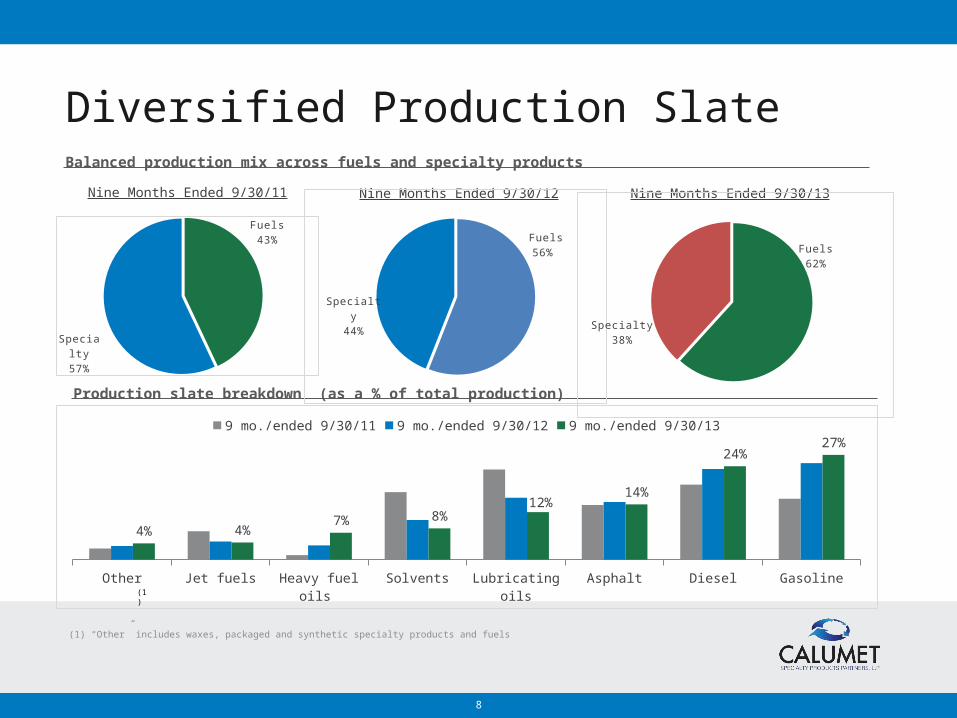
Diversified Production SlateBalanced production mix across fuels and specialty products
Production slate breakdown (as a % of total production)
Nine Months Ended 9/30/11
(1) “Other” includes waxes, packaged and synthetic specialty products and fuels
(1)
Nine Months Ended 9/30/12 Nine Months Ended 9/30/13
Fuels43%
Specialty57%
Fuels56%
Specialty44%
Fuels62%
Specialty38%
Other Jet fuels Heavy fuel oils Solvents Lubricating oils Asphalt Diesel Gasoline
4% 4%7% 8%
12%14%
24%27%
9 mo./ended 9/30/11 9 mo./ended 9/30/12 9 mo./ended 9/30/13

9
Wide Array of Specialty Products Applications
Note: While Calumet does not produce or sell the consumer products pictured above, its finished products are components of such products. The logos,
trademarks and other intellectual property associated with the products pictured above are the intellectual property of those who own or license rights therein.
10
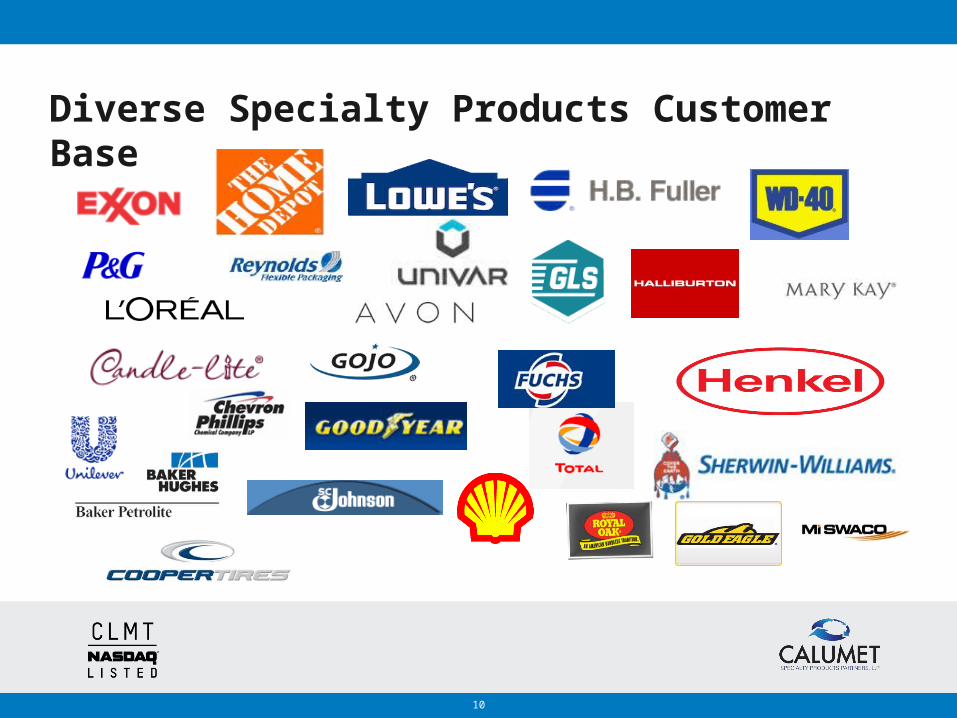
Diverse Specialty Products Customer Base
11
Recent Developments & Outlook
12
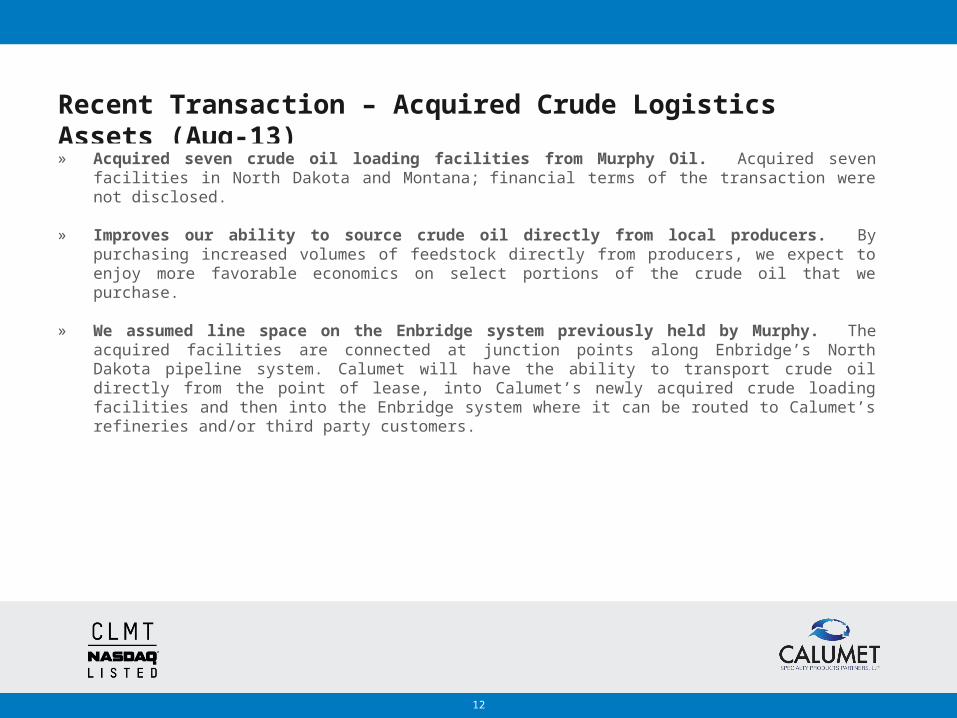
Recent Transaction – Acquired Crude Logistics Assets (Aug-13)
» Acquired seven crude oil loading facilities from Murphy Oil. Acquired seven facilities in North Dakota and Montana; financial terms of the transaction were not disclosed.
» Improves our ability to source crude oil directly from local producers. By purchasing increased volumes of feedstock directly from producers, we expect to enjoy more favorable economics on select portions of the crude oil that we purchase.
» We assumed line space on the Enbridge system previously held by Murphy. The acquired facilities are connected at junction points along Enbridge’s North Dakota pipeline system. Calumet will have the ability to transport crude oil directly from the point of lease, into Calumet’s newly acquired crude loading facilities and then into the Enbridge system where it can be routed to Calumet’s refineries and/or third party customers.
13
Recent Transaction – TexStar Pipeline Agreement (Nov-13)» TexStar to build a crude oil pipeline that will directly supply our San Antonio refinery. Calumet has
entered into a definitive agreement with TexStar Midstream Logistics, L.P. under which TexStar will construct, own and operate a 30,000 bpd crude oil pipeline system that will supply significant volumes of crude oil to our San Antonio refinery.
» TexStar line will supply local Eagle Ford crude oil to our San Antonio refinery. Under the terms of the 15-
year agreement, TexStar has committed to install and operate the Karnes North Pipeline System (“KNPS”), an 8-inch, 50-mile pipeline that will transport crude oil from Karnes City, Texas – a major center of oil production in the Eagle Ford shale formation - to Calumet’s Elmendorf, Texas terminal, a key supply hub for our San Antonio refinery. The San Antonio refinery expects to receive deliveries of at least 10,000 bpd of crude oil through the KNPS-Elmendorf terminal supply route once the line comes into service during the fourth quarter 2014.
» Anticipate crude oil transportation costs to decline meaningfully at the San Antonio refinery. As a result of this agreement, we expect to significantly reduce its cost to transport crude oil to the San Antonio refinery, where it currently receives crude oil deliveries by truck. Over time, Calumet expects to increase the volume of crude oil shipped on the KNPS above 10,000 bpd, which should meaningfully contribute to incremental cost savings.
14
Organic Growth Projects Update
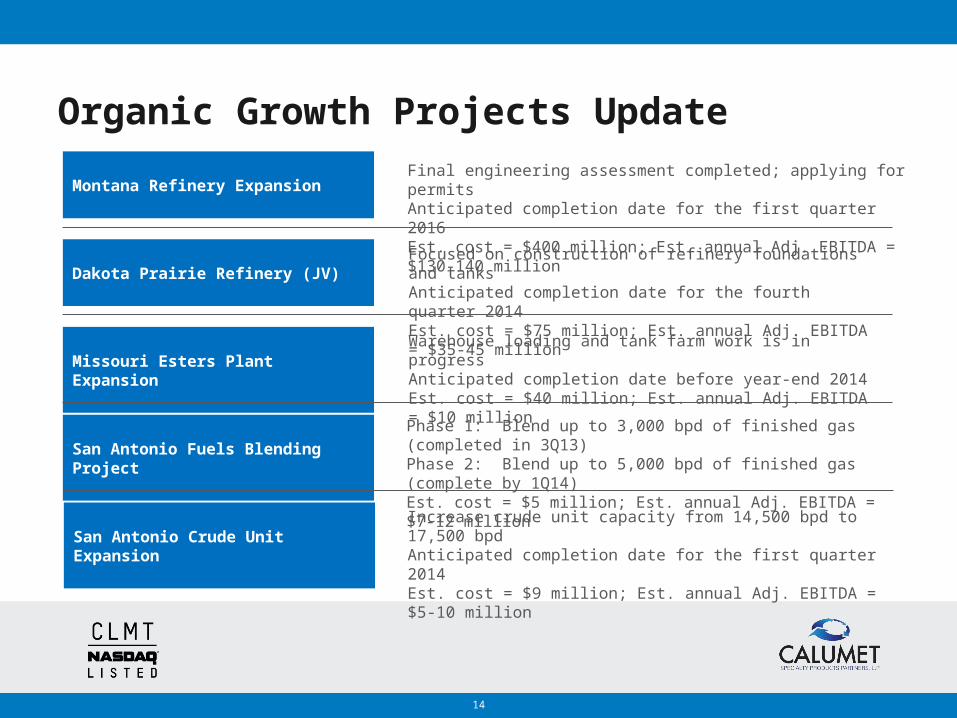
Montana Refinery Expansion
Dakota Prairie Refinery (JV)
Missouri Esters Plant Expansion
San Antonio Fuels Blending Project
Final engineering assessment completed; applying for permits Anticipated completion date for the first quarter 2016 Est. cost = $400 million; Est. annual Adj. EBITDA = $130-140 million
Focused on construction of refinery foundations and tanks Anticipated completion date for the fourth quarter 2014 Est. cost = $75 million; Est. annual Adj. EBITDA = $35-45 million
Phase 1: Blend up to 3,000 bpd of finished gas (completed in 3Q13) Phase 2: Blend up to 5,000 bpd of finished gas (complete by 1Q14) Est. cost = $5 million; Est. annual Adj. EBITDA = $7-12 million
Warehouse loading and tank farm work is in progress Anticipated completion date before year-end 2014 Est. cost = $40 million; Est. annual Adj. EBITDA = $10 million
San Antonio Crude Unit Expansion
Increase crude unit capacity from 14,500 bpd to 17,500 bpd Anticipated completion date for the first quarter 2014 Est. cost = $9 million; Est. annual Adj. EBITDA = $5-10 million
15
Organic Growth Projects – Costs & Contributions
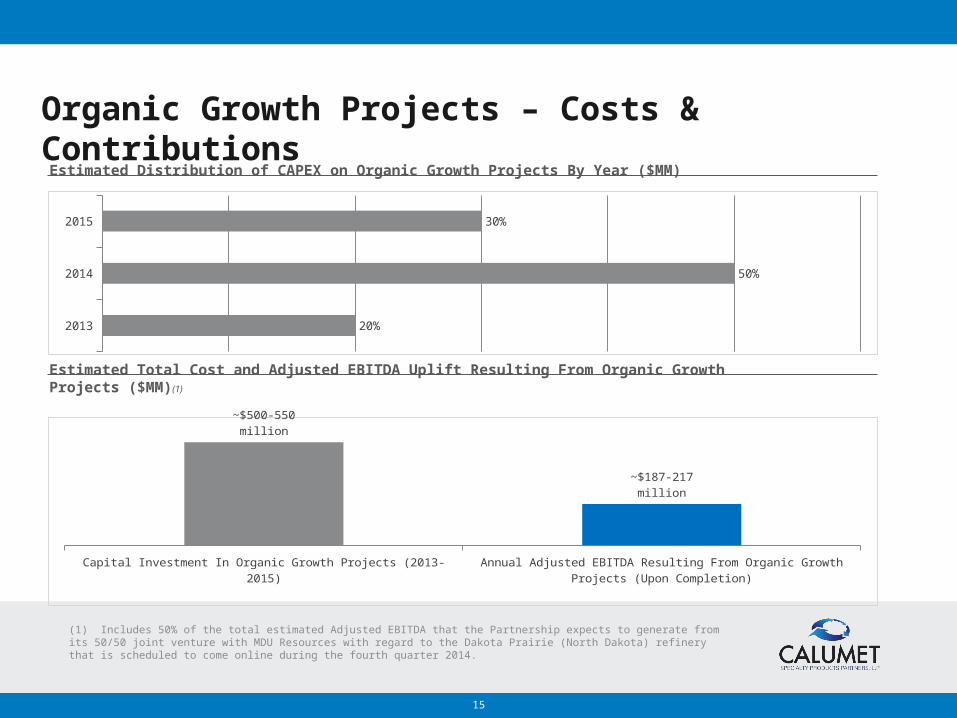
Estimated Total Cost and Adjusted EBITDA Uplift Resulting From Organic Growth Projects ($MM) (1)
(1) Includes 50% of the total estimated Adjusted EBITDA that the Partnership expects to generate from its 50/50 joint venture with MDU Resources with regard to the Dakota Prairie (North Dakota) refinery that is scheduled to come online during the fourth quarter 2014.
Capital Investment In Organic Growth Projects (2013-2015) Annual Adjusted EBITDA Resulting From Organic Growth Projects (Upon Completion)
~$500-550 million
~$187-217 million
Estimated Distribution of CAPEX on Organic Growth Projects By Year ($MM)
2013
2014
2015
20%
50%
30%
16
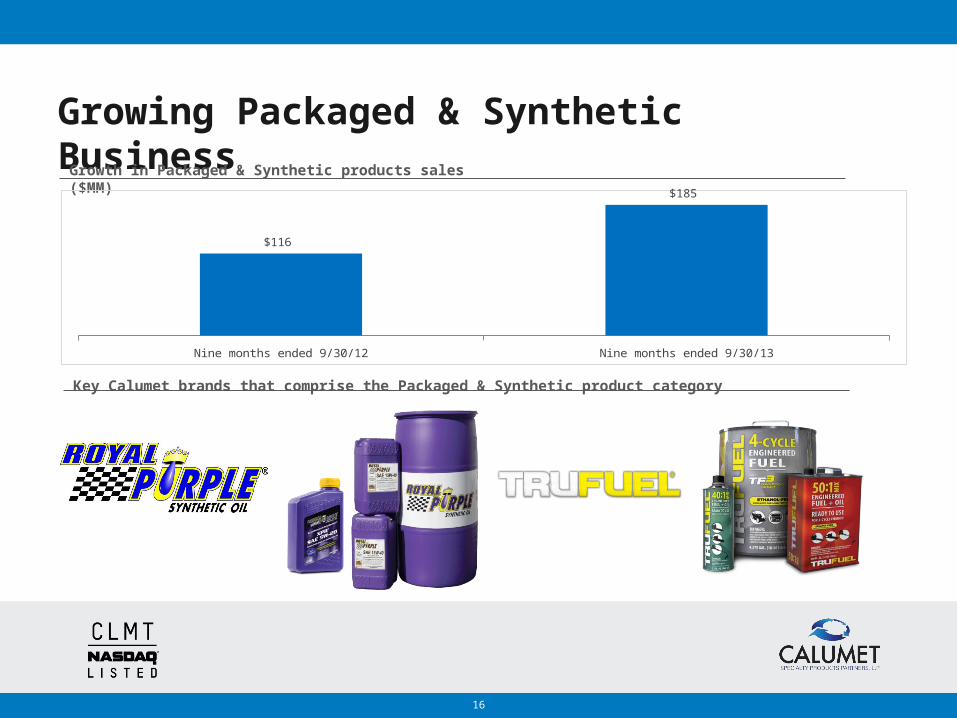
Growing Packaged & Synthetic BusinessGrowth in Packaged & Synthetic products sales ($MM)
Nine months ended 9/30/12 Nine months ended 9/30/13
$116
$185
Key Calumet brands that comprise the Packaged & Synthetic product category
17
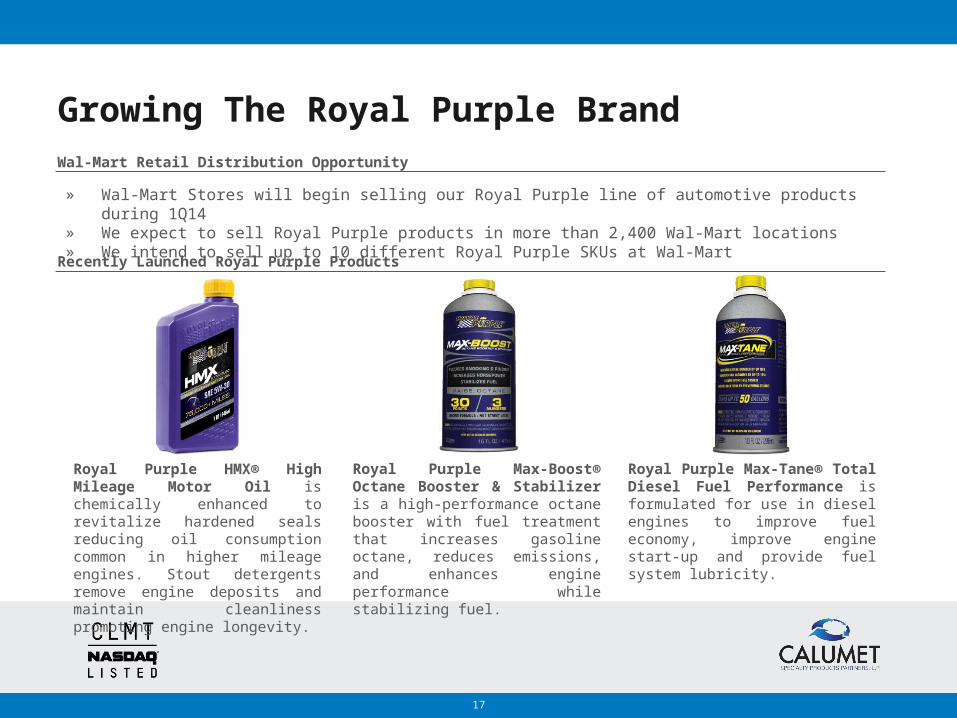
Growing The Royal Purple BrandWal-Mart Retail Distribution Opportunity
Recently Launched Royal Purple Products
Royal Purple HMX® High Mileage Motor Oil is chemically enhanced to revitalize hardened seals reducing oil consumption common in higher mileage engines. Stout detergents remove engine deposits and maintain cleanliness promoting engine longevity.
Royal Purple Max-Boost® Octane Booster & Stabilizer is a high-performance octane booster with fuel treatment that increases gasoline octane, reduces emissions, and enhances engine performance while stabilizing fuel.
Royal Purple Max-Tane® Total Diesel Fuel Performance is formulated for use in diesel engines to improve fuel economy, improve engine start-up and provide fuel system lubricity.
» Wal-Mart Stores will begin selling our Royal Purple line of automotive products during 1Q14 » We expect to sell Royal Purple products in more than 2,400 Wal-Mart locations» We intend to sell up to 10 different Royal Purple SKUs at Wal-Mart
18
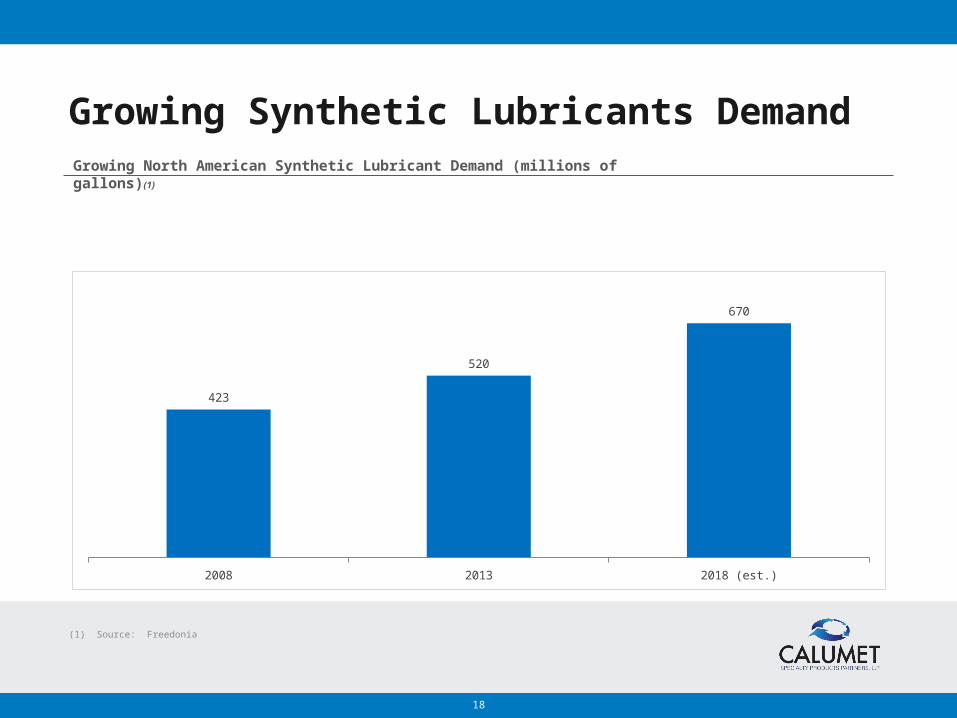
Growing Synthetic Lubricants Demand
(1) Source: Freedonia
Growing North American Synthetic Lubricant Demand (millions of gallons) (1)
2008 2013 2018 (est.)
423
520
670
19
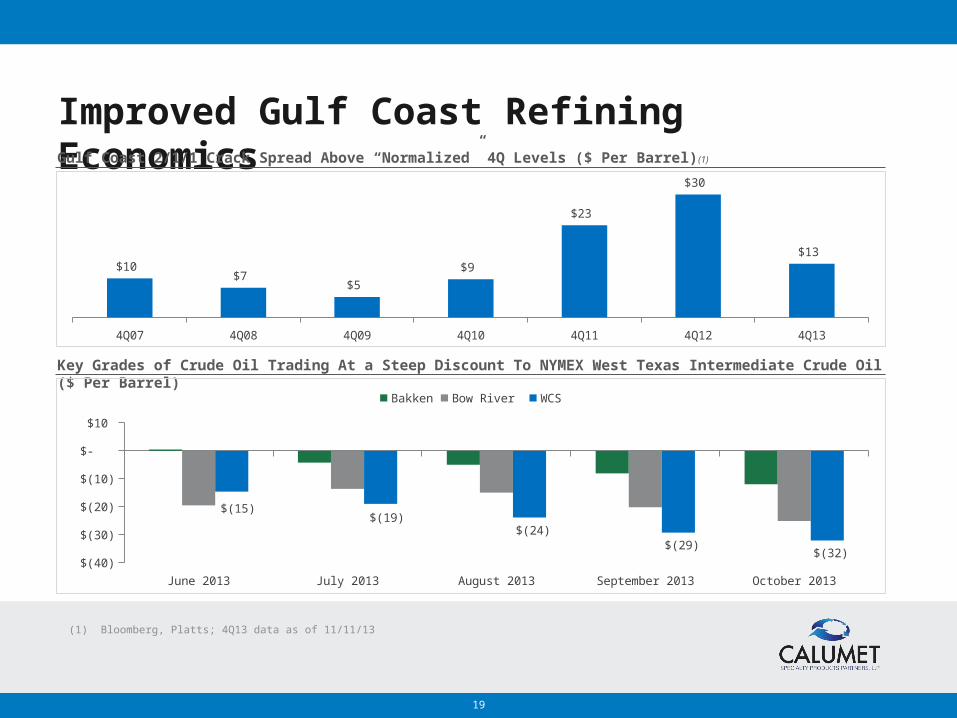
Improved Gulf Coast Refining EconomicsGulf Coast 2/1/1 Crack Spread Above “Normalized” 4Q Levels ($ Per Barrel) (1)
Key Grades of Crude Oil Trading At a Steep Discount To NYMEX West Texas Intermediate Crude Oil ($ Per Barrel)
(1) Bloomberg, Platts; 4Q13 data as of 11/11/13
4Q07 4Q08 4Q09 4Q10 4Q11 4Q12 4Q13
$10 $7
$5
$9
$23
$30
$13
June 2013 July 2013 August 2013 September 2013 October 2013 $(40)
$(30)
$(20)
$(10)
$-
$10
$(15) $(19)
$(24) $(29)
$(32)
Bakken Bow River WCS
20
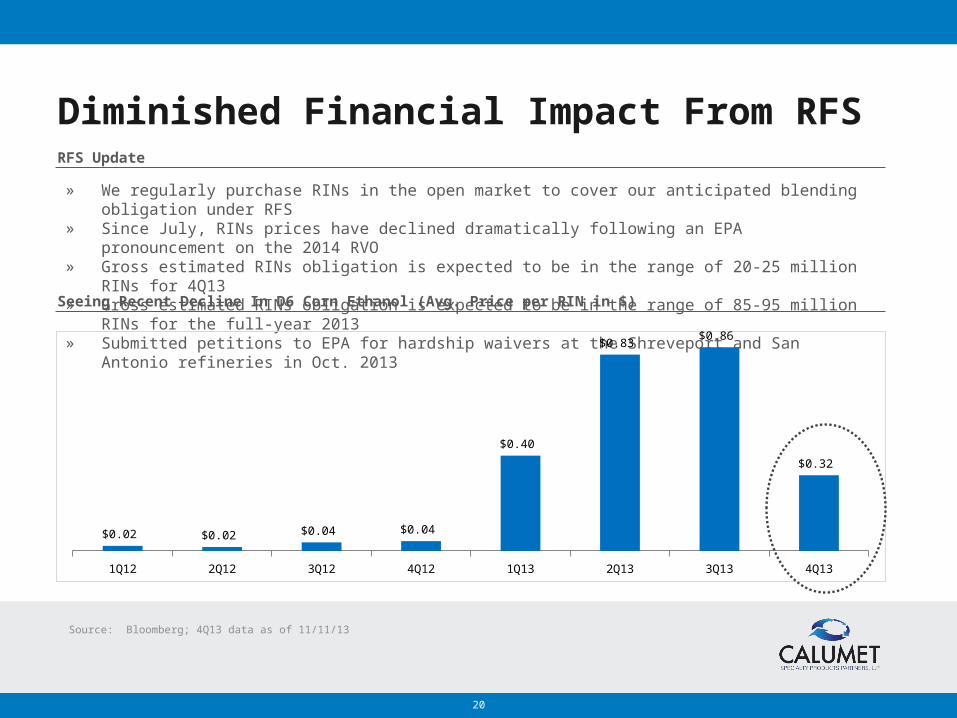
Diminished Financial Impact From RFS
Seeing Recent Decline In D6 Corn Ethanol (Avg. Price per RIN in $)
Source: Bloomberg; 4Q13 data as of 11/11/13
RFS Update
» We regularly purchase RINs in the open market to cover our anticipated blending obligation under RFS» Since July, RINs prices have declined dramatically following an EPA pronouncement on the 2014 RVO» Gross estimated RINs obligation is expected to be in the range of 20-25 million RINs for 4Q13» Gross estimated RINs obligation is expected to be in the range of 85-95 million RINs for the full-year 2013» Submitted petitions to EPA for hardship waivers at the Shreveport and San Antonio refineries in Oct. 2013
1Q12 2Q12 3Q12 4Q12 1Q13 2Q13 3Q13 4Q13
$0.02 $0.02 $0.04 $0.04
$0.40
$0.83 $0.86
$0.32
21
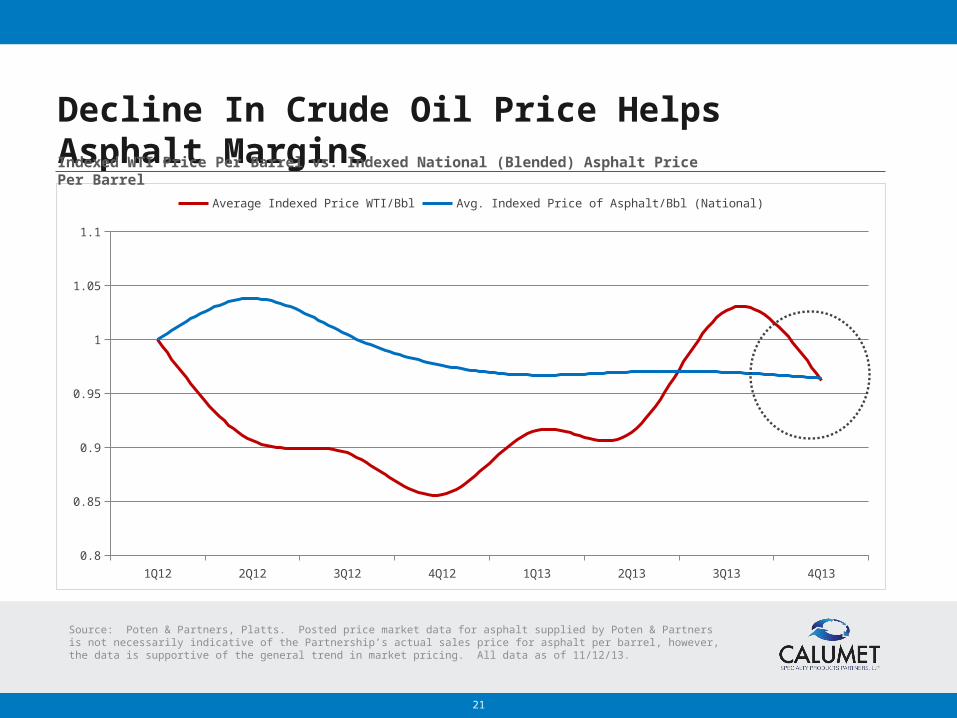
Decline In Crude Oil Price Helps Asphalt Margins
1Q12 2Q12 3Q12 4Q12 1Q13 2Q13 3Q13 4Q130.8
0.85
0.9
0.95
1
1.05
1.1
Average Indexed Price WTI/Bbl Avg. Indexed Price of Asphalt/Bbl (National)
Indexed WTI Price Per Barrel vs. Indexed National (Blended) Asphalt Price Per Barrel
Source: Poten & Partners, Platts. Posted price market data for asphalt supplied by Poten & Partners is not necessarily indicative of the Partnership’s actual sales price for asphalt per barrel, however, the data is supportive of the general trend in market pricing. All data as of 11/12/13.
22
Financial Overview
23
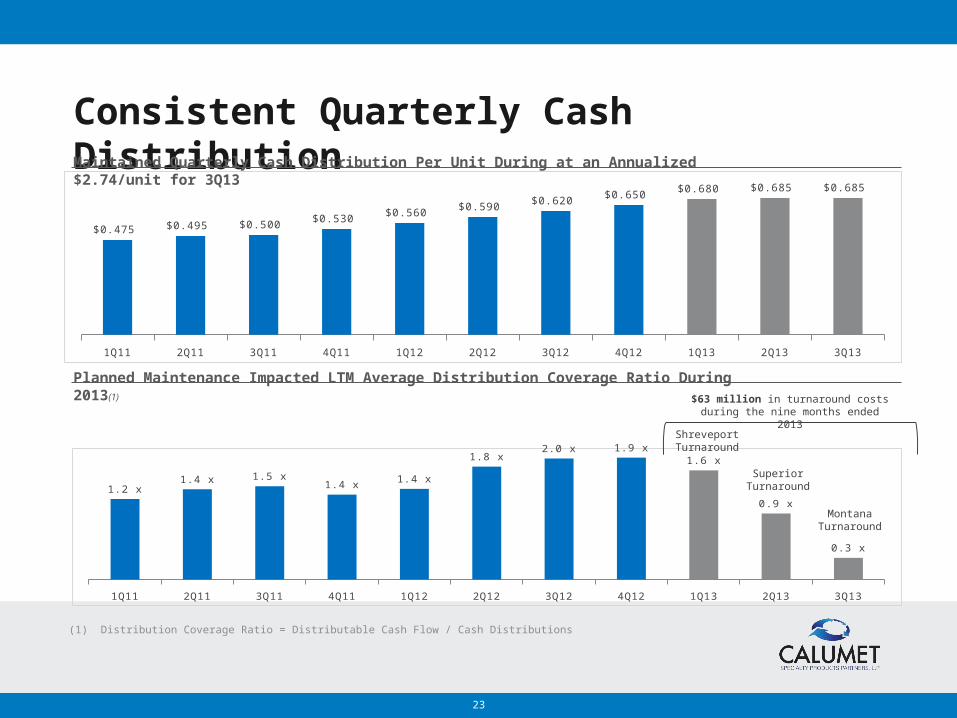
Consistent Quarterly Cash Distribution
(1) Distribution Coverage Ratio = Distributable Cash Flow / Cash Distributions
Maintained Quarterly Cash Distribution Per Unit During at an Annualized $2.74/unit for 3Q13
Planned Maintenance Impacted LTM Average Distribution Coverage Ratio During 2013 (1)
1Q11 2Q11 3Q11 4Q11 1Q12 2Q12 3Q12 4Q12 1Q13 2Q13 3Q13
1.2 x1.4 x 1.5 x
1.4 x1.4 x
1.8 x2.0 x 1.9 x
1.6 x
0.9 x
0.3 x
Shreveport Turnaround
Superior Turnaround
Montana Turnaround
1Q11 2Q11 3Q11 4Q11 1Q12 2Q12 3Q12 4Q12 1Q13 2Q13 3Q13
$0.475 $0.495 $0.500 $0.530
$0.560 $0.590
$0.620 $0.650
$0.680 $0.685 $0.685
$63 million in turnaround costs during the nine months ended 2013
24
Credit Rating Upgrades YTD 2013
Standard & Poor’s Ratings Services Upgrade. On September 3, 2013, Standard & Poor's Ratings Services raised its corporate credit rating on Calumet Specialty Products Partners L.P. to 'B+' from 'B'. They also raised their issue-level rating on Calumet's senior unsecured debt to 'B+' from 'B'. The '4' recovery rating is unchanged. According to the S&P report, “We base the ratings upgrade on Calumet's increased size and geographic diversity, while maintaining good liquidity and adequate financial ratios.” S&P maintained a Stable Outlook on the rating.
Moody’s Investor Service Upgrade. On May 24, 2013, Moody’s Investor Service upgraded Calumet Specialty Products Partners, L.P.’s ratings, including its Corporate Family Rating, to ‘B1’ from ‘B2’ and raised the rating on our senior unsecured notes to ‘B2’ from ‘B3’. According to the Moody’s report, “Calumet’s upgrade to B1 reflects its growing scale through organic growth and acquisitions along with good financial discipline that has resulted in lower leverage over time.” Moody’s maintained a Positive Outlook on the rating.
25
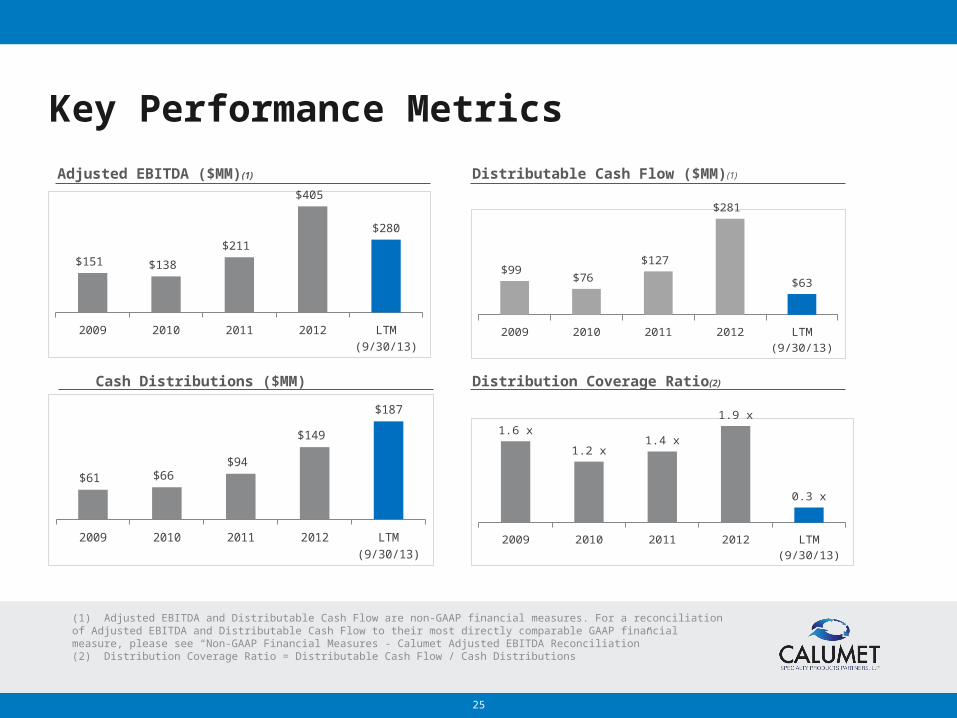
Key Performance Metrics
Adjusted EBITDA ($MM)(1) Distributable Cash Flow ($MM)(1)
Cash Distributions ($MM) Distribution Coverage Ratio(2)
(1) Adjusted EBITDA and Distributable Cash Flow are non-GAAP financial measures. For a reconciliation of Adjusted EBITDA and Distributable Cash Flow to their most directly comparable GAAP financial measure, please see “Non-GAAP Financial Measures - Calumet Adjusted EBITDA Reconciliation”(2) Distribution Coverage Ratio = Distributable Cash Flow / Cash Distributions
2009 2010 2011 2012 LTM (9/30/13)
$151 $138
$211
$405
$280
2009 2010 2011 2012 LTM (9/30/13)
$99 $76
$127
$281
$63
2009 2010 2011 2012 LTM (9/30/13)
$61 $66 $94
$149
$187
2009 2010 2011 2012 LTM (9/30/13)
1.6 x
1.2 x1.4 x
1.9 x
0.3 x
26
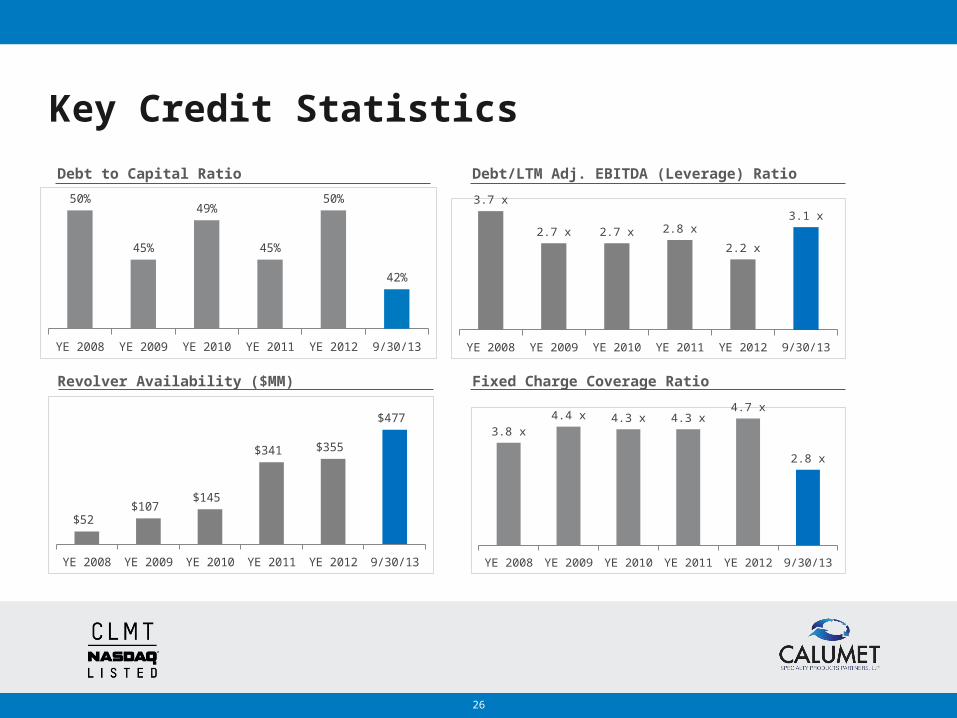
Key Credit Statistics
Debt to Capital Ratio Debt/LTM Adj. EBITDA (Leverage) Ratio
Revolver Availability ($MM) Fixed Charge Coverage Ratio
YE 2008 YE 2009 YE 2010 YE 2011 YE 2012 9/30/13
50%
45%
49%
45%
50%
42%
YE 2008 YE 2009 YE 2010 YE 2011 YE 2012 9/30/13
3.7 x
2.7 x 2.7 x 2.8 x
2.2 x
3.1 x
YE 2008 YE 2009 YE 2010 YE 2011 YE 2012 9/30/13
$52 $107
$145
$341 $355
$477
YE 2008 YE 2009 YE 2010 YE 2011 YE 2012 9/30/13
3.8 x
4.4 x 4.3 x 4.3 x4.7 x
2.8 x
27
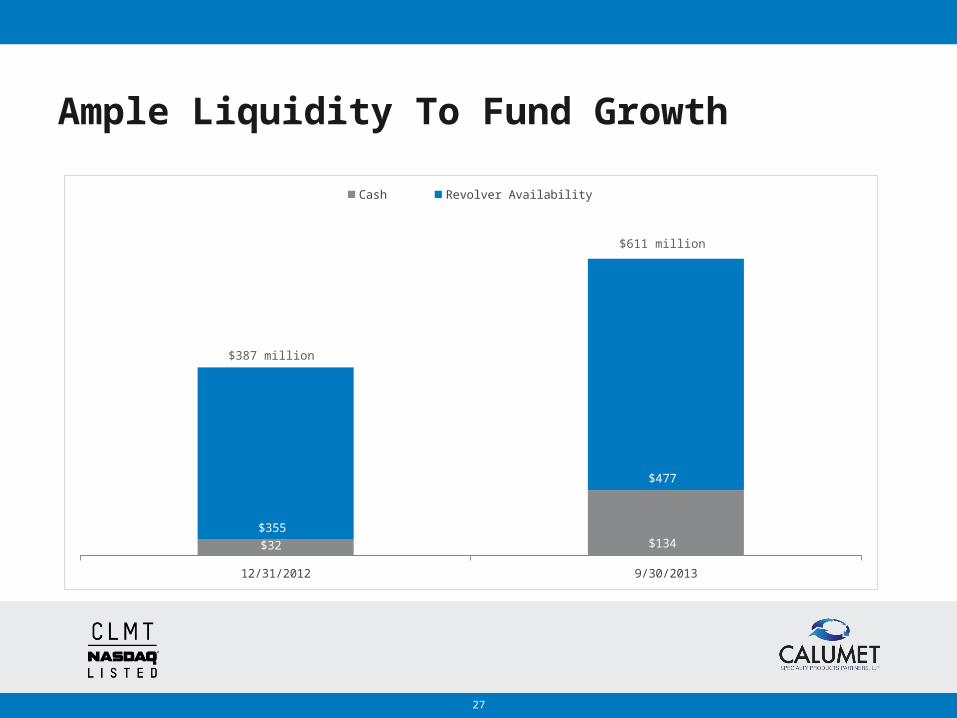
Ample Liquidity To Fund Growth
$387 million
$611 million
12/31/2012 9/30/2013
$32 $134 $355
$477
Cash Revolver Availability
28
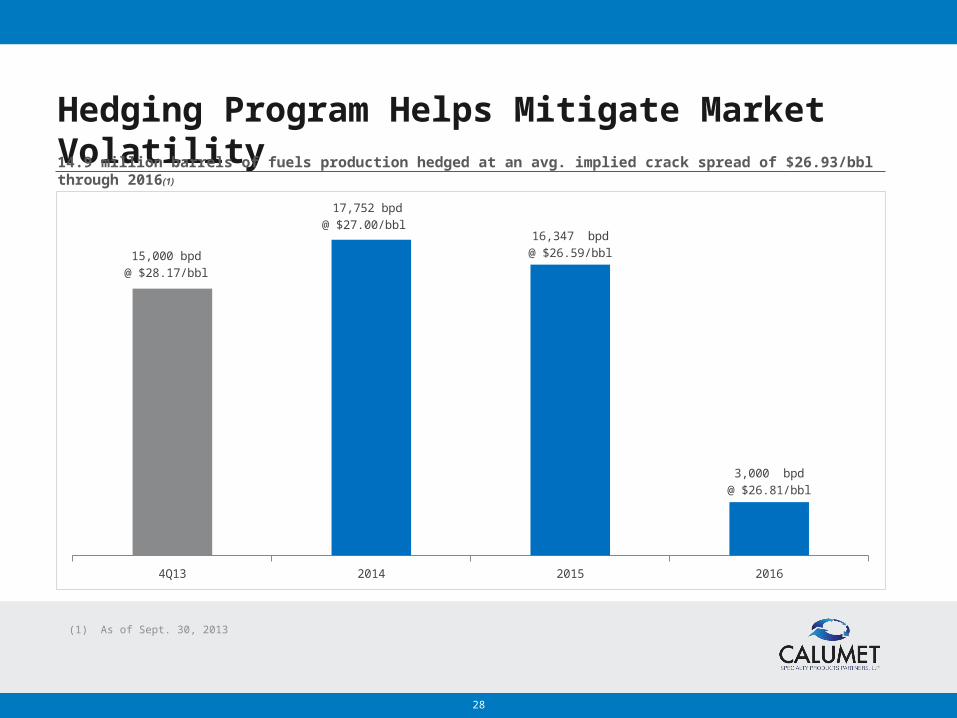
Hedging Program Helps Mitigate Market Volatility
(1) As of Sept. 30, 2013
4Q13 2014 2015 2016
15,000 bpd @ $28.17/bbl
17,752 bpd@ $27.00/bbl
16,347 bpd@ $26.59/bbl
3,000 bpd@ $26.81/bbl
14.9 million barrels of fuels production hedged at an avg. implied crack spread of $26.93/bbl through 2016 (1)
29
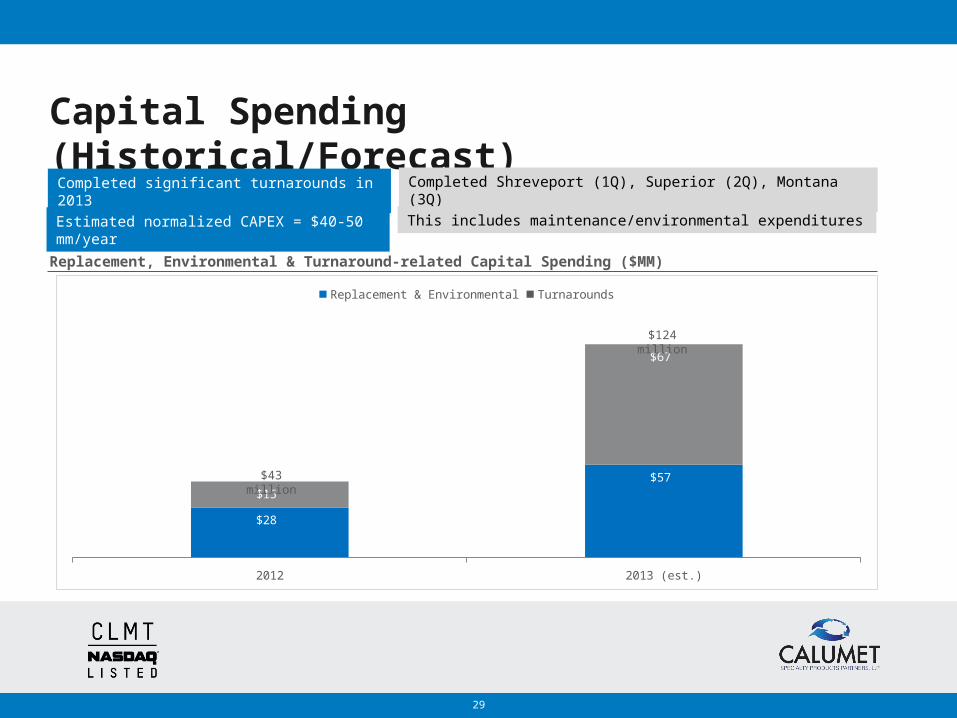
Capital Spending (Historical/Forecast)
Replacement, Environmental & Turnaround-related Capital Spending ($MM)
Completed significant turnarounds in 2013 Completed Shreveport (1Q), Superior (2Q), Montana (3Q)
Estimated normalized CAPEX = $40-50 mm/year This includes maintenance/environmental expenditures
2012 2013 (est.)
$28
$57
$15
$67
Replacement & Environmental Turnarounds
$43 million
$124 million
30
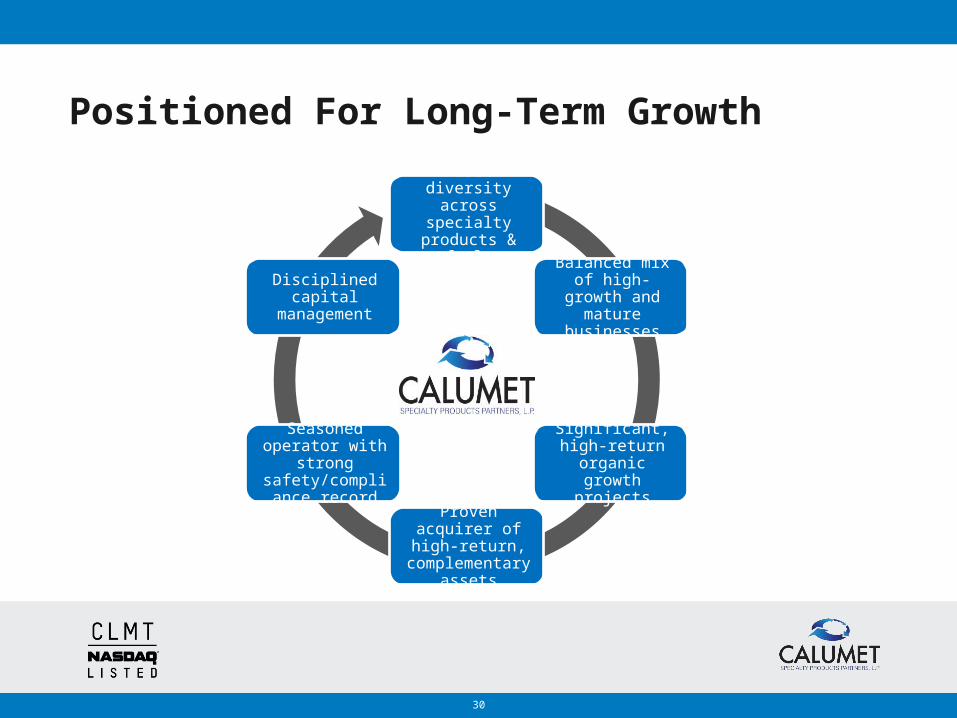
Positioned For Long-Term Growth
Asset diversity across specialty products & fuels
Balanced mix of high-growth and
mature businesses
Significant, high-return organic
growth projects
Proven acquirer of high-return,
complementary assets
Seasoned operator with strong
safety/compliance record
Disciplined capital management
31
Appendix
32
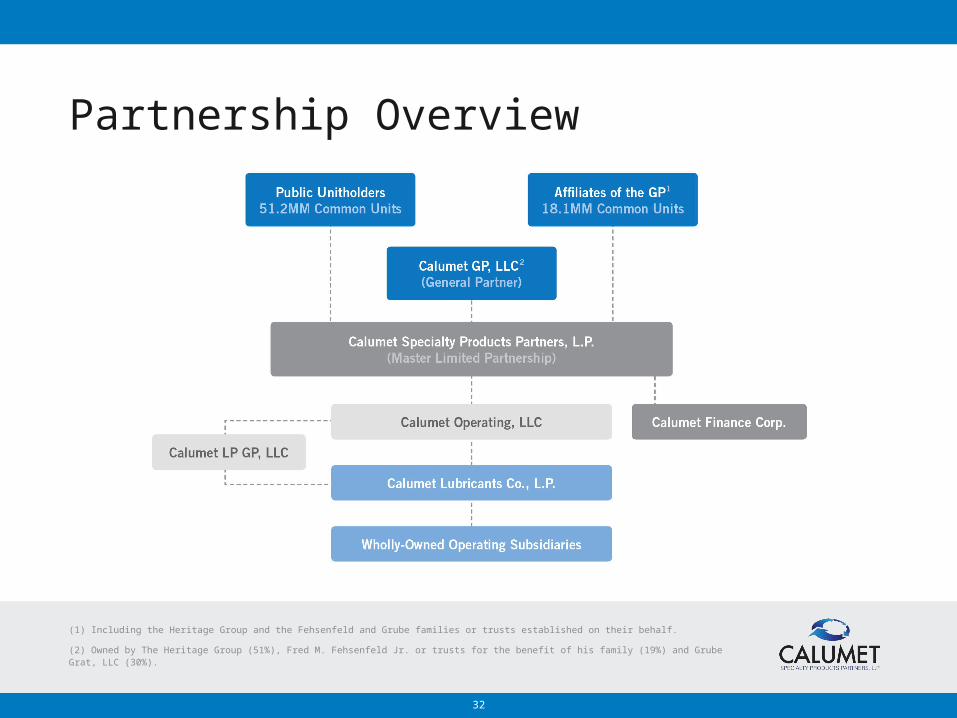
Partnership Overview
(1) Including the Heritage Group and the Fehsenfeld and Grube families or trusts established on their behalf.
(2) Owned by The Heritage Group (51%), Fred M. Fehsenfeld Jr. or trusts for the benefit of his family (19%) and Grube Grat, LLC (30%).
33
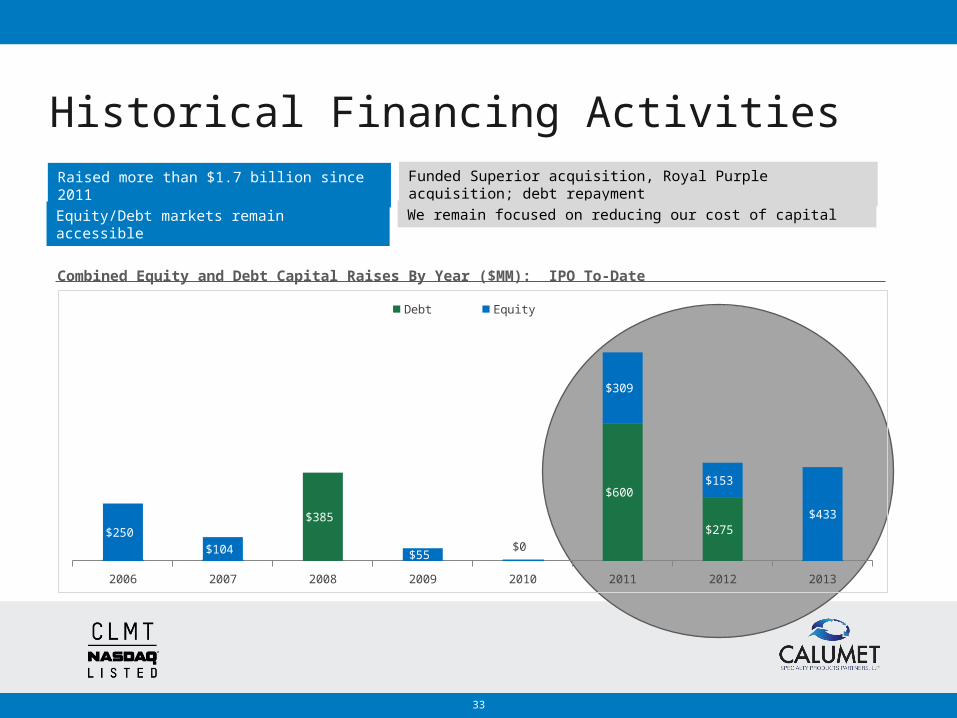
Historical Financing Activities
Combined Equity and Debt Capital Raises By Year ($MM): IPO To-Date
Raised more than $1.7 billion since 2011 Funded Superior acquisition, Royal Purple acquisition; debt repayment
Equity/Debt markets remain accessible We remain focused on reducing our cost of capital
2006 2007 2008 2009 2010 2011 2012 2013
$250
$104 $55 $0
$309
$153
$433$385
$600
$275
Debt Equity