Embed Size (px)
Citation preview

Barclays PLC – 2012 Interim Results
Barclays PLC
Results Announcement
30 June 2012
Barclays PLC – 2012 Interim Results
Table of Contents
Interim Results Announcement Page
Performance Highlights 2
Chairman‟s Statement 4
Group Finance Director‟s Review 5
Barclays Results by Quarter 8
Condensed Consolidated Financial Statements 9
Results by Business
Retail and Business Banking
– UK 14
– Europe 16
– Africa 18
– Barclaycard 20
Corporate and Investment Banking
– Investment Bank 22
– Corporate Banking 24
Wealth and Investment Management 28
Head Office and Other Operations 30
Business Results by Quarter 31
Performance Management
Returns and Equity 33
Margins and Balances 34
Risk Management 36
Funding Risk - Capital 37
Funding Risk - Liquidity 40
Credit Risk 45
Market Risk 70
Statement of Directors‟ Responsibilities 71
Independent Auditors‟ Review Report 72
Financial Statement Notes 73
Shareholder Information 91
Index 92
BARCLAYS PLC, 1 CHURCHILL PLACE, LONDON, E14 5HP, UNITED KINGDOM. TELEPHONE: +44 (0) 20 7116 1000. COMPANY NO. 48839
Barclays PLC – 2012 Interim Results
The term Barclays or Group refers to Barclays PLC together with its subsidiaries. Unless otherwise stated, the income statement analyses
compare the six months to 30 June 2012 to the corresponding six months of 2011 and balance sheet comparisons relate to the
corresponding position at 31 December 2011. The abbreviations „£m‟ and „£bn‟ represent millions and thousands of millions of pounds
Sterling respectively; the abbreviations „$m‟ and „$bn‟ represent millions and thousands of millions of US dollars respectively.
Adjusted profit before tax and adjusted performance metrics have been presented to provide a more consistent basis for comparing
business performance between periods. Adjusting items are considered to be significant and one-off in nature and hence not
representative of the underlying business performance. Items excluded from the adjusted measures are: the impact of own credit; gains on
debt buy-backs; impairment and disposal of the investment in BlackRock, Inc.; the provision for Payment Protection Insurance (PPI)
redress; the provision for interest rate hedging products redress; goodwill impairments; and gains and losses on acquisitions and disposals.
The regulatory penalties relating to the industry-wide investigation into the setting of interbank offered rates have not been excluded from
adjusted measures.
Relevant terms that are used in this document but are not defined under applicable regulatory guidance or International Financial
Reporting Standards (IFRS) are explained in the Results glossary that can be accessed at http://group.barclays.com/about-
barclays/investor-relations#institutional-investors.
In accordance with Barclays policy to provide meaningful disclosures that help investors and other stakeholders understand the financial
position, performance and changes in the financial position of the Group, and having regard to the BBA Disclosure Code, the information
provided in this report goes beyond minimum requirements. Barclays continues to develop its financial reporting considering best practice
and welcomes feedback from investors, regulators and other stakeholders on the disclosures that they would find most useful.
The information in this announcement, which was approved by the Board of Directors on 26 July 2012, does not comprise statutory
accounts within the meaning of Section 434 of the Companies Act 2006. Statutory accounts for the year ended 31 December 2011, which
included certain information required for the Joint Annual Report on Form 20-F of Barclays PLC and Barclays Bank PLC to the US Securities
and Exchange Commission (SEC) and which contained an unqualified audit report under Section 495 of the Companies Act 2006 and
which did not make any statements under Section 498 of the Companies Act 2006, have been delivered to the Registrar of Companies in
accordance with Section 441 of the Companies Act 2006.
These results will be furnished as a Form 6-K to the SEC as soon as practicable following their publication. Once filed with the SEC, copies
of the Form 6-K will also be available from the Barclays Investor Relations website www.barclays.com/investorrelations and from the SEC‟s
website (www.sec.gov).
Forward-looking statements
This document contains certain forward-looking statements within the meaning of Section 21E of the US Securities Exchange Act of 1934,
as amended, and Section 27A of the US Securities Act of 1933, as amended, with respect to certain of the Group‟s plans and its current
goals and expectations relating to its future financial condition and performance. Barclays cautions readers that no forward-looking
statement is a guarantee of future performance and that actual results could differ materially from those contained in the forward-looking
statements. These forward-looking statements can be identified by the fact that they do not relate only to historical or current facts.
Forward-looking statements sometimes use words such as “may”, “will”, “seek”, “continue”, “aim”, “anticipate”, “target”, “expect”,
“estimate”, “intend”, “plan”, “goal”, “believe” or other words of similar meaning. Examples of forward-looking statements include, among
others, statements regarding the Group‟s future financial position, income growth, assets, impairment charges, business strategy, capital
ratios, leverage, payment of dividends, projected levels of growth in the banking and financial markets, projected costs, estimates of capital
expenditures and plans and objectives for future operations and other statements that are not historical fact. By their nature, forward-
looking statements involve risk and uncertainty because they relate to future events and circumstances, including, but not limited to, UK
domestic, Eurozone and global economic and business conditions, the effects of continued volatility in credit markets, market related risks
such as changes in interest rates and exchange rates, effects of changes in valuation of credit market exposures, changes in valuation of
issued notes, the policies and actions of governmental and regulatory authorities (including requirements regarding capital and Group
structures and the potential for one or more countries exiting the Euro), changes in legislation, the further development of standards and
interpretations under IFRS applicable to past, current and future periods, evolving practices with regard to the interpretation and
application of standards under IFRS, the outcome of current and future litigation, the success of future acquisitions and other strategic
transactions and the impact of competition – a number of such factors being beyond the Group‟s control. As a result, the Group‟s actual
future results may differ materially from the plans, goals, and expectations set forth in the Group‟s forward-looking statements.
Any forward-looking statements made herein speak only as of the date they are made. Except as required by the UK Financial Services
Authority (FSA), the London Stock Exchange plc (LSE) or applicable law, Barclays expressly disclaims any obligation or undertaking to
release publicly any updates or revisions to any forward-looking statements contained in this announcement to reflect any change in
Barclays expectations with regard thereto or any change in events, conditions or circumstances on which any such statement is based. The
reader should, however, consult any additional disclosures that Barclays has made or may make in documents it has filed or may file with
the LSE and/or the SEC.
Performance Highlights
Barclays PLC – 2012 Interim Results 2
“We continue to deliver a good financial performance in the context of the current macroeconomic environment. Our
competitive position continues to grow and our financial strength is serving us well in this period of uncertainty and
volatility.
These remain challenging times for Barclays, as well as the industry, and we are sorry for what has happened because of
recent events. However our leadership continues to focus on the delivery of our financial performance targets and on
building a platform for sustainable long term growth. Our customers and clients are at the heart of what we do. I am
confident we can and will repair the reputational damage done to our business in their eyes and those of all our
stakeholders.”
Marcus Agius, Chairman
Adjusted profit before tax up 13% to £4,227m with improvements of 15% in Retail and Business Banking (RBB) and
11% in Corporate and Investment Banking, and 38% in Wealth and Investment Management, demonstrating the
benefits of the universal banking model
Statutory profit before tax down 71% to £759m, including an own credit charge of £2,945m
Adjusted return on average shareholders‟ equity increased to 9.9% (2011: 9.3%) with improvements in five of seven
businesses and Investment Bank achieved nearly 15% despite difficult market conditions
Adjusted income was up 1% at £15,475m despite macroeconomic challenges and the continuing low interest rate
environment
Income at Investment Bank improved 4% to £6,496m. Q2 12 income in Investment Bank was £3,032m, up 5% on Q2
11 and down 12% on Q1 12
Credit impairment charges were flat at £1,832m, reflecting improvements across many businesses, offset principally by
increased levels at Investment Bank where there was a net release of £111m in 2011
Operating expenses, excluding the first quarter £300m (2011: £1,000m) provision for PPI and second quarter £450m
(2011: nil) provision for interest rate hedging products redress, were down 3% to £9,491m. This reduction was
achieved after absorbing regulatory penalties of £290m relating to the industry-wide investigation into the setting of
interbank offered rates
During the first six months of 2012, sovereign exposures to Spain, Italy, Portugal, Ireland, Greece and Cyprus reduced
22% to £5.6bn. In order to mitigate redenomination risk, the Group continues to reduce local funding mismatches in
Spain and Portugal
Core Tier 1 ratio remained strong at 10.9% (31 December 2011: 11.0%), having absorbed the impact of the final
dividend for 2011, treasury share purchases and pension contributions. Risk weighted assets were stable at £390bn
The Group continues to access both secured and unsecured term funding markets and raised £20bn of term funding in
the first half of 2012 with £27bn of term maturities for full year 2012. Liquidity pool increased to £170bn (31 December
2011: £152bn) and the loan to deposit ratio continued to improve to 111% (2011: 118%)
Performance Highlights
Barclays PLC – 2012 Interim Results 3
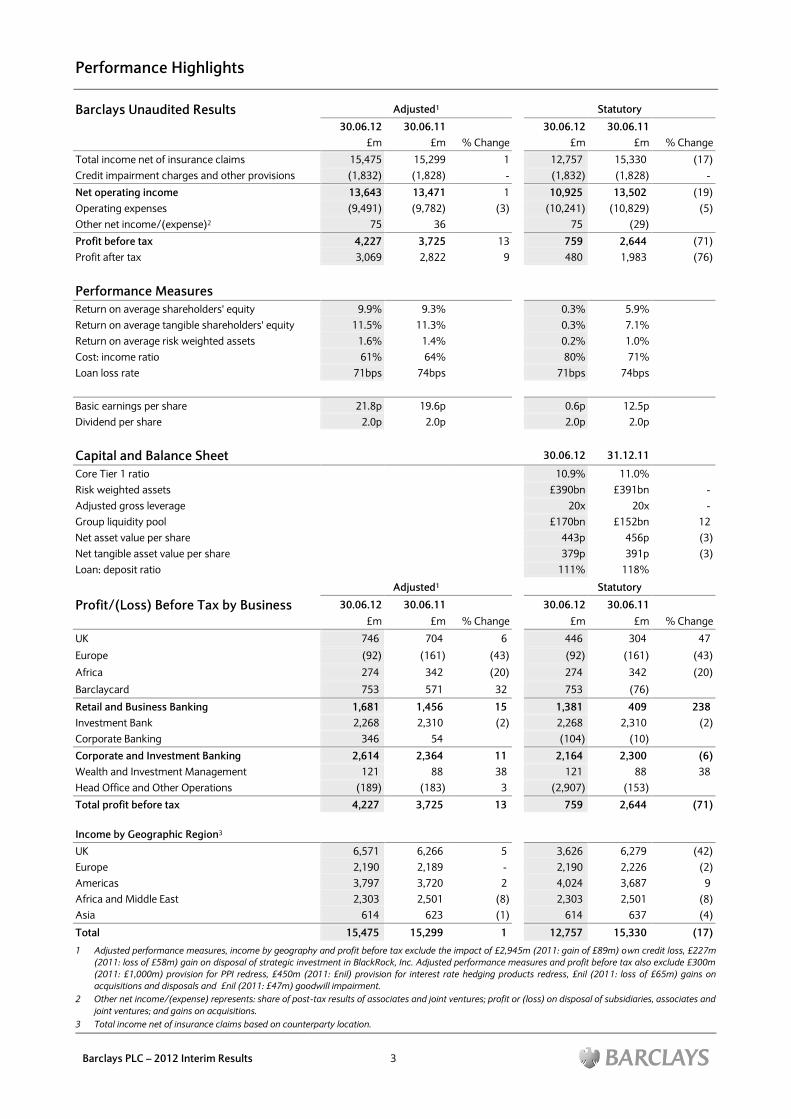
Barclays Unaudited Results Adjusted1 Statutory
30.06.12 30.06.11 30.06.12 30.06.11
£m £m % Change £m £m % Change
Total income net of insurance claims 15,475 15,299 1 12,757 15,330 (17)
Credit impairment charges and other provisions (1,832) (1,828) - (1,832) (1,828) -
Net operating income 13,643 13,471 1 10,925 13,502 (19)
Operating expenses (9,491) (9,782) (3) (10,241) (10,829) (5)
Other net income/(expense)2 75 36 75 (29)
Profit before tax 4,227 3,725 13 759 2,644 (71)
Profit after tax 3,069 2,822 9 480 1,983 (76)
Performance Measures
Return on average shareholders' equity 9.9% 9.3% 0.3% 5.9%
Return on average tangible shareholders' equity 11.5% 11.3% 0.3% 7.1%
Return on average risk weighted assets 1.6% 1.4% 0.2% 1.0%
Cost: income ratio 61% 64% 80% 71%
Loan loss rate 71bps 74bps 71bps 74bps
Basic earnings per share 21.8p 19.6p 0.6p 12.5p
Dividend per share 2.0p 2.0p 2.0p 2.0p
Capital and Balance Sheet 30.06.12 31.12.11
Core Tier 1 ratio 10.9% 11.0%
Risk weighted assets £390bn £391bn -
Adjusted gross leverage 20x 20x -
Group liquidity pool £170bn £152bn 12
Net asset value per share 443p 456p (3)
Net tangible asset value per share 379p 391p (3)
Loan: deposit ratio 111% 118%
Adjusted1 Statutory
Profit/(Loss) Before Tax by Business 30.06.12 30.06.11 30.06.12 30.06.11
£m £m % Change £m £m % Change
UK 746 704 6 446 304 47
Europe (92) (161) (43) (92) (161) (43)
Africa 274 342 (20) 274 342 (20)
Barclaycard 753 571 32 753 (76)
Retail and Business Banking 1,681 1,456 15 1,381 409 238
Investment Bank 2,268 2,310 (2) 2,268 2,310 (2)
Corporate Banking 346 54 (104) (10)
Corporate and Investment Banking 2,614 2,364 11 2,164 2,300 (6)
Wealth and Investment Management 121 88 38 121 88 38
Head Office and Other Operations (189) (183) 3 (2,907) (153)
Total profit before tax 4,227 3,725 13 759 2,644 (71)
Income by Geographic Region3
UK 6,571 6,266 5 3,626 6,279 (42)
Europe 2,190 2,189 - 2,190 2,226 (2)
Americas 3,797 3,720 2 4,024 3,687 9
Africa and Middle East 2,303 2,501 (8) 2,303 2,501 (8)
Asia 614 623 (1) 614 637 (4)
Total 15,475 15,299 1 12,757 15,330 (17)
1 Adjusted performance measures, income by geography and profit before tax exclude the impact of £2,945m (2011: gain of £89m) own credit loss, £227m
(2011: loss of £58m) gain on disposal of strategic investment in BlackRock, Inc. Adjusted performance measures and profit before tax also exclude £300m
(2011: £1,000m) provision for PPI redress, £450m (2011: £nil) provision for interest rate hedging products redress, £nil (2011: loss of £65m) gains on
acquisitions and disposals and £nil (2011: £47m) goodwill impairment.
2 Other net income/(expense) represents: share of post-tax results of associates and joint ventures; profit or (loss) on disposal of subsidiaries, associates and
joint ventures; and gains on acquisitions.
3 Total income net of insurance claims based on counterparty location.
Chairman’s Statement
Barclays PLC – 2012 Interim Results 4
We are pleased to report a good set of results to 30 June 2012, as they reflect our continued hard work in supporting our
customers and clients, delivering our financial objectives and managing risk. We continue to improve our market position
across many of our key products and segments and our financial strength is serving us well in today‟s challenging
environment. Our commitment to maintain Barclays position as a leading global universal bank, underpinned by a diverse
set of businesses, remains unchanged.
The recent events have been challenging for Barclays and all those who work for the Group. We continue to address the
operational and control issues raised in connection with our LIBOR settlement with the US and UK authorities, many of
which have been resolved over the course of the investigation. However, as a consequence of recent events, the Board of
Directors is now focused on identifying and recruiting a new Chief Executive as well as a Chairman of the Board. During this
interim period, my role as Chairman of the Executive Committee is to provide stability and continuity for our customers and
stakeholders. We have a mandate from the Board that goes beyond a simple caretaking role.
Barclays has proven itself as a strong business that delivers resilient performance. The solid divisional leadership and
customer focus of Antony Jenkins, Rich Ricci, Tom Kalaris and Maria Ramos continues. The depth of the Barclays
management team, our relentless focus on customers and clients, and our steady financial performance gives me
confidence in our ability to achieve continued growth in our businesses in difficult times. Our commitment to building a
strong franchise over time based on the prudent management of our resources and delivering 13% Return on Equity
remains unchanged.
Our Citizenship agenda is now more important than ever; we have ambitious commitments that we must deliver and
continue to evolve to address the issues that matter most to those we serve. We must focus on getting the fundamentals
right – serving our customers and clients with integrity and maintaining the highest standards of service – while reviewing
our business values and working to become more transparent. In this regard, the Board has asked Anthony Salz to lead an
independent, third party, review of business practices, engaging all Barclays stakeholders and with the intention of
publishing the review findings and recommendations. This global review will 1) assess the bank‟s current values, principles
and standard of operation; 2) test how well these are reflected in the bank‟s decision-making processes; 3) assess whether
or not the appropriate training, development, incentives, and disciplinary processes are in place; and 4) determine to what
extent each of these aspects need to change. We understand that we will be judged on our deeds and not our words.
The talent and hard work of our colleagues will play a vital role in achieving this. In the first half of 2012, they helped us
deliver £20.5bn in gross new lending to UK households and businesses. Recognising the importance of helping new
entrepreneurs, we launched an initiative to support up to 24,000 start-up businesses in the UK over the next three years. We
also raised over £450bn in financing for businesses and governments globally. In the UK, our apprenticeship scheme is
supporting young people into employment, we have already welcomed 120 new apprentices and are on track to recruit
over 450 by the end of the year. Around half of our colleagues are actively involved in community investment programmes
and, in the first half of 2012 alone, over 44,000 provided their time, skills and money to help disadvantaged people. This
resulted in 160,000 of volunteering hours in local communities and £12.3m raised for charity.
We are sorry for the issues that have emerged over recent weeks and recognise that we have disappointed our customers
and shareholders. I speak for all of Barclays people when I say how determined we are to regain the full confidence of all our
stakeholders; customers and clients, investors, regulators and staff alike.
Marcus Agius, Chairman
Group Finance Director’s Review
Barclays PLC – 2012 Interim Results 5
For the first six months of 2012 we reported a good performance as adjusted profits increased 13% year on year, despite
continuing difficult market conditions. Our Core Tier 1 ratio was robust at 10.9%, while funding and liquidity remained
strong.
Income Statement
Statutory profit before tax was £759m (2011: £2,644m), including an own credit charge of £2,945m (2011: gain of
£89m). Adjusted profit before tax increased 13% to £4,227m. Adjusted results provide a more consistent basis for
comparing business performance between periods
Adjusted return on average shareholders‟ equity increased to 9.9% (2011: 9.3%) with improvements in five of seven
businesses and Investment Bank achieved nearly 15%, an encouraging performance in difficult market conditions
Adjusted income increased 1% to £15,475m, despite continued low interest rates and continuing difficult
macroeconomic conditions
Customer net interest income from RBB, Corporate Banking and Wealth and Investment Management increased 2% to
£4.9bn. The net interest margin declined 8bps to 189bps, driven by a 7bps decrease in non-customer margin reflecting
reduced contributions from structural hedges. Average customer assets for these businesses increased 1% to £317.9bn
and average customer liabilities increased 4% to £277.4bn
Total income in Investment Bank increased 4% to £6,496m driven by improved performances in Rates and
Commodities, partially offset by declines in market volumes and lower corporate deal activity
Credit impairment charges were flat at £1,832m, reflecting improvements across many businesses, offset principally by
increased levels at the Investment Bank where there was a net release of £111m in 2011
Loans and advances balances were up 5% and the annualised loan loss rate reduced to 71bps (Full Year 2011:
77bps; Half Year 2011: 74bps). While delinquency trends improved in cards portfolios and UK unsecured lending
during 2012, home loans in Europe experienced some deterioration as a result of the adverse credit conditions.
South Africa home loans impairment increased reflecting focus on reducing the recoveries portfolio during the first
six months of 2012 which led to higher write offs. Credit metrics in the wholesale portfolios have remained generally
stable, however, the Investment Bank experienced higher charges primarily relating to ABS CDO Super Senior
positions and higher losses on single name exposures
The credit risk loans (CRL) coverage ratio increased slightly as CRL balances and impairment allowances fell 8% and
6%, respectively
Operating expenses, excluding the £300m (2011: £1,000m) provision for PPI and £450m (2011: nil) provision for
interest rate hedging products redress, were down 3% to £9,491m
Performance costs reduced by 14% to £1,422m despite a deferred bonus charge of £655m (2011: £458m).
Investment Bank performance costs reduced 19% to £1,028m, compared to a 2% decrease in profit before tax and
the compensation: income ratio reduced to 39% (2011: 45%)
Non-performance costs decreased by 1% to £8,069m after absorbing regulatory penalties of £290m in the
Investment Bank and Head Office and Other Operations relating to the industry-wide investigation into the setting of
interbank offered rates. Overall increases in regulatory and legal costs, continued business investment and the
impact of acquisitions in 2011, were more than offset by reductions in other non-performance costs, in line with the
Group‟s cost saving initiatives
The adjusted cost: income ratio decreased to 61% (2011: 64%). At the Investment Bank the cost: net operating income
ratio was flat at 64%
The effective tax rate on statutory profit before tax was 36.8% (H1 11: 25.0%), principally due to profits taxed in
countries with high local tax rates and non-deductible expenses. The increase in the tax rate compared to H1 11 reflects
the recognition in 2011 of previously unrecognised deferred tax assets in the US branch of Barclays Bank PLC. The
effective tax rate on adjusted profit before tax was 27.4% (H1 11: 24.2%)
Group Finance Director’s Review
Barclays PLC – 2012 Interim Results 6
Balance Sheet
Total assets increased to £1,631bn (2011: £1,564bn), reflecting increases across a number of asset categories, notably
a £19bn increase in cash and balances at central banks, a £23bn increase in loans and advances to customers (primarily
in relation to settlement balances) and a £21bn increase in reverse repurchase agreements. These were partially offset
by a £21bn reduction in derivative financial instrument assets
Total customer accounts increased 12% to £409bn primarily in relation to settlement balances
The Group‟s loan to deposit ratio continued to improve to 111% (2011: 118%)
Total shareholders‟ equity (including non-controlling interests) at 30 June 2012 was £63.7bn (2011: £65.2bn).
Excluding non-controlling interests, shareholders‟ equity decreased £1.4bn to £54.2bn, principally reflecting negative
reserve movements, notably the £1.0bn net purchase of treasury shares for deferred compensation awards, £0.5bn of
dividends paid and £0.5bn currency reserve movements, partially offset by profit after tax
Net asset value per share decreased 3% to 443p and the net tangible asset value per share decreased 3% to 379p
Adjusted gross leverage remained stable at 20x and moved within a month end range of 20x to 23x. Excluding the
liquidity pool, adjusted gross leverage remained flat at 17x
Capital Management
As at 30 June 2012, the Group‟s Core Tier 1 ratio was 10.9% (31 December 2011: 11.0%) after absorbing a 26bps
impact from pensions, principally reflecting the additional pension contributions made in April 2012 and deducting
future contributions expected over the next 5 years
The Group continued to generate Core Tier 1 capital from retained earnings (excluding own credit, which is added back
for regulatory capital purposes). Retained earnings of £2.3bn were more than offset by other movements in Core Tier 1
capital including pension movements, share purchases, dividends and currency reserve movements
Risk weighted assets remained stable at £390bn (2011: £391bn), principally reflecting increases in operational and
market risk, offset by reductions in counterparty risk and credit risk
In May 2012, the investment in BlackRock, Inc. was sold for net proceeds of £3.5bn, recognising a gain on sale of
£227m. This holding would have resulted in a negative Core Tier 1 capital impact under Basel 3
Funding and Liquidity
The liquidity pool as at 30 June 2012 was £170bn (31 December 2011: £152bn) which is towards the top of the month-end
range for the period of £152bn to £173bn (Full Year 2011: £140bn to £167bn). The liquidity pool is held unencumbered
and is not used to support payment or clearing requirements, which are treated as part of our regular business funding. It is
intended to offset stress outflows and comprises the following cash and unencumbered assets.
Cash and
Deposits with
Central Banks1
Government
Bonds2
Other Available
Liquidity Total3
£bn £bn £bn £bn
As at 30.06.12 124 32 14 170
As at 31.12.11 105 36 11 152
RBB, Corporate Banking and Wealth and Investment Management activities are largely funded by customer deposits
with the remainder covered by funding secured against customer loans and advances. As at 30 June 2012, the loan to
deposit ratio for these businesses was 106% (31 December 2011: 111%) and the loan to deposit and secured funding
ratio was 94% (31 December 2011: 101%)
The Investment Bank‟s activities are primarily funded through wholesale markets. As at 30 June 2012 total wholesale
funding outstanding (excluding repurchase agreements) was £263bn (31 December 2011: £265bn). £118bn of
wholesale funding matures in less than one year (31 December 2011: £130bn)
1 Of which over 95% (31 December 2011: over 95%) is placed with the Bank of England, US Federal Reserve, European Central Bank, Bank of Japan and
Swiss National Bank.
2 Of which over 70% (31 December 2011: over 80%) are comprised of UK, US, Japanese, French, German, Danish and Dutch securities.
3 £149bn (31 December 2011: £140bn) of which is FSA eligible.
Group Finance Director’s Review
Barclays PLC – 2012 Interim Results 7
Barclays continues to attract deposits in unsecured money markets and to raise additional secured and unsecured term
funding in a variety of markets. During H1 12, the Group raised £19.9bn of term funding, including £10.2bn of senior
unsecured and £9.7bn of secured term funding
The Group has £11bn of term funding maturing in the remainder of 2012 (31 December 2011: £27bn), and a further
£18bn maturing in 2013
The Group‟s liquidity pool and wholesale funds continue to be well diversified across major currencies
Exposures to Selected Eurozone Countries
During H1 12, sovereign exposures to Spain, Italy, Portugal, Ireland, Greece and Cyprus reduced by 22% to £5.6bn
Spanish and Portuguese sovereign exposures reduced 13% to £2.2bn and 27% to £0.6bn respectively due to the
disposal of available for sale government bonds held for the purpose of interest rate hedging and liquidity, that have
been replaced by interest rate swaps with alternative counterparties
Italian sovereign exposures decreased 27% to £2.6bn principally due to a redemption in government bonds held for
trading
Retail loans and advances in Spain, Italy and Portugal decreased 5% to £39.6bn, while lending to corporates decreased
13% to £10.0bn reflecting continued prudent risk management of portfolios. CRL coverage ratios in the retail and
wholesale portfolios for Spain, Italy and Portugal have remained broadly stable
During 2012, mitigating actions have been taken to reduce the local net funding mismatch including the drawdown of
€8.2bn in the European Central Bank's three year LTRO in Spain and Portugal and additional deposit taking in Spain. As
a result, the Group reduced the aggregate net local balance sheet funding mismatch from £12.1bn to £2.5bn in Spain
and from £6.9bn to £3.7bn in Portugal during the six months to 30 June 2012
Other Matters
In June 2012, Barclays reached settlement with the FSA and US authorities regarding investigations into submissions
made by Barclays and other panel members to the bodies that set various interbank offered rates. Barclays agreed to
pay total penalties of £290m
Following an increase in PPI claim volumes, the PPI provision was increased by £300m in the first quarter of 2012,
bringing the cumulative charge to £1,300m. Claims volumes remain unpredictable, although have recently been
trending downwards. As at 30 June 2012, £894m of the total £1,300m provision had been utilised
On 29 June 2012, the FSA announced that it had reached agreement with a number of UK banks (including Barclays) in
relation to a review and redress exercise to be carried out in respect of interest rate hedging products sold to small and
medium sized enterprises. A provision of £450m has been recognised based on initial estimates relating to the
appropriate implementation of the agreement, although the ultimate cost of this exercise is uncertain
Dividends
It is our policy to declare and pay dividends on a quarterly basis. We will pay a second interim cash dividend for 2012 of
1p per share on 7 September 2012
Outlook
Performance during July continues to be ahead of the prior year. Nevertheless, we continue to be cautious about the
environment in which we operate and will maintain the Group‟s strong capital, leverage and liquidity positions
Chris Lucas, Group Finance Director
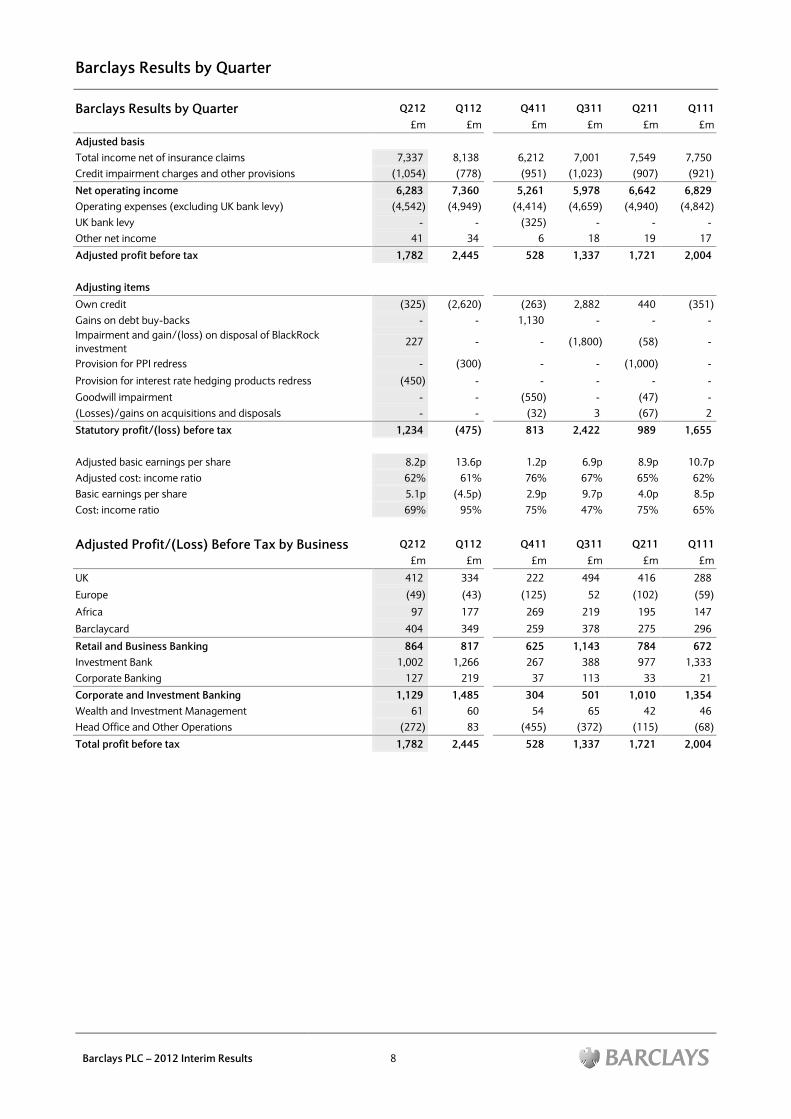
Barclays Results by Quarter
Barclays PLC – 2012 Interim Results 8
Barclays Results by Quarter
Q212 Q112 Q411 Q311 Q211 Q111
£m £m £m £m £m £m
Adjusted basis
Total income net of insurance claims 7,337 8,138 6,212 7,001 7,549 7,750
Credit impairment charges and other provisions (1,054) (778) (951) (1,023) (907) (921)
Net operating income 6,283 7,360 5,261 5,978 6,642 6,829
Operating expenses (excluding UK bank levy) (4,542) (4,949) (4,414) (4,659) (4,940) (4,842)
UK bank levy - - (325) - - -
Other net income 41 34 6 18 19 17
Adjusted profit before tax 1,782 2,445 528 1,337 1,721 2,004
Adjusting items
Own credit (325) (2,620) (263) 2,882 440 (351)
Gains on debt buy-backs - - 1,130 - - -
Impairment and gain/(loss) on disposal of BlackRock
investment 227 - - (1,800) (58) -
Provision for PPI redress - (300) - - (1,000) -
Provision for interest rate hedging products redress (450) - - - - -
Goodwill impairment - - (550) - (47) -
(Losses)/gains on acquisitions and disposals - - (32) 3 (67) 2
Statutory profit/(loss) before tax 1,234 (475) 813 2,422 989 1,655
Adjusted basic earnings per share 8.2p 13.6p 1.2p 6.9p 8.9p 10.7p
Adjusted cost: income ratio 62% 61% 76% 67% 65% 62%
Basic earnings per share 5.1p (4.5p) 2.9p 9.7p 4.0p 8.5p
Cost: income ratio 69% 95% 75% 47% 75% 65%
Adjusted Profit/(Loss) Before Tax by Business
Q212 Q112 Q411 Q311 Q211 Q111
£m £m £m £m £m £m
UK 412 334 222 494 416 288
Europe (49) (43) (125) 52 (102) (59)
Africa 97 177 269 219 195 147
Barclaycard 404 349 259 378 275 296
Retail and Business Banking 864 817 625 1,143 784 672
Investment Bank 1,002 1,266 267 388 977 1,333
Corporate Banking 127 219 37 113 33 21
Corporate and Investment Banking 1,129 1,485 304 501 1,010 1,354
Wealth and Investment Management 61 60 54 65 42 46
Head Office and Other Operations (272) 83 (455) (372) (115) (68)
Total profit before tax 1,782 2,445 528 1,337 1,721 2,004
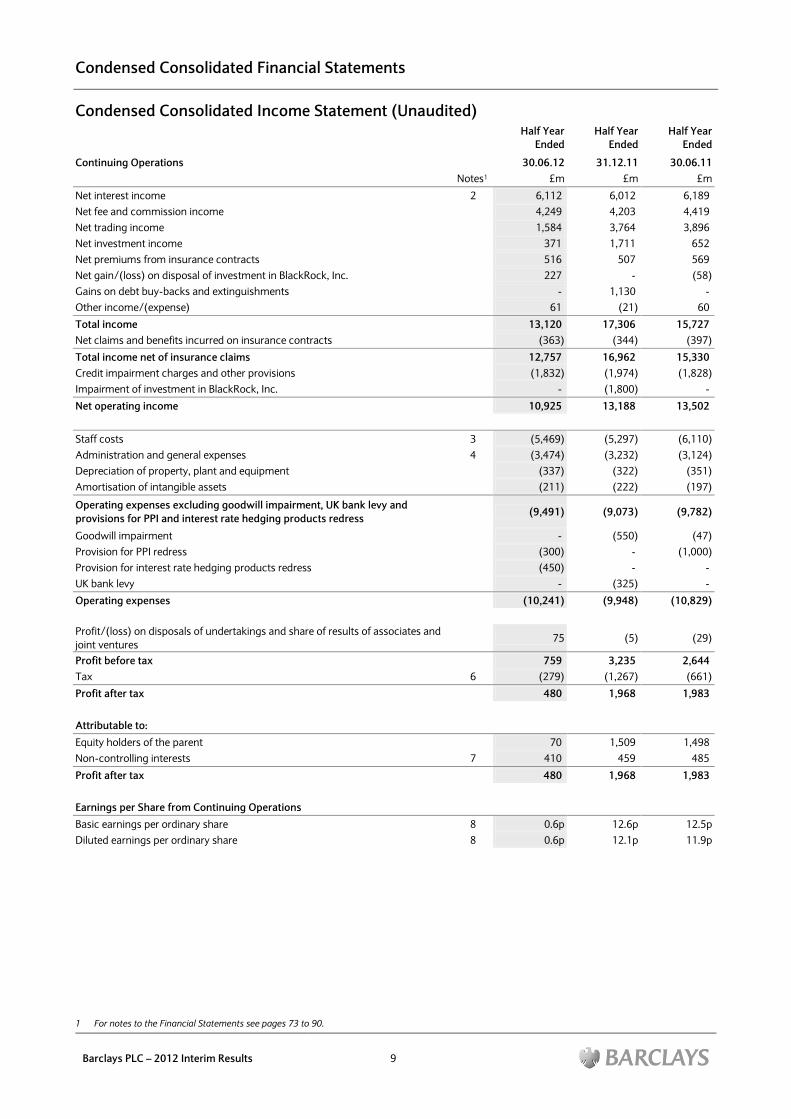
Condensed Consolidated Financial Statements
Barclays PLC – 2012 Interim Results 9
Condensed Consolidated Income Statement (Unaudited)
Half Year
Ended
Half Year
Ended
Half Year
Ended
Continuing Operations 30.06.12 31.12.11 30.06.11
Notes1 £m £m £m
Net interest income 2 6,112 6,012 6,189
Net fee and commission income 4,249 4,203 4,419
Net trading income 1,584 3,764 3,896
Net investment income 371 1,711 652
Net premiums from insurance contracts 516 507 569
Net gain/(loss) on disposal of investment in BlackRock, Inc. 227 - (58)
Gains on debt buy-backs and extinguishments - 1,130 -
Other income/(expense) 61 (21) 60
Total income 13,120 17,306 15,727
Net claims and benefits incurred on insurance contracts (363) (344) (397)
Total income net of insurance claims 12,757 16,962 15,330
Credit impairment charges and other provisions (1,832) (1,974) (1,828)
Impairment of investment in BlackRock, Inc. - (1,800) -
Net operating income 10,925 13,188 13,502
Staff costs 3 (5,469) (5,297) (6,110)
Administration and general expenses 4 (3,474) (3,232) (3,124)
Depreciation of property, plant and equipment (337) (322) (351)
Amortisation of intangible assets (211) (222) (197)
Operating expenses excluding goodwill impairment, UK bank levy and
provisions for PPI and interest rate hedging products redress (9,491) (9,073) (9,782)
Goodwill impairment - (550) (47)
Provision for PPI redress (300) - (1,000)
Provision for interest rate hedging products redress (450) - -
UK bank levy - (325) -
Operating expenses (10,241) (9,948) (10,829)
Profit/(loss) on disposals of undertakings and share of results of associates and
joint ventures 75 (5) (29)
Profit before tax 759 3,235 2,644
Tax 6 (279) (1,267) (661)
Profit after tax 480 1,968 1,983
Attributable to:
Equity holders of the parent 70 1,509 1,498
Non-controlling interests 7 410 459 485
Profit after tax 480 1,968 1,983
Earnings per Share from Continuing Operations
Basic earnings per ordinary share 8 0.6p 12.6p 12.5p
Diluted earnings per ordinary share 8 0.6p 12.1p 11.9p
1 For notes to the Financial Statements see pages 73 to 90.
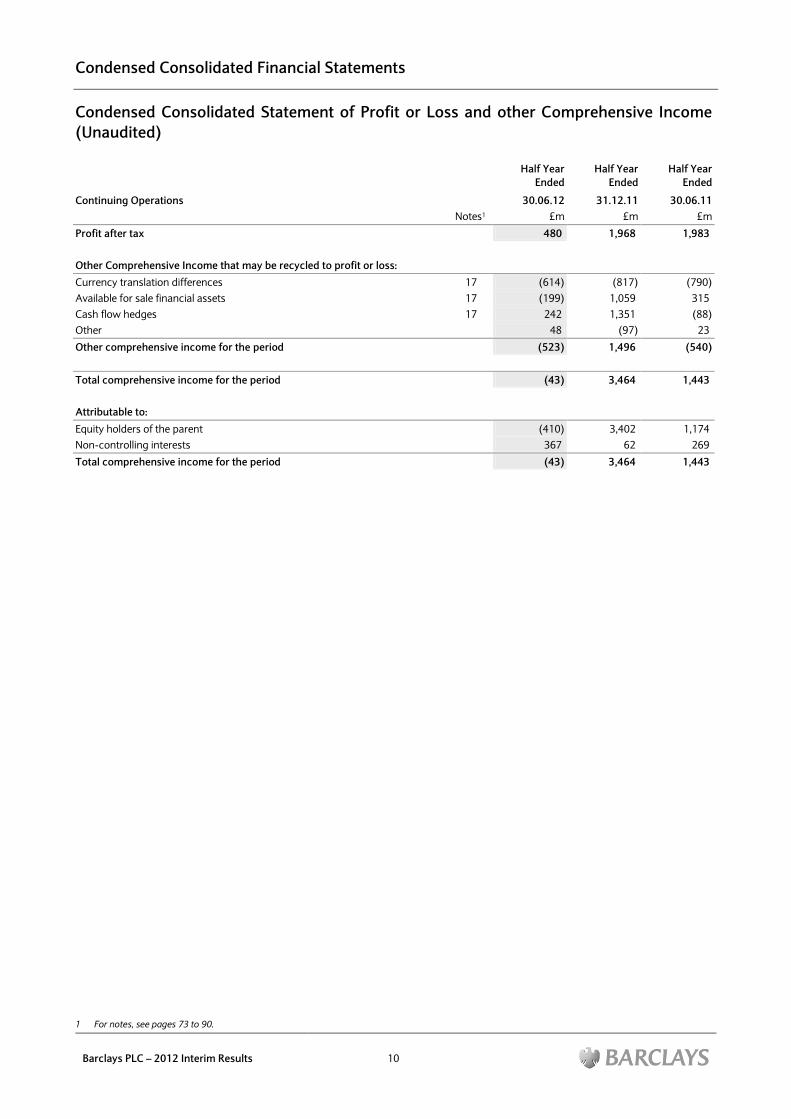
Condensed Consolidated Financial Statements
Barclays PLC – 2012 Interim Results 10
Condensed Consolidated Statement of Profit or Loss and other Comprehensive Income
(Unaudited)
Half Year
Ended
Half Year
Ended
Half Year
Ended
Continuing Operations 30.06.12 31.12.11 30.06.11
Notes1 £m £m £m
Profit after tax 480 1,968 1,983
Other Comprehensive Income that may be recycled to profit or loss:
Currency translation differences 17 (614) (817) (790)
Available for sale financial assets 17 (199) 1,059 315
Cash flow hedges 17 242 1,351 (88)
Other 48 (97) 23
Other comprehensive income for the period (523) 1,496 (540)
Total comprehensive income for the period (43) 3,464 1,443
Attributable to:
Equity holders of the parent (410) 3,402 1,174
Non-controlling interests 367 62 269
Total comprehensive income for the period (43) 3,464 1,443
1 For notes, see pages 73 to 90.
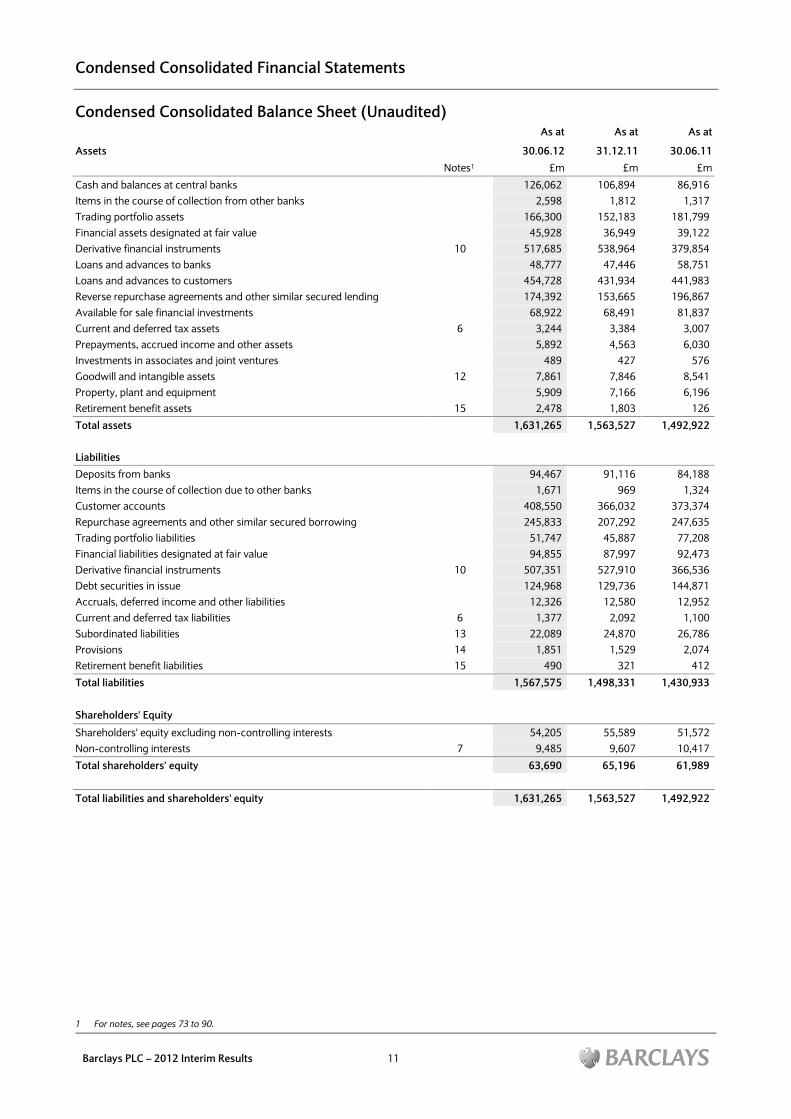
Condensed Consolidated Financial Statements
Barclays PLC – 2012 Interim Results 11
Condensed Consolidated Balance Sheet (Unaudited)
As at As at As at
Assets 30.06.12 31.12.11 30.06.11
Notes1 £m £m £m
Cash and balances at central banks 126,062 106,894 86,916
Items in the course of collection from other banks 2,598 1,812 1,317
Trading portfolio assets 166,300 152,183 181,799
Financial assets designated at fair value 45,928 36,949 39,122
Derivative financial instruments 10 517,685 538,964 379,854
Loans and advances to banks 48,777 47,446 58,751
Loans and advances to customers 454,728 431,934 441,983
Reverse repurchase agreements and other similar secured lending 174,392 153,665 196,867
Available for sale financial investments 68,922 68,491 81,837
Current and deferred tax assets 6 3,244 3,384 3,007
Prepayments, accrued income and other assets 5,892 4,563 6,030
Investments in associates and joint ventures 489 427 576
Goodwill and intangible assets 12 7,861 7,846 8,541
Property, plant and equipment 5,909 7,166 6,196
Retirement benefit assets 15 2,478 1,803 126
Total assets 1,631,265 1,563,527 1,492,922
Liabilities
Deposits from banks 94,467 91,116 84,188
Items in the course of collection due to other banks 1,671 969 1,324
Customer accounts 408,550 366,032 373,374
Repurchase agreements and other similar secured borrowing 245,833 207,292 247,635
Trading portfolio liabilities 51,747 45,887 77,208
Financial liabilities designated at fair value 94,855 87,997 92,473
Derivative financial instruments 10 507,351 527,910 366,536
Debt securities in issue 124,968 129,736 144,871
Accruals, deferred income and other liabilities 12,326 12,580 12,952
Current and deferred tax liabilities 6 1,377 2,092 1,100
Subordinated liabilities 13 22,089 24,870 26,786
Provisions 14 1,851 1,529 2,074
Retirement benefit liabilities 15 490 321 412
Total liabilities 1,567,575 1,498,331 1,430,933
Shareholders' Equity
Shareholders' equity excluding non-controlling interests 54,205 55,589 51,572
Non-controlling interests 7 9,485 9,607 10,417
Total shareholders' equity 63,690 65,196 61,989
Total liabilities and shareholders' equity 1,631,265 1,563,527 1,492,922
1 For notes, see pages 73 to 90.
Condensed Consolidated Financial Statements
Barclays PLC – 2012 Interim Results 12
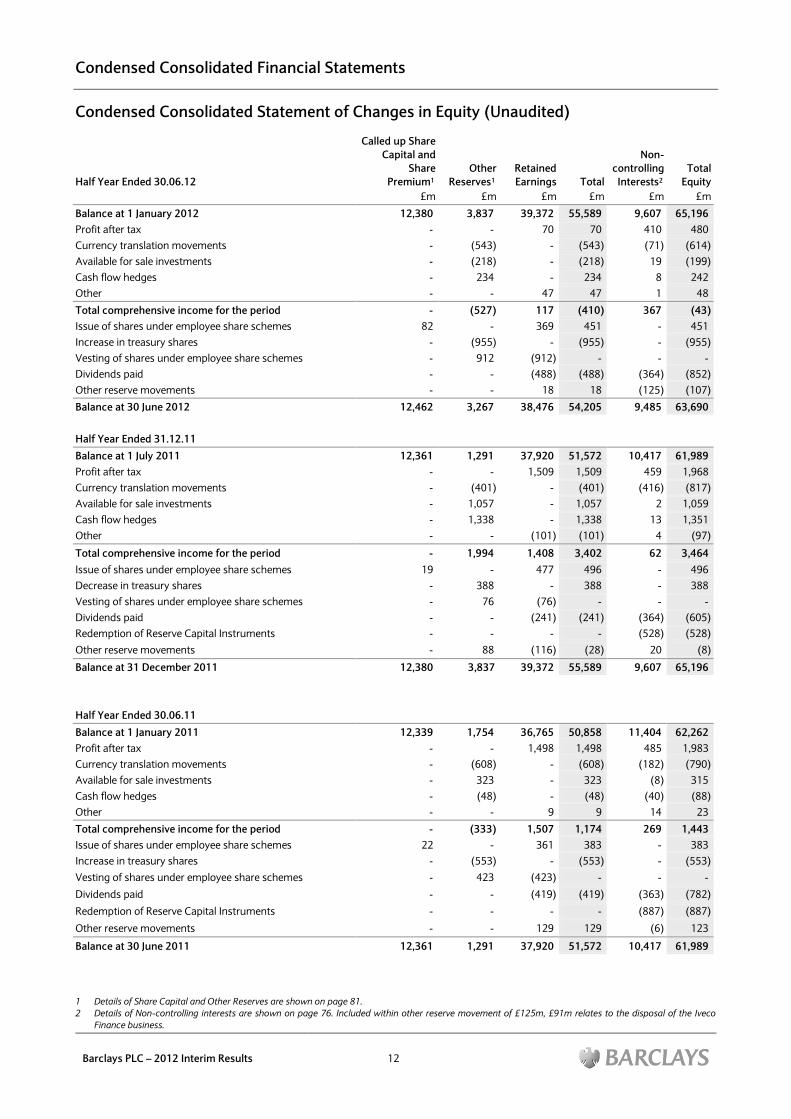
Condensed Consolidated Statement of Changes in Equity (Unaudited)
Half Year Ended 30.06.12
Called up Share
Capital and
Share
Premium1
Other
Reserves1
Retained
Earnings Total
Non-
controlling
Interests2
Total
Equity
£m £m £m £m £m £m
Balance at 1 January 2012 12,380 3,837 39,372 55,589 9,607 65,196
Profit after tax - - 70 70 410 480
Currency translation movements - (543) - (543) (71) (614)
Available for sale investments - (218) - (218) 19 (199)
Cash flow hedges - 234 - 234 8 242
Other - - 47 47 1 48
Total comprehensive income for the period - (527) 117 (410) 367 (43)
Issue of shares under employee share schemes 82 - 369 451 - 451
Increase in treasury shares - (955) - (955) - (955)
Vesting of shares under employee share schemes - 912 (912) - - -
Dividends paid - - (488) (488) (364) (852)
Other reserve movements - - 18 18 (125) (107)
Balance at 30 June 2012 12,462 3,267 38,476 54,205 9,485 63,690
Half Year Ended 31.12.11
Balance at 1 July 2011 12,361 1,291 37,920 51,572 10,417 61,989
Profit after tax - - 1,509 1,509 459 1,968
Currency translation movements - (401) - (401) (416) (817)
Available for sale investments - 1,057 - 1,057 2 1,059
Cash flow hedges - 1,338 - 1,338 13 1,351
Other - - (101) (101) 4 (97)
Total comprehensive income for the period - 1,994 1,408 3,402 62 3,464
Issue of shares under employee share schemes 19 - 477 496 - 496
Decrease in treasury shares - 388 - 388 - 388
Vesting of shares under employee share schemes - 76 (76) - - -
Dividends paid - - (241) (241) (364) (605)
Redemption of Reserve Capital Instruments - - - - (528) (528)
Other reserve movements - 88 (116) (28) 20 (8)
Balance at 31 December 2011 12,380 3,837 39,372 55,589 9,607 65,196
Half Year Ended 30.06.11
Balance at 1 January 2011 12,339 1,754 36,765 50,858 11,404 62,262
Profit after tax - - 1,498 1,498 485 1,983
Currency translation movements - (608) - (608) (182) (790)
Available for sale investments - 323 - 323 (8) 315
Cash flow hedges - (48) - (48) (40) (88)
Other - - 9 9 14 23
Total comprehensive income for the period - (333) 1,507 1,174 269 1,443
Issue of shares under employee share schemes 22 - 361 383 - 383
Increase in treasury shares - (553) - (553) - (553)
Vesting of shares under employee share schemes - 423 (423) - - -
Dividends paid - - (419) (419) (363) (782)
Redemption of Reserve Capital Instruments - - - - (887) (887)
Other reserve movements - - 129 129 (6) 123
Balance at 30 June 2011 12,361 1,291 37,920 51,572 10,417 61,989
1 Details of Share Capital and Other Reserves are shown on page 81.
2 Details of Non-controlling interests are shown on page 76. Included within other reserve movement of £125m, £91m relates to the disposal of the Iveco
Finance business.
Condensed Consolidated Financial Statements
Barclays PLC – 2012 Interim Results 13
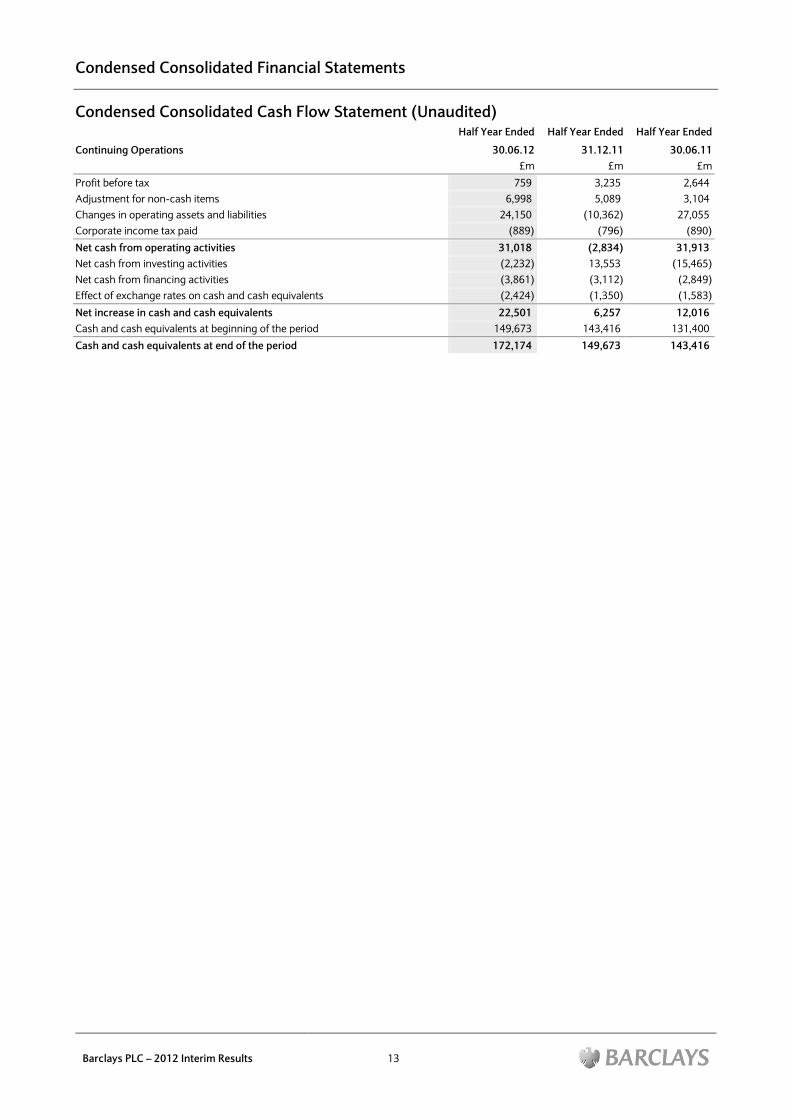
Condensed Consolidated Cash Flow Statement (Unaudited)
Half Year Ended Half Year Ended Half Year Ended
Continuing Operations 30.06.12 31.12.11 30.06.11
£m £m £m
Profit before tax 759 3,235 2,644
Adjustment for non-cash items 6,998 5,089 3,104
Changes in operating assets and liabilities 24,150 (10,362) 27,055
Corporate income tax paid (889) (796) (890)
Net cash from operating activities 31,018 (2,834) 31,913
Net cash from investing activities (2,232) 13,553 (15,465)
Net cash from financing activities (3,861) (3,112) (2,849)
Effect of exchange rates on cash and cash equivalents (2,424) (1,350) (1,583)
Net increase in cash and cash equivalents 22,501 6,257 12,016
Cash and cash equivalents at beginning of the period 149,673 143,416 131,400
Cash and cash equivalents at end of the period 172,174 149,673 143,416
Results by Business
Barclays PLC – 2012 Interim Results 14
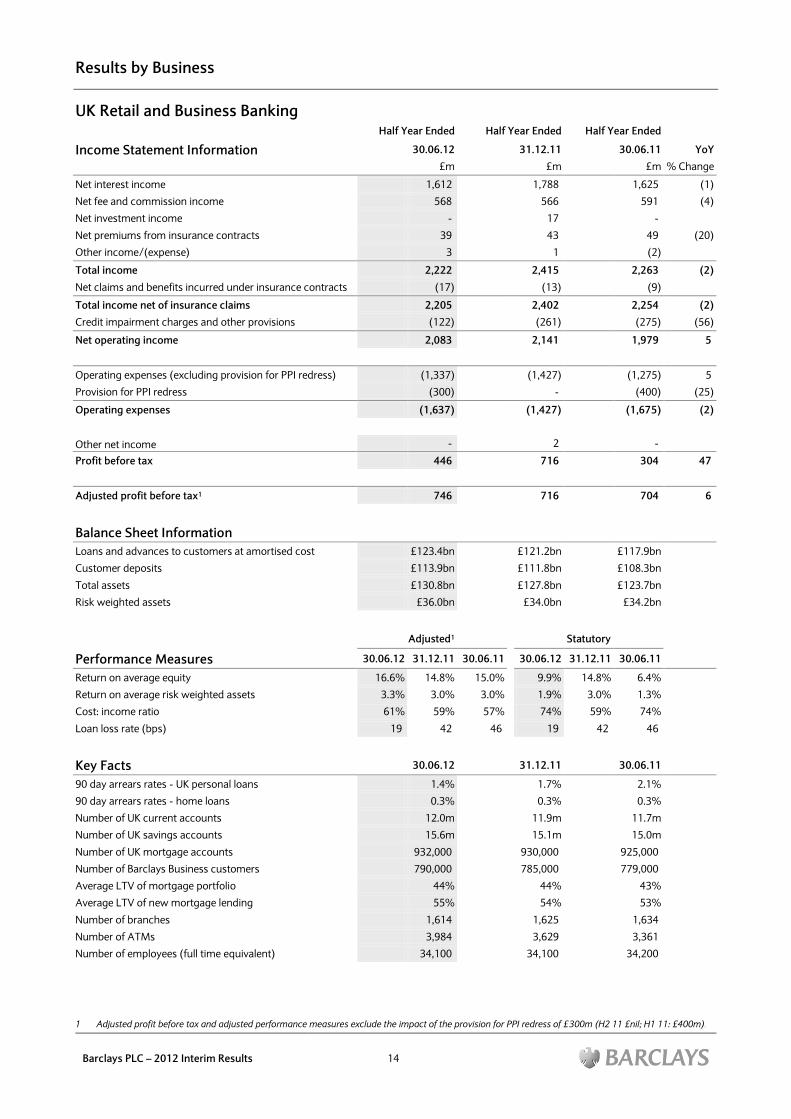
UK Retail and Business Banking
Half Year Ended Half Year Ended Half Year Ended
Income Statement Information 30.06.12 31.12.11 30.06.11 YoY
£m £m £m % Change
Net interest income 1,612 1,788 1,625 (1)
Net fee and commission income 568 566 591 (4)
Net investment income - 17 -
Net premiums from insurance contracts 39 43 49 (20)
Other income/(expense) 3 1 (2)
Total income 2,222 2,415 2,263 (2)
Net claims and benefits incurred under insurance contracts (17) (13) (9)
Total income net of insurance claims 2,205 2,402 2,254 (2)
Credit impairment charges and other provisions (122) (261) (275) (56)
Net operating income 2,083 2,141 1,979 5
Operating expenses (excluding provision for PPI redress) (1,337) (1,427) (1,275) 5
Provision for PPI redress (300) - (400) (25)
Operating expenses (1,637) (1,427) (1,675) (2)
Other net income - 2 -
Profit before tax 446 716 304 47
Adjusted profit before tax1 746 716 704 6
Balance Sheet Information
Loans and advances to customers at amortised cost £123.4bn £121.2bn £117.9bn
Customer deposits £113.9bn £111.8bn £108.3bn
Total assets £130.8bn £127.8bn £123.7bn
Risk weighted assets £36.0bn £34.0bn £34.2bn
Adjusted1 Statutory
Performance Measures 30.06.12 31.12.11 30.06.11 30.06.12 31.12.11 30.06.11
Return on average equity 16.6% 14.8% 15.0% 9.9% 14.8% 6.4%
Return on average risk weighted assets 3.3% 3.0% 3.0% 1.9% 3.0% 1.3%
Cost: income ratio 61% 59% 57% 74% 59% 74%
Loan loss rate (bps) 19 42 46 19 42 46
Key Facts 30.06.12 31.12.11 30.06.11
90 day arrears rates - UK personal loans 1.4% 1.7% 2.1%
90 day arrears rates - home loans 0.3% 0.3% 0.3%
Number of UK current accounts 12.0m 11.9m 11.7m
Number of UK savings accounts 15.6m 15.1m 15.0m
Number of UK mortgage accounts 932,000 930,000 925,000
Number of Barclays Business customers 790,000 785,000 779,000
Average LTV of mortgage portfolio 44% 44% 43%
Average LTV of new mortgage lending 55% 54% 53%
Number of branches 1,614 1,625 1,634
Number of ATMs 3,984 3,629 3,361
Number of employees (full time equivalent) 34,100 34,100 34,200
1 Adjusted profit before tax and adjusted performance measures exclude the impact of the provision for PPI redress of £300m (H2 11 £nil; H1 11: £400m).
Results by Business
Barclays PLC – 2012 Interim Results 15
UK Retail and Business Banking
Income Statement – H1 12 compared to H1 11
Adjusted profit before tax improved 6% to £746m. Profit before tax improved 47% to £446m after £300m (2011:
£400m) provision for PPI redress
Solid new mortgage lending and deposit inflows as reflected in balance sheet growth
Continued reduction in impairment in personal unsecured lending
Income declined 2% to £2,205m driven by lower net fees and commissions
Net interest income declined 1% to £1,612m with net interest margin down 7bps to 139bps including reduced
contributions from structural hedges
Customer asset margin decreased 17bps to 108bps reflecting higher funding rates
Average customer assets increased 5% to £122.3bn driven by 6% growth in average mortgage balances
Customer liability margin increased 14bps to 97bps reflecting an increase in funding rates and therefore the value
generated from customer liabilities
Average customer liabilities increased 3% to £110.5bn due to savings deposit growth
Net fee and commission income down 4% to £568m following closure of the branch-based element of the financial
planning business in Q1 2011 and lower overdraft fees
Credit impairment charges decreased 56% to £122m with annualised loan loss rate of 19bps (2011: 46bps)
Personal unsecured lending impairment improved 62% to £61m with 90 day arrears rates on UK personal loans
improving 70bps to 1.4%
Operating expenses decreased 2% to £1,637m. Excluding the provision for PPI redress of £300m (2011: £400m),
operating expenses increased 5% including higher PPI related operating costs
Adjusted return on average equity improved to 16.6% (2011: 15.0%). Return on average equity improved to 9.9%
(2011: 6.4%)
Income Statement – Q2 12 compared to Q1 12
Adjusted profit before tax improved 23% to £412m, reflecting a 5% increase in income and a 39% reduction in
impairment charges due to a non-recurring provision release. Profit before tax improved £378m to £412m, reflecting
the PPI redress provision of £300m recognised in Q1 12
Balance Sheet – 30 June 2012 compared to 31 December 2011
Total loans and advances to customers increased 2% to £123.4bn driven by growth in mortgage balances
Mortgage balances of £110.0bn at 30 June 2012 (31 December 2011: £107.8bn). Gross new mortgage lending of
£7.8bn (30 June 2011: £7.6bn) and mortgage redemptions of £5.6bn (30 June 2011: £4.9bn), resulted in net new
mortgage lending of £2.2bn (30 June 2011: £2.7bn)
Average Loan to Value (LTV) ratio on the mortgage portfolio (including buy to let) on a current valuation basis was
44% (31 December 2011: 44%). Average LTV of new mortgage lending was 55% (31 December 2011: 54%)
Total customer deposits increased 2% to £113.9bn primarily driven by growth in savings from ISAs and bonds
Risk weighted assets increased 6% to £36.0bn as a result of methodology changes and an increase in mortgage
balances
Results by Business
Barclays PLC – 2012 Interim Results 16
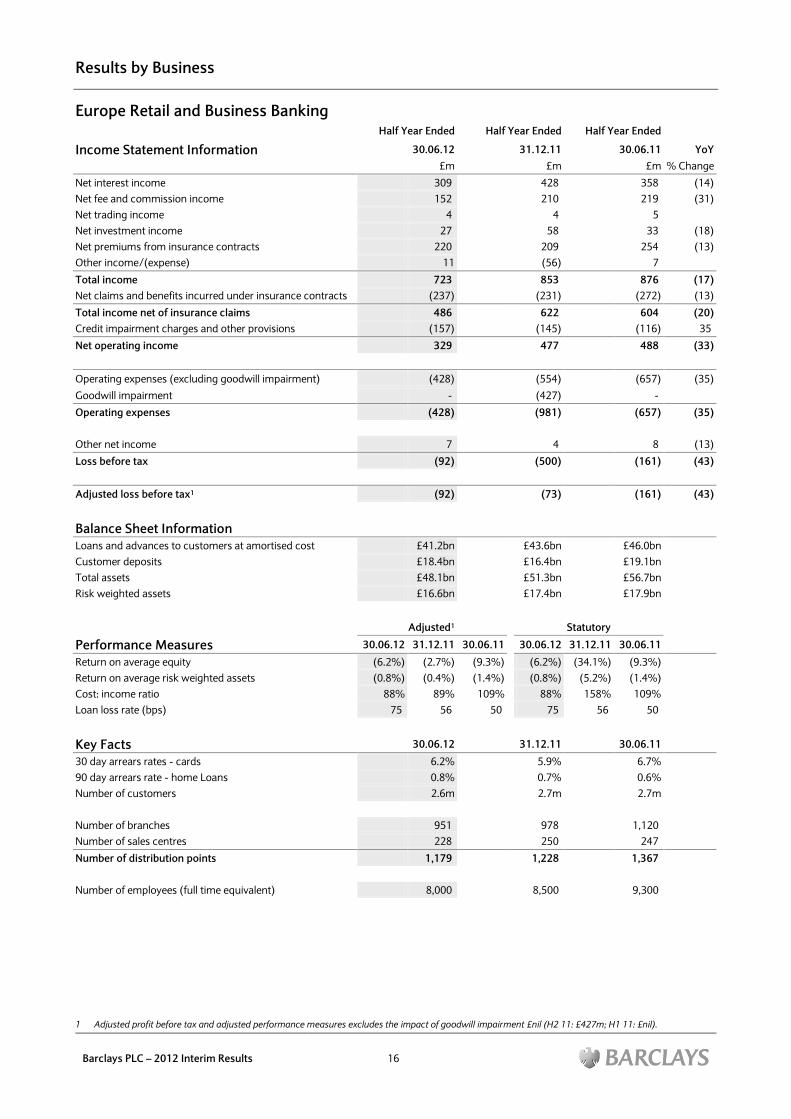
Europe Retail and Business Banking
Half Year Ended Half Year Ended Half Year Ended
Income Statement Information 30.06.12 31.12.11 30.06.11 YoY
£m £m £m % Change
Net interest income 309 428 358 (14)
Net fee and commission income 152 210 219 (31)
Net trading income 4 4 5
Net investment income 27 58 33 (18)
Net premiums from insurance contracts 220 209 254 (13)
Other income/(expense) 11 (56) 7
Total income 723 853 876 (17)
Net claims and benefits incurred under insurance contracts (237) (231) (272) (13)
Total income net of insurance claims 486 622 604 (20)
Credit impairment charges and other provisions (157) (145) (116) 35
Net operating income 329 477 488 (33)
Operating expenses (excluding goodwill impairment) (428) (554) (657) (35)
Goodwill impairment - (427) -
Operating expenses (428) (981) (657) (35)
Other net income 7 4 8 (13)
Loss before tax (92) (500) (161) (43)
Adjusted loss before tax1 (92) (73) (161) (43)
Balance Sheet Information
Loans and advances to customers at amortised cost £41.2bn £43.6bn £46.0bn
Customer deposits £18.4bn £16.4bn £19.1bn
Total assets £48.1bn £51.3bn £56.7bn
Risk weighted assets £16.6bn £17.4bn £17.9bn
Adjusted1 Statutory
Performance Measures 30.06.12 31.12.11 30.06.11 30.06.12 31.12.11 30.06.11
Return on average equity (6.2%) (2.7%) (9.3%) (6.2%) (34.1%) (9.3%)
Return on average risk weighted assets (0.8%) (0.4%) (1.4%) (0.8%) (5.2%) (1.4%)
Cost: income ratio 88% 89% 109% 88% 158% 109%
Loan loss rate (bps) 75 56 50 75 56 50
Key Facts 30.06.12 31.12.11 30.06.11
30 day arrears rates - cards 6.2% 5.9% 6.7%
90 day arrears rate - home Loans 0.8% 0.7% 0.6%
Number of customers 2.6m 2.7m 2.7m
Number of branches 951 978 1,120
Number of sales centres 228 250 247
Number of distribution points 1,179 1,228 1,367
Number of employees (full time equivalent) 8,000 8,500 9,300
1 Adjusted profit before tax and adjusted performance measures excludes the impact of goodwill impairment £nil (H2 11: £427m; H1 11: £nil).
Results by Business
Barclays PLC – 2012 Interim Results 17
Europe Retail and Business Banking
Income Statement – H1 12 compared to H1 11
Loss before tax improved to £92m (2011: £161m) reflecting on-going strategic actions to reposition the business
Lower costs following restructuring charges in 2011 and subsequent cost savings
Reduction in funding mismatch driven by the active management of retail assets, particularly in Spain
Income declined 20% to £486m reflecting the challenging economic environment across Europe
Net interest income declined 14% to £309m reflecting lower asset and liability balances, partially offset by higher
liability margins
Customer asset margin decreased 14bps to 80bps with net interest margin down to 108bps (2011: 118bps), driven
by higher funding rates
Average customer assets decreased 3% to £42.0bn driven by active management to reduce funding mismatch
Customer liability margin increased 6bps to 47bps mainly due to re-pricing initiatives
Average customer liabilities decreased 14% to £15.5bn reflecting competitive pressures
Net fee and commission income declined 31% to £152m, reflecting lower income from Italy mortgage sales and lower
sales of investment products
Net premiums from insurance contracts declined 13% to £220m, with a corresponding 13% decline in net claims and
benefits to £237m
Credit impairment charges increased 35% to £157m reflecting deterioration in credit performance in Spain and Portugal
as economic conditions continued to worsen
Loan loss rate increased to 75bps (2011: 50bps)
90 day arrears rate for home loans deteriorated to 80bps (30 June 2011: 60bps)
Operating expenses decreased 35% to £428m, reflecting restructuring charges of £129m in 2011 and subsequent cost
savings
Return on average equity improved to negative 6.2% (2011: negative 9.3%) reflecting the improved loss before tax
Income Statement – Q2 12 compared to Q1 12
Loss before tax of £49m (Q1 12: £43m) reflecting worsening delinquency trends on Spanish and Italian mortgages
Balance Sheet – 30 June 2012 compared to 31 December 2011
Loans and advances to customers decreased 6% to £41.2bn reflecting currency movements and strategy to reduce the
net funding mismatch. This change has driven a 6% reduction in total assets to £48.1bn
Customer deposits increased 12% to £18.4bn, reflecting active management to improve liquidity and reduce the
funding mismatch
Risk weighted assets decreased 5% to £16.6bn reflecting reduced loans and advances to customers
Results by Business
Barclays PLC – 2012 Interim Results 18
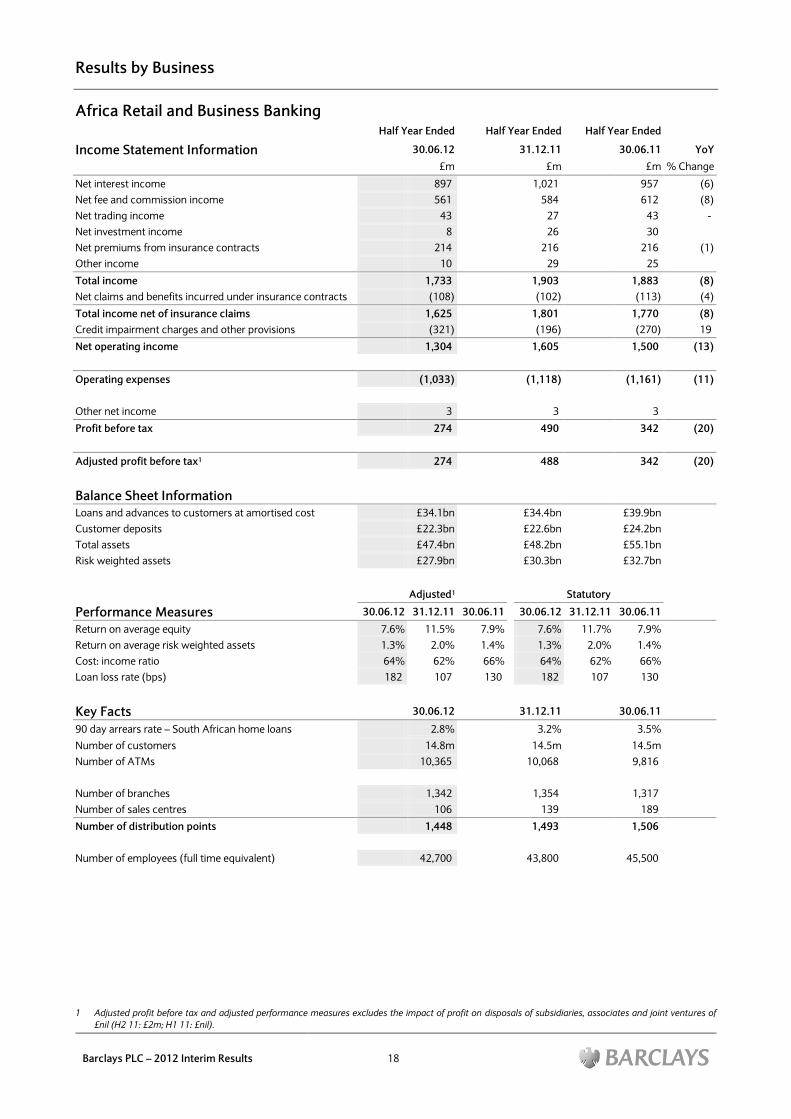
Africa Retail and Business Banking
Half Year Ended Half Year Ended Half Year Ended
Income Statement Information 30.06.12 31.12.11 30.06.11 YoY
£m £m £m % Change
Net interest income 897 1,021 957 (6)
Net fee and commission income 561 584 612 (8)
Net trading income 43 27 43 -
Net investment income 8 26 30
Net premiums from insurance contracts 214 216 216 (1)
Other income 10 29 25
Total income 1,733 1,903 1,883 (8)
Net claims and benefits incurred under insurance contracts (108) (102) (113) (4)
Total income net of insurance claims 1,625 1,801 1,770 (8)
Credit impairment charges and other provisions (321) (196) (270) 19
Net operating income 1,304 1,605 1,500 (13)
Operating expenses (1,033) (1,118) (1,161) (11)
Other net income 3 3 3
Profit before tax 274 490 342 (20)
Adjusted profit before tax1 274 488 342 (20)
Balance Sheet Information
Loans and advances to customers at amortised cost £34.1bn £34.4bn £39.9bn
Customer deposits £22.3bn £22.6bn £24.2bn
Total assets £47.4bn £48.2bn £55.1bn
Risk weighted assets £27.9bn £30.3bn £32.7bn
Adjusted1 Statutory
Performance Measures 30.06.12 31.12.11 30.06.11 30.06.12 31.12.11 30.06.11
Return on average equity 7.6% 11.5% 7.9% 7.6% 11.7% 7.9%
Return on average risk weighted assets 1.3% 2.0% 1.4% 1.3% 2.0% 1.4%
Cost: income ratio 64% 62% 66% 64% 62% 66%
Loan loss rate (bps) 182 107 130 182 107 130
Key Facts 30.06.12 31.12.11 30.06.11
90 day arrears rate – South African home loans 2.8% 3.2% 3.5%
Number of customers 14.8m 14.5m 14.5m
Number of ATMs 10,365 10,068 9,816
Number of branches 1,342 1,354 1,317
Number of sales centres 106 139 189
Number of distribution points 1,448 1,493 1,506
Number of employees (full time equivalent) 42,700 43,800 45,500
1 Adjusted profit before tax and adjusted performance measures excludes the impact of profit on disposals of subsidiaries, associates and joint ventures of
£nil (H2 11: £2m; H1 11: £nil).
Results by Business
Barclays PLC – 2012 Interim Results 19
Africa Retail and Business Banking
Income Statement – H1 12 compared to H1 11
Profit before tax declined 20% to £274m
Higher credit impairment in the South African home loans portfolio
Adverse currency movements due to depreciation of major African currencies against Sterling
Income declined 8% to £1,625m driven by currency movements, partially offset by modest pricing increases and
volume growth
Net interest income declined 6% to £897m with the net interest margin up 16bps to 318bps primarily due to a change
in composition to higher margin business
Customer asset margin increased 15bps to 310bps reflecting a change in composition towards higher margin
business and lower funding rates
Average customer assets decreased 14% to £34.4bn, driven by currency movements and a modest decrease in the
mortgage book
Customer liability margin increased 8bps to 266bps driven by improving margins across a number of African
countries partially offset by a decline in South Africa
Average customer liabilities decreased 7% to £22.3bn, driven by currency movements partially offset by 10%
underlying growth in deposits in South Africa where Absa remains a leader in customer deposits
Net fee and commission income declined 8% to £561m driven by currency movements, partially offset by modest
pricing increases and volume growth
Credit impairment charges increased 19% to £321m reflecting higher impairment charges in the South African home
loans portfolio due to higher write-offs
Operating expenses decreased 11% to £1,033m primarily driven by currency movements and tight cost control
Adjusted return on average equity decreased to 7.6% (2011: 7.9%)
Income Statement – Q2 12 compared to Q1 12
Profit before tax of £97m (Q1 12: £177m) driven by higher impairments in South Africa retail mortgages and currency
movements
Balance Sheet – 30 June 2012 compared to 31 December 2011
Loans and advances to customers decreased 1% to £34.1bn and total assets decreased 2% to £47.4bn mainly due to
currency movements
Customer deposits decreased 1% to £22.3bn due to currency movements partially offset by growth in deposits in South
Africa
Risk weighted assets decreased 8% to £27.9bn primarily driven by changes in exposure risk weightings and currency
movements
Results by Business
Barclays PLC – 2012 Interim Results 20
Barclaycard
Half Year Ended Half Year Ended Half Year Ended
Income Statement Information 30.06.12 31.12.11 30.06.11 YoY
£m £m £m % Change
Net interest income 1,394 1,490 1,370 2
Net fee and commission income 604 600 571 6
Net trading loss (4) (4) (3)
Net investment income - 10 -
Net premiums from insurance contracts 22 21 21
Other income 11 5 15
Total income 2,027 2,122 1,974 3
Net claims and benefits incurred under insurance contracts (1) 1 (2)
Total income net of insurance claims 2,026 2,123 1,972 3
Credit impairment charges and other provisions (460) (611) (648) (29)
Net operating income 1,566 1,512 1,324 18
Operating expenses (excluding provision for PPI redress and
goodwill impairment) (830) (888) (771) 8
Provision for PPI redress - - (600)
Goodwill impairment - - (47)
Operating expenses (830) (888) (1,418) (41)
Other net income 17 13 18 (6)
Profit/(loss) before tax 753 637 (76)
Adjusted profit before tax1 753 637 571 32
Balance Sheet Information Loans and advances to customers at amortised cost £30.6bn £30.1bn £28.3bn
Customer deposits £2.0bn £0.6bn £0.6bn
Total assets £34.6bn £33.8bn £32.5bn
Risk weighted assets £33.1bn £34.2bn £34.0bn
Adjusted1 Statutory
Performance Measures 30.06.12 31.12.11 30.06.11 30.06.12 31.12.11 30.06.11
Return on average equity 22.0% 17.1% 17.7% 22.0% 17.1% (3.6%)
Return on average risk weighted assets 3.3% 2.5% 2.7% 3.3% 2.5% (0.3%)
Loan loss rate (bps) 285 376 420 285 376 420
Cost: income ratio 41% 42% 39% 41% 42% 72%
Key Facts 30.06.12 31.12.11 30.06.11
30 day arrears rates - UK cards 2.7% 2.7% 3.0%
30 day arrears rates - US cards 2.5% 3.1% 3.2%
30 day arrears rates - South Africa cards 5.1% 4.9% 5.4%
Total number of Barclaycard customers 23.0m 22.6m 22.2m
Total average customer assets £31.8bn £31.1bn £29.4bn
Number of retailer relationships 89,000 87,000 90,000
Number of employees (full time equivalent) 10,600 10,400 10,400
1 Adjusted profit before tax and adjusted performance measures excludes the impact of the provision for PPI redress of £nil (H2 11: £nil; H1 11: £600m) and
goodwill impairment of £nil (H2 11: £nil; H1 11: £47m).
Results by Business
Barclays PLC – 2012 Interim Results 21
Barclaycard
Income Statement – H1 12 compared to H1 11
Adjusted profit before tax improved 32% to £753m. Profit before tax increased by £829m to £753m reflecting £600m
provision for PPI redress and £47m goodwill impairment in FirstPlus secured lending portfolio, both charged in H1 11
International profit increased driven by significant improvement in the US
UK consumer card profit increased due to balance growth and 2011 portfolio acquisitions
Solid profit growth within the Business Payments portfolio due to higher volumes
Income improved 3% to £2,026m reflecting continued growth across the business and contributions from 2011
portfolio acquisitions, partially offset by higher funding rates
UK income increased by 2% to £1,281m including contribution from 2011 portfolio acquisitions offset by higher
funding rates
International income improved 3% to £745m reflecting higher US outstanding balances partially offset by increased
funding rates
Net interest income increased by 2% to £1,394m driven by volume growth, partially offset by lower net interest margin
of 881bps (2011: 939bps) including an adverse impact from structural hedges
Average customer assets increased 8% to £31.8bn due to 2011 portfolio acquisitions and business growth, partially
offset by the continued run-off of FirstPlus
Customer asset margin was down 5bps to 953bps due to higher funding rates
Net fee and commission income improved 6% to £604m due to increased business volumes
Credit impairment charges decreased 29% to £460m
Loan loss rate reduced to 285bps (2011: 420bps) principally driven by lower charges in the cards portfolios,
reflecting improved underlying delinquency performance
30 day arrears rates for consumer cards in UK down 30bps to 2.7%, in the US down 70bps to 2.5% and in South
Africa down 30bps to 5.1%
Operating expenses decreased 41% to £830m. Excluding the provision for PPI redress and FirstPlus goodwill
impairment, operating expenses increased 8% reflecting 2011 portfolio acquisitions, investment spend and PPI related
operating costs
Adjusted return on average equity improved to 22.0% (2011: 17.7%). Return on average equity improved to 22.0%
(2011: negative 3.6%)
Income Statement – Q2 12 compared to Q1 12
Profit before tax improved 16% to £404m driven by higher income reflecting seasonal trends and business growth
Balance Sheet – 30 June 2012 compared to 31 December 2011
Total assets increased 2% to £34.6bn in line with loans and advances to customers, primarily within the US
Customer deposits increased by £1.4bn due to business funding initiatives in the US and Germany
Risk weighted assets decreased 3% to £33.1bn, driven by impairment trends and a change in risk weightings more than
offsetting volume growth
Results by Business
Barclays PLC – 2012 Interim Results 22
Investment Bank
Half Year Ended Half Year Ended Half Year Ended
Income Statement Information 30.06.12 31.12.11 30.06.11 YoY
£m £m £m % Change
Net interest income 426 666 511 (17)
Net fee and commission income 1,527 1,483 1,543 (1)
Net trading income 4,269 1,544 3,720 15
Net investment income 270 382 491 (45)
Other income/(expense) 4 (3) (2)
Total income 6,496 4,072 6,263 4
Credit impairment charges and other provisions (323) (204) 111
Net operating income 6,173 3,868 6,374 (3)
Operating expenses (3,933) (3,216) (4,073) (3)
Other net income 28 3 9
Profit before tax 2,268 655 2,310 (2)
Adjusted profit before tax 2,268 655 2,310 (2)
Balance Sheet Information and Key Facts
Loans and advances to banks and customers at
amortised cost £185.9bn £158.6bn £180.7bn
Customer deposits £114.5bn £83.1bn £92.0bn
Total assets £1,225.4bn £1,158.4bn £1,076.0bn
Assets contributing to adjusted gross leverage £650.4bn £604.0bn £653.6bn
Risk weighted assets £190.6bn £186.7bn £190.0bn
Average DVaR (95%) £42m £65m £48m
Number of employees (full time equivalent)1 23,300 23,600 23,600
Adjusted Statutory
Performance Measures 30.06.12 31.12.11 30.06.11 30.06.12 31.12.11 30.06.11
Return on average equity 14.9% 5.0% 15.6% 14.9% 5.0% 15.6%
Return on average risk weighted assets 1.7% 0.6% 1.8% 1.7% 0.6% 1.8%
Cost: income ratio 61% 79% 65% 61% 79% 65%
Cost: net operating income ratio 64% 83% 64% 64% 83% 64%
Compensation: income ratio 39% 49% 45% 39% 49% 45%
Average income per employee (000s)1 £276 £170 £259 £276 £170 £259
Loan loss rate (bps) 35 22 (6) 35 22 (6)
1 H2 11 and H1 11 comparatives have been revised to reflect the transfer of 400 and 500 respectively of dedicated shared service employees to Wealth and
Investment Management.
Results by Business
Barclays PLC – 2012 Interim Results 23
Investment Bank
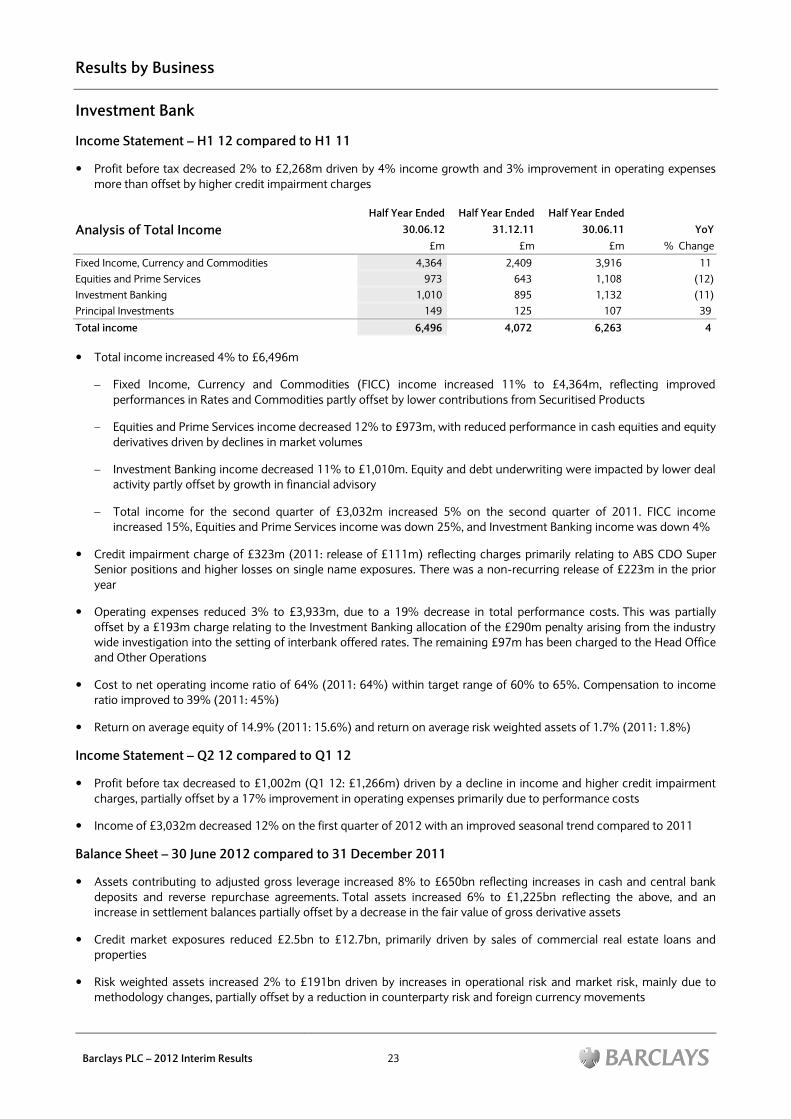
Income Statement – H1 12 compared to H1 11
Profit before tax decreased 2% to £2,268m driven by 4% income growth and 3% improvement in operating expenses
more than offset by higher credit impairment charges
Half Year Ended Half Year Ended Half Year Ended
Analysis of Total Income 30.06.12 31.12.11 30.06.11 YoY
£m £m £m % Change
Fixed Income, Currency and Commodities 4,364 2,409 3,916 11
Equities and Prime Services 973 643 1,108 (12)
Investment Banking 1,010 895 1,132 (11)
Principal Investments 149 125 107 39
Total income 6,496 4,072 6,263 4
Total income increased 4% to £6,496m
Fixed Income, Currency and Commodities (FICC) income increased 11% to £4,364m, reflecting improved
performances in Rates and Commodities partly offset by lower contributions from Securitised Products
Equities and Prime Services income decreased 12% to £973m, with reduced performance in cash equities and equity
derivatives driven by declines in market volumes
Investment Banking income decreased 11% to £1,010m. Equity and debt underwriting were impacted by lower deal
activity partly offset by growth in financial advisory
Total income for the second quarter of £3,032m increased 5% on the second quarter of 2011. FICC income
increased 15%, Equities and Prime Services income was down 25%, and Investment Banking income was down 4%
Credit impairment charge of £323m (2011: release of £111m) reflecting charges primarily relating to ABS CDO Super
Senior positions and higher losses on single name exposures. There was a non-recurring release of £223m in the prior
year
Operating expenses reduced 3% to £3,933m, due to a 19% decrease in total performance costs. This was partially
offset by a £193m charge relating to the Investment Banking allocation of the £290m penalty arising from the industry
wide investigation into the setting of interbank offered rates. The remaining £97m has been charged to the Head Office
and Other Operations
Cost to net operating income ratio of 64% (2011: 64%) within target range of 60% to 65%. Compensation to income
ratio improved to 39% (2011: 45%)
Return on average equity of 14.9% (2011: 15.6%) and return on average risk weighted assets of 1.7% (2011: 1.8%)
Income Statement – Q2 12 compared to Q1 12
Profit before tax decreased to £1,002m (Q1 12: £1,266m) driven by a decline in income and higher credit impairment
charges, partially offset by a 17% improvement in operating expenses primarily due to performance costs
Income of £3,032m decreased 12% on the first quarter of 2012 with an improved seasonal trend compared to 2011
Balance Sheet – 30 June 2012 compared to 31 December 2011
Assets contributing to adjusted gross leverage increased 8% to £650bn reflecting increases in cash and central bank
deposits and reverse repurchase agreements. Total assets increased 6% to £1,225bn reflecting the above, and an
increase in settlement balances partially offset by a decrease in the fair value of gross derivative assets
Credit market exposures reduced £2.5bn to £12.7bn, primarily driven by sales of commercial real estate loans and
properties
Risk weighted assets increased 2% to £191bn driven by increases in operational risk and market risk, mainly due to
methodology changes, partially offset by a reduction in counterparty risk and foreign currency movements
Results by Business
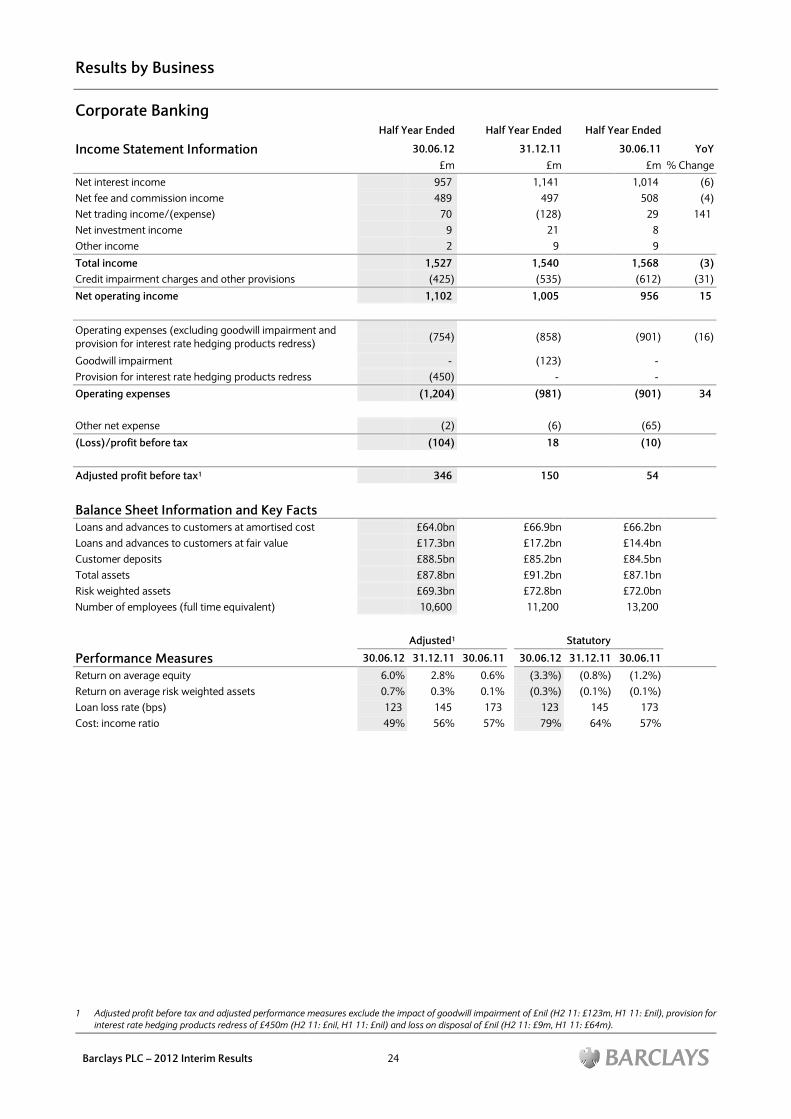
Barclays PLC – 2012 Interim Results 24
Corporate Banking
Half Year Ended Half Year Ended Half Year Ended
Income Statement Information 30.06.12 31.12.11 30.06.11 YoY
£m £m £m % Change
Net interest income 957 1,141 1,014 (6)
Net fee and commission income 489 497 508 (4)
Net trading income/(expense) 70 (128) 29 141
Net investment income 9 21 8
Other income 2 9 9
Total income 1,527 1,540 1,568 (3)
Credit impairment charges and other provisions (425) (535) (612) (31)
Net operating income 1,102 1,005 956 15
Operating expenses (excluding goodwill impairment and
provision for interest rate hedging products redress) (754) (858) (901) (16)
Goodwill impairment - (123) -
Provision for interest rate hedging products redress (450) - -
Operating expenses (1,204) (981) (901) 34
Other net expense (2) (6) (65)
(Loss)/profit before tax (104) 18 (10)
Adjusted profit before tax1 346 150 54
Balance Sheet Information and Key Facts
Loans and advances to customers at amortised cost £64.0bn £66.9bn £66.2bn
Loans and advances to customers at fair value £17.3bn £17.2bn £14.4bn
Customer deposits £88.5bn £85.2bn £84.5bn
Total assets £87.8bn £91.2bn £87.1bn
Risk weighted assets £69.3bn £72.8bn £72.0bn
Number of employees (full time equivalent) 10,600 11,200 13,200
Adjusted1 Statutory
Performance Measures 30.06.12 31.12.11 30.06.11 30.06.12 31.12.11 30.06.11
Return on average equity 6.0% 2.8% 0.6% (3.3%) (0.8%) (1.2%)
Return on average risk weighted assets 0.7% 0.3% 0.1% (0.3%) (0.1%) (0.1%)
Loan loss rate (bps) 123 145 173 123 145 173
Cost: income ratio 49% 56% 57% 79% 64% 57%
1 Adjusted profit before tax and adjusted performance measures exclude the impact of goodwill impairment of £nil (H2 11: £123m, H1 11: £nil), provision for
interest rate hedging products redress of £450m (H2 11: £nil, H1 11: £nil) and loss on disposal of £nil (H2 11: £9m, H1 11: £64m).
Results by Business
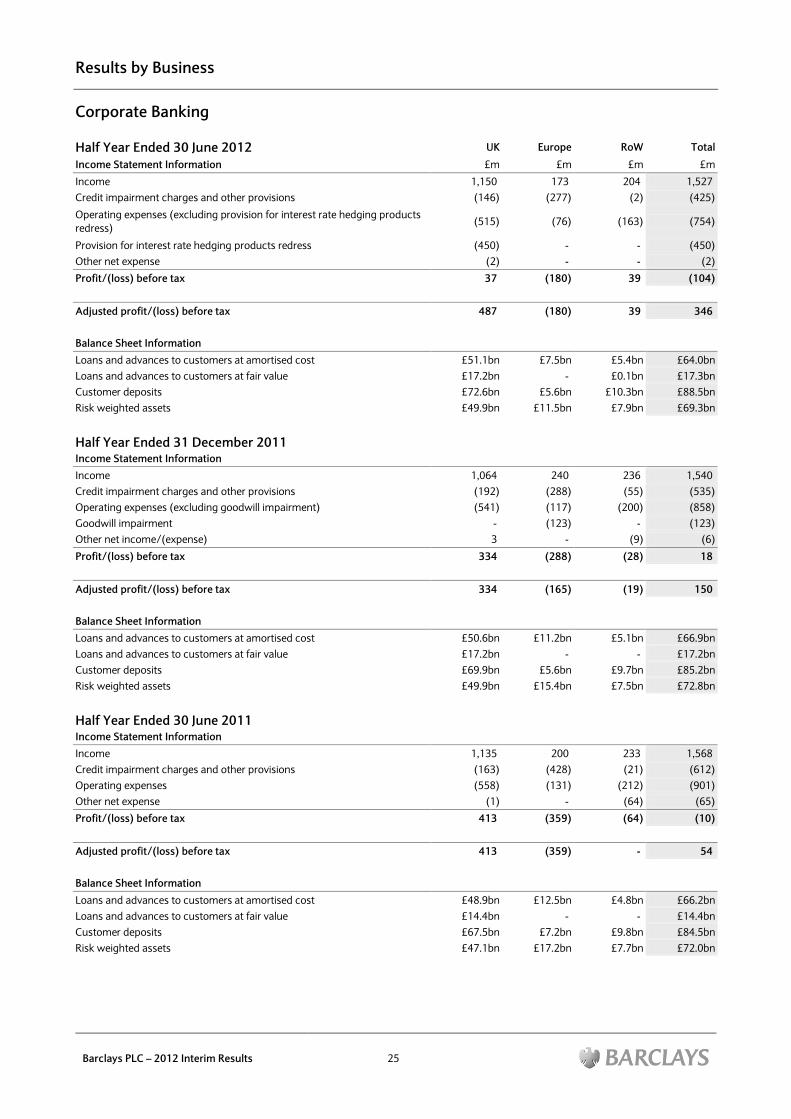
Barclays PLC – 2012 Interim Results 25
Corporate Banking
Half Year Ended 30 June 2012 UK Europe RoW Total
Income Statement Information £m £m £m £m
Income 1,150 173 204 1,527
Credit impairment charges and other provisions (146) (277) (2) (425)
Operating expenses (excluding provision for interest rate hedging products
redress) (515) (76) (163) (754)
Provision for interest rate hedging products redress (450) - - (450)
Other net expense (2) - - (2)
Profit/(loss) before tax 37 (180) 39 (104)
Adjusted profit/(loss) before tax 487 (180) 39 346
Balance Sheet Information
Loans and advances to customers at amortised cost £51.1bn £7.5bn £5.4bn £64.0bn
Loans and advances to customers at fair value £17.2bn - £0.1bn £17.3bn
Customer deposits £72.6bn £5.6bn £10.3bn £88.5bn
Risk weighted assets £49.9bn £11.5bn £7.9bn £69.3bn
Half Year Ended 31 December 2011
Income Statement Information
Income 1,064 240 236 1,540
Credit impairment charges and other provisions (192) (288) (55) (535)
Operating expenses (excluding goodwill impairment) (541) (117) (200) (858)
Goodwill impairment - (123) - (123)
Other net income/(expense) 3 - (9) (6)
Profit/(loss) before tax 334 (288) (28) 18
Adjusted profit/(loss) before tax 334 (165) (19) 150
Balance Sheet Information
Loans and advances to customers at amortised cost £50.6bn £11.2bn £5.1bn £66.9bn
Loans and advances to customers at fair value £17.2bn - - £17.2bn
Customer deposits £69.9bn £5.6bn £9.7bn £85.2bn
Risk weighted assets £49.9bn £15.4bn £7.5bn £72.8bn
Half Year Ended 30 June 2011
Income Statement Information
Income 1,135 200 233 1,568
Credit impairment charges and other provisions (163) (428) (21) (612)
Operating expenses (558) (131) (212) (901)
Other net expense (1) - (64) (65)
Profit/(loss) before tax 413 (359) (64) (10)
Adjusted profit/(loss) before tax 413 (359) - 54
Balance Sheet Information
Loans and advances to customers at amortised cost £48.9bn £12.5bn £4.8bn £66.2bn
Loans and advances to customers at fair value £14.4bn - - £14.4bn
Customer deposits £67.5bn £7.2bn £9.8bn £84.5bn
Risk weighted assets £47.1bn £17.2bn £7.7bn £72.0bn
Results by Business
Barclays PLC – 2012 Interim Results 26
Corporate Banking
Income Statement – H1 12 compared to H1 11
Adjusted profit before tax improved £292m to £346m, primarily driven by improved credit impairment in Europe and
improved operating expenses. Loss before tax was £104m (2011: £10m) including a gain of £68m (2011: gain of £21m)
in the net valuation of fair value loans and a £450m provision for interest rate hedging products redress
UK adjusted profit before tax improved 18% to £487m reflecting improved operating expenses and credit
impairment. UK profit before tax decreased £376m to £37m after £450m provision for interest rate hedging
products redress
Europe loss before tax improved £179m to £180m driven by improved credit impairment charges in Spain and
improved operating expenses, partially offset by non-recurring income from exited businesses
Rest of the World profit before tax improved £103m to £39m including a prior year loss on disposal of Barclays Bank
Russia (BBR). Excluding this item, Rest of the World profit before tax improved £39m
Net interest income decreased 6% to £957m reflecting increased funding rates and non-recurring income from exited
businesses
Credit impairment charges reduced 31% to £425m. Overall loan loss rates improved to 123bps (2011: 173bps)
Impairment charges in Spain reduced £115m to £184m, primarily as a result of ongoing action to reduce exposure
within the property and construction sector
Operating expenses excluding a £450m provision for interest rate hedging products redress improved 16% to £754m,
principally due to prior year restructuring including the exit of BBR. Adjusted cost to income ratio improved to 49%
(2011: 57%)
Adjusted return on average equity improved to 6.0% (2011: 0.6%). Return on average equity was negative 3.3% (2011:
negative 1.2%)
Income Statement – Q2 12 compared to Q1 12
Adjusted profit before tax decreased £92m to £127m including a loss of £10m (Q1 12: gain of £78m) in the net
valuation of fair value loans. Excluding this item, adjusted profit before tax of £137m was broadly in line with the
previous quarter
Loss before tax decreased £542m to £323m after £450m provision for interest rate hedging products redress
Balance Sheet – 30 June 2012 compared to 31 December 2011
Total assets down £3.4bn to £87.8bn driven by reduced balances in Europe
Customer deposits increased 4% to £88.5bn with increased balances in the UK
Risk weighted assets decreased 5% to £69.3bn reflecting lower net exposures in Europe

Results by Business
Barclays PLC – 2012 Interim Results 27
Intentionally left blank
Results by Business
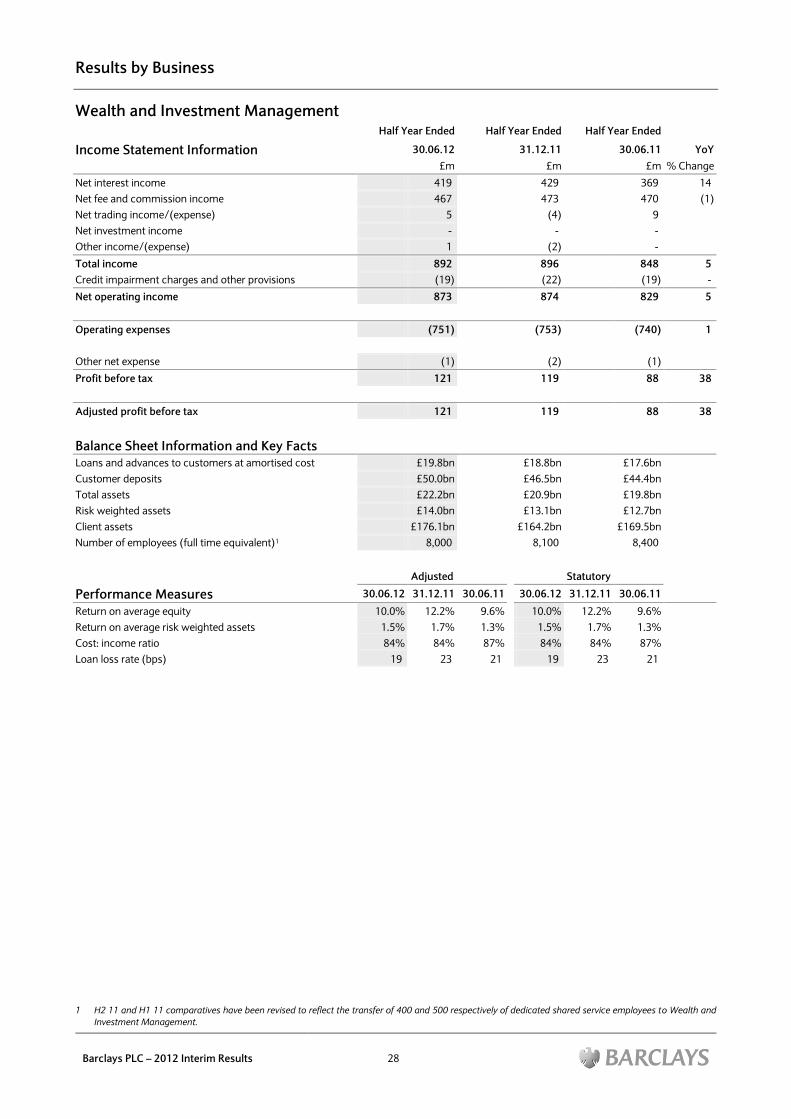
Barclays PLC – 2012 Interim Results 28
Wealth and Investment Management
Half Year Ended Half Year Ended Half Year Ended
Income Statement Information 30.06.12 31.12.11 30.06.11 YoY
£m £m £m % Change
Net interest income 419 429 369 14
Net fee and commission income 467 473 470 (1)
Net trading income/(expense) 5 (4) 9
Net investment income - - -
Other income/(expense) 1 (2) -
Total income 892 896 848 5
Credit impairment charges and other provisions (19) (22) (19) -
Net operating income 873 874 829 5
Operating expenses (751) (753) (740) 1
Other net expense (1) (2) (1)
Profit before tax 121 119 88 38
Adjusted profit before tax 121 119 88 38
Balance Sheet Information and Key Facts Loans and advances to customers at amortised cost £19.8bn £18.8bn £17.6bn
Customer deposits £50.0bn £46.5bn £44.4bn
Total assets £22.2bn £20.9bn £19.8bn
Risk weighted assets £14.0bn £13.1bn £12.7bn
Client assets £176.1bn £164.2bn £169.5bn
Number of employees (full time equivalent)1 8,000 8,100 8,400
Adjusted Statutory
Performance Measures 30.06.12 31.12.11 30.06.11 30.06.12 31.12.11 30.06.11
Return on average equity 10.0% 12.2% 9.6% 10.0% 12.2% 9.6%
Return on average risk weighted assets 1.5% 1.7% 1.3% 1.5% 1.7% 1.3%
Cost: income ratio 84% 84% 87% 84% 84% 87%
Loan loss rate (bps) 19 23 21 19 23 21
1 H2 11 and H1 11 comparatives have been revised to reflect the transfer of 400 and 500 respectively of dedicated shared service employees to Wealth and
Investment Management.
Results by Business
Barclays PLC – 2012 Interim Results 29
Wealth and Investment Management
Income Statement – H1 12 compared to H1 11
Profit before tax increased 38% to £121m
Wealth and Investment Management continues to execute its strategic investment programme with a focus on
building productive capacity and delivering a step change in the client experience
Delivery against these objectives has been strong over the last two and a half years, with significant front office
hiring and material improvements to technology platforms driving efficiencies as well as improved service to clients
Income improved 5% to £892m primarily driven by an increase in the High Net Worth businesses:
Net interest income grew 14% to £419m. Net interest margin increased to 125bps from 122bps with average loans
up £2.3bn to £19.2bn and average customer deposits up £4.3bn to £48.2bn. The growth in deposits was primarily
driven by an enhanced banking proposition in the High Net Worth businesses and a shift in client investment
appetite towards holding cash in volatile market conditions
Net fee and commission income decreased 1% to £467m due to reduced client activity in challenging market
conditions
Operating expenses increased 1% to £751m as the continued cost of the strategic investment programme was partially
offset by additional cost control initiatives
Return on average equity increased to 10.0% (2011: 9.6%)
Income Statement – Q2 12 compared to Q1 12
Profit before tax remained stable at £61m (Q1 12: £60m)
Balance Sheet – 30 June 2012 compared to 31 December 2011
Customer deposits increased 8% to £50.0bn and loans and advances to customers increased 5% to £19.8bn driven by
growth in the High Net Worth businesses
Client assets increased to £176.1bn (2011: £164.2bn) driven by net new assets in the High Net Worth businesses offset
by market, foreign exchange and other movements
Risk weighted assets increased 7% to £14.0bn principally due to growth in lending balances
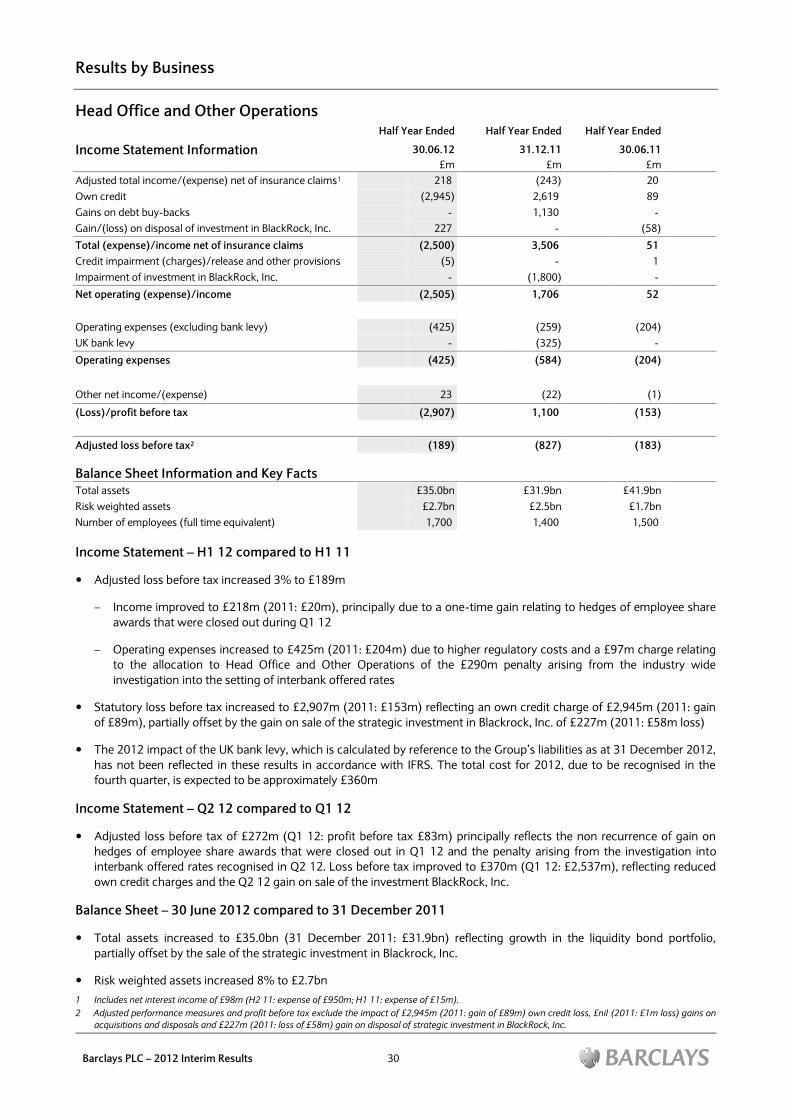
Results by Business
Barclays PLC – 2012 Interim Results 30
Head Office and Other Operations
Half Year Ended Half Year Ended Half Year Ended
Income Statement Information 30.06.12 31.12.11 30.06.11
£m £m £m
Adjusted total income/(expense) net of insurance claims1 218 (243) 20
Own credit (2,945) 2,619 89
Gains on debt buy-backs - 1,130 -
Gain/(loss) on disposal of investment in BlackRock, Inc. 227 - (58)
Total (expense)/income net of insurance claims (2,500) 3,506 51
Credit impairment (charges)/release and other provisions (5) - 1
Impairment of investment in BlackRock, Inc. - (1,800) -
Net operating (expense)/income (2,505) 1,706 52
Operating expenses (excluding bank levy) (425) (259) (204)
UK bank levy - (325) -
Operating expenses (425) (584) (204)
Other net income/(expense) 23 (22) (1)
(Loss)/profit before tax (2,907) 1,100 (153)
Adjusted loss before tax2 (189) (827) (183)
Balance Sheet Information and Key Facts
Total assets £35.0bn £31.9bn £41.9bn
Risk weighted assets £2.7bn £2.5bn £1.7bn
Number of employees (full time equivalent) 1,700 1,400 1,500
Income Statement – H1 12 compared to H1 11
Adjusted loss before tax increased 3% to £189m
Income improved to £218m (2011: £20m), principally due to a one-time gain relating to hedges of employee share
awards that were closed out during Q1 12
Operating expenses increased to £425m (2011: £204m) due to higher regulatory costs and a £97m charge relating
to the allocation to Head Office and Other Operations of the £290m penalty arising from the industry wide
investigation into the setting of interbank offered rates
Statutory loss before tax increased to £2,907m (2011: £153m) reflecting an own credit charge of £2,945m (2011: gain
of £89m), partially offset by the gain on sale of the strategic investment in Blackrock, Inc. of £227m (2011: £58m loss)
The 2012 impact of the UK bank levy, which is calculated by reference to the Group‟s liabilities as at 31 December 2012,
has not been reflected in these results in accordance with IFRS. The total cost for 2012, due to be recognised in the
fourth quarter, is expected to be approximately £360m
Income Statement – Q2 12 compared to Q1 12
Adjusted loss before tax of £272m (Q1 12: profit before tax £83m) principally reflects the non recurrence of gain on
hedges of employee share awards that were closed out in Q1 12 and the penalty arising from the investigation into
interbank offered rates recognised in Q2 12. Loss before tax improved to £370m (Q1 12: £2,537m), reflecting reduced
own credit charges and the Q2 12 gain on sale of the investment BlackRock, Inc.
Balance Sheet – 30 June 2012 compared to 31 December 2011
Total assets increased to £35.0bn (31 December 2011: £31.9bn) reflecting growth in the liquidity bond portfolio,
partially offset by the sale of the strategic investment in Blackrock, Inc.
Risk weighted assets increased 8% to £2.7bn
1 Includes net interest income of £98m (H2 11: expense of £950m; H1 11: expense of £15m).
2 Adjusted performance measures and profit before tax exclude the impact of £2,945m (2011: gain of £89m) own credit loss, £nil (2011: £1m loss) gains on
acquisitions and disposals and £227m (2011: loss of £58m) gain on disposal of strategic investment in BlackRock, Inc.
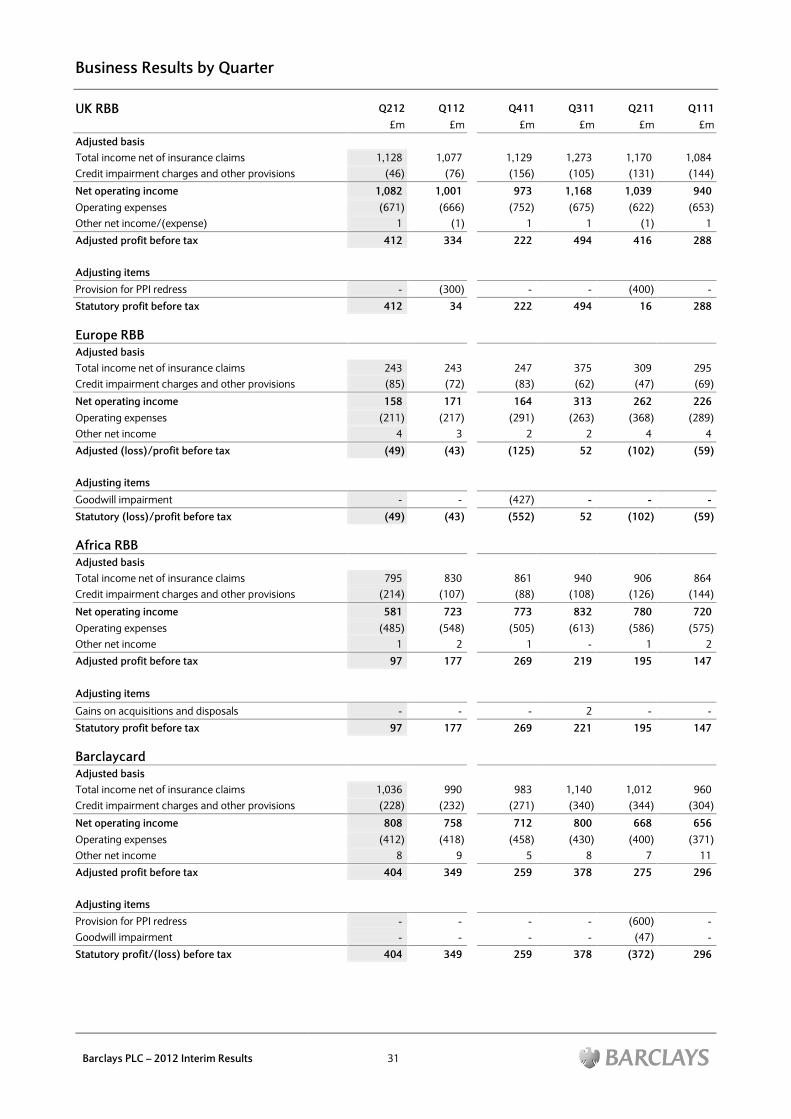
Business Results by Quarter
Barclays PLC – 2012 Interim Results 31
UK RBB Q212 Q112 Q411 Q311 Q211 Q111
£m £m £m £m £m £m
Adjusted basis
Total income net of insurance claims 1,128 1,077 1,129 1,273 1,170 1,084
Credit impairment charges and other provisions (46) (76) (156) (105) (131) (144)
Net operating income 1,082 1,001 973 1,168 1,039 940
Operating expenses (671) (666) (752) (675) (622) (653)
Other net income/(expense) 1 (1) 1 1 (1) 1
Adjusted profit before tax 412 334 222 494 416 288
Adjusting items
Provision for PPI redress - (300) - - (400) -
Statutory profit before tax 412 34 222 494 16 288
Europe RBB
Adjusted basis
Total income net of insurance claims 243 243 247 375 309 295
Credit impairment charges and other provisions (85) (72) (83) (62) (47) (69)
Net operating income 158 171 164 313 262 226
Operating expenses (211) (217) (291) (263) (368) (289)
Other net income 4 3 2 2 4 4
Adjusted (loss)/profit before tax (49) (43) (125) 52 (102) (59)
Adjusting items
Goodwill impairment - - (427) - - -
Statutory (loss)/profit before tax (49) (43) (552) 52 (102) (59)
Africa RBB
Adjusted basis
Total income net of insurance claims 795 830 861 940 906 864
Credit impairment charges and other provisions (214) (107) (88) (108) (126) (144)
Net operating income 581 723 773 832 780 720
Operating expenses (485) (548) (505) (613) (586) (575)
Other net income 1 2 1 - 1 2
Adjusted profit before tax 97 177 269 219 195 147
Adjusting items
Gains on acquisitions and disposals - - - 2 - -
Statutory profit before tax 97 177 269 221 195 147
Barclaycard
Adjusted basis
Total income net of insurance claims 1,036 990 983 1,140 1,012 960
Credit impairment charges and other provisions (228) (232) (271) (340) (344) (304)
Net operating income 808 758 712 800 668 656
Operating expenses (412) (418) (458) (430) (400) (371)
Other net income 8 9 5 8 7 11
Adjusted profit before tax 404 349 259 378 275 296
Adjusting items
Provision for PPI redress - - - - (600) -
Goodwill impairment - - - - (47) -
Statutory profit/(loss) before tax 404 349 259 378 (372) 296
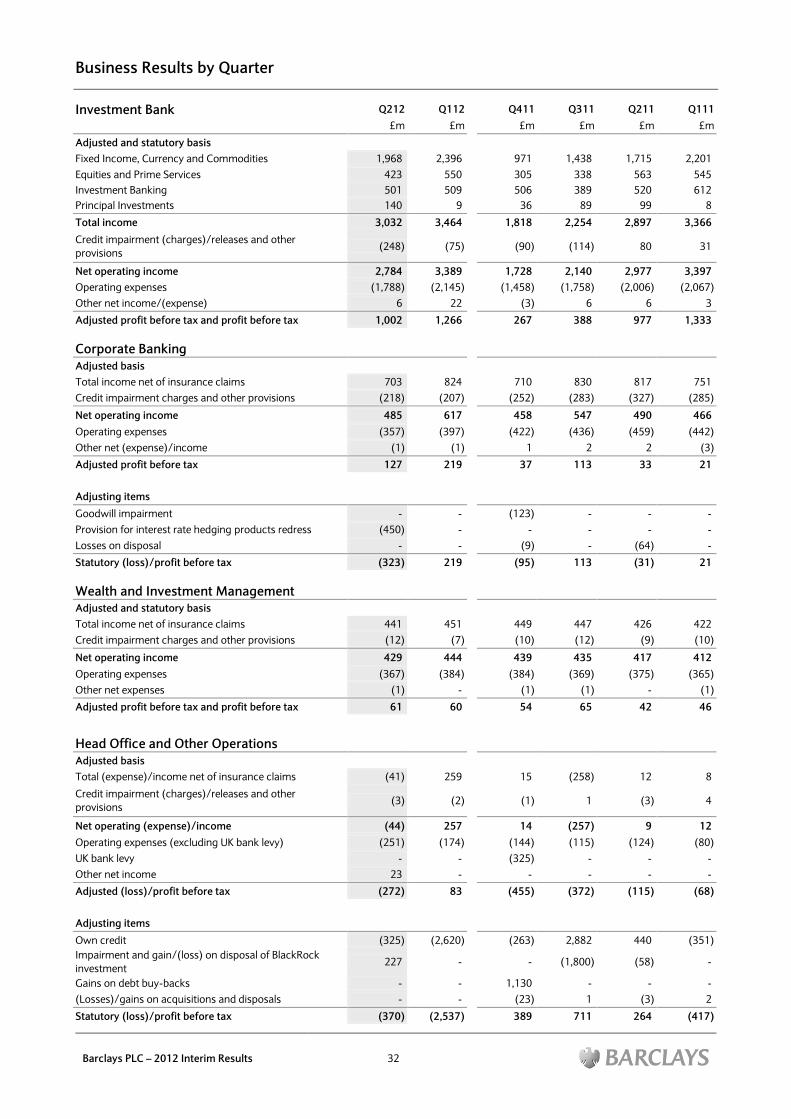
Business Results by Quarter
Barclays PLC – 2012 Interim Results 32
Investment Bank Q212 Q112 Q411 Q311 Q211 Q111
£m £m £m £m £m £m
Adjusted and statutory basis
Fixed Income, Currency and Commodities 1,968 2,396 971 1,438 1,715 2,201
Equities and Prime Services 423 550 305 338 563 545
Investment Banking 501 509 506 389 520 612
Principal Investments 140 9 36 89 99 8
Total income 3,032 3,464 1,818 2,254 2,897 3,366
Credit impairment (charges)/releases and other
provisions (248) (75) (90) (114) 80 31
Net operating income 2,784 3,389 1,728 2,140 2,977 3,397
Operating expenses (1,788) (2,145) (1,458) (1,758) (2,006) (2,067)
Other net income/(expense) 6 22 (3) 6 6 3
Adjusted profit before tax and profit before tax 1,002 1,266 267 388 977 1,333
Corporate Banking
Adjusted basis
Total income net of insurance claims 703 824 710 830 817 751
Credit impairment charges and other provisions (218) (207) (252) (283) (327) (285)
Net operating income 485 617 458 547 490 466
Operating expenses (357) (397) (422) (436) (459) (442)
Other net (expense)/income (1) (1) 1 2 2 (3)
Adjusted profit before tax 127 219 37 113 33 21
Adjusting items
Goodwill impairment - - (123) - - -
Provision for interest rate hedging products redress (450) - - - - -
Losses on disposal - - (9) - (64) -
Statutory (loss)/profit before tax (323) 219 (95) 113 (31) 21
Wealth and Investment Management
Adjusted and statutory basis
Total income net of insurance claims 441 451 449 447 426 422
Credit impairment charges and other provisions (12) (7) (10) (12) (9) (10)
Net operating income 429 444 439 435 417 412
Operating expenses (367) (384) (384) (369) (375) (365)
Other net expenses (1) - (1) (1) - (1)
Adjusted profit before tax and profit before tax 61 60 54 65 42 46
Head Office and Other Operations
Adjusted basis
Total (expense)/income net of insurance claims (41) 259 15 (258) 12 8
Credit impairment (charges)/releases and other
provisions (3) (2) (1) 1 (3) 4
Net operating (expense)/income (44) 257 14 (257) 9 12
Operating expenses (excluding UK bank levy) (251) (174) (144) (115) (124) (80)
UK bank levy - - (325) - - -
Other net income 23 - - - - -
Adjusted (loss)/profit before tax (272) 83 (455) (372) (115) (68)
Adjusting items
Own credit (325) (2,620) (263) 2,882 440 (351)
Impairment and gain/(loss) on disposal of BlackRock
investment 227 - - (1,800) (58) -
Gains on debt buy-backs - - 1,130 - - -
(Losses)/gains on acquisitions and disposals - - (23) 1 (3) 2
Statutory (loss)/profit before tax (370) (2,537) 389 711 264 (417)
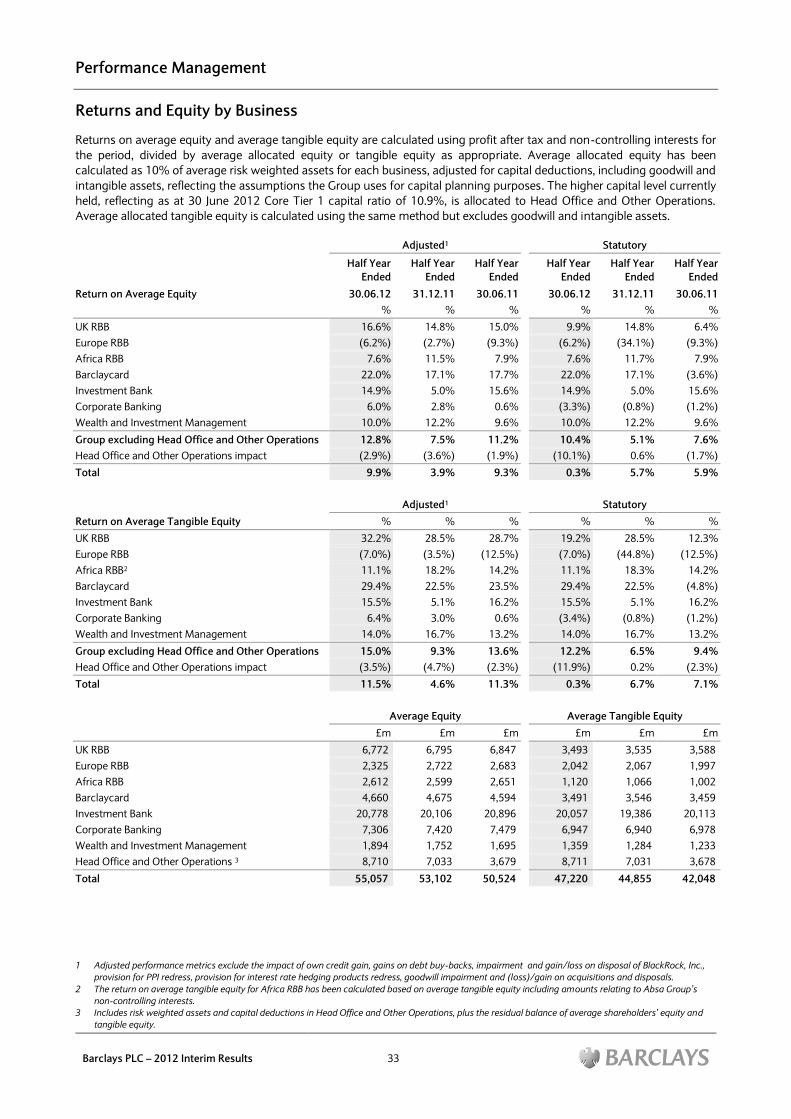
Performance Management
Barclays PLC – 2012 Interim Results 33
Returns and Equity by Business
Returns on average equity and average tangible equity are calculated using profit after tax and non-controlling interests for
the period, divided by average allocated equity or tangible equity as appropriate. Average allocated equity has been
calculated as 10% of average risk weighted assets for each business, adjusted for capital deductions, including goodwill and
intangible assets, reflecting the assumptions the Group uses for capital planning purposes. The higher capital level currently
held, reflecting as at 30 June 2012 Core Tier 1 capital ratio of 10.9%, is allocated to Head Office and Other Operations.
Average allocated tangible equity is calculated using the same method but excludes goodwill and intangible assets.
Adjusted1 Statutory
Half Year
Ended
Half Year
Ended
Half Year
Ended
Half Year
Ended
Half Year
Ended
Half Year
Ended
Return on Average Equity 30.06.12 31.12.11 30.06.11 30.06.12 31.12.11 30.06.11
% % % % % %
UK RBB 16.6% 14.8% 15.0% 9.9% 14.8% 6.4%
Europe RBB (6.2%) (2.7%) (9.3%) (6.2%) (34.1%) (9.3%)
Africa RBB 7.6% 11.5% 7.9% 7.6% 11.7% 7.9%
Barclaycard 22.0% 17.1% 17.7% 22.0% 17.1% (3.6%)
Investment Bank 14.9% 5.0% 15.6% 14.9% 5.0% 15.6%
Corporate Banking 6.0% 2.8% 0.6% (3.3%) (0.8%) (1.2%)
Wealth and Investment Management 10.0% 12.2% 9.6% 10.0% 12.2% 9.6%
Group excluding Head Office and Other Operations 12.8% 7.5% 11.2% 10.4% 5.1% 7.6%
Head Office and Other Operations impact (2.9%) (3.6%) (1.9%) (10.1%) 0.6% (1.7%)
Total 9.9% 3.9% 9.3% 0.3% 5.7% 5.9%
Adjusted1 Statutory
Return on Average Tangible Equity % % % % % %
UK RBB 32.2% 28.5% 28.7% 19.2% 28.5% 12.3%
Europe RBB (7.0%) (3.5%) (12.5%) (7.0%) (44.8%) (12.5%)
Africa RBB2 11.1% 18.2% 14.2% 11.1% 18.3% 14.2%
Barclaycard 29.4% 22.5% 23.5% 29.4% 22.5% (4.8%)
Investment Bank 15.5% 5.1% 16.2% 15.5% 5.1% 16.2%
Corporate Banking 6.4% 3.0% 0.6% (3.4%) (0.8%) (1.2%)
Wealth and Investment Management 14.0% 16.7% 13.2% 14.0% 16.7% 13.2%
Group excluding Head Office and Other Operations 15.0% 9.3% 13.6% 12.2% 6.5% 9.4%
Head Office and Other Operations impact (3.5%) (4.7%) (2.3%) (11.9%) 0.2% (2.3%)
Total 11.5% 4.6% 11.3% 0.3% 6.7% 7.1%
Average Equity Average Tangible Equity
£m £m £m £m £m £m
UK RBB 6,772 6,795 6,847 3,493 3,535 3,588
Europe RBB 2,325 2,722 2,683 2,042 2,067 1,997
Africa RBB 2,612 2,599 2,651 1,120 1,066 1,002
Barclaycard 4,660 4,675 4,594 3,491 3,546 3,459
Investment Bank 20,778 20,106 20,896 20,057 19,386 20,113
Corporate Banking 7,306 7,420 7,479 6,947 6,940 6,978
Wealth and Investment Management 1,894 1,752 1,695 1,359 1,284 1,233
Head Office and Other Operations 3 8,710 7,033 3,679 8,711 7,031 3,678
Total 55,057 53,102 50,524 47,220 44,855 42,048
1 Adjusted performance metrics exclude the impact of own credit gain, gains on debt buy-backs, impairment and gain/loss on disposal of BlackRock, Inc.,
provision for PPI redress, provision for interest rate hedging products redress, goodwill impairment and (loss)/gain on acquisitions and disposals.
2 The return on average tangible equity for Africa RBB has been calculated based on average tangible equity including amounts relating to Absa Group‟s
non-controlling interests.
3 Includes risk weighted assets and capital deductions in Head Office and Other Operations, plus the residual balance of average shareholders‟ equity and
tangible equity.
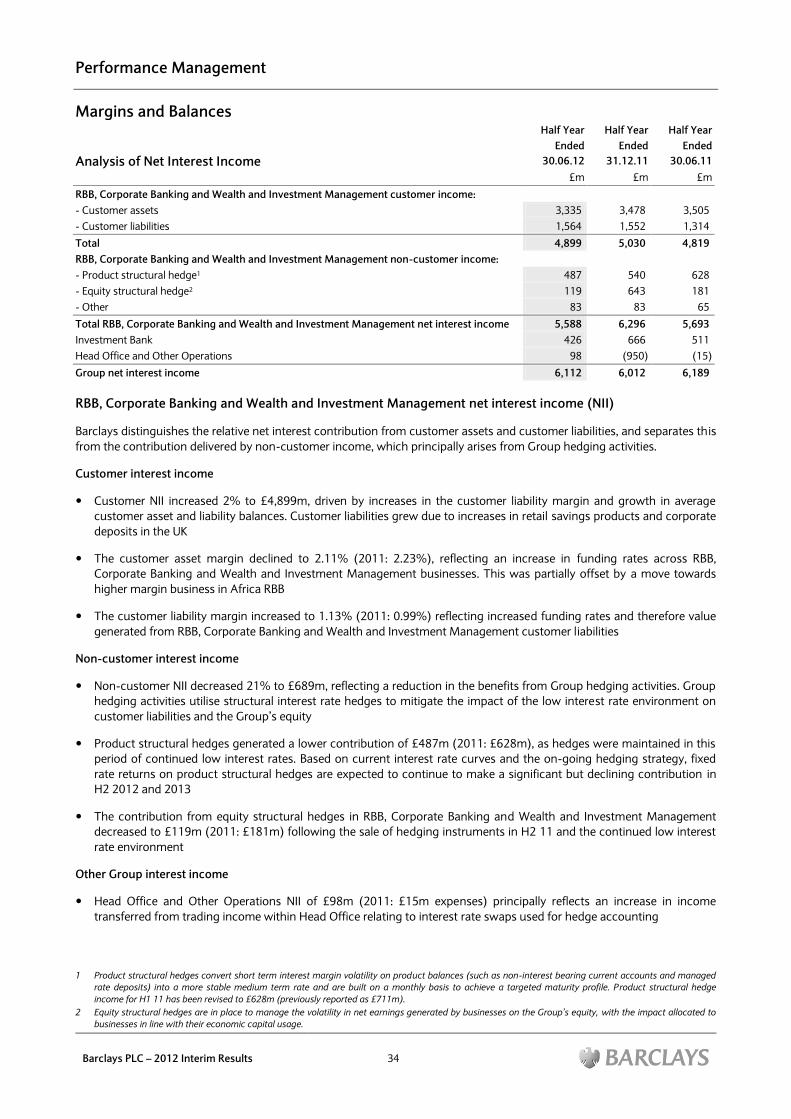
Performance Management
Barclays PLC – 2012 Interim Results 34
Margins and Balances
Half Year
Half Year Half Year
Ended Ended Ended
Analysis of Net Interest Income 30.06.12 31.12.11 30.06.11
£m £m £m
RBB, Corporate Banking and Wealth and Investment Management customer income:
- Customer assets 3,335 3,478 3,505
- Customer liabilities 1,564 1,552 1,314
Total 4,899 5,030 4,819
RBB, Corporate Banking and Wealth and Investment Management non-customer income:
- Product structural hedge1 487 540 628
- Equity structural hedge2 119 643 181
- Other 83 83 65
Total RBB, Corporate Banking and Wealth and Investment Management net interest income 5,588 6,296 5,693
Investment Bank 426 666 511
Head Office and Other Operations 98 (950) (15)
Group net interest income 6,112 6,012 6,189
RBB, Corporate Banking and Wealth and Investment Management net interest income (NII)
Barclays distinguishes the relative net interest contribution from customer assets and customer liabilities, and separates this
from the contribution delivered by non-customer income, which principally arises from Group hedging activities.
Customer interest income
Customer NII increased 2% to £4,899m, driven by increases in the customer liability margin and growth in average
customer asset and liability balances. Customer liabilities grew due to increases in retail savings products and corporate
deposits in the UK
The customer asset margin declined to 2.11% (2011: 2.23%), reflecting an increase in funding rates across RBB,
Corporate Banking and Wealth and Investment Management businesses. This was partially offset by a move towards
higher margin business in Africa RBB
The customer liability margin increased to 1.13% (2011: 0.99%) reflecting increased funding rates and therefore value
generated from RBB, Corporate Banking and Wealth and Investment Management customer liabilities
Non-customer interest income
Non-customer NII decreased 21% to £689m, reflecting a reduction in the benefits from Group hedging activities. Group
hedging activities utilise structural interest rate hedges to mitigate the impact of the low interest rate environment on
customer liabilities and the Group‟s equity
Product structural hedges generated a lower contribution of £487m (2011: £628m), as hedges were maintained in this
period of continued low interest rates. Based on current interest rate curves and the on-going hedging strategy, fixed
rate returns on product structural hedges are expected to continue to make a significant but declining contribution in
H2 2012 and 2013
The contribution from equity structural hedges in RBB, Corporate Banking and Wealth and Investment Management
decreased to £119m (2011: £181m) following the sale of hedging instruments in H2 11 and the continued low interest
rate environment
Other Group interest income
Head Office and Other Operations NII of £98m (2011: £15m expenses) principally reflects an increase in income
transferred from trading income within Head Office relating to interest rate swaps used for hedge accounting
1 Product structural hedges convert short term interest margin volatility on product balances (such as non-interest bearing current accounts and managed
rate deposits) into a more stable medium term rate and are built on a monthly basis to achieve a targeted maturity profile. Product structural hedge
income for H1 11 has been revised to £628m (previously reported as £711m).
2 Equity structural hedges are in place to manage the volatility in net earnings generated by businesses on the Group‟s equity, with the impact allocated to
businesses in line with their economic capital usage.
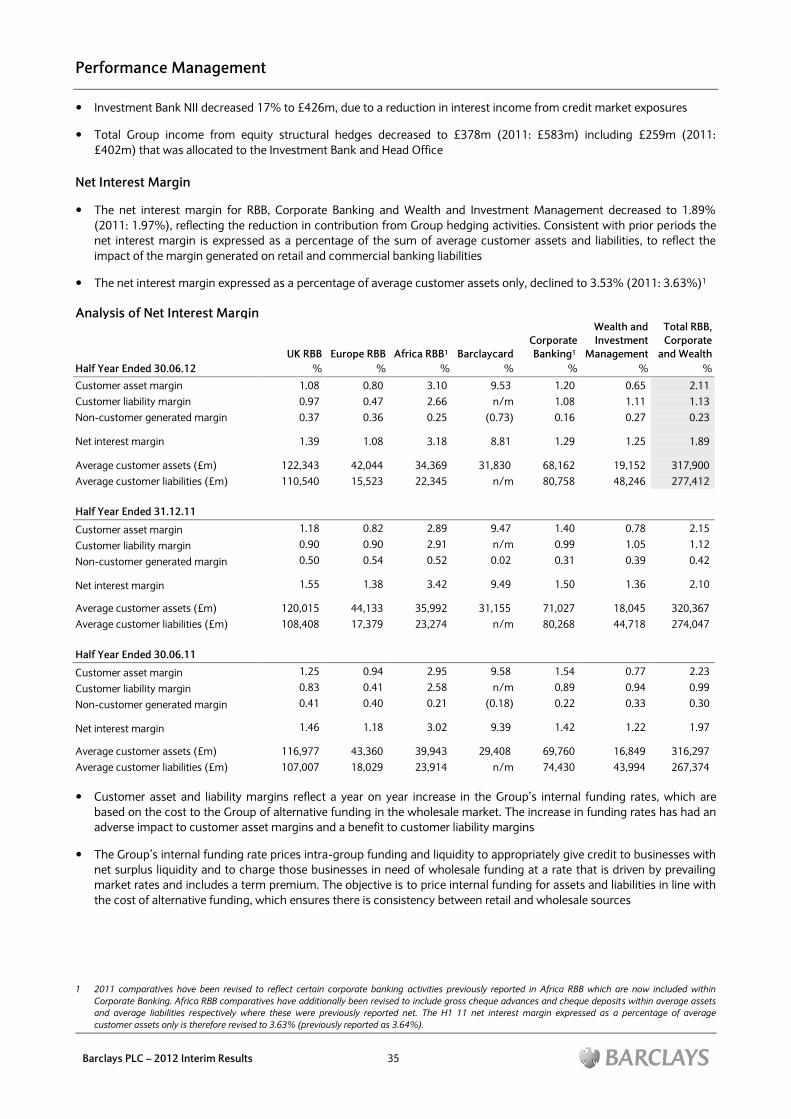
Performance Management
Barclays PLC – 2012 Interim Results 35
Investment Bank NII decreased 17% to £426m, due to a reduction in interest income from credit market exposures
Total Group income from equity structural hedges decreased to £378m (2011: £583m) including £259m (2011:
£402m) that was allocated to the Investment Bank and Head Office
Net Interest Margin
The net interest margin for RBB, Corporate Banking and Wealth and Investment Management decreased to 1.89%
(2011: 1.97%), reflecting the reduction in contribution from Group hedging activities. Consistent with prior periods the
net interest margin is expressed as a percentage of the sum of average customer assets and liabilities, to reflect the
impact of the margin generated on retail and commercial banking liabilities
The net interest margin expressed as a percentage of average customer assets only, declined to 3.53% (2011: 3.63%)1
Analysis of Net Interest Margin
UK RBB Europe RBB Africa RBB1 Barclaycard
Corporate
Banking1
Wealth and
Investment
Management
Total RBB,
Corporate
and Wealth
Half Year Ended 30.06.12 % % % % % % %
Customer asset margin 1.08 0.80 3.10 9.53 1.20 0.65 2.11
Customer liability margin 0.97 0.47 2.66 n/m 1.08 1.11 1.13
Non-customer generated margin 0.37 0.36 0.25 (0.73) 0.16 0.27 0.23
Net interest margin 1.39 1.08 3.18 8.81 1.29 1.25 1.89
Average customer assets (£m) 122,343 42,044 34,369 31,830 68,162 19,152 317,900
Average customer liabilities (£m) 110,540 15,523 22,345 n/m 80,758 48,246 277,412
Half Year Ended 31.12.11
Customer asset margin 1.18 0.82 2.89 9.47 1.40 0.78 2.15
Customer liability margin 0.90 0.90 2.91 n/m 0.99 1.05 1.12
Non-customer generated margin 0.50 0.54 0.52 0.02 0.31 0.39 0.42
Net interest margin 1.55 1.38 3.42 9.49 1.50 1.36 2.10
Average customer assets (£m) 120,015 44,133 35,992 31,155 71,027 18,045 320,367
Average customer liabilities (£m) 108,408 17,379 23,274 n/m 80,268 44,718 274,047
Half Year Ended 30.06.11
Customer asset margin 1.25 0.94 2.95 9.58 1.54 0.77 2.23
Customer liability margin 0.83 0.41 2.58 n/m 0.89 0.94 0.99
Non-customer generated margin 0.41 0.40 0.21 (0.18) 0.22 0.33 0.30
Net interest margin 1.46 1.18 3.02 9.39 1.42 1.22 1.97
Average customer assets (£m) 116,977 43,360 39,943 29,408 69,760 16,849 316,297
Average customer liabilities (£m) 107,007 18,029 23,914 n/m 74,430 43,994 267,374
Customer asset and liability margins reflect a year on year increase in the Group‟s internal funding rates, which are
based on the cost to the Group of alternative funding in the wholesale market. The increase in funding rates has had an
adverse impact to customer asset margins and a benefit to customer liability margins
The Group‟s internal funding rate prices intra-group funding and liquidity to appropriately give credit to businesses with
net surplus liquidity and to charge those businesses in need of wholesale funding at a rate that is driven by prevailing
market rates and includes a term premium. The objective is to price internal funding for assets and liabilities in line with
the cost of alternative funding, which ensures there is consistency between retail and wholesale sources
1 2011 comparatives have been revised to reflect certain corporate banking activities previously reported in Africa RBB which are now included within
Corporate Banking. Africa RBB comparatives have additionally been revised to include gross cheque advances and cheque deposits within average assets
and average liabilities respectively where these were previously reported net. The H1 11 net interest margin expressed as a percentage of average
customer assets only is therefore revised to 3.63% (previously reported as 3.64%).
Risk Management
Barclays PLC – 2012 Interim Results 36
Overview
Barclays has clear risk management objectives, and a well-established strategy and framework for managing risk. The
approach to identifying, assessing, controlling, reporting and managing risks is formalised in the Principal Risks
Framework. The framework, which groups risk into four Principal Risks categories, is unchanged in 2012. Further detail
on how these risks are managed may be found in the 2011 Annual Report and Accounts
The uncertainties currently associated with the Group‟s Principal Risks are described below:
Principal Risks and Associated Uncertainties1 Topics Covered Page
Funding Risk
Impact of Basel 3 as regulatory rules are finalised
Impacts on capital ratios of weak profit performance
Volatility in cost of funding due to economic uncertainty
Reduction in available depositor and wholesale funding
Changes in the value of local assets and liabilities due to the
potential exit of one or more countries from the Euro
Capital base, risk weighted assets,
balance sheet leverage and significant
regulatory changes
Liquidity pool and funding structure
Local Eurozone balance sheet funding
exposures
37
40
62
Credit Risk
Impact of potentially deteriorating sovereign credit quality,
particularly debt servicing and refinancing capability
Extent and sustainability of economic recovery, including
impact of austerity measures on the European economies
Increase in unemployment due to a weaker economy, fiscal
tightening and other measures
Impact of rising inflation and potential interest rate rises on
consumer debt affordability and corporate profitability
Possibility of further falls in residential property prices in the
US, UK, South Africa and Western Europe
Potential liquidity shortages increasing counterparty risks
Potential for large single name losses and deterioration in
specific sectors and geographies
Possible deterioration in remaining credit market exposures
Total assets by valuation basis and
underlying asset class
Loans and advances to customers and
banks
Impairment, potential credit risk loans
and coverage ratios
Retail credit risk
Wholesale credit risk
Investment Bank credit market
exposures
Group exposures to Eurozone
countries
Credit derivatives referencing
Eurozone sovereign debt
45
46
48
51
56
69
58
60
Market Risk
Reduced client activity leading to lower returns
Decreases in market liquidity due to economic uncertainty
Impact on income from uncertain interest and exchange rate
environment
Underperformance of pension asset returns
Analysis of market risk and, in
particular, Investment Bank‟s DvaR
Analysis of interest margins
Retirement benefit liabilities
70
35
81
Operational Risk
Implementation of strategic change and integration
programmes across the Group
Continued regulatory and change programmes, driven by the
global economic climate
Impact of new, wide ranging, legislation in various countries
coupled with a changing regulatory landscape
Increasingly litigious environment
The crisis management agenda and breadth of regulatory
change required in global financial institutions
Significant litigation matters
Significant competition and regulatory
matters which could lead to penalties
and/or the need for redress
83
87
1 The associated uncertainties may affect more than one Principal Risk.
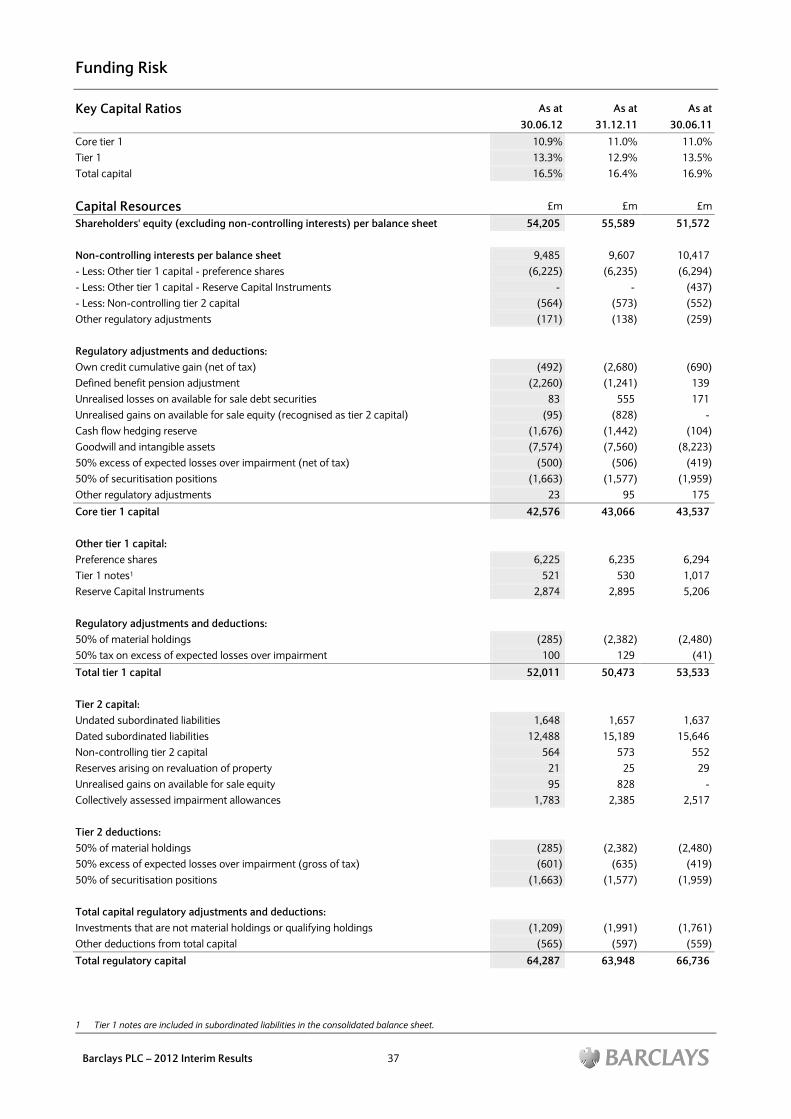
Funding Risk
Barclays PLC – 2012 Interim Results 37
Key Capital Ratios As at As at As at
30.06.12 31.12.11 30.06.11
Core tier 1 10.9% 11.0% 11.0%
Tier 1 13.3% 12.9% 13.5%
Total capital 16.5% 16.4% 16.9%
Capital Resources £m £m £m
Shareholders' equity (excluding non-controlling interests) per balance sheet 54,205 55,589 51,572
Non-controlling interests per balance sheet 9,485 9,607 10,417
- Less: Other tier 1 capital - preference shares (6,225) (6,235) (6,294)
- Less: Other tier 1 capital - Reserve Capital Instruments - - (437)
- Less: Non-controlling tier 2 capital (564) (573) (552)
Other regulatory adjustments (171) (138) (259)
Regulatory adjustments and deductions:
Own credit cumulative gain (net of tax) (492) (2,680) (690)
Defined benefit pension adjustment (2,260) (1,241) 139
Unrealised losses on available for sale debt securities 83 555 171
Unrealised gains on available for sale equity (recognised as tier 2 capital) (95) (828) -
Cash flow hedging reserve (1,676) (1,442) (104)
Goodwill and intangible assets (7,574) (7,560) (8,223)
50% excess of expected losses over impairment (net of tax) (500) (506) (419)
50% of securitisation positions (1,663) (1,577) (1,959)
Other regulatory adjustments 23 95 175
Core tier 1 capital 42,576 43,066 43,537
Other tier 1 capital:
Preference shares 6,225 6,235 6,294
Tier 1 notes1 521 530 1,017
Reserve Capital Instruments 2,874 2,895 5,206
Regulatory adjustments and deductions:
50% of material holdings (285) (2,382) (2,480)
50% tax on excess of expected losses over impairment 100 129 (41)
Total tier 1 capital 52,011 50,473 53,533
Tier 2 capital:
Undated subordinated liabilities 1,648 1,657 1,637
Dated subordinated liabilities 12,488 15,189 15,646
Non-controlling tier 2 capital 564 573 552
Reserves arising on revaluation of property 21 25 29
Unrealised gains on available for sale equity 95 828 -
Collectively assessed impairment allowances 1,783 2,385 2,517
Tier 2 deductions:
50% of material holdings (285) (2,382) (2,480)
50% excess of expected losses over impairment (gross of tax) (601) (635) (419)
50% of securitisation positions (1,663) (1,577) (1,959)
Total capital regulatory adjustments and deductions:
Investments that are not material holdings or qualifying holdings (1,209) (1,991) (1,761)
Other deductions from total capital (565) (597) (559)
Total regulatory capital 64,287 63,948 66,736
1 Tier 1 notes are included in subordinated liabilities in the consolidated balance sheet.
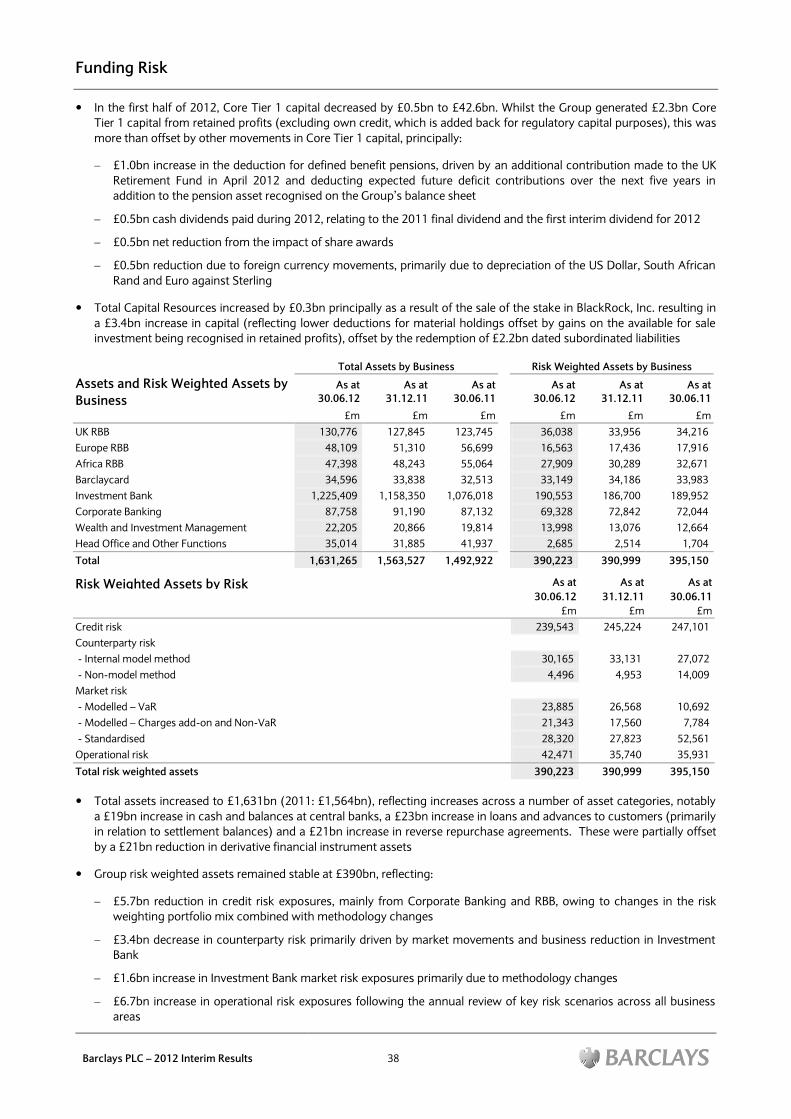
Funding Risk
Barclays PLC – 2012 Interim Results 38
In the first half of 2012, Core Tier 1 capital decreased by £0.5bn to £42.6bn. Whilst the Group generated £2.3bn Core
Tier 1 capital from retained profits (excluding own credit, which is added back for regulatory capital purposes), this was
more than offset by other movements in Core Tier 1 capital, principally:
£1.0bn increase in the deduction for defined benefit pensions, driven by an additional contribution made to the UK
Retirement Fund in April 2012 and deducting expected future deficit contributions over the next five years in
addition to the pension asset recognised on the Group‟s balance sheet
£0.5bn cash dividends paid during 2012, relating to the 2011 final dividend and the first interim dividend for 2012
£0.5bn net reduction from the impact of share awards
£0.5bn reduction due to foreign currency movements, primarily due to depreciation of the US Dollar, South African
Rand and Euro against Sterling
Total Capital Resources increased by £0.3bn principally as a result of the sale of the stake in BlackRock, Inc. resulting in
a £3.4bn increase in capital (reflecting lower deductions for material holdings offset by gains on the available for sale
investment being recognised in retained profits), offset by the redemption of £2.2bn dated subordinated liabilities
Total Assets by Business Risk Weighted Assets by Business
Assets and Risk Weighted Assets by
Business
As at
30.06.12
As at
31.12.11
As at
30.06.11
As at
30.06.12
As at
31.12.11
As at
30.06.11
£m £m £m £m £m £m
UK RBB 130,776 127,845 123,745 36,038 33,956 34,216
Europe RBB 48,109 51,310 56,699 16,563 17,436 17,916
Africa RBB 47,398 48,243 55,064 27,909 30,289 32,671
Barclaycard 34,596 33,838 32,513 33,149 34,186 33,983
Investment Bank 1,225,409 1,158,350 1,076,018 190,553 186,700 189,952
Corporate Banking 87,758 91,190 87,132 69,328 72,842 72,044
Wealth and Investment Management 22,205 20,866 19,814 13,998 13,076 12,664
Head Office and Other Functions 35,014 31,885 41,937 2,685 2,514 1,704
Total 1,631,265 1,563,527 1,492,922 390,223 390,999 395,150
Risk Weighted Assets by Risk
As at As at As at
30.06.12 31.12.11 30.06.11
£m £m £m
Credit risk 239,543 245,224 247,101
Counterparty risk
- Internal model method 30,165 33,131 27,072
- Non-model method 4,496 4,953 14,009
Market risk
- Modelled – VaR 23,885 26,568 10,692
- Modelled – Charges add-on and Non-VaR 21,343 17,560 7,784
- Standardised 28,320 27,823 52,561
Operational risk 42,471 35,740 35,931
Total risk weighted assets 390,223 390,999 395,150
Total assets increased to £1,631bn (2011: £1,564bn), reflecting increases across a number of asset categories, notably
a £19bn increase in cash and balances at central banks, a £23bn increase in loans and advances to customers (primarily
in relation to settlement balances) and a £21bn increase in reverse repurchase agreements. These were partially offset
by a £21bn reduction in derivative financial instrument assets
Group risk weighted assets remained stable at £390bn, reflecting:
£5.7bn reduction in credit risk exposures, mainly from Corporate Banking and RBB, owing to changes in the risk
weighting portfolio mix combined with methodology changes
£3.4bn decrease in counterparty risk primarily driven by market movements and business reduction in Investment
Bank
£1.6bn increase in Investment Bank market risk exposures primarily due to methodology changes
£6.7bn increase in operational risk exposures following the annual review of key risk scenarios across all business
areas
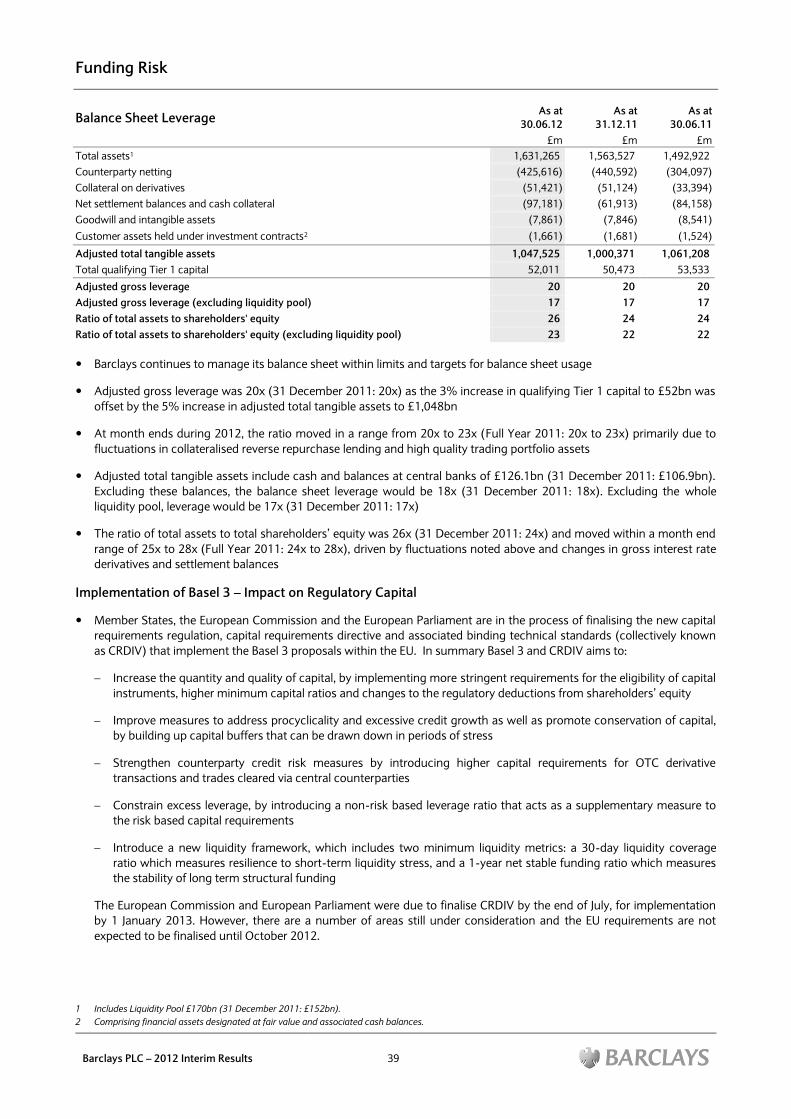
Funding Risk
Barclays PLC – 2012 Interim Results 39
Balance Sheet Leverage As at
30.06.12
As at
31.12.11
As at
30.06.11
£m £m £m
Total assets1 1,631,265 1,563,527 1,492,922
Counterparty netting (425,616) (440,592) (304,097)
Collateral on derivatives (51,421) (51,124) (33,394)
Net settlement balances and cash collateral (97,181) (61,913) (84,158)
Goodwill and intangible assets (7,861) (7,846) (8,541)
Customer assets held under investment contracts2 (1,661) (1,681) (1,524)
Adjusted total tangible assets 1,047,525 1,000,371 1,061,208
Total qualifying Tier 1 capital 52,011 50,473 53,533
Adjusted gross leverage 20 20 20
Adjusted gross leverage (excluding liquidity pool) 17 17 17
Ratio of total assets to shareholders' equity 26 24 24
Ratio of total assets to shareholders' equity (excluding liquidity pool) 23 22 22
Barclays continues to manage its balance sheet within limits and targets for balance sheet usage
Adjusted gross leverage was 20x (31 December 2011: 20x) as the 3% increase in qualifying Tier 1 capital to £52bn was
offset by the 5% increase in adjusted total tangible assets to £1,048bn
At month ends during 2012, the ratio moved in a range from 20x to 23x (Full Year 2011: 20x to 23x) primarily due to
fluctuations in collateralised reverse repurchase lending and high quality trading portfolio assets
Adjusted total tangible assets include cash and balances at central banks of £126.1bn (31 December 2011: £106.9bn).
Excluding these balances, the balance sheet leverage would be 18x (31 December 2011: 18x). Excluding the whole
liquidity pool, leverage would be 17x (31 December 2011: 17x)
The ratio of total assets to total shareholders‟ equity was 26x (31 December 2011: 24x) and moved within a month end
range of 25x to 28x (Full Year 2011: 24x to 28x), driven by fluctuations noted above and changes in gross interest rate
derivatives and settlement balances
Implementation of Basel 3 – Impact on Regulatory Capital
Member States, the European Commission and the European Parliament are in the process of finalising the new capital
requirements regulation, capital requirements directive and associated binding technical standards (collectively known
as CRDIV) that implement the Basel 3 proposals within the EU. In summary Basel 3 and CRDIV aims to:
Increase the quantity and quality of capital, by implementing more stringent requirements for the eligibility of capital
instruments, higher minimum capital ratios and changes to the regulatory deductions from shareholders‟ equity
Improve measures to address procyclicality and excessive credit growth as well as promote conservation of capital,
by building up capital buffers that can be drawn down in periods of stress
Strengthen counterparty credit risk measures by introducing higher capital requirements for OTC derivative
transactions and trades cleared via central counterparties
Constrain excess leverage, by introducing a non-risk based leverage ratio that acts as a supplementary measure to
the risk based capital requirements
Introduce a new liquidity framework, which includes two minimum liquidity metrics: a 30-day liquidity coverage
ratio which measures resilience to short-term liquidity stress, and a 1-year net stable funding ratio which measures
the stability of long term structural funding
The European Commission and European Parliament were due to finalise CRDIV by the end of July, for implementation
by 1 January 2013. However, there are a number of areas still under consideration and the EU requirements are not
expected to be finalised until October 2012.
1 Includes Liquidity Pool £170bn (31 December 2011: £152bn).
2 Comprising financial assets designated at fair value and associated cash balances.
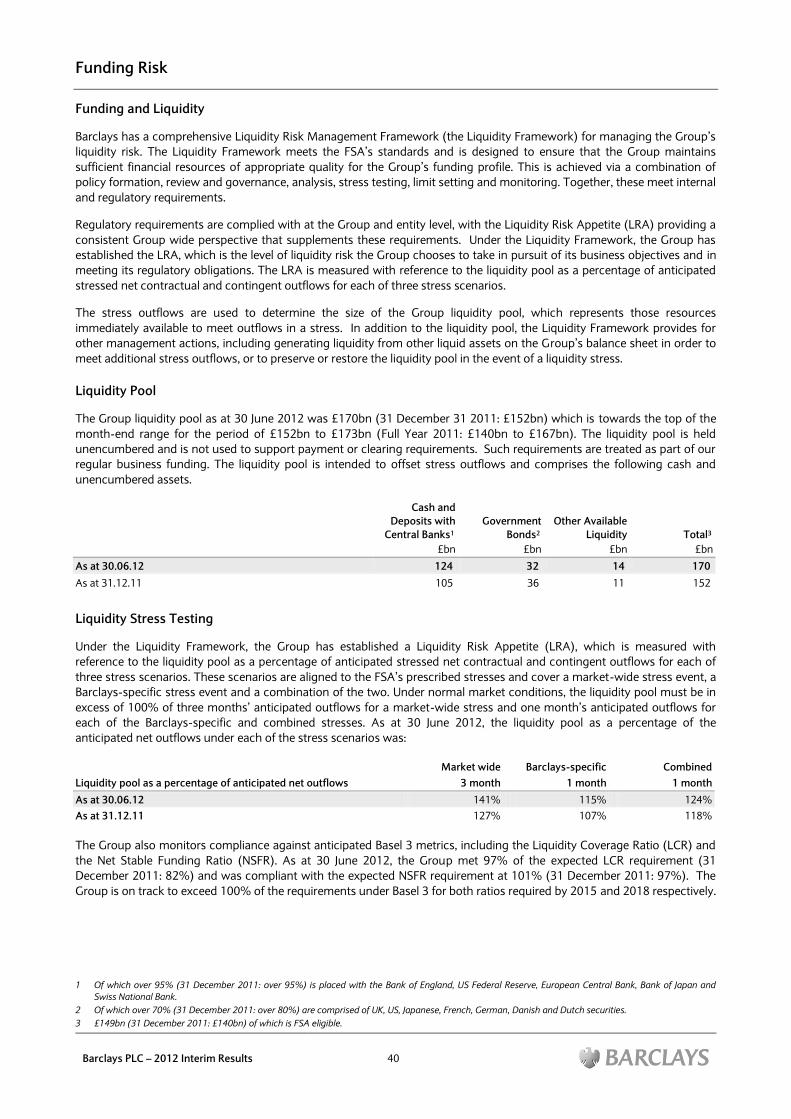
Funding Risk
Barclays PLC – 2012 Interim Results 40
Funding and Liquidity
Barclays has a comprehensive Liquidity Risk Management Framework (the Liquidity Framework) for managing the Group‟s
liquidity risk. The Liquidity Framework meets the FSA‟s standards and is designed to ensure that the Group maintains
sufficient financial resources of appropriate quality for the Group‟s funding profile. This is achieved via a combination of
policy formation, review and governance, analysis, stress testing, limit setting and monitoring. Together, these meet internal
and regulatory requirements.
Regulatory requirements are complied with at the Group and entity level, with the Liquidity Risk Appetite (LRA) providing a
consistent Group wide perspective that supplements these requirements. Under the Liquidity Framework, the Group has
established the LRA, which is the level of liquidity risk the Group chooses to take in pursuit of its business objectives and in
meeting its regulatory obligations. The LRA is measured with reference to the liquidity pool as a percentage of anticipated
stressed net contractual and contingent outflows for each of three stress scenarios.
The stress outflows are used to determine the size of the Group liquidity pool, which represents those resources
immediately available to meet outflows in a stress. In addition to the liquidity pool, the Liquidity Framework provides for
other management actions, including generating liquidity from other liquid assets on the Group‟s balance sheet in order to
meet additional stress outflows, or to preserve or restore the liquidity pool in the event of a liquidity stress.
Liquidity Pool
The Group liquidity pool as at 30 June 2012 was £170bn (31 December 31 2011: £152bn) which is towards the top of the
month-end range for the period of £152bn to £173bn (Full Year 2011: £140bn to £167bn). The liquidity pool is held
unencumbered and is not used to support payment or clearing requirements. Such requirements are treated as part of our
regular business funding. The liquidity pool is intended to offset stress outflows and comprises the following cash and
unencumbered assets.
Cash and
Deposits with
Central Banks1
Government
Bonds2
Other Available
Liquidity Total3
£bn £bn £bn £bn
As at 30.06.12 124 32 14 170
As at 31.12.11 105 36 11 152
Liquidity Stress Testing
Under the Liquidity Framework, the Group has established a Liquidity Risk Appetite (LRA), which is measured with
reference to the liquidity pool as a percentage of anticipated stressed net contractual and contingent outflows for each of
three stress scenarios. These scenarios are aligned to the FSA‟s prescribed stresses and cover a market-wide stress event, a
Barclays-specific stress event and a combination of the two. Under normal market conditions, the liquidity pool must be in
excess of 100% of three months‟ anticipated outflows for a market-wide stress and one month‟s anticipated outflows for
each of the Barclays-specific and combined stresses. As at 30 June 2012, the liquidity pool as a percentage of the
anticipated net outflows under each of the stress scenarios was:
Market wide Barclays-specific Combined
Liquidity pool as a percentage of anticipated net outflows 3 month 1 month 1 month
As at 30.06.12 141% 115% 124%
As at 31.12.11 127% 107% 118%
The Group also monitors compliance against anticipated Basel 3 metrics, including the Liquidity Coverage Ratio (LCR) and
the Net Stable Funding Ratio (NSFR). As at 30 June 2012, the Group met 97% of the expected LCR requirement (31
December 2011: 82%) and was compliant with the expected NSFR requirement at 101% (31 December 2011: 97%). The
Group is on track to exceed 100% of the requirements under Basel 3 for both ratios required by 2015 and 2018 respectively.
1 Of which over 95% (31 December 2011: over 95%) is placed with the Bank of England, US Federal Reserve, European Central Bank, Bank of Japan and
Swiss National Bank.
2 Of which over 70% (31 December 2011: over 80%) are comprised of UK, US, Japanese, French, German, Danish and Dutch securities.
3 £149bn (31 December 2011: £140bn) of which is FSA eligible.
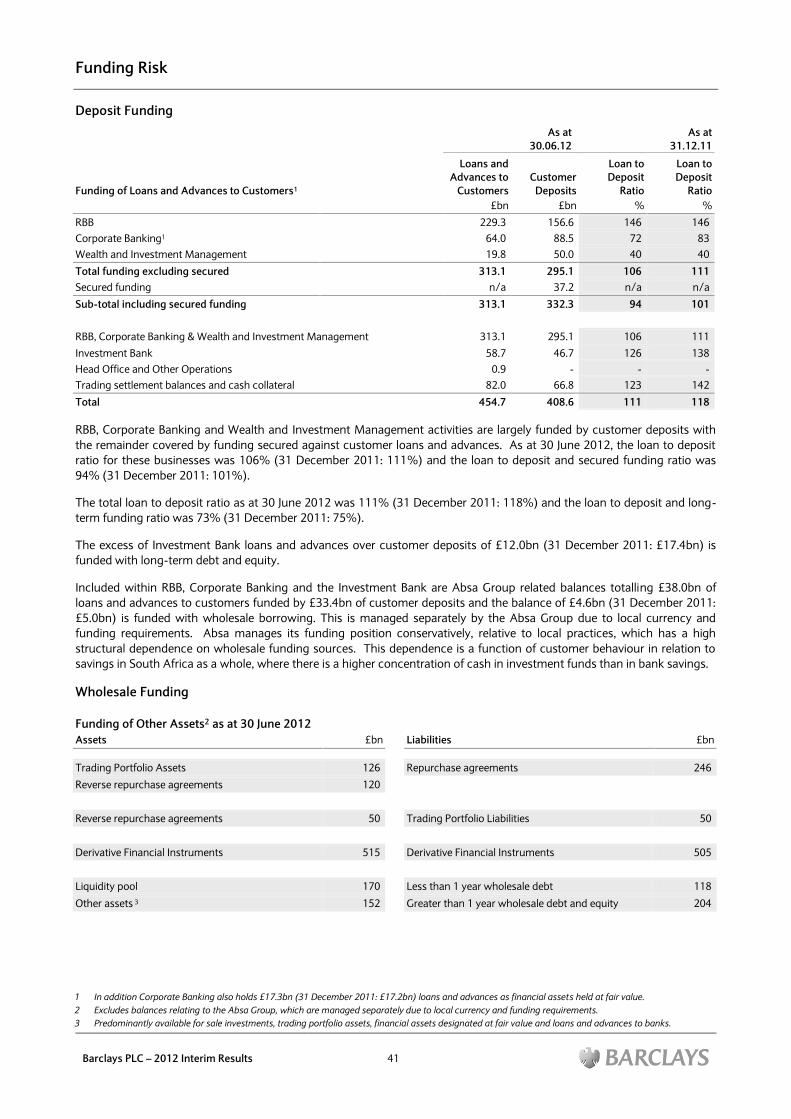
Funding Risk
Barclays PLC – 2012 Interim Results 41
Deposit Funding
As at
30.06.12 As at
31.12.11
Funding of Loans and Advances to Customers1
Loans and
Advances to
Customers
Customer
Deposits
Loan to
Deposit
Ratio
Loan to
Deposit
Ratio
£bn £bn % %
RBB 229.3 156.6 146 146
Corporate Banking1 64.0 88.5 72 83
Wealth and Investment Management 19.8 50.0 40 40
Total funding excluding secured 313.1 295.1 106 111
Secured funding n/a 37.2 n/a n/a
Sub-total including secured funding 313.1 332.3 94 101
RBB, Corporate Banking & Wealth and Investment Management 313.1 295.1 106 111
Investment Bank 58.7 46.7 126 138
Head Office and Other Operations 0.9 - - -
Trading settlement balances and cash collateral 82.0 66.8 123 142
Total 454.7 408.6 111 118
RBB, Corporate Banking and Wealth and Investment Management activities are largely funded by customer deposits with
the remainder covered by funding secured against customer loans and advances. As at 30 June 2012, the loan to deposit
ratio for these businesses was 106% (31 December 2011: 111%) and the loan to deposit and secured funding ratio was
94% (31 December 2011: 101%).
The total loan to deposit ratio as at 30 June 2012 was 111% (31 December 2011: 118%) and the loan to deposit and long-
term funding ratio was 73% (31 December 2011: 75%).
The excess of Investment Bank loans and advances over customer deposits of £12.0bn (31 December 2011: £17.4bn) is
funded with long-term debt and equity.
Included within RBB, Corporate Banking and the Investment Bank are Absa Group related balances totalling £38.0bn of
loans and advances to customers funded by £33.4bn of customer deposits and the balance of £4.6bn (31 December 2011:
£5.0bn) is funded with wholesale borrowing. This is managed separately by the Absa Group due to local currency and
funding requirements. Absa manages its funding position conservatively, relative to local practices, which has a high
structural dependence on wholesale funding sources. This dependence is a function of customer behaviour in relation to
savings in South Africa as a whole, where there is a higher concentration of cash in investment funds than in bank savings.
Wholesale Funding
Funding of Other Assets2 as at 30 June 2012
Assets £bn Liabilities £bn
Trading Portfolio Assets 126 Repurchase agreements 246
Reverse repurchase agreements 120
Reverse repurchase agreements 50 Trading Portfolio Liabilities 50
Derivative Financial Instruments 515 Derivative Financial Instruments 505
Liquidity pool 170 Less than 1 year wholesale debt 118
Other assets 3 152 Greater than 1 year wholesale debt and equity 204
1 In addition Corporate Banking also holds £17.3bn (31 December 2011: £17.2bn) loans and advances as financial assets held at fair value.
2 Excludes balances relating to the Absa Group, which are managed separately due to local currency and funding requirements.
3 Predominantly available for sale investments, trading portfolio assets, financial assets designated at fair value and loans and advances to banks.
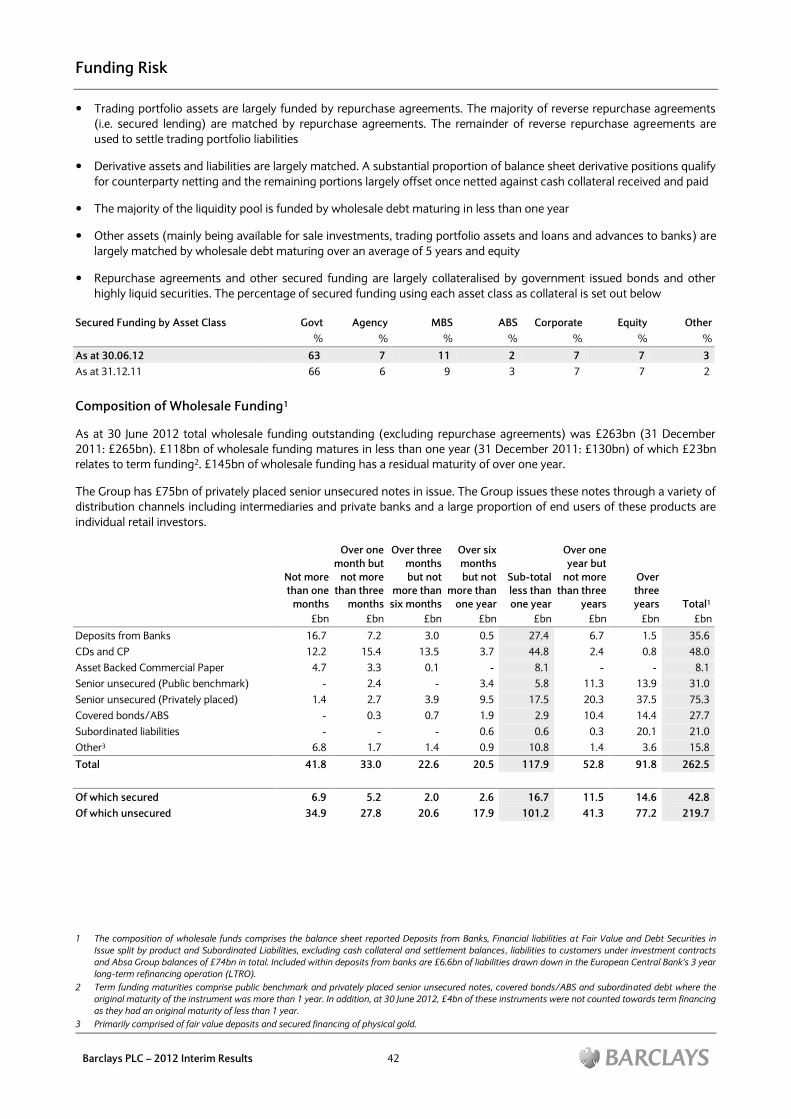
Funding Risk
Barclays PLC – 2012 Interim Results 42
Trading portfolio assets are largely funded by repurchase agreements. The majority of reverse repurchase agreements
(i.e. secured lending) are matched by repurchase agreements. The remainder of reverse repurchase agreements are
used to settle trading portfolio liabilities
Derivative assets and liabilities are largely matched. A substantial proportion of balance sheet derivative positions qualify
for counterparty netting and the remaining portions largely offset once netted against cash collateral received and paid
The majority of the liquidity pool is funded by wholesale debt maturing in less than one year
Other assets (mainly being available for sale investments, trading portfolio assets and loans and advances to banks) are
largely matched by wholesale debt maturing over an average of 5 years and equity
Repurchase agreements and other secured funding are largely collateralised by government issued bonds and other
highly liquid securities. The percentage of secured funding using each asset class as collateral is set out below
Secured Funding by Asset Class Govt Agency MBS ABS Corporate Equity Other
% % % % % % %
As at 30.06.12 63 7 11 2 7 7 3
As at 31.12.11 66 6 9 3 7 7 2
Composition of Wholesale Funding1
As at 30 June 2012 total wholesale funding outstanding (excluding repurchase agreements) was £263bn (31 December
2011: £265bn). £118bn of wholesale funding matures in less than one year (31 December 2011: £130bn) of which £23bn
relates to term funding2. £145bn of wholesale funding has a residual maturity of over one year.
The Group has £75bn of privately placed senior unsecured notes in issue. The Group issues these notes through a variety of
distribution channels including intermediaries and private banks and a large proportion of end users of these products are
individual retail investors.
Not more
than one
months
Over one
month but
not more
than three
months
Over three
months
but not
more than
six months
Over six
months
but not
more than
one year
Sub-total
less than
one year
Over one
year but
not more
than three
years
Over
three
years Total1
£bn £bn £bn £bn £bn £bn £bn £bn
Deposits from Banks 16.7 7.2 3.0 0.5 27.4 6.7 1.5 35.6
CDs and CP 12.2 15.4 13.5 3.7 44.8 2.4 0.8 48.0
Asset Backed Commercial Paper 4.7 3.3 0.1 - 8.1 - - 8.1
Senior unsecured (Public benchmark) - 2.4 - 3.4 5.8 11.3 13.9 31.0
Senior unsecured (Privately placed) 1.4 2.7 3.9 9.5 17.5 20.3 37.5 75.3
Covered bonds/ABS - 0.3 0.7 1.9 2.9 10.4 14.4 27.7
Subordinated liabilities - - - 0.6 0.6 0.3 20.1 21.0
Other3 6.8 1.7 1.4 0.9 10.8 1.4 3.6 15.8
Total 41.8 33.0 22.6 20.5 117.9 52.8 91.8 262.5
Of which secured 6.9 5.2 2.0 2.6 16.7 11.5 14.6 42.8
Of which unsecured 34.9 27.8 20.6 17.9 101.2 41.3 77.2 219.7
1 The composition of wholesale funds comprises the balance sheet reported Deposits from Banks, Financial liabilities at Fair Value and Debt Securities in
Issue split by product and Subordinated Liabilities, excluding cash collateral and settlement balances, liabilities to customers under investment contracts
and Absa Group balances of £74bn in total. Included within deposits from banks are £6.6bn of liabilities drawn down in the European Central Bank's 3 year
long-term refinancing operation (LTRO).
2 Term funding maturities comprise public benchmark and privately placed senior unsecured notes, covered bonds/ABS and subordinated debt where the
original maturity of the instrument was more than 1 year. In addition, at 30 June 2012, £4bn of these instruments were not counted towards term financing
as they had an original maturity of less than 1 year.
3 Primarily comprised of fair value deposits and secured financing of physical gold.
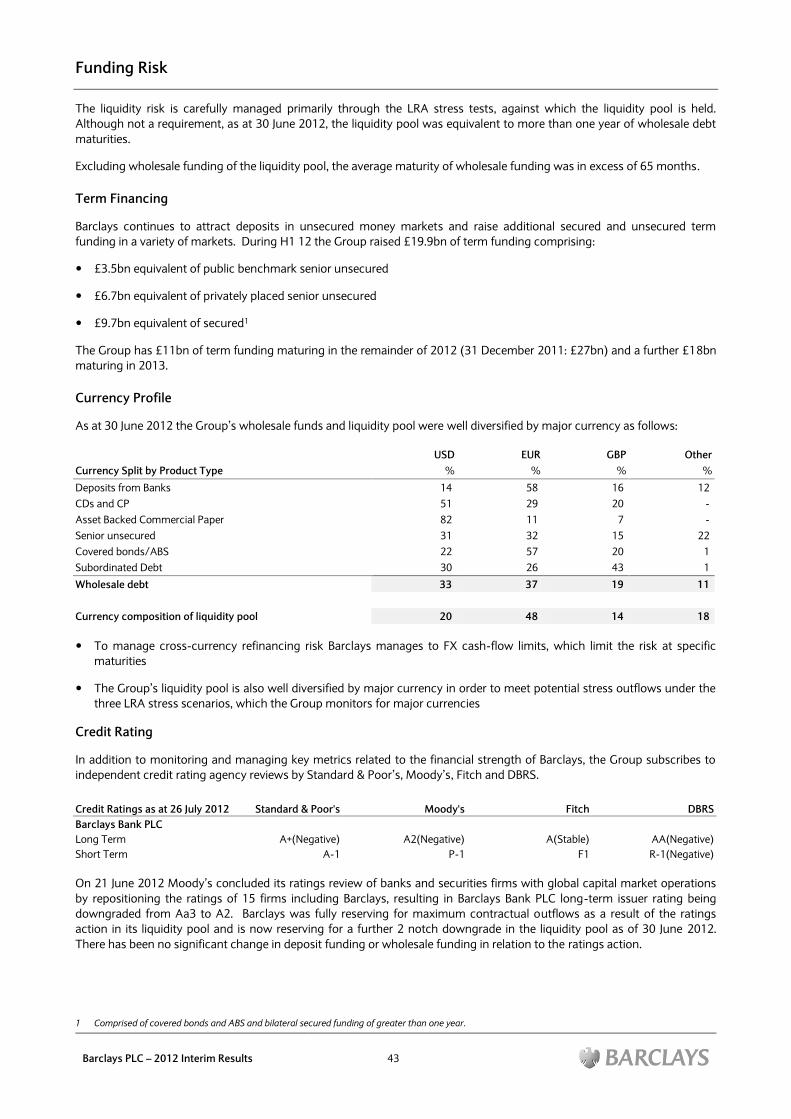
Funding Risk
Barclays PLC – 2012 Interim Results 43
The liquidity risk is carefully managed primarily through the LRA stress tests, against which the liquidity pool is held.
Although not a requirement, as at 30 June 2012, the liquidity pool was equivalent to more than one year of wholesale debt
maturities.
Excluding wholesale funding of the liquidity pool, the average maturity of wholesale funding was in excess of 65 months.
Term Financing
Barclays continues to attract deposits in unsecured money markets and raise additional secured and unsecured term
funding in a variety of markets. During H1 12 the Group raised £19.9bn of term funding comprising:
£3.5bn equivalent of public benchmark senior unsecured
£6.7bn equivalent of privately placed senior unsecured
£9.7bn equivalent of secured1
The Group has £11bn of term funding maturing in the remainder of 2012 (31 December 2011: £27bn) and a further £18bn
maturing in 2013.
Currency Profile
As at 30 June 2012 the Group‟s wholesale funds and liquidity pool were well diversified by major currency as follows:
USD EUR GBP Other
Currency Split by Product Type % % % %
Deposits from Banks 14 58 16 12
CDs and CP 51 29 20 -
Asset Backed Commercial Paper 82 11 7 -
Senior unsecured 31 32 15 22
Covered bonds/ABS 22 57 20 1
Subordinated Debt 30 26 43 1
Wholesale debt 33 37 19 11
Currency composition of liquidity pool 20 48 14 18
To manage cross-currency refinancing risk Barclays manages to FX cash-flow limits, which limit the risk at specific
maturities
The Group‟s liquidity pool is also well diversified by major currency in order to meet potential stress outflows under the
three LRA stress scenarios, which the Group monitors for major currencies
Credit Rating
In addition to monitoring and managing key metrics related to the financial strength of Barclays, the Group subscribes to
independent credit rating agency reviews by Standard & Poor‟s, Moody‟s, Fitch and DBRS.
Credit Ratings as at 26 July 2012 Standard & Poor's Moody's Fitch DBRS
Barclays Bank PLC
Long Term A+(Negative) A2(Negative) A(Stable) AA(Negative)
Short Term A-1 P-1 F1 R-1(Negative)
On 21 June 2012 Moody‟s concluded its ratings review of banks and securities firms with global capital market operations
by repositioning the ratings of 15 firms including Barclays, resulting in Barclays Bank PLC long-term issuer rating being
downgraded from Aa3 to A2. Barclays was fully reserving for maximum contractual outflows as a result of the ratings
action in its liquidity pool and is now reserving for a further 2 notch downgrade in the liquidity pool as of 30 June 2012.
There has been no significant change in deposit funding or wholesale funding in relation to the ratings action.
1 Comprised of covered bonds and ABS and bilateral secured funding of greater than one year.

Funding Risk
Barclays PLC – 2012 Interim Results 44
Further credit rating downgrades could result in contractual outflows to meet collateral requirements on existing contracts.
The below table shows contractual collateral requirements following one and two notch long-term and associated short-
term simultaneous downgrades across all credit rating agencies, which are fully reserved for in the liquidity pool. These
numbers do not assume any management or restructuring actions that could be taken to reduce posting requirements.
These outflows do not include the potential liquidity impact from loss of unsecured funding, such as from money market
funds, or loss of secured funding capacity. However, unsecured and secured funding stresses are included in the LRA stress
scenarios and a portion of the liquidity pool is held against these risks.
Credit ratings downgrades could also result in increased costs or reduced capacity to raise funding.
Contractual credit rating downgrade exposure Cumulative cash outflow
1 notch long-term and associated short-term downgrade
£11bn
2 notch long-term and associated short-term downgrade
£20bn
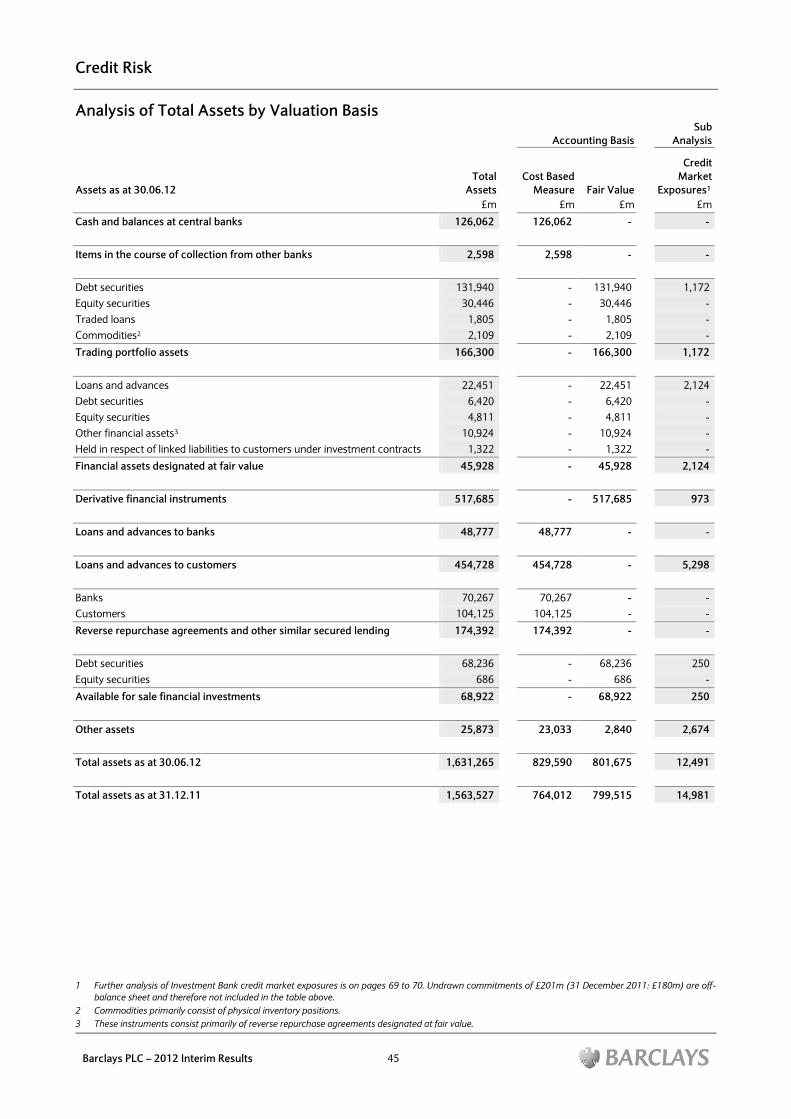
Credit Risk
Barclays PLC – 2012 Interim Results 45
Analysis of Total Assets by Valuation Basis
Accounting Basis
Sub
Analysis
Assets as at 30.06.12
Total
Assets
Cost Based
Measure Fair Value
Credit
Market
Exposures1
£m £m £m £m
Cash and balances at central banks 126,062 126,062 - -
Items in the course of collection from other banks 2,598 2,598 - -
Debt securities 131,940 - 131,940 1,172
Equity securities 30,446 - 30,446 -
Traded loans 1,805 - 1,805 -
Commodities2 2,109 - 2,109 -
Trading portfolio assets 166,300 - 166,300 1,172
Loans and advances 22,451 - 22,451 2,124
Debt securities 6,420 - 6,420 -
Equity securities 4,811 - 4,811 -
Other financial assets3 10,924 - 10,924 -
Held in respect of linked liabilities to customers under investment contracts 1,322 - 1,322 -
Financial assets designated at fair value 45,928 - 45,928 2,124
Derivative financial instruments 517,685 - 517,685 973
Loans and advances to banks 48,777 48,777 - -
Loans and advances to customers 454,728 454,728 - 5,298
Banks 70,267 70,267 - -
Customers 104,125 104,125 - -
Reverse repurchase agreements and other similar secured lending 174,392 174,392 - -
Debt securities 68,236 - 68,236 250
Equity securities 686 - 686 -
Available for sale financial investments 68,922 - 68,922 250
Other assets 25,873 23,033 2,840 2,674
Total assets as at 30.06.12 1,631,265 829,590 801,675 12,491
Total assets as at 31.12.11 1,563,527 764,012 799,515 14,981
1 Further analysis of Investment Bank credit market exposures is on pages 69 to 70. Undrawn commitments of £201m (31 December 2011: £180m) are off-
balance sheet and therefore not included in the table above.
2 Commodities primarily consist of physical inventory positions.
3 These instruments consist primarily of reverse repurchase agreements designated at fair value.
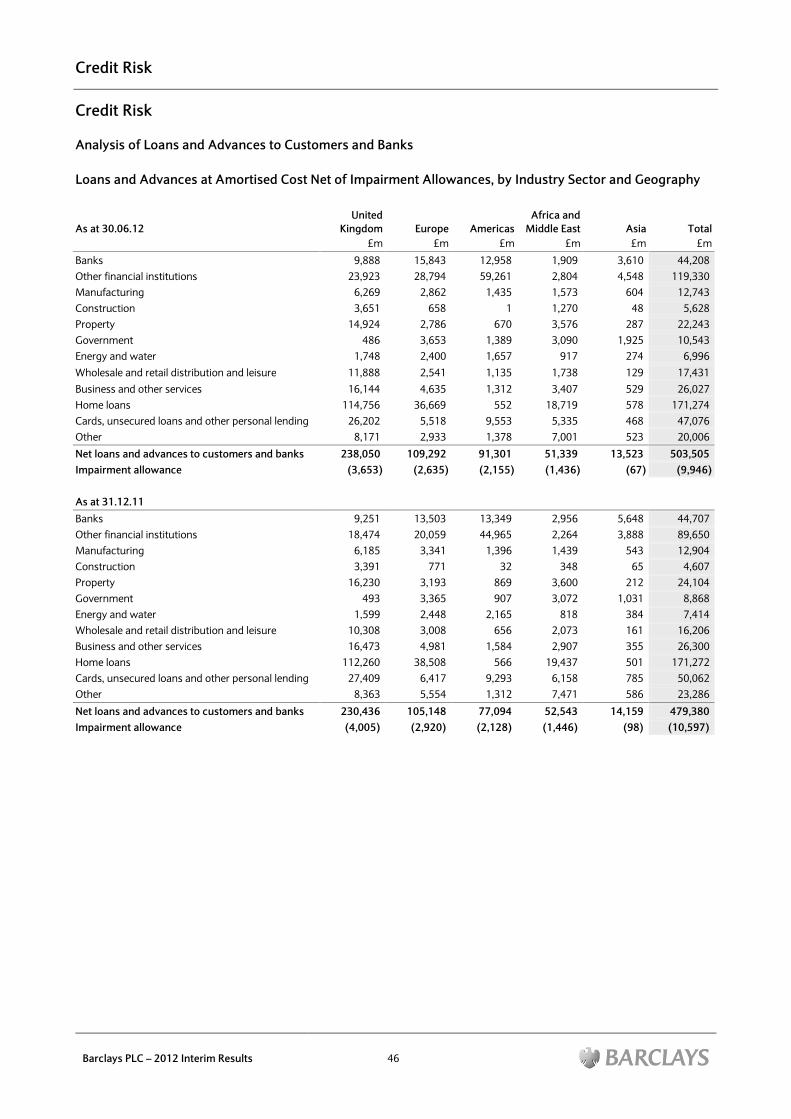
Credit Risk
Barclays PLC – 2012 Interim Results 46
Credit Risk
Analysis of Loans and Advances to Customers and Banks
Loans and Advances at Amortised Cost Net of Impairment Allowances, by Industry Sector and Geography
As at 30.06.12
United
Kingdom Europe Americas
Africa and
Middle East Asia Total
£m £m £m £m £m £m
Banks 9,888 15,843 12,958 1,909 3,610 44,208
Other financial institutions 23,923 28,794 59,261 2,804 4,548 119,330
Manufacturing 6,269 2,862 1,435 1,573 604 12,743
Construction 3,651 658 1 1,270 48 5,628
Property 14,924 2,786 670 3,576 287 22,243
Government 486 3,653 1,389 3,090 1,925 10,543
Energy and water 1,748 2,400 1,657 917 274 6,996
Wholesale and retail distribution and leisure 11,888 2,541 1,135 1,738 129 17,431
Business and other services 16,144 4,635 1,312 3,407 529 26,027
Home loans 114,756 36,669 552 18,719 578 171,274
Cards, unsecured loans and other personal lending 26,202 5,518 9,553 5,335 468 47,076
Other 8,171 2,933 1,378 7,001 523 20,006
Net loans and advances to customers and banks 238,050 109,292 91,301 51,339 13,523 503,505
Impairment allowance (3,653) (2,635) (2,155) (1,436) (67) (9,946)
As at 31.12.11
Banks 9,251 13,503 13,349 2,956 5,648 44,707
Other financial institutions 18,474 20,059 44,965 2,264 3,888 89,650
Manufacturing 6,185 3,341 1,396 1,439 543 12,904
Construction 3,391 771 32 348 65 4,607
Property 16,230 3,193 869 3,600 212 24,104
Government 493 3,365 907 3,072 1,031 8,868
Energy and water 1,599 2,448 2,165 818 384 7,414
Wholesale and retail distribution and leisure 10,308 3,008 656 2,073 161 16,206
Business and other services 16,473 4,981 1,584 2,907 355 26,300
Home loans 112,260 38,508 566 19,437 501 171,272
Cards, unsecured loans and other personal lending 27,409 6,417 9,293 6,158 785 50,062
Other 8,363 5,554 1,312 7,471 586 23,286
Net loans and advances to customers and banks 230,436 105,148 77,094 52,543 14,159 479,380
Impairment allowance (4,005) (2,920) (2,128) (1,446) (98) (10,597)
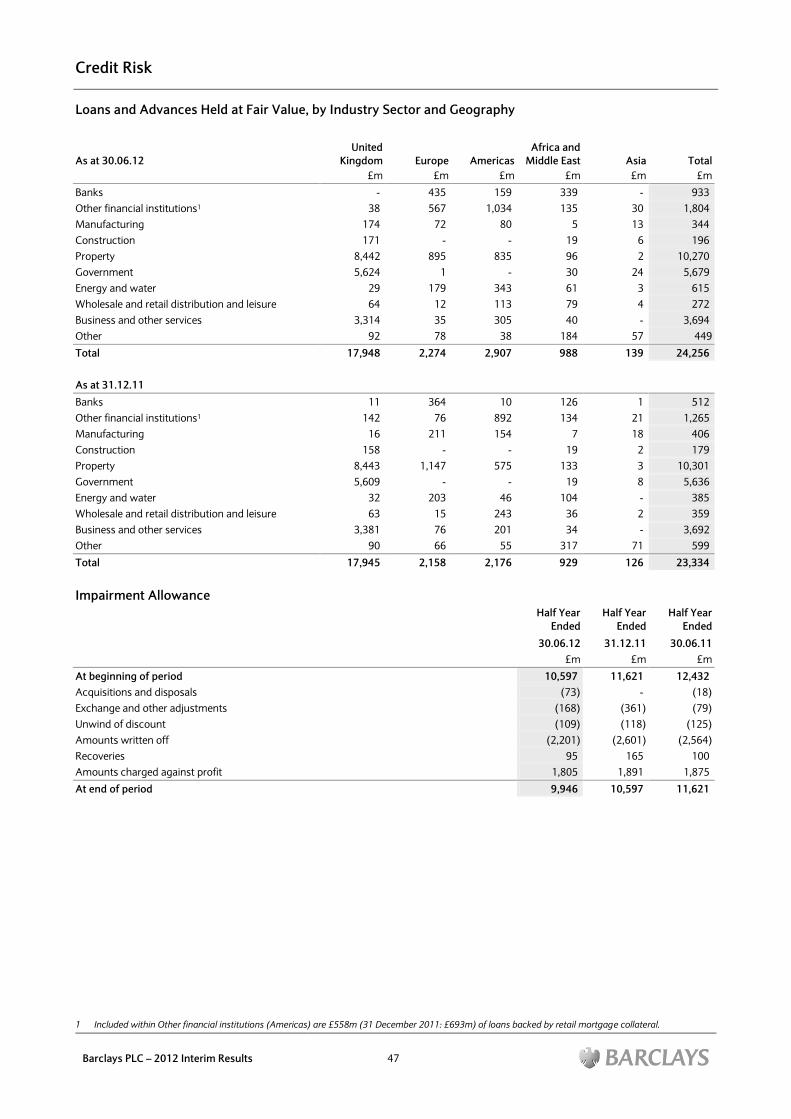
Credit Risk
Barclays PLC – 2012 Interim Results 47
Loans and Advances Held at Fair Value, by Industry Sector and Geography
As at 30.06.12
United
Kingdom Europe Americas
Africa and
Middle East Asia Total
£m £m £m £m £m £m
Banks - 435 159 339 - 933
Other financial institutions1 38 567 1,034 135 30 1,804
Manufacturing 174 72 80 5 13 344
Construction 171 - - 19 6 196
Property 8,442 895 835 96 2 10,270
Government 5,624 1 - 30 24 5,679
Energy and water 29 179 343 61 3 615
Wholesale and retail distribution and leisure 64 12 113 79 4 272
Business and other services 3,314 35 305 40 - 3,694
Other 92 78 38 184 57 449
Total 17,948 2,274 2,907 988 139 24,256
As at 31.12.11
Banks 11 364 10 126 1 512
Other financial institutions1 142 76 892 134 21 1,265
Manufacturing 16 211 154 7 18 406
Construction 158 - - 19 2 179
Property 8,443 1,147 575 133 3 10,301
Government 5,609 - - 19 8 5,636
Energy and water 32 203 46 104 - 385
Wholesale and retail distribution and leisure 63 15 243 36 2 359
Business and other services 3,381 76 201 34 - 3,692
Other 90 66 55 317 71 599
Total 17,945 2,158 2,176 929 126 23,334
Impairment Allowance
Half Year
Ended
Half Year
Ended
Half Year
Ended
30.06.12 31.12.11 30.06.11
£m £m £m
At beginning of period 10,597 11,621 12,432
Acquisitions and disposals (73) - (18)
Exchange and other adjustments (168) (361) (79)
Unwind of discount (109) (118) (125)
Amounts written off (2,201) (2,601) (2,564)
Recoveries 95 165 100
Amounts charged against profit 1,805 1,891 1,875
At end of period 9,946 10,597 11,621
1 Included within Other financial institutions (Americas) are £558m (31 December 2011: £693m) of loans backed by retail mortgage collateral.
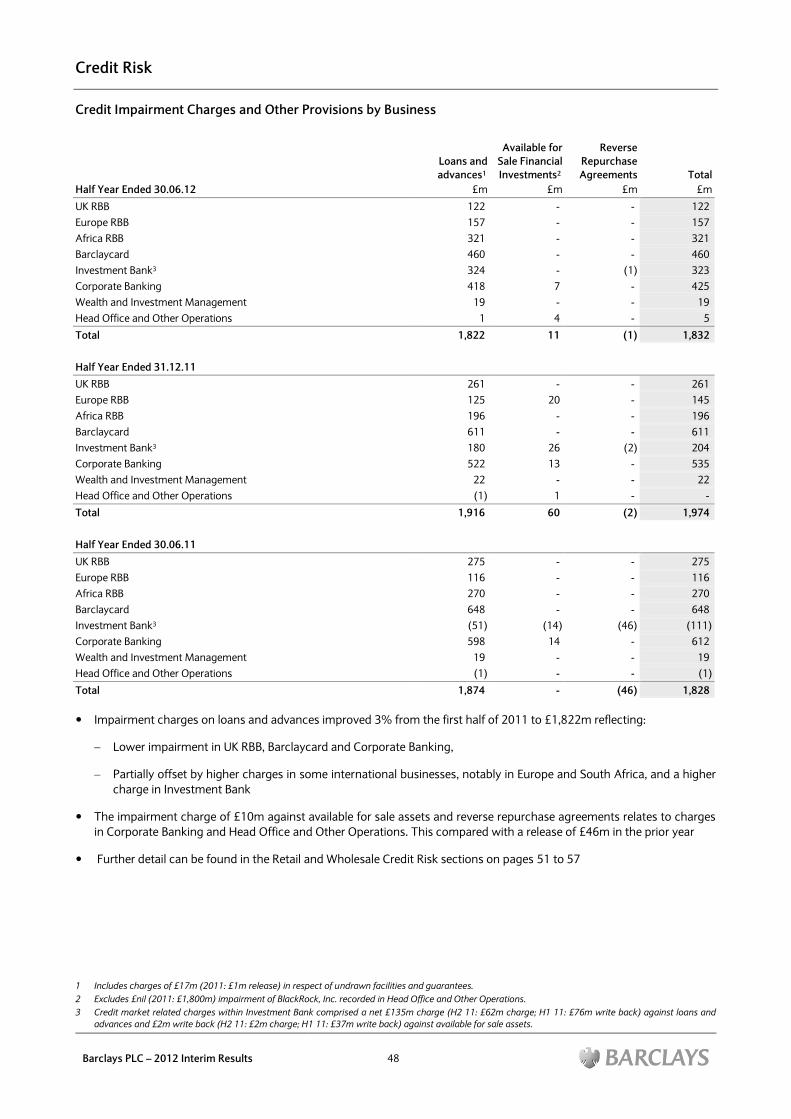
Credit Risk
Barclays PLC – 2012 Interim Results 48
Credit Impairment Charges and Other Provisions by Business
Loans and
advances1
Available for
Sale Financial
Investments2
Reverse
Repurchase
Agreements Total
Half Year Ended 30.06.12 £m £m £m £m
UK RBB 122 - - 122
Europe RBB 157 - - 157
Africa RBB 321 - - 321
Barclaycard 460 - - 460
Investment Bank3 324 - (1) 323
Corporate Banking 418 7 - 425
Wealth and Investment Management 19 - - 19
Head Office and Other Operations 1 4 - 5
Total 1,822 11 (1) 1,832
Half Year Ended 31.12.11
UK RBB 261 - - 261
Europe RBB 125 20 - 145
Africa RBB 196 - - 196
Barclaycard 611 - - 611
Investment Bank3 180 26 (2) 204
Corporate Banking 522 13 - 535
Wealth and Investment Management 22 - - 22
Head Office and Other Operations (1) 1 - -
Total 1,916 60 (2) 1,974
Half Year Ended 30.06.11
UK RBB 275 - - 275
Europe RBB 116 - - 116
Africa RBB 270 - - 270
Barclaycard 648 - - 648
Investment Bank3 (51) (14) (46) (111)
Corporate Banking 598 14 - 612
Wealth and Investment Management 19 - - 19
Head Office and Other Operations (1) - - (1)
Total 1,874 - (46) 1,828
Impairment charges on loans and advances improved 3% from the first half of 2011 to £1,822m reflecting:
Lower impairment in UK RBB, Barclaycard and Corporate Banking,
Partially offset by higher charges in some international businesses, notably in Europe and South Africa, and a higher
charge in Investment Bank
The impairment charge of £10m against available for sale assets and reverse repurchase agreements relates to charges
in Corporate Banking and Head Office and Other Operations. This compared with a release of £46m in the prior year
Further detail can be found in the Retail and Wholesale Credit Risk sections on pages 51 to 57
1 Includes charges of £17m (2011: £1m release) in respect of undrawn facilities and guarantees.
2 Excludes £nil (2011: £1,800m) impairment of BlackRock, Inc. recorded in Head Office and Other Operations.
3 Credit market related charges within Investment Bank comprised a net £135m charge (H2 11: £62m charge; H1 11: £76m write back) against loans and
advances and £2m write back (H2 11: £2m charge; H1 11: £37m write back) against available for sale assets.
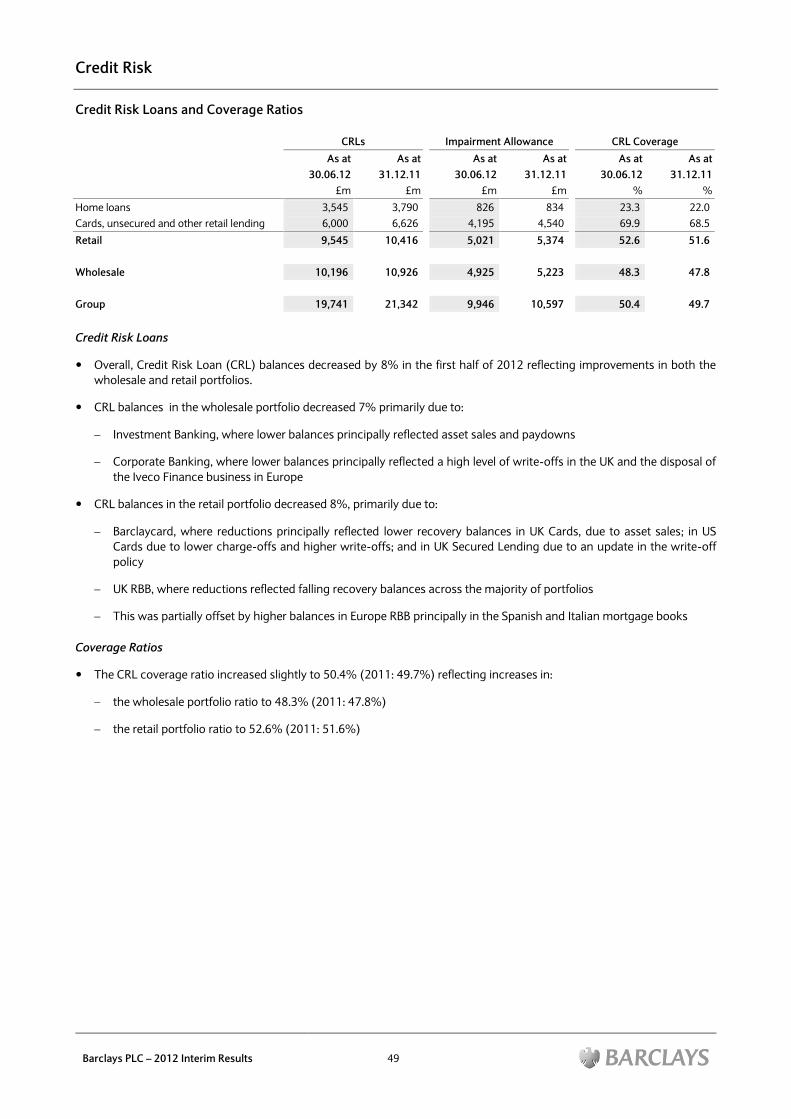
Credit Risk
Barclays PLC – 2012 Interim Results 49
Credit Risk Loans and Coverage Ratios
CRLs Impairment Allowance CRL Coverage
As at As at As at As at As at As at
30.06.12 31.12.11 30.06.12 31.12.11 30.06.12 31.12.11
£m £m £m £m % %
Home loans 3,545 3,790 826 834 23.3 22.0
Cards, unsecured and other retail lending 6,000 6,626 4,195 4,540 69.9 68.5
Retail 9,545 10,416 5,021 5,374 52.6 51.6
Wholesale 10,196 10,926 4,925 5,223 48.3 47.8
Group 19,741 21,342 9,946 10,597 50.4 49.7
Credit Risk Loans
Overall, Credit Risk Loan (CRL) balances decreased by 8% in the first half of 2012 reflecting improvements in both the
wholesale and retail portfolios.
CRL balances in the wholesale portfolio decreased 7% primarily due to:
Investment Banking, where lower balances principally reflected asset sales and paydowns
Corporate Banking, where lower balances principally reflected a high level of write-offs in the UK and the disposal of
the Iveco Finance business in Europe
CRL balances in the retail portfolio decreased 8%, primarily due to:
Barclaycard, where reductions principally reflected lower recovery balances in UK Cards, due to asset sales; in US
Cards due to lower charge-offs and higher write-offs; and in UK Secured Lending due to an update in the write-off
policy
UK RBB, where reductions reflected falling recovery balances across the majority of portfolios
This was partially offset by higher balances in Europe RBB principally in the Spanish and Italian mortgage books
Coverage Ratios
The CRL coverage ratio increased slightly to 50.4% (2011: 49.7%) reflecting increases in:
the wholesale portfolio ratio to 48.3% (2011: 47.8%)
the retail portfolio ratio to 52.6% (2011: 51.6%)
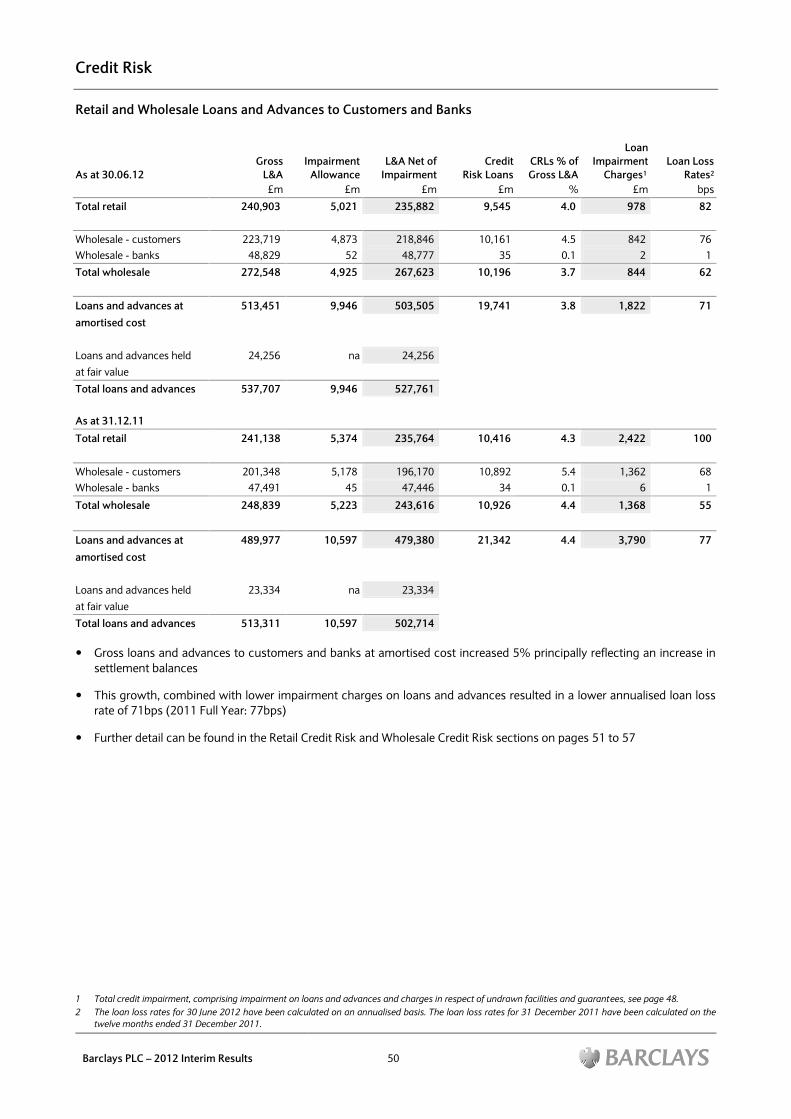
Credit Risk
Barclays PLC – 2012 Interim Results 50
Retail and Wholesale Loans and Advances to Customers and Banks
As at 30.06.12
Gross
L&A
Impairment
Allowance
L&A Net of
Impairment
Credit
Risk Loans
CRLs % of
Gross L&A
Loan
Impairment
Charges1
Loan Loss
Rates2
£m £m £m £m % £m bps
Total retail 240,903 5,021 235,882 9,545 4.0 978 82
Wholesale - customers 223,719 4,873 218,846 10,161 4.5 842 76
Wholesale - banks 48,829 52 48,777 35 0.1 2 1
Total wholesale 272,548 4,925 267,623 10,196 3.7 844 62
Loans and advances at 513,451 9,946 503,505 19,741 3.8 1,822 71
amortised cost
Loans and advances held 24,256 na 24,256
at fair value
Total loans and advances 537,707 9,946 527,761
As at 31.12.11
Total retail 241,138 5,374 235,764 10,416 4.3 2,422 100
Wholesale - customers 201,348 5,178 196,170 10,892 5.4 1,362 68
Wholesale - banks 47,491 45 47,446 34 0.1 6 1
Total wholesale 248,839 5,223 243,616 10,926 4.4 1,368 55
Loans and advances at 489,977 10,597 479,380 21,342 4.4 3,790 77
amortised cost
Loans and advances held 23,334 na 23,334
at fair value
Total loans and advances 513,311 10,597 502,714
Gross loans and advances to customers and banks at amortised cost increased 5% principally reflecting an increase in
settlement balances
This growth, combined with lower impairment charges on loans and advances resulted in a lower annualised loan loss
rate of 71bps (2011 Full Year: 77bps)
Further detail can be found in the Retail Credit Risk and Wholesale Credit Risk sections on pages 51 to 57
1 Total credit impairment, comprising impairment on loans and advances and charges in respect of undrawn facilities and guarantees, see page 48.
2 The loan loss rates for 30 June 2012 have been calculated on an annualised basis. The loan loss rates for 31 December 2011 have been calculated on the
twelve months ended 31 December 2011.
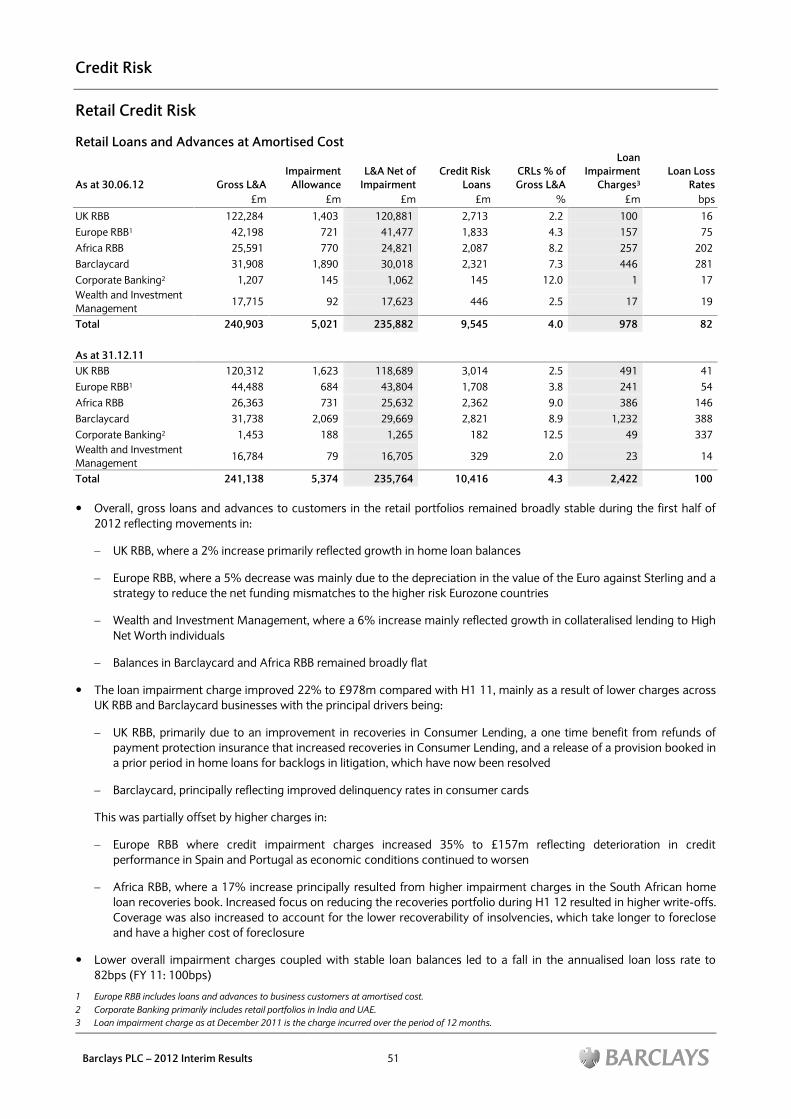
Credit Risk
Barclays PLC – 2012 Interim Results 51
Retail Credit Risk
Retail Loans and Advances at Amortised Cost
As at 30.06.12 Gross L&A
Impairment
Allowance
L&A Net of
Impairment
Credit Risk
Loans
CRLs % of
Gross L&A
Loan
Impairment
Charges3
Loan Loss
Rates
£m £m £m £m % £m bps
UK RBB 122,284 1,403 120,881 2,713 2.2 100 16
Europe RBB1 42,198 721 41,477 1,833 4.3 157 75
Africa RBB 25,591 770 24,821 2,087 8.2 257 202
Barclaycard 31,908 1,890 30,018 2,321 7.3 446 281
Corporate Banking2 1,207 145 1,062 145 12.0 1 17
Wealth and Investment
Management 17,715 92 17,623 446 2.5 17 19
Total 240,903 5,021 235,882 9,545 4.0 978 82
As at 31.12.11
UK RBB 120,312 1,623 118,689 3,014 2.5 491 41
Europe RBB1 44,488 684 43,804 1,708 3.8 241 54
Africa RBB 26,363 731 25,632 2,362 9.0 386 146
Barclaycard 31,738 2,069 29,669 2,821 8.9 1,232 388
Corporate Banking2 1,453 188 1,265 182 12.5 49 337
Wealth and Investment
Management 16,784 79 16,705 329 2.0 23 14
Total 241,138 5,374 235,764 10,416 4.3 2,422 100
Overall, gross loans and advances to customers in the retail portfolios remained broadly stable during the first half of
2012 reflecting movements in:
UK RBB, where a 2% increase primarily reflected growth in home loan balances
Europe RBB, where a 5% decrease was mainly due to the depreciation in the value of the Euro against Sterling and a
strategy to reduce the net funding mismatches to the higher risk Eurozone countries
Wealth and Investment Management, where a 6% increase mainly reflected growth in collateralised lending to High
Net Worth individuals
Balances in Barclaycard and Africa RBB remained broadly flat
The loan impairment charge improved 22% to £978m compared with H1 11, mainly as a result of lower charges across
UK RBB and Barclaycard businesses with the principal drivers being:
UK RBB, primarily due to an improvement in recoveries in Consumer Lending, a one time benefit from refunds of
payment protection insurance that increased recoveries in Consumer Lending, and a release of a provision booked in
a prior period in home loans for backlogs in litigation, which have now been resolved
Barclaycard, principally reflecting improved delinquency rates in consumer cards
This was partially offset by higher charges in:
Europe RBB where credit impairment charges increased 35% to £157m reflecting deterioration in credit
performance in Spain and Portugal as economic conditions continued to worsen
Africa RBB, where a 17% increase principally resulted from higher impairment charges in the South African home
loan recoveries book. Increased focus on reducing the recoveries portfolio during H1 12 resulted in higher write-offs.
Coverage was also increased to account for the lower recoverability of insolvencies, which take longer to foreclose
and have a higher cost of foreclosure
Lower overall impairment charges coupled with stable loan balances led to a fall in the annualised loan loss rate to
82bps (FY 11: 100bps)
1 Europe RBB includes loans and advances to business customers at amortised cost.
2 Corporate Banking primarily includes retail portfolios in India and UAE.
3 Loan impairment charge as at December 2011 is the charge incurred over the period of 12 months.
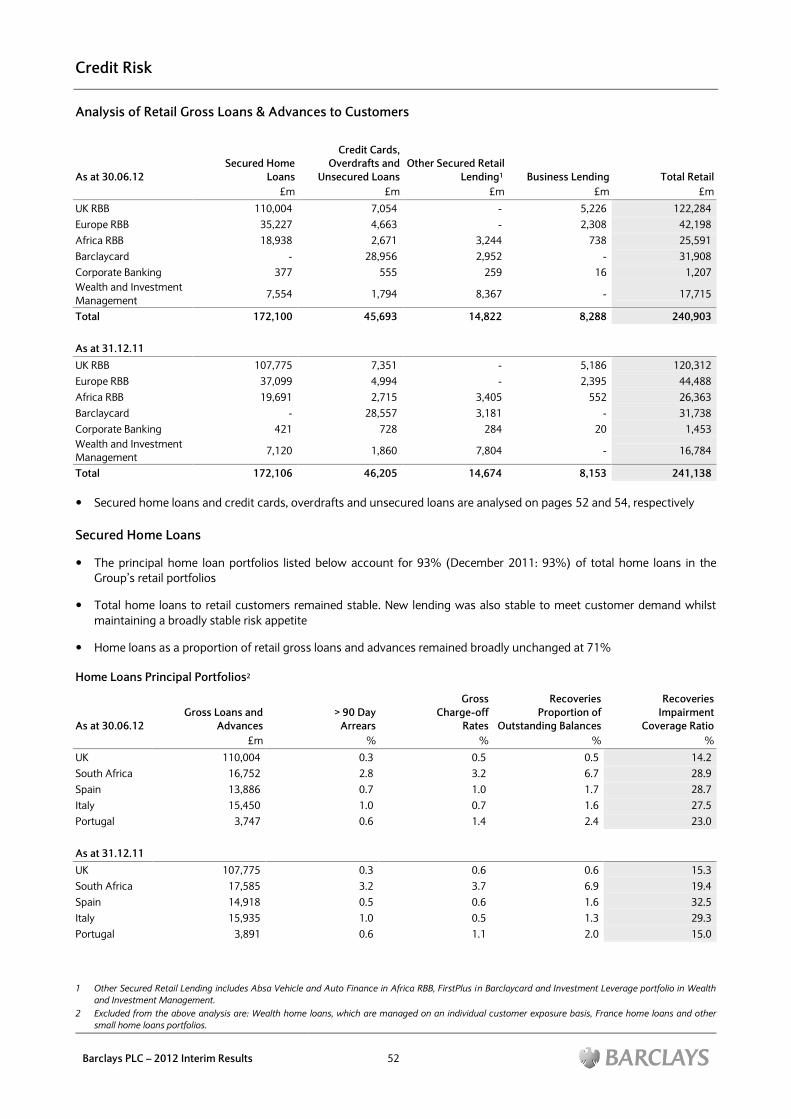
Credit Risk
Barclays PLC – 2012 Interim Results 52
Analysis of Retail Gross Loans & Advances to Customers
As at 30.06.12
Secured Home
Loans
Credit Cards,
Overdrafts and
Unsecured Loans
Other Secured Retail
Lending1 Business Lending Total Retail
£m £m £m £m £m
UK RBB 110,004 7,054 - 5,226 122,284
Europe RBB 35,227 4,663 - 2,308 42,198
Africa RBB 18,938 2,671 3,244 738 25,591
Barclaycard - 28,956 2,952 - 31,908
Corporate Banking 377 555 259 16 1,207
Wealth and Investment
Management 7,554 1,794 8,367 - 17,715
Total 172,100 45,693 14,822 8,288 240,903
As at 31.12.11
UK RBB 107,775 7,351 - 5,186 120,312
Europe RBB 37,099 4,994 - 2,395 44,488
Africa RBB 19,691 2,715 3,405 552 26,363
Barclaycard - 28,557 3,181 - 31,738
Corporate Banking 421 728 284 20 1,453
Wealth and Investment
Management 7,120 1,860 7,804 - 16,784
Total 172,106 46,205 14,674 8,153 241,138
Secured home loans and credit cards, overdrafts and unsecured loans are analysed on pages 52 and 54, respectively
Secured Home Loans
The principal home loan portfolios listed below account for 93% (December 2011: 93%) of total home loans in the
Group‟s retail portfolios
Total home loans to retail customers remained stable. New lending was also stable to meet customer demand whilst
maintaining a broadly stable risk appetite
Home loans as a proportion of retail gross loans and advances remained broadly unchanged at 71%
Home Loans Principal Portfolios2
As at 30.06.12
Gross Loans and
Advances
> 90 Day
Arrears
Gross
Charge-off
Rates
Recoveries
Proportion of
Outstanding Balances
Recoveries
Impairment
Coverage Ratio
£m % % % %
UK 110,004 0.3 0.5 0.5 14.2
South Africa 16,752 2.8 3.2 6.7 28.9
Spain 13,886 0.7 1.0 1.7 28.7
Italy 15,450 1.0 0.7 1.6 27.5
Portugal 3,747 0.6 1.4 2.4 23.0
As at 31.12.11
UK 107,775 0.3 0.6 0.6 15.3
South Africa 17,585 3.2 3.7 6.9 19.4
Spain 14,918 0.5 0.6 1.6 32.5
Italy 15,935 1.0 0.5 1.3 29.3
Portugal 3,891 0.6 1.1 2.0 15.0
1 Other Secured Retail Lending includes Absa Vehicle and Auto Finance in Africa RBB, FirstPlus in Barclaycard and Investment Leverage portfolio in Wealth
and Investment Management.
2 Excluded from the above analysis are: Wealth home loans, which are managed on an individual customer exposure basis, France home loans and other
small home loans portfolios.
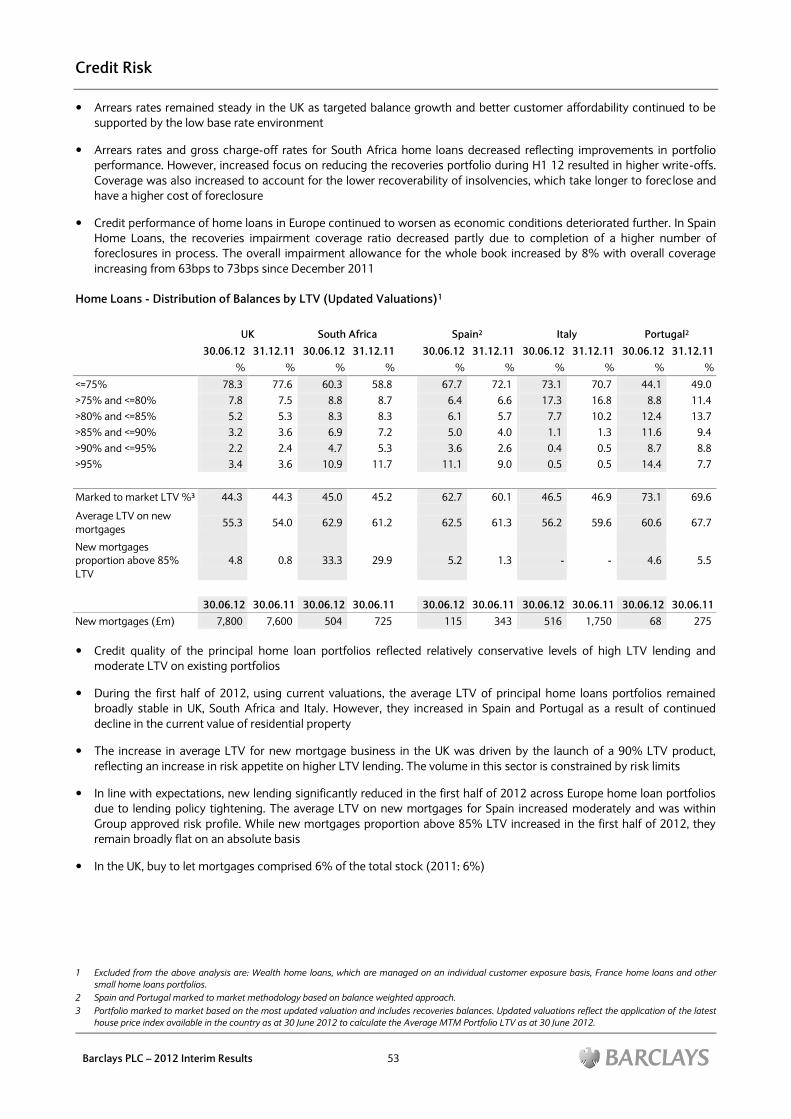
Credit Risk
Barclays PLC – 2012 Interim Results 53
Arrears rates remained steady in the UK as targeted balance growth and better customer affordability continued to be
supported by the low base rate environment
Arrears rates and gross charge-off rates for South Africa home loans decreased reflecting improvements in portfolio
performance. However, increased focus on reducing the recoveries portfolio during H1 12 resulted in higher write-offs.
Coverage was also increased to account for the lower recoverability of insolvencies, which take longer to foreclose and
have a higher cost of foreclosure
Credit performance of home loans in Europe continued to worsen as economic conditions deteriorated further. In Spain
Home Loans, the recoveries impairment coverage ratio decreased partly due to completion of a higher number of
foreclosures in process. The overall impairment allowance for the whole book increased by 8% with overall coverage
increasing from 63bps to 73bps since December 2011
Home Loans - Distribution of Balances by LTV (Updated Valuations)1
UK South Africa Spain2 Italy Portugal2
30.06.12 31.12.11 30.06.12 31.12.11 30.06.12 31.12.11 30.06.12 31.12.11 30.06.12 31.12.11
% % % % % % % % % %
<=75% 78.3 77.6 60.3 58.8 67.7 72.1 73.1 70.7 44.1 49.0
>75% and <=80% 7.8 7.5 8.8 8.7 6.4 6.6 17.3 16.8 8.8 11.4
>80% and <=85% 5.2 5.3 8.3 8.3 6.1 5.7 7.7 10.2 12.4 13.7
>85% and <=90% 3.2 3.6 6.9 7.2 5.0 4.0 1.1 1.3 11.6 9.4
>90% and <=95% 2.2 2.4 4.7 5.3 3.6 2.6 0.4 0.5 8.7 8.8
>95% 3.4 3.6 10.9 11.7 11.1 9.0 0.5 0.5 14.4 7.7
Marked to market LTV %3 44.3 44.3 45.0 45.2 62.7 60.1 46.5 46.9 73.1 69.6
Average LTV on new
mortgages 55.3 54.0 62.9 61.2 62.5 61.3 56.2 59.6 60.6 67.7
New mortgages
proportion above 85%
LTV
4.8 0.8 33.3 29.9 5.2 1.3 - - 4.6 5.5
30.06.12 30.06.11 30.06.12 30.06.11 30.06.12 30.06.11 30.06.12 30.06.11 30.06.12 30.06.11
New mortgages (£m) 7,800 7,600 504 725 115 343 516 1,750 68 275
Credit quality of the principal home loan portfolios reflected relatively conservative levels of high LTV lending and
moderate LTV on existing portfolios
During the first half of 2012, using current valuations, the average LTV of principal home loans portfolios remained
broadly stable in UK, South Africa and Italy. However, they increased in Spain and Portugal as a result of continued
decline in the current value of residential property
The increase in average LTV for new mortgage business in the UK was driven by the launch of a 90% LTV product,
reflecting an increase in risk appetite on higher LTV lending. The volume in this sector is constrained by risk limits
In line with expectations, new lending significantly reduced in the first half of 2012 across Europe home loan portfolios
due to lending policy tightening. The average LTV on new mortgages for Spain increased moderately and was within
Group approved risk profile. While new mortgages proportion above 85% LTV increased in the first half of 2012, they
remain broadly flat on an absolute basis
In the UK, buy to let mortgages comprised 6% of the total stock (2011: 6%)
1 Excluded from the above analysis are: Wealth home loans, which are managed on an individual customer exposure basis, France home loans and other
small home loans portfolios.
2 Spain and Portugal marked to market methodology based on balance weighted approach.
3 Portfolio marked to market based on the most updated valuation and includes recoveries balances. Updated valuations reflect the application of the latest
house price index available in the country as at 30 June 2012 to calculate the Average MTM Portfolio LTV as at 30 June 2012.
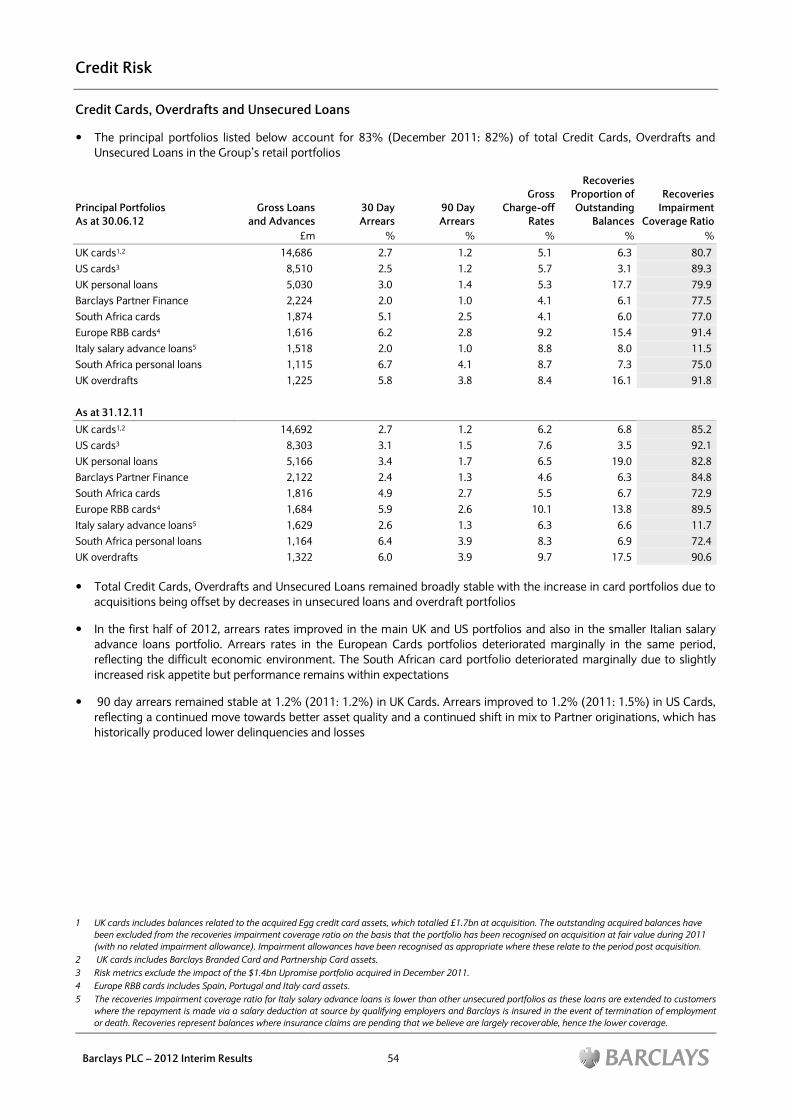
Credit Risk
Barclays PLC – 2012 Interim Results 54
Credit Cards, Overdrafts and Unsecured Loans
The principal portfolios listed below account for 83% (December 2011: 82%) of total Credit Cards, Overdrafts and
Unsecured Loans in the Group‟s retail portfolios
Principal Portfolios
As at 30.06.12
Gross Loans
and Advances
30 Day
Arrears
90 Day
Arrears
Gross
Charge-off
Rates
Recoveries
Proportion of
Outstanding
Balances
Recoveries
Impairment
Coverage Ratio
£m % % % % %
UK cards1,2 14,686 2.7 1.2 5.1 6.3 80.7
US cards3 8,510 2.5 1.2 5.7 3.1 89.3
UK personal loans 5,030 3.0 1.4 5.3 17.7 79.9
Barclays Partner Finance 2,224 2.0 1.0 4.1 6.1 77.5
South Africa cards 1,874 5.1 2.5 4.1 6.0 77.0
Europe RBB cards4 1,616 6.2 2.8 9.2 15.4 91.4
Italy salary advance loans5 1,518 2.0 1.0 8.8 8.0 11.5
South Africa personal loans 1,115 6.7 4.1 8.7 7.3 75.0
UK overdrafts 1,225 5.8 3.8 8.4 16.1 91.8
As at 31.12.11
UK cards1,2 14,692 2.7 1.2 6.2 6.8 85.2
US cards3 8,303 3.1 1.5 7.6 3.5 92.1
UK personal loans 5,166 3.4 1.7 6.5 19.0 82.8
Barclays Partner Finance 2,122 2.4 1.3 4.6 6.3 84.8
South Africa cards 1,816 4.9 2.7 5.5 6.7 72.9
Europe RBB cards4 1,684 5.9 2.6 10.1 13.8 89.5
Italy salary advance loans5 1,629 2.6 1.3 6.3 6.6 11.7
South Africa personal loans 1,164 6.4 3.9 8.3 6.9 72.4
UK overdrafts 1,322 6.0 3.9 9.7 17.5 90.6
Total Credit Cards, Overdrafts and Unsecured Loans remained broadly stable with the increase in card portfolios due to
acquisitions being offset by decreases in unsecured loans and overdraft portfolios
In the first half of 2012, arrears rates improved in the main UK and US portfolios and also in the smaller Italian salary
advance loans portfolio. Arrears rates in the European Cards portfolios deteriorated marginally in the same period,
reflecting the difficult economic environment. The South African card portfolio deteriorated marginally due to slightly
increased risk appetite but performance remains within expectations
90 day arrears remained stable at 1.2% (2011: 1.2%) in UK Cards. Arrears improved to 1.2% (2011: 1.5%) in US Cards,
reflecting a continued move towards better asset quality and a continued shift in mix to Partner originations, which has
historically produced lower delinquencies and losses
1 UK cards includes balances related to the acquired Egg credit card assets, which totalled £1.7bn at acquisition. The outstanding acquired balances have
been excluded from the recoveries impairment coverage ratio on the basis that the portfolio has been recognised on acquisition at fair value during 2011
(with no related impairment allowance). Impairment allowances have been recognised as appropriate where these relate to the period post acquisition.
2 UK cards includes Barclays Branded Card and Partnership Card assets.
3 Risk metrics exclude the impact of the $1.4bn Upromise portfolio acquired in December 2011.
4 Europe RBB cards includes Spain, Portugal and Italy card assets.
5 The recoveries impairment coverage ratio for Italy salary advance loans is lower than other unsecured portfolios as these loans are extended to customers
where the repayment is made via a salary deduction at source by qualifying employers and Barclays is insured in the event of termination of employment
or death. Recoveries represent balances where insurance claims are pending that we believe are largely recoverable, hence the lower coverage.
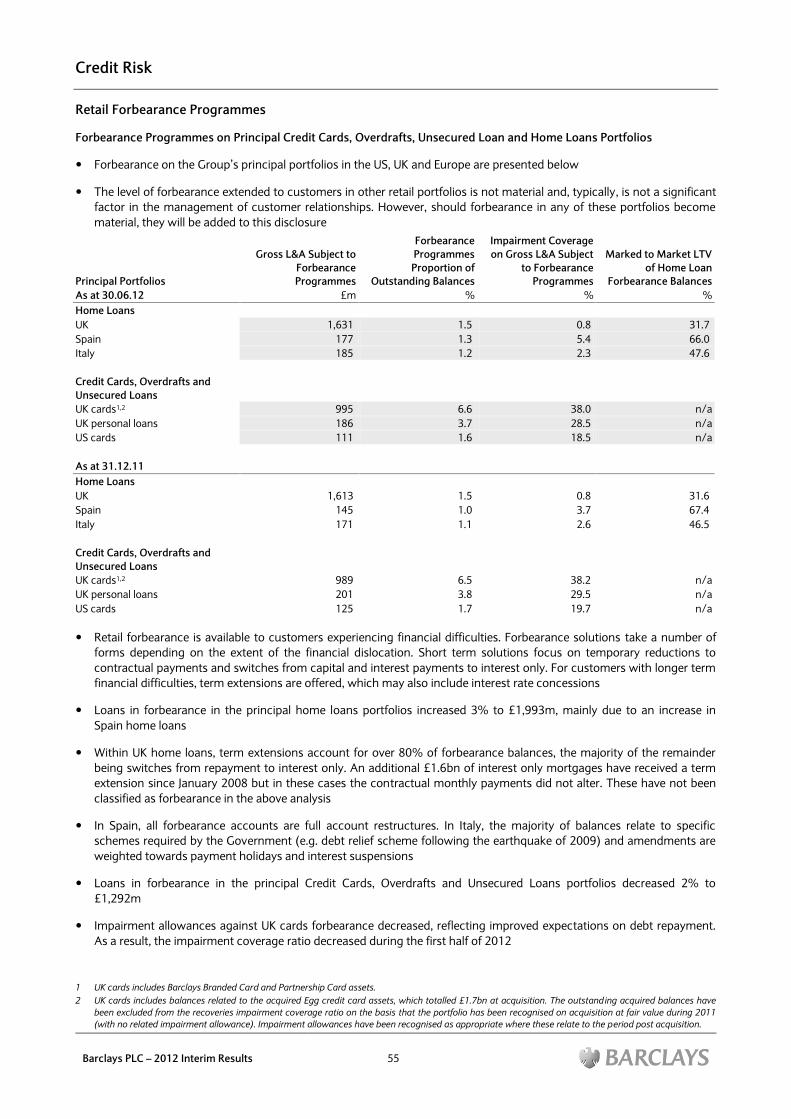
Credit Risk
Barclays PLC – 2012 Interim Results 55
Retail Forbearance Programmes
Forbearance Programmes on Principal Credit Cards, Overdrafts, Unsecured Loan and Home Loans Portfolios
Forbearance on the Group‟s principal portfolios in the US, UK and Europe are presented below
The level of forbearance extended to customers in other retail portfolios is not material and, typically, is not a significant
factor in the management of customer relationships. However, should forbearance in any of these portfolios become
material, they will be added to this disclosure
Principal Portfolios
Gross L&A Subject to
Forbearance
Programmes
Forbearance
Programmes
Proportion of
Outstanding Balances
Impairment Coverage
on Gross L&A Subject
to Forbearance
Programmes
Marked to Market LTV
of Home Loan
Forbearance Balances
As at 30.06.12 £m % % %
Home Loans
UK 1,631 1.5 0.8 31.7
Spain 177 1.3 5.4 66.0
Italy 185 1.2 2.3 47.6
Credit Cards, Overdrafts and
Unsecured Loans
UK cards1,2 995 6.6 38.0 n/a
UK personal loans 186 3.7 28.5 n/a
US cards 111 1.6 18.5 n/a
As at 31.12.11
Home Loans
UK 1,613 1.5 0.8 31.6
Spain 145 1.0 3.7 67.4
Italy 171 1.1 2.6 46.5
Credit Cards, Overdrafts and
Unsecured Loans
UK cards1,2 989 6.5 38.2 n/a
UK personal loans 201 3.8 29.5 n/a
US cards 125 1.7 19.7 n/a
Retail forbearance is available to customers experiencing financial difficulties. Forbearance solutions take a number of
forms depending on the extent of the financial dislocation. Short term solutions focus on temporary reductions to
contractual payments and switches from capital and interest payments to interest only. For customers with longer term
financial difficulties, term extensions are offered, which may also include interest rate concessions
Loans in forbearance in the principal home loans portfolios increased 3% to £1,993m, mainly due to an increase in
Spain home loans
Within UK home loans, term extensions account for over 80% of forbearance balances, the majority of the remainder
being switches from repayment to interest only. An additional £1.6bn of interest only mortgages have received a term
extension since January 2008 but in these cases the contractual monthly payments did not alter. These have not been
classified as forbearance in the above analysis
In Spain, all forbearance accounts are full account restructures. In Italy, the majority of balances relate to specific
schemes required by the Government (e.g. debt relief scheme following the earthquake of 2009) and amendments are
weighted towards payment holidays and interest suspensions
Loans in forbearance in the principal Credit Cards, Overdrafts and Unsecured Loans portfolios decreased 2% to
£1,292m
Impairment allowances against UK cards forbearance decreased, reflecting improved expectations on debt repayment.
As a result, the impairment coverage ratio decreased during the first half of 2012
1 UK cards includes Barclays Branded Card and Partnership Card assets.
2 UK cards includes balances related to the acquired Egg credit card assets, which totalled £1.7bn at acquisition. The outstanding acquired balances have
been excluded from the recoveries impairment coverage ratio on the basis that the portfolio has been recognised on acquisition at fair value during 2011
(with no related impairment allowance). Impairment allowances have been recognised as appropriate where these relate to the period post acquisition.
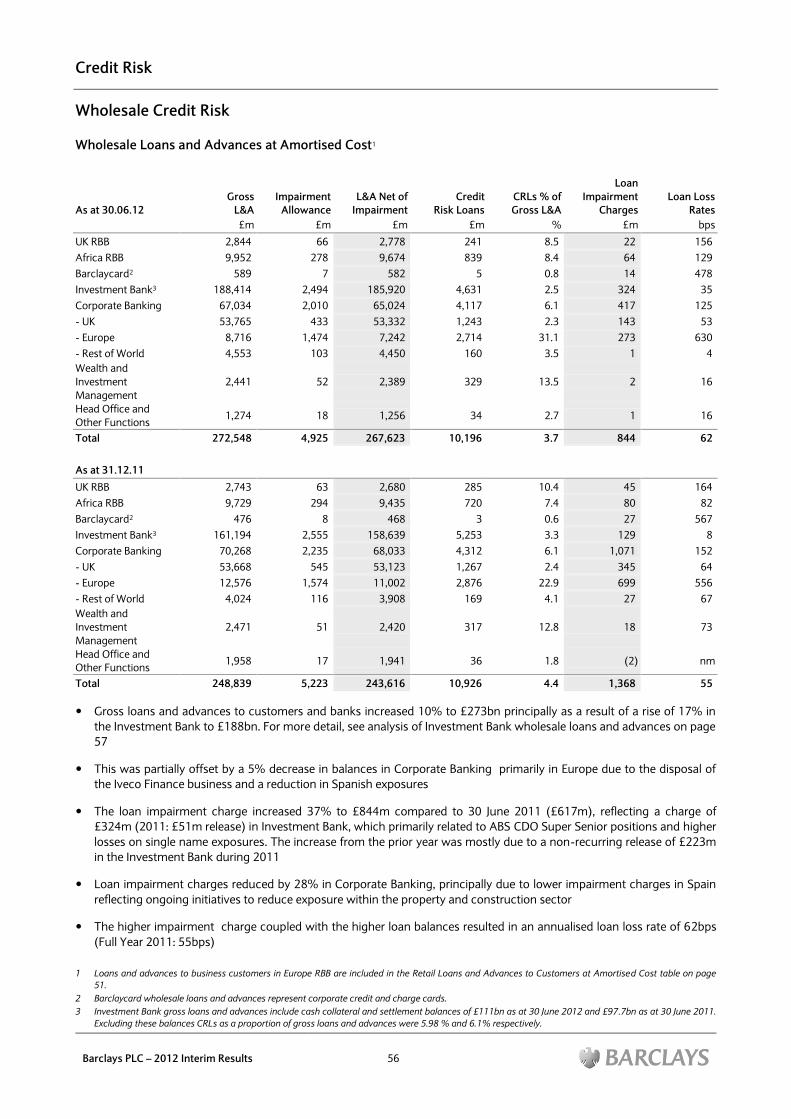
Credit Risk
Barclays PLC – 2012 Interim Results 56
Wholesale Credit Risk
Wholesale Loans and Advances at Amortised Cost1
As at 30.06.12
Gross
L&A
Impairment
Allowance
L&A Net of
Impairment
Credit
Risk Loans
CRLs % of
Gross L&A
Loan
Impairment
Charges
Loan Loss
Rates
£m £m £m £m % £m bps
UK RBB 2,844 66 2,778 241 8.5 22 156
Africa RBB 9,952 278 9,674 839 8.4 64 129
Barclaycard2 589 7 582 5 0.8 14 478
Investment Bank3 188,414 2,494 185,920 4,631 2.5 324 35
Corporate Banking 67,034 2,010 65,024 4,117 6.1 417 125
- UK 53,765 433 53,332 1,243 2.3 143 53
- Europe 8,716 1,474 7,242 2,714 31.1 273 630
- Rest of World 4,553 103 4,450 160 3.5 1 4
Wealth and
Investment
Management
2,441 52 2,389 329 13.5 2 16
Head Office and
Other Functions 1,274 18 1,256 34 2.7 1 16
Total 272,548 4,925 267,623 10,196 3.7 844 62
As at 31.12.11
UK RBB 2,743 63 2,680 285 10.4 45 164
Africa RBB 9,729 294 9,435 720 7.4 80 82
Barclaycard2 476 8 468 3 0.6 27 567
Investment Bank3 161,194 2,555 158,639 5,253 3.3 129 8
Corporate Banking 70,268 2,235 68,033 4,312 6.1 1,071 152
- UK 53,668 545 53,123 1,267 2.4 345 64
- Europe 12,576 1,574 11,002 2,876 22.9 699 556
- Rest of World 4,024 116 3,908 169 4.1 27 67
Wealth and
Investment
Management
2,471 51 2,420 317 12.8 18 73
Head Office and
Other Functions 1,958 17 1,941 36 1.8 (2) nm
Total 248,839 5,223 243,616 10,926 4.4 1,368 55
Gross loans and advances to customers and banks increased 10% to £273bn principally as a result of a rise of 17% in
the Investment Bank to £188bn. For more detail, see analysis of Investment Bank wholesale loans and advances on page
57
This was partially offset by a 5% decrease in balances in Corporate Banking primarily in Europe due to the disposal of
the Iveco Finance business and a reduction in Spanish exposures
The loan impairment charge increased 37% to £844m compared to 30 June 2011 (£617m), reflecting a charge of
£324m (2011: £51m release) in Investment Bank, which primarily related to ABS CDO Super Senior positions and higher
losses on single name exposures. The increase from the prior year was mostly due to a non-recurring release of £223m
in the Investment Bank during 2011
Loan impairment charges reduced by 28% in Corporate Banking, principally due to lower impairment charges in Spain
reflecting ongoing initiatives to reduce exposure within the property and construction sector
The higher impairment charge coupled with the higher loan balances resulted in an annualised loan loss rate of 62bps
(Full Year 2011: 55bps)
1 Loans and advances to business customers in Europe RBB are included in the Retail Loans and Advances to Customers at Amortised Cost table on page
51.
2 Barclaycard wholesale loans and advances represent corporate credit and charge cards.
3 Investment Bank gross loans and advances include cash collateral and settlement balances of £111bn as at 30 June 2012 and £97.7bn as at 30 June 2011.
Excluding these balances CRLs as a proportion of gross loans and advances were 5.98 % and 6.1% respectively.
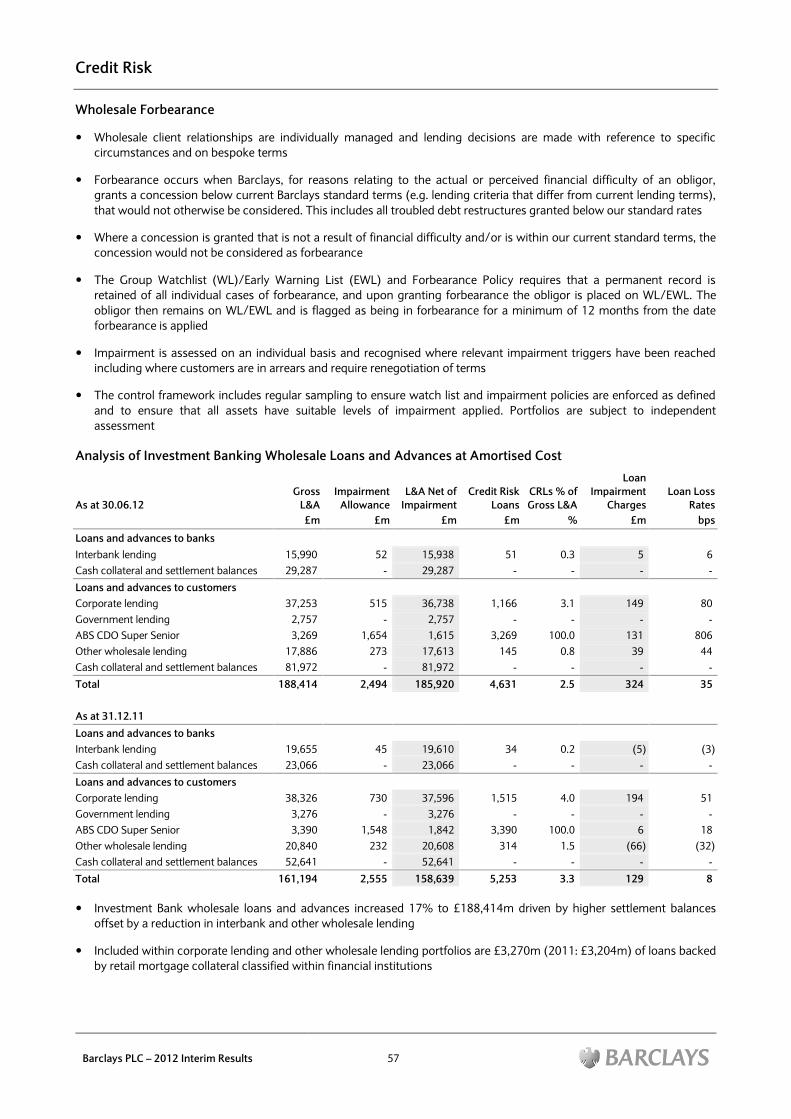
Credit Risk
Barclays PLC – 2012 Interim Results 57
Wholesale Forbearance
Wholesale client relationships are individually managed and lending decisions are made with reference to specific
circumstances and on bespoke terms
Forbearance occurs when Barclays, for reasons relating to the actual or perceived financial difficulty of an obligor,
grants a concession below current Barclays standard terms (e.g. lending criteria that differ from current lending terms),
that would not otherwise be considered. This includes all troubled debt restructures granted below our standard rates
Where a concession is granted that is not a result of financial difficulty and/or is within our current standard terms, the
concession would not be considered as forbearance
The Group Watchlist (WL)/Early Warning List (EWL) and Forbearance Policy requires that a permanent record is
retained of all individual cases of forbearance, and upon granting forbearance the obligor is placed on WL/EWL. The
obligor then remains on WL/EWL and is flagged as being in forbearance for a minimum of 12 months from the date
forbearance is applied
Impairment is assessed on an individual basis and recognised where relevant impairment triggers have been reached
including where customers are in arrears and require renegotiation of terms
The control framework includes regular sampling to ensure watch list and impairment policies are enforced as defined
and to ensure that all assets have suitable levels of impairment applied. Portfolios are subject to independent
assessment
Analysis of Investment Banking Wholesale Loans and Advances at Amortised Cost
As at 30.06.12
Gross
L&A
Impairment
Allowance
L&A Net of
Impairment
Credit Risk
Loans
CRLs % of
Gross L&A
Loan
Impairment
Charges
Loan Loss
Rates
£m £m £m £m % £m bps
Loans and advances to banks
Interbank lending 15,990 52 15,938 51 0.3 5 6
Cash collateral and settlement balances 29,287 - 29,287 - - - -
Loans and advances to customers
Corporate lending 37,253 515 36,738 1,166 3.1 149 80
Government lending 2,757 - 2,757 - - - -
ABS CDO Super Senior 3,269 1,654 1,615 3,269 100.0 131 806
Other wholesale lending 17,886 273 17,613 145 0.8 39 44
Cash collateral and settlement balances 81,972 - 81,972 - - - -
Total 188,414 2,494 185,920 4,631 2.5 324 35
As at 31.12.11
Loans and advances to banks
Interbank lending 19,655 45 19,610 34 0.2 (5) (3)
Cash collateral and settlement balances 23,066 - 23,066 - - - -
Loans and advances to customers
Corporate lending 38,326 730 37,596 1,515 4.0 194 51
Government lending 3,276 - 3,276 - - - -
ABS CDO Super Senior 3,390 1,548 1,842 3,390 100.0 6 18
Other wholesale lending 20,840 232 20,608 314 1.5 (66) (32)
Cash collateral and settlement balances 52,641 - 52,641 - - - -
Total 161,194 2,555 158,639 5,253 3.3 129 8
Investment Bank wholesale loans and advances increased 17% to £188,414m driven by higher settlement balances
offset by a reduction in interbank and other wholesale lending
Included within corporate lending and other wholesale lending portfolios are £3,270m (2011: £3,204m) of loans backed
by retail mortgage collateral classified within financial institutions
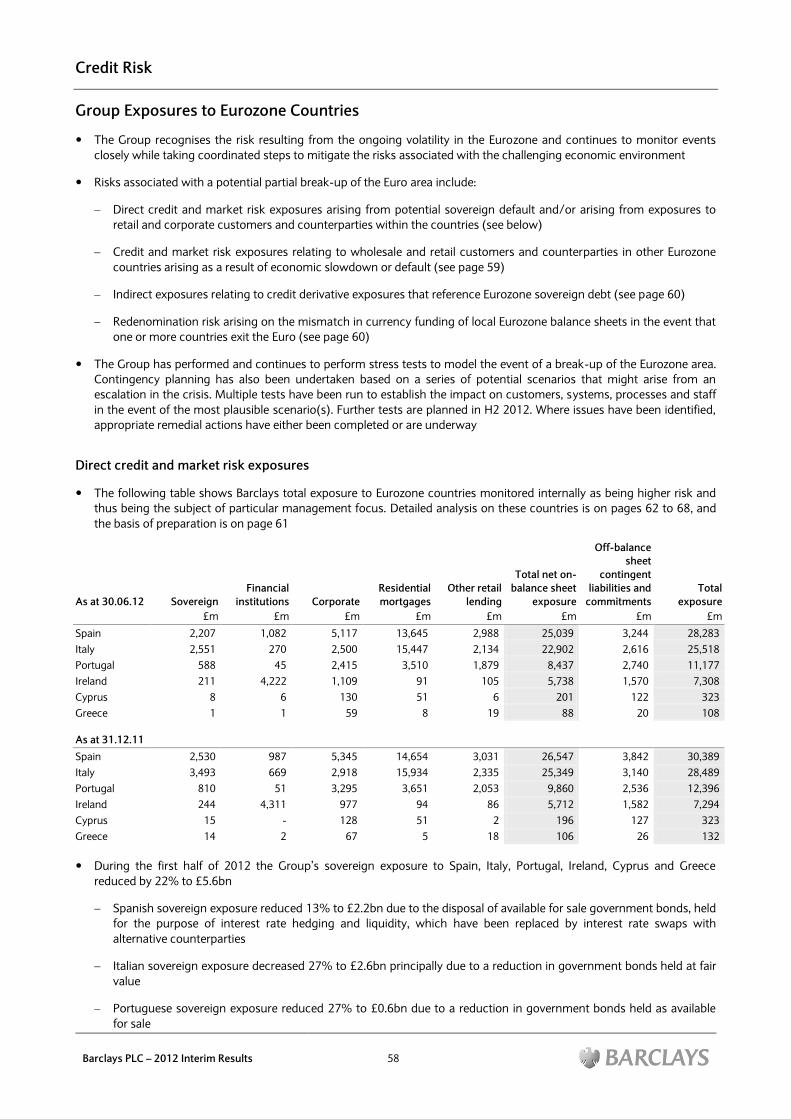
Credit Risk
Barclays PLC – 2012 Interim Results 58
Group Exposures to Eurozone Countries
The Group recognises the risk resulting from the ongoing volatility in the Eurozone and continues to monitor events
closely while taking coordinated steps to mitigate the risks associated with the challenging economic environment
Risks associated with a potential partial break-up of the Euro area include:
Direct credit and market risk exposures arising from potential sovereign default and/or arising from exposures to
retail and corporate customers and counterparties within the countries (see below)
Credit and market risk exposures relating to wholesale and retail customers and counterparties in other Eurozone
countries arising as a result of economic slowdown or default (see page 59)
Indirect exposures relating to credit derivative exposures that reference Eurozone sovereign debt (see page 60)
Redenomination risk arising on the mismatch in currency funding of local Eurozone balance sheets in the event that
one or more countries exit the Euro (see page 60)
The Group has performed and continues to perform stress tests to model the event of a break-up of the Eurozone area.
Contingency planning has also been undertaken based on a series of potential scenarios that might arise from an
escalation in the crisis. Multiple tests have been run to establish the impact on customers, systems, processes and staff
in the event of the most plausible scenario(s). Further tests are planned in H2 2012. Where issues have been identified,
appropriate remedial actions have either been completed or are underway
Direct credit and market risk exposures
The following table shows Barclays total exposure to Eurozone countries monitored internally as being higher risk and
thus being the subject of particular management focus. Detailed analysis on these countries is on pages 62 to 68, and
the basis of preparation is on page 61
Total net on-
balance sheet
exposure
Off-balance
sheet
contingent
liabilities and
commitments
Total
exposure As at 30.06.12 Sovereign
Financial
institutions Corporate
Residential
mortgages
Other retail
lending
£m £m £m £m £m £m £m £m
Spain 2,207 1,082 5,117 13,645 2,988 25,039 3,244 28,283
Italy 2,551 270 2,500 15,447 2,134 22,902 2,616 25,518
Portugal 588 45 2,415 3,510 1,879 8,437 2,740 11,177
Ireland 211 4,222 1,109 91 105 5,738 1,570 7,308
Cyprus 8 6 130 51 6 201 122 323
Greece 1 1 59 8 19 88 20 108
As at 31.12.11
Spain 2,530 987 5,345 14,654 3,031 26,547 3,842 30,389
Italy 3,493 669 2,918 15,934 2,335 25,349 3,140 28,489
Portugal 810 51 3,295 3,651 2,053 9,860 2,536 12,396
Ireland 244 4,311 977 94 86 5,712 1,582 7,294
Cyprus 15 - 128 51 2 196 127 323
Greece 14 2 67 5 18 106 26 132
During the first half of 2012 the Group‟s sovereign exposure to Spain, Italy, Portugal, Ireland, Cyprus and Greece
reduced by 22% to £5.6bn
Spanish sovereign exposure reduced 13% to £2.2bn due to the disposal of available for sale government bonds, held
for the purpose of interest rate hedging and liquidity, which have been replaced by interest rate swaps with
alternative counterparties
Italian sovereign exposure decreased 27% to £2.6bn principally due to a reduction in government bonds held at fair
value
Portuguese sovereign exposure reduced 27% to £0.6bn due to a reduction in government bonds held as available
for sale
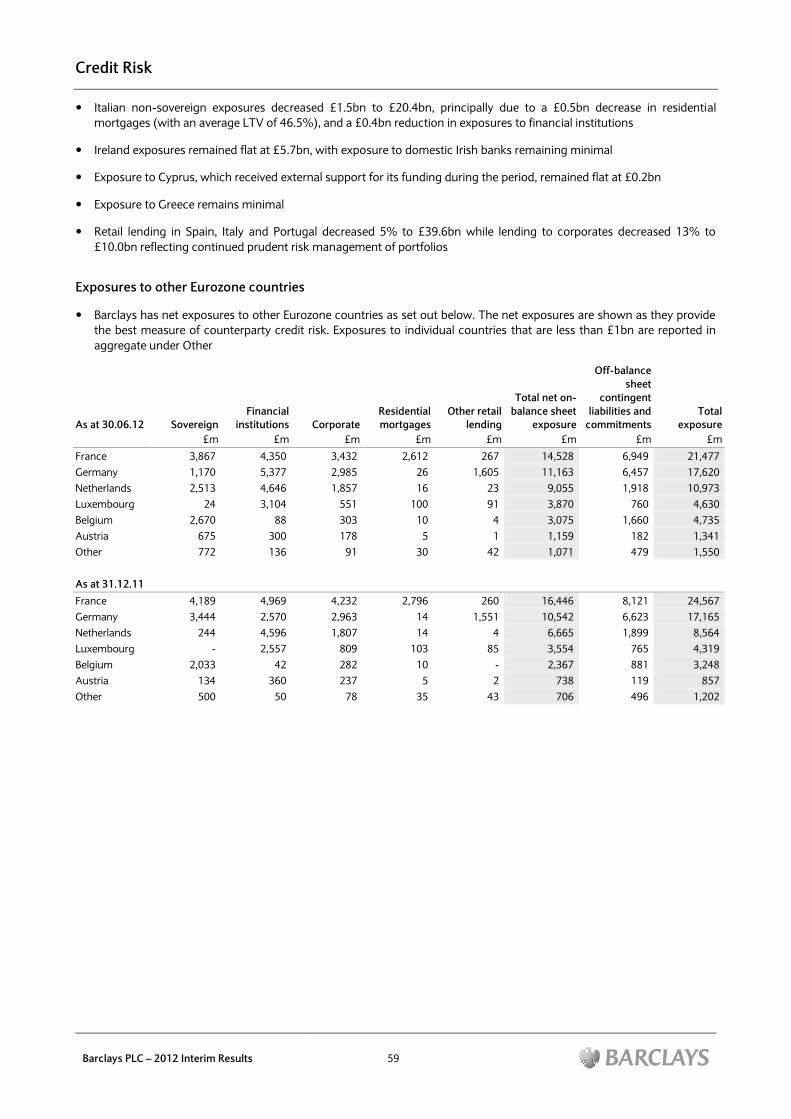
Credit Risk
Barclays PLC – 2012 Interim Results 59
Italian non-sovereign exposures decreased £1.5bn to £20.4bn, principally due to a £0.5bn decrease in residential
mortgages (with an average LTV of 46.5%), and a £0.4bn reduction in exposures to financial institutions
Ireland exposures remained flat at £5.7bn, with exposure to domestic Irish banks remaining minimal
Exposure to Cyprus, which received external support for its funding during the period, remained flat at £0.2bn
Exposure to Greece remains minimal
Retail lending in Spain, Italy and Portugal decreased 5% to £39.6bn while lending to corporates decreased 13% to
£10.0bn reflecting continued prudent risk management of portfolios
Exposures to other Eurozone countries
Barclays has net exposures to other Eurozone countries as set out below. The net exposures are shown as they provide
the best measure of counterparty credit risk. Exposures to individual countries that are less than £1bn are reported in
aggregate under Other
As at 30.06.12 Sovereign
Financial
institutions Corporate
Residential
mortgages
Other retail
lending
Total net on-
balance sheet
exposure
Off-balance
sheet
contingent
liabilities and
commitments
Total
exposure
£m £m £m £m £m £m £m £m
France 3,867 4,350 3,432 2,612 267 14,528 6,949 21,477
Germany 1,170 5,377 2,985 26 1,605 11,163 6,457 17,620
Netherlands 2,513 4,646 1,857 16 23 9,055 1,918 10,973
Luxembourg 24 3,104 551 100 91 3,870 760 4,630
Belgium 2,670 88 303 10 4 3,075 1,660 4,735
Austria 675 300 178 5 1 1,159 182 1,341
Other 772 136 91 30 42 1,071 479 1,550
As at 31.12.11
France 4,189 4,969 4,232 2,796 260 16,446 8,121 24,567
Germany 3,444 2,570 2,963 14 1,551 10,542 6,623 17,165
Netherlands 244 4,596 1,807 14 4 6,665 1,899 8,564
Luxembourg - 2,557 809 103 85 3,554 765 4,319
Belgium 2,033 42 282 10 - 2,367 881 3,248
Austria 134 360 237 5 2 738 119 857
Other 500 50 78 35 43 706 496 1,202
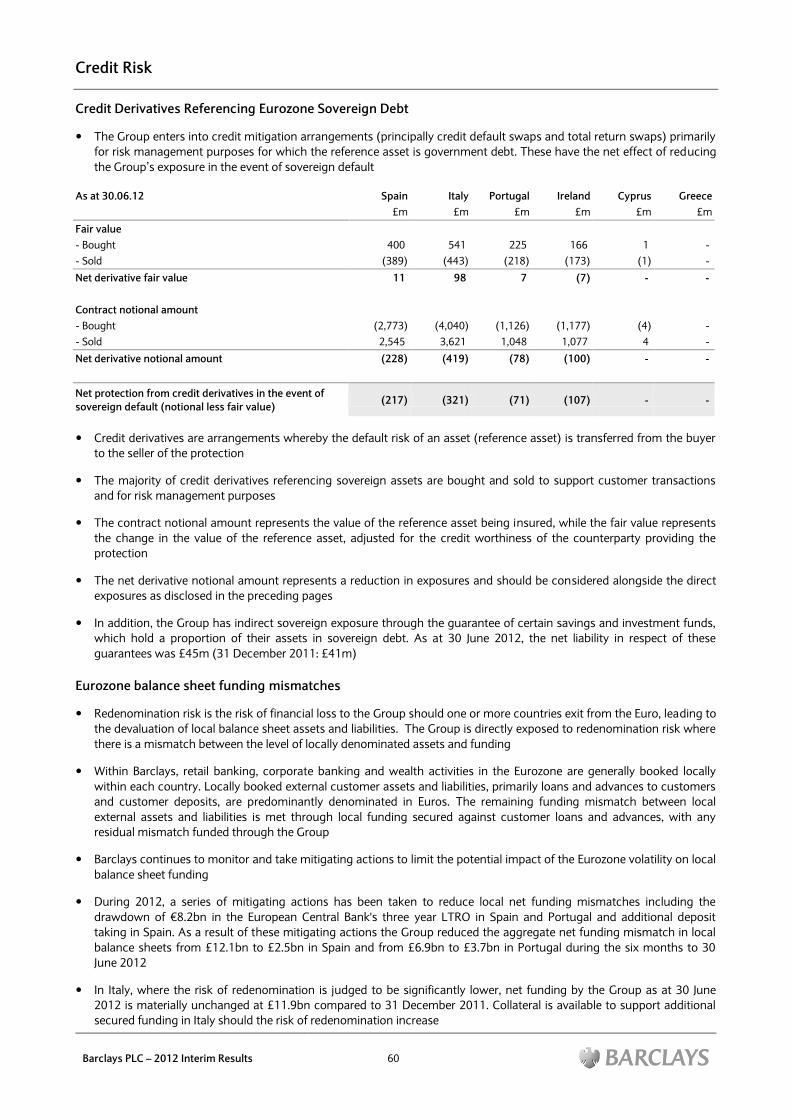
Credit Risk
Barclays PLC – 2012 Interim Results 60
Credit Derivatives Referencing Eurozone Sovereign Debt
The Group enters into credit mitigation arrangements (principally credit default swaps and total return swaps) primarily
for risk management purposes for which the reference asset is government debt. These have the net effect of reducing
the Group‟s exposure in the event of sovereign default
As at 30.06.12 Spain Italy Portugal Ireland Cyprus Greece
£m £m £m £m £m £m
Fair value
- Bought 400 541 225 166 1 -
- Sold (389) (443) (218) (173) (1) -
Net derivative fair value 11 98 7 (7) - -
Contract notional amount
- Bought (2,773) (4,040) (1,126) (1,177) (4) -
- Sold 2,545 3,621 1,048 1,077 4 -
Net derivative notional amount (228) (419) (78) (100) - -
Net protection from credit derivatives in the event of
sovereign default (notional less fair value) (217) (321) (71) (107) - -
Credit derivatives are arrangements whereby the default risk of an asset (reference asset) is transferred from the buyer
to the seller of the protection
The majority of credit derivatives referencing sovereign assets are bought and sold to support customer transactions
and for risk management purposes
The contract notional amount represents the value of the reference asset being insured, while the fair value represents
the change in the value of the reference asset, adjusted for the credit worthiness of the counterparty providing the
protection
The net derivative notional amount represents a reduction in exposures and should be considered alongside the direct
exposures as disclosed in the preceding pages
In addition, the Group has indirect sovereign exposure through the guarantee of certain savings and investment funds,
which hold a proportion of their assets in sovereign debt. As at 30 June 2012, the net liability in respect of these
guarantees was £45m (31 December 2011: £41m)
Eurozone balance sheet funding mismatches
Redenomination risk is the risk of financial loss to the Group should one or more countries exit from the Euro, leading to
the devaluation of local balance sheet assets and liabilities. The Group is directly exposed to redenomination risk where
there is a mismatch between the level of locally denominated assets and funding
Within Barclays, retail banking, corporate banking and wealth activities in the Eurozone are generally booked locally
within each country. Locally booked external customer assets and liabilities, primarily loans and advances to customers
and customer deposits, are predominantly denominated in Euros. The remaining funding mismatch between local
external assets and liabilities is met through local funding secured against customer loans and advances, with any
residual mismatch funded through the Group
Barclays continues to monitor and take mitigating actions to limit the potential impact of the Eurozone volatility on local
balance sheet funding
During 2012, a series of mitigating actions has been taken to reduce local net funding mismatches including the
drawdown of €8.2bn in the European Central Bank's three year LTRO in Spain and Portugal and additional deposit
taking in Spain. As a result of these mitigating actions the Group reduced the aggregate net funding mismatch in local
balance sheets from £12.1bn to £2.5bn in Spain and from £6.9bn to £3.7bn in Portugal during the six months to 30
June 2012
In Italy, where the risk of redenomination is judged to be significantly lower, net funding by the Group as at 30 June
2012 is materially unchanged at £11.9bn compared to 31 December 2011. Collateral is available to support additional
secured funding in Italy should the risk of redenomination increase
Credit Risk
Barclays PLC – 2012 Interim Results 61
Direct exposure to Greece is very small with negligible net funding required from Group. For Ireland there is no local
balance sheet funding requirement by the Group as total liabilities in this country exceed total assets
Detailed Eurozone credit exposures tables
Basis of preparation
Further detail for the Eurozone countries deemed as higher risk and that are the subject of particular market focus is
disclosed in the following tables (pages 62 to 68)
The following tables are prepared on the same basis as the 2011 Results Announcement and present the direct balance
sheet exposure to credit risk by country, with the totals reflecting allowance for impairment, netting and cash collateral
held where appropriate
Trading and derivatives balances relate to investment banking activities, principally as market-maker for government
bond positions. Positions are held at fair value, with daily movements taken through profit and loss. Assets and liabilities
are presented by counterparty type, whereby positions are netted to the extent allowable under IFRS excluding cross
border netting for multinational counterparties. Cash collateral is then presented by counterparty to give a net credit
exposure
Available for sale assets are principally investments in government bonds and other debt securities held for the
purposes of interest rate hedging and liquidity for local banking activities. Balances are reported on a fair value basis,
with movements in fair value going through equity
Loans and advances held at amortised cost1 comprise: (i) retail lending portfolios, predominantly mortgages secured on
residential property; and (ii) corporate lending portfolios, largely reflecting established corporate banking businesses in
Spain, Italy and Portugal and investment banking services provided to multinational and large national corporate clients.
Settlement balances and cash collateral are excluded from this analysis
Sovereign exposures reflect direct exposures to central and local governments2, the majority of which are used for
hedging interest rate risk relating to local activities. These positions are being actively replaced by non-government
instruments such as interest rate swaps. The remaining portion is actively managed reflecting our role as a leading
primary dealer, market-maker and liquidity provider to our clients
Financial institution and corporate exposures reflect the country of operations of the counterparty (including foreign
subsidiaries and without reference to cross-border guarantees)
Retail exposures reflect the country of residence of retail customers
Exposures on loans and advances to other geographies including Europe as a whole are set out on page 46
Off-balance sheet exposure consists primarily of undrawn commitments and guarantees issued to third parties on
behalf of our corporate clients. Information on the terms and potential limitations of such facilities is presented on page
83
1 The Group also enters into reverse repurchase agreements and other similar secured lending, which are fully collateralised.
2 In addition, the Group held cash with the central banks of these countries totalling £0.4bn as at 30 June 2012. Other immaterial balances with central
banks are classified within loans to financial institutions.
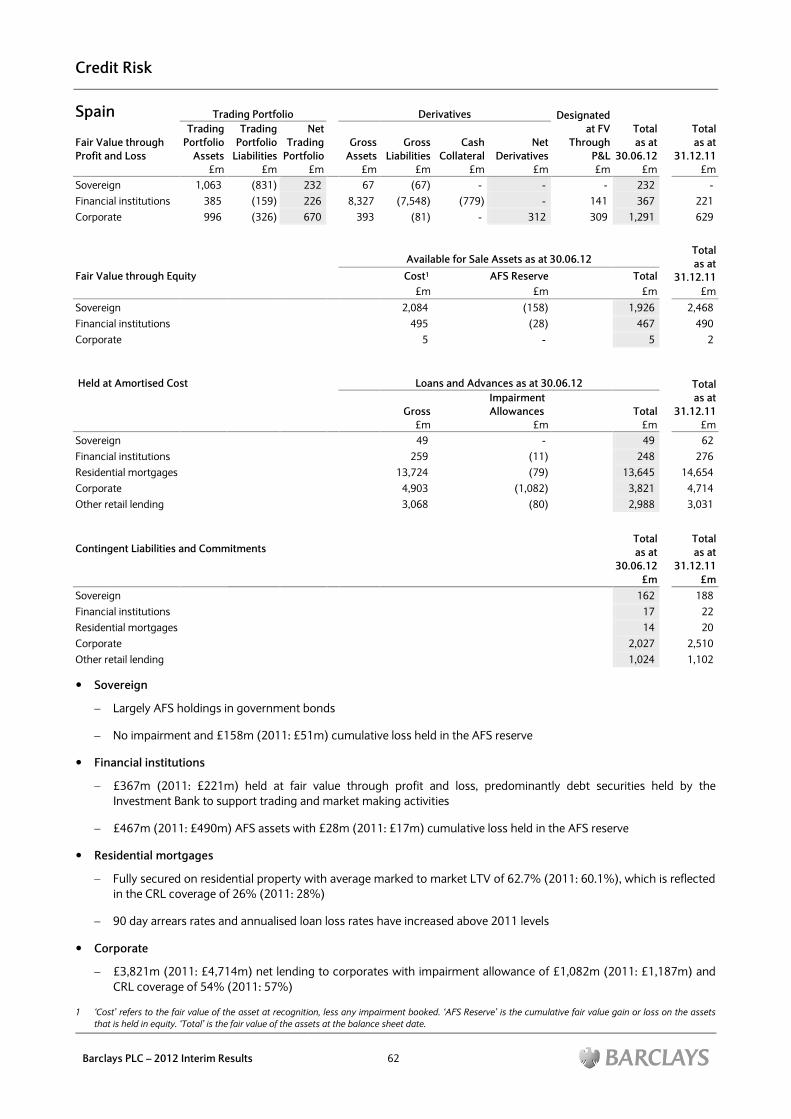
Credit Risk
Barclays PLC – 2012 Interim Results 62
Spain Trading Portfolio Derivatives Designated
at FV
Through
P&L
Fair Value through
Profit and Loss
Trading
Portfolio
Assets
Trading
Portfolio
Liabilities
Net
Trading
Portfolio
Gross
Assets
Gross
Liabilities
Cash
Collateral Net
Derivatives
Total
as at
30.06.12
Total
as at
31.12.11
£m £m £m £m £m £m £m £m £m £m
Sovereign 1,063 (831) 232 67 (67) - - - 232 -
Financial institutions 385 (159) 226 8,327 (7,548) (779) - 141 367 221
Corporate 996 (326) 670 393 (81) - 312 309 1,291 629
Total
as at
31.12.11
Available for Sale Assets as at 30.06.12
Fair Value through Equity Cost1 AFS Reserve Total
£m £m £m £m
Sovereign 2,084 (158) 1,926 2,468
Financial institutions 495 (28) 467 490
Corporate 5 - 5 2
Total
as at
31.12.11
Held at Amortised Cost Loans and Advances as at 30.06.12
Gross Impairment
Allowances Total
£m £m £m £m
Sovereign 49 - 49 62
Financial institutions 259 (11) 248 276
Residential mortgages 13,724 (79) 13,645 14,654
Corporate 4,903 (1,082) 3,821 4,714
Other retail lending 3,068 (80) 2,988 3,031
Total
as at
30.06.12
Total
as at
31.12.11
Contingent Liabilities and Commitments
£m £m
Sovereign 162 188
Financial institutions 17 22
Residential mortgages 14 20
Corporate 2,027 2,510
Other retail lending 1,024 1,102
Sovereign
Largely AFS holdings in government bonds
No impairment and £158m (2011: £51m) cumulative loss held in the AFS reserve
Financial institutions
£367m (2011: £221m) held at fair value through profit and loss, predominantly debt securities held by the
Investment Bank to support trading and market making activities
£467m (2011: £490m) AFS assets with £28m (2011: £17m) cumulative loss held in the AFS reserve
Residential mortgages
Fully secured on residential property with average marked to market LTV of 62.7% (2011: 60.1%), which is reflected
in the CRL coverage of 26% (2011: 28%)
90 day arrears rates and annualised loan loss rates have increased above 2011 levels
Corporate
£3,821m (2011: £4,714m) net lending to corporates with impairment allowance of £1,082m (2011: £1,187m) and
CRL coverage of 54% (2011: 57%)
1 „Cost‟ refers to the fair value of the asset at recognition, less any impairment booked. „AFS Reserve‟ is the cumulative fair value gain or loss on the assets
that is held in equity. „Total‟ is the fair value of the assets at the balance sheet date.
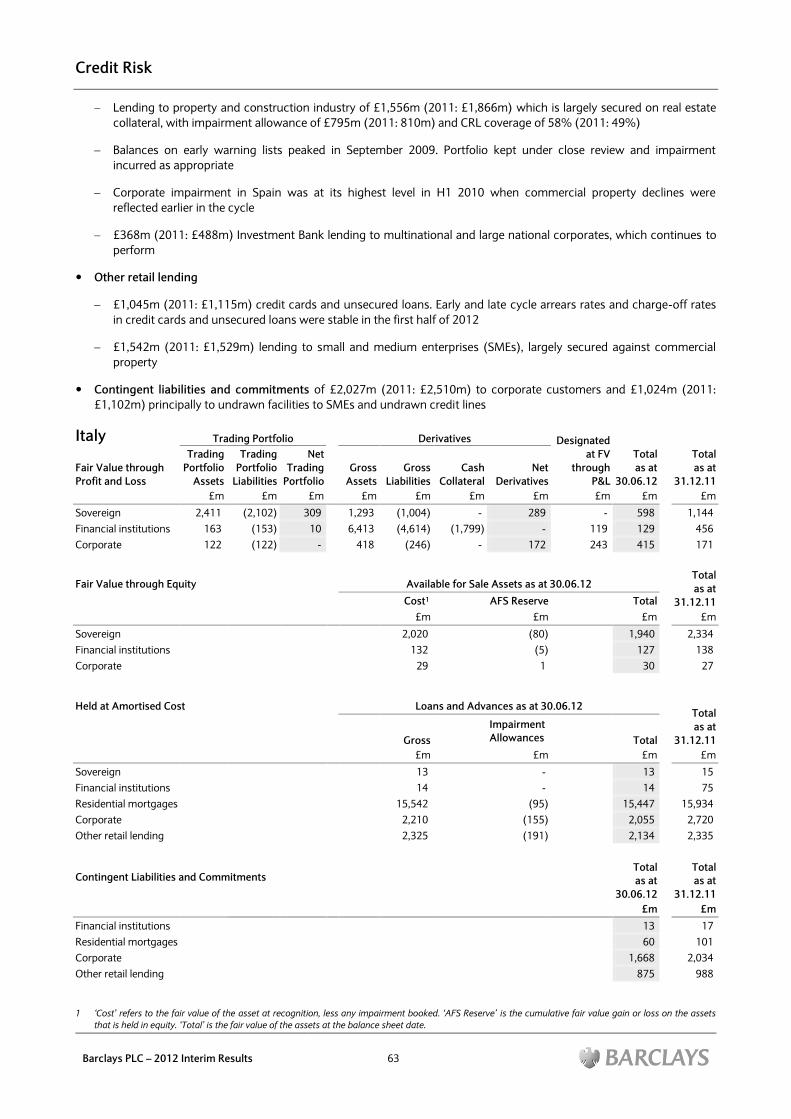
Credit Risk
Barclays PLC – 2012 Interim Results 63
Lending to property and construction industry of £1,556m (2011: £1,866m) which is largely secured on real estate
collateral, with impairment allowance of £795m (2011: 810m) and CRL coverage of 58% (2011: 49%)
Balances on early warning lists peaked in September 2009. Portfolio kept under close review and impairment
incurred as appropriate
Corporate impairment in Spain was at its highest level in H1 2010 when commercial property declines were
reflected earlier in the cycle
£368m (2011: £488m) Investment Bank lending to multinational and large national corporates, which continues to
perform
Other retail lending
£1,045m (2011: £1,115m) credit cards and unsecured loans. Early and late cycle arrears rates and charge-off rates
in credit cards and unsecured loans were stable in the first half of 2012
£1,542m (2011: £1,529m) lending to small and medium enterprises (SMEs), largely secured against commercial
property
Contingent liabilities and commitments of £2,027m (2011: £2,510m) to corporate customers and £1,024m (2011:
£1,102m) principally to undrawn facilities to SMEs and undrawn credit lines
Italy Trading Portfolio Derivatives Designated
at FV
through
P&L
Fair Value through
Profit and Loss
Trading
Portfolio
Assets
Trading
Portfolio
Liabilities
Net
Trading
Portfolio
Gross
Assets
Gross
Liabilities
Cash
Collateral Net
Derivatives
Total
as at
30.06.12
Total
as at
31.12.11
£m £m £m £m £m £m £m £m £m £m
Sovereign 2,411 (2,102) 309 1,293 (1,004) - 289 - 598 1,144
Financial institutions 163 (153) 10 6,413 (4,614) (1,799) - 119 129 456
Corporate 122 (122) - 418 (246) - 172 243 415 171
Total
as at
31.12.11
Fair Value through Equity Available for Sale Assets as at 30.06.12
Cost1 AFS Reserve Total
£m £m £m £m
Sovereign 2,020 (80) 1,940 2,334
Financial institutions 132 (5) 127 138
Corporate 29 1 30 27
Total
as at
31.12.11
Held at Amortised Cost Loans and Advances as at 30.06.12
Gross
Impairment
Allowances
Total
£m £m £m £m
Sovereign 13 - 13 15
Financial institutions 14 - 14 75
Residential mortgages 15,542 (95) 15,447 15,934
Corporate 2,210 (155) 2,055 2,720
Other retail lending 2,325 (191) 2,134 2,335
Total
as at
30.06.12
Total
as at
31.12.11
Contingent Liabilities and Commitments
£m £m
Financial institutions
13 17
Residential mortgages
60 101
Corporate
1,668 2,034
Other retail lending
875 988
1 „Cost‟ refers to the fair value of the asset at recognition, less any impairment booked. „AFS Reserve‟ is the cumulative fair value gain or loss on the assets
that is held in equity. „Total‟ is the fair value of the assets at the balance sheet date.
Credit Risk
Barclays PLC – 2012 Interim Results 64
Sovereign
Largely holdings in government bonds held at fair value
£309m (2011: £566m) trading portfolio and £1,940m (2011: £2,334m) AFS assets with £80m (2011: £123m)
cumulative loss held in the AFS reserve
Financial institutions
Predominantly investments in debt securities, including £127m (2011: £138m) AFS assets and £10m (2011:
£287m) trading portfolio, the majority held by the Investment Bank to support trading and market making activities
Residential mortgages
Fully secured on residential property with average marked to market LTVs of 46.5% (2011: 46.9%)
90 day arrears rates were stable in H1 12
The CRL coverage of 23% (2011: 25%) reflects the above
Corporate
Focused on large corporate clients with very limited exposure to property sector
Balances in early warning lists broadly stable since December 2011
Majority of exposures categorised as Strong or Satisfactory
Other retail lending
£1,503m (2011: £1,615m) Italian salary advance loans (repayment deducted at source by qualifying employers and
Barclays is insured in the event of termination of employment or death). Arrears rates on salary loans improved in
H1 12 while charge-off rates deteriorated in the same period
£432m (2011: £483m) credit cards and other unsecured loans. While arrears rates have marginally deteriorated, the
charge-off rates have improved within the cards portfolio
Contingent liabilities and commitments of £1,668m (2011: £2,034m) to corporate customers and £875m (2011:
£988m) principally undrawn credit card lines
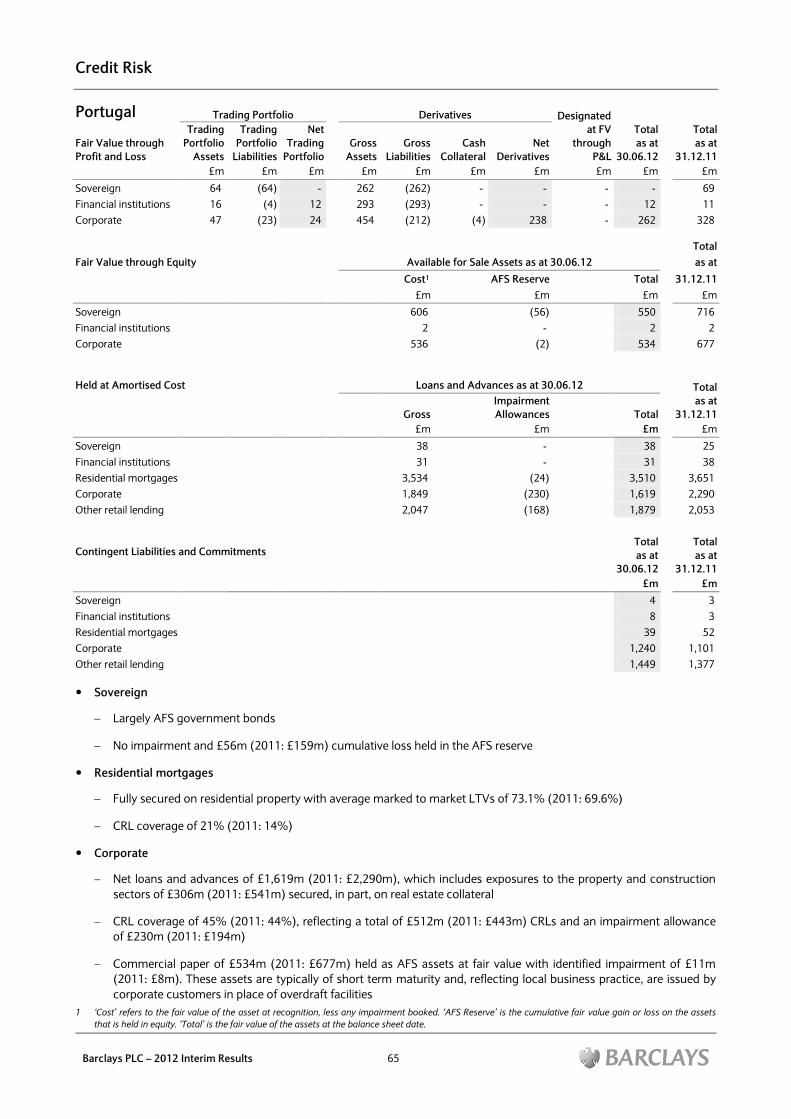
Credit Risk
Barclays PLC – 2012 Interim Results 65
Portugal Trading Portfolio Derivatives Designated
at FV
through
P&L
Fair Value through
Profit and Loss
Trading
Portfolio
Assets
Trading
Portfolio
Liabilities
Net
Trading
Portfolio
Gross
Assets
Gross
Liabilities
Cash
Collateral Net
Derivatives
Total
as at
30.06.12
Total
as at
31.12.11
£m £m £m £m £m £m £m £m £m £m
Sovereign 64 (64) - 262 (262) - - - - 69
Financial institutions 16 (4) 12 293 (293) - - - 12 11
Corporate 47 (23) 24 454 (212) (4) 238 - 262 328
Total
Fair Value through Equity Available for Sale Assets as at 30.06.12 as at
Cost1 AFS Reserve Total 31.12.11
£m £m £m £m
Sovereign 606 (56) 550 716
Financial institutions 2 - 2 2
Corporate 536 (2) 534 677
Total
as at
31.12.11
Held at Amortised Cost Loans and Advances as at 30.06.12
Gross
Impairment
Allowances
Total
£m £m £m £m
Sovereign 38 - 38 25
Financial institutions 31 - 31 38
Residential mortgages 3,534 (24) 3,510 3,651
Corporate 1,849 (230) 1,619 2,290
Other retail lending 2,047 (168) 1,879 2,053
Total
as at
30.06.12
Total
as at
31.12.11
Contingent Liabilities and Commitments
£m £m
Sovereign
4 3
Financial institutions
8 3
Residential mortgages
39 52
Corporate
1,240 1,101
Other retail lending
1,449 1,377
Sovereign
Largely AFS government bonds
No impairment and £56m (2011: £159m) cumulative loss held in the AFS reserve
Residential mortgages
Fully secured on residential property with average marked to market LTVs of 73.1% (2011: 69.6%)
CRL coverage of 21% (2011: 14%)
Corporate
Net loans and advances of £1,619m (2011: £2,290m), which includes exposures to the property and construction
sectors of £306m (2011: £541m) secured, in part, on real estate collateral
CRL coverage of 45% (2011: 44%), reflecting a total of £512m (2011: £443m) CRLs and an impairment allowance
of £230m (2011: £194m)
Commercial paper of £534m (2011: £677m) held as AFS assets at fair value with identified impairment of £11m
(2011: £8m). These assets are typically of short term maturity and, reflecting local business practice, are issued by
corporate customers in place of overdraft facilities
1 „Cost‟ refers to the fair value of the asset at recognition, less any impairment booked. „AFS Reserve‟ is the cumulative fair value gain or loss on the assets
that is held in equity. „Total‟ is the fair value of the assets at the balance sheet date.
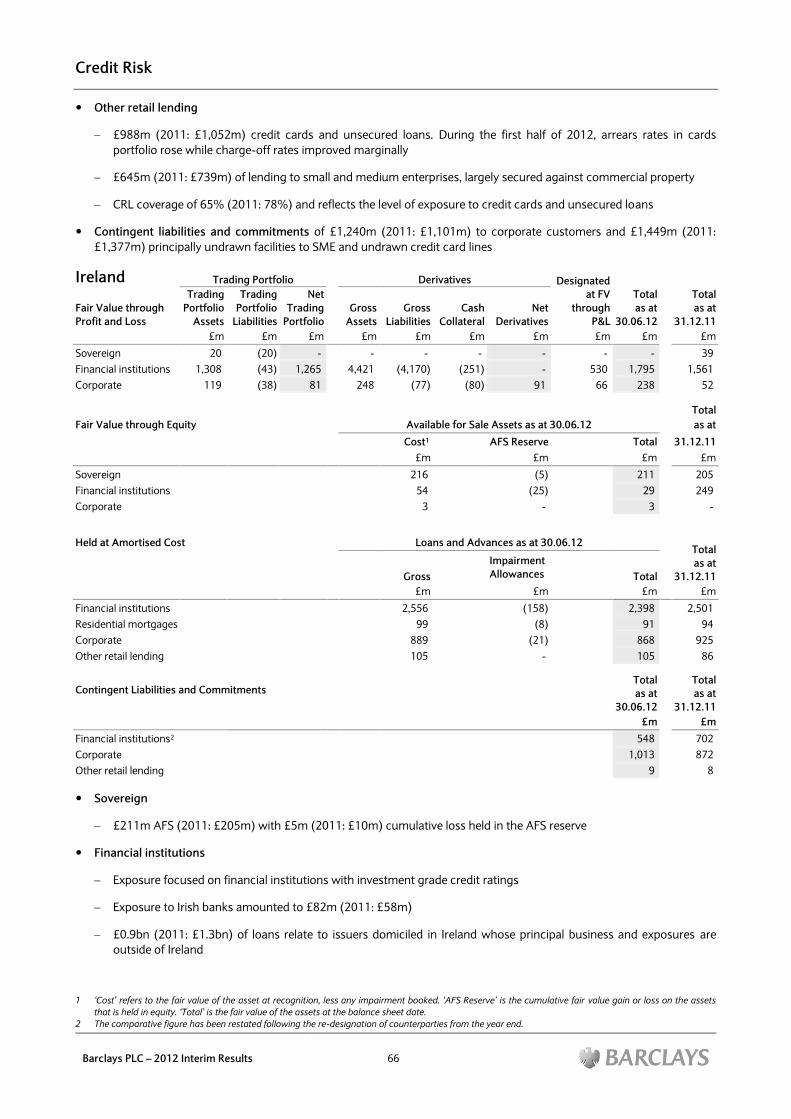
Credit Risk
Barclays PLC – 2012 Interim Results 66
Other retail lending
£988m (2011: £1,052m) credit cards and unsecured loans. During the first half of 2012, arrears rates in cards
portfolio rose while charge-off rates improved marginally
£645m (2011: £739m) of lending to small and medium enterprises, largely secured against commercial property
CRL coverage of 65% (2011: 78%) and reflects the level of exposure to credit cards and unsecured loans
Contingent liabilities and commitments of £1,240m (2011: £1,101m) to corporate customers and £1,449m (2011:
£1,377m) principally undrawn facilities to SME and undrawn credit card lines
Ireland Trading Portfolio Derivatives Designated
at FV
through
P&L
Fair Value through
Profit and Loss
Trading
Portfolio
Assets
Trading
Portfolio
Liabilities
Net
Trading
Portfolio
Gross
Assets
Gross
Liabilities
Cash
Collateral Net
Derivatives
Total
as at
30.06.12
Total
as at
31.12.11
£m £m £m £m £m £m £m £m £m £m
Sovereign 20 (20) - - - - - - - 39
Financial institutions 1,308 (43) 1,265 4,421 (4,170) (251) - 530 1,795 1,561
Corporate 119 (38) 81 248 (77) (80) 91 66 238 52
Total
Fair Value through Equity Available for Sale Assets as at 30.06.12 as at
Cost1 AFS Reserve Total 31.12.11
£m £m £m £m
Sovereign 216 (5) 211 205
Financial institutions 54 (25) 29 249
Corporate 3 - 3 -
Total
as at
31.12.11
Held at Amortised Cost Loans and Advances as at 30.06.12
Gross
Impairment
Allowances
Total
£m £m £m £m
Financial institutions 2,556 (158) 2,398 2,501
Residential mortgages 99 (8) 91 94
Corporate 889 (21) 868 925
Other retail lending 105 - 105 86
Total
as at
30.06.12
Total
as at
31.12.11
Contingent Liabilities and Commitments
£m £m
Financial institutions2
548 702
Corporate
1,013 872
Other retail lending
9 8
Sovereign
£211m AFS (2011: £205m) with £5m (2011: £10m) cumulative loss held in the AFS reserve
Financial institutions
Exposure focused on financial institutions with investment grade credit ratings
Exposure to Irish banks amounted to £82m (2011: £58m)
£0.9bn (2011: £1.3bn) of loans relate to issuers domiciled in Ireland whose principal business and exposures are
outside of Ireland
1 „Cost‟ refers to the fair value of the asset at recognition, less any impairment booked. „AFS Reserve‟ is the cumulative fair value gain or loss on the assets
that is held in equity. „Total‟ is the fair value of the assets at the balance sheet date.
2 The comparative figure has been restated following the re-designation of counterparties from the year end.
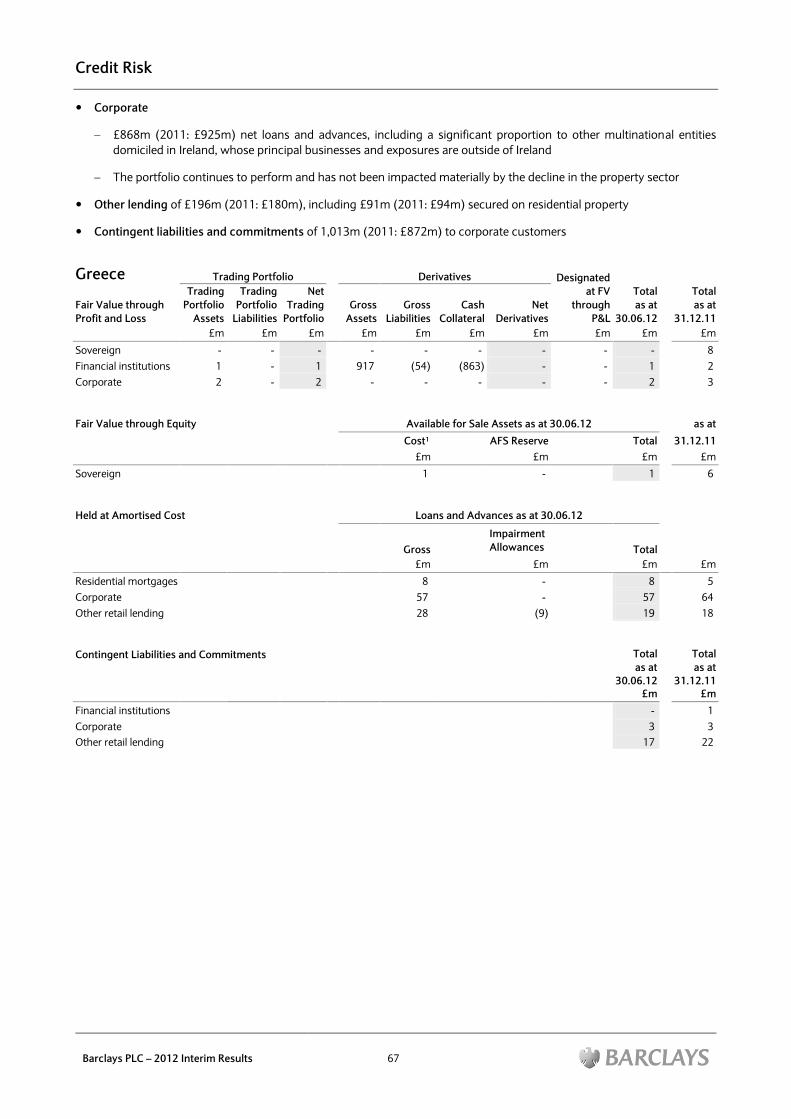
Credit Risk
Barclays PLC – 2012 Interim Results 67
Corporate
£868m (2011: £925m) net loans and advances, including a significant proportion to other multinational entities
domiciled in Ireland, whose principal businesses and exposures are outside of Ireland
The portfolio continues to perform and has not been impacted materially by the decline in the property sector
Other lending of £196m (2011: £180m), including £91m (2011: £94m) secured on residential property
Contingent liabilities and commitments of 1,013m (2011: £872m) to corporate customers
Greece Trading Portfolio Derivatives Designated
at FV
through
P&L
Fair Value through
Profit and Loss
Trading
Portfolio
Assets
Trading
Portfolio
Liabilities
Net
Trading
Portfolio
Gross
Assets
Gross
Liabilities
Cash
Collateral Net
Derivatives
Total
as at
30.06.12
Total
as at
31.12.11
£m £m £m £m £m £m £m £m £m £m
Sovereign - - - - - - - - - 8
Financial institutions 1 - 1 917 (54) (863) - - 1 2
Corporate 2 - 2 - - - - - 2 3
Fair Value through Equity Available for Sale Assets as at 30.06.12 as at
Cost1 AFS Reserve Total 31.12.11
£m £m £m £m
Sovereign 1 - 1 6
Held at Amortised Cost Loans and Advances as at 30.06.12
Gross
Impairment
Allowances
Total
£m £m £m £m
Residential mortgages 8 - 8 5
Corporate 57 - 57 64
Other retail lending 28 (9) 19 18
Contingent Liabilities and Commitments
Total
as at
30.06.12
Total
as at
31.12.11
£m £m
Financial institutions
- 1
Corporate
3 3
Other retail lending
17 22
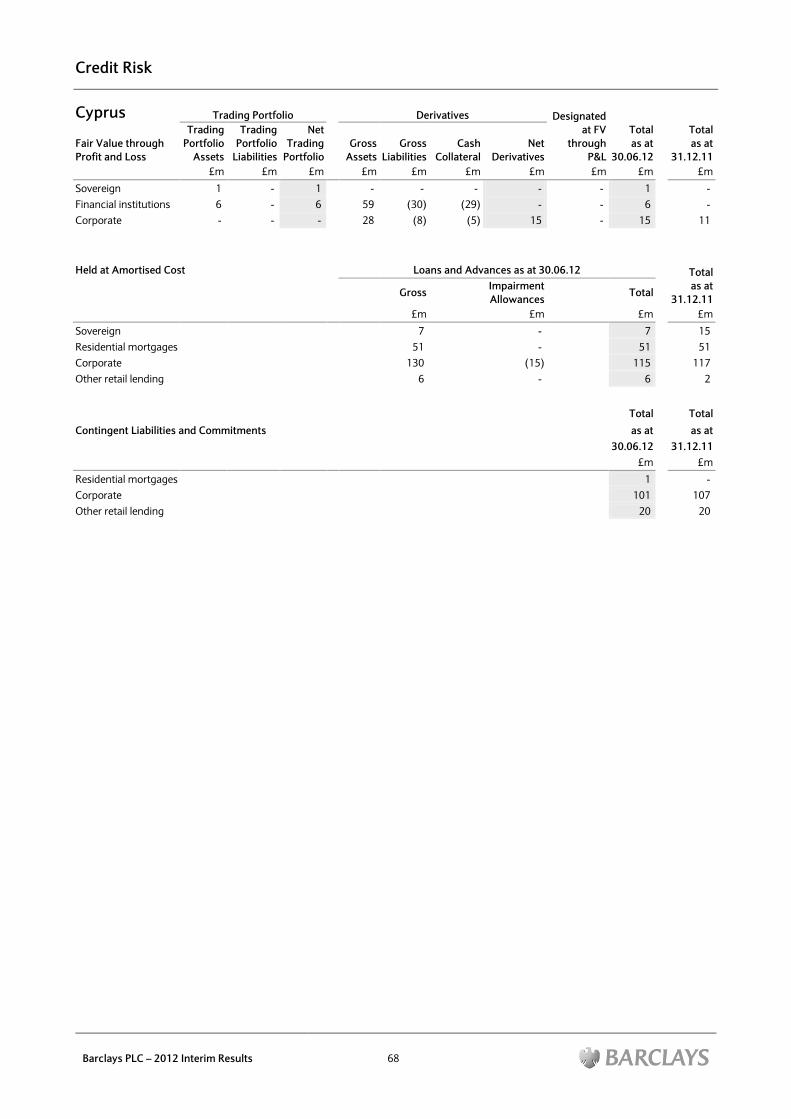
Credit Risk
Barclays PLC – 2012 Interim Results 68
Cyprus Trading Portfolio Derivatives Designated
at FV
through
P&L
Fair Value through
Profit and Loss
Trading
Portfolio
Assets
Trading
Portfolio
Liabilities
Net
Trading
Portfolio
Gross
Assets
Gross
Liabilities
Cash
Collateral Net
Derivatives
Total
as at
30.06.12
Total
as at
31.12.11
£m £m £m £m £m £m £m £m £m £m
Sovereign 1 - 1 - - - - - 1 -
Financial institutions 6 - 6 59 (30) (29) - - 6 -
Corporate - - - 28 (8) (5) 15 - 15 11
Total
as at
31.12.11
Held at Amortised Cost Loans and Advances as at 30.06.12
Gross Impairment
Allowances Total
£m £m £m £m
Sovereign 7 - 7 15
Residential mortgages 51 - 51 51
Corporate 130 (15) 115 117
Other retail lending 6 - 6 2
Total Total
Contingent Liabilities and Commitments as at as at
30.06.12 31.12.11
£m £m
Residential mortgages 1 -
Corporate 101 107
Other retail lending 20 20
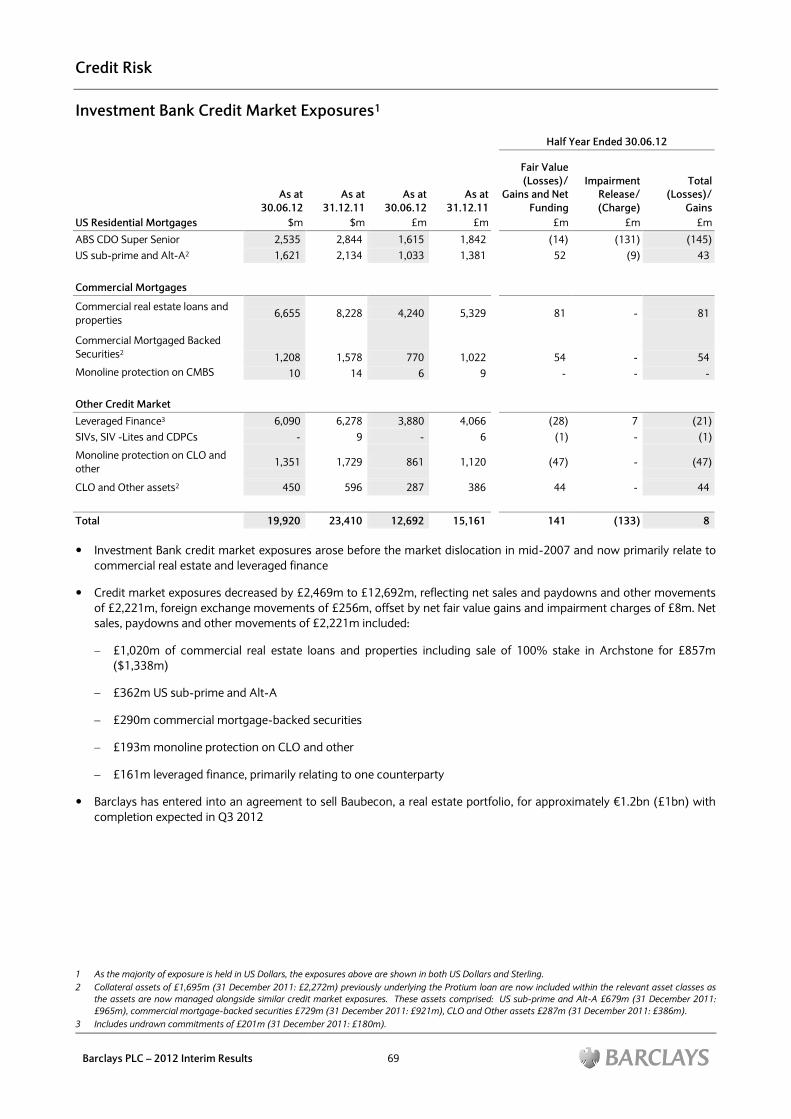
Credit Risk
Barclays PLC – 2012 Interim Results 69
Investment Bank Credit Market Exposures1
Half Year Ended 30.06.12
As at
30.06.12
As at
31.12.11
As at
30.06.12
As at
31.12.11
Fair Value
(Losses)/
Gains and Net
Funding
Impairment
Release/
(Charge)
Total
(Losses)/
Gains
US Residential Mortgages $m $m £m £m £m £m £m
ABS CDO Super Senior 2,535 2,844 1,615 1,842 (14) (131) (145)
US sub-prime and Alt-A2 1,621 2,134 1,033 1,381 52 (9) 43
Commercial Mortgages
Commercial real estate loans and
properties 6,655 8,228 4,240 5,329 81 - 81
Commercial Mortgaged Backed
Securities2 1,208 1,578 770 1,022 54 - 54
Monoline protection on CMBS 10 14 6 9 - - -
Other Credit Market
Leveraged Finance3 6,090 6,278 3,880 4,066 (28) 7 (21)
SIVs, SIV -Lites and CDPCs - 9 - 6 (1) - (1)
Monoline protection on CLO and
other 1,351 1,729 861 1,120 (47) - (47)
CLO and Other assets2 450 596 287 386 44 - 44
Total 19,920 23,410 12,692 15,161 141 (133) 8
Investment Bank credit market exposures arose before the market dislocation in mid-2007 and now primarily relate to
commercial real estate and leveraged finance
Credit market exposures decreased by £2,469m to £12,692m, reflecting net sales and paydowns and other movements
of £2,221m, foreign exchange movements of £256m, offset by net fair value gains and impairment charges of £8m. Net
sales, paydowns and other movements of £2,221m included:
£1,020m of commercial real estate loans and properties including sale of 100% stake in Archstone for £857m
($1,338m)
£362m US sub-prime and Alt-A
£290m commercial mortgage-backed securities
£193m monoline protection on CLO and other
£161m leveraged finance, primarily relating to one counterparty
Barclays has entered into an agreement to sell Baubecon, a real estate portfolio, for approximately €1.2bn (£1bn) with
completion expected in Q3 2012
1 As the majority of exposure is held in US Dollars, the exposures above are shown in both US Dollars and Sterling.
2 Collateral assets of £1,695m (31 December 2011: £2,272m) previously underlying the Protium loan are now included within the relevant asset classes as
the assets are now managed alongside similar credit market exposures. These assets comprised: US sub-prime and Alt-A £679m (31 December 2011:
£965m), commercial mortgage-backed securities £729m (31 December 2011: £921m), CLO and Other assets £287m (31 December 2011: £386m).
3 Includes undrawn commitments of £201m (31 December 2011: £180m).
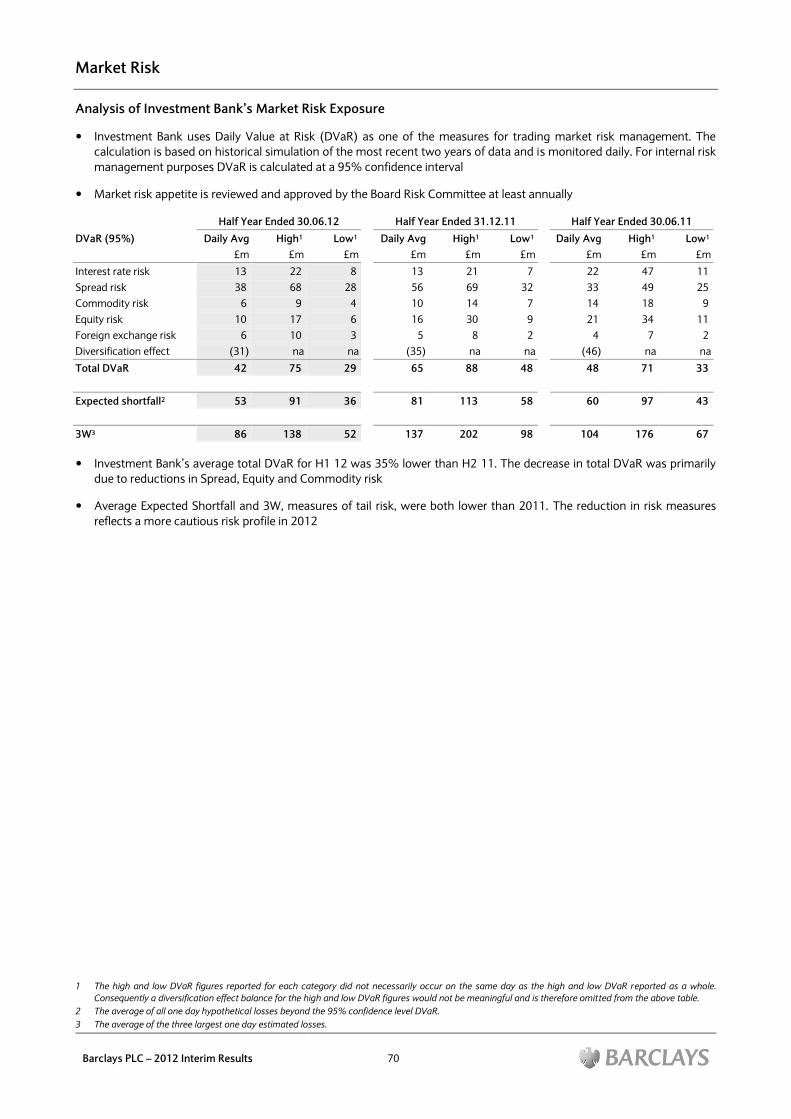
Market Risk
Barclays PLC – 2012 Interim Results 70
Analysis of Investment Bank’s Market Risk Exposure
Investment Bank uses Daily Value at Risk (DVaR) as one of the measures for trading market risk management. The
calculation is based on historical simulation of the most recent two years of data and is monitored daily. For internal risk
management purposes DVaR is calculated at a 95% confidence interval
Market risk appetite is reviewed and approved by the Board Risk Committee at least annually
Half Year Ended 30.06.12 Half Year Ended 31.12.11 Half Year Ended 30.06.11
DVaR (95%) Daily Avg High1 Low1 Daily Avg High1 Low1 Daily Avg High1 Low1
£m £m £m £m £m £m £m £m £m
Interest rate risk 13 22 8 13 21 7 22 47 11
Spread risk 38 68 28 56 69 32 33 49 25
Commodity risk 6 9 4 10 14 7 14 18 9
Equity risk 10 17 6 16 30 9 21 34 11
Foreign exchange risk 6 10 3 5 8 2 4 7 2
Diversification effect (31) na na (35) na na (46) na na
Total DVaR 42 75 29 65 88 48 48 71 33
Expected shortfall2 53 91 36 81 113 58 60 97 43
3W3 86 138 52 137 202 98 104 176 67
Investment Bank‟s average total DVaR for H1 12 was 35% lower than H2 11. The decrease in total DVaR was primarily
due to reductions in Spread, Equity and Commodity risk
Average Expected Shortfall and 3W, measures of tail risk, were both lower than 2011. The reduction in risk measures
reflects a more cautious risk profile in 2012
1 The high and low DVaR figures reported for each category did not necessarily occur on the same day as the high and low DVaR reported as a whole.
Consequently a diversification effect balance for the high and low DVaR figures would not be meaningful and is therefore omitted from the above table.
2 The average of all one day hypothetical losses beyond the 95% confidence level DVaR.
3 The average of the three largest one day estimated losses.

Statement of Directors’ Responsibilities
Barclays PLC – 2012 Interim Results 71
The Directors confirm to the best of their knowledge that the condensed consolidated interim financial statements set out
on pages 9 to 13 and 73 to 90 have been prepared in accordance with International Accounting Standard 34, „Interim
Financial Reporting‟, as adopted by the European Union, and that the interim management report herein includes a fair
review of the information required by Disclosure and Transparency Rules 4.2.7 and 4.2.8 namely:
An indication of important events that have occurred during the six months ended 30 June 2012 and their impact on the
condensed consolidated interim financial statements, and a description of the principal risks and uncertainties for the
remaining six months of the financial year
Material related party transactions in the six months ended 30 June 2012 and any material changes in the related party
transactions described in the last Annual Report
On behalf of the Board
Marcus Agius Chris Lucas
Chairman Group Finance Director
Independent Auditors’ Review Report to Barclays PLC
Barclays PLC – 2012 Interim Results 72
Introduction
We have been engaged by Barclays PLC to review the condensed set of consolidated interim financial statements in the
interim results announcement for the six months ended 30 June 2012, which comprises the condensed consolidated
income statement on page 9, condensed consolidated statement of profit or loss and other comprehensive income on page
10, condensed consolidated balance sheet on page 11, condensed consolidated statement of changes in equity on page 12,
condensed consolidated cash flow statement on page 13 and related notes on pages 73 to 90. We have read the other
information contained in the interim results announcement and considered whether it contains any apparent
misstatements or material inconsistencies with the information in the condensed consolidated interim financial statements.
Directors’ Responsibilities1,2
The interim results announcement is the responsibility of, and has been approved by, the Directors. The Directors are
responsible for preparing the interim results announcement in accordance with the Disclosure and Transparency Rules of
the United Kingdom's Financial Services Authority.
As disclosed in the „Accounting Policies‟ section, the annual financial statements of the Group are prepared in accordance
with IFRSs as adopted by the European Union. The condensed consolidated interim financial statements included in this
interim results announcement have been prepared in accordance with International Accounting Standard 34, "Interim
Financial Reporting", as adopted by the European Union.
Our Responsibility
Our responsibility is to express to the company a conclusion on the condensed consolidated interim financial statements in
the interim results announcement based on our review. This report, including the conclusion, has been prepared for and
only for the company for the purpose of the Disclosure and Transparency Rules of the Financial Services Authority and for
no other purpose. We do not, in producing this report, accept or assume responsibility for any other purpose or to any other
person to whom this report is shown or into whose hands it may come save where expressly agreed by our prior consent in
writing.
Scope of Review
We conducted our review in accordance with the International Standard on Review Engagements (UK and Ireland) 2410,
„Review of Interim Financial Information Performed by the Independent Auditor of the Entity‟ issued by the Auditing
Practices Board for use in the United Kingdom. A review of interim financial information consists of making enquiries,
primarily of persons responsible for financial and accounting matters, and applying analytical and other review procedures.
A review is substantially less in scope than an audit conducted in accordance with International Standards on Auditing (UK
and Ireland) and consequently does not enable us to obtain assurance that we would become aware of all significant
matters that might be identified in an audit. Accordingly, we do not express an audit opinion.
Conclusion
Based on our review, nothing has come to our attention that causes us to believe that the condensed consolidated interim
financial statements in the interim results announcement for the six months ended 30 June 2012 are not prepared, in all
material respects, in accordance with International Accounting Standard 34 as adopted by the European Union and the
Disclosure and Transparency Rules of the United Kingdom's Financial Services Authority.
PricewaterhouseCoopers LLP
Chartered Accountants London,
United Kingdom
26 July 2012
1 The maintenance and integrity of the Barclays website is the responsibility of the Directors; the work carried out by the auditors does not involve
consideration of these matters and, accordingly, the auditors accept no responsibility for any changes that may have occurred to the financial statements
since they were initially presented on the website.
2 Legislation in the United Kingdom governing the preparation and dissemination of financial statements may differ from legislation in other jurisdictions.
Financial Statement Notes
Barclays PLC – 2012 Interim Results 73
1. Basis of preparation
The Results Announcement has been prepared in accordance with IAS 34 Interim Financial Reporting, using the same
accounting policies and methods of computation as those used in the 2011 Annual Report.
There have been no accounting developments since those disclosed in the 2011 Annual Report that are expected to have a
material impact on the Group‟s 2012 results. There have been and are expected to be a number of significant changes to
the Group‟s financial reporting after 2012 as a result of amended or new accounting standards that have been or will be
issued by the IASB. The most significant of these are as follows:
Effective from 1 January 2013:
From 1 January 2013, the Group will adopt IAS 19 Employee Benefits revised. The main impact of the revision is the
removal of the ability to defer actuarial gains and losses as part of its pension assets and liabilities. The Group will also
include changes in net pension liabilities or assets that do not arise from regular cost, interest (on the net pension
liabilities or assets) or contributions, within Other Comprehensive Income. Details of the financial and capital impact of
these changes are detailed in note 15, page 81
IFRS 10 Consolidated Financial Statements will require the Group to apply different criteria to determine the entities that
are included in the Group‟s consolidated financial statements. It is not yet possible to estimate the financial effects of
adopting the standard
Effective from 1 January 2015:
IFRS 9 Financial Instruments will change the classification and therefore the measurement of its financial assets, the
calculation of impairment and hedge accounting. In addition to these changes, the portion of gains and losses arising
from changes in the Group‟s credit rating included in changes in the value of the Group‟s issued debt securities held at
fair value through profit or loss will be included in other comprehensive income rather than the income statement. The
proposals have yet to be finalised and it is therefore not yet possible to estimate the financial effects.
For more information on the changes, refer to the Barclays 2011 Annual Report.
Going Concern
The Group's business activities and financial position, the factors likely to affect its future development and performance,
and its objectives and policies in managing the financial risks to which it is exposed and its capital are discussed in the
Results by Business, Performance Management and Risk Management sections.
The Directors confirm they are satisfied that the Group has adequate resources to continue in business for the foreseeable
future. For this reason, they continue to adopt the going concern basis for preparing accounts.
2. Net Interest Income
Half Year Half Year Half Year
Ended Ended Ended
30.06.12 31.12.11 30.06.11
£m £m £m
Cash and balances with central banks 169 206 186
Available for sale financial investments 1,683 1,029 1,108
Loans and advances to banks 185 192 158
Loans and advances to customers 8,471 8,681 8,590
Other 178 285 154
Interest income 10,686 10,393 10,196
Deposits from banks (171) (221) (145)
Customer accounts (1,864) (1,494) (1,032)
Debt securities in issue (1,583) (1,711) (1,813)
Subordinated liabilities (817) (910) (903)
Other (139) (45) (114)
Interest expense (4,574) (4,381) (4,007)
Net interest income 6,112 6,012 6,189
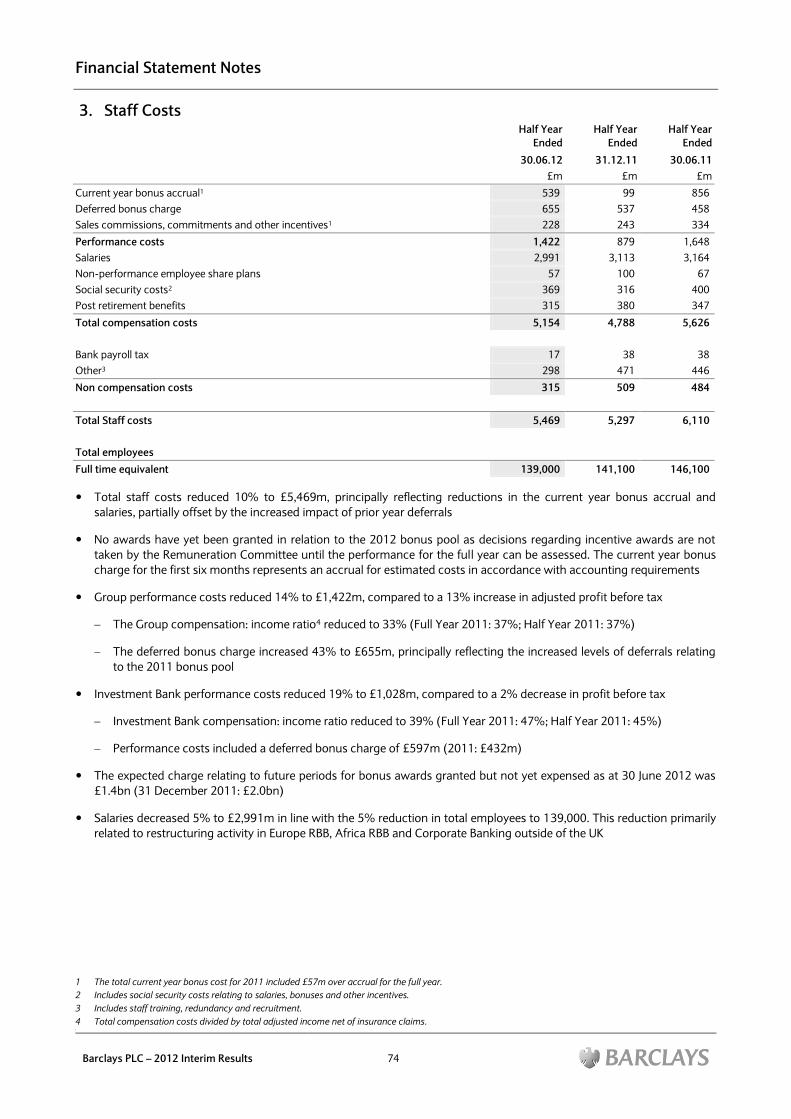
Financial Statement Notes
Barclays PLC – 2012 Interim Results 74
3. Staff Costs
Half Year
Ended
Half Year
Ended
Half Year
Ended
30.06.12 31.12.11 30.06.11
£m £m £m
Current year bonus accrual1 539 99 856
Deferred bonus charge 655 537 458
Sales commissions, commitments and other incentives1 228 243 334
Performance costs 1,422 879 1,648
Salaries 2,991 3,113 3,164
Non-performance employee share plans 57 100 67
Social security costs2 369 316 400
Post retirement benefits 315 380 347
Total compensation costs 5,154 4,788 5,626
Bank payroll tax 17 38 38
Other3 298 471 446
Non compensation costs 315 509 484
Total Staff costs 5,469 5,297 6,110
Total employees
Full time equivalent 139,000 141,100 146,100
Total staff costs reduced 10% to £5,469m, principally reflecting reductions in the current year bonus accrual and
salaries, partially offset by the increased impact of prior year deferrals
No awards have yet been granted in relation to the 2012 bonus pool as decisions regarding incentive awards are not
taken by the Remuneration Committee until the performance for the full year can be assessed. The current year bonus
charge for the first six months represents an accrual for estimated costs in accordance with accounting requirements
Group performance costs reduced 14% to £1,422m, compared to a 13% increase in adjusted profit before tax
The Group compensation: income ratio4 reduced to 33% (Full Year 2011: 37%; Half Year 2011: 37%)
The deferred bonus charge increased 43% to £655m, principally reflecting the increased levels of deferrals relating
to the 2011 bonus pool
Investment Bank performance costs reduced 19% to £1,028m, compared to a 2% decrease in profit before tax
Investment Bank compensation: income ratio reduced to 39% (Full Year 2011: 47%; Half Year 2011: 45%)
Performance costs included a deferred bonus charge of £597m (2011: £432m)
The expected charge relating to future periods for bonus awards granted but not yet expensed as at 30 June 2012 was
£1.4bn (31 December 2011: £2.0bn)
Salaries decreased 5% to £2,991m in line with the 5% reduction in total employees to 139,000. This reduction primarily
related to restructuring activity in Europe RBB, Africa RBB and Corporate Banking outside of the UK
1 The total current year bonus cost for 2011 included £57m over accrual for the full year.
2 Includes social security costs relating to salaries, bonuses and other incentives.
3 Includes staff training, redundancy and recruitment.
4 Total compensation costs divided by total adjusted income net of insurance claims.
4
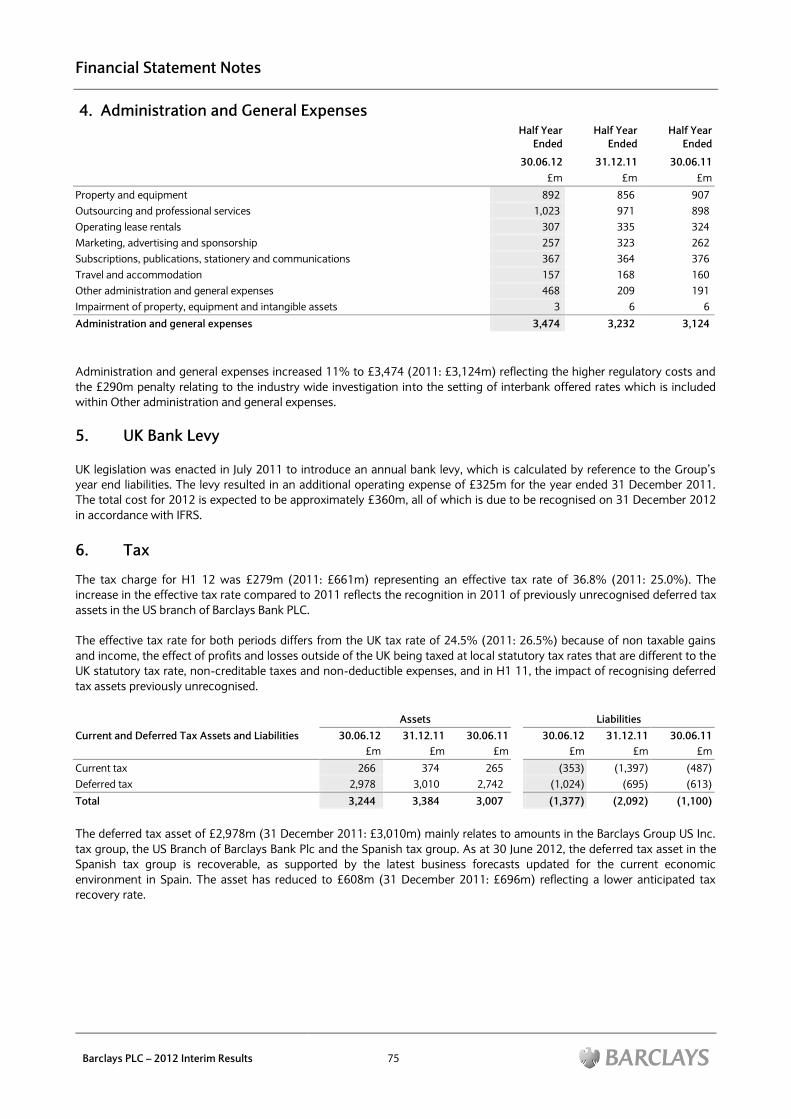
Financial Statement Notes
Barclays PLC – 2012 Interim Results 75
4. Administration and General Expenses
Half Year
Ended
Half Year
Ended
Half Year
Ended
30.06.12 31.12.11 30.06.11
£m £m £m
Property and equipment 892 856 907
Outsourcing and professional services 1,023 971 898
Operating lease rentals 307 335 324
Marketing, advertising and sponsorship 257 323 262
Subscriptions, publications, stationery and communications 367 364 376
Travel and accommodation 157 168 160
Other administration and general expenses 468 209 191
Impairment of property, equipment and intangible assets 3 6 6
Administration and general expenses 3,474 3,232 3,124
Administration and general expenses increased 11% to £3,474 (2011: £3,124m) reflecting the higher regulatory costs and
the £290m penalty relating to the industry wide investigation into the setting of interbank offered rates which is included
within Other administration and general expenses.
5. UK Bank Levy
UK legislation was enacted in July 2011 to introduce an annual bank levy, which is calculated by reference to the Group‟s
year end liabilities. The levy resulted in an additional operating expense of £325m for the year ended 31 December 2011.
The total cost for 2012 is expected to be approximately £360m, all of which is due to be recognised on 31 December 2012
in accordance with IFRS.
6. Tax
The tax charge for H1 12 was £279m (2011: £661m) representing an effective tax rate of 36.8% (2011: 25.0%). The
increase in the effective tax rate compared to 2011 reflects the recognition in 2011 of previously unrecognised deferred tax
assets in the US branch of Barclays Bank PLC.
The effective tax rate for both periods differs from the UK tax rate of 24.5% (2011: 26.5%) because of non taxable gains
and income, the effect of profits and losses outside of the UK being taxed at local statutory tax rates that are different to the
UK statutory tax rate, non-creditable taxes and non-deductible expenses, and in H1 11, the impact of recognising deferred
tax assets previously unrecognised.
Assets Liabilities
Current and Deferred Tax Assets and Liabilities 30.06.12 31.12.11 30.06.11 30.06.12 31.12.11 30.06.11
£m £m £m £m £m £m
Current tax 266 374 265 (353) (1,397) (487)
Deferred tax 2,978 3,010 2,742 (1,024) (695) (613)
Total 3,244 3,384 3,007 (1,377) (2,092) (1,100)
The deferred tax asset of £2,978m (31 December 2011: £3,010m) mainly relates to amounts in the Barclays Group US Inc.
tax group, the US Branch of Barclays Bank Plc and the Spanish tax group. As at 30 June 2012, the deferred tax asset in the
Spanish tax group is recoverable, as supported by the latest business forecasts updated for the current economic
environment in Spain. The asset has reduced to £608m (31 December 2011: £696m) reflecting a lower anticipated tax
recovery rate.
Financial Statement Notes
Barclays PLC – 2012 Interim Results 76
7. Non-controlling Interests
Profit Attributable to Non-controlling
Interest
Equity Attributable to Non-controlling
Interest
Half Year
Ended
Half Year
Ended
Half Year
Ended
Half Year
Ended
Half Year
Ended
Half Year
Ended
30.06.12 31.12.11 30.06.11 30.06.12 31.12.11 30.06.11
£m £m £m £m £m £m
Barclays Bank PLC Issued:
- Preference shares 232 234 231 5,942 5,929 5,948
- Reserve Capital Instruments (RCIs) - 12 34 - - 529
- Upper Tier 2 instruments 2 2 1 589 586 586
Absa Group Limited 154 204 197 2,842 2,861 3,110
Other non-controlling interests 22 7 22 112 231 244
Total 410 459 485 9,485 9,607 10,417
RCIs with a nominal value of $1.25bn and $0.75bn were redeemed at Barclays option in June and December 2011
respectively.
8. Earnings Per Share
Half Year
Ended
Half Year
Ended
Half Year
Ended
30.06.12 31.12.11 30.06.11
£m £m £m
Profit attributable to equity holders of the parent 70 1,509 1,498
Dilutive impact of convertible options - 2 (2)
Profit attributable to equity holders of the parent including dilutive impact of
convertible options 70 1,511 1,496
Impact of adjusting items1 2,589 (525) 839
Adjusted Profit attributable to equity holders of the parent including dilutive impact of
convertible options 2,659 986 2,335
Basic weighted average number of shares in issue2 12,215m 11,976m 11,938m
Number of potential ordinary shares 317m 511m 651m
Diluted weighted average number of shares 12,532m 12,487m 12,589m
Basic earnings per ordinary share 0.6p 12.6p 12.5p
Diluted earnings per ordinary share 0.6p 12.1p 11.9p
Adjusted earnings per ordinary share 21.8p 8.2p 19.6p
9. Dividends on Ordinary Shares
It is Barclays policy to declare and pay dividends on a quarterly basis. The first interim cash dividend for 2012 of 1p per
share was paid on 8 June 2012. The Board has decided to pay on 7 September 2012, a second dividend for 2012 of 1p per
ordinary share to shareholders on the share register on 10 August 2012, making a total for the first half of 2012 of 2p
(2011: 2p).
Half Year Ended 30.06.12 Half Year Ended 31.12.11 Half Year Ended 30.06.11
Dividends Paid During the Period Per Share Total Per Share Total Per Share Total
Pence £m Pence £m Pence £m
Final dividend paid during period 3.0p 366 - - 2.5p 298
Interim dividends paid during period 1.0p 122 2.0p 241 1.0p 121
For qualifying US and Canadian resident ADR holders, the interim dividend of 1p per ordinary share becomes 4p per ADS
(representing four shares). The ADR depositary will post the interim dividend on 7 September 2012 to ADR holders on the
record at close of business on 10 August 2012.
1 Adjusted performance measures exclude the impact of own credit, gains on debt buy-backs, impairment and gain/(loss)on disposal of BlackRock investment, provision
for PPI redress, provision for interest rate hedging products redress, goodwill impairment and (losses) on acquisitions and disposals as detailed on page 8. The tax
impact of these items is a charge of £879m (H2 11: credit of £845m; H1 11: charge of £242m).
2 The number of basic weighted average number of shares excludes Treasury shares held in employee benefit trusts for trading.
Financial Statement Notes
Barclays PLC – 2012 Interim Results 77
10. Derivative Financial Instruments
Contract
Notional
Amount
Fair Value
As at 30.06.12 Assets Liabilities
£m £m £m
Foreign exchange derivatives 5,067,266 58,663 (63,369)
Interest rate derivatives 38,549,480 374,353 (357,665)
Credit derivatives 1,926,860 48,100 (46,539)
Equity and stock index and commodity derivatives 1,504,099 31,582 (34,917)
Derivative assets/(liabilities) held for trading 47,047,705 512,698 (502,490)
Derivatives in Hedge Accounting Relationships
Derivatives designated as cash flow hedges 210,141 2,760 (1,414)
Derivatives designated as fair value hedges 133,581 2,121 (3,388)
Derivatives designated as hedges of net investments 10,246 106 (59)
Derivative assets/(liabilities) designated in hedge accounting relationships 353,968 4,987 (4,861)
Total recognised derivative assets/(liabilities) 47,401,673 517,685 (507,351)
As at 31.12.11
Foreign exchange derivatives 4,452,874 63,822 (67,280)
Interest rate derivatives 35,541,980 372,570 (357,440)
Credit derivatives 1,886,650 63,312 (61,348)
Equity and stock index and commodity derivatives 1,214,487 35,602 (38,484)
Derivative assets/(liabilities) held for trading 43,095,991 535,306 (524,552)
Derivatives in Hedge Accounting Relationships
Derivatives designated as cash flow hedges 157,149 2,150 (1,726)
Derivatives designated as fair value hedges 74,375 1,447 (1,238)
Derivatives designated as hedges of net investments 12,010 61 (394)
Derivative assets/(liabilities) designated in hedge accounting relationships 243,534 3,658 (3,358)
Total recognised derivative assets/(liabilities) 43,339,525 538,964 (527,910)
As at 30.06.11
Foreign exchange derivatives 3,965,712 54,186 (57,176)
Interest rate derivatives 37,739,893 238,645 (220,854)
Credit derivatives 2,085,191 45,883 (44,169)
Equity and stock index and commodity derivatives 1,268,250 39,090 (41,907)
Derivative assets/(liabilities) held for trading 45,059,046 377,804 (364,106)
Derivatives in Hedge Accounting Relationships
Derivatives designated as cash flow hedges 164,846 891 (848)
Derivatives designated as fair value hedges 98,245 1,077 (1,116)
Derivatives designated as hedges of net investments 15,405 82 (466)
Derivative assets/(liabilities) designated in hedge accounting relationships 278,496 2,050 (2,430)
Total recognised derivative assets/(liabilities) 45,337,542 379,854 (366,536)
The fair value of gross derivative assets decreased by 4% to £518bn (31 December 2011: £539bn) reflecting the impact of
optimisation initiatives to reduce gross derivative exposures, and the tightening of credit spreads, offset by decreases in the
major forward curves.
Derivative asset exposures would be £477bn (31 December 2011: £492bn) lower than reported under IFRS if netting were
permitted for assets and liabilities with the same counterparty or for which we hold cash collateral. Derivative liabilities
would be £463bn (31 December 2011: £478bn) lower reflecting counterparty netting and collateral placed.
Financial Statement Notes
Barclays PLC – 2012 Interim Results 78
11. Financial Instruments Held at Fair Value
The table below shows the financial assets and liabilities that are recognised and measured at fair value analysed by level
within the fair value hierarchy.
Valuations Based on
Quoted
Market Prices
Observable
Inputs
Significant
Unobservable
Inputs
(Level 1) (Level 2) (Level 3) Total
As at 30.06.12 £m £m £m £m
Trading portfolio assets 71,695 86,130 8,475 166,300
Financial assets designated at fair value 9,469 28,919 7,540 45,928
Derivative financial assets 1,902 507,126 8,657 517,685
Available for sale assets 31,377 34,571 2,974 68,922
Total Assets 114,443 656,746 27,646 798,835
Trading portfolio liabilities (25,387) (26,251) (109) (51,747)
Financial liabilities designated at fair value (51) (92,002) (2,802) (94,855)
Derivative financial liabilities (1,887) (498,776) (6,688) (507,351)
Total Liabilities (27,325) (617,029) (9,599) (653,953)
As at 31.12.11
Trading portfolio assets 61,530 81,449 9,204 152,183
Financial assets designated at fair value 4,179 24,091 8,679 36,949
Derivative financial assets 2,550 525,147 11,267 538,964
Available for sale assets 30,857 34,761 2,873 68,491
Total Assets 99,116 665,448 32,023 796,587
Trading portfolio liabilities (26,155) (19,726) (6) (45,887)
Financial liabilities designated at fair value (39) (84,822) (3,136) (87,997)
Derivative financial liabilities (2,263) (517,066) (8,581) (527,910)
Total Liabilities (28,457) (621,614) (11,723) (661,794)
As at 30.06.11
Trading portfolio assets 53,259 117,703 10,837 181,799
Financial assets designated at fair value 5,875 22,304 10,943 39,122
Derivative financial assets 3,001 368,690 8,163 379,854
Available for sale assets 44,945 34,139 2,753 81,837
Total Assets 107,080 542,836 32,696 682,612
Trading portfolio liabilities (36,919) (40,282) (7) (77,208)
Financial liabilities designated at fair value (100) (88,862) (3,511) (92,473)
Derivative financial liabilities (2,424) (358,930) (5,182) (366,536)
Total Liabilities (39,443) (488,074) (8,700) (536,217)
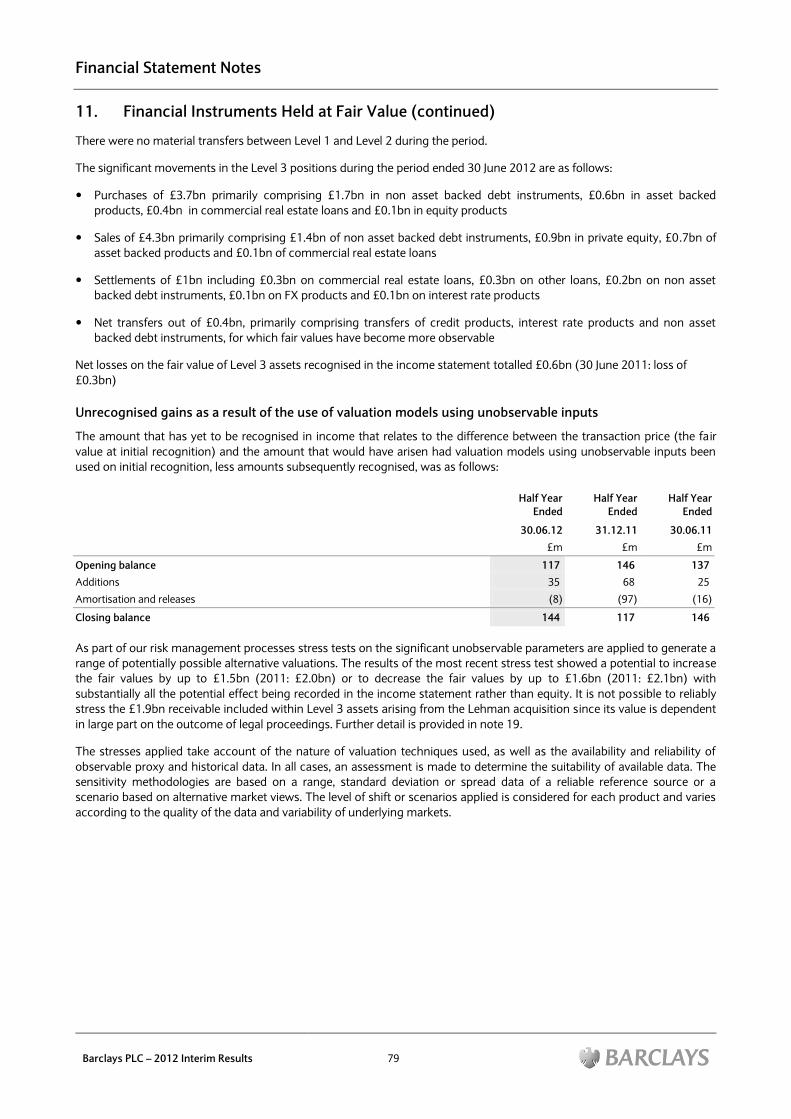
Financial Statement Notes
Barclays PLC – 2012 Interim Results 79
11. Financial Instruments Held at Fair Value (continued)
There were no material transfers between Level 1 and Level 2 during the period.
The significant movements in the Level 3 positions during the period ended 30 June 2012 are as follows:
Purchases of £3.7bn primarily comprising £1.7bn in non asset backed debt instruments, £0.6bn in asset backed
products, £0.4bn in commercial real estate loans and £0.1bn in equity products
Sales of £4.3bn primarily comprising £1.4bn of non asset backed debt instruments, £0.9bn in private equity, £0.7bn of
asset backed products and £0.1bn of commercial real estate loans
Settlements of £1bn including £0.3bn on commercial real estate loans, £0.3bn on other loans, £0.2bn on non asset
backed debt instruments, £0.1bn on FX products and £0.1bn on interest rate products
Net transfers out of £0.4bn, primarily comprising transfers of credit products, interest rate products and non asset
backed debt instruments, for which fair values have become more observable
Net losses on the fair value of Level 3 assets recognised in the income statement totalled £0.6bn (30 June 2011: loss of
£0.3bn)
Unrecognised gains as a result of the use of valuation models using unobservable inputs
The amount that has yet to be recognised in income that relates to the difference between the transaction price (the fair
value at initial recognition) and the amount that would have arisen had valuation models using unobservable inputs been
used on initial recognition, less amounts subsequently recognised, was as follows:
Half Year
Ended
Half Year
Ended
Half Year
Ended
30.06.12 31.12.11 30.06.11
£m £m £m
Opening balance 117 146 137
Additions 35 68 25
Amortisation and releases (8) (97) (16)
Closing balance 144 117 146
As part of our risk management processes stress tests on the significant unobservable parameters are applied to generate a
range of potentially possible alternative valuations. The results of the most recent stress test showed a potential to increase
the fair values by up to £1.5bn (2011: £2.0bn) or to decrease the fair values by up to £1.6bn (2011: £2.1bn) with
substantially all the potential effect being recorded in the income statement rather than equity. It is not possible to reliably
stress the £1.9bn receivable included within Level 3 assets arising from the Lehman acquisition since its value is dependent
in large part on the outcome of legal proceedings. Further detail is provided in note 19.
The stresses applied take account of the nature of valuation techniques used, as well as the availability and reliability of
observable proxy and historical data. In all cases, an assessment is made to determine the suitability of available data. The
sensitivity methodologies are based on a range, standard deviation or spread data of a reliable reference source or a
scenario based on alternative market views. The level of shift or scenarios applied is considered for each product and varies
according to the quality of the data and variability of underlying markets.
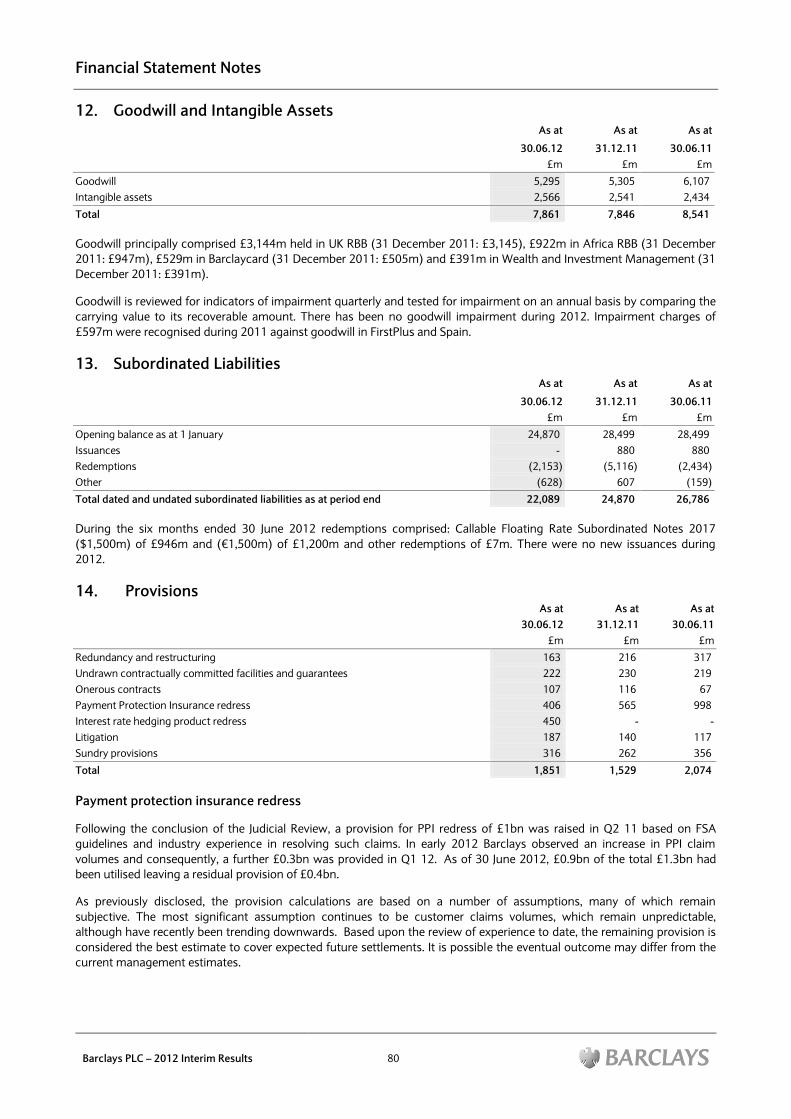
Financial Statement Notes
Barclays PLC – 2012 Interim Results 80
12. Goodwill and Intangible Assets
As at As at As at
30.06.12 31.12.11 30.06.11
£m £m £m
Goodwill 5,295 5,305 6,107
Intangible assets 2,566 2,541 2,434
Total 7,861 7,846 8,541
Goodwill principally comprised £3,144m held in UK RBB (31 December 2011: £3,145), £922m in Africa RBB (31 December
2011: £947m), £529m in Barclaycard (31 December 2011: £505m) and £391m in Wealth and Investment Management (31
December 2011: £391m).
Goodwill is reviewed for indicators of impairment quarterly and tested for impairment on an annual basis by comparing the
carrying value to its recoverable amount. There has been no goodwill impairment during 2012. Impairment charges of
£597m were recognised during 2011 against goodwill in FirstPlus and Spain.
13. Subordinated Liabilities
As at As at As at
30.06.12 31.12.11 30.06.11
£m £m £m
Opening balance as at 1 January 24,870 28,499 28,499
Issuances - 880 880
Redemptions (2,153) (5,116) (2,434)
Other (628) 607 (159)
Total dated and undated subordinated liabilities as at period end 22,089 24,870 26,786
During the six months ended 30 June 2012 redemptions comprised: Callable Floating Rate Subordinated Notes 2017
($1,500m) of £946m and (€1,500m) of £1,200m and other redemptions of £7m. There were no new issuances during
2012.
14. Provisions
As at As at As at
30.06.12 31.12.11 30.06.11
£m £m £m
Redundancy and restructuring 163 216 317
Undrawn contractually committed facilities and guarantees 222 230 219
Onerous contracts 107 116 67
Payment Protection Insurance redress 406 565 998
Interest rate hedging product redress 450 - -
Litigation 187 140 117
Sundry provisions 316 262 356
Total 1,851 1,529 2,074
Payment protection insurance redress
Following the conclusion of the Judicial Review, a provision for PPI redress of £1bn was raised in Q2 11 based on FSA
guidelines and industry experience in resolving such claims. In early 2012 Barclays observed an increase in PPI claim
volumes and consequently, a further £0.3bn was provided in Q1 12. As of 30 June 2012, £0.9bn of the total £1.3bn had
been utilised leaving a residual provision of £0.4bn.
As previously disclosed, the provision calculations are based on a number of assumptions, many of which remain
subjective. The most significant assumption continues to be customer claims volumes, which remain unpredictable,
although have recently been trending downwards. Based upon the review of experience to date, the remaining provision is
considered the best estimate to cover expected future settlements. It is possible the eventual outcome may differ from the
current management estimates.
Financial Statement Notes
Barclays PLC – 2012 Interim Results 81
14. Provisions (continued)
Interest rate hedging product redress
On 29 June 2012, the FSA announced that it had reached agreement with a number of UK banks (including Barclays) in
relation to a review and redress exercise to be carried out in respect of interest rate hedging products sold to small and
medium sized enterprises. A provision of £450m, reflecting £350m for the costs of redress and £100m to reflect the
widening of credit spreads since the original products were entered into (and which we expect to unwind over the life of the
new arrangements), has been recognised. The ultimate cost of this exercise is uncertain and the provision is based on a
number of initial estimates relating to the appropriate implementation of the agreement. These estimates primarily relate
to the number of customers that will be subject to the review, and to the extent and nature of any redress payable. In this
context, the appropriate provision level will be kept under ongoing review.
15. Retirement Benefits
The Group's IAS 19 pension deficit across all schemes as at 30 June 2012 was £1.3bn (31 December 2011: £0.2bn). This
reflects net recognised assets of £2.0bn (31 December 2011: £1.5bn) and unrecognised actuarial losses of £3.2bn (31
December 2011: £1.7bn). The net recognised assets comprised retirement benefit assets of £2.5bn (31 December 2011:
£1.8bn) and liabilities of £0.5bn (31 December 2011: £0.3bn).
The Group‟s main scheme is the UK Retirement Fund (UKRF). As at 30 June 2012, the UKRF had £2.2bn assets recognised
on the balance sheet (31 December 2011: £1.7bn) and on an IAS 19 basis the scheme liabilities exceeded the assets by
£0.7bn (31 December 2011: surplus of £0.3bn). The most significant reason for the change in the IAS 19 position was a
reduction in the net discount rate, driven by falls in AA corporate bond yields, partially offset by the deficit contribution paid
over in the year.
The latest triennial funding valuation of the UKRF was carried out with an effective date of 30 September 2010, and showed
a deficit of £5.0bn. The Bank and Trustee agreed a funding plan to eliminate the deficit in the fund. As part of this plan,
deficit contributions of £1.8bn were paid to the fund in December 2011 and a further £0.5bn in April 2012. Further deficit
contributions are payable from 2017 to 2021 starting at £0.7bn for 2017 and increasing by approximately 3.5% per annum
until 2021. These deficit contributions are in addition to the regular contributions to meet the Group‟s share of the cost of
benefits accruing over each year.
The latest annual funding update prepared by the Scheme Actuary as at 30 September 2011 showed a funding deficit of
£6.4bn, which was prior to the payment of contributions referred to above in December 2011.
As indicated in Note 1, from 1 January 2013, the Group will adopt IAS 19 revised. Had the Group adopted the revisions in
these interim financial statements the net recognised position would reduce by £3.2bn (31 December 2011: £1.7bn)
resulting in a liability of £1.2bn (31 December 2011: £0.2bn). Profit after tax for the period ended 30 June 2012 would have
been lower by £11m (H2 11: £41m; H1 11: £42m) and other comprehensive income lower by £1.1bn (H2 11: £0.2bn; H1
11: £1.0bn). Shareholders equity would have been reduced by £2.4bn (31 December 2011: £1.3bn) and additional deferred
tax assets of £0.8bn (31 December 2011: £0.5bn) would have been recognised. Due to uncertainties surrounding market
factors, such as interest rates, it is not possible to estimate the impact on the full year financial statements.
16. Share Capital and Warrants
Called up share capital comprises 12,235 million (2011: 12,199 million) ordinary shares of 25p each.
As at 30 June 2012, there were unexercised warrants to subscribe for 379.2 million (2011: 379.2 million) new ordinary
shares at a price of £1.97775. The warrants may be exercised at any time up to close of business on 31 October 2013.
17. Other Reserves
Currency Translation Reserve
Currency translation movements in 2012 of £614m (30 June 2011: £790m), including £71m (30 June 2011: £182m)
associated with non-controlling interests, were largely due to the depreciation of the US Dollar, Rand and Euro against
Sterling. During the period, £20m gain (2011: £3m loss) from the currency translation reserve was recognised in the
income statement.
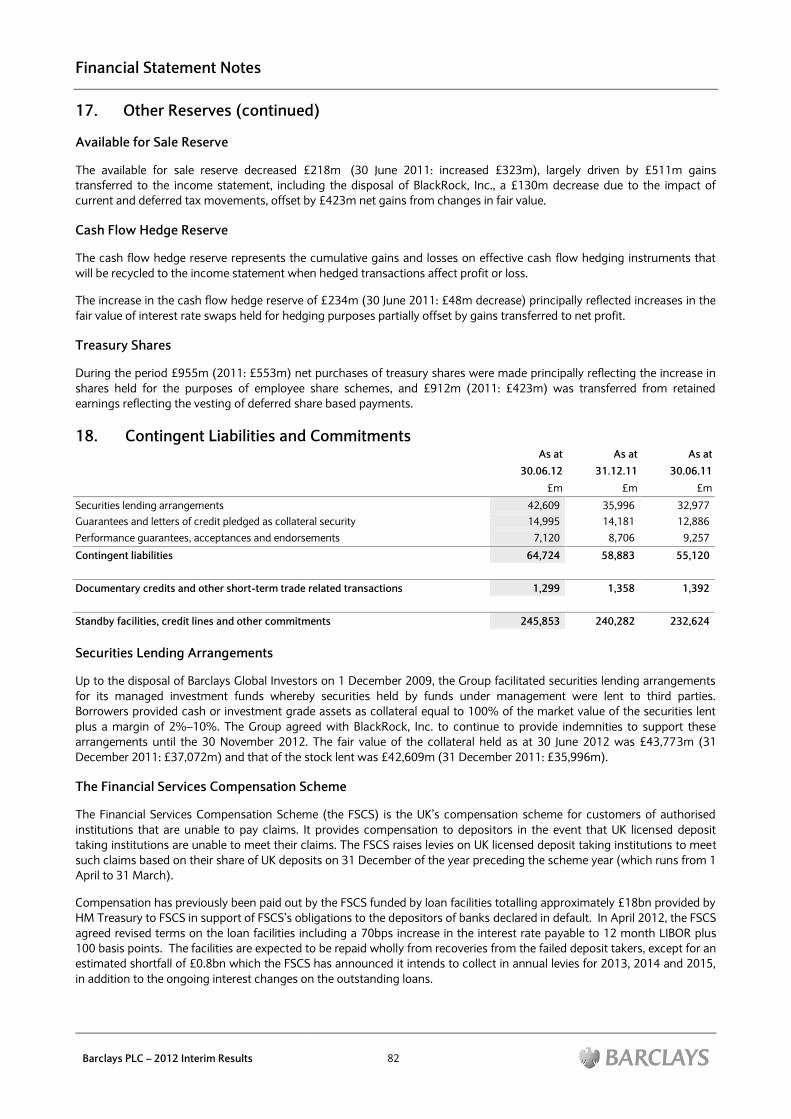
Financial Statement Notes
Barclays PLC – 2012 Interim Results 82
17. Other Reserves (continued)
Available for Sale Reserve
The available for sale reserve decreased £218m (30 June 2011: increased £323m), largely driven by £511m gains
transferred to the income statement, including the disposal of BlackRock, Inc., a £130m decrease due to the impact of
current and deferred tax movements, offset by £423m net gains from changes in fair value.
Cash Flow Hedge Reserve
The cash flow hedge reserve represents the cumulative gains and losses on effective cash flow hedging instruments that
will be recycled to the income statement when hedged transactions affect profit or loss.
The increase in the cash flow hedge reserve of £234m (30 June 2011: £48m decrease) principally reflected increases in the
fair value of interest rate swaps held for hedging purposes partially offset by gains transferred to net profit.
Treasury Shares
During the period £955m (2011: £553m) net purchases of treasury shares were made principally reflecting the increase in
shares held for the purposes of employee share schemes, and £912m (2011: £423m) was transferred from retained
earnings reflecting the vesting of deferred share based payments.
18. Contingent Liabilities and Commitments
As at As at As at
30.06.12 31.12.11 30.06.11
£m £m £m
Securities lending arrangements 42,609 35,996 32,977
Guarantees and letters of credit pledged as collateral security 14,995 14,181 12,886
Performance guarantees, acceptances and endorsements 7,120 8,706 9,257
Contingent liabilities 64,724 58,883 55,120
Documentary credits and other short-term trade related transactions 1,299 1,358 1,392
Standby facilities, credit lines and other commitments 245,853 240,282 232,624
Securities Lending Arrangements
Up to the disposal of Barclays Global Investors on 1 December 2009, the Group facilitated securities lending arrangements
for its managed investment funds whereby securities held by funds under management were lent to third parties.
Borrowers provided cash or investment grade assets as collateral equal to 100% of the market value of the securities lent
plus a margin of 2%–10%. The Group agreed with BlackRock, Inc. to continue to provide indemnities to support these
arrangements until the 30 November 2012. The fair value of the collateral held as at 30 June 2012 was £43,773m (31
December 2011: £37,072m) and that of the stock lent was £42,609m (31 December 2011: £35,996m).
The Financial Services Compensation Scheme
The Financial Services Compensation Scheme (the FSCS) is the UK‟s compensation scheme for customers of authorised
institutions that are unable to pay claims. It provides compensation to depositors in the event that UK licensed deposit
taking institutions are unable to meet their claims. The FSCS raises levies on UK licensed deposit taking institutions to meet
such claims based on their share of UK deposits on 31 December of the year preceding the scheme year (which runs from 1
April to 31 March).
Compensation has previously been paid out by the FSCS funded by loan facilities totalling approximately £18bn provided by
HM Treasury to FSCS in support of FSCS‟s obligations to the depositors of banks declared in default. In April 2012, the FSCS
agreed revised terms on the loan facilities including a 70bps increase in the interest rate payable to 12 month LIBOR plus
100 basis points. The facilities are expected to be repaid wholly from recoveries from the failed deposit takers, except for an
estimated shortfall of £0.8bn which the FSCS has announced it intends to collect in annual levies for 2013, 2014 and 2015,
in addition to the ongoing interest changes on the outstanding loans.
Financial Statement Notes
Barclays PLC – 2012 Interim Results 83
18 Contingent Liabilities and Commitments (continued)
Investment Bank US Mortgage Activities
Barclays activities within the US residential mortgage sector during the period of 2005 through 2008 included: sponsoring
and underwriting of approximately $39bn of private-label securitisations; underwriting of approximately $34bn of other
private-label securitisations; sales of approximately $150m of loans to government sponsored enterprises (GSEs); and sales
of approximately $3bn of loans to others. Some of the loans sold to Barclays were originated by a Barclays subsidiary.
Barclays also performed servicing activities through its US residential mortgage servicing business which Barclays acquired
in Q4 2006 and subsequently sold in Q3 2010.
In connection with Barclays loan sales and some of its sponsored private-label securitisations, Barclays made certain loan
level representations and warranties (R&Ws) generally relating to the underlying borrower, property and/or mortgage
documentation. Under certain circumstances, Barclays may be required to repurchase the related loans or make other
payments related to such loans if the R&Ws are breached. As of 30 June 2012, Barclays R&Ws in respect of approximately
$1bn of loans sold to others had expired. The R&Ws with respect to the balance of the loans sold to others were not subject
to expiration provisions. However, such loans were generally sold at significant discounts and contained more limited R&Ws
than loans sold to GSEs. Third party originators provided loan level R&Ws directly to the securitisation trusts for
approximately $34bn of the $39bn in Barclays sponsored securitisations. Barclays or a subsidiary provided loan level R&Ws
to the securitisation trusts for approximately $5bn of the Barclays sponsored securitisations. R&Ws made by Barclays in
respect of such securitised loans, and the loans sold by Barclays to GSEs, are not subject to expiration provisions. Total
unresolved repurchase requests associated with all loans sold to others and private-label activities were $24m at 30 June
2012. Current provisions are adequate to cover estimated losses associated with outstanding repurchase claims. However,
based upon a large number of defaults occurring in US residential mortgages, there is a potential for additional claims for
repurchases.
Claims against Barclays as an underwriter of RMBS (Residential Mortgage Backed Securities) offerings have been brought in
certain civil actions. See Note 19 – Legal Proceedings. Additionally, Barclays has received inquiries from various regulatory
and governmental authorities regarding its mortgage-related activities and is cooperating with such inquiries.
It is not practicable to provide an estimate of the financial impact of the potential exposure in relation to the foregoing
matters.
19. Legal Proceedings
Lehman Brothers Holdings Inc.
On 15 September 2009, motions were filed in the United States Bankruptcy Court for the Southern District of New York
(Bankruptcy Court) by Lehman Brothers Holdings Inc. (LBHI), the SIPA Trustee for Lehman Brothers Inc. (Trustee) and the
Official Committee of Unsecured Creditors of Lehman Brothers Holdings Inc. (Committee). All three motions challenged
certain aspects of the transaction pursuant to which BCI and other companies in the Group acquired most of the assets of
Lehman Brothers Inc. (LBI) in September 2008 and the Court Order approving such sale (Sale). The claimants were seeking
an order voiding the transfer of certain assets to BCI; requiring BCI to return to the LBI estate alleged excess value BCI
received; and declaring that BCI is not entitled to certain assets that it claims pursuant to the sale documents and Order
approving the Sale (Rule 60 Claims). On 16 November 2009, LBHI, the Trustee and the Committee filed separate complaints
in the Court asserting claims against BCI based on the same underlying allegations as the pending motions and seeking
relief similar to that which is requested in the motions. On 29 January 2010, BCI filed its response to the motions and also
filed a motion seeking delivery of certain assets that LBHI and LBI have failed to deliver as required by the sale documents
and the Court Order approving the Sale (together with the Trustee‟s competing claims to those assets, the Contract
Claims). Approximately $4.3bn (£2.8bn) of the assets acquired as part of the acquisition had not been received by 30 June
2012, approximately $3.0bn (£1.9bn) of which were recognised as part of the accounting for the acquisition and are
included in the balance sheet as at 30 June 2012. This results in an effective provision of $1.3bn (£0.8bn) against the
uncertainty inherent in the litigation.
Financial Statement Notes
Barclays PLC – 2012 Interim Results 84
19. Legal Proceedings (continued)
On 22 February 2011, the Bankruptcy Court issued its Opinion in relation to these matters, rejecting the Rule 60 Claims and
deciding some of the Contract Claims in the Trustee‟s favour and some in favour of BCI. On 15 July 2011, the Bankruptcy
Court entered final Orders implementing its Opinion. Barclays and the Trustee each appealed the Bankruptcy Court‟s
adverse rulings on the Contract Claims to the United States District Court for the Southern District of New York (District
Court). LBHI and the Committee did not pursue an appeal from the Bankruptcy Court‟s ruling on the Rule 60 Claims. After
briefing and argument, the District Court issued its Opinion on 5 June 2012 in which it reversed one of the Bankruptcy
Court‟s rulings on the Contract Claims that had been adverse to Barclays and affirmed the Bankruptcy Court‟s other rulings
on the Contract Claims. On 17 July 2012, the District Court issued an amended Opinion, correcting certain errors but not
otherwise affecting the rulings, and an agreed Judgment implementing the rulings in the Opinion. Barclays and the Trustee
have each filed a notice of appeal from the adverse rulings of the District Court to the United States Court of Appeals for the
Second Circuit.
Under the Judgment of the District Court, Barclays is entitled to receive:
$1.1bn (£0.7bn) from the Trustee in respect of “clearance box” assets;
property held at various institutions to secure obligations under the exchange-traded derivatives transferred to Barclays
in the Sale (the ETD Margin), subject to the proviso that Barclays will be entitled to receive $507m (£0.3bn) of the ETD
Margin only if and to the extent the Trustee has assets available once the Trustee has satisfied all of LBI‟s customer
claims; and
$769m (£0.5bn) from the Trustee in respect of LBI‟s 15c3-3 reserve account assets only if and to the extent the Trustee
has assets available once the Trustee has satisfied all of LBI‟s customer claims.
A portion of the ETD Margin which has not yet been recovered by Barclays or the Trustee is held or owed by certain
institutions outside the United States (including several Lehman affiliates that are subject to insolvency or similar
proceedings). Barclays cannot reliably estimate at this time how much of the ETD Margin held or owed by such institutions
Barclays is ultimately likely to receive. Further, Barclays cannot reliably estimate at this time if and to the extent the Trustee
will have assets remaining available to it to pay Barclays the $507m (£0.3bn) in respect of ETD Margin or the $769m
(£0.5bn) in respect of LBI‟s 15c3-3 reserve account assets after satisfying all of LBI‟s customer claims. If the District Court‟s
rulings were to be unaffected by future proceedings, Barclays estimates that after taking into account the effective
provision of $1.3bn (£0.8bn) its loss would be approximately $0.9bn (£0.6bn), conservatively assuming no recovery by
Barclays of any of the ETD Margin not yet recovered by Barclays or the Trustee that is held or owed by institutions outside
the United States and no recovery by Barclays of the $507m (£0.3bn) in respect of ETD Margin or the $769m (£0.5bn) in
respect of LBI‟s 15c3-3 reserve account assets. Any such loss, however, is not considered probable and Barclays is satisfied
with the current level of provision.
American Depositary Shares
Barclays Bank PLC, Barclays PLC and various current and former members of Barclays PLC's Board of Directors have been
named as defendants in five proposed securities class actions (which have been consolidated) pending in the United States
District Court for the Southern District of New York (the Court). The consolidated amended complaint, dated 12 February
2010, alleges that the registration statements relating to American Depositary Shares representing Preferred Stock, Series 2,
3, 4 and 5 (the ADS) offered by Barclays Bank PLC at various times between 2006 and 2008 contained misstatements and
omissions concerning (amongst other things) Barclays portfolio of mortgage-related (including US subprime-related)
securities, Barclays exposure to mortgage and credit market risk and Barclays financial condition. The consolidated
amended complaint asserts claims under Sections 11, 12(a)(2) and 15 of the Securities Act of 1933. On 5 January 2011, the
Court issued an Order and, on 7 January 2011, judgment was entered, granting the defendants' motion to dismiss the
complaint in its entirety and closing the case. On 4 February 2011, the plaintiffs filed a motion asking the Court to
reconsider in part its dismissal order. On 31 May 2011, the Court denied in full the plaintiffs‟ motion for reconsideration.
The plaintiffs have appealed both decisions (the grant of the defendants‟ motion to dismiss and the denial of the plaintiffs‟
motion for reconsideration) to the United States Court of Appeals for the Second Circuit.
Barclays considers that these ADS-related claims against it are without merit and is defending them vigorously. It is not
practicable to estimate Barclays possible loss in relation to these claims or any effect that they might have upon operating
results in any particular financial period.
Financial Statement Notes
Barclays PLC – 2012 Interim Results 85
19. Legal Proceedings (continued)
US Federal Housing Finance Agency and Other Residential Mortgage-Backed Securities Litigation
The United States Federal Housing Finance Agency (FHFA), acting for two US government sponsored enterprises, Fannie
Mae and Freddie Mac (collectively, the GSEs), filed lawsuits against 17 financial institutions in connection with the GSEs‟
purchases of residential mortgage-backed securities (RMBS). The lawsuits allege, amongst other things, that the RMBS
offering materials contained materially false and misleading statements and/or omissions. Barclays Bank PLC and/or
certain of its affiliates or former employees are named in two of these lawsuits, relating to sales between 2005 and 2007 of
RMBS, in which Barclays Capital Inc. was lead or co-lead underwriter.
Both complaints demand, amongst other things: rescission and recovery of the consideration paid for the RMBS; and
recovery for the GSEs‟ alleged monetary losses arising out of their ownership of the RMBS. The complaints are similar to
other civil actions filed against Barclays Bank PLC and/or certain of its affiliates by other plaintiffs, including the Federal
Home Loan Bank of Seattle, Federal Home Loan Bank of Boston, Federal Home Loan Bank of Chicago, Cambridge Place
Investment Management, Inc., HSH Nordbank AG (and affiliates), Sealink Funding Limited, Landesbank Baden-
Württemberg (and affiliates), Deutsche Zentral-Genossenschaftsbank AG (and affiliates) and Stichting Pensioenfonds ABP,
relating to their purchases of RMBS. Barclays considers that the claims against it are without merit and intends to defend
them vigorously.
The original amount of RMBS related to the claims against Barclays in these cases totalled approximately $7.6bn, of which
approximately $2.4bn was outstanding as at 30 June 2012. Cumulative losses reported on these RMBS as at 30 June 2012
were approximately $0.2bn. If Barclays were to lose these cases it could incur a loss of up to the outstanding amount of the
RMBS at the time of judgment (taking into account further principal payments after 30 June 2012) plus any cumulative
losses on the RMBS at such time and any interest, fees and costs, less the market value of the RMBS at such time. Barclays
has estimated the total market value of the RMBS as at 30 June 2012 to be approximately $1.3bn. Barclays may be entitled
to indemnification for a portion of any losses.
Devonshire Trust
On 13 January 2009, Barclays commenced an action in the Ontario Superior Court seeking an order that its early
terminations earlier that day of two credit default swaps under an ISDA Master Agreement with the Devonshire Trust
(Devonshire), an asset-backed commercial paper conduit trust, were valid. On the same day, Devonshire purported to
terminate the swaps on the ground that Barclays had failed to provide liquidity support to Devonshire's commercial paper
when required to do so. On 7 September 2011, the Court ruled that Barclays early terminations were invalid, Devonshire's
early terminations were valid and, consequently, Devonshire was entitled to receive back from Barclays cash collateral of
approximately Canadian $533m together with accrued interest thereon. Barclays is appealing the Court's decision. If the
Court‟s decision were to be unaffected by future proceedings, Barclays estimates that its loss would be approximately
Canadian $500m, less any impairment provisions taken by Barclays for this matter.
LIBOR Civil Actions
Barclays and other banks have been named as defendants in class action lawsuits filed in United States Federal Courts in
connection with their roles as contributor panel banks to US Dollar LIBOR, the first of which was filed on 15 April 2011. The
complaints are substantially similar and allege, amongst other things, that Barclays and the other banks individually and
collectively violated various provisions of the Sherman Act, the Commodity Exchange Act and various state laws by
suppressing US Dollar LIBOR rates. Barclays is also named along with other banks in three individual lawsuits by Charles
Schwab & Co., Inc. and/or its affiliates, which allege substantially similar claims, as well as violations of the Racketeer
Influenced and Corrupt Organizations Act (RICO). The lawsuits seek an unspecified amount of damages and trebling of
damages under the Sherman and RICO Acts.
An additional class action was commenced on 30 April 2012 in the United States District Court for the Southern District of
New York (SDNY) against Barclays and other Japanese Yen LIBOR panel banks by plaintiffs involved in exchange-traded
derivatives. The complaint also names members of the Japanese Bankers Association‟s Euroyen TIBOR panel, of which
Barclays is not a member. The complaint alleges, amongst other things, manipulation of the Euroyen TIBOR and Yen LIBOR
rates and breaches of US antitrust laws between 2006 and 2010.
Financial Statement Notes
Barclays PLC – 2012 Interim Results 86
19. Legal Proceedings (continued)
A further class action was commenced on 6 July 2012 in the SDNY against Barclays and other EURIBOR panel banks by
plaintiffs that purchased or sold EURIBOR-related financial instruments. The complaint alleges, amongst other things,
manipulation of the EURIBOR rate and breaches of the Sherman Act and the Commodity Exchange Act beginning as early
as 1 January 2005 and continuing through to 31 December 2009. Barclays has been granted conditional leniency from the
Antitrust Division of the Department of Justice (DOJ) in connection with potential US antitrust law violations with respect to
financial instruments that reference EURIBOR. As a result of that grant of conditional leniency, Barclays is eligible for (i) a
limit on liability to actual rather than treble damages if damages were to be awarded in any civil antitrust action under US
antitrust law based on conduct covered by the conditional leniency and (ii) relief from potential joint-and-several liability in
connection with such civil antitrust action, subject to Barclays satisfying the DOJ and the court presiding over the civil
litigation of its satisfaction of its cooperation obligations.
Barclays has also been named as a defendant along with a current and former member of its Board of Directors in a
proposed securities class action pending in the SDNY in connection with Barclays role as a contributor panel bank to LIBOR.
The complaint alleges that Barclays Annual Reports for the years 2006-2011 contained misstatements and omissions
concerning (amongst other things) Barclays compliance with its operational risk management processes and certain laws
and regulations. The complaint is brought on behalf of a proposed class consisting of all persons or entities (other than the
defendants) that purchased Barclays sponsored American Depositary Receipts on an American securities exchange
between 10 July 2007 and 27 June 2012. The complaint asserts claims under Sections 10(b) and 20(a) of the Securities
Exchange Act 1934.
It is not practicable to provide an estimate of the financial impact of the potential exposure of any of the actions described
or what effect, if any, that they might have upon operating results, cash flows or Barclays financial position in any particular
period.
See also page 87.
Other
Barclays is engaged in various other legal proceedings both in the United Kingdom and a number of overseas jurisdictions,
including the United States, involving claims by and against it which arise in the ordinary course of business, including debt
collection, consumer claims and contractual disputes. Barclays does not expect the ultimate resolution of any of these
proceedings to which Barclays is party to have a material adverse effect on its results of operations, cash flows or the
financial position of the Group and Barclays has not disclosed the contingent liabilities associated with these claims either
because they cannot reliably be estimated or because such disclosure could be prejudicial to the conduct of the claims.
Provisions have been recognised for those cases where Barclays is able reliably to estimate the probable loss where the
probable loss is not de minimis.
20. Competition and Regulatory Matters
This note highlights some of the key competition and regulatory challenges facing Barclays, many of which are beyond our
control. The extent of the impact of these matters on Barclays and the impact on Barclays of any other competition and
regulatory matters in which Barclays is or may in the future become involved cannot always be predicted but may
materially impact our businesses and earnings.
Regulatory change
The scale of regulatory change remains challenging with a significant tightening of regulation and changes to regulatory
structures globally, especially for banks that are deemed to be of systemic importance. Concurrently, there is continuing
political and regulatory scrutiny of the operation of the banking and consumer credit industries which, in some cases, is
leading to increased or changing regulation which is likely to have a significant effect on the industry. Examples include
Basel 3, the emerging proposals on bank resolution regimes and proposals relating to over-the-counter derivatives clearing
and global systemically important banks.
Financial Statement Notes
Barclays PLC – 2012 Interim Results 87
20. Competition and Regulatory Matters (continued)
In the UK, the FSA's current responsibilities are to be reallocated between the Prudential Regulatory Authority (a subsidiary
of the Bank of England) and a new Financial Conduct Authority. In addition, the Independent Commission on Banking (the
ICB) completed its review of the UK banking system and published its final report on 12 September 2011. The ICB
recommended (amongst other things) that: (i) the UK and EEA retail banking activities of a UK bank or building society
should be placed in a legally distinct, operationally separate and economically independent entity (so-called “ring-fencing”);
and (ii) the loss-absorbing capacity of ring-fenced banks and UK-headquartered global systemically important banks (such
as Barclays Bank PLC) should be increased to levels higher than the Basel 3 proposals. The UK Government published a
white paper setting out its proposals for taking forward implementation of the ICB recommendations in June 2012 and
indicated that primary and secondary legislation will be completed by May 2015, with UK banks required to be compliant by
1 January 2019. Furthermore, in July 2012, the UK Parliament established a Parliamentary Commission on Banking
Standards, which will consider and report on the professional standards and culture of the UK banking sector and corporate
governance, transparency and conflicts of interest. The Parliamentary Commission is due to report in December 2012 its
findings and proposals for any legislative changes.
The US Dodd-Frank Wall Street Reform and Consumer Protection Act contains far reaching regulatory reform. The full
impact on Barclays businesses and markets will not be known until the principal implementing rules are adopted in final
form by governmental authorities, a process which is underway and which will take effect over several years.
Interchange
The Office of Fair Trading, as well as other competition authorities elsewhere in Europe, continues to investigate Visa and
MasterCard credit and debit interchange rates. These investigations may have an impact on the consumer credit industry as
well as having the potential for the imposition of fines. Timing is uncertain but outcomes may be known within the next 2-4
years.
London Interbank Offered Rate (LIBOR)
The FSA, the US Commodity Futures Trading Commission (the CFTC), the SEC, the US Department of Justice Fraud Section
(the DOJ-FS) and Antitrust Division and the European Commission are amongst various authorities conducting
investigations (the Investigations) into submissions made by Barclays and other panel members to the bodies that set
various interbank offered rates, such as LIBOR and the Euro Interbank Offered Rate (EURIBOR).
On 27 June 2012, Barclays announced that it had reached settlements with the FSA, the CFTC and the DOJ-FS in relation to
the Investigations and Barclays has agreed to pay total penalties of £290m (Sterling equivalent), which have been reflected
in operating expenses for 2012. The settlements were made by entry into a Settlement Agreement with the FSA, a Non-
Prosecution Agreement with the DOJ-FS and a Settlement Order Agreement with the CFTC. In addition, Barclays has been
granted conditional leniency from the Antitrust Division of the Department of Justice in connection with potential US
antitrust law violations with respect to financial instruments that reference EURIBOR.
See also page 86.
On 6 July 2012, the UK Serious Fraud Office announced that it had decided formally to accept the LIBOR matter for
investigation.
Interest Rate Hedging Products
See page 81.
Other disclosure matters
The FSA has commenced an investigation involving Barclays and four current and former senior employees, including Chris
Lucas, Group Finance Director. The FSA is investigating the sufficiency of disclosure in relation to fees payable under certain
commercial agreements and whether these may have related to Barclays capital raisings in June and November 2008.
Barclays considers that it satisfied its disclosure obligations and confirms that it will cooperate fully with the FSA‟s
investigation.
Financial Statement Notes
Barclays PLC – 2012 Interim Results 88
21. Related Party Transactions
Related party transactions in the half year ended 30 June 2012 were similar in nature to those disclosed in the Group‟s 2011
Annual Report. No related party transactions that have taken place in the six months to 30 June 2012 have materially
affected the financial position or the performance of the Group during this period and there were no changes in the related
parties transactions described in the 2011 Annual Report that could have a material effect on the financial position or
performance of the Group in the first six months of the current financial year.
22. Post Balance Sheet Events
On 2 July 2012, Marcus Agius announced his resignation as Chairman of Barclays PLC, confirming that a search would
commence, with immediate effect, for an appropriate successor. Mr Agius would remain in post until an orderly succession
is assured and Sir Michael Rake was appointed Deputy Chairman. In addition, and in response to the findings from the
investigations by various regulatory authorities into submissions made by Barclays and other Panel members into the
setting of various interbank offered rates, the Board confirmed that it would undertake an independent, third party review
of Barclays business practices.
On 3 July, and with immediate effect, Bob Diamond resigned from the Boards of Barclays PLC and Barclays Bank PLC, and
from his role as Chief Executive, and Jerry Del Missier resigned as Chief Operating Officer and relinquished his membership
of the Executive Committee. Mr Agius assumed the role of full-time Chairman and chair of the Executive Committee and is
leading the search for a new Chief Executive, supported by Sir Michael Rake.
On 10 July, the Board announced that it had accepted Mr Diamond‟s voluntary offer to waive all of his unvested deferred
bonus awards and long-term incentive share awards, with no compensation made in respect of the lapsed awards. The
Board also asked Mr Diamond to support the transition to the new Chief Executive as necessary, to which he agreed.
Consistent with his contract of employment, Mr Diamond will receive up to 12 months‟ salary, pension allowance and other
benefits; and he agreed to forgo his contractual entitlement to tax equalisation going forward. The Board agreed with Mr
Diamond that he will not receive any future bonus or incentive awards; nor will he receive any further compensation
payment in connection with the termination of his employment.
On 24 July, the Board announced that Anthony Salz would lead an independent, third party, review of business practices.
This global review will 1) assess the bank‟s current values, principles and standard of operation; 2) test how well these are
reflected in the bank‟s decision-making processes; 3) assess whether or not the appropriate training, development,
incentives, and disciplinary processes are in place; and 4) determine to what extent each of these aspects need to change.
The review‟s findings and recommendations will be published, based on evidence gathered through extensive engagement
with all of the bank‟s stakeholders and a thorough review of all pertinent documentary evidence.
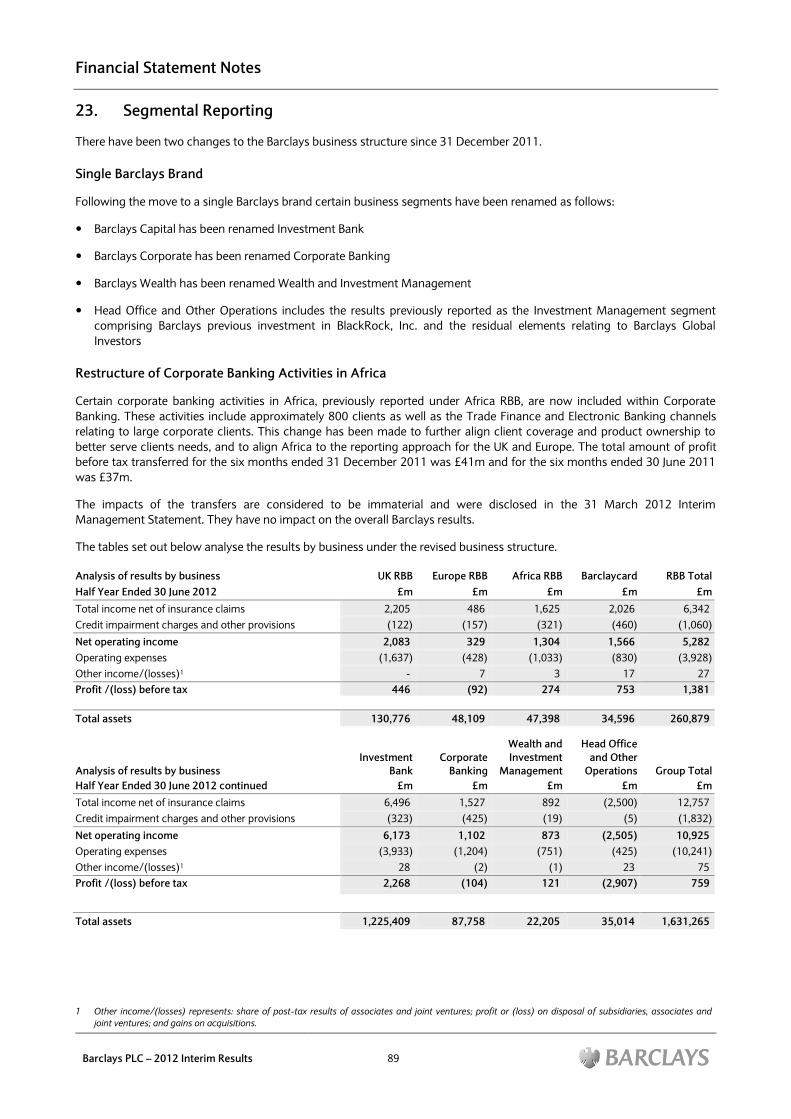
Financial Statement Notes
Barclays PLC – 2012 Interim Results 89
23. Segmental Reporting
There have been two changes to the Barclays business structure since 31 December 2011.
Single Barclays Brand
Following the move to a single Barclays brand certain business segments have been renamed as follows:
Barclays Capital has been renamed Investment Bank
Barclays Corporate has been renamed Corporate Banking
Barclays Wealth has been renamed Wealth and Investment Management
Head Office and Other Operations includes the results previously reported as the Investment Management segment
comprising Barclays previous investment in BlackRock, Inc. and the residual elements relating to Barclays Global
Investors
Restructure of Corporate Banking Activities in Africa
Certain corporate banking activities in Africa, previously reported under Africa RBB, are now included within Corporate
Banking. These activities include approximately 800 clients as well as the Trade Finance and Electronic Banking channels
relating to large corporate clients. This change has been made to further align client coverage and product ownership to
better serve clients needs, and to align Africa to the reporting approach for the UK and Europe. The total amount of profit
before tax transferred for the six months ended 31 December 2011 was £41m and for the six months ended 30 June 2011
was £37m.
The impacts of the transfers are considered to be immaterial and were disclosed in the 31 March 2012 Interim
Management Statement. They have no impact on the overall Barclays results.
The tables set out below analyse the results by business under the revised business structure.
Analysis of results by business UK RBB Europe RBB Africa RBB Barclaycard RBB Total
Half Year Ended 30 June 2012 £m £m £m £m £m
Total income net of insurance claims 2,205 486 1,625 2,026 6,342
Credit impairment charges and other provisions (122) (157) (321) (460) (1,060)
Net operating income 2,083 329 1,304 1,566 5,282
Operating expenses (1,637) (428) (1,033) (830) (3,928)
Other income/(losses)1 - 7 3 17 27
Profit /(loss) before tax 446 (92) 274 753 1,381
Total assets 130,776 48,109 47,398 34,596 260,879
Analysis of results by business
Investment
Bank
Corporate
Banking
Wealth and
Investment
Management
Head Office
and Other
Operations Group Total
Half Year Ended 30 June 2012 continued £m £m £m £m £m
Total income net of insurance claims 6,496 1,527 892 (2,500) 12,757
Credit impairment charges and other provisions (323) (425) (19) (5) (1,832)
Net operating income 6,173 1,102 873 (2,505) 10,925
Operating expenses (3,933) (1,204) (751) (425) (10,241)
Other income/(losses)1 28 (2) (1) 23 75
Profit /(loss) before tax 2,268 (104) 121 (2,907) 759
Total assets 1,225,409 87,758 22,205 35,014 1,631,265
1 Other income/(losses) represents: share of post-tax results of associates and joint ventures; profit or (loss) on disposal of subsidiaries, associates and
joint ventures; and gains on acquisitions.
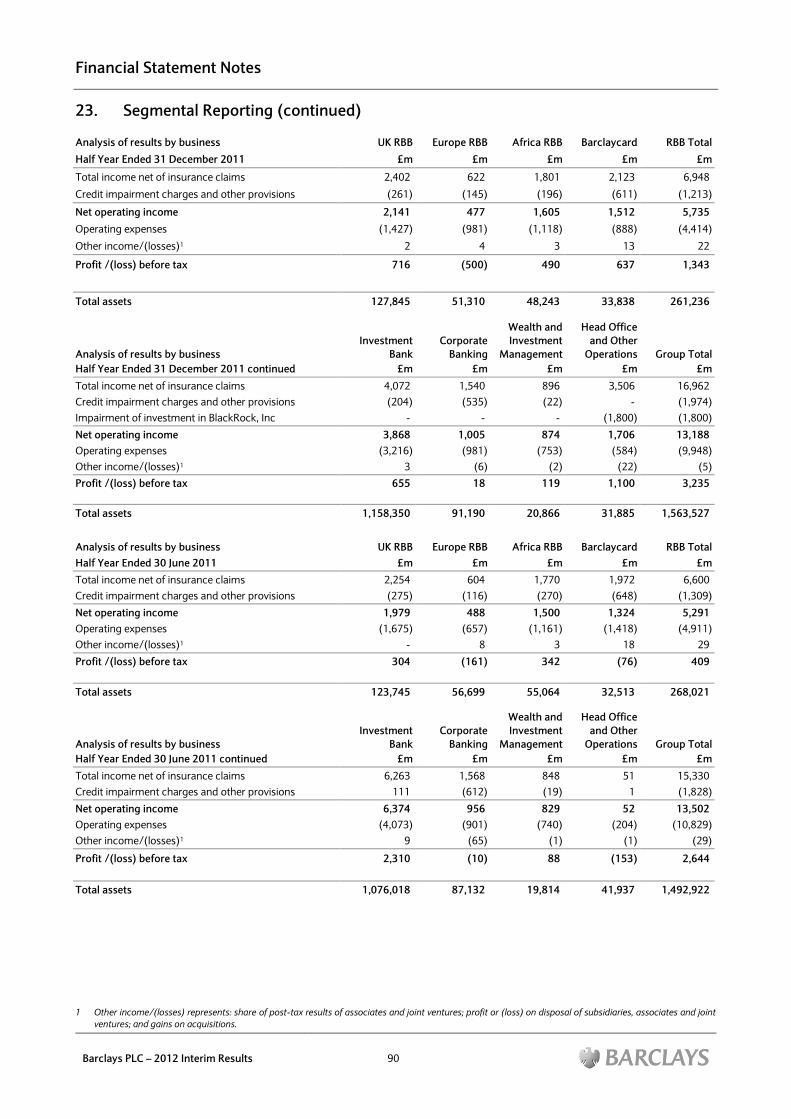
Financial Statement Notes
Barclays PLC – 2012 Interim Results 90
23. Segmental Reporting (continued)
Analysis of results by business UK RBB Europe RBB Africa RBB Barclaycard RBB Total
Half Year Ended 31 December 2011 £m £m £m £m £m
Total income net of insurance claims 2,402 622 1,801 2,123 6,948
Credit impairment charges and other provisions (261) (145) (196) (611) (1,213)
Net operating income 2,141 477 1,605 1,512 5,735
Operating expenses (1,427) (981) (1,118) (888) (4,414)
Other income/(losses)1 2 4 3 13 22
Profit /(loss) before tax 716 (500) 490 637 1,343
Total assets 127,845 51,310 48,243 33,838 261,236
Analysis of results by business
Investment
Bank
Corporate
Banking
Wealth and
Investment
Management
Head Office
and Other
Operations Group Total
Half Year Ended 31 December 2011 continued £m £m £m £m £m
Total income net of insurance claims 4,072 1,540 896 3,506 16,962
Credit impairment charges and other provisions (204) (535) (22) - (1,974)
Impairment of investment in BlackRock, Inc - - - (1,800) (1,800)
Net operating income 3,868 1,005 874 1,706 13,188
Operating expenses (3,216) (981) (753) (584) (9,948)
Other income/(losses)1 3 (6) (2) (22) (5)
Profit /(loss) before tax 655 18 119 1,100 3,235
Total assets 1,158,350 91,190 20,866 31,885 1,563,527
Analysis of results by business UK RBB Europe RBB Africa RBB Barclaycard RBB Total
Half Year Ended 30 June 2011 £m £m £m £m £m
Total income net of insurance claims 2,254 604 1,770 1,972 6,600
Credit impairment charges and other provisions (275) (116) (270) (648) (1,309)
Net operating income 1,979 488 1,500 1,324 5,291
Operating expenses (1,675) (657) (1,161) (1,418) (4,911)
Other income/(losses)1 - 8 3 18 29
Profit /(loss) before tax 304 (161) 342 (76) 409
Total assets 123,745 56,699 55,064 32,513 268,021
Analysis of results by business
Investment
Bank
Corporate
Banking
Wealth and
Investment
Management
Head Office
and Other
Operations Group Total
Half Year Ended 30 June 2011 continued £m £m £m £m £m
Total income net of insurance claims 6,263 1,568 848 51 15,330
Credit impairment charges and other provisions 111 (612) (19) 1 (1,828)
Net operating income 6,374 956 829 52 13,502
Operating expenses (4,073) (901) (740) (204) (10,829)
Other income/(losses)1 9 (65) (1) (1) (29)
Profit /(loss) before tax 2,310 (10) 88 (153) 2,644
Total assets 1,076,018 87,132 19,814 41,937 1,492,922
1 Other income/(losses) represents: share of post-tax results of associates and joint ventures; profit or (loss) on disposal of subsidiaries, associates and joint
ventures; and gains on acquisitions.
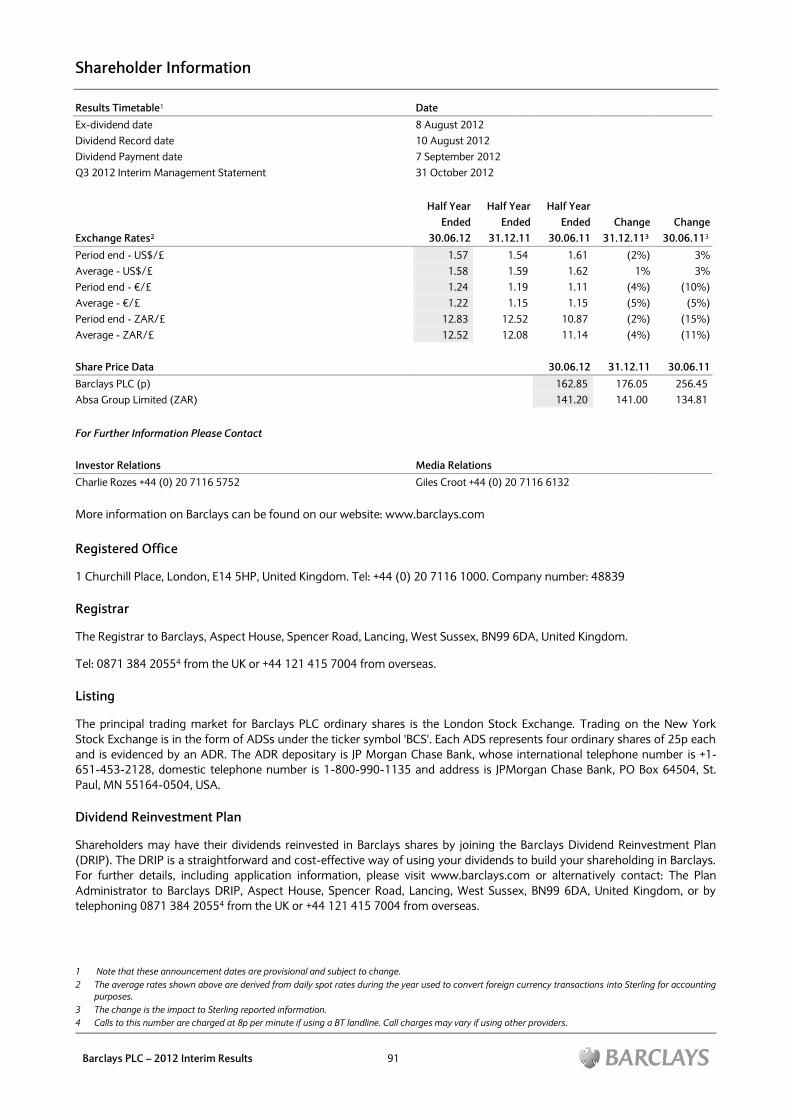
Shareholder Information
Barclays PLC – 2012 Interim Results 91
Results Timetable1 Date
Ex-dividend date 8 August 2012
Dividend Record date 10 August 2012
Dividend Payment date 7 September 2012
Q3 2012 Interim Management Statement 31 October 2012
Half Year Half Year Half Year
Ended Ended Ended Change Change
Exchange Rates2 30.06.12 31.12.11 30.06.11 31.12.113 30.06.113
Period end - US$/£ 1.57 1.54 1.61 (2%) 3%
Average - US$/£ 1.58 1.59 1.62 1% 3%
Period end - €/£ 1.24 1.19 1.11 (4%) (10%)
Average - €/£ 1.22 1.15 1.15 (5%) (5%)
Period end - ZAR/£ 12.83 12.52 10.87 (2%) (15%)
Average - ZAR/£ 12.52 12.08 11.14 (4%) (11%)
Share Price Data 30.06.12 31.12.11 30.06.11
Barclays PLC (p) 162.85 176.05 256.45
Absa Group Limited (ZAR) 141.20 141.00 134.81
For Further Information Please Contact
Investor Relations Media Relations
Charlie Rozes +44 (0) 20 7116 5752 Giles Croot +44 (0) 20 7116 6132
More information on Barclays can be found on our website: www.barclays.com
Registered Office
1 Churchill Place, London, E14 5HP, United Kingdom. Tel: +44 (0) 20 7116 1000. Company number: 48839
Registrar
The Registrar to Barclays, Aspect House, Spencer Road, Lancing, West Sussex, BN99 6DA, United Kingdom.
Tel: 0871 384 20554 from the UK or +44 121 415 7004 from overseas.
Listing
The principal trading market for Barclays PLC ordinary shares is the London Stock Exchange. Trading on the New York
Stock Exchange is in the form of ADSs under the ticker symbol 'BCS'. Each ADS represents four ordinary shares of 25p each
and is evidenced by an ADR. The ADR depositary is JP Morgan Chase Bank, whose international telephone number is +1-
651-453-2128, domestic telephone number is 1-800-990-1135 and address is JPMorgan Chase Bank, PO Box 64504, St.
Paul, MN 55164-0504, USA.
Dividend Reinvestment Plan
Shareholders may have their dividends reinvested in Barclays shares by joining the Barclays Dividend Reinvestment Plan
(DRIP). The DRIP is a straightforward and cost-effective way of using your dividends to build your shareholding in Barclays.
For further details, including application information, please visit www.barclays.com or alternatively contact: The Plan
Administrator to Barclays DRIP, Aspect House, Spencer Road, Lancing, West Sussex, BN99 6DA, United Kingdom, or by
telephoning 0871 384 20554 from the UK or +44 121 415 7004 from overseas.
1 Note that these announcement dates are provisional and subject to change.
2 The average rates shown above are derived from daily spot rates during the year used to convert foreign currency transactions into Sterling for accounting
purposes.
3 The change is the impact to Sterling reported information.
4 Calls to this number are charged at 8p per minute if using a BT landline. Call charges may vary if using other providers.
Index
Barclays PLC – 2012 Interim Results 92
Africa Retail and Business Banking 18 Liquidity pool 40
Accounting policies 73 Loans and advances to customers and banks 46
Administration and general expenses 75 Margins and balances 34
Balance sheet 11 Market risk 70
Balance sheet leverage 39 Net interest income 73
Barclaycard 20 Non-controlling interests 76
Capital ratios 37 Other reserves 81
Capital resources 37 Performance highlights 2
Cash flow statement 13 Principal risks 36
Competition and regulatory matters 86 Provisions 80
Contingent liabilities and commitments 82 Results by quarter 8, 31
Corporate Banking 24 Results timetable 91
Country exposures (selected Eurozone) 58 Retail credit risk 51
Credit impairment charges and other credit
provisions 48 Retail forbearance programmes 55
Credit market exposures 69 Retirement benefits 81
Credit risk 45 Returns and equity by business 33
Credit risk loans 49 Risk weighted assets 38
Derivative financial instruments 77 Share capital 81
Dividends on ordinary shares 76 Share price data 91
Earnings per share 76 Staff costs 74
Europe Retail and Business Banking 16 Statement of profit or loss and other
comprehensive income 10
Financial instruments held at fair value 78 Statement of changes in equity 12
Finance Director‟s review 5 Taxation 75
Funding and liquidity 40 Tier 1 capital ratio 37
Head Office and Other Operations 30 Total assets 38, 45
Income statement 9 UK Retail and Business Banking 14
Investment Bank 22 Wealth and Investment Management 28
Legal proceedings 83 Wholesale credit risk 56
The glossary of terms can be found on:
http://group.barclays.com/about-barclays/investor-relations#institutional-investors