Embed Size (px)
DESCRIPTION
BARC Survey on BI Tools Dec 2013
Citation preview

QlikTech in THE BI Survey 13
1
QlikTech in The B
I Survey
13 BI SURVEY THE
The Customer Verdict
The world’s largest survey of
business intelligence software users
This document is a specially produced summary
by BARC of the headline results for QlikTech

QlikTech in THE BI Survey 13
2
Table of contents
QlikTech in THE BI Survey 13 .................................................................................... 3
Introduction ............................................................................................................. 3
QlikTech overview ................................................................................................... 3
QlikTech customer responses ................................................................................. 3
User and use case demographics ........................................................................... 4
Peer Groups ............................................................................................................... 6
The KPIs ..................................................................................................................... 6
Summary .................................................................................................................. 26

QlikTech in THE BI Survey 13
3
QlikTech in THE BI Survey 13
Introduction
The BI Survey 13 is based on findings from the world's largest and most
comprehensive survey of business intelligence end-users, conducted earlier this
year. In total, 3,149 people responded to The Survey with 2,298 answering a series
of detailed questions about their usage of a named product. Altogether, 30 products
or groups of products received a detailed analysis.
The BI Survey 13 examines BI product selection and usage among users in areas
including business benefits, costs, proportion of employees using the product,
competitiveness, recommendation, innovation, performance, customer satisfaction
and agility.
One thing that all BI deployments ought to have in common is that they should
deliver business benefits. We asked several questions that helped us measure how
successful respondents’ deployments had been. The combined results were then
used as a calibration tool that is widely used throughout The Survey to assess the
correlation between many factors and project success.
QlikTech overview
QlikView is the main product of QlikTech, an American company originally founded
as a consulting company in the Swedish university town of Lund in 1993. Its
headquarters moved to Pennsylvania in 2005 after it raised funds from several
venture capital firms. QlikTech went public in 2010.
QlikTech has grown very quickly. The company says it has more than 26,000
customers in 100 countries and more than $320m revenue in 2011 and $388.5
million in 2012. QlikTech is commonly cited as a competitor by other vendors we
speak with. It has very successfully addressed the self-service BI requirements of
business users in both functionality and go-to-market.
QlikTech customer responses
QlikTech has featured in The BI Survey for several years. This year 178 respondents
reported on their experiences with the tool, more than any other product in The
Survey. About 73 percent of participants said they were using QlikView version 11
and 22 percent version 10. The rest of the respondents used older versions.

QlikTech in THE BI Survey 13
4
User and use case demographics
Product usage
QlikView is a dashboard and analysis platform based on in-memory technology
which is particularly suitable for set analysis. The solution offers simplicity,
performance and agility and is well positioned for the self-service BI market.
Customers seem to use the solution for a broad range of applications. The analysis
results produced in QlikView are used in dashboard and reporting applications.
75%
70%
69%
65%
36%
28%
28%
25%
21%
19%
21%
19%
29%
19%
31%
40%
Dashboards
Ad hoc query
Standard/Enterprise Reporting
Visual Analysis/Data Discovery
Budgeting/Planning
OLAP Analysis
Financial Consolidation
Predictive Analytics/Data Mining
In use Planned

QlikTech in THE BI Survey 13
5
Company size (number of employees)
Percentage of employees using QlikTech
Average 13%
Average of all products
15%
Number of users using QlikTech
Median 50
Mean 379
QlikView continues to increase penetration in both mid-market and large enterprise
15%
49%
35%
Less than 100
100 - 2500 More than 2500

QlikTech in THE BI Survey 13
6
Peer Groups Peer groups are used to ensure similar products are compared against each other
both in fairness to the vendor and for the benefit of the customer. The groups are
essential to allow fair and useful comparisons of products that are likely to compete.
The peer groups are primarily data-driven and based on how customers say they
use the product.
QlikTech features in the following peer groups:
- Large International Vendors
- Dashboard Vendors
- Visual Analysis and Data Discovery Vendors
The KPIs The BI Survey 13 provides the reader with well-designed dashboards packed with
concise information using aggregated KPIs, which can be absorbed at a glance. The
KPIs all follow these simple rules:
- Only measures that have a clear good/bad trend are used as the basis for
KPIs
- KPIs may be based on one or more measures from The BI Survey
- Only products with samples of at least 20 - 30 (depending on the KPI) for
each of the questions that feeds into the KPI are included
- Each KPI is normalized so that the overall sample always has a value of
1.0
- The KPIs are calculated so that better-than-average products always
have scores of greater than 1.0, while less good products score less than
1.0. When viewing the peer group KPI charts, note that the average for
each peer group will usually be either higher or lower than 1.0 because
the peer groups are all subsets of the overall sample.
The products are sorted by value, the better the product the higher the value. The
average is displayed as a green bar and separates the products into two groups, the
ones that have performed better than average and the ones that have performed
worse than average.

QlikTech in THE BI Survey 13
7
For more details on the KPIs, see the ‘KPIs and Dashboards’ document.
Leading Large International Vendor in goal achievement
The extent to which projects reach the goals initially set
1.10 1.10 1.07
1.03 1.00
0.98 0.97 0.96 0.96 0.95 0.93 0.93
0.88 0.87
0.74
IBM Cognos TM1 (1) Oracle Essbase (2)
Information Builders (3) QlikTech (4)
MicroStrategy (5) SAS (6)
Microsoft SSAS (7) Average
Microsoft SSRS (8) SAP BW (9)
Oracle BI Found. Suite (10) Infor (11)
IBM Cognos BI (12) SAP BO WebI (13)
Microsoft Excel (14) Average Large International
Vendors Peer Group

QlikTech in THE BI Survey 13
8
Leading Large International Vendor in business achievement
The extent to which the product delivers business value and helps organizations
achieve their goals
QlikTech performed above average in both business and goal achievement. Given
the fact that QlikTech often seems to be in evaluation considerations among large
international vendors, the customers seem to achieve the goals they set.
1.11 1.09
1.03 1.01 1.01 1.01 1.00
0.96 0.92 0.92
0.89 0.88 0.87
0.82 0.81
Information Builders (1) Oracle Essbase (2)
IBM Cognos TM1 (3) Microsoft SSAS (4)
QlikTech (5) Microsoft SSRS (6)
MicroStrategy (7) Average
SAP BW (8) SAS (9)
Infor (10) IBM Cognos BI (11)
Oracle BI Found. Suite (12) Microsoft Excel (13) SAP BO WebI (14)
Average Large International Vendors
Peer Group
QlikTech in THE BI Survey 13
9
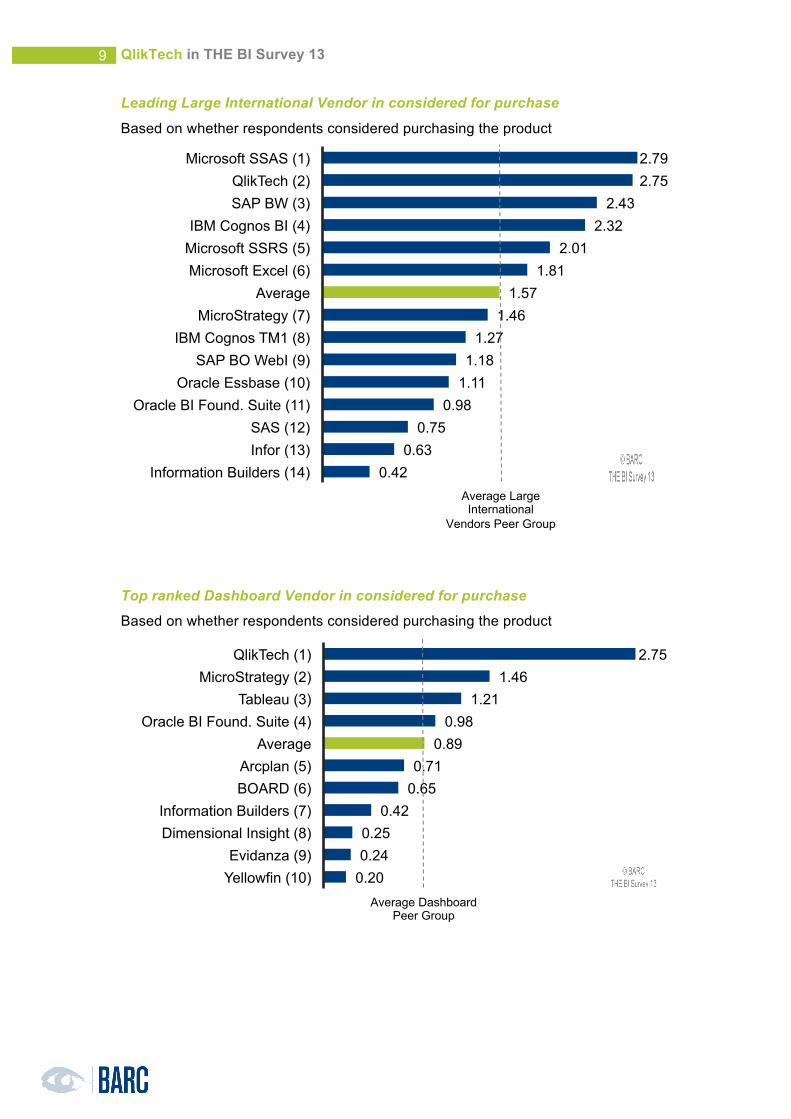
Leading Large International Vendor in considered for purchase
Based on whether respondents considered purchasing the product
Top ranked Dashboard Vendor in considered for purchase
Based on whether respondents considered purchasing the product
2.79 2.75
2.43 2.32
2.01 1.81
1.57 1.46
1.27 1.18
1.11 0.98
0.75 0.63
0.42
Microsoft SSAS (1) QlikTech (2) SAP BW (3)
IBM Cognos BI (4) Microsoft SSRS (5) Microsoft Excel (6)
Average MicroStrategy (7)
IBM Cognos TM1 (8) SAP BO WebI (9)
Oracle Essbase (10) Oracle BI Found. Suite (11)
SAS (12) Infor (13)
Information Builders (14) Average Large International
Vendors Peer Group
2.75 1.46
1.21 0.98
0.89 0.71
0.65 0.42
0.25 0.24
0.20
QlikTech (1) MicroStrategy (2)
Tableau (3) Oracle BI Found. Suite (4)
Average Arcplan (5) BOARD (6)
Information Builders (7) Dimensional Insight (8)
Evidanza (9) Yellowfin (10)
Average Dashboard Peer Group

QlikTech in THE BI Survey 13
10
Top ranked Visual Analysis & Data Discovery Vendor in considered for
purchase
Based on whether respondents considered purchasing the product
QlikTech’s non-technical marketing and sales strategy has worked very well and
therefore made the vendor popular in the BI market. As a result, QlikTech is the top
ranked vendor in the Visual Analysis & Data Discovery Vendor and Dashboard
Vendor peer groups, as well as one of the leading vendors in the Large International
Vendor peer group for the ‘considered for purchase’ KPI.
This is an achievement for a considerably smaller vendor operating at the same level
as other, very large vendors and reflects the companies huge investment in
marketing and sales.
2.75 1.21
0.76 0.75
0.33 0.28 0.25 0.25 0.24
QlikTech (1) Tableau (2)
Average SAS (3)
TARGIT (4) Phocas (5)
Dimensional Insight (6) Cyberscience (7)
Pyramid (8) Average Visual Analysis & Data Discovery Peer Group

QlikTech in THE BI Survey 13
11
Leading Large International Vendor in competitiveness
Combines the ‘Considered for purchase’, ‘Competitive win rate’ and ‘Chosen as
standard’ KPIs
Top ranked Dashboard Vendor in competitiveness
Combines the ‘Considered for purchase’, ‘Competitive win rate’ and ‘Chosen as
standard’ KPIs
1.68 1.53
1.47 1.44
1.34 1.25
1.18 1.12
1.10 1.05
0.99 0.95
0.92 0.85
0.83
Microsoft SSAS (1) SAP BW (2) QlikTech (3)
Microsoft SSRS (4) IBM Cognos BI (5) Microsoft Excel (6)
Average MicroStrategy (7) SAP BO WebI (8)
Oracle Essbase (9) IBM Cognos TM1 (10)
Oracle BI Found. Suite (11) Infor (12) SAS (13)
Information Builders (14)
Average Large International Vendors
Peer Group
1.47 1.12
0.98 0.97 0.97 0.97 0.95
0.83 0.83 0.83
0.74
QlikTech (1) MicroStrategy (2)
Arcplan (3) Tableau (4)
Average Dimensional Insight (5)
Oracle BI Found. Suite (6) BOARD (7)
Information Builders (8) Yellowfin (9)
Evidanza (10)
Average Dashboard Peer Group

QlikTech in THE BI Survey 13
12
QlikTech is considered but also wins many deals. It is quite competitive.
Top ranked Visual Analysis & Data Discovery Vendor in competitiveness
Combines the ‘Considered for purchase’, ‘Competitive win rate’ and ‘Chosen as
standard’ KPIs
Competitiveness is an aggregate of competitive win rate and standardization.
QlikTech is competitive in this area due to its agility in sales situations. The sales
process is targeted towards a short proof of concept and can show rapid benefits to
the customer.
QlikTech also uses a large partner network efficiently. This network is an excellent
asset for the vendor.
1.47
1.02
1.01
0.99
0.97
0.97
0.94
0.91
0.85
QlikTech (1)
Cyberscience (2)
Average
Phocas (3)
Tableau (4)
Dimensional Insight (5)
Pyramid (6)
TARGIT (7)
SAS (8) Average Visual Analysis & Data Discovery Peer Group

QlikTech in THE BI Survey 13
13
Top ranked Large International Vendor in collaboration
How many sites currently use collaboration features with their BI tool
Leading Dashboard Vendor in collaboration
How many sites currently use collaboration features with their BI tool
1.36 1.28
0.98 0.96 0.95
0.93 0.92
0.84 0.78
0.75 0.74
0.65 0.59
0.52 0.37
QlikTech (1) SAS (2)
IBM Cognos TM1 (3) Microsoft Excel (4)
Infor (5) Microsoft SSAS (6) Microsoft SSRS (7)
Average Oracle Essbase (8)
MicroStrategy (9) Oracle BI Found. Suite (10)
SAP BO WebI (11) Information Builders (12)
IBM Cognos BI (13) SAP BW (14)
Average Large International
Vendors Peer Group
2.12 1.68 1.67
1.36 1.22 1.20 1.19 1.18
0.94 0.75 0.74
0.59
Evidanza (1) Tableau (2)
Yellowfin (3) QlikTech (4)
Average Dimensional Insight (5)
BOARD (6) Arcplan (7)
Logi Analytics (8) MicroStrategy (9)
Oracle BI Found. Suite (10) Information Builders (11)
Average Dashboard Peer Group

QlikTech in THE BI Survey 13
14
Leading Visual Analysis & Data Discovery Vendor in collaboration
How many sites currently use collaboration features with their BI tool
QlikView offers good commenting features, especially from Version 11. Users can
use text field or bookmarks to annotate published content. Customers can also make
threaded, chat-like comments.
In QlikView 11.2 there is also a new feature called collaborative sessions that helps
users view and interact with QlikView applications without needing a licence. V12 will
have a different name and will be released at the end of the year. Previews suggest
that enabling collaborative workspaces and user experiences is one of the main
improvements in the new version.
1.68
1.47
1.36
1.33
1.28
1.24
1.20
1.20
1.18
Tableau (1)
Cyberscience (2)
QlikTech (3)
Average
SAS (4)
Phocas (5)
Dimensional Insight (6)
Pyramid (7)
TARGIT (8) Average Visual Analysis & Data Discovery Peer Group

QlikTech in THE BI Survey 13
15
Leading Large International Vendor in mobile BI
How many sites currently use mobile BI with their BI tool
QlikTech has been quick to invest in its mobile clients. The vendor has also invested
in HTML5 technology for displaying interactive content to users. As a result the
mobile device experience and user interfaces have dictated the way future GUI
interfaces will be developed in QlikTech.
By contrast, we weren’t impressed by the company’s mobile client. The non-native
implementation of the software is perhaps not adapting to the device, but the
company is working on this.
2.07 1.41
1.35 1.25
1.04 0.81
0.67 0.59 0.58 0.56
0.47 0.42 0.41
0.36 0.14
MicroStrategy (1) Oracle BI Found. Suite (2)
QlikTech (3) IBM Cognos BI (4)
Information Builders (5) Average SAS (6)
IBM Cognos TM1 (7) Microsoft SSAS (8) Oracle Essbase (9)
SAP BW (10) SAP BO WebI (11)
Microsoft Excel (12) Microsoft SSRS (13)
Infor (14) Average Large
International Vendors Peer Group

QlikTech in THE BI Survey 13
16
Leading Large International Vendor in advanced information design
How many sites currently use advanced information design with their BI tool
The tool can implement some standards. Another jump in innovation has been
announced for 2013/14 and it will be interesting to see if the company can make this
move successfully.
1.37 1.15
1.04 0.98 0.97
0.93 0.93
0.85 0.80
0.74 0.73 0.71
0.68 0.45
0.35
Infor (1) MicroStrategy (2)
Information Builders (3) QlikTech (4)
SAS (5) Oracle Essbase (6) Microsoft SSRS (7)
Average Microsoft SSAS (8)
Oracle BI Found. Suite (9) IBM Cognos BI (10) SAP BO WebI (11)
IBM Cognos TM1 (12) SAP BW (13)
Microsoft Excel (14) Average Large
International Vendors Peer Group

QlikTech in THE BI Survey 13
17
Leading Large International Vendor in innovation
Combines the ‘Cloud BI’, ‘Collaboration’, ‘Mobile BI’ and ‘Advanced information
design’ KPIs to measure the product’s level of innovation
QlikTech scored very well in collaboration, mobile BI and advanced information
design. These are trending topics that QlikTech addressed early on, leading to a
good result in the innovation category.
1.22 1.18
1.10 1.03
0.92 0.90
0.88 0.85 0.84
0.78 0.70
0.68 0.67
0.55 0.46
MicroStrategy (1) QlikTech (2)
Oracle BI Found. Suite (3) SAS (4)
IBM Cognos BI (5) Oracle Essbase (6)
Information Builders (7) Average
Microsoft SSRS (8) Infor (9)
IBM Cognos TM1 (10) Microsoft SSAS (11) Microsoft Excel (12) SAP BO WebI (13)
SAP BW (14) Average Large
International Vendors Peer Group

QlikTech in THE BI Survey 13
18
Leading Large International Vendor in query performance
How long it takes for queries to respond in the largest application, adjusted by data
volume
Leading Dashboard Vendor in query performance
How long it takes for queries to respond in the largest application, adjusted by data
volume
1.78 1.47
1.31 1.16 1.14
1.09 0.95 0.95
0.89 0.78 0.77
0.65 0.52
0.44 0.33
Microsoft SSAS (1) Oracle Essbase (2)
QlikTech (3) Microsoft SSRS (4)
Information Builders (5) SAS (6)
IBM Cognos TM1 (7) Average Infor (8)
SAP BW (9) Oracle BI Found. Suite (10)
MicroStrategy (11) IBM Cognos BI (12) Microsoft Excel (13) SAP BO WebI (14)
Average Large International Vendors
Peer Group
1.78 1.31
1.18 1.14
1.02 0.99
0.96 0.94
0.77 0.77
0.69 0.65
Yellowfin (1) QlikTech (2)
Logi Analytics (3) Information Builders (4)
Average Dimensional Insight (5)
Arcplan (6) BOARD (7) Tableau (8)
Oracle BI Found. Suite (9) Evidanza (10)
MicroStrategy (11) Average Dashboard
Peer Group

QlikTech in THE BI Survey 13
19
Top ranked Visual Analysis & Data Discovery Vendor in query performance
How long it takes for queries to respond in the largest application, adjusted by data
volume
Top ranked Large International Vendor in performance satisfaction
How common are complaints about the system’s performance
1.31 1.26
1.18 1.09
1.03 0.99
0.90 0.77
0.74
QlikTech (1) Pyramid (2) Phocas (3)
SAS (4) Average
Dimensional Insight (5) TARGIT (6) Tableau (7)
Cyberscience (8) Average Visual Analysis & Data Discovery Peer Group
1.10 1.09 1.09 1.06
1.02 1.02 1.01 1.00
0.98 0.97 0.97 0.97
0.91 0.83
0.73
QlikTech (1) Oracle Essbase (2)
Information Builders (3) Microsoft SSRS (4)
MicroStrategy (5) SAS (6)
Microsoft Excel (7) Microsoft SSAS (8)
Average IBM Cognos TM1 (9)
Infor (10) Oracle BI Found. Suite (11)
SAP BO WebI (12) IBM Cognos BI (13)
SAP BW (14)
Average Large International
Vendors Peer Group

QlikTech in THE BI Survey 13
20
Leading Dashboard Vendor in performance satisfaction
How common are complaints about the system’s performance
Leading Large International Vendor in performance
A combination of the ‘Query performance’ and ‘Performance satisfaction’ KPIs
1.14 1.10 1.10 1.09 1.08 1.07
1.04 1.03 1.02
0.99 0.97
0.81
Yellowfin (1) Dimensional Insight (2)
QlikTech (3) Information Builders (4)
Tableau (5) Logi Analytics (6)
Average BOARD (7)
MicroStrategy (8) Arcplan (9)
Oracle BI Found. Suite (10) Evidanza (11)
Average Dashboard Peer Group
1.39 1.28
1.21 1.11 1.11
1.05 0.97 0.96
0.93 0.87
0.84 0.76
0.73 0.67
0.62
Microsoft SSAS (1) Oracle Essbase (2)
QlikTech (3) Information Builders (4)
Microsoft SSRS (5) SAS (6) Average
IBM Cognos TM1 (7) Infor (8)
Oracle BI Found. Suite (9) MicroStrategy (10)
SAP BW (11) Microsoft Excel (12) IBM Cognos BI (13) SAP BO WebI (14)
Average Large International
Vendors Peer Group

QlikTech in THE BI Survey 13
21
Leading Dashboard Vendor in performance
A combination of the ‘Query performance’ and ‘Performance satisfaction’ KPIs
Leading Visual Analysis & Data Discovery Vendor in performance
A combination of the ‘Query performance’ and ‘Performance satisfaction’ KPIs
The good results for query performance and system performance are due to
QlikTech’s inbuilt, in-memory database which offers very fast response times and
good overall performance.
1.46 1.21
1.12 1.11
1.05 1.03
0.99 0.98
0.93 0.87
0.84 0.75
Yellowfin (1) QlikTech (2)
Logi Analytics (3) Information Builders (4) Dimensional Insight (5)
Average BOARD (6) Arcplan (7) Tableau (8)
Oracle BI Found. Suite (9) MicroStrategy (10)
Evidanza (11)
Average Dashboard Peer Group
1.22
1.21
1.17
1.06
1.05
1.05
0.94
0.93
0.90
Pyramid (1)
QlikTech (2)
Phocas (3)
Average
SAS (4)
Dimensional Insight (5)
Cyberscience (6)
Tableau (7)
TARGIT (8) Average Visual Analysis & Data Discovery Peer Group

QlikTech in THE BI Survey 13
22
Leading Large International Vendor in vendor support
Measures user satisfaction with the level of vendor support provided for the product
The company has experienced rapid growth over the last few years yet continues to
maintain satisfactory support.
1.23 1.09
1.01 0.96
0.91 0.86
0.84 0.83
0.79 0.78
0.72 0.63
0.56 0.33
0.14
Information Builders (1) SAS (2)
MicroStrategy (3) Microsoft SSAS (4)
QlikTech (5) Microsoft SSRS (6)
Infor (7) SAP BW (8)
IBM Cognos TM1 (9) Average
IBM Cognos BI (10) Oracle BI Found. Suite (11)
Oracle Essbase (12) Microsoft Excel (13) SAP BO WebI (14)
Average Large International Vendors
Peer Group

QlikTech in THE BI Survey 13
23
Leading Large International Vendor in customer satisfaction
Combines the ‘Product satisfaction’, ‘Vendor support’ and ‘Implementer support’
KPIs
Satisfaction is an aggregate of several KPIs. Customers report very high levels of
product and performance satisfaction with QlikTech QlikView.
1.06
1.05
0.97
0.96
0.96
0.95
0.91
0.87
0.87
0.87
0.82
0.77
0.56
0.54
Microsoft SSAS (1)
SAS (2)
QlikTech (3)
IBM Cognos TM1 (4)
Infor (5)
MicroStrategy (6)
Oracle Essbase (7)
Microsoft SSRS (8)
Average
SAP BW (9)
IBM Cognos BI (10)
Oracle BI Found. Suite (11)
Microsoft Excel (12)
SAP BO WebI (13)
Average Large International
Vendors Peer Group

QlikTech in THE BI Survey 13
24
Leading Large International Vendor in project length
How long it takes to implement the product
QlikTech’s approach of offering a flexible development environment enables skilled
consultants and users to build up applications quickly. Projects often use local data
integration and analysis of data directly so that time-consuming tasks such as data
integration or data modelling are bypassed. This leads to a good ranking for
QlikTech.
1.44 1.22
1.18 1.05
0.97 0.83 0.81
0.77 0.71 0.69 0.68
0.63 0.42 0.42
0.37
Microsoft SSAS (1) Microsoft Excel (2)
QlikTech (3) SAS (4)
Information Builders (5) MicroStrategy (6)
Average IBM Cognos TM1 (7)
Microsoft SSRS (8) IBM Cognos BI (9) SAP BO WebI (10)
Infor (11) Oracle BI Found. Suite (12)
SAP BW (13) Oracle Essbase (14)
Average Large International Vendors
Peer Group

QlikTech in THE BI Survey 13
25
Leading Large International Vendor in agility
Combines the ‘Project length’ and ‘Self service’ KPIs
Leading Dashboard Vendor in agility
Combines the ‘Project length’ and ‘Self service’ KPIs
Short project length and QlikTech’s flexibility in building and changing applications
leads to good results in the ‘Agility’ KPI. It’s not the easiest to use, but business
users find the tool usable and the technology satisfies the demands of self-service
1.25 1.14
1.07 1.05
0.97 0.95
0.92 0.90
0.88 0.80 0.78
0.73 0.72
0.69 0.61
Microsoft SSAS (1) Microsoft Excel (2)
QlikTech (3) SAS (4)
Information Builders (5) Infor (6)
IBM Cognos TM1 (7) Average
MicroStrategy (8) IBM Cognos BI (9) SAP BO WebI (10)
Microsoft SSRS (11) Oracle Essbase (12)
Oracle BI Found. Suite (13) SAP BW (14)
Average Large International Vendors
Peer Group
1.36
1.07
0.99
0.97
0.95
0.90
0.88
0.88
0.81
0.69
Tableau (1)
QlikTech (2)
Dimensional Insight (3)
Information Builders (4)
Average
Evidanza (5)
Arcplan (6)
MicroStrategy (7)
BOARD (8)
Oracle BI Found. Suite (9)
Average Dashboard Peer Group

QlikTech in THE BI Survey 13
26
BI, so changes can be implemented quite quickly either by the business user or the
consultant. In this sense it’s an agile solution.
Summary QlikTech is a company that has grown very quickly. The results shown here illustrate
that a well thought out and executed go-to-market strategy can deliver real value to
customers.
QlikTech scores well in a variety of areas but is best when it comes to performance,
collaboration and innovation. QlikTech also scored well in mobile BI and advanced
information design. These are trending topics that QlikTech addressed early on,
leading to a good result in the innovation category.
The solution offers simplicity, performance and agility and is well positioned for the
self-service BI market. Its sales process is targeted towards a short proof of concept
and can show rapid benefits to the customer.
QlikTech also uses a large partner network efficiently. This network is an excellent
asset for the vendor.

Copyright © BARC GmbH 2013. All rights reserved.
Business Application Research Center - BARC GmbH
Berliner Platz 7
97080 Würzburg
Germany
+49 (0)931 880651-0