Embed Size (px)
Citation preview

Annu. Rev. Chem. Biomol. Eng. 2016. 7:X--X doi: PLEASE INSERT CORRECT CHAPTER DOI, BOTH HERE AND AS TAGGED STRING
Copyright © 2016 by Annual Reviews. All rights reserved BARBATI � MCKINLEY
COMPLEX FLUIDS & HYDRAULIC FRACTURING
COMPLEXFLUIDSANDHYDRAULICFRACTURING
Alexander C. Barbati,1 Jean Desroches,2 Agathe Robisson,3 and
Gareth H. McKinley1 1Hatsopoulos Microfluids Laboratory, Department of Mechanical Engineering,
Massachusetts Institute of Technology, Cambridge, Massachusetts 02139 email
missing 2Schlumberger, Paris la Défense 92936, France 3Schlumberger-Doll Research, Cambridge, Massachusetts 02139
� Abstract Nearly 70 years old, hydraulic fracturing is a core technique for stimulating hydrocarbon
production in a majority of oil and gas reservoirs. Complex fluids are implemented in nearly every
step of the fracturing process, most significantly to generate and sustain fractures, and transport and
distribute proppant particles during and following fluid injection. An extremely wide range of complex
fluids are used: naturally occurring polysaccharide and synthetic polymer solutions, aqueous physical
and chemical gels, organic gels, micellar surfactant solutions, emulsions, and foams. These fluids are
loaded over a wide range of concentration with particles of varying size, and aspect ratio, and are
subjected to a extreme mechanical and environmental conditions. We describe the settings of
hydraulic fracturing (framed by geology), fracturing mechanics and physics, and the critical role that
non-Newtonian fluid dynamics and complex fluids plays in the hydraulic fracturing process.
Keywords hydraulic fracturing, porous media, rheology, complex fluids, suspension mechanics,
particulate transport
1. INTRODUCTION
Hydrocarbons are crucial feedstocks across all sectors of the global economy.
The ease of hydrocarbon extraction translates directly into petroleum availability
and lower cost for products derived from petrochemicals. Periods of increased
worldwide demand, coupled with restricted supply of hydrocarbons, have

encouraged and enabled various technological advances to recover oil and gas
that is increasingly difficult to remove from the ground. While a variety of
reservoir stimulation techniques are currently used, we describe the process of
hydraulic fracturing and the central role that particulate transport by complex
fluids plays through it.
Although hydraulic fracturing of source rocks (also loosely called “shales”) -
as opposed to hydrocarbon reservoirs - is a topic of contemporary (and often
contentious (2)) interest, hydraulic fracturing is used in a majority of oil and gas
reservoirs at some point in their lifetime. Fracturing is used in conventional
hydrocarbon reservoirs to increase permeability in damaged formations or in
formations which exhibit significantly lower production rates over what could be
achieved after fracturing stimulation. It is also used in reservoirs where the
intrinsic permeability is too low to yield economical production without it.
Reservoir stimulation by hydraulic fracturing creates reservoir surface by
pumping a particle-laden fluid into the rock, generating a large pressure relative
to the hydrostatic pressure downhole. Since the rock has low permeability, and
the fluid is (mostly) incompressible, the growing pressure is relieved by the
fracturing of reservoir rock generating a new flow path. Pumping stops when the
desired volume (and fracture extensions) is attained or when the pressure
required to sustain fracture growth exceeds the available pumping capacity; at
this point the well is shut. Over time, the pressure in the fracture and in the
formation will equilibrate, following the penetration of the injected fluid into the
formation and the closure of the fracture. This process depends largely on the
fluid leak-off rate inside the formation, and can take several days in low
permeability formations. The fractures do not close completely, as the sand or
other proppant carried into the fracture by fluid transport remains, and will prop
the fractures open. Following this shut-in and leak-off period, the well is
reopened and liquid or gaseous hydrocarbons flow out into the well from which
they can be extracted or produced.
The hydraulic fracturing process depends critically upon complex fluids. Prior
to hydraulic fracturing, a well must be drilled , cased and cemented. Drilling
muds (either aqueous or oil-based) are employed as mechanical stabilizers in the
construction of the wellbore to pressurize (via gravitational hydrostatic pressure)
the sidewall against collapse, cool the drill bit, and carry away rock cuttings.

Cements are pumped downhole to form a reinforced casing and (along with
metal pipe) isolate sections of the wellbore, providing crucial isolation (1) of the
well from the surrounding environment. The first step of fracturing consists of
pumping a solid-free fluid, called a pad, that initiates the fracture prior to the
introduction of a particle-laden fracturing fluid. This way, risks associated with
particles reaching the tip of the fracture (described in Section 4) are mitigated.
The fracturing fluids used in commercial operations are proprietary
formulations specific to the geology of the formation and desired treatment, yet
nearly all contain rigid proppant particles used to hold the newly-generated
fracture network open after the cessation of flow. Fluids ranging from dilute
polymer solutions (i.e., ‘slickwater’), polysaccharide solutions (crosslinked and
linear), foams (also called energized fluids), micellar fluids (viscoelastic
surfactants), and oil-based fluids are loaded with particles of varying size, aspect
ratio, and density to achieve the desired combination of chemical and mechanical
properties.
Fluid selection for hydraulic fracturing is a design problem. Optimality is
economic: given a hydrocarbon reservoir with a specific set of geological
characteristics, what set of fluid properties will produce the most hydrocarbon
for the least cost? This question is straightforward but nontrivial, as it requires a
thorough understanding of (i) the petrophysical properties of the hydrocarbon
reservoir, (ii) the rheology and formulation costs of the particle-laden complex
fluid used in fracturing, (iii) the fluid--solid interaction driving the hydraulically-
induced fractures in the anisotropic hydrocarbon reservoir, and (iv)
quantification of risk--reward since no process is 100% reliable. The industry has
turned to complex fluids to satisfy this optimization process.
In this review, we focus on the application of complex fluids and non-
Newtonian hydrodynamics which governs the hydraulic fracturing of oil and gas
reservoirs. This necessarily requires an understanding of hydrocarbon reservoirs,
with particular attention to the fluid--solid interactions that occur during the
fracturing process, and the nature of reservoir rock (and bounding layers) in
general. We first consider a brief history of hydraulic fracturing. This is followed
by a discussion of hydrocarbon reservoir petrology and geomechanics. Then, we
consider the mechanics of hydraulic fracturing, focusing on the role of fluid,
reservoir, and flow properties in determining the fracture geometry. Finally, with

the fracturing process quantitatively described, we detail the rheology of
complex fluids relevant in the oilfield and explore the wide-ranging and varied
types of fracturing fluids that are employed downhole, highlighting the various
processes that these complex fluids are involved in during the hydraulic
fracturing process, as well as the potential knowledge gaps associated with them.
1.1. A Brief History of Hydraulic Fracturing Hydraulic fracturing is the progeny of reservoir acidizing processes that date
back to the late 1800s (3). Acidizing increases permeability and production in
reservoirs through the injection of acids directly into the formation which react
with, and subsequently dissolve, carbonates and some sandstones (4, 5). The Van
Dyke acidizing patent (3) describes several of the features present in fracturing
today: the use of a rubber packer to isolate target areas of the well, the loading of
the well with a target fluid (in this case an acid), the pressurization (via an
imposed hydrostatic head) of the fluid to improve penetration into the formation,
and then the breaking (in this case neutralization) of the fluid with a base. This
technique was later expanded upon by Grebe and Stoesser (6) who describe an
“organic jellifying material” for use in wells. Grebe and Stoesser further describe
a wide range of fluids and fluid-property modifiers in a 1935 article (7), and also
a description of the hydraulic rock-splitting action (Figure 1) to increase the
effectiveness of acidizing. All of these technologies have descendants in the
modern oilfield. Hydraulically-driven reservoir deformation was further
recognized in water injection and cementing operations throughout the 1940s, as
summarized in the monograph by Howard and Fast (8).
<COMP: PLEASE INSERT FIGURE 1 HERE>
Figure1Thenandnow.Upperleft:Schematicdiagramoffracturingduringanacidizingtreatmentca.1935,fromproductliterature(7).Upperright:Thefirstfracturingoperation(1947)inGrantCounty,Kansas(courtesyMichaelB.Smith,credit:RobertC.Fast).Lowerleft:schematicdiagramofacontemporaryfracturingjob(courtesySchlumberger)Lowerright:Layoutforacontemporaryfracturingoperation.Pumptrucksarearrayedatcenter,andoutlyingtrailerscontainliquids.(©CustomAerialImages.com).
The first hydraulic fracturing operation occurred in the Hugoton field, Kansas
in 1947, where a gelled gasoline was used as the fracturing fluid. In the decades
since, hydraulic fracturing has grown in scale and importance, following
innovations in fluid chemistry and pumping capacity. Coupled with the ability to
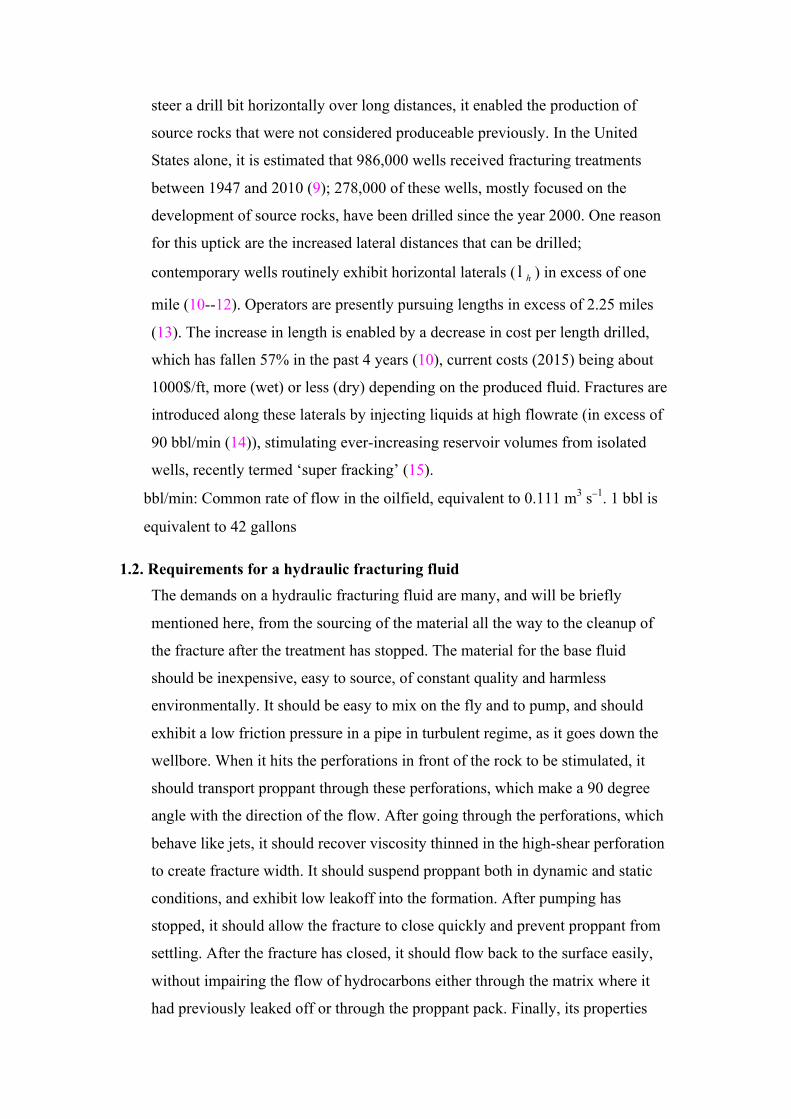
steer a drill bit horizontally over long distances, it enabled the production of
source rocks that were not considered produceable previously. In the United
States alone, it is estimated that 986,000 wells received fracturing treatments
between 1947 and 2010 (9); 278,000 of these wells, mostly focused on the
development of source rocks, have been drilled since the year 2000. One reason
for this uptick are the increased lateral distances that can be drilled;
contemporary wells routinely exhibit horizontal laterals ( hl ) in excess of one
mile (10--12). Operators are presently pursuing lengths in excess of 2.25 miles
(13). The increase in length is enabled by a decrease in cost per length drilled,
which has fallen 57% in the past 4 years (10), current costs (2015) being about
1000$/ft, more (wet) or less (dry) depending on the produced fluid. Fractures are
introduced along these laterals by injecting liquids at high flowrate (in excess of
90 bbl/min (14)), stimulating ever-increasing reservoir volumes from isolated
wells, recently termed ‘super fracking’ (15).
bbl/min: Common rate of flow in the oilfield, equivalent to 0.111 m3 s−1. 1 bbl is
equivalent to 42 gallons
1.2. Requirements for a hydraulic fracturing fluid The demands on a hydraulic fracturing fluid are many, and will be briefly
mentioned here, from the sourcing of the material all the way to the cleanup of
the fracture after the treatment has stopped. The material for the base fluid
should be inexpensive, easy to source, of constant quality and harmless
environmentally. It should be easy to mix on the fly and to pump, and should
exhibit a low friction pressure in a pipe in turbulent regime, as it goes down the
wellbore. When it hits the perforations in front of the rock to be stimulated, it
should transport proppant through these perforations, which make a 90 degree
angle with the direction of the flow. After going through the perforations, which
behave like jets, it should recover viscosity thinned in the high-shear perforation
to create fracture width. It should suspend proppant both in dynamic and static
conditions, and exhibit low leakoff into the formation. After pumping has
stopped, it should allow the fracture to close quickly and prevent proppant from
settling. After the fracture has closed, it should flow back to the surface easily,
without impairing the flow of hydrocarbons either through the matrix where it
had previously leaked off or through the proppant pack. Finally, its properties

should be tunable to a wide range of downhole temperatures and chemical
environments.
Let us note that, for simple Newtonian fluids, many of those requirements are
contradictory in nature, e.g. the low friction pressure in the pipe and the high
pressure drop in the fracture, or the proppant suspending capability and the ease
of proppant pack cleanup. This is the main reason why the industry has turned to
the complex fluids to satisfy these requirements.
2. HYDROCARBON RESERVOIR PETROLOGY
Sedimentary rocks form the majority of oil reservoirs. Sedimentary rocks can be
formed by the successive deposition of fluids and minerals from weathering
(mechanical and chemical), evaporation, or biogenic activity, which, over time,
become continuous and porous structures such as sandstones, limestones, and
mudstones (16, 17). We shall omit evaporites as they tend to have no porosity or
permeability. This sedimentation process occurs as a set of discrete depositions,
and the rock is formed by a combination of compaction and cementation (17).
Sedimentary reservoirs are porous and present many distinct and identifiable
layers, with the precise nature of the sedimentary rock determined by the
depositional environment (e.g. a marine shale versus an aolian dune set), along
with the thermodynamic and mechanical history of the reservoir as a whole. The
size, shape and topology of sedimentary structures, along with the thermo-
mechanical properties exhibited locally in the lithosphere, determine many of the
pertinent reservoir properties for hydrocarbon production (18).
Kerogen: A nanoporous (19) material, insoluble to both alkaline and organic
solvents.
In some sediments, interspersed among clay, sand, and silt are organic
materials that will degrade to form oil and gas. Organics trapped within the
sedimentary rock experience progressively greater temperatures (increasing at a
rate of about 2.5°C/100m (20, 21)) and stresses as the layers travel deeper into
the earth (21). The gradual degradation of organics in these source rocks occurs
in three stages: diagenesis, catagenesis, and metagenesis; they can be loosely
thought of as the ‘heating’, ‘cooking’, and ‘burning’ of organic material.
Diagenesis occurs in the relatively low-temperature region (<50°C) up to a depth

of several hundred meters; Here, organic matter is converted to kerogen (21, 22).
Kerogen is acknowledged to exist in three types, delineated by origin, structure
(aliphatic versus polyaromatic), and constitution (atomic ratios of hydrogen to
carbon and oxygen to carbon (21, 23, 24)). Oil and gas molecules are derived
from kerogen during catagenesis, which occurs at temperatures between 50 and
150°C. Gas is generated primarily at the higher end of this window. Organic
material subjected to yet greater temperatures continue to degrade into dry gas
(i.e., methane), with carbon as the ultimate endpoint of thermolysis.
While kerogen is converted to oil and gas in such formations called “source
rocks”, traditional drilling operations do not extract hydrocarbons directly from
them, as the volume concentration of hydrocarbon is low. Hydrocarbons may
undergo primary migration, exiting the source rocks where they originated and
then undergo secondary, buoyancy-driven, migration to and within distal porous
layers. Eventually, further upward motion of the hydrocarbons is arrested by an
impermeable cap (16) and oil and gas sit bounded. Conventional extraction
targets oil and gas away from source rocks, in these secondary porous structures
where hydrocarbons are concentrated.
The most economically favorable reservoirs exhibit large porosities and
permeabilities. Porosity, hydrocarbon saturation and reservoir volume set the
available amount of hydrocarbons to be extracted, while reservoir permeability
sets the relative ease by which the hydrocarbons may be removed. Early oil and
gas drilling relied upon the pressure in the earth to expel hydrocarbons directly or
with minimal pumping from the wells (primary recovery). If the hydrocarbons
are liquid, this production technique produces only a minimal amount of the
hydrocarbons in place and other methods have been developed to recover more
of them. For example, as the pressure in the reservoir will decrease as
hydrocarbons are produced at the surface, positive displacement of water can
then be used to drive hydrocarbons to the surface, known as secondary recovery.
Finally, enhanced oil recovery (or tertiary recovery) makes use of chemical
additives pumped downhole to coax and recover oil that could not be removed in
earlier stages. In all cases, the techniques used are determined by the
hydrocarbon content and flow properties of the reservoir --- multiple techniques
may be used on the same reservoir over the course of its lifetime.
2.1. Fluid Flows in Reservoir Rocks The sedimentary process endows reservoirs with widely varying porosity and
permeability (18, 25--27). The initial sedimentation of material forms a porous
structure which, through time, is acted upon by chemical and mechanical forces
(28--30) to provide (i) pores in organic material, (ii) pores in inorganic material,
and (iii) faults and fractures (31--33); all processes and features yield widely
variable porosity and permeability within the reservoir (18, 25--27).
Additionally, the sediment settling process results in anisotropic permeabilities
such that transport is favored along the sedimentary beds rather than the direction
of deposition (18).
Inorganic (i.e., mineral-based) and organic (i.e., kerogen-based) pores in
mature source rocks are discussed in detail by Bernard and Horsfield (34),
highlighting the change in morphology of the pore network as the source rocks
age. Source rocks are distinguished from conventional oil reservoirs by reduced
pore size (35) and the role of nanoscale pores within kerogen trapped in the rock.
Nanoscale pores in kerogen may not form a formation-spanning connected
network, but do form a local network on the scale of the organic deposit and are
storage sites for gas (19, 30).
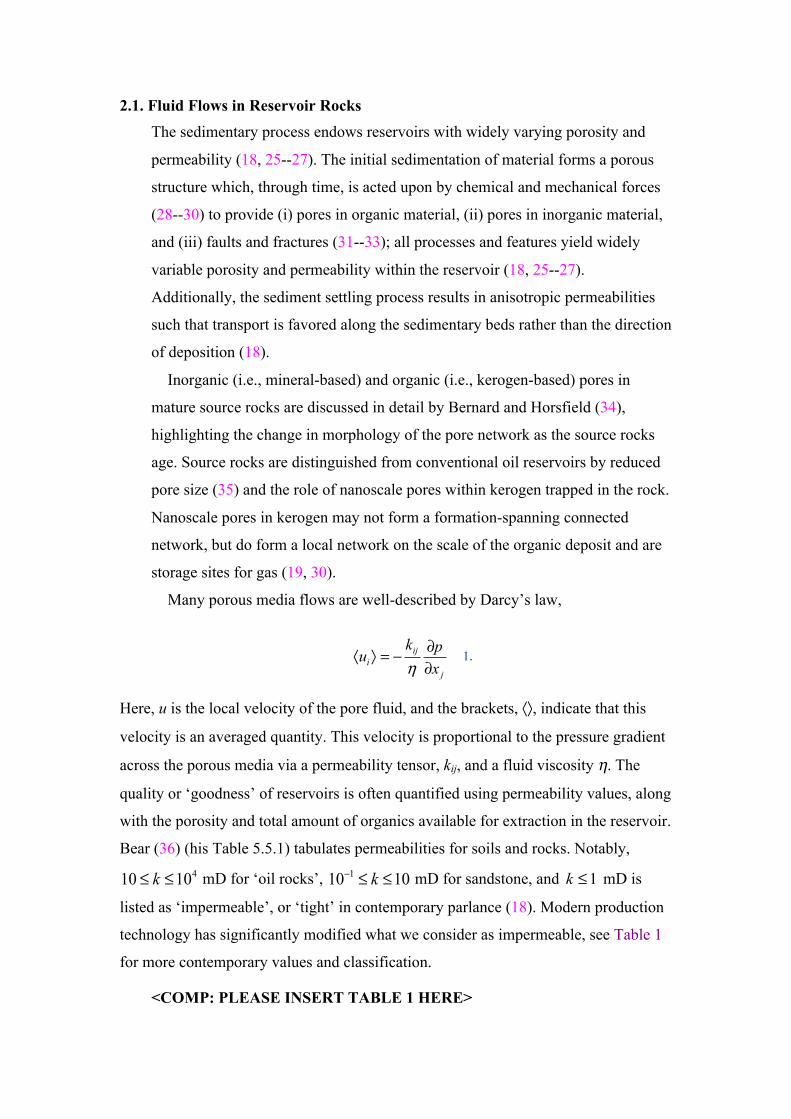
Many porous media flows are well-described by Darcy’s law,
iji
j
k puxη∂〈 〉 = −∂
1.
Here, u is the local velocity of the pore fluid, and the brackets, 〈〉, indicate that this
velocity is an averaged quantity. This velocity is proportional to the pressure gradient
across the porous media via a permeability tensor, kij, and a fluid viscosity η. The
quality or ‘goodness’ of reservoirs is often quantified using permeability values, along
with the porosity and total amount of organics available for extraction in the reservoir.
Bear (36) (his Table 5.5.1) tabulates permeabilities for soils and rocks. Notably, 410 10k≤ ≤ mD for ‘oil rocks’, 110 10k− ≤ ≤ mD for sandstone, and 1k ≤ mD is
listed as ‘impermeable’, or ‘tight’ in contemporary parlance (18). Modern production
technology has significantly modified what we consider as impermeable, see Table 1
for more contemporary values and classification.
<COMP: PLEASE INSERT TABLE 1 HERE>

Permeability: A geometric constant of a porous material indicating resistance to
flow. It incorporates both the porosity and the tortuosity of the porous media.
Porosity: A measure of the open space in a material, reported as percent of void
space.
Darcy: Permeability carries units of length squared, and is typically cited in
Darcies, 1 D = 9.867 × 10⁻¹³ m2; milli- and nanodarcy permeabilities are
commonly reported.
The linear Darcy relation generally holds for creeping flows of Newtonian
fluids. Corrections exist to accommodate larger Reynolds number flows (37),
large-scale velocity gradients (38), non-Newtonian effects (39--41), and
pressure-dependent permeabilities (25, 37). Despite these corrections, departures
from strictly Darcian flow conditions remain an open problem. Complications
arise in time-dependent processes, like hydraulic fracturing, where the
permeability may vary owing to components adsorbed onto the porous matrix
from the fluid, and/or variations in the pressure difference between the matrix
and fluid modulating the pore structure.
The Darcy law (Equation 1) is invalid for gas flows in nanopores such as those
found in kerogen. For these flows, the mean free path (λ) of gas within the pores
is large as compared to a characteristic diameter of the pores, dp, and the
continuum Darcy law is strictly inapplicable. The ratio of these lengths form the
Knudsen number, KnPdλ= , revealing if the flow may be described using
classical continuum descriptions of transport (Kn 1= ), if slip effects must be
included ( 3 110 Kn 10− −≤ ≤ ), or if free-molecule flow ( 1Kn 10≥ ) must be used to
describe gas transport. Several models have been proposed (42--44), starting
with the Klinkenberg relation (42) which introduced an empirical permeability,
ks, slip ‘corrected’ to augment the permeability in the Darcy law,
(1 / )s bk k K p∞= + , so that decreases in thermodynamic pressure (p) will
augment the permeability; here, k∞ is a liquid permeability in the same medium,
p is the pressure in the pores, and Kb is the Klingenberg constant.
There is no universal relation to connect the porosity, φ, to the permeability kij
in rocks or porous media in general. This failure arises from the inherent
dependence of the permeability on the detailed geometry of the pores, and the
distribution of pore sizes, whereas the porosity is a scalar measure that does not

include pore-scale information beyond the volume fraction of solids. Strikingly,
the permeability in mudstones can vary over three orders of magnitude for the
same value of porosity (27)! Despite this limitation, several empirical
correlations and analytical models exist (27, 37); The success of the various
models depends upon how well the underlying assumptions match physical
characteristics of the targeted reservoirs. Katz and Thompson, recognizing the
self-similarity of pore spaces for several sandstones (45), developed a predictive
permeability model (46) 0/ck c σ σ= l , where c is a numeric constant, cl is a
length scale from mercury injection measurements, and G and Gc are electrical
conductivities of the brine saturated porous media and brine, respectively. The
Katz and Thompson model includes two important components: (i) a single
characteristic length, cl , which dominates momentum transport, determined by
the inflection point of pressure during a mercury injection test (37), and (ii) a
measure of the pore connectivity through the independent electrical conductivity
measurements of brine.
Brine: A salt solution typically at a concentration greater than seawater.
Concentrated salt solutions suppress surface conductance effects and encourage
measurement of solution conductance.
Natural fractures can also contribute to the porosity and permeability.
Fractures in rocks form from stresses and natural fluid motion. These fractures
and associated fracture networks have been identified as major contributors to
shale gas reservoirs (47--49); it is therefore desirable in these systems to intersect
the natural fracture network during the drilling and hydraulic fracturing process
(50). Natural fractures are characterized by orientation, length, aperture, and
roughness (33, 49, 51, 52). Similar to the porous media described above, the
natural fracture network can exist in a percolated or unpercolated state, and can
also be both anisotropic and heterogeneous (51). Percolated fractures within
hydrocarbon reservoirs do not necessarily conduct liquids or gases; the fractures
may be filled with calcite, or are otherwise sealed (48, 50). Transport models for
fractures and fracture networks suffer similar limitations to the porous media
discussed previously -- the geometry of the networks and individual fractures is
strongly variable and typically unknown. Despite these uncertainties, individual

fractures (53) and fracture networks in porous matrices (52, 54--56) have been
analyzed to elucidate estimated flows and permeabilities for Darcy flows.
Despite all complications associated with the description of multiphase flow in
rocks (brine, liquid and gaseous hydrocarbons), one can infer that the total flux
that can be drained from a reservoir into a well is a function of the rock
permeability, viscosity of the reservoir fluids, pressure gradient and surface area
over which that pressure gradient is applied. Rock permeability is provided by
geology and can only be altered locally (e.g. by the injection of reactive fluids).
Mobility of the flowing fluid(s) is also given by the nature of the fluids in place
and the temperature and pressure conditions in the reservoir– even if it can be
modified in some cases by heat (e.g. injection of steam) or injection of
surfactants. The amount of pressure gradient that can be applied is also limited,
roughly by the difference between the initial fluid pressure of the reservoir and
the weight of the hydrostatic column in the wellbore. It is therefore natural to
look at the surface area over which a pressure gradient can be applied from the
well to the reservoir.
A vertical well drilled in a hydrocarbon reservoir drains the reservoir fluids
through a small contact area with the producing layers: the intersection of a 0.2m
diameter well with a 15m thick producing layer results in about 20m2 of contact
area. The magnitude of this contact area can be increased if the well is drilled
with a long portion following the producing layer: a 1000m lateral drain placed
in the same producing layer would have a contact area with the reservoir of about
1,250m2. Another means is hydraulic fracturing, whose goal is to create a large
surface area in contact with the reservoir. For example, the creation of a 100m
long bi-wing fracture in contact with the same reservoir would result in a contact
area of 3,000m2. If the permeability of the fracture is large enough so that the
pressure in the fracture is close to that in the wellbore, hydraulic fracturing is
extremely effective at promoting flow from low permeability reservoirs. One of
the goals of hydraulic fracturing is thus to create a fracture whose permeability is
infinitely large compared to that of the reservoir that it is draining. Let us remark,
finally, that for reservoirs with extremely poor flow characteristics (e.g. with
permeabilities of the order of 100nD or less), lateral drains can be hydraulically
fractured to create enough drainage area to concentrate enough flow into the
wellbore.

2.2. Mechanical Attributes of Rocks Hydraulic fractures arise from fluid--solid interaction resulting in mechanical
failure of the formation. The orientation, geometry and extent of these fractures
depends strongly on the intrinsic mechanical properties and state of stress of the
reservoir rock. As one wishes to limit the extension of the created hydraulic
fracture to the producing layers of interest as well as extending the fracture as
long as required to obtain the desired producing area, a brief description of the
mechanical system formed by both reservoir rocks and the layers adjacent to
them follows. Reservoir rocks are usually modeled as linear elastic materials.
This is not strictly true for rocks in general (18); elevated temperatures and the
presence of pore fluid can lead to plastic rather than elastic failure (57, 58).
However, for the hydraulic fracturing process, this has proved extremely
effective, mostly because of the loading path followed by the material during the
fracturing process.
Within the linear elastic framework, reservoir rocks are characterized by a
modulus of elasticity, E, and Poisson’s ratio, ν. Note that anisotropy of the rock
can also be taken into account. Measurements of these properties can be
performed on drill cores removed from the earth, although the cost can be
prohibitive and care must be taken to preserve the in situ rock conditions
(water/fluid content, overburden pressure) when tests are performed (58). Sonic
logging tools permit direct interrogation of rocks downhole (59), accomplished
by measuring the propagation speed of waves through rock and using the density
to recover elastic moduli and Poisson’s ratio. These and other dynamic methods
typically yield larger values of both the Poisson ratio (60) and elastic moduli (60,
61) as compared to measurements using static methods, as would be done in the
lab on core samples in gradual compression. Correlations have been developed to
allow the transformation of the parameters obtained under small strain / large
frequency (dynamic) conditions to parameters corresponding to large strain / low
frequency (static) conditions required for modeling the hydraulic fracturing
process. Beyond variations in these values due to test type and configuration,
mechanical properties also vary substantially from reservoir to reservoir and

within rock layers forming the reservoirs, as presented in Table 1, and in the
references cited therein.
Tensile failure in rocks can be characterized by a fracture tougness ICK .
Contrary to the variation in the elastic parameters, the value of the fracture
toughness does not vary strongly between rocks and is of the order of 1
MPa m .
The lithostatic stress determines the orientation and, along with rock
properties and the injection pressure, the extent to which the reservoir may be
fractured. Lithostatic stresses can be highly anisotropic. These stresses arise
chiefly from the weight of rock atop any given point in the reservoir. Typically,
the lithostatic stress is highest in the vertical direction (aligned with gravity),
with a horizontal stress that varies as a function of depth. Brown and Hoek (64)
tabulate the ratio v
hr σ
σ= and write the empirical bounds 100 15000.3 0.5z zr+ ≤ ≤ + ,
where z is the vertical depth in meters. Because the density of rocks is not a
strongly varying quantity, the vertical stress at the same vertical depth z
correlates with 327 10v zσ = × , with vσ in Pascals. Complexities arise due to the
superposition to gravity of both tectonic activity, thermal and fluid pressure
effects on the potentially complex geological structure hosting the reservoir of
interest.
2.3. Designing around geological constraints
In order for a hydraulic fracturing treatment to be effective, one wants to
create a hydraulic path that is localized to the producing layer targeted,
perpendicular to the bedding of that layer (to take advantage of the permeability
anisotropy of reservoir rocks). Note that, if the minimum principal stress is
vertical, the reservoir is unfit for hydraulic fracturing as horizontal fractures will
be favored, which will not drain the reservoir effectively. That hydraulic path
should also extend sufficiently away from the wellbore and be of an infinite
conductivity compared to that of the targeted layer.
Creating a hydraulic fracture of a desired geometry by designing around the
geological constraints is only the first step to attain these objectives. One also
needs to ensure that there is enough residual permeability of the hydraulic
fracture once pressure is decreased to start flow from the reservoir. This is
achieved by placing solid particles that form a highly permeable layer inside the
fracture (proppant pack). Transport of these particles from surface to the fracture,
so that a permeable enough pack is formed in front of the target layer, is
therefore a critical aspect of hydraulic fracturing. Using fluids that do not
damage the flow capacity of the reservoir or that of the proppant pack is also of
high importance.
Finally, the - possibly large - variations of both mechanical and flow
properties from one layer to the next, along with often poorly constrained
variations of these properties along a layer, 100m away or more from the
wellbore, put a very strong requirement of robustness on the design of a
hydraulic fracture to such variations, and thus on the fluid systems that will be
used to create them.
3. MECHANICS OF HYDRAULIC FRACTURING
The mechanics of fracture generation and arrest have been extensively studied in
the decades following the first field tests. Since the choice of fluid and pumping
rate are the main design levers to achieve the desired fracture geometry in a
given geological setting, these studies have highlighted the - often conflicting -
requirements placed on hydraulic fracturing fluids. In the following section, we
review the phenomena specific to the fluid-solid interactions in hydraulic
fracturing.
3.1. Fracture Orientation and Geometry The fracture orientation conspires with the flow properties of the reservoir rock
to determine the efficacy of the fracturing operation. Reservoirs have anisotropic
permeability. The permeability is generally smallest through the plane of
bedding, thus the desired flow path is perpendicular to the formation bedding.
The orientation of hydraulic fractures is predominantly controlled by the in situ
stresses of the reservoir (61, 89), and fractures tend to open in the direction of the
minimum compressive stress. This was clearly demonstrated in a set of
laboratory experiments by Hubbert and Willis (90), using a gelatin mold as the
reservoir and liquid plaster as the fracturing fluid; after curing of the plaster,
fractures of vertical and horizontal orientation were observed consistent with

compressive stresses applied to the mold. A study of the rank ordering of the
stresses in the reservoir is thus a pre-requisite to decide if hydraulic fracturing
can be applied or not. If the minimum stress is near perpendicular to the reservoir
bedding, a hydraulic fracture parallel to bedding will be created regardless of the
fluids being used. Thus, flow on the fracture face proceeds through the direction
of minimal permeability, limiting the benefit of the fracturing process to increase
production.
Pre-existing fractures, joints, and faults can, however, redirect or modify the
propagation direction of induced fractures (89, 91--94). In conventional
reservoirs, this reorienting effect is not generally strong enough to override the
global fracture orientation that is dictated by lithostatic stresses (95). In
unconventional reservoirs (often fractured source rocks), the interaction between
the hydraulic fracture, the bedding planes, and the pre-existing fractures and
faults has tremendous importance, directly impacting the amount of stimulated
reservoir area. Whether a hydraulic fracture ignores a pre-existing fracture /
bedding plane is not only a function of the geomechanical setting but also of the
fracturing fluid (Yew2014), which adds another dimension to the selection of
fracturing fluids.
Measurement of hydraulic fracture geometry is challenging, requiring remote
downhole, or direct measurement from mineback experiments (95). A wide
range of fracture lengths, widths, and heights are reported in the petroleum
literature, and, along with treatment and reservoir parameters (50), are highly
variable (96, 97); see Tables 1 and 4 for ranges of natural and engineered
parameters.
Mineback: Excavation of a fractured formation to measure fracture geometry and
extent.
<COMP: PLEASE INSERT TABLE 4 HERE>
The width of the fracture is the smallest lengthscale in the system; It is largest
at the wellbore, where the pressure is greatest, and decreases towards the fracture
tip. Cipolla et al. (97), in a discussion on the relation between fracture
complexity and dimension, provide fracture widths varying from 2.5 mm to 185
mm when fluids ranging from waterfrac/slickwater (basically dilute polymer

solutions with η ∼O(1) mPa-s) to gel-like fluids (η ∼ O(100 –1000) mPa-s) are
used. The fracture length is typically hundreds to more than a thousand meters,
and the fracture height may be 50--100 m. The flow may branch during
stimulation, forming a tortuous network of fractures. Treatments of the same
reservoir with different viscosity fluids have been observed to follow the general
expectation that lower viscosity fluids produce longer (and thinner) fractures
than thicker gel-based systems (97). The impact of multiple fracture treatments
staged along a horizontal wellbore can be inferred from microseismic
measurements (98), where the seismic activity is assumed to coincide with
fracture progress.
3.2. SIMPLE MODELS FOR HYDRAULIC FRACTURE GEOMETRY One of the strong peculiarities of hydraulic fracturing is the robust coupling
between fluid flow, reservoir deformation, and fracture growth. We discuss here
insights provided by the two-dimensional Perkins-Kern-Nordgren (PKN) and
radial and Kristianovic-Geertsma-de Klerk (KGD) models. These models are
physical and geometrical simplifications of the full transient and three-
dimensional fluid--structure interaction problem. These approaches, following a
variety of assumptions, provide analytical solutions to the fracture problem
illustrating the dominance of dissipation mechanisms and how these mechanisms
translate to fracture geometry and fluid design. Regardless of their simplifying
assumptions, these models are used to validate hydraulic fracture simulations
(65) and inform fracturing job design where applicable.
3.2.1. PK, PKN, KGD, AND RADIAL FRACTURE MODELS Models by Perkins and Kern (66) (PK), later modified by Nordgren (67)
(PKN), a plane-strain model by Kristianovic (68), Geertsma and de Klerk (69)
(KGD), along with a radial model (69, 70) all present simplifying assumptions in
the state of strain and dissipation, many of which been revisited in later
refinements.
In the PKN model, a bi-wing fracture with elliptic cross-section emanates from
the wellbore. The height (ellipse major axis) of the fracture is set a priori by the
height, h, of the formation. bounded by layers that are known to (by experience)

arrest vertical fracture growth. The fracture width, w, (ellipse minor axis) is
determined via a plane strain elasticity relation (71):
2(1 )( , ) 2 ( ( , ) )w x t h p x tEν σ⊥
−= − 2.
Here, the pressure in the invading fluid, p(x, t), balances against the far--field
solid stress, σ⊥, in the formation and compression of the linear elastic reservoir
with Poisson’s ratio ν and Young’s modulus E. Note that only the difference is
significant, ( , )p p x t σ⊥Δ = − . The plane strain condition in each vertical plane
constitutes a crucial simplifying assumption --- the elliptical deformation profiles
in the direction of the fracture propagation become uncoupled. Whence, the
fracture width (minor ellipse axis) is determined uniquely by the local fluid
pressure, reservoir stress, Young’s modulus, and Poisson’s ratio at each location
along the fracture. Furthermore, in this model, fracture behavior at the
propagating tip is completely neglected; the fracture toughness does not appear in
the solution.
The pressure in the fluid is given by a lubrication approximation to the Navier-
Stokes equations, inherently assuming laminar flow prevails. Here, the pressure
drop along the fracture depends linearly on the viscosity, η, and flow rate, while
depending more strongly on the fracture width, so that,
3
64p Qx w h
ηπ
∂Δ = −∂
3.
Note that the flowrate in the fracture, Q, and the width, w, are functions of
position and time. The flowrate varies in time and space along the fracture by any
combination of (i) a change in pumping rate (or ‘flow schedule’) at the surface,
(ii) leak-off of fluid through the porous fracture walls into the formation, and (iii)
accumulation in the fracture as the width varies in space and time.
A statement of mass conservation connects the fracture width (Equation 2),
pressure drop (Equation 3), flow schedule, and other system properties to enable
prediction of fracture geometry as a function of time:
04L
Q wq hx t
π∂ ∂+ + =∂ ∂
4.

The first term accounts for the change in volumetric flow as a function of
position along the fracture, the second term, qL is the volumetric flowrate of leak-
off per unit fracture length from the fracture into the formation, and the final term
accounts for the expansion or contraction of the fracture width as a function of
time.
The early work by Perkins and Kern (PK) (citation) assumed 0Qx
∂∂ = ,
neglecting both changes in fracture area and leak-off. Nordgren (citation)
recognized that both leak-off and evolution of the fracture aperture must be
included, resulting in a nonlinear partial differential equation for the fracture
width:
24
2 2
1 1 4 1( ) 0128 1 L
E ww qh x h xη ν π∂ ∂− + + =
− ∂ ∂ 5.
This equation is subject to the initial condition w(x, 0) = 0, and the distal
boundary condition w(x, t) = 0 when the coordinate ( )x t≥ l , where ( )tl is the
fracture length at arbitrary time. The problem is closed by an additional boundary
condition on the flow into the fracture as a function of time: (0, ) ( )Q t t= Γ . In the
absence of leak-off, the fracture length, width, and pressure difference in the
fracture have all been determined analytically for a constant injection rate at the
wellbore (72). These results are shown in Table 2. Note that this model
corresponds to the limiting case of a height-constrained fracture with a length
much larger than the height.
<COMP: PLEASE INSERT TABLE 2 HERE>
Models for other limiting cases include that of Geertsma and de Klerk (69),
incorporating work from Kristianovich (68), who developed models that include
the influence of the fracture tip to describe the fracture geometry. As before,
laminar flow is assumed within a fracture embedded in an isotropic linear elastic
solid. Models were developed for both linear (KGD) and radial fractures. The
KGD case considers plane strain along the propagation direction and corresponds
to the limiting case where the height of the fracture is much larger than its length,
whereas the radial case corresponds to the propagation of a hydraulic fracture in
an infinite isotropic medium. In each, the fracture width is determined nonlocally

by the fluid pressure and far-field stress. Both are constrained by a smooth
fracture closure condition (68, 73), for the radial case: ( )
0wr r R t
∂∂ =
= . We present
results for both (Table 2), but consider only the radial fracture in detail, as it is
the most simple, yet complete, model for practical applications.
The radial model assumes a penny-- or disc--shaped fracture of radius R,
emanating from a well of radius rw, with a local width, w(r). The closure
condition places a constraint on the pressure,
2/
( )1w
R
r R
sp s dss
σ⊥=−∫ 6.
This mechanical condition is combined with a description of the hydrodynamics
in the fracture. A piecewise pressure profile is assumed in the fracture to satisfy
Equation 6. It consists of two regions: a section with logarithmic pressure decay
due to viscous dissipation and expanding fracture area along the radius, and a
zero pressure region near the fracture tip:
3
6( ) ( ) ln ,
( ) 0,
w w cw
c
Q rp r p r r r rw r
p r r r R
ηπ
= − ≤ <
= ≤ ≤ 7.
Here, w is the average fracture width. Equation 7 implies a gradual decrease in
pressure outward along the fracture followed by a severely dissipative region
near the tip, and a zero pressure region to satisfy the tip closure condition. The
length scale corresponding to this dissipation region, rc, is found through the tip
closure condition (72), 3
4 2 3 3
1/3
(1 )/ 1 0.368 E Q
c Rr R η
σ ν⊥ −⎡ ⎤− ⎣ ⎦: .
The pressure, fracture width, and radius are determined via an analysis of the
strain induced by the pressure, and the hydrodynamic model of laminar flow in a
radial fracture (69, 72). These results are shown in Table 2, where both storage
and leak-off are neglected. The radial results are semi-analytical (69). The
pressure varies weakly with radius, except near the tip through the step function
in equation 7.
3.2.2. LEAK-OFF IN THE PKN AND RADIAL MODELS. Substantial complications
in the mass conservation statement for both the PKN and radial models are

introduced by fluid leak-off into the formation. The leak-off term qL is often
given by the Carter law (originating in an appendix to a conference proceeding
by Howard and Fast (74)), and is typically of the form exp
2 LhCL t tq
−= when the
height is constant. The leak-off rate varies as a function of the elapsed exposure
time at the fracture face, expt t− ; this decrease in leak-off is due to the progressive
build-up of a resistance in the reservoir to the invasion of the fracturing fluid, be
it by simple diffusion gradient or by the formation of a filter-cake, either at the
fracture wall or in the near fracture region of the reservoir. In the case of filter
cake formstion, material is deposited on the wall and/or within the pores
(colmatage (37) or clogging may also occur). The leak-off coefficient, CL,
typically depends on the fluid viscosity, the pressure difference between the fluid
in the fracture and fluid in the pores, and the permeabilities of the filter cake and
reservoir. Models using Darcy’s law can be used to construct the leak-off
coefficient (37). However, because the process relies on the detailed pore-scale
structure of the rock averaged over large surfaces where the variation of such
details is unknown, the leak-off rate is typically determined experimentally, both
in the field and in the laboratory (75, 76).
The fracture problem with leak-off can be solved numerically in the general
case, as originally done by Nordgren (67) for the PK model. These results
indicate a matching at long and short times with restricted versions of the full
mass transport equations. Nordgren’s characteristic time scale, ( )25
2 /3(1 )* 232 L
QC hG
t ν ηπ −=
, developed by making the PKN equation set dimensionless, indicates early times *t t= where leak-off is minimal and late times, *t t? , where fluid loss to the
formation is significant. Limiting results for the fracture length, width, and
pressure following this early/late time approach appear in Nordgren (67) and
Geertsma (72) for the PKN fracture.
The rapdily increasing complexity of solving the coupled equations for this
non-linear moving boundary problem leads very quickly to fully numerical
solutions, be it for the radial geometry (citation), or more complex planar or
even fully 3-dimensional geometries (citation). Another approach to the
problem is to focus on what is happening at the tip of the fracture. Here, the
coupling of the various processes at play yields a series of multi-scale solutions

highlighting mechanisms that control energy dissipation as the fracture
propagates.
3.3. Asymptotic Solutions
Following the KGD and radial results outlined above, the fracturing fluid-
structure interaction problem has been approached more carefully by Spence and
Sharpe (78) through a similarity solution for flow into a penny- (or lens-)shaped
cavity. Related approaches have beenadopted to explore the formation of dykes
(magma-driven fractures) by Spence and Turcotte (79), and also for studying
buoyancy-driven propagation (Spence, Sharp, and Turcotte (80) and Lister (81)).
These analyses highlight the importance of various physical processes in
determining the final geometry of the fracture, and, crucially, the localization of
processes at the fracture tip.
Lister (81) notes that when the crack tip is saturated with liquid, large
pressures are required to fill the fracture; Instead, it can be supposed that there is
a region of fluid lag with inviscid material filling the remainder of the fracture
between the liquid front and fracture tip. This distinction between fluid filling
and fluid lagging the fracture tip is discussed further by Desroches et al. (82),
indicating that fluid approaching the fracture tip implies a solution of zero
fracture toughness ( 0ICK = ) in the leading order term, with a stress singularity
weaker than predicted by linear elastic fracture mechanics. The dominant
dissipation mechanism is due to the pumping of viscous liquid into the fracture
tip (Poiseuille flow) rather than the fracture process itself. Solutions with non-
negligible fracture toughness, then, require a fluid lag between the advancing
fracture tip and the driving fluid.
The strength of the singularity at the crack tip indicates the dominant physical
process (83--86). In 2004, Detournay (84) summarized this work for fracturing
in impermeable rock, 0Lq = , considering both the radial and plane strain KGD
fractures. Absent of leak-off, a dimensionless toughness ( )mkpL
L=K identifies if
the fracture process is dominated by viscosity ( 1≤K ) or fracture toughness (
4≥K ). The exponent p is 5/2 and 3/2 for the radial and KGD fracture,
respectively. Expressions for Lm and Lk, along with the controlling ratio K are
presented in Table 3. These scalings show that the KGD fracture is dominated by

the same physics for all time, as determined by the temporal invariance of the
parameter K . The radial fracture exhibits a 19t time dependence, indicating that
the dominant dissipation mechanism changes from viscous dissipation to fracture
toughness dominated at long times.
<COMP: PLEASE INSERT TABLE 3 HERE>
3.3.1. ASYMPTOTICS WITH LEAK-OFF. Inclusion of leak-off for permeable
formations adds an additional dissipation mechanism; relaxation of the
impermeability condition permits fluid accumulation in the formation, in
addition to the fracture. Lenoach (87) considered leak-off with a viscosity-
dominated fracture and Bunger et al. (88) consider leak-off in the toughness-
dominated case. Subsequently, Garagash et al. (86) has presented a generalized
approach where leak-off, storage in the fracture, along with viscous and
toughness losses are all active within the fracture and at the tip. This unifying
approach verifies that previous analyses (as detailed in (86)) are obtained as
limiting cases of the general problem. Tip asymptotics can be used to indicate the
dominant mechanisms in planar fracture propagation. A recent review,
highlighting the multi-scale and time dependence of the leading phenomena at
play during creation of a hydraulic fracture, is provided by Detournay(citation).
Verifying the regime in which a hydraulic fracture will be propagating is of
crucial importance in the design of laboratory tests and small scale experiments
to understand the behavior of a hydraulic fracture. Improper scaling of the
dominant physics yields results that are purely of academic interest and cannot
be practically exploited.
3.4. Transport of solids in hydraulic fracturing Solid particles are injected to sustain fractures of the desired geometry against
closure stresses imposed by the reservoir. Fractures which close before, or
during, hydrocarbon production severely limit the efficacy of the fracturing
process. Injected particles are transported by the fracturing fluid to minimize the
as designed and final fracture dimensions. A straightforward dimensional
analysis provides insight to the transport phenomena at play during creation and

propagation of the hydraulic fracture. The geometry of the fracture (w, h, l ), the
injection rate (Q , or shear rate γ&), fluid rheology (chiefly: viscosity η, relaxation
time λ, fluid density ρf), and proppant properties (solids volume fraction φ,
radius a, density ρs) frame the geometric and dynamic scales, and appropriate
dimensionless parameters in the fracturing process. Application of the
Buckingham Pi theorem to the variables ( , , , , , , , , )s fw h a φ ρ ρ η λ γ& forms a set of
six dimensionless groups, two purely geometric (1 /w hΠ = ,
2 /w aΠ = ), three
dynamic ( 2 /w fRe wρ γ η= & , Wi λγ= &, /Sk awρ γ η= Δ & ), and the volume
fraction, φ. Here, | |s fρ ρ ρΔ = − is the density difference. The geometric
parameters define the aspect ratio of the fracture (w/h), and the aperture as
measured by the particle size (w/a). The relevant dynamic conditions of the flow
are indicated by the dominance of viscosity versus inertia through the Reynolds
number (Re), the flow timescale versus the fluid relaxation time through the
Weissenberg number (Wi), and the importance of particle inertia in unsteady
flows via the Stokes number (Sk). The shear rate, γ&, varies throughout the
fracture and can be computed from the flowrate and the fracture geometry. Here,
we choose the simple relation, 2 1Qw hγ − −=& , assuming flow in a slit. Note also
that a particle-based Reynolds number can also be defined, 1p 2 wRe Re−=Π .
Additional physical variables give rise to additional dimensionless groups.
These groups will reflect the important physics of the transport process, and the
rheology of the complex fluid in the fracture. A Shields parameter, for example,
captures the ability of a slickwater treatment to transport proppant particles
settled along the bottom of a fracture. Further, we could quite reasonably specify
a particle settling velocity to compare against the flow velocity, a wall roughness
or channel bend radius to compare against the channel width or particle size (53,
99), a thermodynamic energy scale to compare against viscous dissipation
around the particle (100), or additional timescales for the fluid rheology or
pumping schedule.
3.5. Implications for fracturing fluids

These models highlight expected geometric and dyanmical scalings associated
with fluid selection. Parameterizaton of the particle-laden fracturing fluid is often
relegated to the magnitude of the viscosity only, occasionally also capturing
shear rate dependence (82). The fracture geometry depends weakly on the
viscosity: For a PKN fracture geometry, the length scales with the viscosity as 1/4η−l : , width as 1/5w η: , pressure as 1/ 4p ηΔ : . Fluid viscosity must thus be
varied by orders of magnitude to significantly alter length and width. However,
assuming simple Darcy flow into the formation, 1LC η: , and Nordgren’s
crossover time scales as * 7/3t η: , indicating a strong viscosity dependence for
leak-off. Settling also depends strongly on the viscosity; the Stokes settling
velocity of a suspension with volume fraction φ scales as 1 5
max(1 )u φη φ
− −:
(101).
These scaling considerations highlight contradictory fluid requirements, and
the need for complex fluids in hydraulic fracturing. The implications are
significant: a fluid designed to create large fracture widths (high viscosity) will
also exhibit low leak-off resulting in a long fracture closure time. This long
closure time will result in proppant settling to the bottom of the fracture, leaving
the top part mostly un-propped and it will re-seal during leak-off reducing the net
flow of reservoir fluids. Thus, a large viscosity is required during pumping and a
small viscosity is required to aid leak-off before proppant can settle. Further
examples include: (1) low pressure drop in the pipe and the simultaneous
creation of fracture width, (2) low leak-off during fracture creation but fast
fracture closure after pumping has stopped with low damage of the rock
permeability (102), and (3) transport of solid particles whilst providing
maximum permeability of the placed proppant pack to hydrocarbon fluids.
Three main routes exist to optimize between these conflicting requirements. A
‘train of fluids’ is often used: For example, creation of fracture complexity
requires a thin, solids-free fluid. A slurry created by adding solids to the base
fluid will not create enough fracture width to admit large concentrations of
proppant particles. Therefore, a sequence of at least two different fluids is
preferred: a low-viscosity fluid to propagate the leading edge of the fracture,
followed by a particle-laden fluid with a larger viscosity. A second route to

address this fluids design challenge is the use of additives to decouple fluid
properties: for example, starch particles can be added to control leak-off. A third
route is to use fluids whose properties can be altered with time and temperature.
4. FRACTURING FLUIDS
The formulation and properties of hydraulic fracturing fluids vary greatly in
response to performance requirements that re set by constraints on the surface
and downhole (citation). The choice of fracturing fluid is largely set by reservoir
properties, which are strongly variable across different reservoirs (if not within a
particular reservoir). Thus, a complex design of the base fluid must be performed
for each job. Today, this design is largely empirical and is guided by return on
experience.
Fracturing fluid design is constrained. All fluids should: (1) have minimal
environmental impact, (2) be easy to mix/hydrate in water with varying ion
content, (3) be easy to pump with low pressure drop in the wellbore, (4) be able
to travel 1--5 miles through the pipe (typical pipe diameter is 4.5”) and transit the
perforation (aperture of about 1” diameter connecting the wellbore to the
formation) without significant pressure loss and material degradation, (5) be
compatible with the formation, (6) generate a high pressure drop in the fracture to
create fracture width, (7) transport the proppant, (8) minimize leak-off during
fracture creation, (9) (but) maximize leak-off after proppant placement to hasten
fracture closure, (10) have low residue content to minimally alter
fracture/proppant pack conductivity, and (11) limit proppant flowback during
hydrocarbon production. In spite of these (often contradictory) requirements,
typical fluids cost less than $1/liter (citation).
Fluids designed to meet these requirements are complex. Additives, both
chemical (such as polymers) and physical (e.g. spherical particles and fibers)
endow the fluid with a non-Newtonian response in which the stress varies
nonlinearly with the shear rate, and changes also as a function of mechanical (and
thermodynamic) variables. Other important non-Newtonian characteristics
include strain-dependent stresses, viscoelasticity, thixotropy, and a finite yield
stress during shearing, amongst others (105, 106). Importantly, non-Newtonian

fluids can also exhibit normal stresses which are not observed in Newtonian
fluids; normal stresses give rise to several important phenomena, including
elastic tension along streamlines (105, 107), particle migration (108, 109), and
elastic instabilities (110, 111). The various processes described here, and how
they manifest in the fracturing process, are shown schematically in Figure 2.
<COMP: PLEASE INSERT FIGURE 2 HERE>
Figure2Schematicdiagramofthefracturingprocess(above),andvarioustransportphenomenainvolvedinhydraulicfracturing.
The majority of fracturing fluids used today are aqueous (9). Diesel, alcohol
and other organic-based fluids, while desirable since they tend not to cause
formation damage and are easily viscosified, tend not to be used as they are
hazardous to pump at high pressures and in large volumes (104). Both aqueous
and organic fluids can be foamed (or ‘energized’), and all are eventually filled
with proppant. Due to the proprietary nature of fracturing fluids, definitive
information on components and concentrations are not generally available. Also,
the chemical structure of components can be ambiguous. Reviews by Barati and
Liang (197), Montgomery (104, 198), Gulbis and Hodge (192), and Ely (103)
describe many chemical and physical properties of commonly used fracturing
fluids. We summarize material properties and parameters within the
supplementary material; follow the Supplemental Material link in the online
version of this article or at http://www.annualreviews.org/.”
4.1 POLYSACCHARIDE-BASED FLUIDS.
Polysaccharide-based fluids are inexpensive and effective viscosifiers,
achieving desired fracture widths and reduced proppant settling. Most of these
materials are well-studied (200). Guar is the most common polysaccharide used
in hydraulic fracturing (198). It is mostly soluble in water (the residue varies
depending on the guar), biodegradable, presents low health concern (it is
commonly used as food additive), and can be readily broken. Xanthan gum and
cellulosic materials are also used. Xanthan is less-common owing to its higher
cost, and materials modified from cellulose (which is itself not soluble in water)

are also used since they have fewer impurities than guar (192) and easily form
gels when derivitized (e.g., hydroxyethyl cellulose or HEC) (200). Here, we
focus on guar exclusively, as guar-based fluids can answer all of the
requirements enumerated above. Consequently, guar based fluids have been the
fracturing fluid of choice for decades.
Uncrosslinked, or linear, guar consists of a mannose backbone substituted
galactose with an average ratio 1.8 mannose (201). Uncrosslinked guar behaves
as a viscoelastic shear thinning fluid (202). The galactose units are commonly
modified (192) to change (i) the solvation properties of the guar, (ii) the
availability of crosslinking sites and chemistries, and (iii) the performance of the
material at elevated temperature. Typical guar concentration is 0.5 wt%,
providing viscosity of the order of 0.1 Pa.s at 170s-1 and room temperature
(citation). Borate and various metal ions crosslink the linear material to a
physical or chemical gel. Crosslinking with borate requires elevated pH ( 7.5â )
(190, 197), resulting in a dynamic ionic bond in which the borate ion connects
cis-diols on the galactose. The dynamics of these crosslinks have been
extensively studied (191, 203), and they give rise to a classical Maxwell-like
linear viscoelastic response of the material (190) and a more viscous solution (as
compared to the uncrosslinked case) in steady shear that can also display shear
thickening above a critical shear rate (204). Crosslinking with metal ions is
performed over a larger range of pH (depending on the ion) (192), and gels
crosslinked with zirconate can tolerate a higher downhole temperature than with
borate (197). Since the metal crosslinked guar forms a chemical gel, shearing
disrupts the bonding network and the gels do not completely reheal (193, 197).
Temperature and pH accelerate the crosslink reaction, while the addition of
organic molecules (ligands) can delay it. Pressure also affects the rheology: a
decrease of 70% was reported in the viscosity of 0.3wt% hydroxypropyl guar
crosslinked with diboronic acid when pressure was increased from atmospheric
to 10,000psi (citation). Water chemistry (pH and ion content) must also be
monitored, as species like bicarbonate, phosphate, magnesium, iron, and silicate
can affect the crosslink density and hydration state of the guar (citation).
Guar is often injected with delayed crosslinker and a breaker to modify the
fluid rheology away from surface equipment. Ideally, crosslinking would occur

immediately before the fluid transits the perforation to the fracture: (1)
Crosslinking in the wellbore subjects the fluid to high rates of shear (typically
500-1,500 s-1), and may irreversibly damage the crosslinked network. (2)
Crosslinked guar is more viscous and more difficult to pump, limiting the
pumping rate (citation). (3) Crosslinked guar more effectively carries proppant
into the fracture preventing sand from settling to the bottom of the pipe instead of
entering the fracture. Even when crosslinking is delayed, the gel is exposed to
extremely high shear rates in the jet-like flow through the perforation. Thus, the
ability of the gel to heal and recover must be quantified to ensure that the desired
rheological properties of the fluid are retained in the fracture. The breaker is
added to degrade the guar (crosslinked or uncrosslinked) once the fracture has
closed (192). Degradation is necessary to ensure that the ultimate conductivity of
the fracture is not hindered by the presence of a viscous fluid, or residual
polymer. Oxidizers and enzymes can be used (such as β-mannanase) to cleave
the acetyl linkages connecting mannose--mannose and mannose--galactose
groups (citation, 205).
Breaker: Additive to reduce fluid structure and viscosity.
4.2 VISCOELASTIC SURFACTANT-BASED FLUIDS.
Micellar surfactants in water constitute the so-called viscoelastic surfactant
(VES) class of fluids. Introduced because of simplicity in design, preparation,
and breaking requirements, the rheology of VES can be tuned by varying the
surfactant concentration and also the amount and type of salt or co-surfactant
added to water. Since the surfactant molecules are amiphilic and relatively short-
chained (as compared to polysaccharides), these fluids do not require time to
hydrate and generally build structure rapidly upon addition to water. Above the
critical micelle concentration, the VES forms long worm--like structures that
continuously break and reform, endowing the fluid with a Maxwell--like
viscoelastic response (206). This microstructure is perturbed and the fluid thins
when flowing through the high shear perforation (like guar). Since the proppant-
carrying ability depends critically upon the viscosity, the crucial design

parameter is the fluid rehealing time versus the proppant settling time in the near-
perforation region. If the fluid does not recover sufficiently fast, the proppant will
settle, accumulate, and occlude the perforation resulting in screenout. The
micellar fluid rheology is also strongly temperature sensitive; VES are only
typically used in formations below 115˚C.
VES has additional benefits: A breaker is not required when the formation
contains mobile water. In other cases, VES can be broken by dilution with
injected water (citation). Permeability damage is reduced in the formation and
proppant pack as the surfactant micelles can dissolve in both aqueous and organic
liquids. The strain-hardening extensional viscosity of VES reduces leak-off in
formations with small pores. Furthermore, the rheology of such systems can be
tuned such that the very high shear rate rheology translates into low frictional
pressure losses in the pipe (in turbulent regime), eliminating the need for a cross-
linker. The main disadvantage, however, is the low pressure drop they create in
the fracture (related to their shear banding). To remediate this issue and ensure
enough fracture aperture for proppant placement, VES are generally foamed.
While much is known about unladen VES, the current body of knowledge has not
enabled a clear link between the structure of the surfactant and the resulting
properties of the slurry, limiting the development of this family of fluids.
4.3 ENERGIZED FLUIDS, FOAMS, AND EMULSIONS.
All of the fluids described above can be energized (foamed) with nitrogen
and/or carbon dioxide, and can also be added as inclusions in an immiscible
organic fluid to build an emulsion (197, 198). Energized fluids and foams have
the advantage of reduced water usage, while maintaining proppant transport
ability. Furthermore, energized fluids require little or no breaker (the foam life
can be controlled by surfactant chemistry), and tend not to damage the formation
since a majority of the material (by volume) pumped downhole is gas and not
water or oil (192). The rheology of foams and emulsions can be tuned through
the fraction of the various phases, distribution of the size of the dispersed phase,
and the interfacial tensions of the phases (106). Foams can exhibit viscosities far
greater than the liquid phase and can exhibit a yield stress (207): they thus

suspend proppant adequately, provide enough viscosity to create fracture width
and can provide adequate leakoff control.
Temperature and pressure variations from the surface to the fracture tip yield
changes in the rheology of the foam, and changes in the overall gas volume
fraction. Foams must be designed to accommodate these changes, requiring
interrogation at variable temperature, pressure, and mechanical stimuli. These
materials are difficult to characterize in the lab, chiefly due to slip and related
artifacts (120, 207). Furthermore, the structure of foams, although shown to
strongly control flow properties in both straight channels and porous media, is
difficult to replicate in the laboratory.
Foams have been historically used to decrease the hydrostatic pressure in the
wellbore, enabling hydraulic fracturing treatments in depleted reservoirs (with
low pore pressure and low reservoir stress). Despite strong potential benefits in
reservoirs generally, the use of foams remains restricted to lower pressure regions
and low volume treatments. Fluid selection is (again) mainly based on empirical
experience, largely because of the lack of systematic understanding noted above.
More recently, liquefied gas has been used as the liquid phase (to decrease
formation damage) (citation), but this approach has not yet been
comprehensively developed.
4.4 SLICKWATER AND WATERFRACS.
The simplest materials used in hydraulic fracturing are the slickwater/waterfrac
fluids. These materials target very low permeability reservoirs, where leak-off is
minimal and generation of frature surface area is paramount (citation). These
fluids are dilute polymer solutions (usually polyacrylamide (198) or propylene
oxide) where the polymer acts as a friction reducer (199) in the pipe, and not a
viscosifier. The concentration of these additives is of the order of 0.01-0.1w%
(Montgomery2013,Gulbis1999). Salts, clay control additives (to mitigate clay
swelling and permeability reduction), and other components may be added in
small amounts (104). Mitigating pumping losses are a key issue, as these fluids
are pumped at high rates to treat multiple fractures at once (upwards of 120

bbl/min for 4 to 6 concurrent hydraulic fractures). Of all the fracturing fluids,
proppant settling occurs most rapidly in slickwater. Since the carrying ability of
these fluids is minimal, proppant concentrations 0 0.07φ≤ à are typically used.
The main advantage of slickwater fluids is their low cost, which has enabled
economical production of unconventional reservoirs in North America. The
major drawbacks are the minimal proppant-carrying ability, minimal fracture
width generated, and challenges in fracture containment. Slickwater has been
used recently in hybrid jobs, where slickwater is first pumped to create narrow
fractures in a complex nextwork, and is followed by a more viscous fluid to
widen the fracture and carry higher concentrations of proppant (citation). As
with other fluids, the design of slickwater and hybrid jobs is largely empirical.
4.5 FIBER-BASED FLUIDS
Fiber-based fracturing fluids are a relatively recent innovation, developed to
improve proppant transport (citation). Benefits of fiber-based fluids lie in their
ability to partially decouple proppant transport ability from the base fluid
rheology. This enables independent control of viscosity to achieve fracture
width, pumping rate, and invasion of proppant into the fracture. The addition of
fibers is particularly useful for high-temperature application, where maintaining
the fluid viscosity with chemical modifiers can prove difficult. Furthermore,
fibers strongly reduce the effect of proppant diffusion during transport, both in
the pipe and in the fracture. This ensures that the schedule of proppant
concentration imposed at the surface is preserved along the wellbore and into the
fracture. Specifically, this feature permits the pulsing of proppant-laden slugs
with particle-free fluid, enhancing the post-treatment fracture conductivity.
Despite the success and wide use of fiber-based fluids, fundamental
understanding of these systems are scant. This knowledge gap is likely the
largest among all commonly-used fracturing fluids. Design empiricisms rule:
systems adjudged to be adequate typically consist of a polysaccharide (guar) base
fluid, flexible fibers in the semi-dilute to dense regime, and proppant. The
properties of these systems have not been comprehensively studied in the
literature. Typically, simpler canonical systems have been studied, focusing on

rigid fibers in Newtonian matrix fluids, in the absence of other solid particles
(i.e., proppant). Despite their relative simplicity, studies demonstrate that fiber
based suspensions have unique properties.
4.6 THE NEED FOR MEASUREMENTS
Fracturing fluids operate at high shear, high temperature, high pressure, are
laden with dense spherical particles, long and flexible fibers, and can be foamed.
As experimental requirements, any one of these is a challenge. In conjunction the
experimental task is daunting. Regardless, measurement and theory are required
to enable model-based fluid selection and design, rather than Edisonian
approaches guided by empirical experience. Parametric exploration of the
rheology of t these materials, and measurements at high pressure and high
temperature under both steady and dynamic forcing would advance our
understanding substantially.
5. COMPLEX FLUIDS IN HYDRAULIC FRACTURING
Fracturing fluid characterization is essential for both the design of new
fracturing fluid systems and for the optimization of hydraulic fracturing
treatments. It can be decomposed into two parts: Firstly to provide an
understanding of how the fluid answers the tremendously complex and often
contradictory engineering requirements described in sections 3.5 and 4.1, and
result in a knowledge base that forms the basis for design and optimization. The
second goal is to inform fracturing models that are used to design and optimize
hydraulic fracturing treatments. Tests associated with these goals should (ideally)
be standard protocols as they be repeated for any new fluid formulation and, to
some degree, for any new fracture design. Such standard tests should be guided
by the knowledge developed in the former, more detailed characterization In this
section, we consider the rheology of the base fluids (that also constitute the pad)
and that of the particle laden fluids (slurries).

Propping the fracture is an essential outcome of the hydraulic fracturing
treatment. In addition to initiating and propagating the fracture, the fracturing
fluid must transport and enable an even distribution of particles to the instant of
fracture closure. Avoidance of particle settling is thus a major consideration in
particle transport – settling results in inhomogeneous placement along the length
and height of the fracture, and can cause the fracture to close in a wedge-like
shape (124). Transported particles must navigate the vertical and horizontal
wellbore, the perforation, the fracture width and height, as well as the
bifurcations and tortuosity encountered along the fracture length; Nearly every
point along the flow path is an opportunity for occlusion by the proppant.
5.1. Rheology and Rheometry of Fracturing Fluids
The response of the fluid stress as a function of shear rate and temperature is an
important input to fracturing models (65) both to determine the geometry of the
fractures and the power required to pump fluids downhole. As described in
section 1, most codes model the slurry as a continuous fluid using a shear-
thinning viscosity model (citation). Oilfield operators argue that determining a
precise fluid viscosity is unnecessary owing to the weak dependence of fracture
dimensions on the viscosity, as described in section 3.5. Even as the viscosity
strongly influences leak-off, knowledge of the exact value may not be critical, as
the necessary rock properties are often a priori unknown and independent tests
must be carried out to characterize leak-off. The flow behavior of suspensions,
on the other hand, is critical to optimize proppant transport, as described in the
next section.
Complex fluids exhibiting a dependence of stress on shear rate only (absent
material memory and strain dependence) are classified as generalized Newtonian
fluids (GNFs). We provide a set of commonly used GNF constitutive laws in
Table 5. Common Fracturing fluids are also often viscoelastic in character
exhibiting normal stress differences, memory, and other effects. More accurate
descriptions and fits can obtained by viscoelastic equations of state like the
Giesekus or K-BKZ models accounting for memory and strain effects (105, 107,
112), but these models are more challenging to implement analytically and
computationally.

<COMP: PLEASE INSERT TABLE 5 HERE>
5.1.1. FRACTURING FLUID RHEOMETRY. The bespoke design of fracturing
fluids, coupled with the absence of universally predictive structure–function
relationships, necessitates the direct measurement of complex fluid properties.
Rheometers are used to measure the stress response to well-defined shearing
motions generating (i) steady applied rate or stress, (ii) steady-state and transient
response to oscillations in amplitude and frequency (capturing both linear and
nonlinear viscoelastic material response), and (iii) startup and cessation of stress
or strain. Pressure-driven flows through slits, pipes, and constrictions can also be
used to measure properties of pure fluids and suspensions under kinematics
conditions closer to those downhole. Fewer commercial instruments exist to
probe the extensional properties of complex fluids (useful for flow through
perforations and porous media), with most being custom-built (114). This is
mainly due to difficulties in eliminating no-slip boundary conditions and in
controlling the kinematics and flow strength (115).
Rheometric tests quantify several material functions: the shear viscosity ( )η γ& ,
normal stress differences 1N ( )γ& and 2N ( )γ&, viscoelastic storage and loss moduli
in response to imposed oscillations (at frequency ω and amplitude γ0) 0( , )G γ ω′
and 0( , )G γ ω′′ , compliance J(t), relaxation modulus G(t), extensional viscosity
( )Eη γ& , or CaBER relaxation time (116), among others (105, 117). Measures of
linear viscoelasticity are relatively well-defined and can be reproduced across
different techniques, whereas numerous alternate measures of nonlinear
viscoelasticity can be made and are often chosen to closely mimic the process
that the data will inform.
Despite the availability of commercial fluids-characterization tools, care must
be taken to properly execute experiments and interpret results. Several effects,
generic to all complex fluids, are present and should be anticipated when
performing experiments: (1) Slip and shear banding; Slip, adhesive failure, and
shear banding on the measuring instrument will compromise results.
Unavoidable in many cases, they can be quantified with direct measurement
(119), or inferred by repeated measurements varying the gap between parallel

plates (120). (2) Instabilities; Strongly viscoelastic fluids can exhibit spurious,
or apparent, shear thickening owing to elastic (117, 121) or inertial instabilities
(117). Predictive theories for the onset of instabilities are available in most
geometries (111, 117) as a function of material properties and experiment
parameters. (3) Particle migration; Gradients in shear rate and elastic stress, and
nonzero streamline curvature promote particle migration; Most rheometric shear
flows have circular streamlines. The measurement time should be short as
compared to the time scale for particle migration. (4) Boundary effects; In
addition to slip, rheometer boundaries can induce ordering and disturb the
orientation of nonspherical particles (122). The geometry should be large as
compared to the particle size, typically greater than 10 particle diameters (117).
(5) Measurement at elevated temperature and pressure; Reproducing
downhole temperature and pressure introduces problems in evaporation and
sample containment, and is generally available only for steady measurements
above 100°C. (6) Repeatability and mixing; Care must be taken to properly
hydrate and mix additives in fluids (123), and also that the materials have not
degraded or biologically decomposed when used over several days. In all cases
the material should reflect the state of hydration/homogeneity used in the actual
process.
In addition to shear, pressure-driven, and extensional rheometry, simpler
index-based measures of rheological properties are also used (117). Common
outside of academic laboratories, indicial measurements provide a simple
diagnostic metric corresponding to pressure drop or torque in response to a
poorly-defined flow field. They are difficult to connect to models and
microstructural material theories. Such indices are useful, however, in that they
can provide rough quality-control checks that the target fluid will answer all
requirements adequately.
5.1.2. RHEOLOGY OF PARTICLE LADEN FLUIDS. Proppants are transported to
the fracture to maintain conductivity after cessation of the flow/pressure from
surface. Proppants are classified by their strength (i.e. how much fracture closure
stress the proppant pack can sustain), average grain size and statistical
distribution, the quantity of fines (that may reduce the pack permeability),

roundness and sphericity, and density. Sand is commonly used, as are other
materials like resin or polymer-based particles, ceramics or carbides, and hollow
glass spheres may be added as proppants or as components in a mixture. As
mentioned in Section 4, fibers are also added, not as proppant per se, but to
modify fluid rheology and decrease settling rates (132) although fibers can also
mechanically bridge the fracture. At the pump, the volume fraction (vol/vol) of
the flowing suspension can range from 0% to 5% for waterfrac/slickwater
applications (133), and upwards of 20% in treatments using more viscous fluids
(134); these values increase along the fracture due to leak-off. The size of the
proppant particles used is guided by the expected width of the fracture during
pumping, and proppant concentration by the desired width during production
which is directly linked to the final amount of proppant per fracture area after
closure. Particle size is specified using the mesh size of a sieve, larger mesh
values correspond to smaller particles. 40/70 mesh sand is commonly used,
corresponding to particles with approximate diameters between 210 and 420 µm.
Volume fraction: Typically, solids
total
VVφ = . Industrial specifications of solids concentration
are typically in pounds added per fluid volume; pounds per gallon, ppg, is common.
Addition of particles will ‘thicken’ the fluid due to the additional viscous
dissipation that arises at the no slip boundary of each particle. This effect is well-
characterized in Newtonian fluids, and has been worked out to first order by
Einstein and to second order by Batchelor: 2522/ 1 Csη η φ φ= + + . The constant C2
depends on the flow type and the Pèclet number (101, 135). At larger
concentrations no analytical solution is known; several empirical fits to data for
monodisperse suspensions of spheres exist (100, 135), typically of the form
given by the Krieger-Dougherty equation (Table 5), Where maxφ is the maximum
packing fraction for spheres in the suspension, and [η] is the specific viscosity (a
function of particle shape); with max[ ] 1.6η φ ≈ for spheres. The viscosity diverges
at maxφ , and is very sensitive to small changes in particle concentration except for
small values of max/φ φ .

Similar results follow for multimodal suspensions (136, 137). Chang and
Powell (137) review and study the rheology of bimodal suspensions of spherical
particles; At an identical total volume fraction, the viscosity of a bimodal
suspension is lower than a monodisperse suspension, and this difference grows
as the mismatch between particle sizes becomes larger. The same result follows
for multimodal suspensions, as described by Farris (136), for whom the effect is
named. This result is significant for fracturing – solids loading can be increased
without sacrificing pumping power by selectively controlling the size distribution
(citation).
The dynamics of a fibers are drastically different than spheres, even in the
dilute limit. Jeffery (138) solved for the motion of an isolated, axisymmetric
ellipsoid in a shear flow, demonstrating that particles orbit and sweep out a
volume dependent upon the initial orientation of the ellipsoid. Rigid fibers fit
well into this framework --- they can be modeled as ellipsoids where the aspect
ratio major axisminor axis 1L
p dr = = ? . Suspensions of fibers may be classified according to
the nature of interactions among the fibers (122). Suspensions are considered
dilute when the distance between fiber centers avoids contact and hydrodynamic
interactions are negligible (>L), satisfied when 2prφ −à . Incorporating
hydrodynamic interactions with minimal particle--particle contacts establishes
the semidilute window, 2 1p pr rφ− −à à ; everything above this window ( 1
prφ −> ) is
considered the concentrated regime, in which interparticle interactions between
fibers contributes strongly to the fluid rheology.
In the dilute regime, fibers viscosify the fluid less than spheres at the same
volume fraction, as they spend most of their existence aligned with the flow
during their Jeffrey orbit. This is communicated quantitatively through the
specific viscosity of fiber suspensions (ellipsoids with pr →∞ ), found by Jeffery
to be [ ] 2η = ; similar results have been computed by many others (see Table 1 in
Petrie’s review on fiber suspension rheology (139)). In the semidilute regime, for
the same solids concentration, suspensions with larger rp will exhibit a larger
viscosity (140). The aspect ratio and concentration are not the only controlling
parameters, however, as the fiber length has been shown to influence the
viscosity for fixed rp and φ (140); this length effect is presumably due to the

presence of flocs formed by adhesive contacts and between the particles, and is
mitigated at large stresses (141). Other effects, like the orientation and buckling
of fibers contribute strongly to suspension rheology and stress growth in the
start-up of shear flows.
The volume fraction required to form a mechanical contact network (φc)
decreases strongly as the particle becomes less spherical (142), scaling as 10.6c prφ −: to lowest order in the aspect ratio for prolate ellipsoids. This suggests
that mechanically--connected networks of fibers can be formed at smaller
volume fractions as compared to spheres, where 0.28cφ : (142). This result has
been exploited to fiber-based fracturing fluids (132).
Shear thickening is also observed in some fracturing fluids. Particle-laden
flows will exhibit an increase of viscosity with increasing shear rate provided the
suspension is above about 40% solid particles; the magnitude of shear
thickening, becomes increasingly severe as the concentration of particles
increases (100, 113). The shear thickening described here is dynamic and distinct
from the viscosity enhancement that arises from simply adding particles to a
fluid (where no-slip on the particle surfaces enhances the local viscous
dissipation rate as the volume fraction of the solid phase increases). Recent
reviews by Denn and Morris (143), Stickel and Powell (135), and the
monographs by Guazzelli and Morris (101) and Mewis and Wagner (100),
provide extensive reviews of suspension rheology and mechanics for non-
Brownian particles.
Describing the rheology of filled non-Newtonian liquids is significantly more
complex due to the variety of fluid behaviors and constitutive laws available ---
experiments and theory required to classify and describe each are extensive and
difficult. Barnes (144) provides a recent review of particulate suspensions in
non-Newtonian fluids. While generalized statements are difficult to justify for
particles in non-Newtonian matrix fluids, many viscoelastic particle-laden
systems display a magnification of viscoelastic effects in the fluid phase owing
to the increased local shear rate resulting from the presence of solids. This effect
has been explored by Gleissle and coworkers, showing that a shift factor
dependent on volume fraction can accurately predict material functions of many
particle--fluid systems (145, 146). The non-Newtonian rheology of a suspension

in a yield-stress fluid has recently been explored by Dagois-Bohy et al.
(citation).
5.2. PARTICLE MIGRATION
The oilfield community started to investigate particle migration under fluid flow
in the late 1980s (citation). There was a concern that settling would be
accelerated if particles migrated to the center of the fracture width, both under
flow and at rest. Another concern is the increased velocity of the particles in the
fracture midplane, which may reach the tip of the fracture and cause bridging
[cite??]. Particle migration arises from several forces, present in both Newtonian
and non-Newtonian fluids.
The migration of a dilute suspension of particles in low Reynolds number flow
was studied by Segré and Silberberg (147, 148), observing particle concentration
at ≈0.6 of the tube radius. Theory applied to migration in this dilute limit
generally agrees with experiment (149, 150), revealing that a balance between an
inertial lift force and a repulsion near the wall is responsible for the equilibrium
distribution. At higher Reynolds numbers the concentrate annulus moves towards
the wall. Matas et al. (151) characterize this behavior for 67 Re 2400≤ ≤ , and
observe a second equilibrium position at the tube center when Re 600≥ , which
was also a function of particle size. Asmolov (152) provides a theoretical
description of particle migration in this limit, but does not predict the second
equilibrium region.
Non-dilute suspensions under flow exhibit particle migration owing to
gradients in viscosity, shear rate, and particle concentration. These effects were
observed by Acrivos and coworkers (162, 163) in the rheometry of suspensions,
where particles migrated to regions of low shear rate in a Couette cell. Similar
effects have been observed in duct flows of suspensions (citation) , showing the
transport of particles toward the channel centerline and a blunting of the velocity
profile with increasing volume fraction. Oh et al. (citation) measured that the
center region could reach Phi=0.64, the random close packing limit of
monodisperse spheres, demonstrating that these domains progressively compact.

The driving mechanisms are well-described in constitutive models by Phillips
et al. (164) and Mills and Snabre (165). Phillips et al. use a diffusive flux
approach, in which particle concentration plays the role of an active scalar which
diffuses as a result of several gradient terms. Particles migrate away from
regions of high collision frequency, corresponding to regions of large shear
and/or particle concentration, ( )p pJ γφ− −∇ &: . Further, particles migrate away
from regions of large viscosity; a colliding particle pair in a region of
inhomogeneous φ (and therefore ( )η φ ) will exhibit a net displacement toward
the region of lower viscosity, ( ( ))Jη η φ−∇: . Mills and Snabre (165) predict
migration based upon gradients in the stress (rather than upon local particle
collision rates as considered by Phillips et al. (164)). Recent analyses (166, 167)
employ the frictional rheology model of Boyer et al. (168). Both capture the
migration of particles toward the center and resultant blunting of the parabolic
flow profile. The distribution of particles has been measured (154) and
demonstrates the applicability of these models (166, 168).
In viscoelastic fluids, migration can also occur due to an elastic force
orthogonal to the direction of shearing. Elastic (normal) forces are largest in
regions of large shear rate; gradients in the shear rate across a particle will result
in a net elastic force pushing particles to regions where the gradient in shear rate-
--and resulting elastic stress gradient---is small. In a Poiseuille flow, particles
therefore migrate toward the apex of the velocity profile. This effect has been
described in a Second Order Fluid by Ho and Leal (108), and experimentally
verified by Tehrani (155). Leshansky et al. (109) perform experiments showing
focusing in a microdevice, and derive an identical scaling argument as Tehrani
for the migration speed, 2 16
Nayv γ
πη γ∂ ∂∂ ∂∼ − && where N1 is the first normal stress
difference, and y is the cross-channel dimension. Tehrani also illustrates the
importance of the shear rate, observing the absence of particle migration in the
plug-flow region of an elastic solution.
Elastic forces also give rise to subtle and surprising particle--particle
interactions. Feng and Joseph (156) studied these interaction effects in torsional
shearing flow between parallel plates, observing the formation of annular rings
using both spheres and fibers in a polyox solution; interestingly, fibers can rotate
inward or outward depending if the fiber is free to rotate about the vorticity axis

or if it is stuck in a state aligned with the flow. Lim et al. (157) explored these
effects in rigid microfluidic devices at high Reynolds number. Iso, Koch, and
Cohen (158, 159) study semidilute concentrations of fibers in fluids of varying
elasticity in a Couette flow and highlight the competition between particle--
particle hydrodynamic interactions and elasticity-driven fluid effects. Fibers tend
to align toward the vorticity axis in weakly elastic fluids ( 1Wi = , ‘log rolling’),
but become more random when the fiber concentration increases, whereas fibers
tend to align in fixed orientations (along and slightly offset from flow) in
strongly elastic fluids ( (1)Wi Oâ ).
The nature of the non-Newtonian fluid determines the nature of the particle-
particle interactions. In a study of particle--particle interactions in a shear flow,
Snijkers et al. (160) detail these differences in both the rheology of the fluid and
resulting particle trajectories. A unifying theme of elastic fluids, however, is the
tendency to exert an inward compressive force normal to curved streamlines,
which can explain particle--particle kissing, streamwise orientation of elongated
particles, and particle motion toward walls (161). Understanding these effects
better may provide insight into the trajectory of proppants in a complex network
on fractures, e.g. which components of a proppant will effectively move from the
main fracture into an adjacent fracture making a sharp angle with it.
A myriad of these migration mechanisms have been implicated, along with
fluid phase leak-off, in suspension flow and tip screenout in the fracturing
process. Chekhonin and Levonyan (169) consider suspension flow in a KGD
fracture to establish parameters for tip screenout, computationally modeling the
suspension concentration along the fracture length only and dividing the flow
into regions that are Poiseuille--like ( maxφ φ< ) or Darcy--like ( maxφ φ= ).
Dontsov and Peirce (170, 171) consider both KGD and pseudo 3D fracture
models using a frictional rheology model incorporating slip and settling within a
fracture. These results establish that proppant screenout (owing to leak-off driven
concentration and settling) can drive strong changes in fracture geometry.
5.3. PARTICLE SETTLING

Proppant settling occurs under both dynamic (during flow) and static conditions.
Elimination and mitigation of settling is important to ensure a uniform
distribution of proppant particles along a fracture; settling will occur unless the
proppant and fluid are density-matched. The presence of boundaries, non-
Newtonian base fluids, and other particles all modify the settling of proppants
within a fracture.
Two distinct regimes of settling behavior are recognized to exist during the
fracturing process: (i) rapid settling coupled with successive rolling, saltation,
and resuspension of the sediment bed, and (ii) gradual settling absent a moving
sediment bed. In all cases descriptions of particle transport are dominated by
empirical correlations except where exact zero Reynolds number results can be
applied (172). The sediment transport described in (i) was recognized in 1959 by
Kern et al. (173). The relevant physical parameters are the shear stress acting on
the grain compared to a gravitational stress, 2 ( )p
s fagτρ ρθ −= (the Shields
parameter), and the particle Reynolds number Rep. Sediment transport is
anticipated in waterfrac/slickwater operations (174), the onset of which can be
predicted using a Shields plot (175). This process, specific to the fracturing
configuration, was studied in more detail by Patankar et al. (176) and Wang et al.
(177) who develop power law correlations to describe static and fluidized bed
heights in a fracture.
Proppant particles in more concentrated polymer and gel--like fluids will
experience reduced settling and flow rates, owing to the enhanced viscosity of
the fluid. Particles sedimenting experience frictional drag and a variety of
particle-- and wall--driven retarding phenomena prior to deposition in a pack on
the bottom of the fracture. The flowing particles experience all of the migration
forces described above, and additionally feel a body force due to gravity. This
body force drives particles downward to the fracture floor; conservation of mass
and the migration of neighboring particles drives a recirculation (101), which
retards the settling speed. A result by Richardson and Zaki (101, 178),
(1 ) nsu u φ −= − , predicts the decrease in the Stokes settling speed, us, as a
function of volume fraction, φ. The power-law exponent 5n ≈ is determined
empirically (101, 179). In this expression the volume fraction is uncorrected for
maximum packing and will lose predictive capability at higher particle

concentrations; Chang and Powell (180) introduce a modified version of this law
to correct for the maximum packing limit, 5.3 0.2max(1 0.05 / )su u φ φ ±= − .
Particles sediment differently under both static and flowing conditions when
embedded in non-Newtonian fluids (Figure 3). This aspect of fracturing fluids has
been studied in the petroleum industry since at least the 1970s. Some efforts have
focused on the development of empirical correlations to predict settling of
particles in shear-thinning or Carreau-like fluids (172, 181, 182), while others
have tackled the static versus dynamic settling problem directly. Novotny (183)
performed experiments in a Couette cell using a polyacrylamide fluid and
observed enhanced settling when the suspension was sheared, even remarking
that particles which appeared to be completely stagnant in a ‘highly non-
Newtonian fluid’ will sediment once sheared. McMechan and Shah (184) studied
the static settling of particles in a 14-ft tall cell using a variety of metal and
borate crosslinked guar fluids, and remarked on the suspending ability of the
various crosslinkers. In particular, they noted variability in the time for the
proppant--carrying capacity of the materials to recover following pumping and
shearing to fill the cell.
<COMP: PLEASE INSERT FIGURE 3 HERE>
Figure3Singleandmanyparticleeffectsundersettlingandshear.(a)Traceoftheconformationtensorsurroundingasettlingparticleundershear(128)illustratingregionsofpronouncedmolecularstretchinglengthandregionsofelasticstress(ReprintedfromJournalofnon-NewtonianFluidMechanics,Vol197,Padhyetal.,Simulationsofaspheresedimentinginaviscoelasticfluidwithcrossshearflow,48--60,Copyright2013,withpermissionfromElsevier).(b)Settlingofparticleswithstationary( 0γ =& )andshearedfluid(ReprintedwithpermissionfromTonmukayakuletal.(129)Copyright2008,AIPPublishingLLC)illustratingincreaseddragonasettlingsuspensionwhen 0γ >& .ManyparticleinteractionsinducechaininginaperiodictrianglewaveCouetteflow(130)(ReprintedfromJournalofnon-NewtonianFluidMechanics,Vol117,Wonetal.,Alignmentandaggregationofsphericalparticlesinviscoelasticfluidundershearflow,141--146,Copyright2004,withpermissionfromElsevier)(c)andundersettling(131)in(d)(ReprintedfigurewithpermissionfromMoraetal.PhysicalReviewLetters95:0883012005Copyright2015bytheAmericanPhysicalSociety).
Extensive experiments using Couette and slit-flow geometries indicate that
fluid elasticity is required to retard settling in dynamic conditions, and that the
microstructure of the non-Newtonian fluid and shear conditions are essential to
determine the ability of the fluid to retard (or enhance) settling under dynamic
conditions. Gheissary and van den Brule (185, 186) study Newtonian, constant
viscosity elastic fluids (i.e., Boger fluids), and a viscoelastic shear-thinning fluid.
They find that settling is retarded in the Boger and viscoelastic shear-thinning
fluids, with the highest elasticity fluid (as measured by the first normal stress
difference) giving slowest settling rates, even if the fluid shear-thins. They also
comment on flow-induced anisotropy: flow of fluids that shear-thin due to
alignment of polymer molecules (HEC for example) will exhibit less settling that
shear-thinning fluids that shear-thin due to breakdown of the internal
microstructure (such as carbopol). Tonmukayakul et al. (129) tune the amount of
borate crosslinker in a guar gum solution, and show that at lower concentration
of crosslinker (corresponding to a weakly elastic, shear-thinning fluid), the
settling rate increases with shear rate, whereas at higher concentration of
crosslinker (a viscoelastic gel-like fluid), the settling rate markedly decreases
with shear rate. The experiments by Hu et al. (187--189) focus on differences
between borate and metal crosslinked guars, with high concentration
crosslinkers. Microstructurally, these materials differ in the nature of the
crosslinks: Addition of borate introduces dynamic crosslinks, enabling the
material to reheal following breaking (190, 191), while the metal-based
crosslinks are irreversible and do not reform once broken (192, 193). Settling in
each gel under shear then proceeds differently. Settling in the borate crosslinked
guar is retarded by imposed crossflow, and both N1 and η increase as a result of
shear. Conversely, minimal settling is observed in metal crosslinked gels at low
or zero shear rates, but, above a critical shear rate, the proppant carrying ability
of the material is lost and substantial settling is observed.
The retarded settling of particles within non-Newtonian fluids subjected to
shear flow has also been examined computationally and analytically. Tanner,
Housiadas, and coworkers (194, 195) have studied the drag on a sphere, pointing
to an added elastic stress contributed by the distortion of streamlines induced by
the settling particle. Padhy et al. (128, 196) perform computations using FENE-P
and Giesekus models to mimic a Boger fluid and a guar solution lightly
crossslinked with borate (which shows enhanced settling with increasing shear
rate in experiments (citation)). Their computations capture the retarded settling
observed in experiments, and also capture the result of Housiadas and Tanner

(194) when walls bounding the flow are removed (infinite domain). Padhy et al.
(128, 196) examine individual contributions to the total drag and highlight the
competition between elasticity (which increases frictional drag) and shear
thinning (decreasing drag). They further note that these phenomena scale
differently with polymer concentration, and a optimum concentration exists to
minimize the sedimentation speed (196).
The complexity of the nonlinear transport phenomena presented here,
compounded with complex temperature, pressure, and shear rate history
experienced by a slurry during a hydraulic fracturing treatment, in very
conservative assumptions in the design and optimization of hydraulic fracturing
treatments.
5.4. BRIDGING AND JAMMING EVENTS
Proppant occasionally becomes stuck, or jammed, during fluid injection. This
event is known to occur in both the immediate vicinity of the wellbore and close
to the fracture. In narrow apertures, these events may start after the formation of
a localized force chain or bridge of particles between the fracture walls. Bridged
proppant will redirect the local flow around it, and may either become
destabilized (unbridged) or grow. Jammed proppant creates a region of locally
magnified hydraulic resistance, growing until the pressure drop through the
jammed pack exceeds the pumping pressure at the well surface, termed
screenout. Screenout events constitute failure if they happen in the near wellbore,
as they halt the fracturing job, and require well cleaning. On the contrary, these
events can be planned to happen further down the fracture, ideally with limited
pad left if the fracture design is perfect, stopping the fracture from growing and
allowing more packing of the fracture with proppant than would be possible
without this event taking place (“tip-screenout” technique).
Bridge: A localized group of stuck particles, around which other particles and fluid
may flow.
Jam: A particle pack in the fracture with enhanced hydraulic resistance accumulating
proppant but permitting fluid to filter through.

Screenout: Pumping failure caused by massive hydraulic reisistance due proppant
obstructing the flow in the well or fracture.
Control and prediction of bridging and jamming are critical to avoid and
program screenout. Jamming is predicted sufficently well when solids reach a
maximum volume fraction. As for bridging, fracture models typically predict
bridging events when the ratio of slot width/particle size is below 3 to 10 – a
number that is tuned by experience, but consistent with bridging studies in
granular (125) and non-Brownian (127) systems, which reveal the stochastic
nature of the process. The difficulty partially comes from the physics controlling
the phenomena: bridging is a discrete event governed by probabilities of
occurrence that are not resolved by continuum models nor accurately predicted
by discrete models. The sphericity and frictional properties of the particle
certainly play a role and the pronounced effects such properties have on
suspension rheology are now beginning to be considered (citation). In addition
to tip-screenout designs, the dramatic consequences of bridging/jamming have
been advantageously applied in ‘diversion techniques’, where a fracture is locally
jammed and the particle-laden fluid is redirected to stimulate other parts of the
oilfield reservoir (citation), or in the form of a fluid loss control additive where
operators want to locally eliminate leak-off to the formation (citation).
Volume fraction: Typically, solids
total
VVφ = . Industrial specifications of solids
concentration are typically in pounds added per fluid volume; pounds per gallon,
ppg, is common.
6. CONCLUSIONS
Hydraulic fracturing, and hydrocarbon recovery operations in general, present a
grand challenge for non-Newtonian fluid dynamics. Complex fluids used in
fracturing operations encompass essentially all aspects of rheology and complex
fluids --- linear and nonlinear viscoelasticity, physicochemical gelation, transport
and orientation of spherical and fibrous particles, control of slip/shear banding,
migratory and many-body particle interactions are present in abundance and
intimately affect the ultimate hydrocarbon recovery that can be achieved. These

manifold effects match the spectrum of specific fluids employed to target rock
formations of widely varying permeability, porosity, mechanical properties,
depth, and temperature. Understanding and integrating non-Newtonian fluid
mechanics with reservoir attributes and statistical variability is a key contributor
to improved resource recovery, and constitutes an intellectually rich and
economically relevant research problem for years to come.
SUMMARY POINTS
1. Hydraulic fracturing is a key stimulation technique in hydrocarbon recovery,
primarily targeting reservoirs of low intrinsic permeability.
2. Hydrocarbon reservoirs exhibit widely variable mechanical, chemical, and
environmental properties.
3. Particle-laden complex fluids with a wide range of rheological characteristics
are used to open and sustain hydraulic fractures.
4. Quantitative descriptions of non-Newtonian fluid mechanics are essential to
predict complex fluid (and hence fracturing) performance.
FUTURE ISSUES
1. Improvement and development of constitutive models (particularly nonlinear)
for physical gels and supramolecular systems to model crosslinked and
associating complex fluids.
2. Mechanistic descriptions of particle--particle and particle--fluid interactions
under pressure (or shear) driven flow with superposed gravitational settling.
3. Material property measurements under representative temperatures and
pressures and shear rates to match downhole conditions.
4. Development of laboratory (milli- and microfluidic) scale experiments
illustrating reservoir--fluid--proppant interactions in flow regimes
representative of hydraulic fracturing dynamics, geometry, and materials.
5. Creation of coupled, multiscale, time-dependent simulations capturing
complex fluid rheology and particle transport during pumping, fracturing,
leak-off, and fracture closure.

DISCLOSURE STATEMENT
The authors are not aware of any affiliations, memberships, funding, or financial
holdings that might be perceived as affecting the objectivity of this review.
ACKNOWLEDGMENTS
We thank E. B. Dussan V. and Francois Auzerais for helpful and stimulating
discussions.
LITERATURE CITED
1. Ingraffea AR, Wells MR, Santoro RL, Shonkoff BC. 2014. Assessment and risk
analysis of casing and cement impairment in oil and gas wells in pennsylvania,
2000--2012. Proc. Natl. Acad. Sci. USA 111:10955--60
2. Howarth RW, Ingraffea A, Engelder T. 2011. Natural gas: Should fracking stop?
Nature 477:271--75
3. Van Dyke JW. 1896. Increasing the flow of oil-wells. Please check this reference
4. Thomas RL, Morgenthaler LN. 1999. Reservori stimulation, chap. 13, Introduction
to Matrix Treatments. John Wiley & Sons, 13.1--38 Please check this reference
5. Kalfayan LJ. 2007. Fracture acidizing: History, present state, and future. SPE
Hydraulic Fracturing Technology Conference: SPE 106371 Please check this
reference
6. Grebe JJ, Stoesser SM. 1935a. Treatment of deep wells. Please check this
reference
7. Grebe JJ, Stoesser S. 1935b. Increasing crude production 20,000,000 bbl. from
established fields. World Petroleum August:473--82
8. Howard GC, Fast CR. 1970. Hydraulic fracturing. Society of Petroleum Engineers.
Please check this reference
9. Gallegos TJ, Varela BA. 2015. Trends in hydraulic fracturing distributions and
treatment fluids, additives, proppants, and water volumes applied to wells drilled
in the united states from 1947 through 2010 ---data analysis and comparison to the
literature. Tech. rep., U.S. Geological Survey Investigations Report 2014-5131
Please check this reference
10. Ventura J. 2015. In Ener Con: The Oil and Gas Conference Please check this
reference

11. Energy R. 2015. 2nd quarter 2015 supplemental slides. Tech. rep., Rice Energy
Please check this reference
12. Corporation COG. 2015. In EnerCom: The Oil and Gas Conference Please check
this reference
13. Energy C. 2015. 2nd quarter earnings report. Tech. rep., Chesapeake Energy
Please check this reference
14. Kennedy RL, Knecht WN, Georgi DT. 2012. In SPE Saudi Arabia Section
Technical Symposium and Exhibition, 8--11 April, Al-Khobar, Saudi Arabia
Please check this reference
15. Turcotte DL, Moores EM, Rundle J. 2014. Super fracking. Phys. Today 67:34--39
16. Selley RC. 1975. An introduction to sedimentology. Academic Press City missing
17. Dietrich RV, Skinner BJ. 1979. Rocks and Rock Minerals. John Wiley & Sons
City missing
18. Tiab D, Donaldson EC. 2012. Petrophysics: Theory and practice of measuring
reservoir rock and fluid transport properties. Gulf Professional Publishing City
missing
19. Passey QR, Bohacs KM, Esch WL, Klimentidis R, Sinha S. 2010. From oil-prone
source rock to gas-producing shale reservoir -- geologic and petrophysical
characterization of unconventional shale-gas reservoirs. Soc. Petroleum Eng. SPE-
131350-MS Please check this reference
20. Lee WHK, Uyeda S. 1965. Terrestrial heat flow, chap. 6: Review of Heat Flow
Data. Am. Geophys. Union 87--190 Volume missing
21. Tissot BP, Welte DH. 1984. Petroleum formation and occurence. Springer-Verlag
City missing
22. Dow WG. 1977. Kerogen studies and geological interpretations. J. Geochem.
Explor. 7:79--99
23. Vandenbroucke M, Largeau C. 2007. Kerogen orgin, evolution and structure. Org.
Geochem. 38:719--833
24. McCarthy K, Rejas K, Niemann M, Palmowski D, Peters K, Stankiewicz A. 2011.
Basic petroleum geochemistry fo source rock evaluation. Oilfield Rev. 23:32--43
25. Soeder DJ. 1988. Porosity and permeability of eastern devonian gas shale. SPE
Formation Eval. March:116--24
26. Neuzil CE. 1994. How permeable are clays and shales? Water Resour. Res.
30:145--50

27. Dewhurst DN, Yang Y, Aplin AC. 1999. Permeability and fluid flow in natural
mudstones. Geol. Soc. Lond. Spec. Publ. 158:23--43
28. Dewhurst DN, Aplin AC, Sarda JP, Y Y. 1998. Compaction-driven evolution of
porosity and permeability in natural mudstones: An experimental study. J.
Geophys. Res.: Solid Earth 103:651--61
29. Aplin AC, Matenaar IF, McCarty DK, van der Pluijm BA. 2006. Influence of
mechanical compaction and clay mineral diagenesis on the microfabric and pore-
scale properties of deep-water gulf of mexico mudstones. Clays Clay Miner.
54:500--14
30. Loucks RG, Reed RM, Ruppel SC, Hammes U. 2012. Spectrum of pore types and
networks in mudrocks and a descriptive classification for matrix-related mudrock
proes. AAPG Bull. 96:1070--98
31. Aydin A. 2000. Fractures, faults, and hydrocarbon entrapment, migration and
flow. Mar. Petroleum Geol. 17:797--814
32. Anders MH, Laubach SE, Scholz CH. 2014. Microfractures: A review. J. Struct.
Geol. 69:377--94
33. Hooker JN, Laubach SE, Marrett R. 2014. A universal power-law scaling
exponent for fracture aperatures in sandstones. GSA Bull. 126:1340--62
34. Bernard S, Horsfield B. 2014. Thermal maturation of gas shale systems. Annu.
Rev. Earth Planetary Sci. 42:635--51
35. Nelson PH. 2009. Pore-throat sizes in sandstones, tight sandstones, and shales.
AAPG Bull. 93:329--40
36. Bear J. 1972. Dynamics of fluids in porous media. Dover Please check this
reference
37. Scheidegger AE. 1974. The physics of flow through porous media. University of
Toronto Press
38. Koplik J, Levine H, Zee A. 1983. Viscosity renormalization in the brinkman
equation. Phys. Fluids 26:2864--70
39. Larson RG. 1981. Derivation of generalized darcy equations for creeping flow in
porous media. Ind. Eng. Chem. Fundam. 20:132--37
40. Pearson JRA, Tardy PMJ. 2002. Models for flow of non-newtonian and complx
fluid through porous media. J. Non-Newtonian Fluid Mech. 102:447--73

41. Morais AF, Seybold H, Herrmann HJ, Andrade JS. 2009. Non-newtonian fluid
flow through three-dimensional disordered porous media. Phys. Rev. Lett.
103:194502
42. Klinkenberg LJ. 1941. The permeability of porous media to liquids and gases.
Drilling Prod. Pract. 200--13 Volume missing
43. Javadpour F. 2009. Nanopores and apparent permeability of gas flow in mudrocks
(shales and siltstone). J. Can. Pet. Technol. 48:16--21
44. Darabi H, Ettehad A, Javadpour F, Sepehrnoori K. 2012. Gas flow in ultra-tight
shale strata. J. Fluid Mech. 710:641--58
45. Katz AJ, Thompson AH. 1985. Fractal sandstone pores: Implications for
conductivity and pore formation. Phys. Rev. Lett. 54:1325--28
46. Katz AJ, Thompson AH. 1986. Quantitative prediction of permeability in porous
rock. Phys. Rev. B 34:8179--81
47. Curtis JB. 2002. Fractured shale-gas systems. AAPG Bull. 86:1921--38
48. Gale JFW, Reed RM, Holder J. 2007. Natural fractures in the barnett shale and
their importance for hydraulic fracture treatments. AAPG Bull. 91:603--22
49. Gale JFW, Laubach SE, Olson JE, Eichhubl P, Fall A. 2014. Natural fractures in
shale: A review and new observations. AAPG Bull. 98:2165--216
50. King GE. 2010. In SPE Annual Technical Conference and Exhibition, 19--22
September, Florence, Italy. Society of Petroleum Engineers, Florence, Italy:
Society of Petroleum Engineers
51. Berkowitz B. 2002. Characterizing flow and transport in fractured geological
media: A review. Adv. Water Resour. 25:861--84
52. Sahimi M. 2011. Flow and transport in porous media and fractured rock. Wiley-
VCH, 2nd ed. City missing
53. Zimmerman RW, Bodvarsson GS. 1996. Hydraulic conductivity of rock fractures.
Transp. Porous Media 23:1--30
54. Barenblatt GI, Zheltov IP, Kochina IN. 1960. Basic concepts in the theory of
seepage of homogeneous liquids in fissured rocks [strata]. J. Appl. Math. Mech.
24:1286--303
55. Warren JE, Root PJ. 1963. The behavior of naturally fractured reservoirs. Soc.
Petroleum Eng. J. 3:245--55
56. Kuchuk F, Biryukov D. 2014. Pressure-transient behavior of continuously and
discretely fractured reservoirs. SPE Reservoir Eval. Eng. February:82--97

57. Lockner DA. 2013. Rock failure. American Geophysical Union, pp. 127--47
Please check this reference
58. Kohlstedt DL, Evans B, Mackwell SJ. 1995. Strength of the lithosphere:
Constrains imposed by laboratory experiments. J. Geophys. Res. 100:17587--602
59. Alford J, Blyth M, Tollefsen E, Crowe J, Loreto J, et al. 2012. Sonic logging
while drilling --- shear answers. Oilfield Rev. 24:4--15
60. King MS. 1969. In The 11th U.S. Symposium on Rock Mechanics (USRMS), 16--
19 June, Berkeley, California. American Rock Mechanics Association, American
Rock Mechanics Association Please check this reference
61. Warpinski NR, Smith MB. 1989. Recent advances in hydraulic fracturing, chap. 3.
Rock Mechanics and Fracture Geometry. Society of Petroleum Engineers, 57--80
Please check this reference
62. Warpinski NR, Teufel LW. 1989. In-situ stresses in low-permeability, nonmarine
rocks. J. Pet. Technol. April:405--14
63. Sensey PE, Pfeilfe TW. 1984. In The 25th U.S. Symposium on Rock Mechanics
(USRMS), 25--27 June, Evanston, Illinois Please check this reference
64. Brown ET, Hoek E. 1978. Trends in relationships between measured in situ
stresses and depth. Int. J. Rock Mech. Min. Sci. Geomech. Abstr. 15:211--15
65. Adachi J, Siebrits E, Peirce A, Desroches J. 2007. Computer simulations of
hydraulic fractures. Int. J. Rock Mech. Min. Sci. 44:739--57
66. Perkins TK, Kern LR. 1961. Widths of hydraulic fractures. J. Pet. Technol.
13:937--49
67. Nordgren RP. 1972. Propagation of a vertical hydraulic fracture. Soc. Petroleum
Eng. J. August:306--14
68. Khristianovich SA, Zheltov YP. 1955. In Fourth World Petroleum Congress, vol.
2 Please check this reference
69. Geertsma J, de Klerk F. 1969. A rapid method of predicting width and extent of
hydraulically induced fractures. J. Pet. Technol. December:1571--81
70. Abé H, Mura T, Keer LM. 1976. Growth rate of a penny-shaped crack in
hydraulic fracturing of rocks. J. Geophys. Res. 81:5335--40
71. England AH, Green AE. 1963. Some two-dimensional punch and crack problems
in classical elasticity. Math. Proc. Camb. Philos. Soc. 59:489--500

72. Geertsma J. 1989. Recent advances in hydraulic fracturing, chap. 4. Two-
Dimensional Fracture-Propagation Models. Society of Petroleum Engineers, 81--
94 Please check this reference
73. Barenblatt GI. 1959. The formation of equilibrium cracks during brittle fracture.
general ideas and hypotheses. axially-symmetric cracks. J. Appl. Math. Mech.
23:622--36
74. Howard GC, Fast CR. 1957. In Drilling and Production Practice, 1 January, New
York, New York Publisher name missing
75. McGowen JM, Vitthal S. 1996. In SPE Annual Technical Conference and
Exhibition, 6--9 October, Denver, Colorado Please check this reference
76. Vitthal S, McGowen JM. 1996. In SPE Annual Technical Conference and
Exhibition, 6--9 October, Denver, Colorado Please check this reference
77. Madyarova MV. 2003. Fluid-driven penny-shaped fracture in permeable rock.
Master’s thesis, University of Minnesota City missing
78. Spence DA, Sharp PW. 1985. Self-similar solutions for elastohydrodynamic
cavity flow. Proc. R. Soc. Lond. Ser. A: Math. Phys. Sci. 400:289--313
79. Spence DA, Turcotte DL. 1985. Magma-driven propagation of cracks. J. Geophys.
Res. 90:575--80
80. Spence DA, Sharp PW, Turcotte DL. 1987. Buoyancy-driven crack propagation: a
mechanism for magma migration. J. Fluid Mech. 174:135--53
81. Lister JR. 1990. Buoyancy-driven fluid fracture: the effects of material toughness
and of low-viscosity precursors. J. Fluid Mech. 210:263--80
82. Desroches J, Detournay E, Lenoach B, Papanastasiou P, Pearson JRA, et al. 1994.
The crack tip region in hydraulic fracturing. Proc. R. Soc. Lond. Ser. A: Math.
Phys. Sci. 447:39--48
83. Garagash D, Detournay E. 2000. The tip region of a fluid-driven fracture in an
elastic medium. J. Appl. Mech. 67:183--92
84. Detournay E. 2004. Propagation regimes of fluid-driven fractures in impermeable
rocks. Int. J. Geomech. 4:35--45
85. Garagash DI. 2009. In IUTAM Symposium on Scaling in Solid Mechanics, ed. F
Borodich, vol. 10 of Iutam Bookseries. Netherlands: Springer, pp. 91--100
86. Garagash DI, Detournay E, Adachi JI. 2011. Multiscale tip asymptotics in
hydraulic fracture with leak-off. J. Fluid Mech. 669:260--97

87. Lenoach B. 1995. The crack tip solution for hydraulic fracturing in a permeable
solid. J. Mech. Phys. Solids 43:1025--43
88. Bunger AP, Detournay E, Garagash Dmitry I. 2005. toughness-dominated
hydraulic fracture with leak-off. Int. J. Fract. 134:175--90
89. Warpinski N. 2011. In Proceedings of the Technical Workshops for the Hydraulic
Fracturing Study: Fate and Transport Please check this reference
90. Hubbert MK, Willis DG. 1957. Mechanics of hydraulic fracturing. Pet. Trans.
210:153--68
91. Teufel LW, Clark JA. 1984. Hydraulic fracture propagation in layered rock:
Experimental studies of fracture containment. Soc. Petroleum Eng. J.
February:19--32
92. Warpinski NR, Teufel LW. 1987. Influence of geologic discontinuities on
hydraulic fracture propagation. J. Pet. Technol. February:209--20
93. Smart KJ, Ofoegbu GI, Morris AP, McGinnis RN, Ferrill DA. 2014.
Geomechanical modeling of hydraulic fracturing: Why mechanical stratigraphy,
stress state, and pre-existing structure matter. AAPG Bull. 98:2237--61
94. Rassenfoss S. 2015. What do fractures look like? a picture says a lot, even when it
is wrong. J. Pet. Technol. May:60--68
95. Fisher K, Warpinski N. 2012. Hydraulic-fracture-height growth: Real data. SPE
Prod. Oper. February:8--19
96. Smith MB, Shylapobersky JW. 1999. Reservoir stimulation, chap. 5. Basics of
Hydraulic Fracturing. John Wiley & Sons, 5.1--5.28 Please check this reference
97. Cipolla CL, Warpinski NR, Mayerhofer MJ, Lolon E, Vincent MC. 2008. In SPE
Annual Technical Conference and Exhibition, 21--24 September, Denver,
Colorado, USA Please check this reference
98. Warpinski NR, Wolhart SL, Wright CA. 2001. In SPE Annual Technical
Conference and Exhibition, 30 September--3 October, New Orleans, Louisiana
Please check this reference
99. Brown SR. 1987. Fluid flow through rock joints: The effect of surface roughness.
J. Geophys. Res. 92:1337--47
100. Mewis J, Wagner NJ. 2013. Colloidal suspension rheology. Cambridge
University Press City missing
101. Guazzelli E, Morris JF. 2012. A physical introduction to suspension dynamics.
Cambridge University Press City missing

102. Khilar KC, Fogler HS. 1998. Migration of fines in porous media. Kluwer City
missing
103. Ely JW. 1989. Recent advances in hydraulic fracturing, chap. 7. Fracturing
Fluids and Additives. Society of Petroleum Engineers, pp. 131--46 Please check
this reference
104. Montgomery C. 2013a. In Proceedings of the International Conference for
Effective and Sustainable Hydraulic Fracturing Please check this reference
105. Bird RB, Armstrong RC, Hassager O. 1987. Dynamics of polymeric liquids, vol.
1: Fluid mechanics. Wiley Interscience City missing
106. Larson RG. 1998. The structure and rheology of complex fluids. Oxford
University Press City missing
107. Joseph DD. 1990. Fluid dynamics of viscoelastic liquids. Springer City missing
108. Ho BP, Leal LG. 1976. Migration of rigid spheres in a two-dimensional
unidirectional shear flow of a second-order fluid. J. Fluid Mech. 76:783--99
109. Leshansky AM, Bransky A, Korin N, Dinnar U. 2007. Tunable nonlinear
viscoelastic ``focusing” in a microfluid device. Phys. Rev. Lett. 98:234501
110. Larson RG, Shaqfeh ESG, Muller SJ. 1990. A purely elastic instability in taylor-
couette flow. J. Fluid Mech. 218:573--600
111. McKinley GH, Pakdel P, Oztekin A. 1996. Geometric and rheological scaling of
purely elastic flow instabilities. J. Non-Newt. Fluid Mech. 67:19--48
112. Larson RG. 1988. Constitutive equations for polymer melts and solutions.
Butterworths City missing
113. Barnes HA. 1989. Shear-thickening (“dilatancy”) in suspensions of
nonaggregating solid particles dispersed in newtonian liquids. J. Rheol. 33:329--
66
114. Anna SL, McKinley GH, Nguyen DA, Sridhar T, Muller SJ, et al. 2001. An
interlaboratory comparison of measurements from filament-stretching rheometers
using common test fluids. J. Rheol. 45:83--114
115. McKinley GH, Sridhar T. 2002. Filament-stretching rheometry of complex
fluids. Annu. Rev. Fluid Mech. 34:375--415
116. Rodd LE, Scott TP, Cooper-White JJ, McKinley GH. 2005. Capillary breakup
rheometry of low-viscosity elastic fluids. Appl. Rheol. 15:12--27
117. Macosko CW. 1994. Rheology: principles, measurements, and applications.
Wiley-VCH City missing

118. Shah SN, Lord DL, Tan HC. 1992. In International Meeting on Petroleum
Engineering, 24--27 March, Beijing, China Please check this reference
119. Manneville S. 2008. Recent experimental probes of shear banding. Rheol. Acta
47:301--18
120. Yoshimura A, Prud’homme RK. 1988. Wall slip corrections for couette and
parallel disk viscometers. J. Rheol. 32:53--67
121. Larson RG. 1992. Instabilities in viscoelastic flows. Rheol. Acta 31:213--63
122. Eberle APR, Baird DG, Wapperom P. 2008. Rheology of non-newtonian fluids
containing glass fibers: A review of experimental literature. Ind. Eng. Chem. Res.
47:3470--88
123. Prud’homme RK, Ellis S, Constien VG, Knoll S. 1988. In SPE Annual Technical
Conference and Exhibition, 2--5 October, Houston, Texas Please check this
reference
124. Warpinski NR. 2009. In SPE Hydraulic Fracturing Technology Conference, 19--
21 January, The Woodlands, Texas Please check this reference
125. To K, Lai PK, Pak HK. 2001. Jamming of granular flow in a two-dimensional
hopper. Phys. Rev. Lett. 86:71
126. Wyss HM, Blair DL, Morris JF, Stone HA, Weitz DA. 2006. Mechanism for
clogging of microchannels. Phys. Rev. E: Stat. Nonlinear Soft Matter Phys.
74:061402
127. Roussel N, Nguyen TLH, Coussot P. 2007. General probabilistic approach to the
filtration process. Phys. Rev. Lett. 98:114502
128. Padhy S, Shaqfeh ESG, Iaccarino G, Morris JF, Tonmukayakul N. 2013a.
Simulations of a sphere sedimenting in a viscoelastic fluid with cross shear flow.
J. Non-Newtonian Fluid Mech. 197:48--60
129. Tonmukayakul N, Bryant JE, Talbot MS, Morris JF. 2008. In The XVth
International Congress on Rheology, The Society of Rheology 80th Annual
Meeting Please check this reference
130. Won D, Kim C. 2004. Alignment and aggregation of spherical particles in
viscoelastic fluid under shear flow. J. Non-Newtonian Fluid Mech. 117:141--46
131. Mora S, Talini L, Allain C. 2005. Structuring sedimentation in a shear-thinning
fluid. Phys. Rev. Lettt. 95:088301
132. Bivins CH, Boney C, Fredd C, Lassek J, Sullivan P, et al. 2005. New fibers for
hydraulic fracturing. Oilfield Rev. Summer:34--43

133. Walker RNJ, Hunter JL, Brake AC, Fagin PA, Steinsberger N. 1998. In SPE
Annual Technical Conference and Exhibition, 27--30 September, New Orleans,
Louisiana Please check this reference
134. Montgomery CT, Smith MB. 2010. Hydraulic fracturing: History of an enduring
technology. J. Pet. Technol. December:26--32
135. Stickel JJ, Powell RL. 2005. Fluid mechanics and rheology of dense suspensions.
Annu. Rev. Fluid Mech. 37:129--49
136. Farris RJ. 1968. Prediction of the viscosity of multimodal suspensions from
unimodal viscosity data. Trans. Soc. Rheol. 12:281--301
137. Chang C, Powell RL. 1994. Effect of particle size distribution on the rheology of
concentrated biomodal suspensions. J. Rheol. 38:85--98
138. Jeffery GB. 1922. The motion of ellipsoidal particles immersed in a viscous
fluid. Proc. R. Soc. Lond. Ser. A, Containing Papers Math. Phys. Character
102:161--79
139. Petrie CJS. 1999. The rheology of fibre suspensions. J. Non-Newtonian Fluid
Mech. 87:369--402
140. Djalili-Moghaddam M, Toll S. 2006. Fibre suspension rheology: effect of
concentration, aspect ratio and fiber size. Rheol. Acta 45:315--20
141. Chaouche M, Koch DL. 2001. Rheology of non-brownian rigid fiber suspensions
with adhesive contacts. J. Rheol. 45:369--82
142. Garboczi EJ, Snyder KA, Douglas JF, Thorpe MF. 1995. Geometrical
percolation threshold of overlapping ellipsoids. Phys. Rev. E: Stat. Nonlinear Soft
Matter Phys. 52:819--28
143. Denn MM, Morris JF. 2014. Rheology of non-brownian suspensions. Annu. Rev.
Chem. Biomol. Eng. 5:203--28
144. Barnes HA. 2003. A review on the rheology of filled viscoelastic systems. Rheol.
Rev. 1--36 Volume missing
145. Ohl N, Gleissle W. 1993. The characterization of the steady-state shear and
normal stress functions of highly concentrated suspensions formulated with
viscoelastic liquids. J. Rheol. 37:381--406
146. Mall-Gleissle SE, Gleissle W, McKinley GH, Buggisch H. 2002. The normal
stress behavior of suspensions with viscoelastic matrix fluids. Rheol. Acta 42:61--
76

147. Segré G, Silberberg A. 1962a. Behaviour of macroscopic rigid spheres in
poiseuille flow part 1. determination of local concentration by statistical analysis
of particle passages through crossed light beams. J. Fluid Mech. 14:115--35
148. Segré G, Silberberg A. 1962b. Behaviour of macroscopic rigid spheres in
poiseuille flow part 2. experimental results and interpretation. J. Fluid Mech.
14:136--57
149. Ho BP, Leal LG. 1974. Inertial migration of rigid spheres in two-dimensional
unidirectional flows. J. Fluid Mech. 65:365--400
150. Schonberg JA, Hinch EJ. 1989. Inertial migration of a sphere in poiseuille flow.
J. Fluid Mech. 203:517--24
151. Matas JP, Morris JF, Guazzelli E. 2004. Inertial migration of rigid spherical
particles in poiseuille flow. J. Fluid Mech. 515:171--95
152. Asmolov ES. 1999. The inertial lift on a spherical particle in a plan poiseuille
flow at large channel reynolds number. J. Fluid Mech. 381:63--87
153. Han M, Kim C, Kim M, Lee S. 1999. Particle migration in tube flow of
suspensions. J. Rheol. 43:1157--74
154. Oh S, Song Yq, Garagash DI, Lecampion B, Desroches J. 2015. Pressure-driven
suspension flow near jamming. Phys. Rev. Lett. 114:088301
155. Tehrani MA. 1996. An experimental study of particle migration in pipe flow of
viscoelastic fluids. J. Rheol. 40:1057--77
156. Feng J, Joseph DD. 1996. The motion of solid particles suspended in viscoelastic
liquids under torsional shear. J. Fluid Mech. 324:199--222
157. Lim EJ, Ober TJ, Edd JF, Desai SP, Neal D, et al. 2014. Inertio-elastic focusing
of bioparticles in microchannels at ultra-high throughput. Nat. Commun. 5:1460
158. Iso Y, Koch DL, Cohen C. 1996. Orientation in simple shear flow of semi-dilute
fiber suspensions 1. weakly elastic fluids. J. Non-Newtonian Fluid Mech. 62:115--
34
159. Iso Y, Cohen C, Koch DL. 1996. Orientation in simple shear flow of semi-dilute
fiber suspensions 1. highly elastic fluids. J. Non-Newtonian Fluid Mech. 62:135--
53
160. Snijkers F, Pasquino R, Vermant J. 2013. Hydrodynamic interactions between
two equally sized sphers in viscoelastic fluids in shear flow. Langmuir 29:5701--
13
161. Joseph DD, Feng J. 1996. A note on the forces that move particles in a second-
order fluid. J. Non-Newtonian Fluids Mech. 64:299--302
162. Gadala-Maria F, Acrivos A. 1980. Shear-induced structure in a concentrated
suspension of solid spheres. J. Rheol. 24:799--814
163. Leighton D, Acrivos A. 1987. The shear-induced migration of particles in
concentrated suspensions. J. Fluid Mech. 181:415--39
164. Phillips RJ, Armstrong RC, Brown RA, Graham AL, Abbott JR. 1992. A
constitutive equation for concentrated suspensions that accounts for shear--
induced particle migration. Phys. Fluids A 4:30--40
165. Mills P, Snabre P. 1995. Rheology and structure of concentrated suspensions of
hard spheres. shear induced particle migration. J. Phys. II France 5:1597--608
166. Lecampion B, Garagash D. 2014. Confined flow of suspensions modelled by a
frictional rheology. J. Fluid Mech. 759:197--235
167. Dontsov EV, Peirce AP. 2014a. Slurry flow, gravitational settling and a proppant
transport model for hydraulic fractures. J. Fluid Mech. 760:567--90
168. Boyer B, Guazelli E, Pouliquen O. 2011. Unifying suspension and granular
rheology. Phys. Rev. Lett. 107:188301
169. Chekhonin E, Levonyan K. 2012. Hydraulic fracture propagation in highly
permeable formations, with applications to tip screenout. Int. J. Rock Mech. Min.
Sci. 50:19--28
170. Dontsov EV, Peirce AP. 2014b. In 48th US Rock Mechanics/Geomechanics
Symposium, 1--4 June, Minneapolis, Minnesota Please check this reference
171. Dontsov EV, Peirce AP. 2015. Proppant transport in hydraulic fracturing: Crack
tip screen-out in kgd and p3d models. Int. J. Solids Struct. 63:206--18
172. Daneshy A. 1989. Recent advances in hydraulic fracturing, chap. 10. Proppant
Transport. Society of Petroleum Engineers, pp. 210--22 Please check this
reference
173. Kern LR, Perkins TK, Wyant RE. 1959. The mechanics of sand movement in
fracturing. J. Pet. Technol. 11:55--57
174. McLennan JD, Green SJ, Bai M. 2008. In 42nd U.S. Rock Mechanics Symposium
and 2nd U.S.-Canada Rock Mechanics Symposium Please check this reference
175. Miller KC, McCave IN, Komar PD. 1977. Threshold of sediment motion under
unidirectional currents. Sedimentology 24:507--27

176. Patankar NA, Joseph DD, Wang J, Barree RD, Conway M, Asadi M. 2002.
Power law correlations for sediment transport in pressure driven channel flows.
Int. J. Multiphase Flow 28:1269--92
177. Wang J, Joseph DD, Patankar NA, Conway M, Barree RD. 2003. Bi-power law
correlations for sediment transport in pressure driven channel flows. Int. J.
Multiphase Flow 29:475--94
178. Richardson JF, Zaki WN. 1954a. The sedimentation of a suspension of uniform
spheres under conditions of viscous flow. Chem. Eng. Sci. 8:65--73
179. Richardson JF, Zaki WN. 1954b. Sedimentation and fluidisation: Part i. Trans.
Inst. Chem. Eng. 32:S82--S100
180. Chang C, Powell RL. 2002. Hydrodynamic transport properties of concentrated
suspensions. Am. Inst. Chem. Eng. J. 48:2475--80
181. Roodhart LP. 1985. In SPE/DOE 1985 Low Permeability Gas Reservoirs
Symposium, 19--22 March, Denver, Colorado Please check this reference
182. Acharya AR. 1988. Viscoelasticity of crosslinked fracturing fluids and proppant
transport. SPE Prod. Eng. November:483--88
183. Novotny EJ. 1977. In SPE Annual Fall Technical Conference and Exhibition, 9--
12 October, Denver, Colorado Please check this reference
184. McMechan DE, Shah SN. 1991. Static proppant-settling characteristics of non-
newtonian fracturing fluids in a large-scale test model. SPE Prod. Eng.
August:305--12
185. van den Brule BHAA, Gheissary G. 1993. Effects of fluid elasticity on the static
and dynamic settling of a spherical particle. J. Non-Newtonian Fluid Mech.
49:123--32
186. Gheissary G, van den Brule BHAA. 1996. Unexpected phenomena observed in
particle settling in non-newtonian media. J. Non-Newtonian Fluid Mech. 67:1--18
187. Hu YT, Chung H, Maxey J. 2015. In SPE Hydraulic Fracturing Technology
Conference, 3--5 February, The Woodlands, Texas, USA Please check this
reference
188. Hu YT, Larsen T, Martysevich V. 2015. In SPE Production and Operations
Symposium, 1--5 March, Oklahoma City, Oklahoma, USA Please check this
reference
189. Hu YT, Kishore T, Maxey J, Loveless D. 2015. In SPE International Symposium
on Oilfield Chemistry, 13--15 April, The Woodlands, Texas, USA Please check
this reference
190. Kesavan S, Prud’homme RK. 1992. Rheology of guar and (hydroxypropyl) guar
crosslinked by borate. Macromolecules 25:2026--32
191. Pezron E, Ricard A, Lafuma F, Audebert R. 1988. Reversible gel formation
induced by ion complexation. 1. borax--galactomannan interactions.
Macromolecules 21:1121--25
192. Gulbis J, Hodge RM. 1999. Reservoir stimulation, chap. Fracturing Fluid
Chemistry and Proppants. John Wiley & Sons, 7--1--7--23 City missing
193. Kramer J, Prud’homme RK, Wiltzius P, Knoll S. 1988. Comparison of
galactomannan crosslinking with orgnotitanates and borates. Colloid Polymer Sci.
266:145--55
194. Housiadas KD, Tanner RI. 2012. The drag of a freely sedimenting sphere in a
sheared weakly viscoelastic fluid. J. Non-Newtonian Fluid Mech. 138--184:52--56
195. Tanner RI, Housiadas KD, Qi F. 2014. Mechanism of drag increase on spheres in
viscoelastic cross-shear flow. J. Non-Newtonian Fluid Mech. 203:51--53
196. Padhy S, Rodriguez M, Shaqfeh ESG, Iaccarino G, Morris JF, Tonmukayakul N.
2013b. The effect of shear thinning and walls on the sedimentation of a sphere in
an elastic fluid under orthogonal shear. J. Non-Newtonian Fluid Mech. 201:120--
29
197. Barati R, Liang JT. 2014. A review of fracturing fluid systems used for hydraulic
fracaturing of oil and gas wells. J. Appl. Polymer Sci. 131:40735
198. Montgomery C. 2013b. In Proceedings of the International Conference for
Effective and Sustainable Hydraulic Fracturing Please check this reference
199. White CM, Mungal MG. 2008. Mechanics and prediction of turbulent drag
reduction with polymer additives. Annu. Rev. Fluid Mech. 40:235--56
200. Clark AH, Ross-Murphy SB. 1987. In Biopolymers. Springer, pp. 57--192
Please check this reference
201. Mathur NK. 2012. Industrial galactomannan polysaccharides. CRC Press City
missing
202. Wientjes RHW, Duits MHG, Jongschaap RJJ, Mellema J. 2000. Linear rheology
of guar gum solutions. Macromolecules 33:9594--605
203. Bishop M, Shahid N, Yang J, Barron AR. 2004. Determination of the modle and
efficacy of the cross-linking of guar by borate using mas 11b nmr of borate cross-
linked guar in combination with solution 11b nmr of model systems. Dalton Trans.
2621--34 Volume missing
204. Hu YT. 2014. Mechanism of shear thickening in transient guar network. J.
Rheol. 58:1789--807
205. Tayal A, Pai VB, Khan SA. 1999. Rheology and microstructural changes during
enzymatic degradation of a guar--borax hydrogel. Macromolecules 32:5567--74
206. Dreiss CA. 2007. Wormlike micelles: where do we stand? recent developments,
linear rheology and scattering techniques. Soft Matter 3:956--70
207. Khan SA, Schnepper CA, Armstrong RC. 1988. Foam rheology: Iii.
measurement of shear flow properties. J. Rheol. 32:69--92

Table 1 Reservoir properties for shales, sandstones, and mudstones
Quantity [units] Range 〈representative value〉 Poisson’s ratio, ν [−] (18, 61, 62) 0.1--0.5 〈0.25〉 Young’s modulus, E [GPa] (18, 61) 5--95 〈30〉 Toughness, KIC [MPa- m ] (61, 63)
0.17--1.73 〈1.0〉
Permeability, k [D]†) (14, 18) Shale gas 91 10−×: Tight gas 30.1 10−< × Conventional 3500 10−< × Porosity [%] (14) 6-- >25‡)
Formation depth, vl [m] (14) 1200M)--4100EF)
Formation thickness, h [m] (14) 6F)--180B)
†) 13 21D 9.86 10 m−= × ; ‡)Source rock and tight gas formations are at the low end of this range, conventional formations at upper; Depth and thickness range extremes from: B)Barnett Shale, F)Fayetteville Shale, EF)Eagle Ford Shale, M)Marcellus Shale.

Table 2 PK, PKN, KGD, and radial model predictions for an impermeable formation (
0Lq = ), following (69, 72)
Model ( )tl , R(t) w(0,t) Δp PKa), PKNb) ( )3
2 4
1/54/5
1 2(1 )EQ
hC t
ν η− ( )2 2 1/5
2(1 ) 1/52
QEhC tν η− ( )3
2 3
1/ 41
3 8(1 )E Q
hC ην−l
KGDc) ( )3
2 3
1/ 62/3
1 2(1 )EQ
hC t
ν η− ( )2 3
3
1/62(1 ) 1/3
2Q
EhC tν η− ( )3 3
2 3 2
1/ 41
3 2 8(1 )E Q h
hC ην− l
Radiald) ( )1/ 2 1/ 22 (0, )1.94 Qw t tπ
( )2 1/ 42(1 ) ( )2.15 QR t
Eν η− ( )3
2 3 3
1/ 4( )2.03
8(1 ) ( )ln
w
E Q R trR t
ηπ ν−
Coefficients for single and bi-wing fractures, (single wing, bi-wing) a)1 (0.60,0.395)C = ,
2 (2.64,2.00)C = , 3 (3.00,2.52)C = ; b)1 (0.68,0.45)C = ,
2 (2.50,1.89)C = , 3 (2.75,2.31)C =; c)
1 (0.68,0.48)C = , 2 (1.87,1.32)C = , 3 (2.27,1.19)C = . d)Results are semianalytical (69).

Table 3 Length scales for viscosity and toughness in KGD and radial models under
constant injection rate Q, from (84)
Lm Lk K KGD ( )1/6 2/3E Q tη
′′
( )2/3 2/3E QK t′′
3 1/ 4( )K
E Qη′′′
Radial ( )3 1/94/9E Q tη
′′ E Q
K
2/5t2/5
5 3 13 1/181/9
( )K
Q Et
η′
′ ′
Here, 12η η′ = , 2/(1 )E E ν′ = − ,
124(2 / ) ICK Kπ′ = . KIC is the fracture toughness.

Table 4 Operational scales in hydraulic fracturing
Quantity [units] Range Remarks Fracture height [m], h 10--100 Set by the rock formation and local stresses Fracture width [mm], w 2--185 2--10 is typical Fracture length [m], l 100--1000 Can form complex network Fluid viscosity [mPa-s], η 1--1000 Impacts fracture width, length, network
complexity Proppant diam. [µm], a 100--850 Highly variable and polydisperse Proppant conc. [-], φ 0--20 Variable during injection, correlated with η Fluid Injection rate [m3 s−1], Q 0.05--0.27 20--100 bbl/min Shear rate [s−1], γ& 0--1000 The magnitude of γ& is important for controlling
settling, and the local fluid rheology 2
w /fRe wρ γ η= & 0--5000 Flow can be turbulent in wellbore, where 10,000rRe :
Wi λγ= & 0--1000 Difficult to quantify at downhole temperature; λ undetermined
p wawRe Re= ≤100 From upper limit on Rew
3a 6 /( )BPe a k Tπηγ= & >103 Proppant is noncolloidal and viscous stresses
dominate

Table 5 Expressions for viscosity as a function of shear rate and particle volume fraction
in generalized Newtonian fluids
Model Expression Remarks Newtonian ( )η γ µ→& Constant viscosity Power-law 1( ) nkη γ γ −=& & Easiest to implement
Carreau ( )η γ η∞→∞ =& ,
0( 0)η γ η→ =&
12
0
( ) 2(1 ( ) )nη γ η
η η λγ−
∞
∞
−− = +& & Captures low/high shear plateau
and power law thinning at intermediate rates
Bingham (n, k = µ), Hershel-Bulkley ( 1,n k≠ consistency)
0
0
1 y
y
nyk
ητηη γ
τ τ
γ τ τ−
∞ ≤⎧⎪= ⎨ + >⎪⎩ &&
Thinning above τy; Finite yield stress and shear thinning
Krieger-Dougherty ( ) max
max
[ ]( ) 1s
η φφφη φ η
−= − sη is solvent phase viscosity (
0φ → )