Embed Size (px)
DESCRIPTION
Annual Report of trading activity on the board of the Barbados Stock Exchange Inc. (BSE).
Citation preview
2012 Year End Report
The following report reviews the overall performance of the companies listed on the Barbados Stock Exchange for the
period January 1st, 2012 to December 31st, 2012 inclusive. Additionally, in an effort to provide greater detail on the
market performance, fourth quarter information has been included. General discussion was also given to the overall
economic situation of the country and its impact on the general performance of the market. The report has been
structured as follows:
Overall Performance
Economic Factors
Trading activity by Market
Indices and Market Capitalization
Advancers/Decliners for 2012
Historical Company Trading statistics
Market Events
The Regulatory Roundup
Concluding Remarks
Overall Performance
General performance on the Board of the Barbados Stock Exchange Inc. (BSE) was stable for the year 2012 in line with
the general economic conditions which are prevailing in the wider local economy. Trading for the year started slow but
picked up with increased activity in the Put Through and Block Trade Markets during the last quarter of the year; there
were also improvements in the level of Bond Market activity during 2012. There were two transactions pursuant to
takeovers; the first was the completion of trades regarding the offer made by AMCL Holdings Limited in 2011 to
purchase all issued and outstanding shares of ANSA MCAL Barbados Limited (MCAL). The second transaction was that of
Republic Bank Limited's offer to purchase all issued and outstanding shares of Republic Bank Barbados Limited (RBBL).
The latter transaction is what lead to the activity on the Block Trade market; a total of three transactions took place on
this market.
A comparison of total trading volume and value 2012/2011, inclusive of extraordinary transactions for 2012 mentioned
above as well as those occurring in 2011 - EMERA (Barbados) Holdings No. 2 Incorporated's takeover of Light and Power
Holdings Limited and AMCL Holdings Limited's takeover of ANSA McAL (Barbados) Limited, shows an increase in total
trading volume of 129% but a decrease in total trading value of 20% as illustrated in Table 1 below. However, excluding
the extraordinary transactions for both years, total trading volume would have decreased by 10% and total trading value

P a g e | 2
would have declined by 6%.
The Junior Market of the BSE welcomed two new listings on September 20th, 2012 when Royal Fidelity (Barbados)
Investment Fund Limited listed two of its sub funds - Royal Fidelity TIGRS A2 Fund and Royal Fidelity TIGRSA3 Fund.
Table 1: Trading Activity Comparison by Market
Market December December December December % Change
% Change
2012 Volume 2011 Volume 2012 Value 2011 Value Volume Value
Regular 7,974,092 16,162,861 $ 36,529,235 $ 238,242,191 -51% -85%
Odd-Lot 142,892 170,741 $ 602,889 $ 852,648 -16% -29%
Put - Through 531,269 890,195 $ 2,026,359 $ 3,465,480 -40% -42%
Junior 2,000 5,000 $ 20,925 $ 53,750 -60% -61%
Block Trade 30,817,908 - $ 154,089,540 $ - NA NA
Total 39,468,161 17,228,797 $ 193,268,948 $ 242,614,069 129% -20%
Market indices have shown moderate improvement in 2012 when compared to the closing figures for 2011. At year-end,
the Local Index was the only measure to record a decrease of 5.66%. The Cross-listed and Composite indices, however,
had risen by 12.88% and 1.10% respectively, above the 2011 year-end figures. These increases were due primarily to the
increase in traded price of three (3) of the four (4) Cross-Listed securities on the board of the BSE. Jamaica Money
Market Brokers Limited's price increased 50%, Neal and Massy Holdings Limited's price rose by 3.31% and One
Caribbean Media Limited's price increased by 61.02%. Market Capitalization performed similarly with the local market
cap experiencing an decrease of 1.86% and the cross-listed increasing by 13.83%.
Table 2 below illustrates the Trading Statistics Comparison 2011 - 2012. Quarters I and IV were the most active; activity was attributed to the two takeover transactions previously mentioned.
Table 2: Trading Statistics Comparison 2011 - 2012
Number of
Shares Number of
Shares Market Value Market Value Number of
Transactions Number of
Transactions
Quarter 2012 2011 2012 2011 2012 2011
I 2,464,186 11,244,088 $ 14,619,815.38 $ 220,108,986.48 452 446
II 1,380,819 1,340,272 $ 4,517,815.31 $ 6,936,617.89 418 368
III 1,908,100 3,192,963 $ 8,276,299.69 $ 8,712,824.43 302 466
IV 33,715,056 1,451,474 $ 165,855,017.49 $ 6,855,640.37 328 294
Total 39,468,161 17,228,797 $ 193,268,947.87 $ 242,614,069.17 1,500 1,574
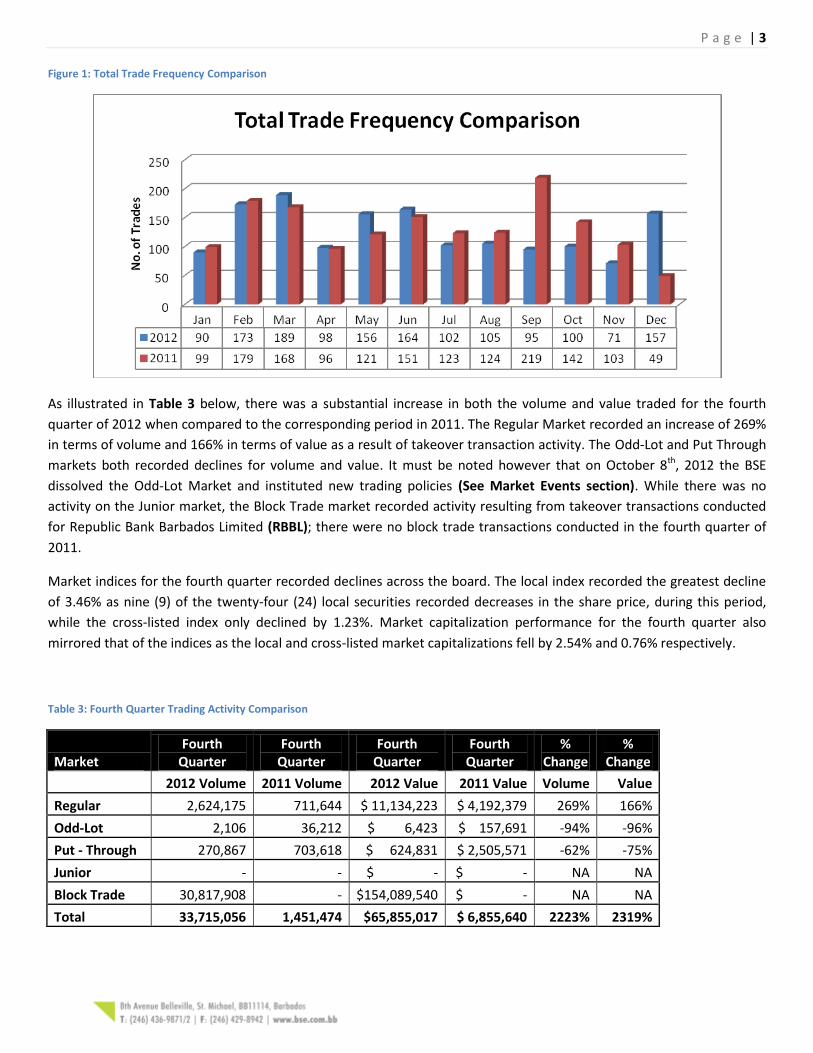
There was a 4.7% decrease in the number of trades occurring in 2012 as compared to 2011. There were 1,500 trades in
2012 as compared to 1,574 for 2011. Figure 1: Total Trade Frequency Comparison, illustrates graphically how the trade
frequency has varied between 2012 and 2011.
P a g e | 3
Figure 1: Total Trade Frequency Comparison
As illustrated in Table 3 below, there was a substantial increase in both the volume and value traded for the fourth
quarter of 2012 when compared to the corresponding period in 2011. The Regular Market recorded an increase of 269%
in terms of volume and 166% in terms of value as a result of takeover transaction activity. The Odd-Lot and Put Through
markets both recorded declines for volume and value. It must be noted however that on October 8th, 2012 the BSE
dissolved the Odd-Lot Market and instituted new trading policies (See Market Events section). While there was no
activity on the Junior market, the Block Trade market recorded activity resulting from takeover transactions conducted
for Republic Bank Barbados Limited (RBBL); there were no block trade transactions conducted in the fourth quarter of
2011.
Market indices for the fourth quarter recorded declines across the board. The local index recorded the greatest decline
of 3.46% as nine (9) of the twenty-four (24) local securities recorded decreases in the share price, during this period,
while the cross-listed index only declined by 1.23%. Market capitalization performance for the fourth quarter also
mirrored that of the indices as the local and cross-listed market capitalizations fell by 2.54% and 0.76% respectively.
Table 3: Fourth Quarter Trading Activity Comparison
Market Fourth
Quarter Fourth
Quarter Fourth
Quarter Fourth
Quarter %
Change %
Change
2012 Volume 2011 Volume 2012 Value 2011 Value Volume Value
Regular 2,624,175 711,644 $ 11,134,223 $ 4,192,379 269% 166%
Odd-Lot 2,106 36,212 $ 6,423 $ 157,691 -94% -96%
Put - Through 270,867 703,618 $ 624,831 $ 2,505,571 -62% -75%
Junior - - $ - $ - NA NA
Block Trade 30,817,908 - $154,089,540 $ - NA NA
Total 33,715,056 1,451,474 $65,855,017 $ 6,855,640 2223% 2319%
P a g e | 4
Economic Factors
This segment of the report was compiled from the Review of Barbados' Economic Performance for 2012 and Prospects for 2013 by the Central Bank of Barbados (CBB). The review states that the economy of Barbados experienced ‘flat growth'. "The flat growth performance resulted from declines in tourism, other traded services and manufacturing. Output in the non-traded sectors grew by only 1 percent because of fiscal spending limits and the reduction in the traded sectors. Several tourism related projects were ongoing, but foreign investment in real estate projects was down about 16 percent." Contributions from the Tourism Sector declined as value added contracted by approximately 3.5%. Arrivals from the US and UK declined by 8.8% and 9.0% respectively. Major contributing factors to these declines were the closure of Almond Resorts Incorporated's property in St. Peter - which accounts for about one-fifth of those visitors preferring an all-inclusive vacation, the UK's increase in the Air Passenger Duty of over 8% which deterred many persons from travelling abroad and reductions in the number of flights out of the US and UK by two major carriers. Arrivals from Trinidad and Tobago increased by 50% for the period January to April 2012 but slowed significantly, recording a total increase of 1.5% for the entire year. Arrivals from across the region contracted by 8.1%. These reductions were attributed to "the cessation of flights by Redjet” earlier in 2012. With many cruise lines refocusing their energies on new destinations, such as the Mediterranean, the number of cruise ship calls was reduced. This resulted in a 15% decline in the number of cruise ship arrivals for the year. Performance in the non-trading sectors also experienced declines. Construction declined by 3%, "a reflection of declines in the import of building materials and employment in the sector of 6% and 7.7% respectively." Despite a 1% increase in the level of Food Processing and a 4.4% increase in Sugar Production, output in the Manufacturing and Agriculture sectors both contracted by 5% and 2% respectively.
"The fiscal deficit for the April-December period is estimated at 6.4% of GDP, compared with 5.2% in the same period of 2011. Revenue from personal taxes was down 10% and VAT receipts fell 2%, but there was a 9% increase in property taxes. Subsidies to government entities rose by 2%, and interest payments were higher by 4%. Capital expenditure fell by 4%." The Central Bank of Barbados (CBB), having reviewed the International Monetary Fund's (IMF) World Economic Outlook
October 2012, expects a growth rate of 0.7% or less, based on their forecasted average growth rate of Barbados' major
trading partners - the US, UK and Canada - of 1.7% as well as improvements in the levels of capital expenditure. There is
also the anticipation of private capital inflows of $600 million from activity in the Tourism and Construction sectors.
Domestic inflation is expected to fall to approximately 5% and no gain in employment is expected.

P a g e | 5
Trading Activity by Market
Regular
The performance of the Regular Market for 2012 has shown decreases when compared to its performance in 2011.
Decreases of 50.66% and 84.67% were registered in both trading volume and value respectively. The decreases can be
attributed to the reduction in the volume of trades for extraordinary transactions. In 2011, EMERA (Barbados) Holdings
No. 2 Incorporated purchased 7,189,812 shares of Light and Power Holdings Limited at $25.70 while AMCL Holdings
Limited purchased 2,788,400 shares of ANSA McAL (Barbados) Limited at $11.75 bringing the total volume and value of
takeover transactions to 9,980,212 and $217,593,268.40 respectively. In 2012, however, Republic Bank Limited
purchased 1,347,489 shares of Republic Bank Barbados Limited at $5.00 per share; the value traded was $6,737,445.00.
Excluding these transactions from the Regular Market activity for the periods under examination, the volume traded
would have decreased by 5% while value traded would have increased by 1%.
Table 4: Regular Market Statistical Comparison
December 31
2012 December 31
2011 %
Change Total Share Volume 7,974,092 16,162,861 -50.66%
Total Share Value 36,529,235 238,242,191 -84.67%
Average Daily Share Volume 31,896 64,911 -50.86%
Average Daily Share Value $ 146,117 $ 956,796 -84.73%
Number of Trades 943 895 5.36%
Number of Trade Days 250 249 0.40%
Average Share Price $ 5.23 $ 5.78 -9.56%
Advance/Decline Ratio 7/11 6/12 N/A
Local Index 3,082.38 3,267.18 -5.66%
Cross – Listed Index 1,289.35 1,142.23 12.88%
Composite Market Index 730.04 722.07 1.10%
Local Market Capitalization 8,957,484,391 9,127,101,474 -1.86%
Cross-Listed Market Capitalization 2,159,097,185 1,896,819,202 13.83%
Composite Market Capitalization 11,124,381,576 11,031,870,677 0.84%
Number of Listed Securities 28 26 7.69%
Table 4 provides a statistical comparison of Regular Market activity for the reporting period. Improvements were seen in
the Number of Trades, Advance/Decline ratio, Cross-Listed and Composite Indices and Market Caps and finally the
Number of Listed Securities.
Figure 2 illustrates the breakdown of trades which occurred during 2012. There was a increase in the number of trades
occurring on the Regular Market. There were 943 trades in 2012, representing a 5.36% increase when compared to the
895 trades which occurred in 2011.

P a g e | 6
Figure 2: Trade Frequency Comparison (Regular Market)
Table 5 and Table 6 show the top traded companies for the year in terms of volume and value. Sagicor Financial
Corporation and Republic Bank Barbados Limited were the only two securities to break the 1 million shares traded mark.
Table 5: Top Five Traded Companies by Volume – 2012
2012 2011 2012 2011
Company Volume Volume Value Value
Sagicor Financial Corporation 1,593,145 1,073,982 $ 3,595,268 $ 2,859,780
Republic Bank Barbados Limited 1,371,291 2,800 $ 6,852,925 $ 15,400
FirstCaribbean International Bank 916,329 707,569 $ 2,843,735 $ 2,194,334
Ansa Mcal (Barbados) Limited 761,324 2,788,400 $ 8,945,557 $ 32,763,700
One Caribbean Media Limited 641,064 267,041 $ 2,720,721 $ 828,990
Table 6: Top Five Traded Companies by Value – 2012
2012 2011 2012 2011
Company Value Value Volume Volume
Ansa Mcal (Barbados) Limited $ 8,945,557 $ 32,763,700 761,324 2,788,400
Republic Bank Barbados Limited $ 6,852,925 $ 15,400 1,371,291 2,800
Sagicor Financial Corporation $ 3,595,268 $ 2,859,780 1,593,145 1,073,982
Goddard Enterprises Limited $ 3,175,533 $ 1,827,349 547,795 304,205
FirstCaribbean International Bank $ 2,843,735 $ 2,194,334 916,329 707,569
For the fourth quarter, there was a 269% increase in volume and a 166% increase in value of shares traded. Republic
Bank Barbados Limited was the volume and value leader for the fourth quarter as their takeover transactions accounted
for 52% of the volume traded and 62% of the value traded.

P a g e | 7
Table 7 and Table 8 illustrate the top traded companies for the quarter by volume and value.
Table 7: Top Five Traded Companies by Volume – 4th Quarter
2012 2011 2012 2011
Company Volume Volume Value Value
Republic Bank Barbados Limited 1,371,291 0 $ 6,852,925 $ -
FirstCaribbean International Bank 333,329 117,530 $ 1,030,029 $ 366,126
One Caribbean Media Limited 242,990 8,630 $ 1,154,217 $ 26,209
Sagicor Financial Corporation 208,387 118,953 $ 461,527 $ 338,363
Banks Holdings Limited 206,536 44,575 $ 619,625 $ 146,617
Table 8: Top Five Traded Companies by Value – 4th Quarter
2012 2011 2012 2011
Company Value Value Volume Volume
Republic Bank Barbados Limited $ 6,852,925 $ - 1,371,291 0
One Caribbean Media Limited $ 1,154,217 $ 26,209 242,990 8,630
FirstCaribbean International Bank $ 1,030,029 $ 366,126 333,329 117,530
Banks Holdings Limited $ 619,625 $ 146,617 206,536 44,575
Sagicor Financial Corporation $ 461,527 $ 338,363 208,387 118,953
P a g e | 8
Odd Lot Market
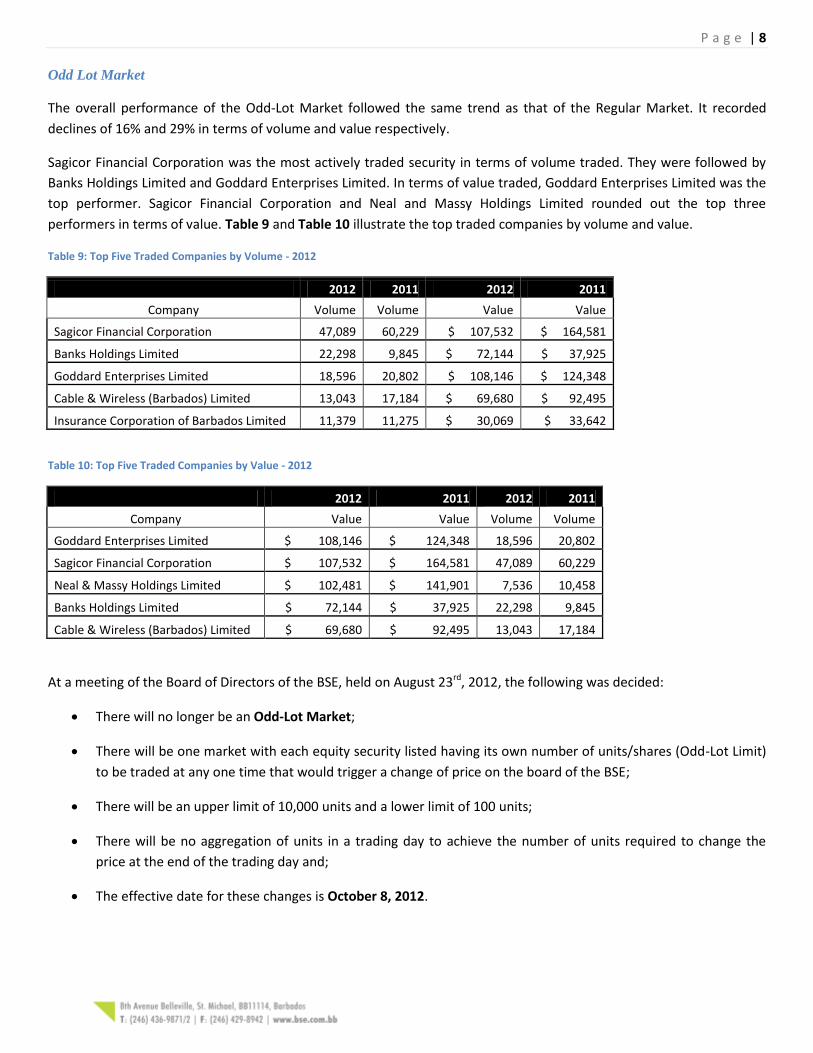
The overall performance of the Odd-Lot Market followed the same trend as that of the Regular Market. It recorded
declines of 16% and 29% in terms of volume and value respectively.
Sagicor Financial Corporation was the most actively traded security in terms of volume traded. They were followed by
Banks Holdings Limited and Goddard Enterprises Limited. In terms of value traded, Goddard Enterprises Limited was the
top performer. Sagicor Financial Corporation and Neal and Massy Holdings Limited rounded out the top three
performers in terms of value. Table 9 and Table 10 illustrate the top traded companies by volume and value.
Table 9: Top Five Traded Companies by Volume - 2012
2012 2011 2012 2011
Company Volume Volume Value Value
Sagicor Financial Corporation 47,089 60,229 $ 107,532 $ 164,581
Banks Holdings Limited 22,298 9,845 $ 72,144 $ 37,925
Goddard Enterprises Limited 18,596 20,802 $ 108,146 $ 124,348
Cable & Wireless (Barbados) Limited 13,043 17,184 $ 69,680 $ 92,495
Insurance Corporation of Barbados Limited 11,379 11,275 $ 30,069 $ 33,642
Table 10: Top Five Traded Companies by Value - 2012
2012 2011 2012 2011
Company Value Value Volume Volume
Goddard Enterprises Limited $ 108,146 $ 124,348 18,596 20,802
Sagicor Financial Corporation $ 107,532 $ 164,581 47,089 60,229
Neal & Massy Holdings Limited $ 102,481 $ 141,901 7,536 10,458
Banks Holdings Limited $ 72,144 $ 37,925 22,298 9,845
Cable & Wireless (Barbados) Limited $ 69,680 $ 92,495 13,043 17,184
At a meeting of the Board of Directors of the BSE, held on August 23rd, 2012, the following was decided:
There will no longer be an Odd-Lot Market;
There will be one market with each equity security listed having its own number of units/shares (Odd-Lot Limit)
to be traded at any one time that would trigger a change of price on the board of the BSE;
There will be an upper limit of 10,000 units and a lower limit of 100 units;
There will be no aggregation of units in a trading day to achieve the number of units required to change the
price at the end of the trading day and;
The effective date for these changes is October 8, 2012.
P a g e | 9
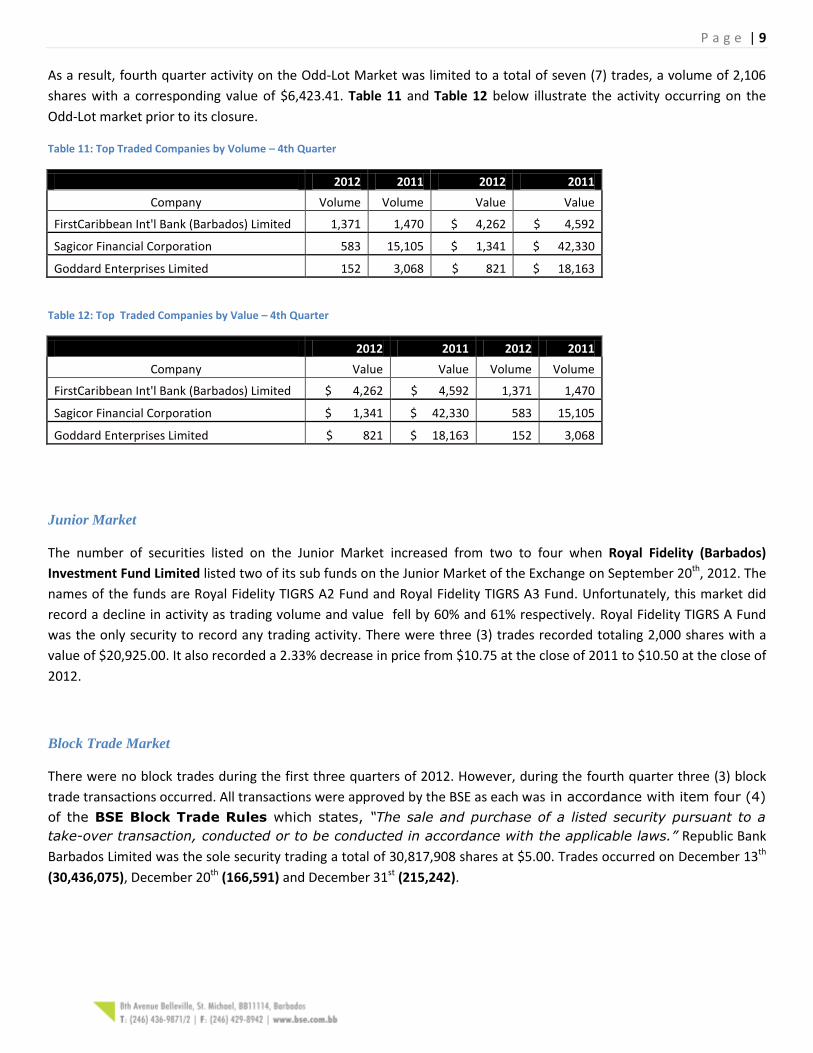
As a result, fourth quarter activity on the Odd-Lot Market was limited to a total of seven (7) trades, a volume of 2,106
shares with a corresponding value of $6,423.41. Table 11 and Table 12 below illustrate the activity occurring on the
Odd-Lot market prior to its closure.
Table 11: Top Traded Companies by Volume – 4th Quarter
2012 2011 2012 2011
Company Volume Volume Value Value
FirstCaribbean Int'l Bank (Barbados) Limited 1,371 1,470 $ 4,262 $ 4,592
Sagicor Financial Corporation 583 15,105 $ 1,341 $ 42,330
Goddard Enterprises Limited 152 3,068 $ 821 $ 18,163
Table 12: Top Traded Companies by Value – 4th Quarter
2012 2011 2012 2011
Company Value Value Volume Volume
FirstCaribbean Int'l Bank (Barbados) Limited $ 4,262 $ 4,592 1,371 1,470
Sagicor Financial Corporation $ 1,341 $ 42,330 583 15,105
Goddard Enterprises Limited $ 821 $ 18,163 152 3,068
Junior Market
The number of securities listed on the Junior Market increased from two to four when Royal Fidelity (Barbados)
Investment Fund Limited listed two of its sub funds on the Junior Market of the Exchange on September 20th, 2012. The
names of the funds are Royal Fidelity TIGRS A2 Fund and Royal Fidelity TIGRS A3 Fund. Unfortunately, this market did
record a decline in activity as trading volume and value fell by 60% and 61% respectively. Royal Fidelity TIGRS A Fund
was the only security to record any trading activity. There were three (3) trades recorded totaling 2,000 shares with a
value of $20,925.00. It also recorded a 2.33% decrease in price from $10.75 at the close of 2011 to $10.50 at the close of
2012.
Block Trade Market
There were no block trades during the first three quarters of 2012. However, during the fourth quarter three (3) block
trade transactions occurred. All transactions were approved by the BSE as each was in accordance with item four (4)
of the BSE Block Trade Rules which states, “The sale and purchase of a listed security pursuant to a
take-over transaction, conducted or to be conducted in accordance with the applicable laws.” Republic Bank
Barbados Limited was the sole security trading a total of 30,817,908 shares at $5.00. Trades occurred on December 13th
(30,436,075), December 20th (166,591) and December 31st (215,242).
P a g e | 10
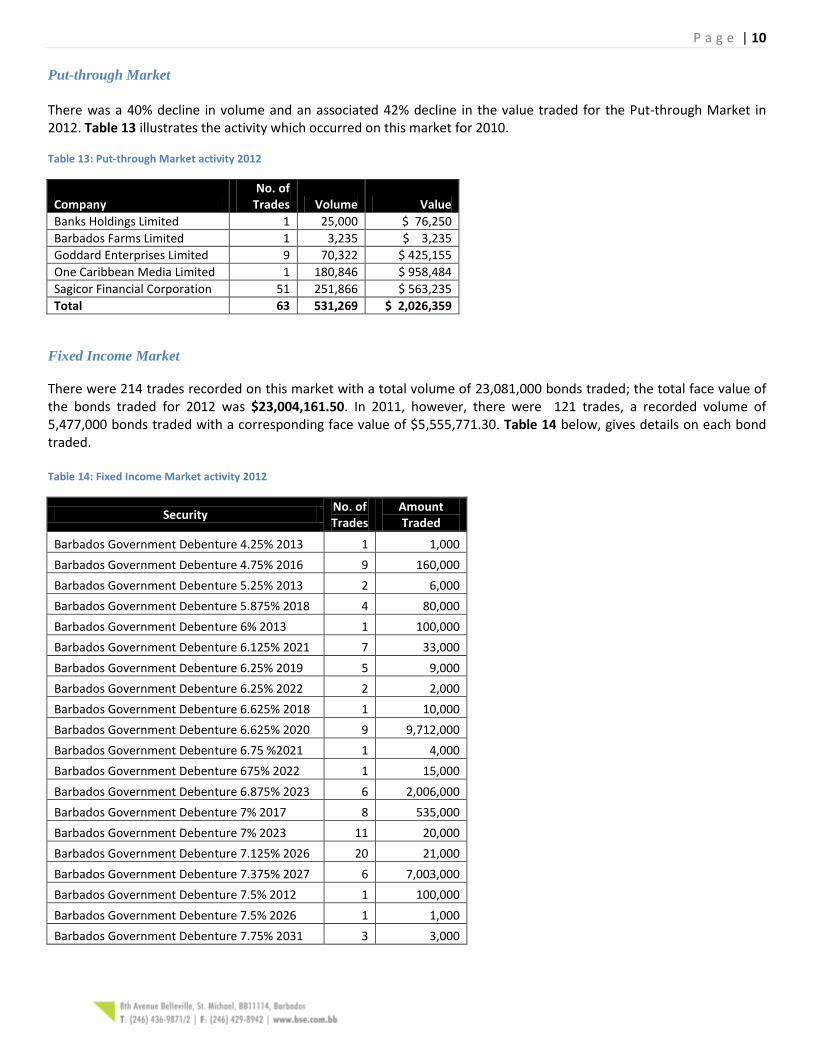
Put-through Market There was a 40% decline in volume and an associated 42% decline in the value traded for the Put-through Market in 2012. Table 13 illustrates the activity which occurred on this market for 2010. Table 13: Put-through Market activity 2012
Company No. of
Trades Volume Value
Banks Holdings Limited 1 25,000 $ 76,250
Barbados Farms Limited 1 3,235 $ 3,235
Goddard Enterprises Limited 9 70,322 $ 425,155
One Caribbean Media Limited 1 180,846 $ 958,484
Sagicor Financial Corporation 51 251,866 $ 563,235
Total 63 531,269 $ 2,026,359
Fixed Income Market
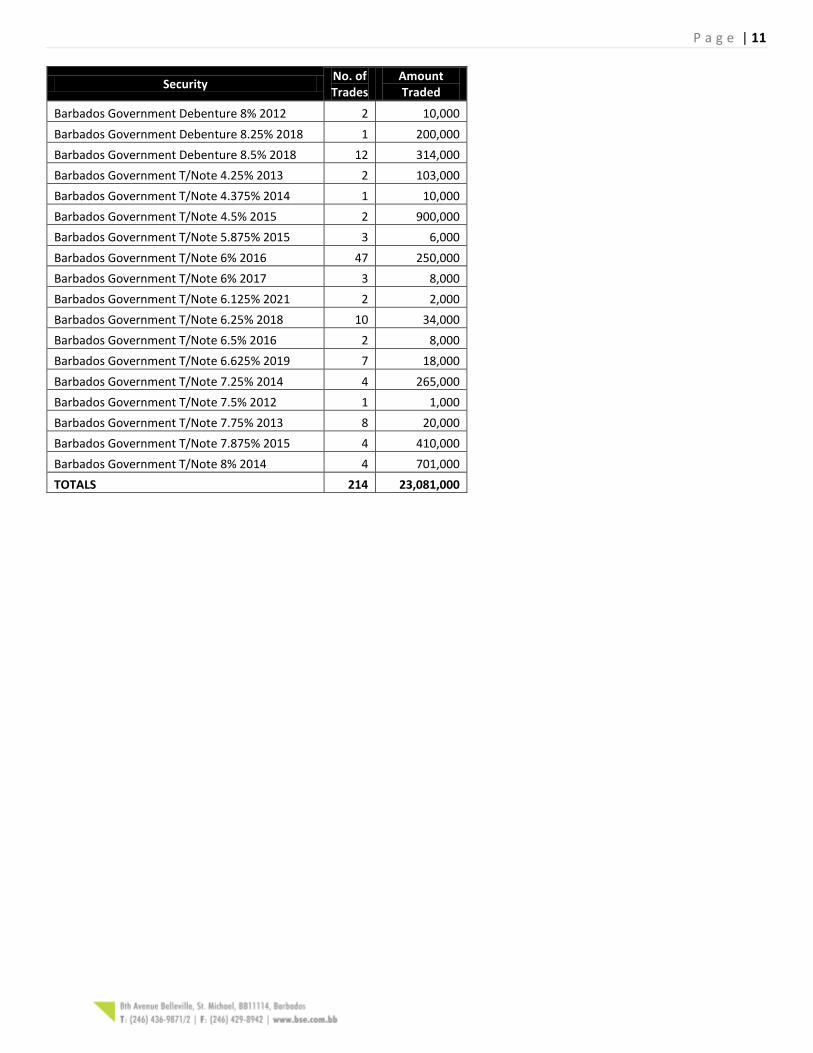
There were 214 trades recorded on this market with a total volume of 23,081,000 bonds traded; the total face value of the bonds traded for 2012 was $23,004,161.50. In 2011, however, there were 121 trades, a recorded volume of 5,477,000 bonds traded with a corresponding face value of $5,555,771.30. Table 14 below, gives details on each bond traded. Table 14: Fixed Income Market activity 2012
Security No. of Trades
Amount Traded
Barbados Government Debenture 4.25% 2013 1 1,000
Barbados Government Debenture 4.75% 2016 9 160,000
Barbados Government Debenture 5.25% 2013 2 6,000
Barbados Government Debenture 5.875% 2018 4 80,000
Barbados Government Debenture 6% 2013 1 100,000
Barbados Government Debenture 6.125% 2021 7 33,000
Barbados Government Debenture 6.25% 2019 5 9,000
Barbados Government Debenture 6.25% 2022 2 2,000
Barbados Government Debenture 6.625% 2018 1 10,000
Barbados Government Debenture 6.625% 2020 9 9,712,000
Barbados Government Debenture 6.75 %2021 1 4,000
Barbados Government Debenture 675% 2022 1 15,000
Barbados Government Debenture 6.875% 2023 6 2,006,000
Barbados Government Debenture 7% 2017 8 535,000
Barbados Government Debenture 7% 2023 11 20,000
Barbados Government Debenture 7.125% 2026 20 21,000
Barbados Government Debenture 7.375% 2027 6 7,003,000
Barbados Government Debenture 7.5% 2012 1 100,000
Barbados Government Debenture 7.5% 2026 1 1,000
Barbados Government Debenture 7.75% 2031 3 3,000
P a g e | 11
Security No. of Trades
Amount Traded
Barbados Government Debenture 8% 2012 2 10,000
Barbados Government Debenture 8.25% 2018 1 200,000
Barbados Government Debenture 8.5% 2018 12 314,000
Barbados Government T/Note 4.25% 2013 2 103,000
Barbados Government T/Note 4.375% 2014 1 10,000
Barbados Government T/Note 4.5% 2015 2 900,000
Barbados Government T/Note 5.875% 2015 3 6,000
Barbados Government T/Note 6% 2016 47 250,000
Barbados Government T/Note 6% 2017 3 8,000
Barbados Government T/Note 6.125% 2021 2 2,000
Barbados Government T/Note 6.25% 2018 10 34,000
Barbados Government T/Note 6.5% 2016 2 8,000
Barbados Government T/Note 6.625% 2019 7 18,000
Barbados Government T/Note 7.25% 2014 4 265,000
Barbados Government T/Note 7.5% 2012 1 1,000
Barbados Government T/Note 7.75% 2013 8 20,000
Barbados Government T/Note 7.875% 2015 4 410,000
Barbados Government T/Note 8% 2014 4 701,000
TOTALS 214 23,081,000
P a g e | 12
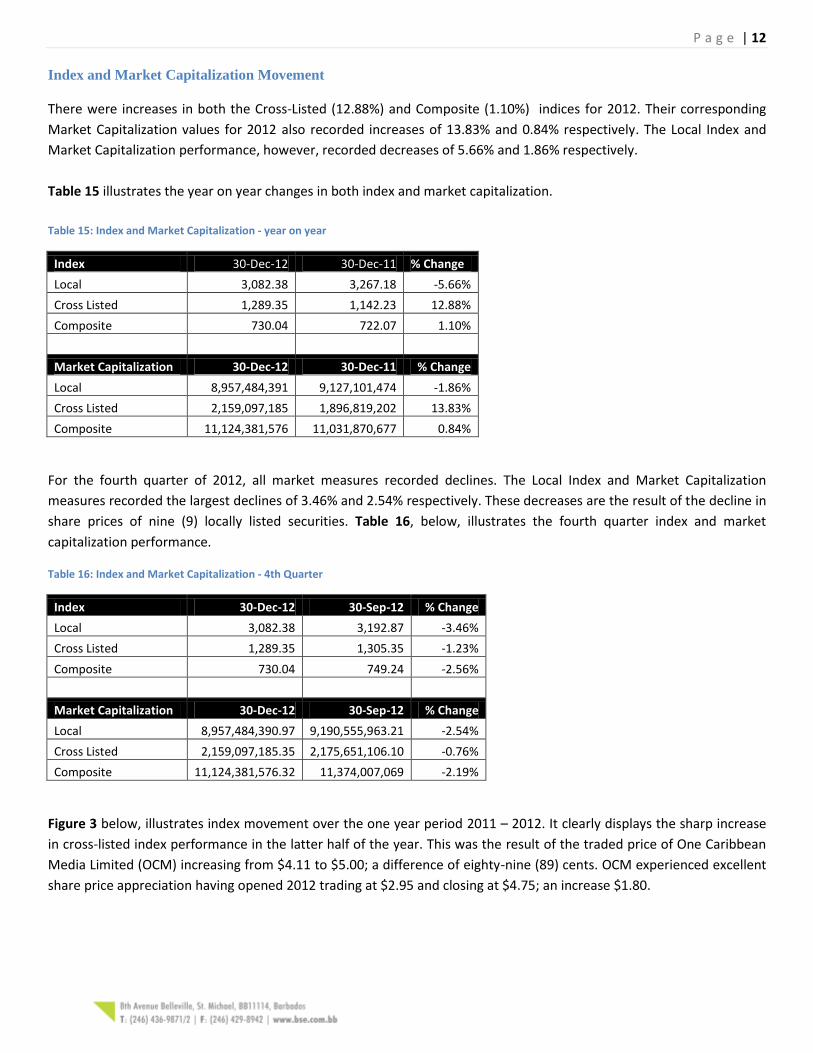
Index and Market Capitalization Movement
There were increases in both the Cross-Listed (12.88%) and Composite (1.10%) indices for 2012. Their corresponding
Market Capitalization values for 2012 also recorded increases of 13.83% and 0.84% respectively. The Local Index and
Market Capitalization performance, however, recorded decreases of 5.66% and 1.86% respectively.
Table 15 illustrates the year on year changes in both index and market capitalization.
Table 15: Index and Market Capitalization - year on year
Index 30-Dec-12 30-Dec-11 % Change
Local 3,082.38 3,267.18 -5.66%
Cross Listed 1,289.35 1,142.23 12.88%
Composite 730.04 722.07 1.10%
Market Capitalization 30-Dec-12 30-Dec-11 % Change
Local 8,957,484,391 9,127,101,474 -1.86%
Cross Listed 2,159,097,185 1,896,819,202 13.83%
Composite 11,124,381,576 11,031,870,677 0.84%
For the fourth quarter of 2012, all market measures recorded declines. The Local Index and Market Capitalization
measures recorded the largest declines of 3.46% and 2.54% respectively. These decreases are the result of the decline in
share prices of nine (9) locally listed securities. Table 16, below, illustrates the fourth quarter index and market
capitalization performance.
Table 16: Index and Market Capitalization - 4th Quarter
Index 30-Dec-12 30-Sep-12 % Change
Local 3,082.38 3,192.87 -3.46%
Cross Listed 1,289.35 1,305.35 -1.23%
Composite 730.04 749.24 -2.56%
Market Capitalization 30-Dec-12 30-Sep-12 % Change
Local 8,957,484,390.97 9,190,555,963.21 -2.54%
Cross Listed 2,159,097,185.35 2,175,651,106.10 -0.76%
Composite 11,124,381,576.32 11,374,007,069 -2.19%
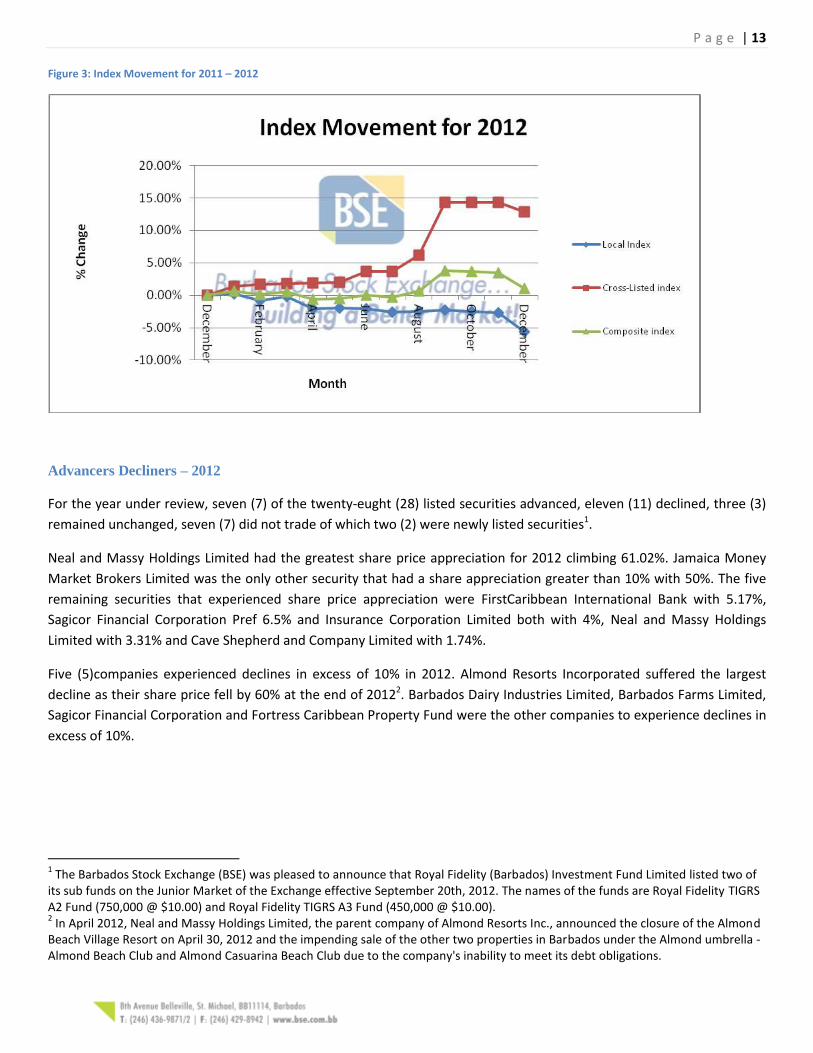
Figure 3 below, illustrates index movement over the one year period 2011 – 2012. It clearly displays the sharp increase
in cross-listed index performance in the latter half of the year. This was the result of the traded price of One Caribbean
Media Limited (OCM) increasing from $4.11 to $5.00; a difference of eighty-nine (89) cents. OCM experienced excellent
share price appreciation having opened 2012 trading at $2.95 and closing at $4.75; an increase $1.80.
P a g e | 13
Figure 3: Index Movement for 2011 – 2012
Advancers Decliners – 2012
For the year under review, seven (7) of the twenty-eught (28) listed securities advanced, eleven (11) declined, three (3)
remained unchanged, seven (7) did not trade of which two (2) were newly listed securities1.
Neal and Massy Holdings Limited had the greatest share price appreciation for 2012 climbing 61.02%. Jamaica Money
Market Brokers Limited was the only other security that had a share appreciation greater than 10% with 50%. The five
remaining securities that experienced share price appreciation were FirstCaribbean International Bank with 5.17%,
Sagicor Financial Corporation Pref 6.5% and Insurance Corporation Limited both with 4%, Neal and Massy Holdings
Limited with 3.31% and Cave Shepherd and Company Limited with 1.74%.
Five (5)companies experienced declines in excess of 10% in 2012. Almond Resorts Incorporated suffered the largest
decline as their share price fell by 60% at the end of 20122. Barbados Dairy Industries Limited, Barbados Farms Limited,
Sagicor Financial Corporation and Fortress Caribbean Property Fund were the other companies to experience declines in
excess of 10%.
1 The Barbados Stock Exchange (BSE) was pleased to announce that Royal Fidelity (Barbados) Investment Fund Limited listed two of
its sub funds on the Junior Market of the Exchange effective September 20th, 2012. The names of the funds are Royal Fidelity TIGRS A2 Fund (750,000 @ $10.00) and Royal Fidelity TIGRS A3 Fund (450,000 @ $10.00). 2 In April 2012, Neal and Massy Holdings Limited, the parent company of Almond Resorts Inc., announced the closure of the Almond
Beach Village Resort on April 30, 2012 and the impending sale of the other two properties in Barbados under the Almond umbrella - Almond Beach Club and Almond Casuarina Beach Club due to the company's inability to meet its debt obligations.
P a g e | 14
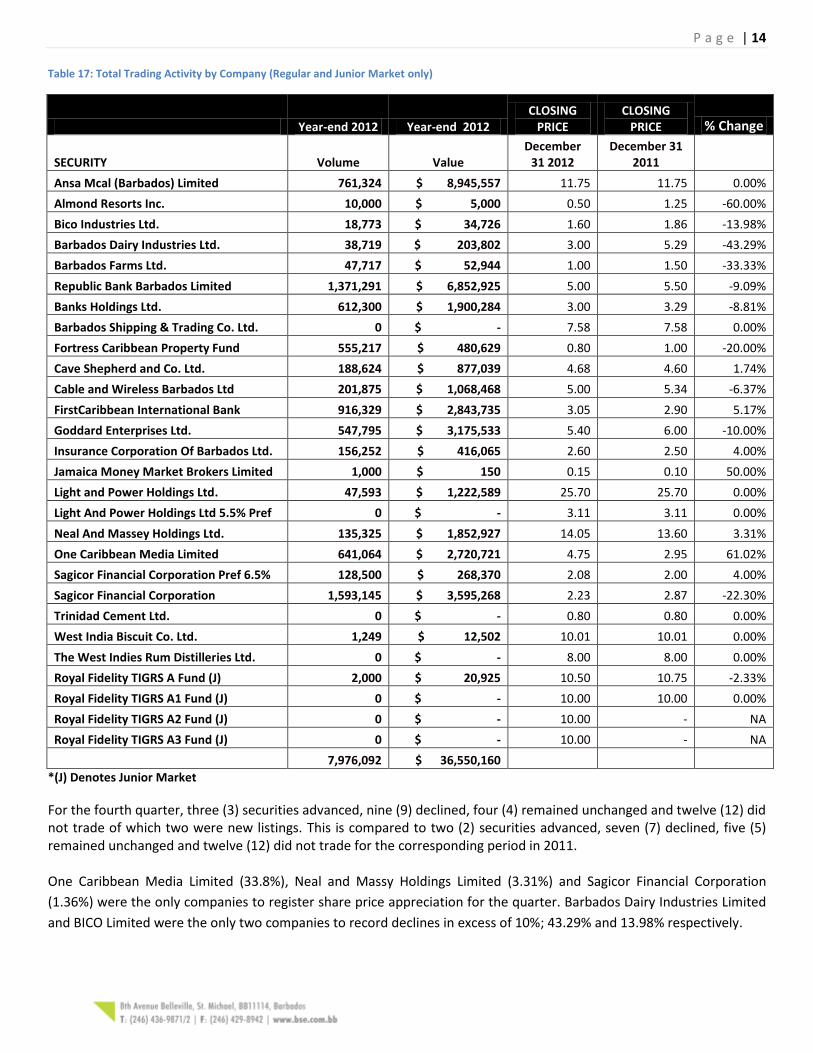
Table 17: Total Trading Activity by Company (Regular and Junior Market only)
Year-end 2012 Year-end 2012 CLOSING
PRICE CLOSING
PRICE % Change
SECURITY Volume Value December
31 2012 December 31
2011
Ansa Mcal (Barbados) Limited 761,324 $ 8,945,557 11.75 11.75 0.00%
Almond Resorts Inc. 10,000 $ 5,000 0.50 1.25 -60.00%
Bico Industries Ltd. 18,773 $ 34,726 1.60 1.86 -13.98%
Barbados Dairy Industries Ltd. 38,719 $ 203,802 3.00 5.29 -43.29%
Barbados Farms Ltd. 47,717 $ 52,944 1.00 1.50 -33.33%
Republic Bank Barbados Limited 1,371,291 $ 6,852,925 5.00 5.50 -9.09%
Banks Holdings Ltd. 612,300 $ 1,900,284 3.00 3.29 -8.81%
Barbados Shipping & Trading Co. Ltd. 0 $ - 7.58 7.58 0.00%
Fortress Caribbean Property Fund 555,217 $ 480,629 0.80 1.00 -20.00%
Cave Shepherd and Co. Ltd. 188,624 $ 877,039 4.68 4.60 1.74%
Cable and Wireless Barbados Ltd 201,875 $ 1,068,468 5.00 5.34 -6.37%
FirstCaribbean International Bank 916,329 $ 2,843,735 3.05 2.90 5.17%
Goddard Enterprises Ltd. 547,795 $ 3,175,533 5.40 6.00 -10.00%
Insurance Corporation Of Barbados Ltd. 156,252 $ 416,065 2.60 2.50 4.00%
Jamaica Money Market Brokers Limited 1,000 $ 150 0.15 0.10 50.00%
Light and Power Holdings Ltd. 47,593 $ 1,222,589 25.70 25.70 0.00%
Light And Power Holdings Ltd 5.5% Pref 0 $ - 3.11 3.11 0.00%
Neal And Massey Holdings Ltd. 135,325 $ 1,852,927 14.05 13.60 3.31%
One Caribbean Media Limited 641,064 $ 2,720,721 4.75 2.95 61.02%
Sagicor Financial Corporation Pref 6.5% 128,500 $ 268,370 2.08 2.00 4.00%
Sagicor Financial Corporation 1,593,145 $ 3,595,268 2.23 2.87 -22.30%
Trinidad Cement Ltd. 0 $ - 0.80 0.80 0.00%
West India Biscuit Co. Ltd. 1,249 $ 12,502 10.01 10.01 0.00%
The West Indies Rum Distilleries Ltd. 0 $ - 8.00 8.00 0.00%
Royal Fidelity TIGRS A Fund (J) 2,000 $ 20,925 10.50 10.75 -2.33%
Royal Fidelity TIGRS A1 Fund (J) 0 $ - 10.00 10.00 0.00%
Royal Fidelity TIGRS A2 Fund (J) 0 $ - 10.00 - NA
Royal Fidelity TIGRS A3 Fund (J) 0 $ - 10.00 - NA
7,976,092 $ 36,550,160
*(J) Denotes Junior Market
For the fourth quarter, three (3) securities advanced, nine (9) declined, four (4) remained unchanged and twelve (12) did not trade of which two were new listings. This is compared to two (2) securities advanced, seven (7) declined, five (5) remained unchanged and twelve (12) did not trade for the corresponding period in 2011. One Caribbean Media Limited (33.8%), Neal and Massy Holdings Limited (3.31%) and Sagicor Financial Corporation
(1.36%) were the only companies to register share price appreciation for the quarter. Barbados Dairy Industries Limited
and BICO Limited were the only two companies to record declines in excess of 10%; 43.29% and 13.98% respectively.
P a g e | 15
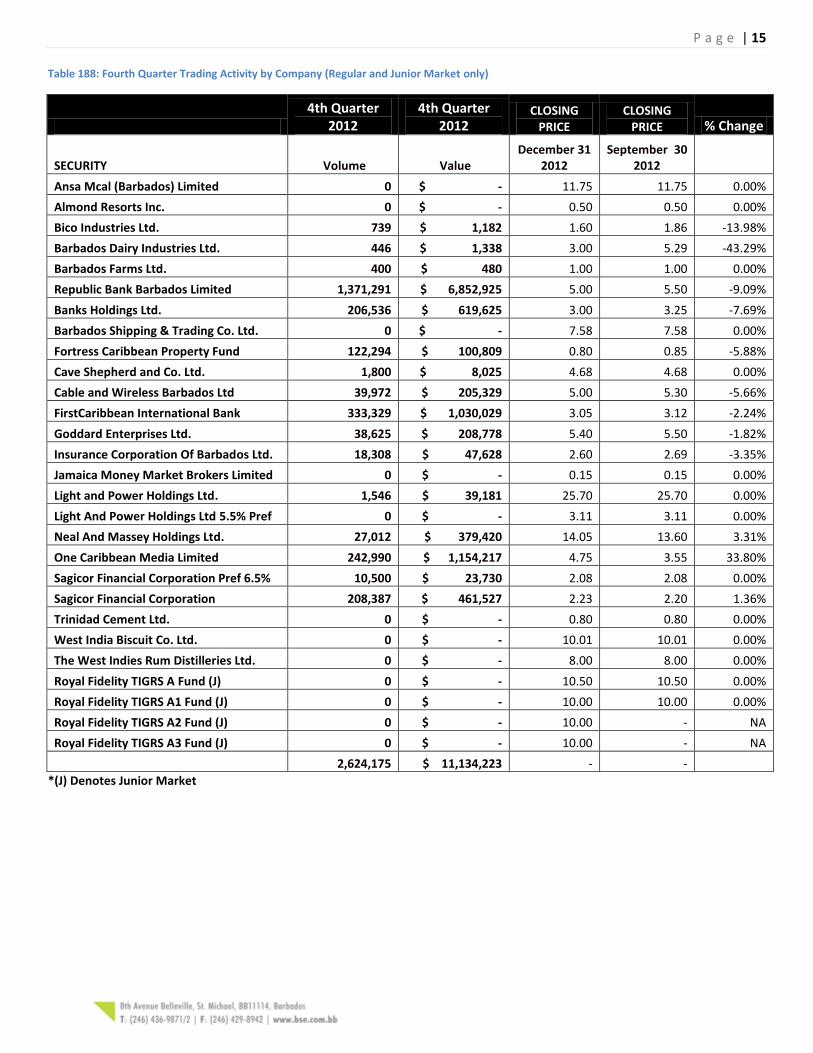
Table 188: Fourth Quarter Trading Activity by Company (Regular and Junior Market only)
4th Quarter 2012
4th Quarter 2012
CLOSING PRICE
CLOSING PRICE % Change
SECURITY Volume Value December 31
2012 September 30
2012
Ansa Mcal (Barbados) Limited 0 $ - 11.75 11.75 0.00%
Almond Resorts Inc. 0 $ - 0.50 0.50 0.00%
Bico Industries Ltd. 739 $ 1,182 1.60 1.86 -13.98%
Barbados Dairy Industries Ltd. 446 $ 1,338 3.00 5.29 -43.29%
Barbados Farms Ltd. 400 $ 480 1.00 1.00 0.00%
Republic Bank Barbados Limited 1,371,291 $ 6,852,925 5.00 5.50 -9.09%
Banks Holdings Ltd. 206,536 $ 619,625 3.00 3.25 -7.69%
Barbados Shipping & Trading Co. Ltd. 0 $ - 7.58 7.58 0.00%
Fortress Caribbean Property Fund 122,294 $ 100,809 0.80 0.85 -5.88%
Cave Shepherd and Co. Ltd. 1,800 $ 8,025 4.68 4.68 0.00%
Cable and Wireless Barbados Ltd 39,972 $ 205,329 5.00 5.30 -5.66%
FirstCaribbean International Bank 333,329 $ 1,030,029 3.05 3.12 -2.24%
Goddard Enterprises Ltd. 38,625 $ 208,778 5.40 5.50 -1.82%
Insurance Corporation Of Barbados Ltd. 18,308 $ 47,628 2.60 2.69 -3.35%
Jamaica Money Market Brokers Limited 0 $ - 0.15 0.15 0.00%
Light and Power Holdings Ltd. 1,546 $ 39,181 25.70 25.70 0.00%
Light And Power Holdings Ltd 5.5% Pref 0 $ - 3.11 3.11 0.00%
Neal And Massey Holdings Ltd. 27,012 $ 379,420 14.05 13.60 3.31%
One Caribbean Media Limited 242,990 $ 1,154,217 4.75 3.55 33.80%
Sagicor Financial Corporation Pref 6.5% 10,500 $ 23,730 2.08 2.08 0.00%
Sagicor Financial Corporation 208,387 $ 461,527 2.23 2.20 1.36%
Trinidad Cement Ltd. 0 $ - 0.80 0.80 0.00%
West India Biscuit Co. Ltd. 0 $ - 10.01 10.01 0.00%
The West Indies Rum Distilleries Ltd. 0 $ - 8.00 8.00 0.00%
Royal Fidelity TIGRS A Fund (J) 0 $ - 10.50 10.50 0.00%
Royal Fidelity TIGRS A1 Fund (J) 0 $ - 10.00 10.00 0.00%
Royal Fidelity TIGRS A2 Fund (J) 0 $ - 10.00 - NA
Royal Fidelity TIGRS A3 Fund (J) 0 $ - 10.00 - NA
2,624,175 $ 11,134,223 - -
*(J) Denotes Junior Market
P a g e | 16
Historical Company Trading Statistics
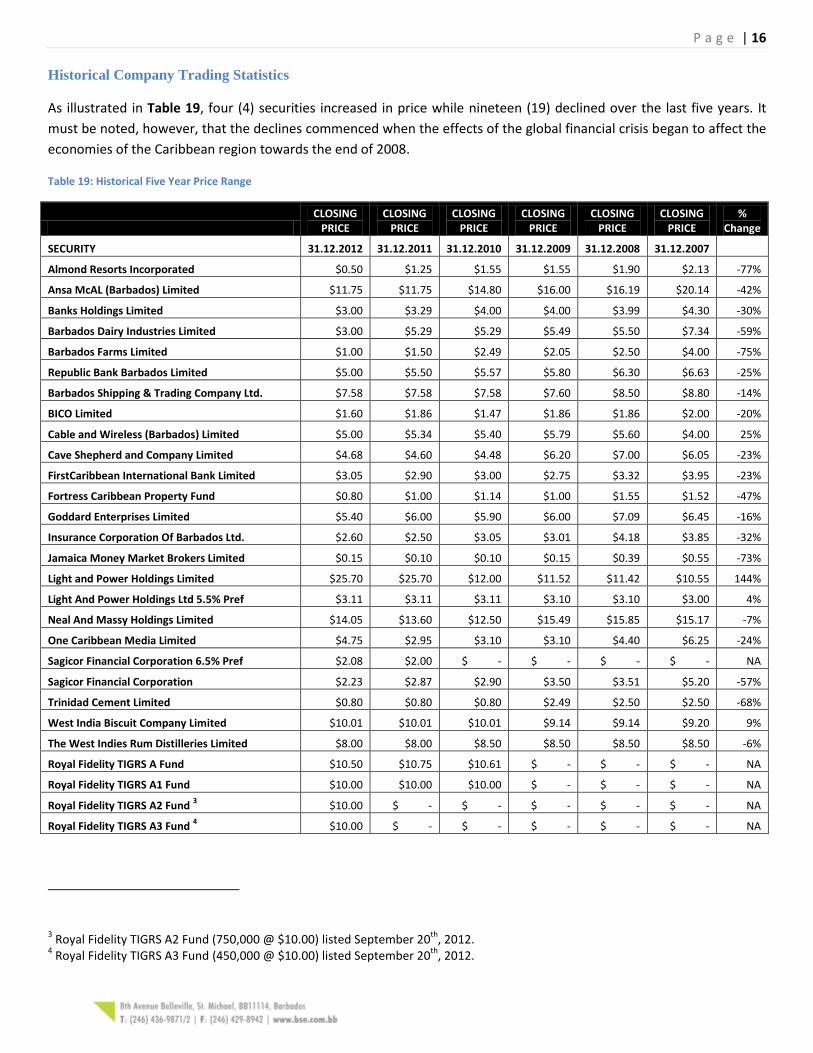
As illustrated in Table 19, four (4) securities increased in price while nineteen (19) declined over the last five years. It
must be noted, however, that the declines commenced when the effects of the global financial crisis began to affect the
economies of the Caribbean region towards the end of 2008.
Table 19: Historical Five Year Price Range
CLOSING
PRICE CLOSING
PRICE CLOSING
PRICE CLOSING
PRICE CLOSING
PRICE CLOSING
PRICE %
Change
SECURITY 31.12.2012 31.12.2011 31.12.2010 31.12.2009 31.12.2008 31.12.2007
Almond Resorts Incorporated $0.50 $1.25 $1.55 $1.55 $1.90 $2.13 -77%
Ansa McAL (Barbados) Limited $11.75 $11.75 $14.80 $16.00 $16.19 $20.14 -42%
Banks Holdings Limited $3.00 $3.29 $4.00 $4.00 $3.99 $4.30 -30%
Barbados Dairy Industries Limited $3.00 $5.29 $5.29 $5.49 $5.50 $7.34 -59%
Barbados Farms Limited $1.00 $1.50 $2.49 $2.05 $2.50 $4.00 -75%
Republic Bank Barbados Limited $5.00 $5.50 $5.57 $5.80 $6.30 $6.63 -25%
Barbados Shipping & Trading Company Ltd. $7.58 $7.58 $7.58 $7.60 $8.50 $8.80 -14%
BICO Limited $1.60 $1.86 $1.47 $1.86 $1.86 $2.00 -20%
Cable and Wireless (Barbados) Limited $5.00 $5.34 $5.40 $5.79 $5.60 $4.00 25%
Cave Shepherd and Company Limited $4.68 $4.60 $4.48 $6.20 $7.00 $6.05 -23%
FirstCaribbean International Bank Limited $3.05 $2.90 $3.00 $2.75 $3.32 $3.95 -23%
Fortress Caribbean Property Fund $0.80 $1.00 $1.14 $1.00 $1.55 $1.52 -47%
Goddard Enterprises Limited $5.40 $6.00 $5.90 $6.00 $7.09 $6.45 -16%
Insurance Corporation Of Barbados Ltd. $2.60 $2.50 $3.05 $3.01 $4.18 $3.85 -32%
Jamaica Money Market Brokers Limited $0.15 $0.10 $0.10 $0.15 $0.39 $0.55 -73%
Light and Power Holdings Limited $25.70 $25.70 $12.00 $11.52 $11.42 $10.55 144%
Light And Power Holdings Ltd 5.5% Pref $3.11 $3.11 $3.11 $3.10 $3.10 $3.00 4%
Neal And Massy Holdings Limited $14.05 $13.60 $12.50 $15.49 $15.85 $15.17 -7%
One Caribbean Media Limited $4.75 $2.95 $3.10 $3.10 $4.40 $6.25 -24%
Sagicor Financial Corporation 6.5% Pref $2.08 $2.00 $ - $ - $ - $ - NA
Sagicor Financial Corporation $2.23 $2.87 $2.90 $3.50 $3.51 $5.20 -57%
Trinidad Cement Limited $0.80 $0.80 $0.80 $2.49 $2.50 $2.50 -68%
West India Biscuit Company Limited $10.01 $10.01 $10.01 $9.14 $9.14 $9.20 9%
The West Indies Rum Distilleries Limited $8.00 $8.00 $8.50 $8.50 $8.50 $8.50 -6%
Royal Fidelity TIGRS A Fund $10.50 $10.75 $10.61 $ - $ - $ - NA
Royal Fidelity TIGRS A1 Fund $10.00 $10.00 $10.00 $ - $ - $ - NA
Royal Fidelity TIGRS A2 Fund 3 $10.00 $ - $ - $ - $ - $ - NA
Royal Fidelity TIGRS A3 Fund 4 $10.00 $ - $ - $ - $ - $ - NA
3 Royal Fidelity TIGRS A2 Fund (750,000 @ $10.00) listed September 20
th, 2012.
4 Royal Fidelity TIGRS A3 Fund (450,000 @ $10.00) listed September 20
th, 2012.
P a g e | 17
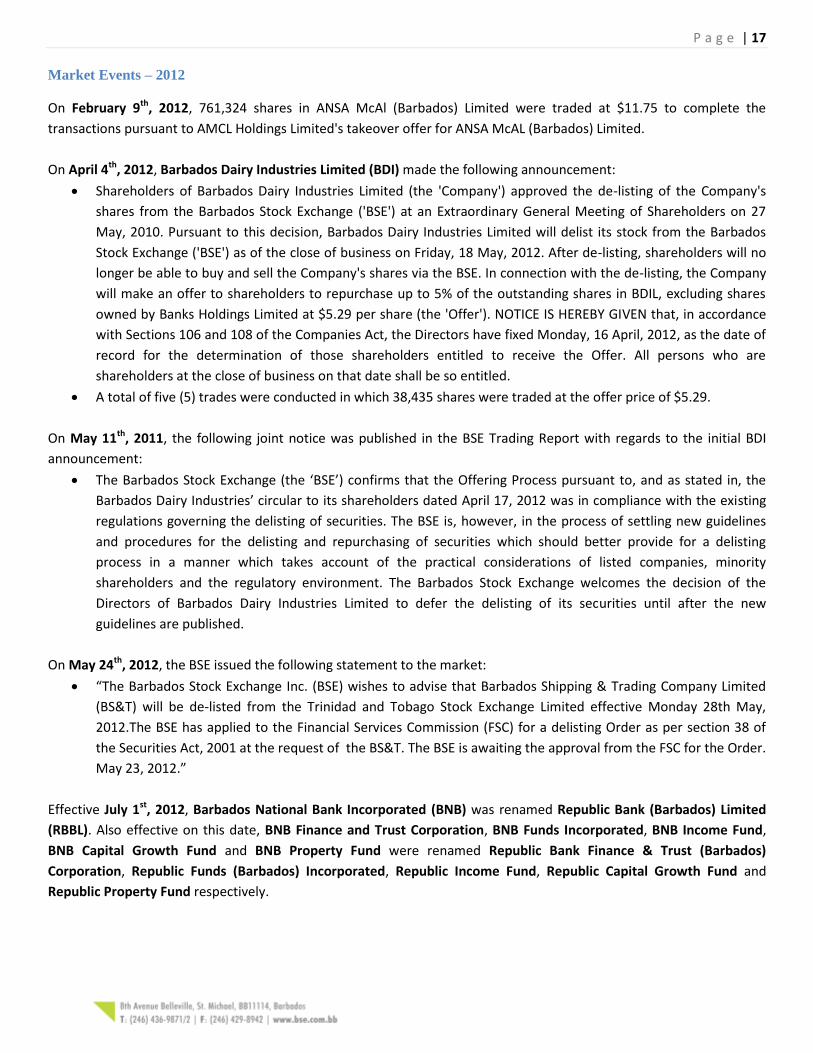
Market Events – 2012
On February 9th, 2012, 761,324 shares in ANSA McAl (Barbados) Limited were traded at $11.75 to complete the
transactions pursuant to AMCL Holdings Limited's takeover offer for ANSA McAL (Barbados) Limited.
On April 4th, 2012, Barbados Dairy Industries Limited (BDI) made the following announcement:
Shareholders of Barbados Dairy Industries Limited (the 'Company') approved the de-listing of the Company's
shares from the Barbados Stock Exchange ('BSE') at an Extraordinary General Meeting of Shareholders on 27
May, 2010. Pursuant to this decision, Barbados Dairy Industries Limited will delist its stock from the Barbados
Stock Exchange ('BSE') as of the close of business on Friday, 18 May, 2012. After de-listing, shareholders will no
longer be able to buy and sell the Company's shares via the BSE. In connection with the de-listing, the Company
will make an offer to shareholders to repurchase up to 5% of the outstanding shares in BDIL, excluding shares
owned by Banks Holdings Limited at $5.29 per share (the 'Offer'). NOTICE IS HEREBY GIVEN that, in accordance
with Sections 106 and 108 of the Companies Act, the Directors have fixed Monday, 16 April, 2012, as the date of
record for the determination of those shareholders entitled to receive the Offer. All persons who are
shareholders at the close of business on that date shall be so entitled.
A total of five (5) trades were conducted in which 38,435 shares were traded at the offer price of $5.29.
On May 11th, 2011, the following joint notice was published in the BSE Trading Report with regards to the initial BDI
announcement:
The Barbados Stock Exchange (the ‘BSE’) confirms that the Offering Process pursuant to, and as stated in, the
Barbados Dairy Industries’ circular to its shareholders dated April 17, 2012 was in compliance with the existing
regulations governing the delisting of securities. The BSE is, however, in the process of settling new guidelines
and procedures for the delisting and repurchasing of securities which should better provide for a delisting
process in a manner which takes account of the practical considerations of listed companies, minority
shareholders and the regulatory environment. The Barbados Stock Exchange welcomes the decision of the
Directors of Barbados Dairy Industries Limited to defer the delisting of its securities until after the new
guidelines are published.
On May 24th, 2012, the BSE issued the following statement to the market:
“The Barbados Stock Exchange Inc. (BSE) wishes to advise that Barbados Shipping & Trading Company Limited
(BS&T) will be de-listed from the Trinidad and Tobago Stock Exchange Limited effective Monday 28th May,
2012.The BSE has applied to the Financial Services Commission (FSC) for a delisting Order as per section 38 of
the Securities Act, 2001 at the request of the BS&T. The BSE is awaiting the approval from the FSC for the Order.
May 23, 2012.”
Effective July 1st, 2012, Barbados National Bank Incorporated (BNB) was renamed Republic Bank (Barbados) Limited
(RBBL). Also effective on this date, BNB Finance and Trust Corporation, BNB Funds Incorporated, BNB Income Fund,
BNB Capital Growth Fund and BNB Property Fund were renamed Republic Bank Finance & Trust (Barbados)
Corporation, Republic Funds (Barbados) Incorporated, Republic Income Fund, Republic Capital Growth Fund and
Republic Property Fund respectively.
P a g e | 18
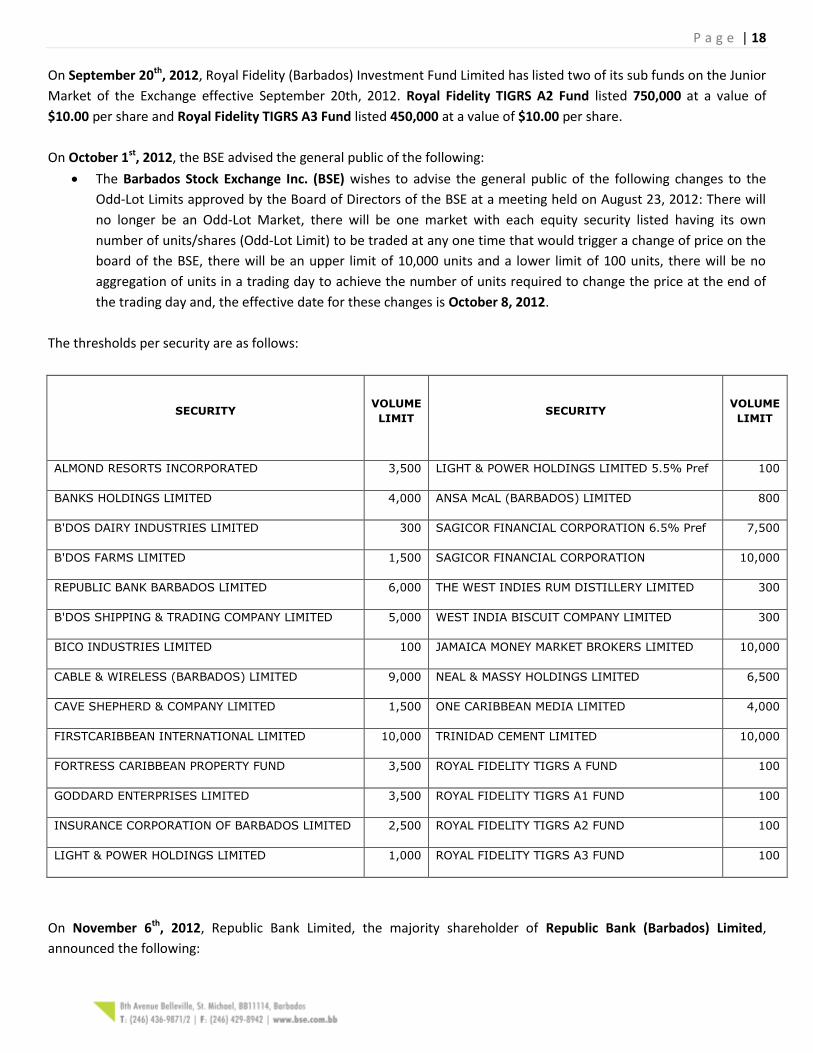
On September 20th, 2012, Royal Fidelity (Barbados) Investment Fund Limited has listed two of its sub funds on the Junior
Market of the Exchange effective September 20th, 2012. Royal Fidelity TIGRS A2 Fund listed 750,000 at a value of
$10.00 per share and Royal Fidelity TIGRS A3 Fund listed 450,000 at a value of $10.00 per share.
On October 1st, 2012, the BSE advised the general public of the following:
The Barbados Stock Exchange Inc. (BSE) wishes to advise the general public of the following changes to the
Odd-Lot Limits approved by the Board of Directors of the BSE at a meeting held on August 23, 2012: There will
no longer be an Odd-Lot Market, there will be one market with each equity security listed having its own
number of units/shares (Odd-Lot Limit) to be traded at any one time that would trigger a change of price on the
board of the BSE, there will be an upper limit of 10,000 units and a lower limit of 100 units, there will be no
aggregation of units in a trading day to achieve the number of units required to change the price at the end of
the trading day and, the effective date for these changes is October 8, 2012.
The thresholds per security are as follows:
SECURITY
VOLUME
LIMIT SECURITY
VOLUME
LIMIT
ALMOND RESORTS INCORPORATED 3,500 LIGHT & POWER HOLDINGS LIMITED 5.5% Pref 100
BANKS HOLDINGS LIMITED 4,000 ANSA McAL (BARBADOS) LIMITED 800
B'DOS DAIRY INDUSTRIES LIMITED 300 SAGICOR FINANCIAL CORPORATION 6.5% Pref 7,500
B'DOS FARMS LIMITED 1,500 SAGICOR FINANCIAL CORPORATION 10,000
REPUBLIC BANK BARBADOS LIMITED 6,000 THE WEST INDIES RUM DISTILLERY LIMITED 300
B'DOS SHIPPING & TRADING COMPANY LIMITED 5,000 WEST INDIA BISCUIT COMPANY LIMITED 300
BICO INDUSTRIES LIMITED 100 JAMAICA MONEY MARKET BROKERS LIMITED 10,000
CABLE & WIRELESS (BARBADOS) LIMITED 9,000 NEAL & MASSY HOLDINGS LIMITED 6,500
CAVE SHEPHERD & COMPANY LIMITED 1,500 ONE CARIBBEAN MEDIA LIMITED 4,000
FIRSTCARIBBEAN INTERNATIONAL LIMITED 10,000 TRINIDAD CEMENT LIMITED 10,000
FORTRESS CARIBBEAN PROPERTY FUND 3,500 ROYAL FIDELITY TIGRS A FUND 100
GODDARD ENTERPRISES LIMITED 3,500 ROYAL FIDELITY TIGRS A1 FUND 100
INSURANCE CORPORATION OF BARBADOS LIMITED 2,500 ROYAL FIDELITY TIGRS A2 FUND 100
LIGHT & POWER HOLDINGS LIMITED 1,000 ROYAL FIDELITY TIGRS A3 FUND 100
On November 6th, 2012, Republic Bank Limited, the majority shareholder of Republic Bank (Barbados) Limited,
announced the following:
P a g e | 19
"that it has received the required regulatory approvals from the Government of Barbados, the Central Bank of
Barbados and the Barbados Financial Services Commission to make an offer for the remaining shares of Republic
Bank (Barbados) Limited. Republic Bank Limited currently holds 65.14% of the shares of the Barbados subsidiary.
The offer at $5.00 per share opens today (Tuesday November 6th 2012) and will close on Tuesday 4th December
2012."
As at December 31st, 2012, a total of seven (7) trades were conducted in which 32,165,397 shares were traded
with a total value of $160,826,985.00.
P a g e | 20
The Regulatory Roundup – 2012
This new section of the Annual Report features the activities of the BSE’s Compliance Department during the year 2012
and outlines its objectives for 2013.
Notices to the Market
Notice to Members 2012-1 – Guidelines for due diligence procedures for offers to shareholders of
companies listed on the board of the Barbados Stock Exchange Inc. This notice revokes and replaces Notice
to Members 2011-1.
Notice to Members 2012-2 – Cross Border Remittance.
Notice to Listed Companies 2012-1 – Enforcement and Compliance – The Corporate Governance
Recommendations and Insider Trading Guidelines.
Compliance Review of Brokers
Compliance reviews of two member brokers conducted.
Consultation with the Market
Meeting held with listed companies to discuss the BSE Corporate Governance Recommendations.
Power Point Presentation entitled: BSE Corporate Governance Recommendations: Improved Standards of
Corporate Governance for Publicly Listed Companies, drafted by the BSE and presented to listed
companies.
Success of the Regulatory Objectives for 2012-2013
Regulatory objectives in respect of the rules of the BSE and Corporate Governance Recommendations which were set for
the 2012-2013 were pursued by:
The BSE making further proposals to the Financial Services Commission (‘FSC’) for further amendments
to the rules of the BSE, which are necessary to provide greater protection to investors, and increase the
effectiveness of the rules in our local market; and
The BSE engaging in a consultation period with the listed companies on the proposed BSE Corporate
Governance Recommendations.
The above-mentioned regulatory objectives are therefore works in progress. However, we believe we stand poised to
have the new rules of the BSE made enforceable in this 2013 year. Similarly, the BSE Corporate Governance
Recommendations should be reissued to the listed companies in the 2013 year.
The completion of these objectives will mean enhanced regulatory oversight and a more transparent and secure
investment environment for Barbados. Accordingly, the completion of these objectives is a principal objective for the
BSE for 2013.
P a g e | 21
The BSE will engage with the FSC on the question of a suitable anti-money laundering policy to guide our local market.
The BSE has already issued Notice to Members 2012-1 (– Guidelines for due diligence procedures for offers to
shareholders of companies listed on the board of the BSE) and will be reviewing this policy in this 2013 year for its
effectiveness in our local market. Further anti money laundering guidelines will be issued to the market in 2013.
Major Regulatory Objectives for 2013-2014
Overseeing the implementation the first International Securities Market in Barbados.
Drafting rules to further develop the Junior Market of the BSE.
Improving the awareness of the regulatory powers of the BSE amongst brokers, listed companies, legal
practitioners, and the general public.
Developing the website of the BSE as a source of regulatory information for use by investors, brokers, listed
companies, and the general public. The website of the BSE will also function as a major tool for regulation of
the market.
P a g e | 22
Conclusion
Trading activity on the board of the BSE for 2012 can best be described as stable. The takeover activity which occurred in
the last quarter of 2012 had positive effects of both volumes and values traded, however, these transactions were not
sufficient to result in any improvements in overall performance versus the 2011 figures. It must be noted, however, that
despite this stable performance, improvements were seen in the Cross-Listed and Composite market measures as the
share prices of some securities started to improve.
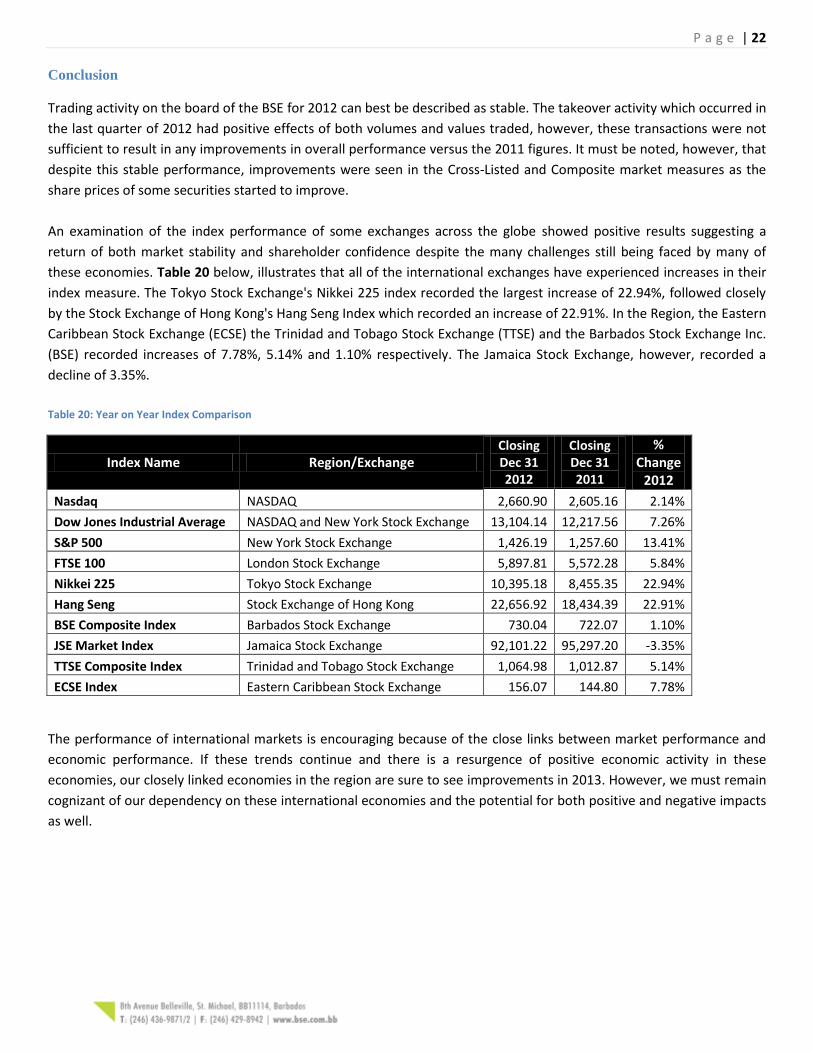
An examination of the index performance of some exchanges across the globe showed positive results suggesting a
return of both market stability and shareholder confidence despite the many challenges still being faced by many of
these economies. Table 20 below, illustrates that all of the international exchanges have experienced increases in their
index measure. The Tokyo Stock Exchange's Nikkei 225 index recorded the largest increase of 22.94%, followed closely
by the Stock Exchange of Hong Kong's Hang Seng Index which recorded an increase of 22.91%. In the Region, the Eastern
Caribbean Stock Exchange (ECSE) the Trinidad and Tobago Stock Exchange (TTSE) and the Barbados Stock Exchange Inc.
(BSE) recorded increases of 7.78%, 5.14% and 1.10% respectively. The Jamaica Stock Exchange, however, recorded a
decline of 3.35%.
Table 20: Year on Year Index Comparison
Index Name Region/Exchange Closing Dec 31 2012
Closing Dec 31 2011
% Change
2012
Nasdaq NASDAQ 2,660.90 2,605.16 2.14%
Dow Jones Industrial Average NASDAQ and New York Stock Exchange 13,104.14 12,217.56 7.26%
S&P 500 New York Stock Exchange 1,426.19 1,257.60 13.41%
FTSE 100 London Stock Exchange 5,897.81 5,572.28 5.84%
Nikkei 225 Tokyo Stock Exchange 10,395.18 8,455.35 22.94%
Hang Seng Stock Exchange of Hong Kong 22,656.92 18,434.39 22.91%
BSE Composite Index Barbados Stock Exchange 730.04 722.07 1.10%
JSE Market Index Jamaica Stock Exchange 92,101.22 95,297.20 -3.35%
TTSE Composite Index Trinidad and Tobago Stock Exchange 1,064.98 1,012.87 5.14%
ECSE Index Eastern Caribbean Stock Exchange 156.07 144.80 7.78%
The performance of international markets is encouraging because of the close links between market performance and
economic performance. If these trends continue and there is a resurgence of positive economic activity in these
economies, our closely linked economies in the region are sure to see improvements in 2013. However, we must remain
cognizant of our dependency on these international economies and the potential for both positive and negative impacts
as well.