Embed Size (px)
Citation preview
Level 4
IELTS Writing Task 1
Task 1 – Temporal Graphs
Task 1 on the IELTS exam requires you to transfer information from a chart into a written report. You need to be able to give a clear interpretation of the data in the chart. You need to produce a report that gives an introduction and a body paragraph for each of the data sources.
In this section you will:
practice identifying trends in a bar/line chart practice writing about changes in a bar/line chart
To get a band 5 in IELTS, you need to:-
• write an overview• describe the main information in the chart(s) correctly• make some comparisons• organise your writing in a clear and logical way• use some good linking words• use suitable vocabulary with good range, spelling and correct word forms• have some simple sentences, some compound sentences (using linking
words like and & but), some complex sentences (e.g. …., which was the highest figure in the period, …, after which…)

Tourists Visiting Three European Countries in 2008
Sentence TypesTwo of the main sentence types for this kind of writing are those using verb/adverb and adjective/noun combinations.
Directions - Look at the chart on the number of tourists visiting three European countries in 2008 and fill in the gaps below with the correct countries.
1. The number of tourists in _____________________ increased dramatically in October.
2. The number of tourists in _____________________ dropped steadily from January to June.
3. There was a dramatic increase in the number of tourists in ____________________ in October.
4. There was a steady drop in the number of tourists in _____________________ from January to June.
Directions - Which of these 4 sentences use verb/adverb and which use adjective/noun? Circle the verb/adverb and adjective/noun combinations and match them with sentence type (A) or (B) below.
(A) Sentences using verbs of change
subject + verb + adverb + other important details
(B) Sentences using nouns of change
1

there + be verb + article + adjective + noun + in + noun + other important details Key vocabulary Directions - Write the present and past tense of the verbs, and the adjectives of the adverbs.
Nouns Present tense verbs
Past tense verbs
Adverbs Adjectives
START POINT
- begin at - -- stand at - -- start at - -
UPrise rapidlyincrease dramaticallyclimb sharply
- go up gradually
DOWNfall steadilydecrease moderatelydecline slowlydrop slightly
- go down
SAME- remain
constant - -
- stay the same
- -
no change - -
UP and DOWN
fluctuation upwardsdownwards
peak - -plateau - -
Introductory Verbs Othersshow around just over / just under
illustrate approximately slightly more than / slightly less than
indicate about
2

Directions - Using the vocabulary from the chart, look at the line charts and complete the sentences using the correct adverb and verb or adjective and noun.
3
The number of homes owning more than one TV ________ ________ during September and then __________ ________ between October and November.
TV ratings ________ at ten million on June 30th.
There was a _________ ___________ in sales of Play Station 3 in March and then a ____________ _____________ during April.
The number of people investing in houses ______________ during the months of February and March.
Sales of crude oil ________________ ________________ between 2 and 2.5 million barrels from May to September.
The number of students attending Oxford University _________ _________ between 1997 and 2000.
There was a ___________ __________ in stocks in computer chips from November to December.
The amount of rainfall in the UAE ________ ____________ in July.

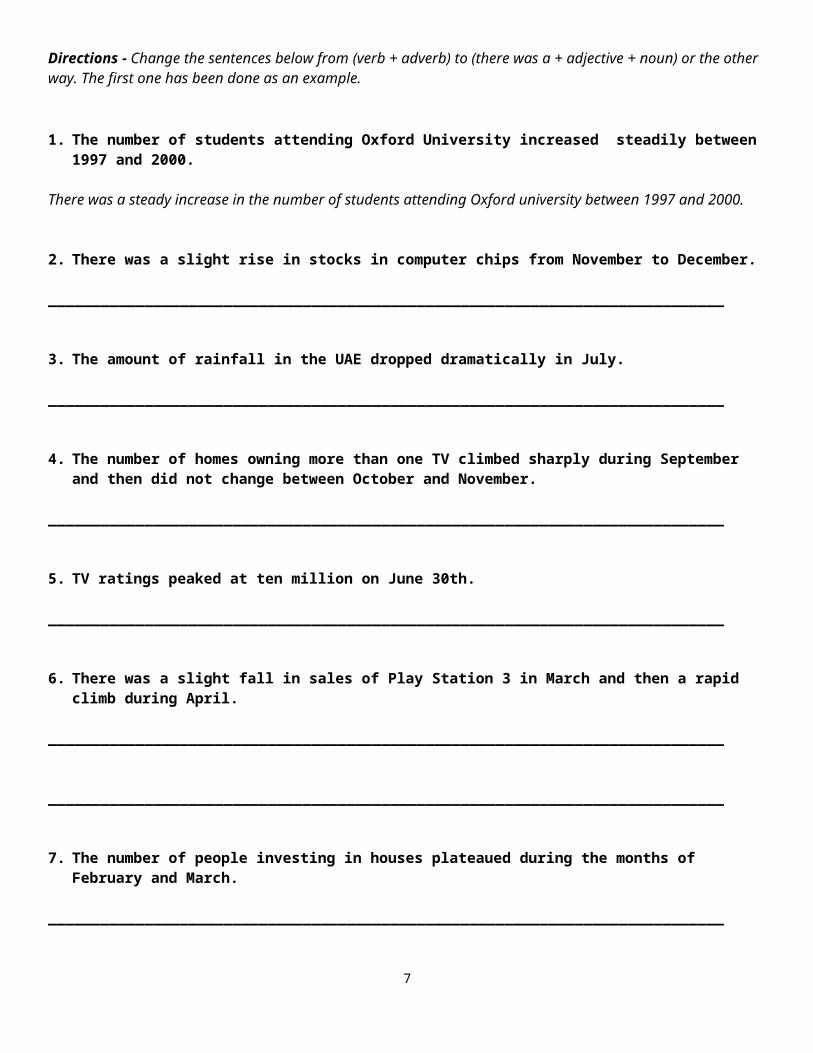
Directions - Change the sentences below from (verb + adverb) to (there was a + adjective + noun) or the other way. The first one has been done as an example.
1. The number of students attending Oxford University increased steadily between 1997 and 2000.
There was a steady increase in the number of students attending Oxford university between 1997 and 2000.
2. There was a slight rise in stocks in computer chips from November to December.
_____________________________________________________________________________
3. The amount of rainfall in the UAE dropped dramatically in July.
_____________________________________________________________________________
4. The number of homes owning more than one TV climbed sharply during September and then did not change between October and November.
_____________________________________________________________________________
5. TV ratings peaked at ten million on June 30th.
_____________________________________________________________________________
6. There was a slight fall in sales of Play Station 3 in March and then a rapid climb during April.
_____________________________________________________________________________
_____________________________________________________________________________
7. The number of people investing in houses plateaued during the months of February and March.
_____________________________________________________________________________
8. Sales of crude oil fluctuated upwards between 2 and 2.5 million barrels from May to September.
_____________________________________________________________________________
4

Task 1 Analysis and Planning
Directions- Look at the graph and answer the following questions
1. What kind of chart is it?2. What is the overall trend for each country?3. How would you organise the information in each of the paragraphs in
the boxes below?
5

Model Report:
The bar graph shows the amount of rice grown in three countries, which were China, Japan and India from 1920 to 2000. As an overall trend, the amount of rice for both China and India increased, while the amount for Japan decreased over the period.
Looking at the amount of rice grown in China, it is clear to see that it went up over the period. It stood at approximately 300 tons in 1920. From 1920 to 1960, the amount of rice grew slightly from 300 tons to 500 tons, after which it remained constant from 1960 to 1980. Then, between 1980 and 2000, there was a sharp rise in the amount from 500 tons to 2,400 tons, which was the highest figure in the period.
Similarly, the amount of rice in India climbed during the same 80 years. It began at 750 tons in 1920. Following this, there was a fluctuation in the amount of rice grown at around 800 tons between 1920 and 1960, after which the amount rose steadily from 800 tons to 1,500 tons between 1960 and 1990. Finally, the figure stayed the same from 1990 to 2000.
Unlike China and India, there was an overall drop in the amount of rice grown in Japan. It started at about 1,600 tons in 1920, before rising slightly to a peak of 1,800 tons between 1920 and 1930. Next, from 1930 to 1960, it fell steadily from 1,800 tons to about 1,300 tons. After that, it remained constant from 1960 to 2000.
Focus on Structure and Organisation
Directions- Look at the report and answer the following questions.
1. How many paragraphs are there? 2. How are the paragraphs organised?
6
3. Where is the overview found? Underline/highlight the sentences(s) that are the overview.
4. Does the overview have any details such as data or numbers?5. Which sentences in the body paragraphs 2 and 3 are comparisons? What are the
sentences comparing?6. Write down all the linking words that are used to order data information according
to time.____________________ _____________ ____________________ _____________ _____________ _____________ _____________
7. In each body paragraph, is all data described?8. Are there any explanations/opinions about the information in the graph?
Focus on Vocabulary and Grammar
9. What verb tense is used in the report? Why?10. In each body paragraph, what verb is used to describe the first data point?
Write these verbs below:_____________________ _____________________ _____________________
11. Look at body paragraph 1. How many verbs can you find that have the same meaning as increased? Underline/highlight them. Are the verbs the same or different from each other?
12. Do most of the sentences use verb/adverb or adjective/noun combinations? Write down some examples of:-
a. verb/adverb combinations ___________________________ ___________________________ ___________________________
b. adjective/noun combinations ___________________________ ___________________________ ___________________________
13. Look at body paragraph 2. Write down the different ways of referring to “the amount of ricegrown”. ____________________ ____________________ ____________________
14. Underline/highlight the complex structures used in the example report.15. Below are some common phrases, fill in each gap with 1 word only.
a. As ___________ overall trend,
7

b. From 1920 ___________ 1960,
c. Between 1980 ___________ 2000,
d. ……..decreased over ___________ period.
e. Looking ___________ the amount of rice grown in China, ………….
f. ………….it is clear to see ___________ it went up ……………..
g. It started ___________ 750 tons …………
h. there was an overall drop ___________ the amount………………
i. …………………___________ 1920 and 930.
j. Next, ___________ 1930 to 1960,…………………..
k. … it fell steadily ___________ 1,800 tons ___________ about 1,300 tons
Additional things to think about when writing reports:
Check that you have an overview and that it is correct. Make sure you give some numbers but don’t write any numbers in the
overview Be careful of spellings – learn the vocabulary table. Use the correct tense for verbs and vary them Make sure you use a variety of sentence patterns. Use the correct adverbs to describe trends.
8
Steps to writing a report1. Select information- Before you write think of what to include 2. Look at the main features- tops/bottoms, beginning/ends,
common patterns, changes, identify the important trends.3. Compare- similarities and differences4. Report- Write what you see- No opinion, not an essay 5. Summarize information- need to leave out some information,
don’t give too much information.

Put your time phrases in different parts of the sentence (front/back).
9

Practice
Task 1: You should spend 20 minutes on this task.
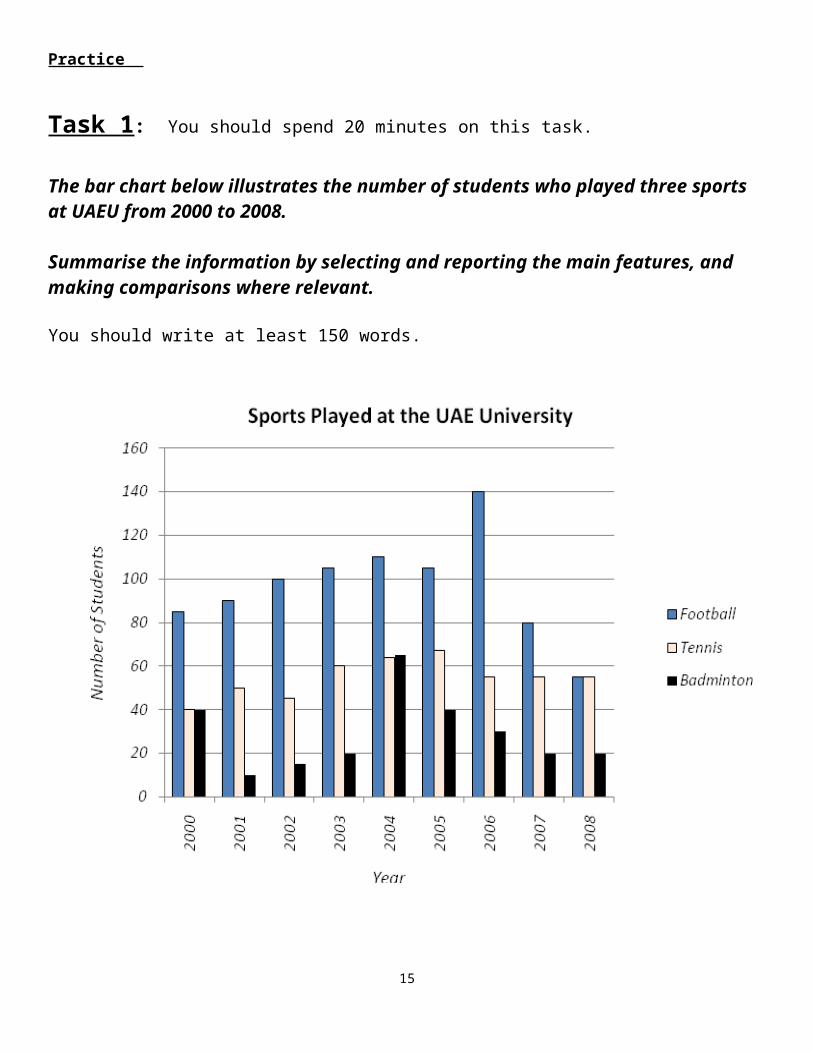
The bar chart below illustrates the number of students who played three sports at UAEU from 2000 to 2008.
Summarise the information by selecting and reporting the main features, and making comparisons where relevant.
You should write at least 150 words.
10

Name:__________________________________ ID:__________________________
__________________________________________________________________________________________
__________________________________________________________________________________________
__________________________________________________________________________________________
__________________________________________________________________________________________
__________________________________________________________________________________________
__________________________________________________________________________________________
__________________________________________________________________________________________
__________________________________________________________________________________________
__________________________________________________________________________________________
__________________________________________________________________________________________
__________________________________________________________________________________________
__________________________________________________________________________________________
__________________________________________________________________________________________
__________________________________________________________________________________________
__________________________________________________________________________________________
__________________________________________________________________________________________
__________________________________________________________________________________________
__________________________________________________________________________________________
__________________________________________________________________________________________
__________________________________________________________________________________________
__________________________________________________________________________________________
__________________________________________________________________________________________
11

__________________________________________________________________________________________
__________________________________________________________________________________________
__________________________________________________________________________________________
__________________________________________________________________________________________
__________________________________________________________________________________________
__________________________________________________________________________________________
__________________________________________________________________________________________
__________________________________________________________________________________________
__________________________________________________________________________________________
__________________________________________________________________________________________
__________________________________________________________________________________________
__________________________________________________________________________________________
____________________
12

Model Answer: Sports played at UAEU from 2000 to 2008
Directions – Fill in the missing words. The first letter of each word has been given for
you.
T___________ b___________ g___________ s___________ t___________ n___________
o___________ students at UAE University who played three sports, w___________ w___________
football, tennis and badminton between 2000 and 2008. A___________ a___________ o___________
t___________ the number of students who participated in football and badminton decreased,
w___________ the number of students who played tennis increased o___________ t___________ 9
year p___________.
L___________ a___ the number of UAEU students who played football, i___________
i___________ c___________ t___________ s___________ t___________ i___________ fell o___________
t___________ p___________. It s___________ a___________ about 85 in 2000, a__________ t___________
the f___________ rose steadily to around 110 in 2004. N___________, t___________ w___ a slight drop
to approximately 105 in 2005. A___________ t___________, it peaked a___________ 140 i___________
2006. F___________, it declined dramatically to just under 60, w___________ w___________
t___________ l___________ in the 9 years.
S___________, the number of students who enjoyed badminton dropped d___________
t___________ s___________ 9 years. In 2000, i___________ b___________ a___________ 40, before falling
rapidly to 10 in 2001. From 2001 to 2003, it rose slightly to 20. F___________ t___________,
t___________ w___________ a sharp climb to around 65 in 2004, a___________ w___________ it
decreased moderately to 20 in 2007 and remained constant to 2008.
U___________ the number of students who played football and badminton, t___________
w___________ a___________ o___________ climb i___________ the number of students who
participated in tennis. The figure s___________ a___________ 40 in 2000, a___________ w___________
it fluctuated upwards to about 68 in 2005, w___________ w___________ t___________ h___________ in
13

the period. Then it fell slightly to approximately 58 in 2006. F___________, between 2006 and
2008, t___________ n___________ stayed the same.
14
Model Answer: Sports played at UAEU from 2000 to 2008
Teachers’ Answers
The bar graph shows the number of students at UAE University who played three
sports, which were football, tennis and badminton between 2000 and 2008. As an overall
trend the number of students who participated in football and badminton decreased,
while the number of students who played tennis increased over the 9 year period.
Looking at the number of UAEU students who played football, it is clear to see that
it fell over the period. It stood at about 85 in 2000, and then the figure rose steadily to
around 110 in 2004. Next, there was a slight drop to approximately 105 in 2005. After
that, it peaked at 140 in 2006. Finally, it declined dramatically to just under 60, which
was the lowest in the 9 years.
Similarly, the number of students who enjoyed badminton dropped during the
same 9 years. In 2000, it began at 40, before falling rapidly to 10 in 2001. From 2001 to
2003, it rose slightly to 20. Following this, there was a sharp climb to around 65 in 2004,
after which it decreased moderately to 20 in 2007 and remained constant to 2008.
Unlike the number of students who played football and badminton, there was an
overall climb in the number of students who participated in tennis. The figure started at
40 in 2000, after which it fluctuated upwards to about 68 in 2005, which was the highest
in the period. Then it fell slightly to approximately 58 in 2006. Finally, between 2006 and
2008, the number stayed the same.
15

Temporal Task 1 Practice Writing
For each of the practice tasks below, you can do any or all of the following:-
plan and write the overview write the introduction write the first sentence of each body paragraph write the full report in 20 minutes
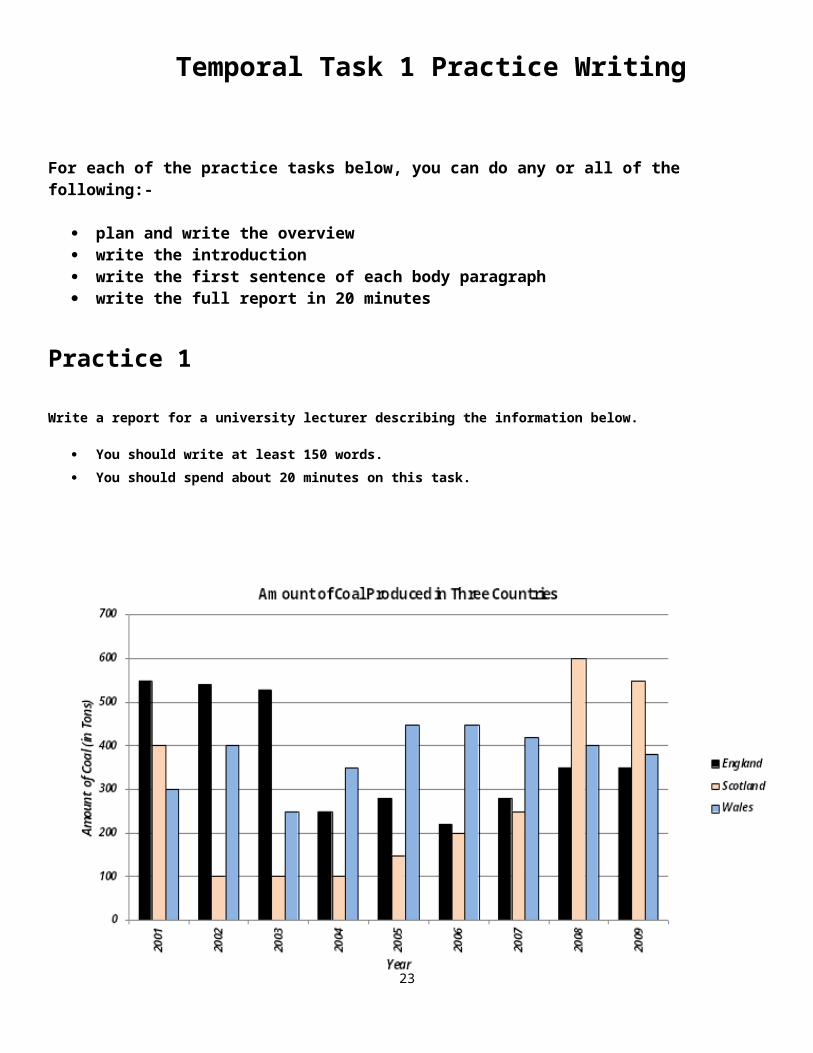
Practice 1
Write a report for a university lecturer describing the information below.
You should write at least 150 words. You should spend about 20 minutes on this task.
16

Practice 2
Write a report for a university lecturer describing the information below.
You should write at least 150 words. You should spend about 20 minutes on this task.
17

Practice 3
Write a report for a university lecturer describing the information below.
You should write at least 150 words. You should spend about 20 minutes on this task.
18

Practice 4
Write a report for a university lecturer describing the information below.
You should write at least 150 words. You should spend about 20 minutes on this task.
19

ArchivedThe bar chart below illustrates the coal produced by three countries. Summarise the information by selecting and reporting the main features, and making comparisons where relevant.
Task 8
20

You should spend about 20 minutes on this task.
The graph below shows female unemployment rates in each country of the United Kingdom in 2013 and 2014.
Summarise the information by selecting and reporting the main features, and make comparisons where relevant.
Write at least 150 words.
Task 9
You should spend about 20 minutes on this task.
The charts give information about
two genres of TV programmes watched by men and women and four different age groups in Australia.
Summarise the information by selecting and reporting the main features, and make comparisons where relevant.
Write at least 150 words.
21

Task 11
You should spend about 20 minutes on this task.
The chart shows student expenditure over a three-year period in the United Kingdom.
Summarise the information by selecting and reporting the main features, and make comparisons where relevant.
Write at least 150 words.
22
You should spend about 20 minutes on this task.The chart shows components of GDP in the UK from 1992 to 2000.Summarize the information by selecting and reporting the main features and make comparisons where relevant.Write at least 150 words.
Gross Domestic Product in the UK
Task 12
The graph shows estimated oil production capacity
for several Gulf countries between 1990 and 2010.
Summarise the information by selecting and reporting the main
features, and make comparisons where relevant.
You should write at least 150 words.
You should spend about 20 minutes on this task.
23
![Task-Oriented Optimal Sequencing of Visualization Charts · developing techniques to threading visualization charts into meaningful sequences. Kim et al. [25] introduced GraphScape,](https://img.pdfslide.us/doc/110x75/5f61133bf3ed7763fb2e9c52/task-oriented-optimal-sequencing-of-visualization-charts-developing-techniques-to.jpg)