Embed Size (px)
Citation preview
BAO & RSDNikhil Padmanabhan
Essential Cosmology for the Next Generation
December, 2017
BAO vs RSD• BAO uses the position of a large-scale feature; RSD uses
the shape of the power spectrum/correlation function• RSD measurements can be used to measure distances
as well as growth• AP effect (DA H). • Note that the shape of the power spectrum can be used as a
standard ruler. Loss of robustness though.
• Not limited to large scales – work to as small a scale as possible (Reid et al 2014 worked to 2.5 Mpc)
• Issues• Velocities • Bias
• There are many different formulations – we will simply consider one.
An (very) incomplete list of references• Kaiser 1987
• Fisher 1995
• Reid & White 2011
• Okumura et al 2015
• Uhlemann et al 2015
• Bianchi et al 2017
• Vlah et al 2017
• … and various references within
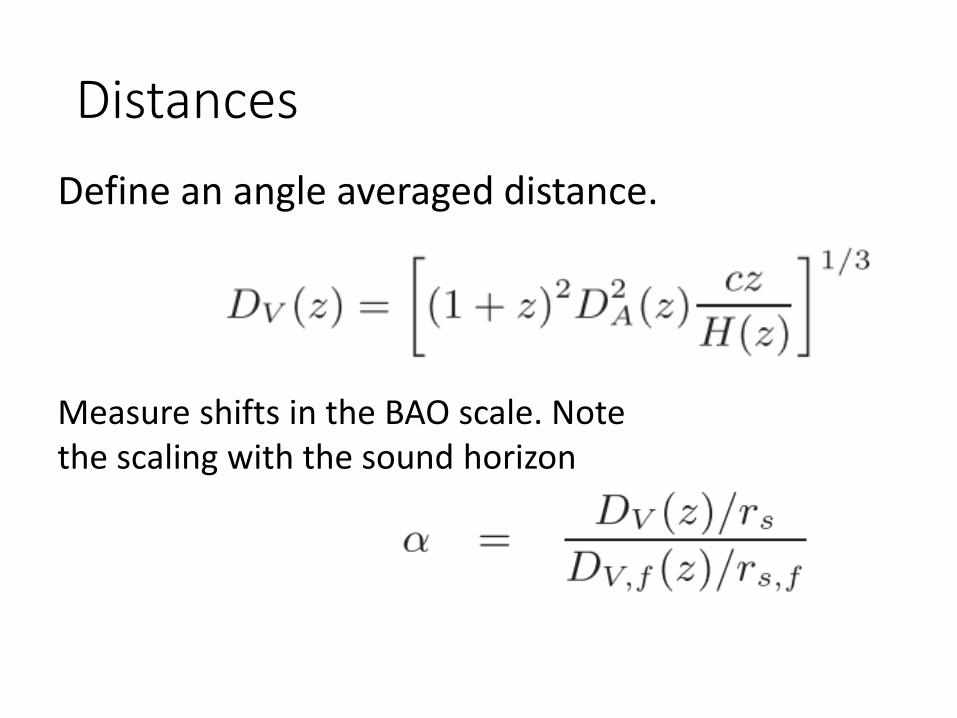
Distances
Define an angle averaged distance.
Measure shifts in the BAO scale. Note the scaling with the sound horizon
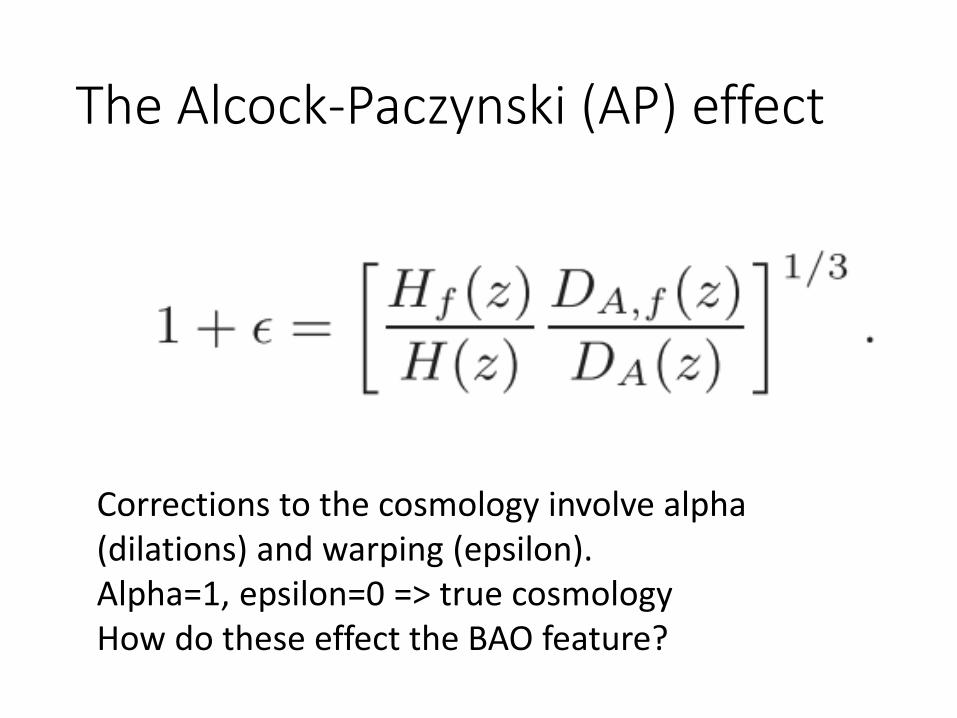
The Alcock-Paczynski (AP) effect
Corrections to the cosmology involve alpha (dilations) and warping (epsilon).Alpha=1, epsilon=0 => true cosmology How do these effect the BAO feature?
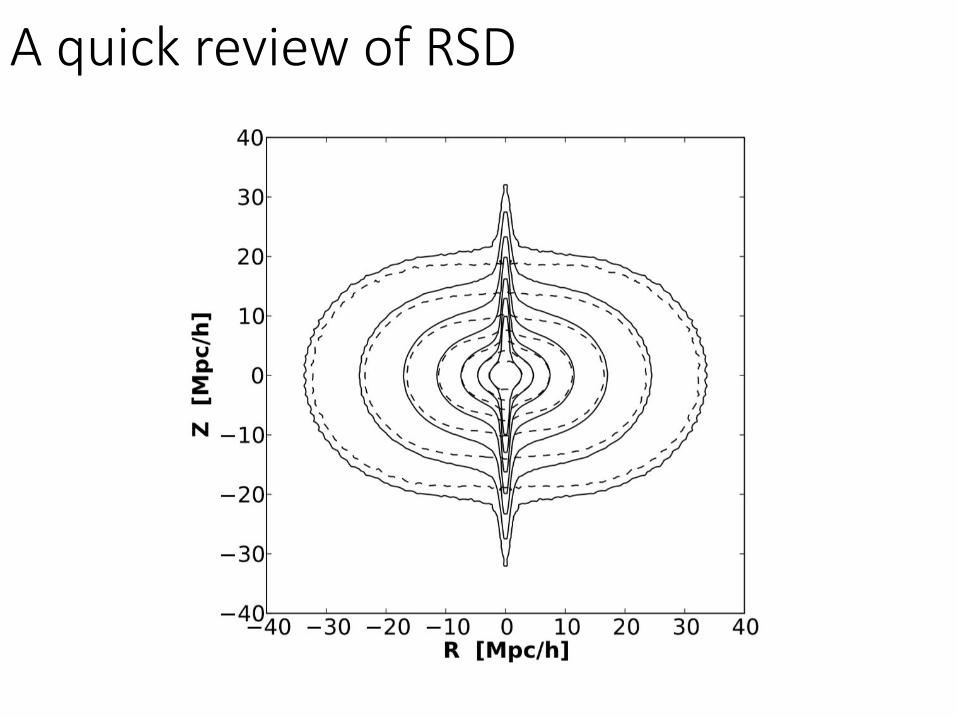
A quick review of RSD
RSD vs FoG vs Redshift Errors
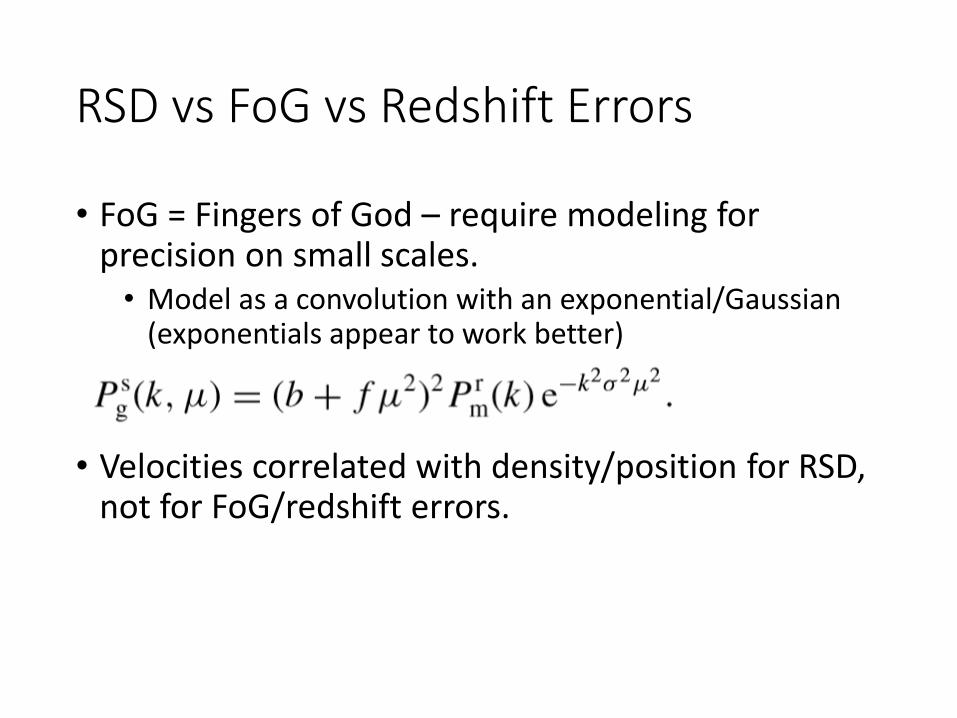
• FoG = Fingers of God – require modeling for precision on small scales.• Model as a convolution with an exponential/Gaussian
(exponentials appear to work better)
• Velocities correlated with density/position for RSD, not for FoG/redshift errors.
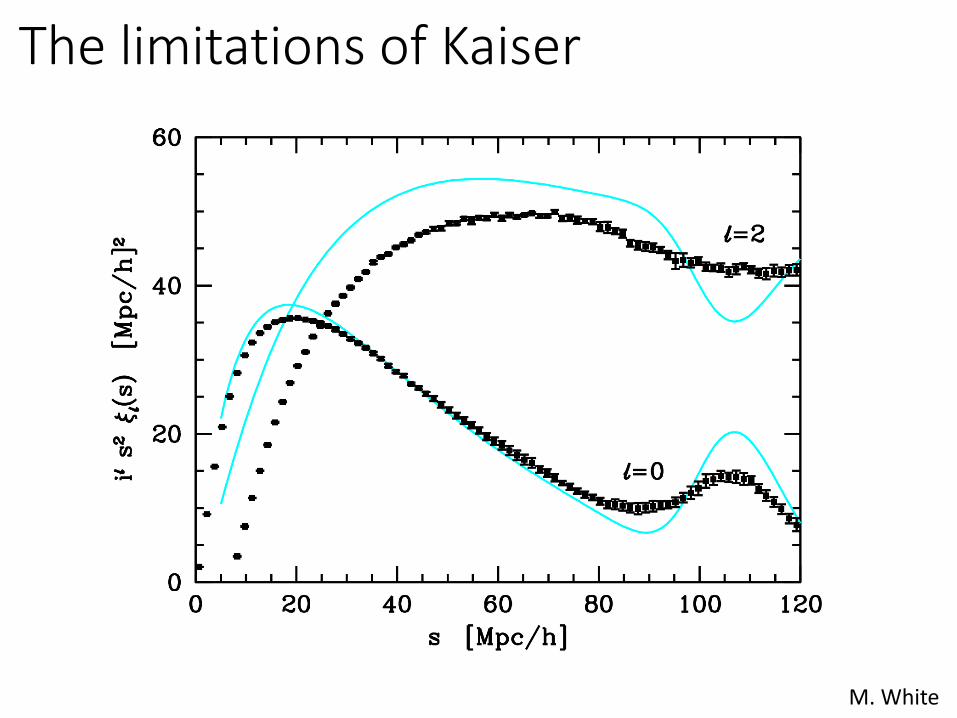
The limitations of Kaiser
M. White
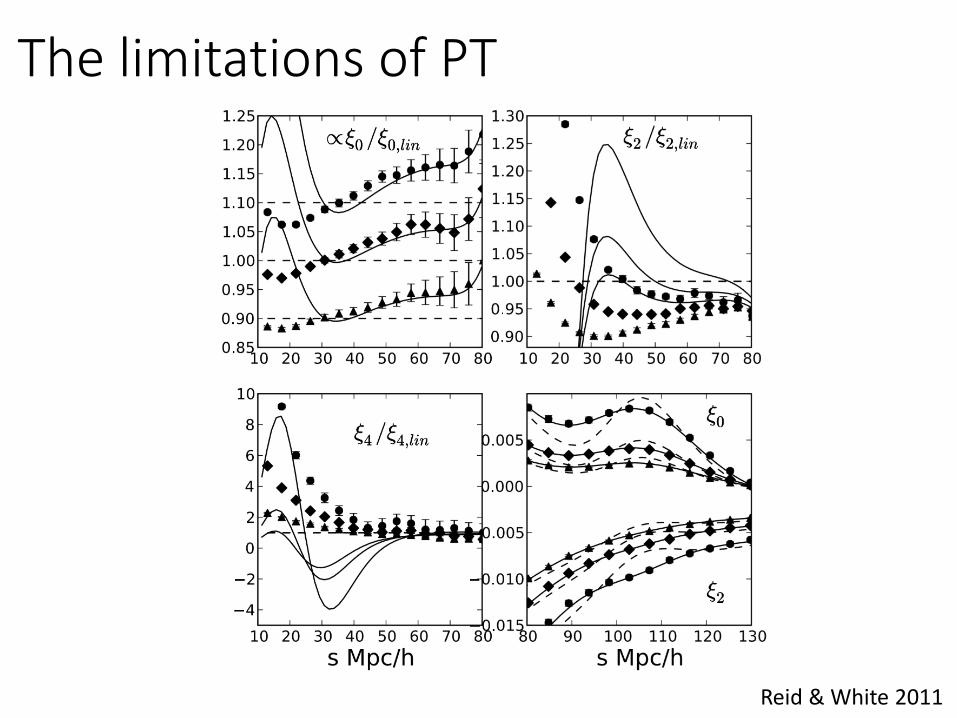
The limitations of PT
Reid & White 2011
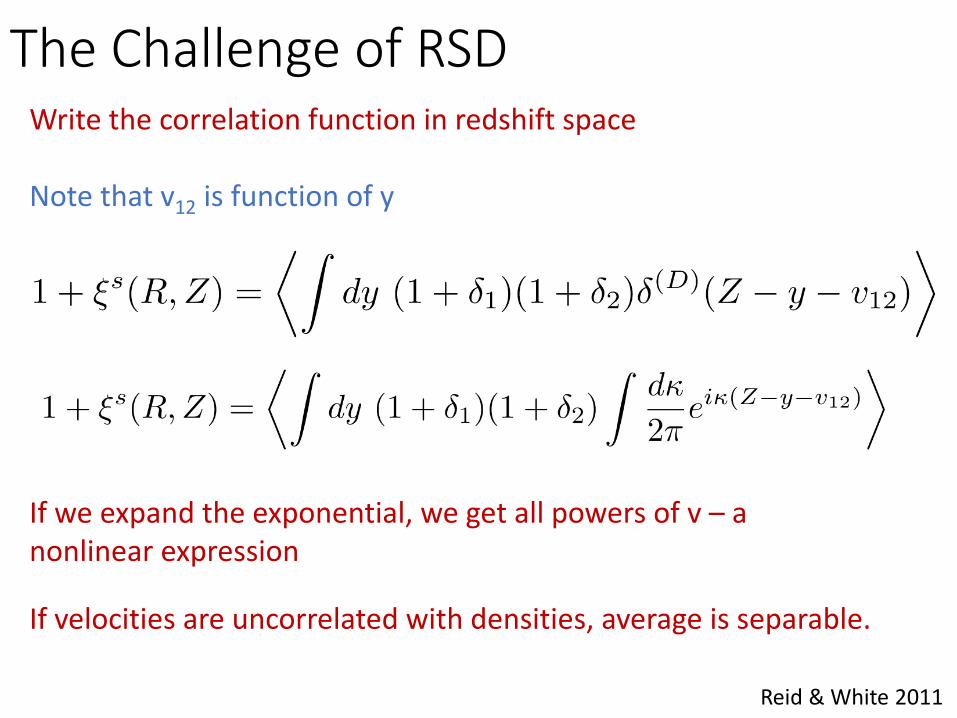
The Challenge of RSDWrite the correlation function in redshift space
Note that v12 is function of y
If we expand the exponential, we get all powers of v – a nonlinear expression
Reid & White 2011
If velocities are uncorrelated with densities, average is separable.
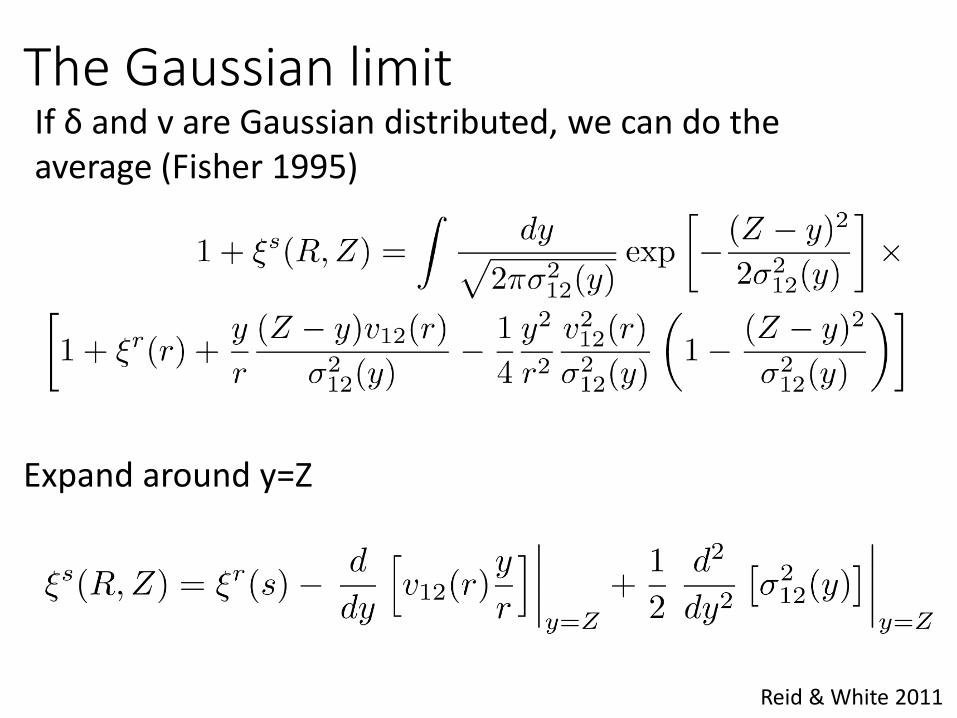
The Gaussian limitIf δ and v are Gaussian distributed, we can do the average (Fisher 1995)
Expand around y=Z
Reid & White 2011
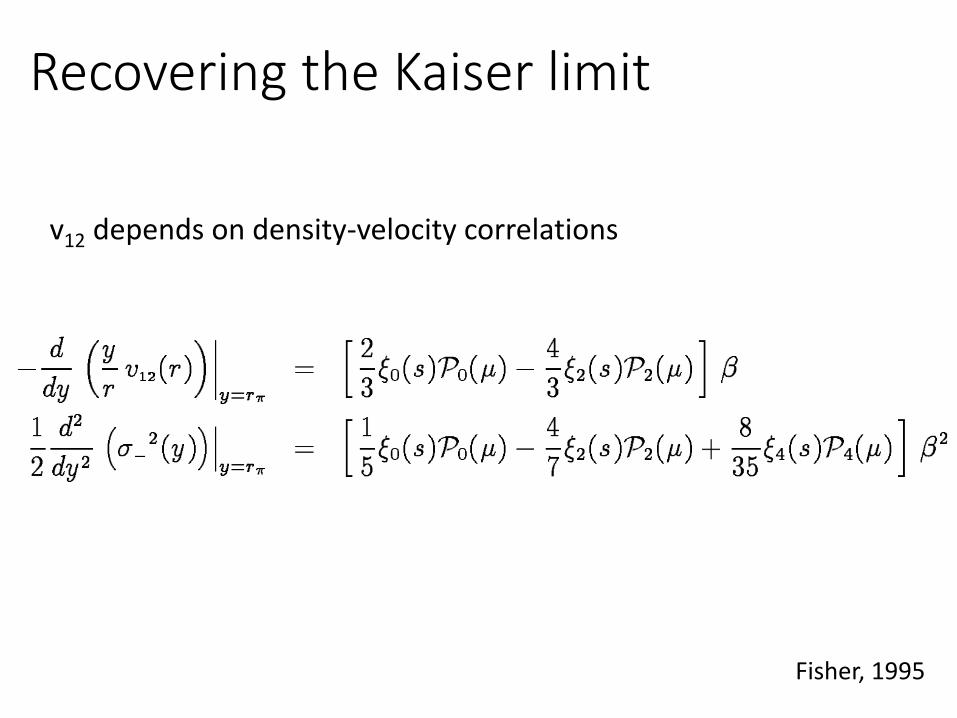
Recovering the Kaiser limit
v12 depends on density-velocity correlations
Fisher, 1995
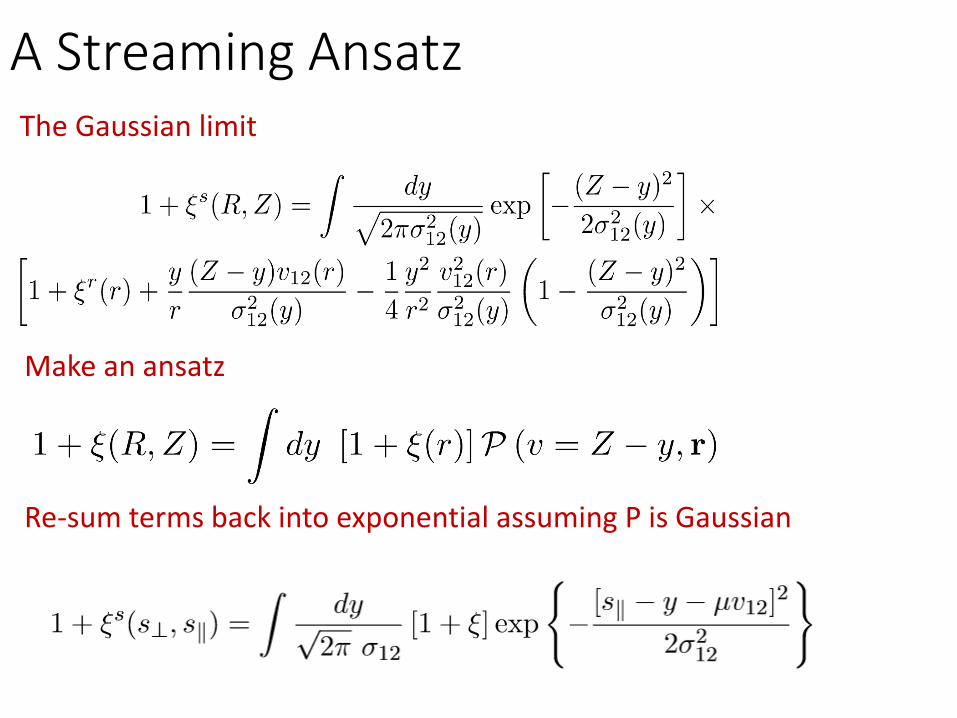
A Streaming Ansatz
Re-sum terms back into exponential assuming P is Gaussian
Make an ansatz
The Gaussian limit
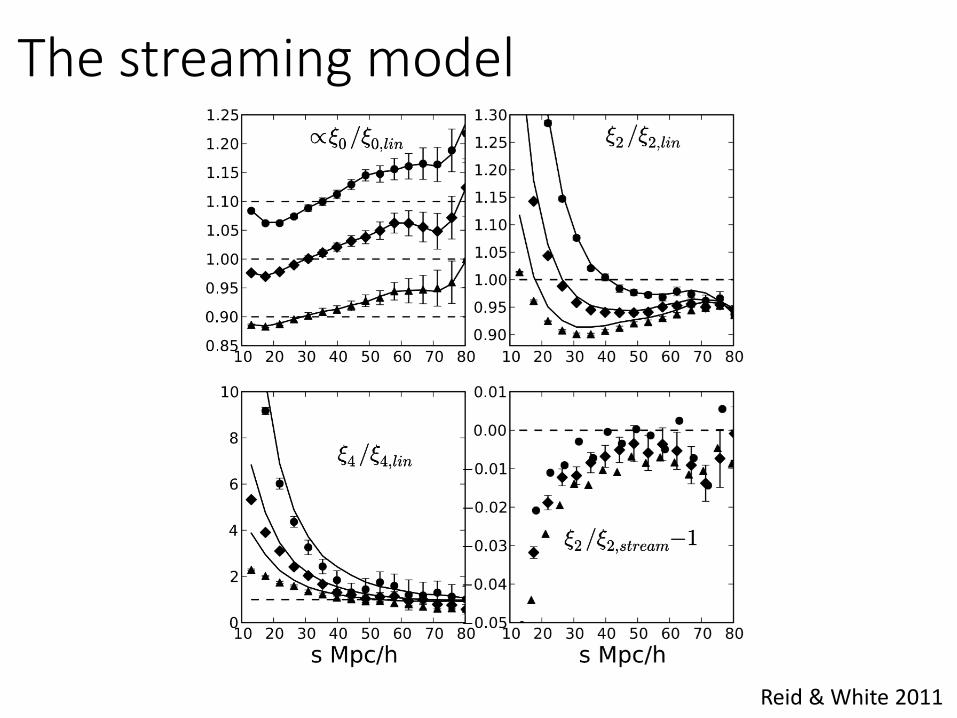
The streaming model
Reid & White 2011
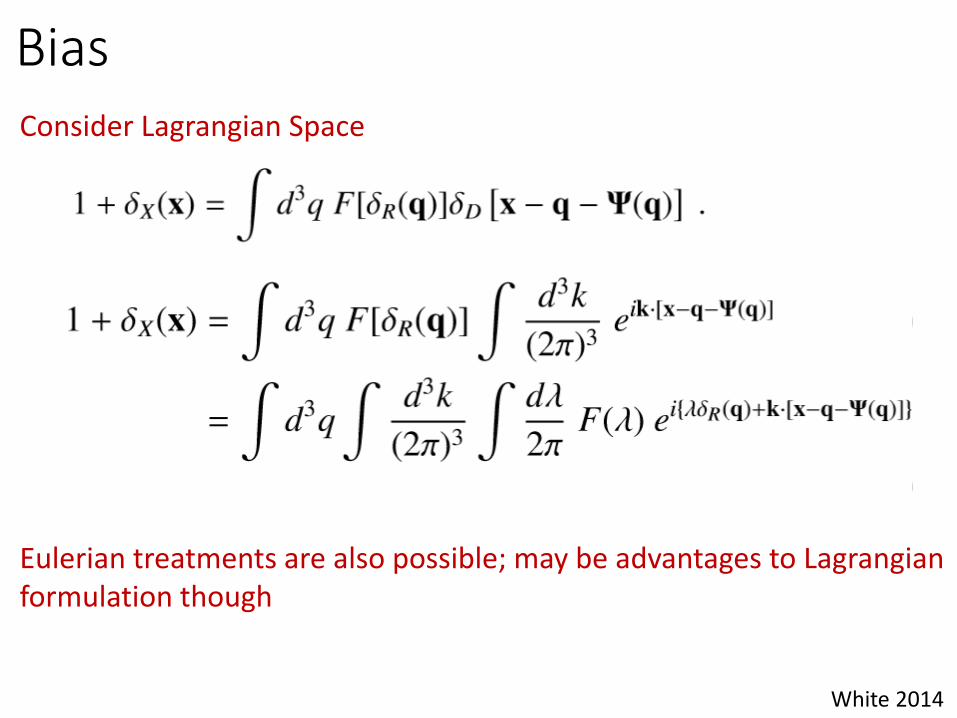
BiasConsider Lagrangian Space
White 2014
Eulerian treatments are also possible; may be advantages to Lagrangianformulation though
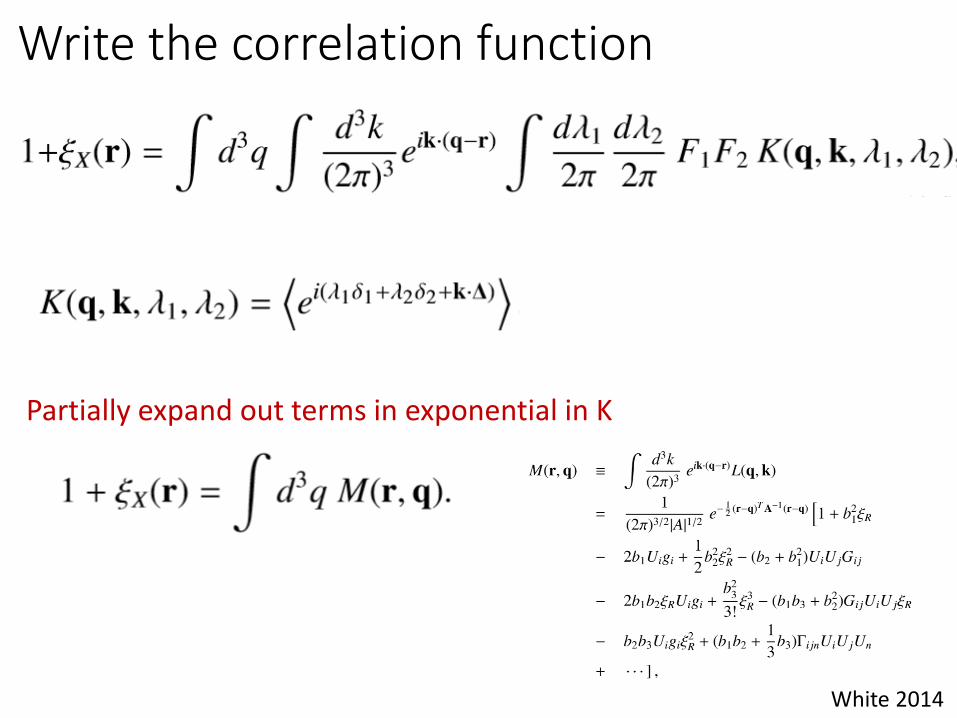
Write the correlation function
Partially expand out terms in exponential in K
White 2014
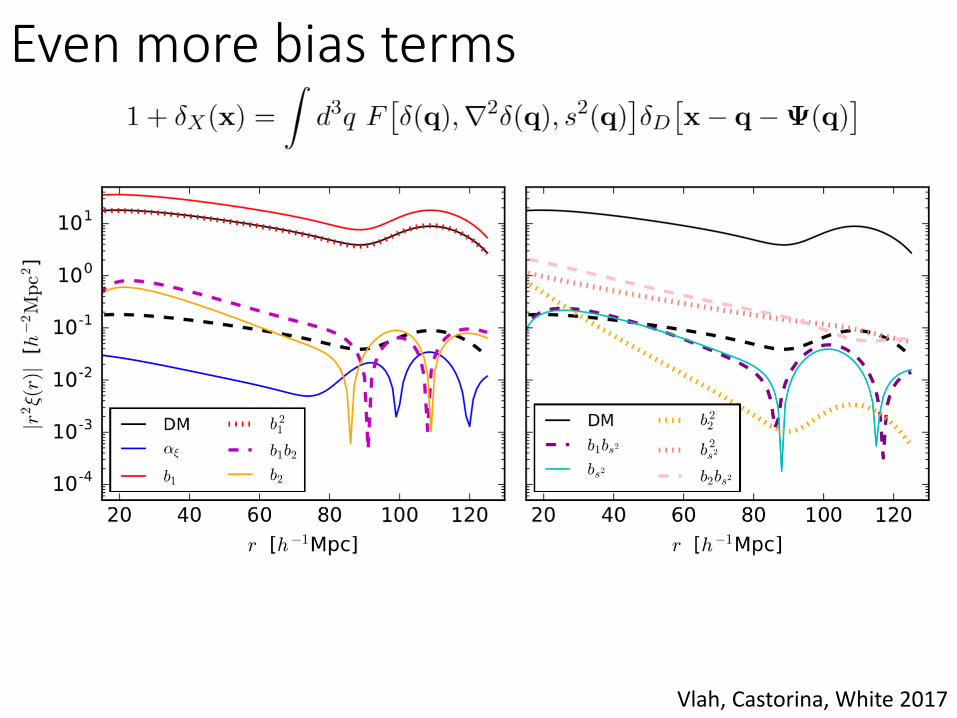
Even more bias terms
Vlah, Castorina, White 2017
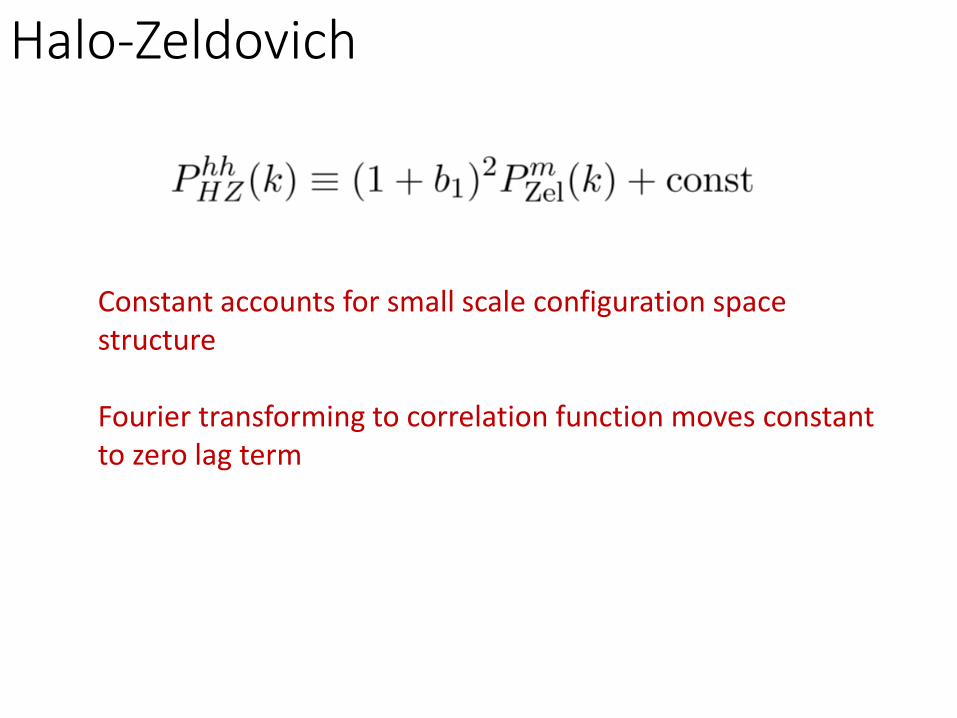
Halo-Zeldovich
Constant accounts for small scale configuration space structure
Fourier transforming to correlation function moves constant to zero lag term
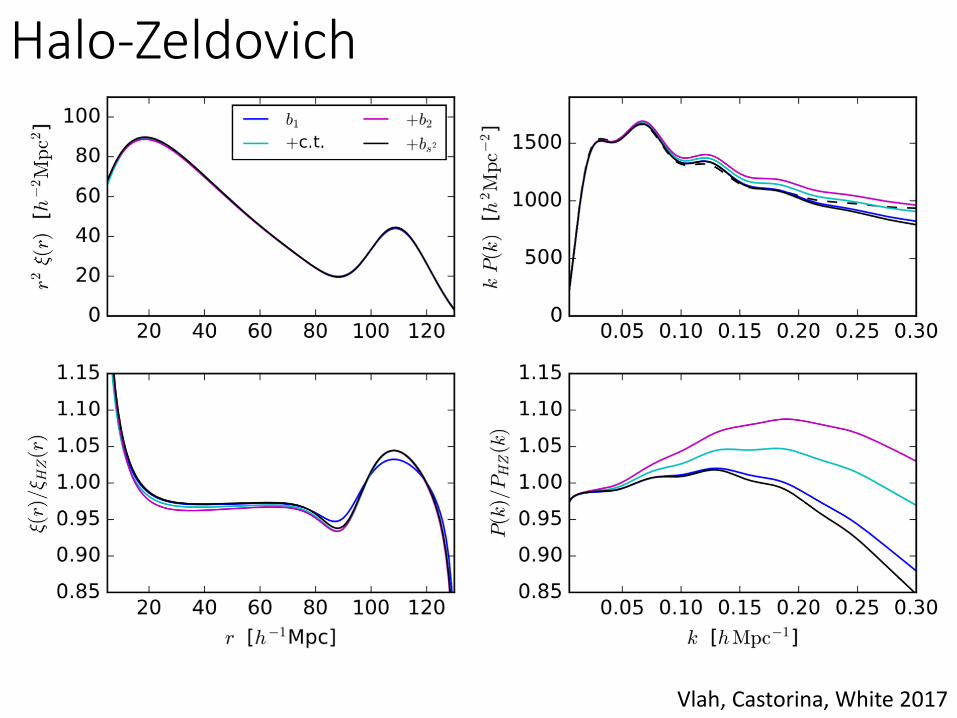
Halo-Zeldovich
Vlah, Castorina, White 2017
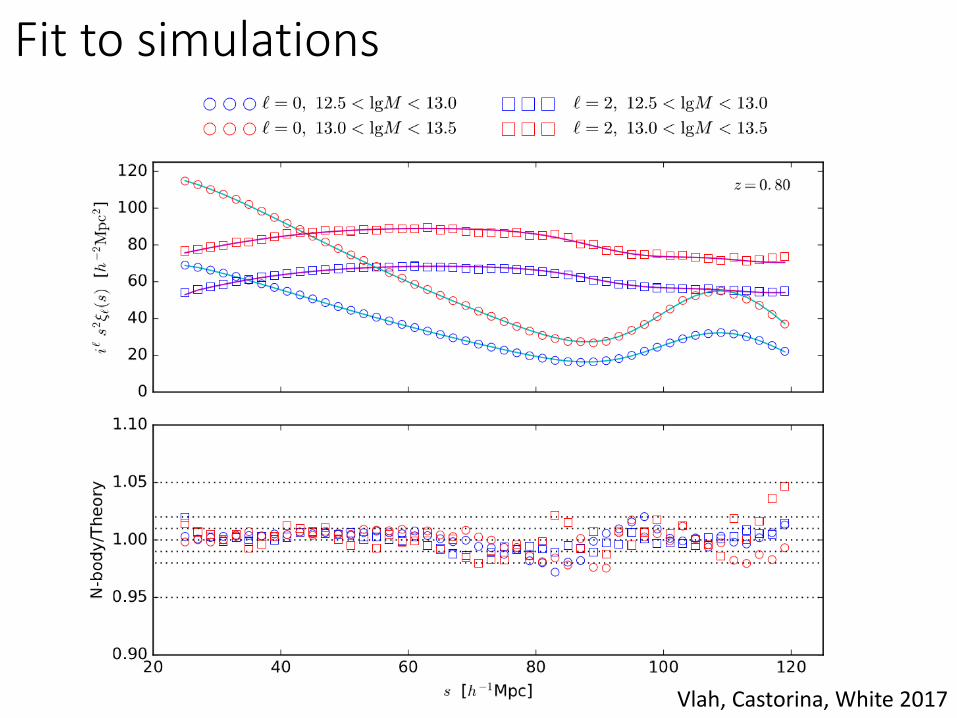
Fit to simulations
Vlah, Castorina, White 2017
Forecasting
Seo & Eisenstein, 2007
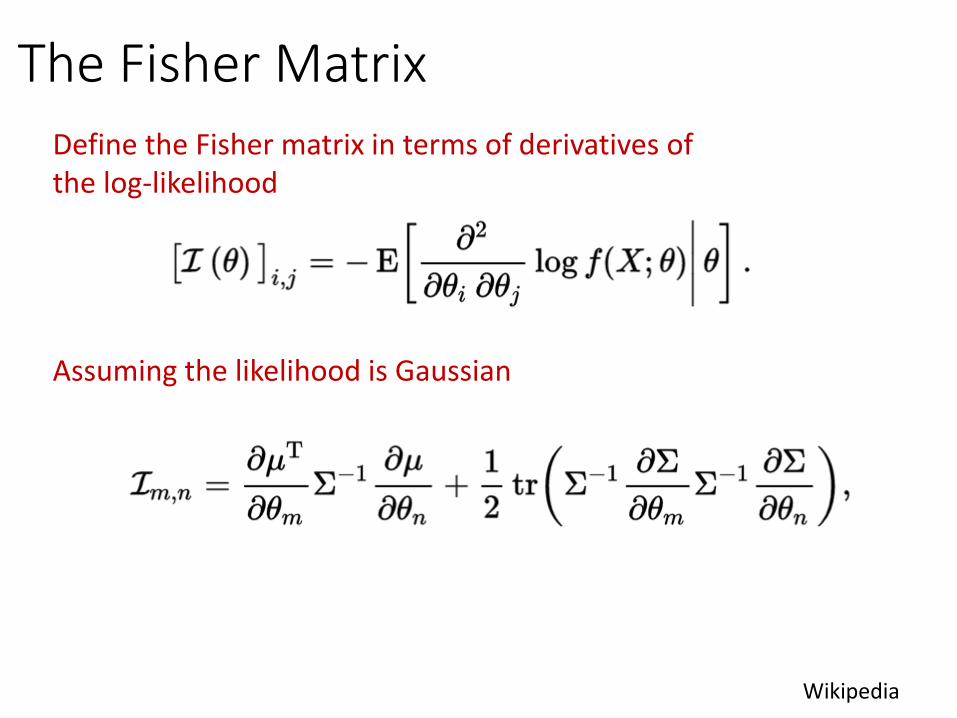
The Fisher Matrix
Wikipedia
Define the Fisher matrix in terms of derivatives of the log-likelihood
Assuming the likelihood is Gaussian
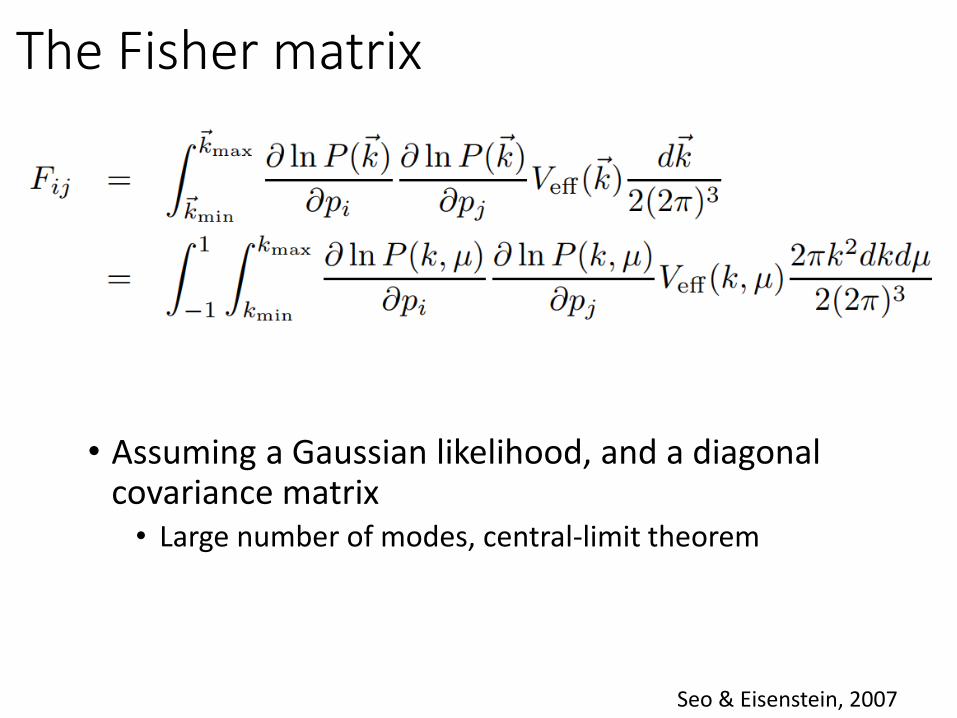
The Fisher matrix
• Assuming a Gaussian likelihood, and a diagonal covariance matrix• Large number of modes, central-limit theorem
Seo & Eisenstein, 2007
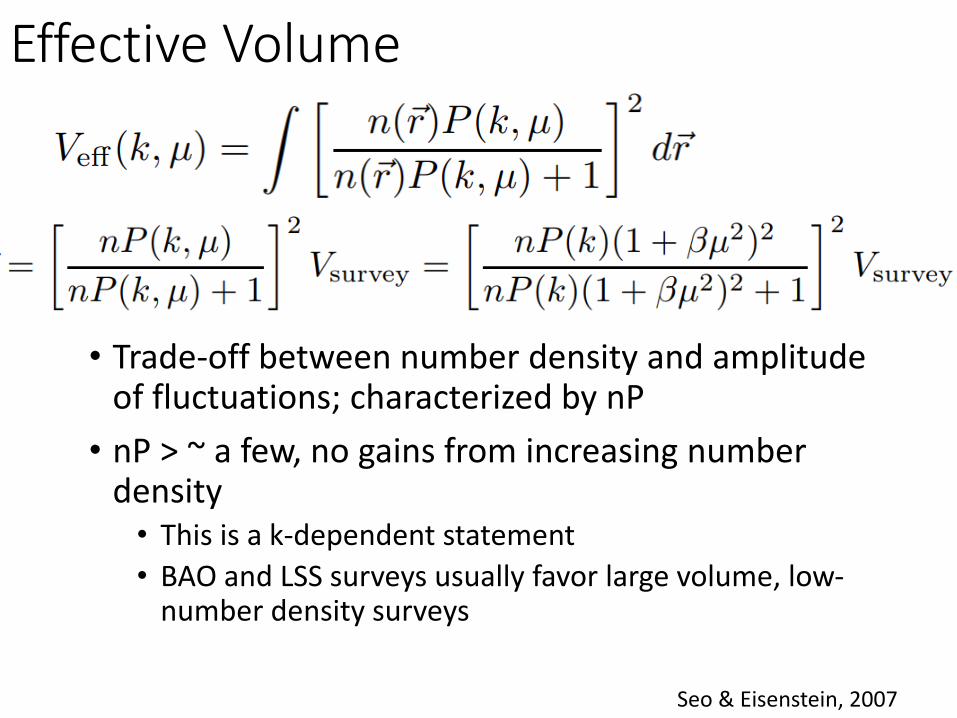
Effective Volume
• Trade-off between number density and amplitude of fluctuations; characterized by nP
• nP > ~ a few, no gains from increasing number density• This is a k-dependent statement
• BAO and LSS surveys usually favor large volume, low-number density surveys
Seo & Eisenstein, 2007
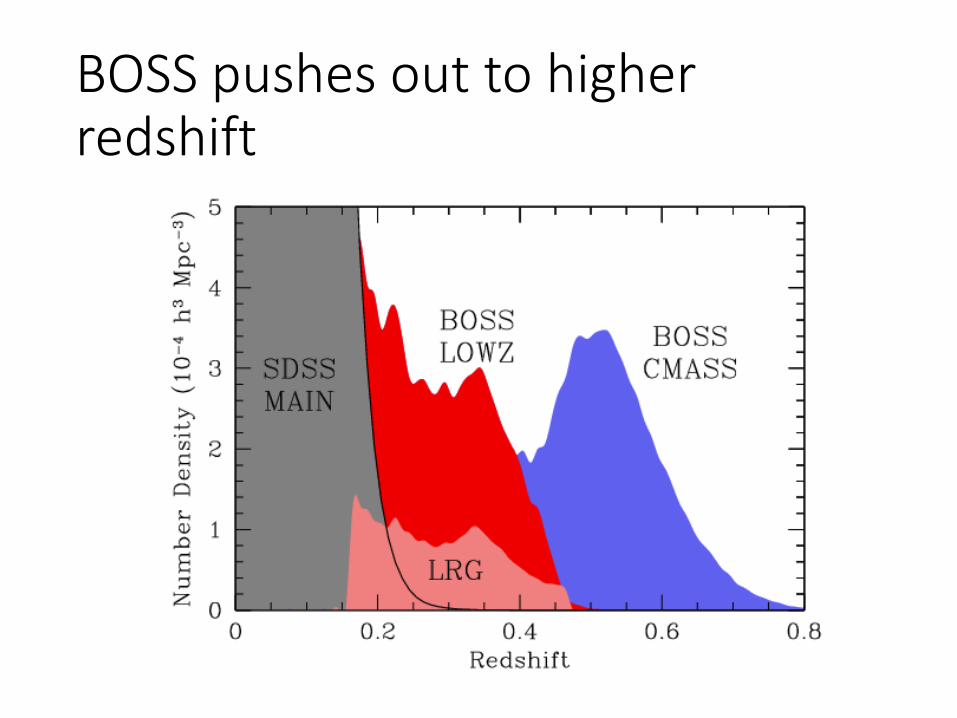
BOSS pushes out to higher redshift
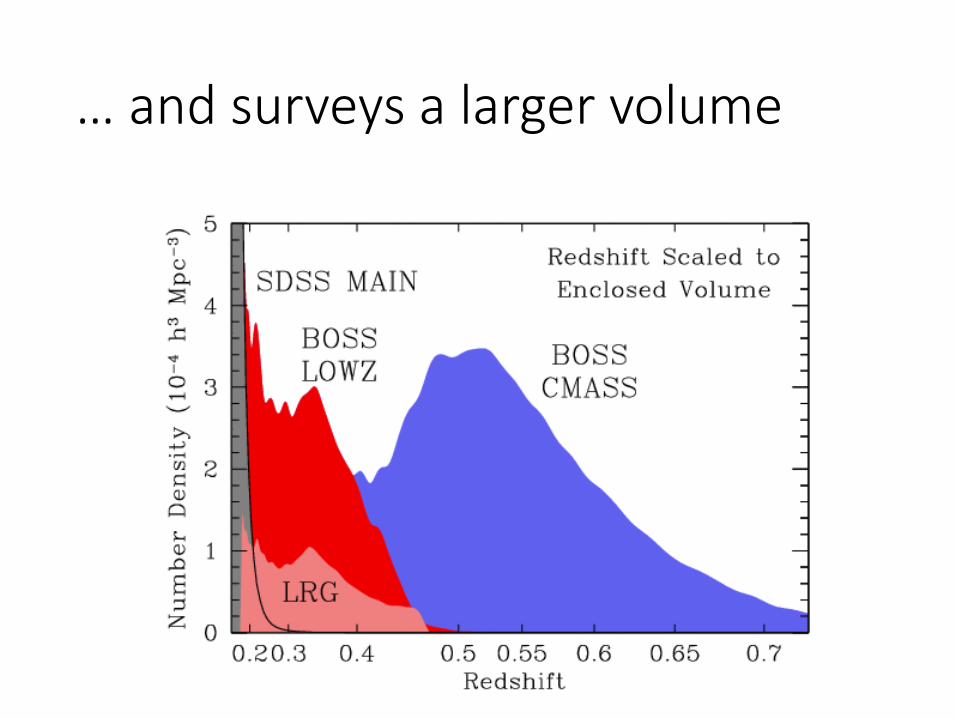
… and surveys a larger volume
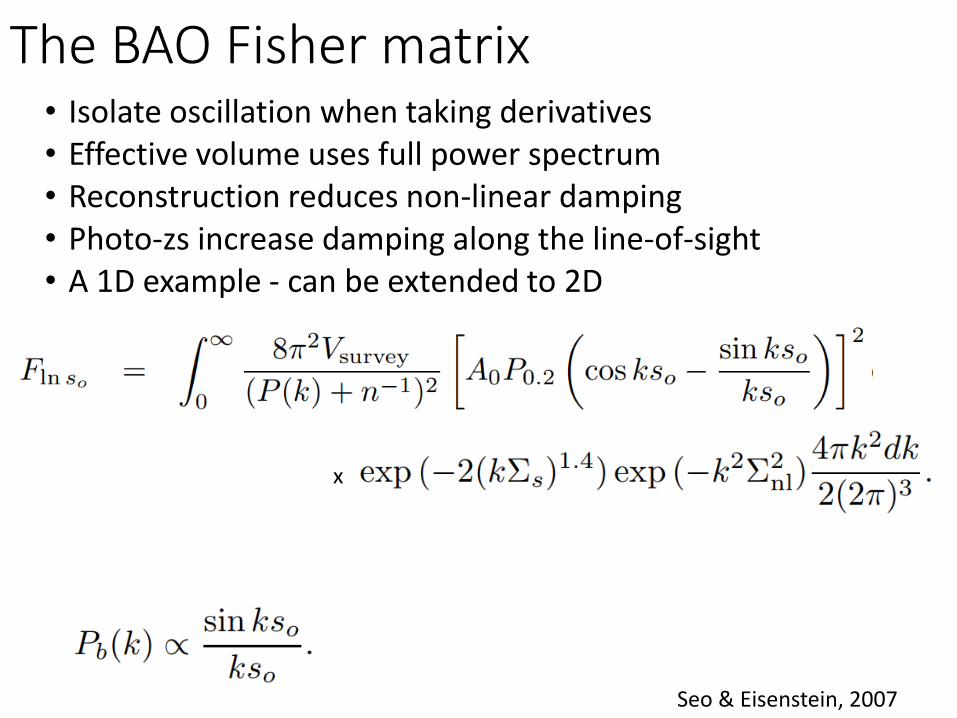
The BAO Fisher matrix• Isolate oscillation when taking derivatives• Effective volume uses full power spectrum• Reconstruction reduces non-linear damping• Photo-zs increase damping along the line-of-sight• A 1D example - can be extended to 2D
x
Seo & Eisenstein, 2007
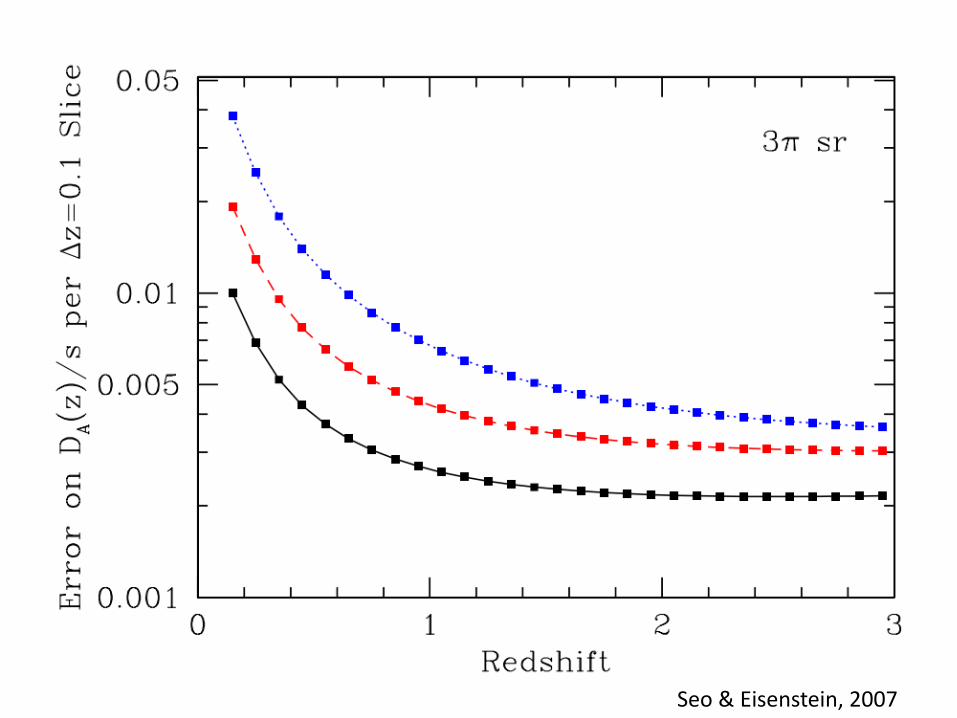
Seo & Eisenstein, 2007
A Quick Survey of (e)BOSS Results
Anderson et al, 2014
Alam et al, 2016
Aubourg et al, 2014
Ata et al, 2017
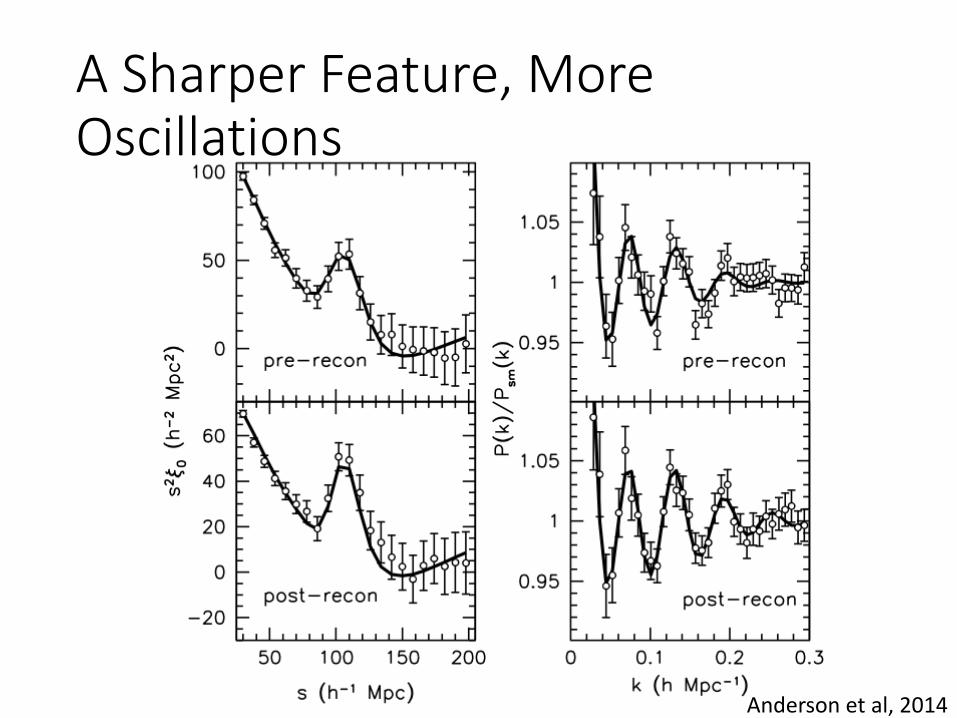
A Sharper Feature, More Oscillations
Anderson et al, 2014
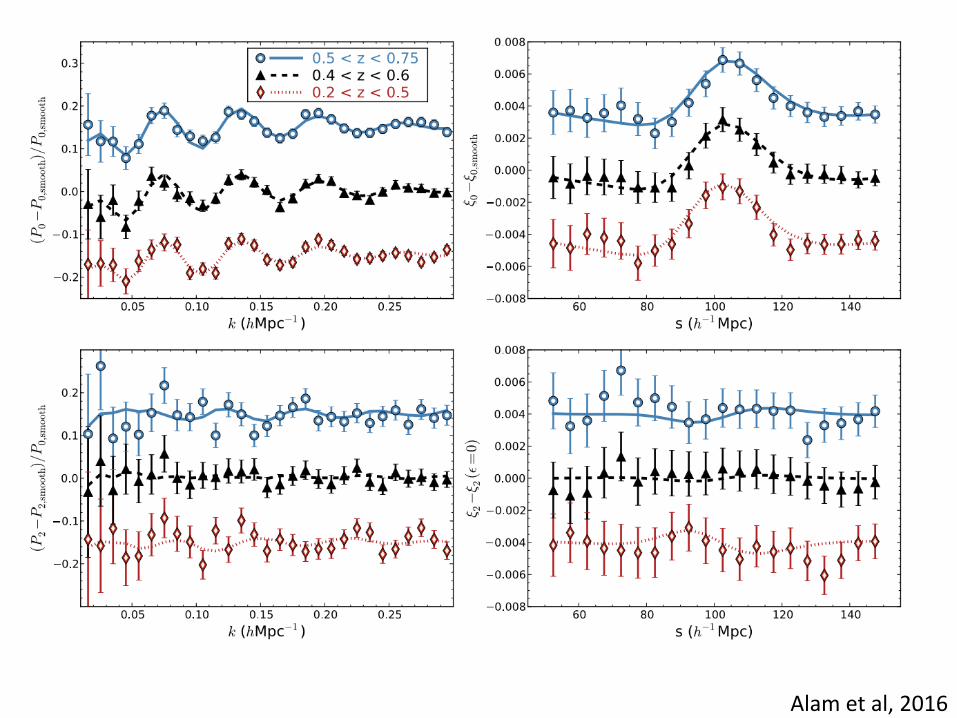
Alam et al, 2016
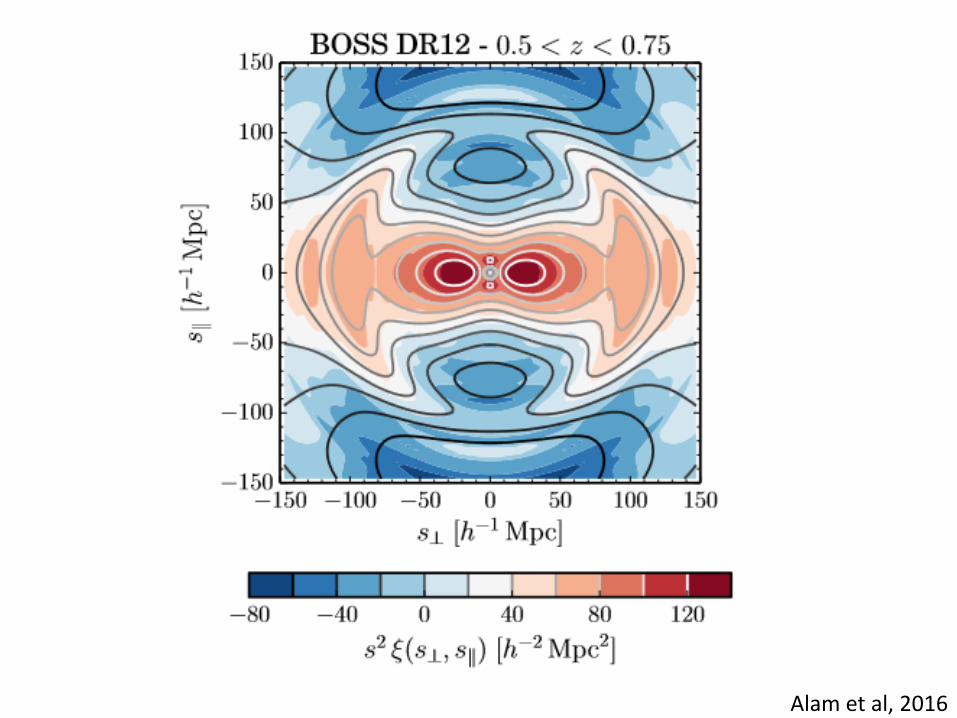
Alam et al, 2016
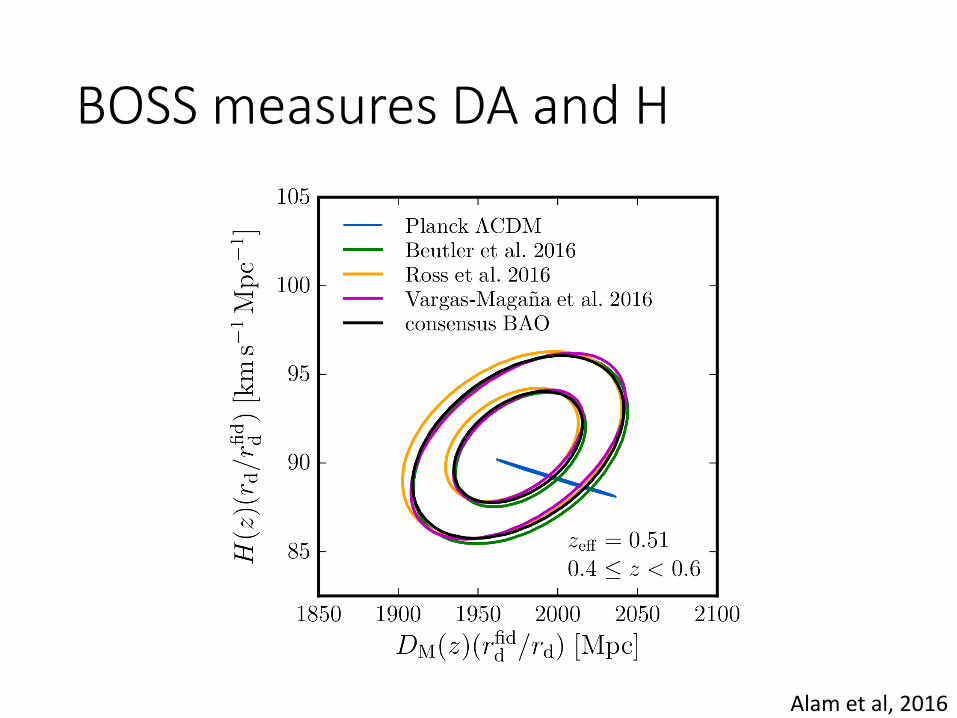
BOSS measures DA and H
Alam et al, 2016
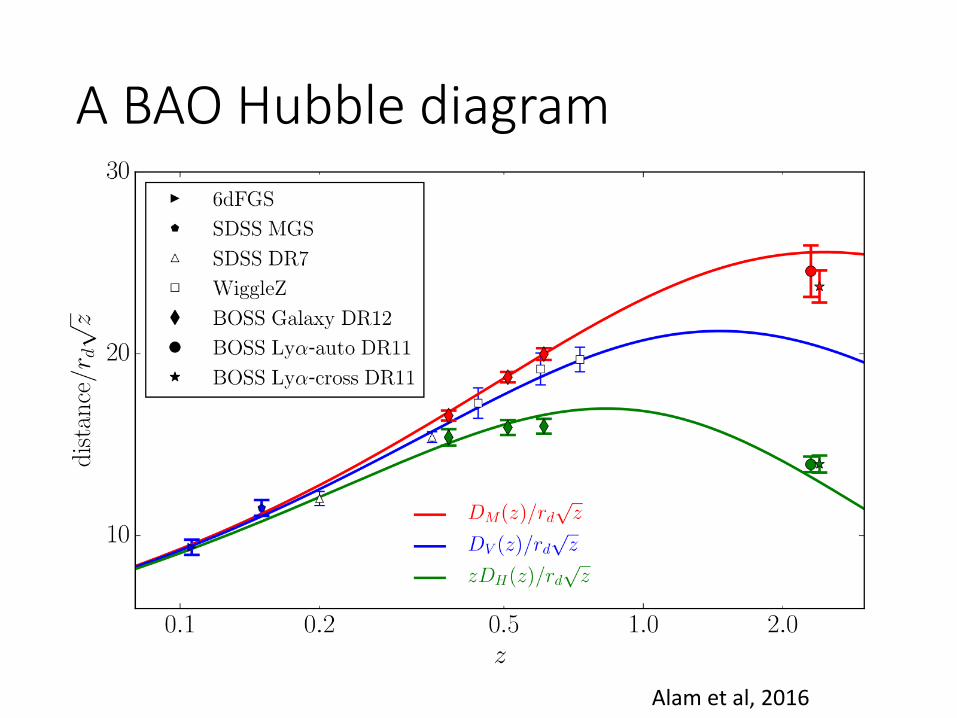
A BAO Hubble diagram
Alam et al, 2016
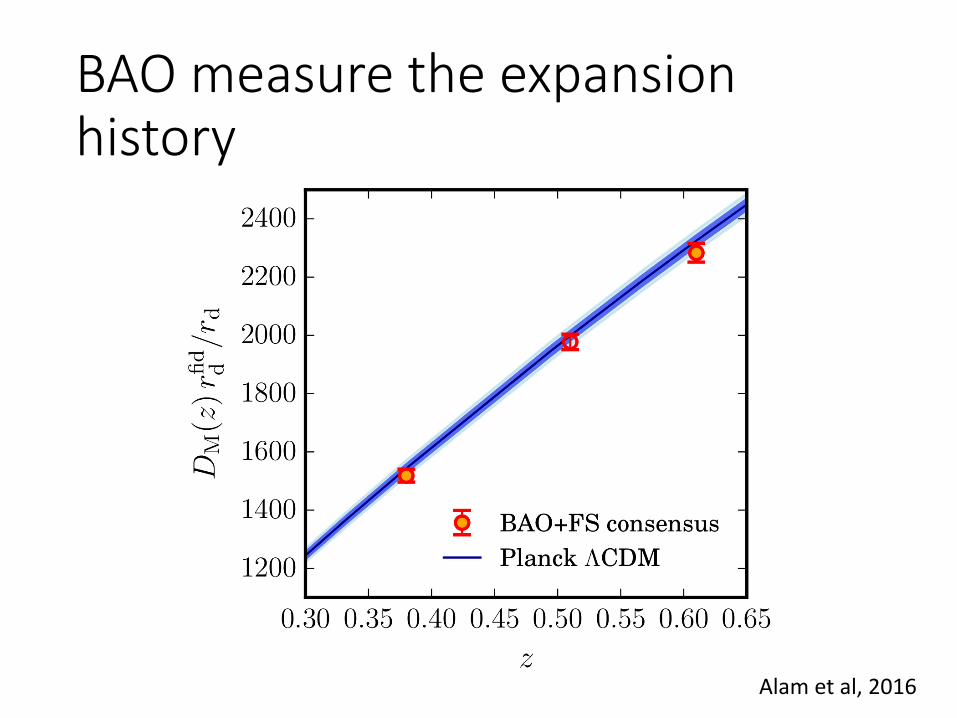
BAO measure the expansion history
Alam et al, 2016
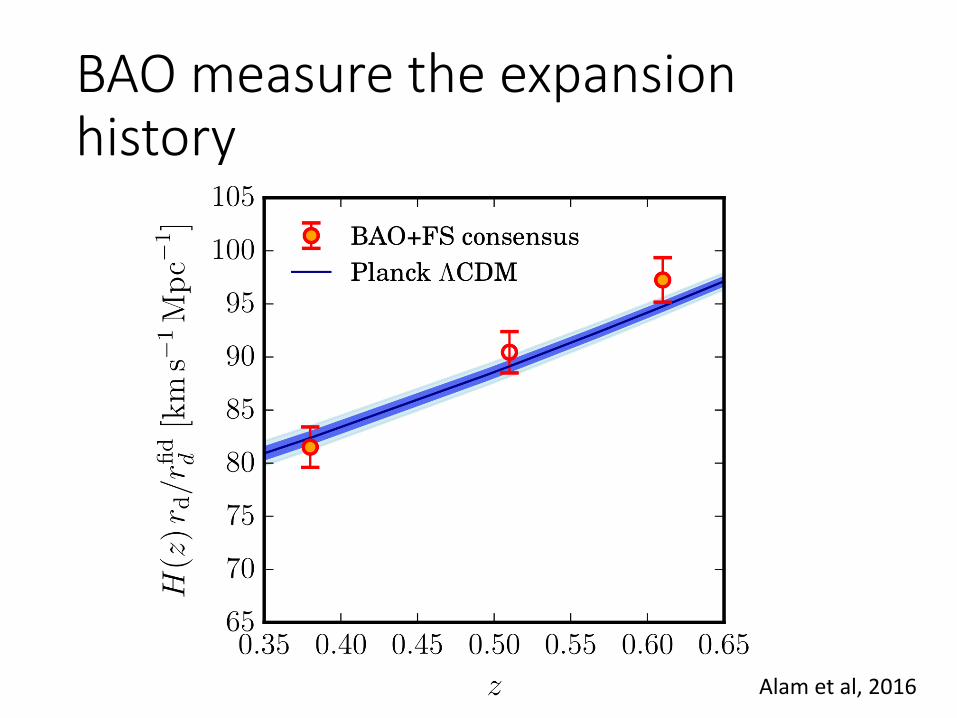
BAO measure the expansion history
Alam et al, 2016
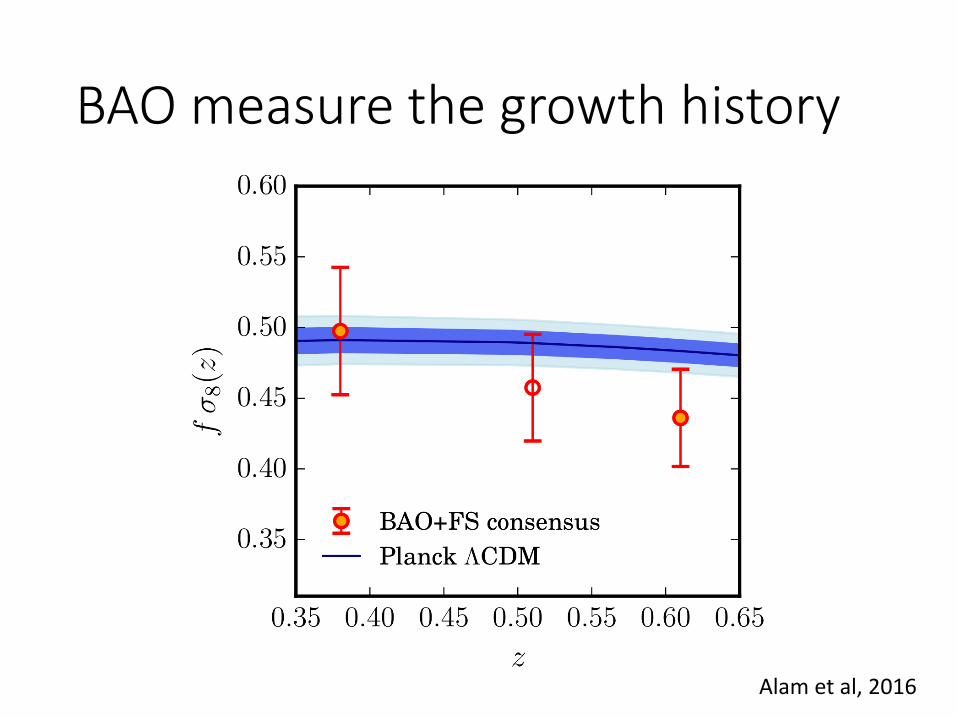
BAO measure the growth history
Alam et al, 2016
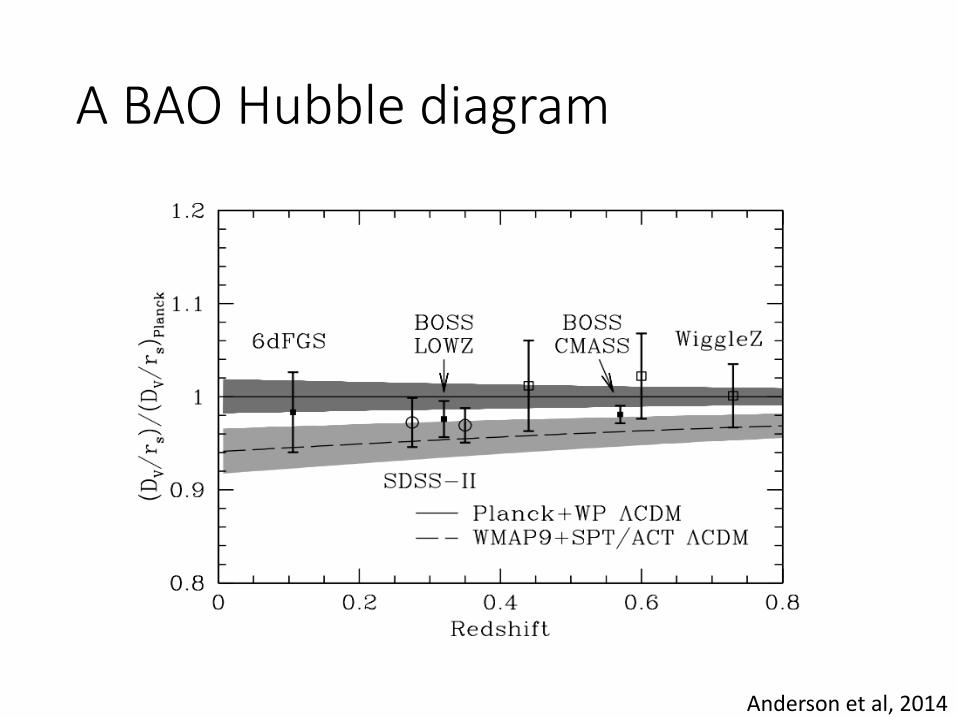
A BAO Hubble diagram
Anderson et al, 2014
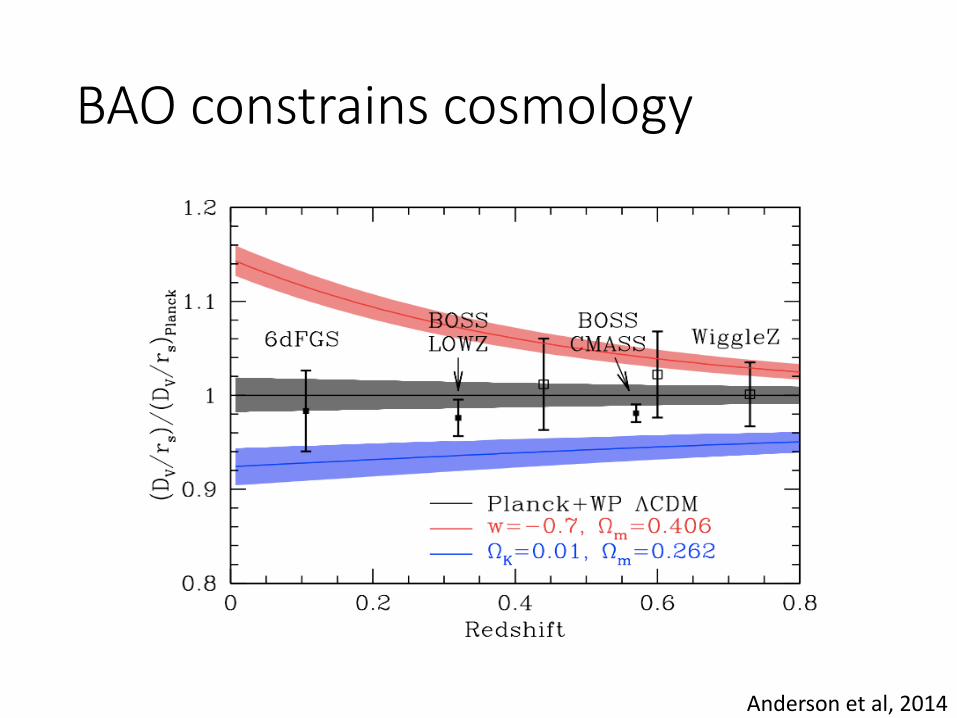
BAO constrains cosmology
Anderson et al, 2014
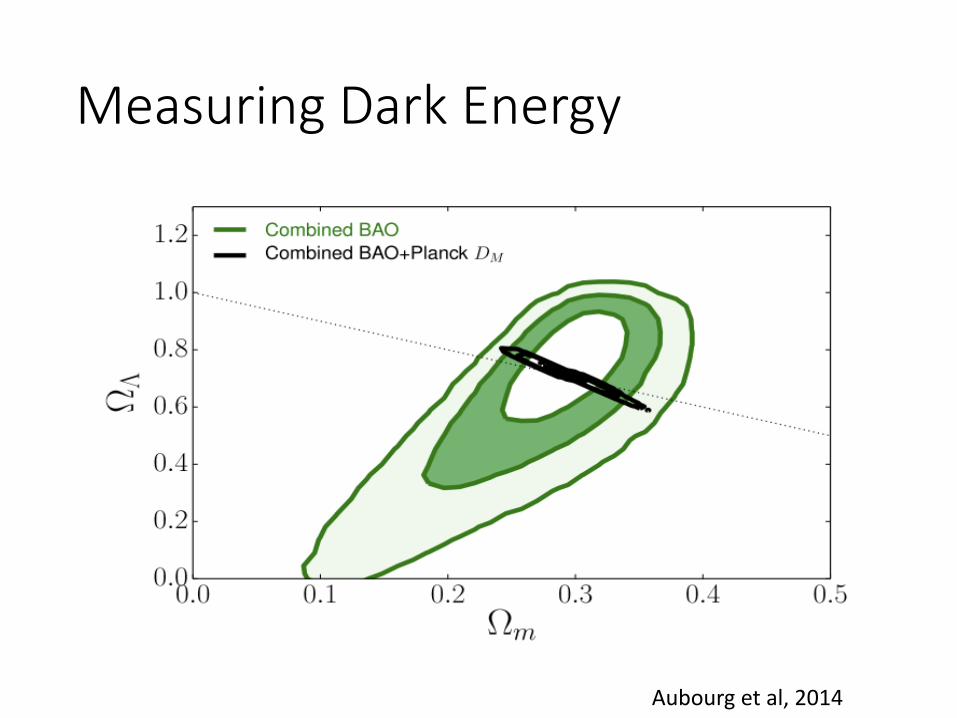
Measuring Dark Energy
Aubourg et al, 2014
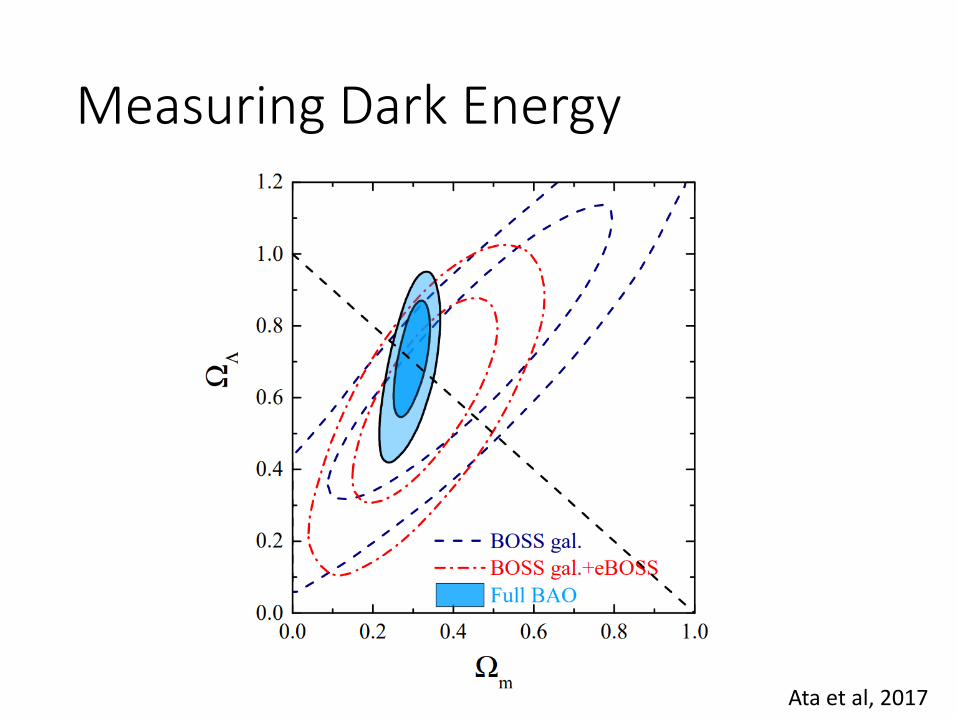
Measuring Dark Energy
Ata et al, 2017
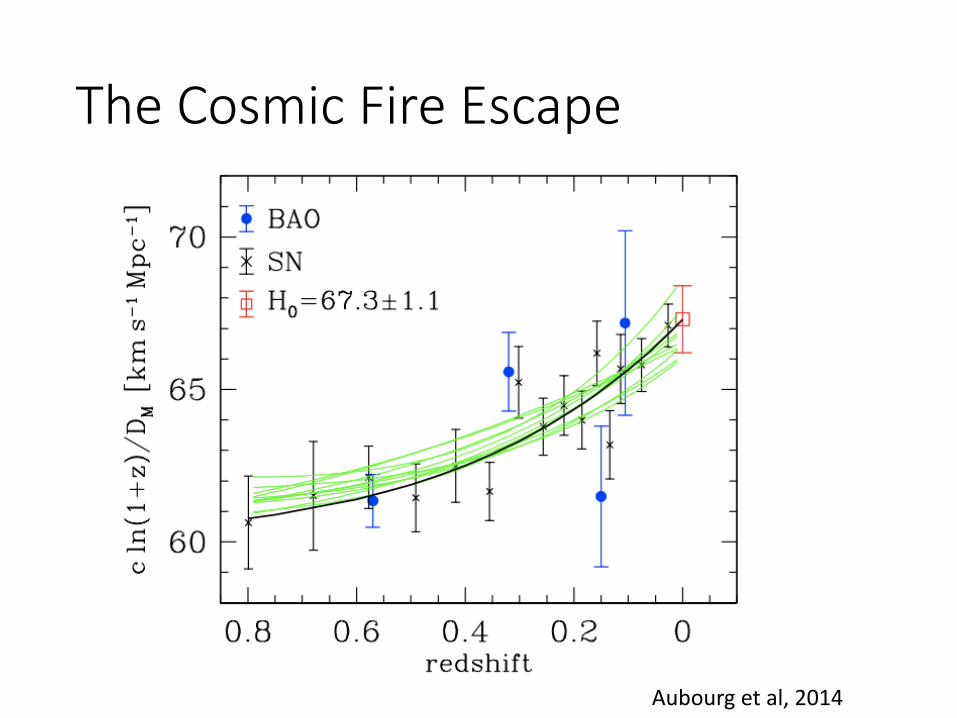
The Cosmic Fire Escape
Aubourg et al, 2014
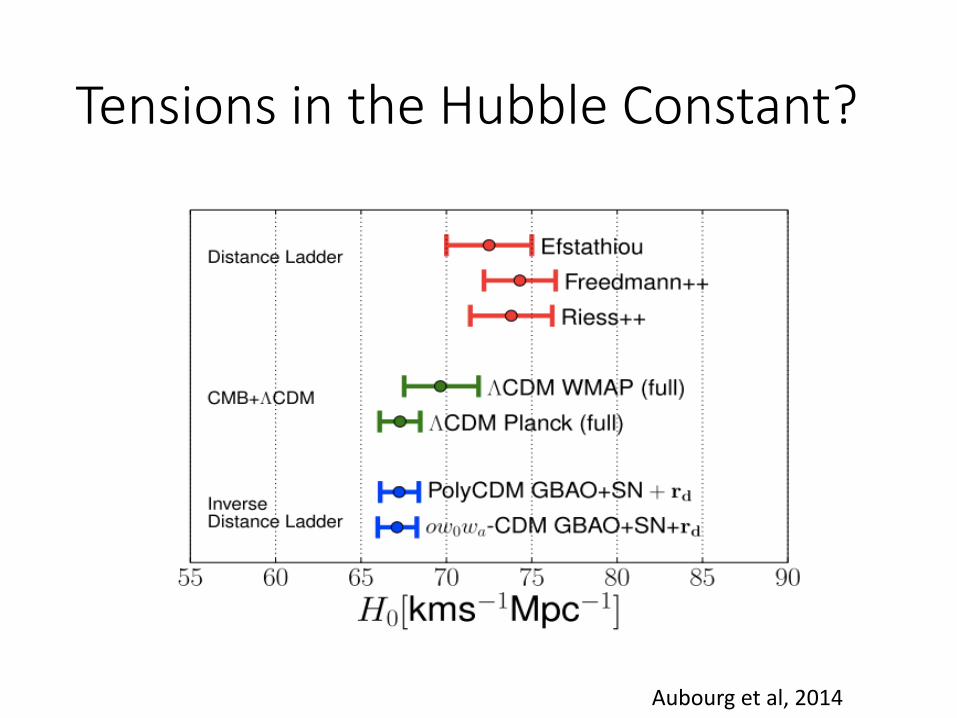
Tensions in the Hubble Constant?
Aubourg et al, 2014
A Glimpse of the Future
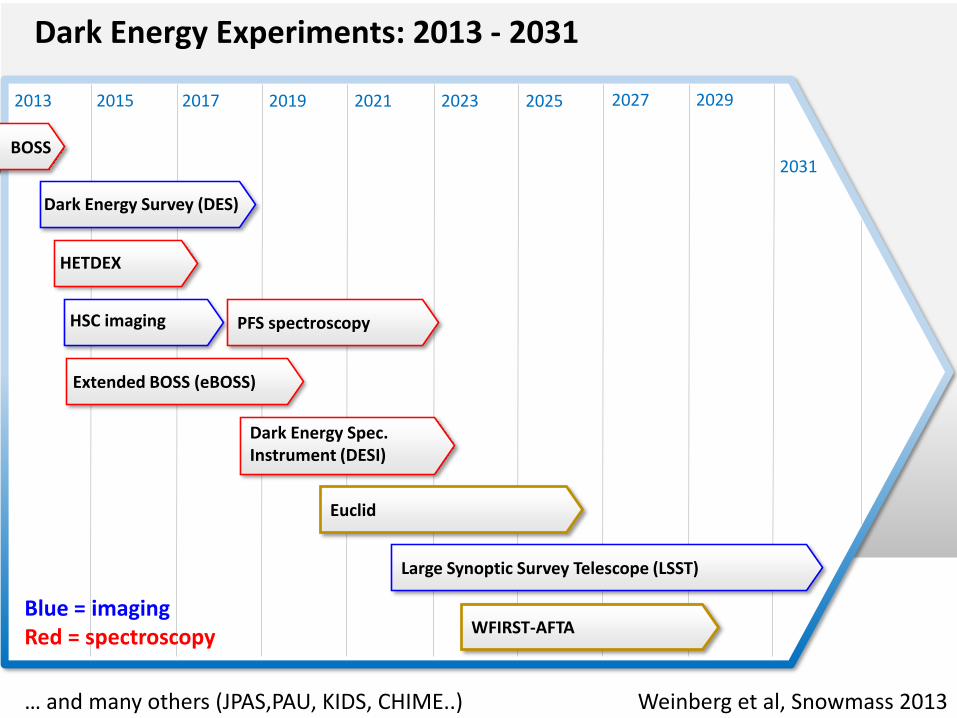
BOSS
20292027202520232021201720152013 2019
Dark Energy Experiments: 2013 - 2031
Dark Energy Survey (DES)
Extended BOSS (eBOSS)
HSC imaging PFS spectroscopy
Dark Energy Spec. Instrument (DESI)
Large Synoptic Survey Telescope (LSST)
Euclid
WFIRST-AFTA
BOSS
HETDEX
2031
Blue = imagingRed = spectroscopy
Weinberg et al, Snowmass 2013… and many others (JPAS,PAU, KIDS, CHIME..)
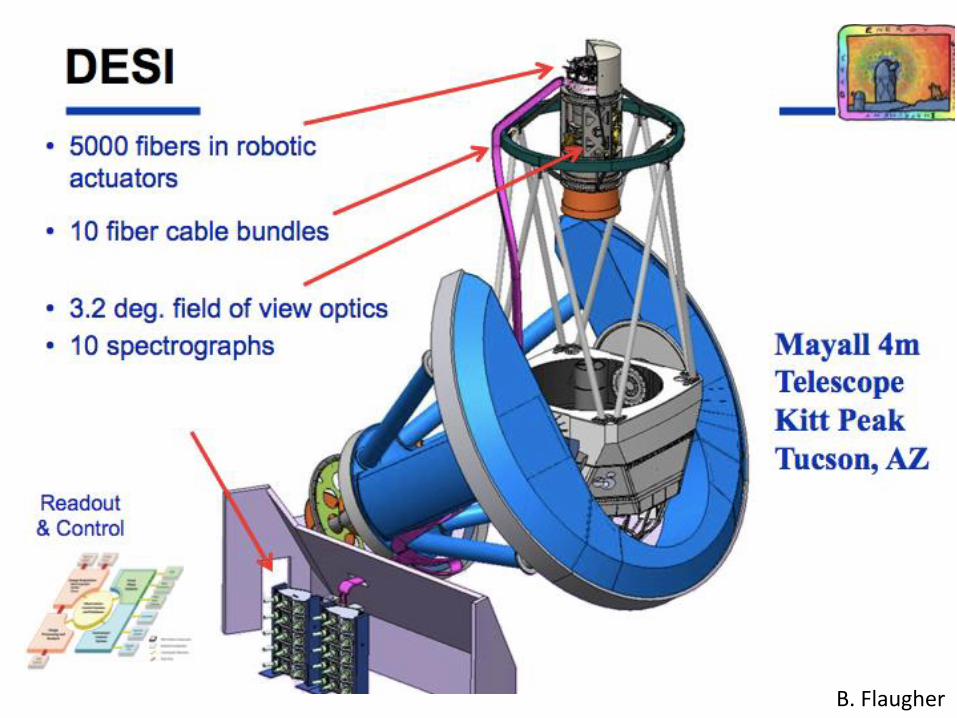
B. Flaugher
The DESI Survey
• 2019-2024
• 14000 sq. deg.
• Tracers• Bright galaxy survey (r < 19.5, z < 0.2)• Red galaxies (z < 1)• Emission line galaxies (z < 1.7)• Tracer QSOs (1 < z < 3)• Lyman-alpha forest• Designed to have multiple possible cross correlations
• Imaging• DECam data (dec < 30) : 9000 sq.deg --- these data will be made
public over the next ~4 years• Bok, Mosaic data (dec > 30)• WISE data
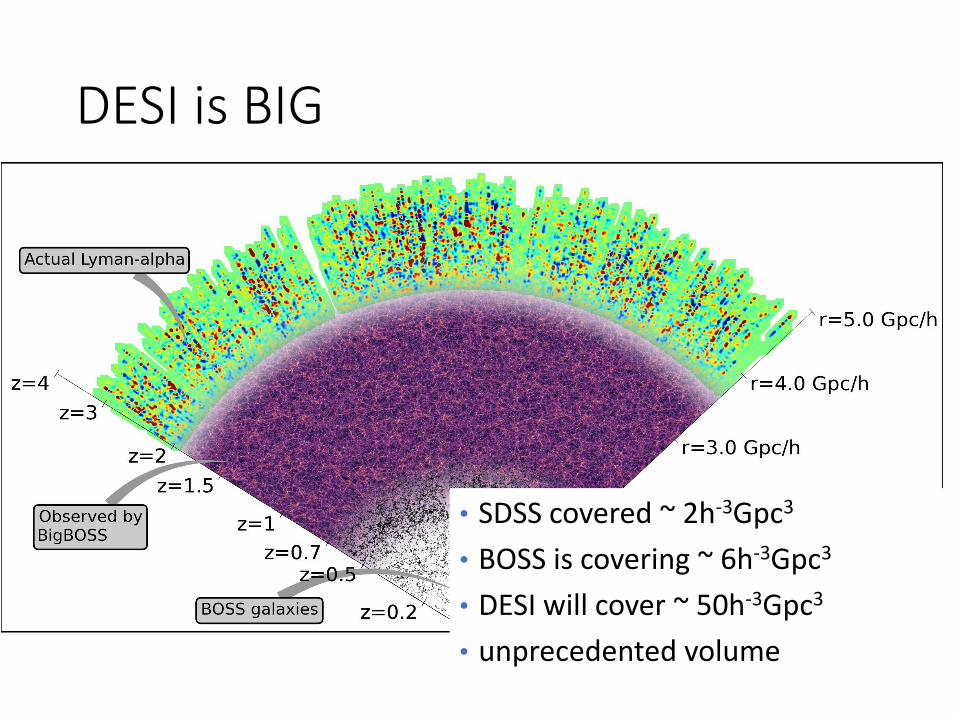
DESI is BIG
• SDSS covered ~ 2h-3Gpc3
• BOSS is covering ~ 6h-3Gpc3
• DESI will cover ~ 50h-3Gpc3
• unprecedented volume
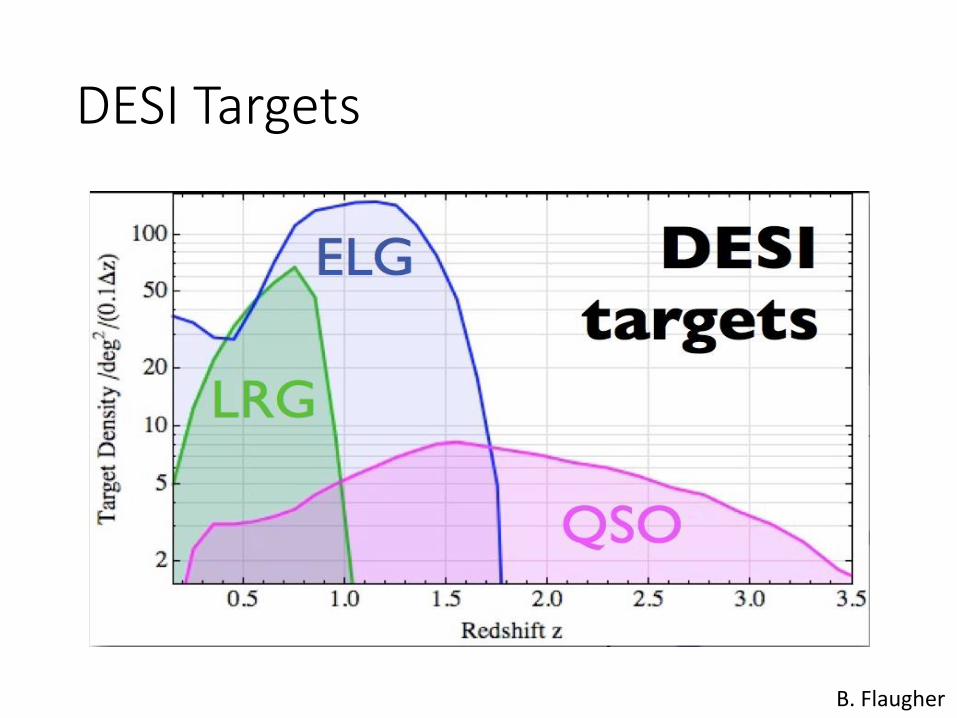
DESI Targets
B. Flaugher
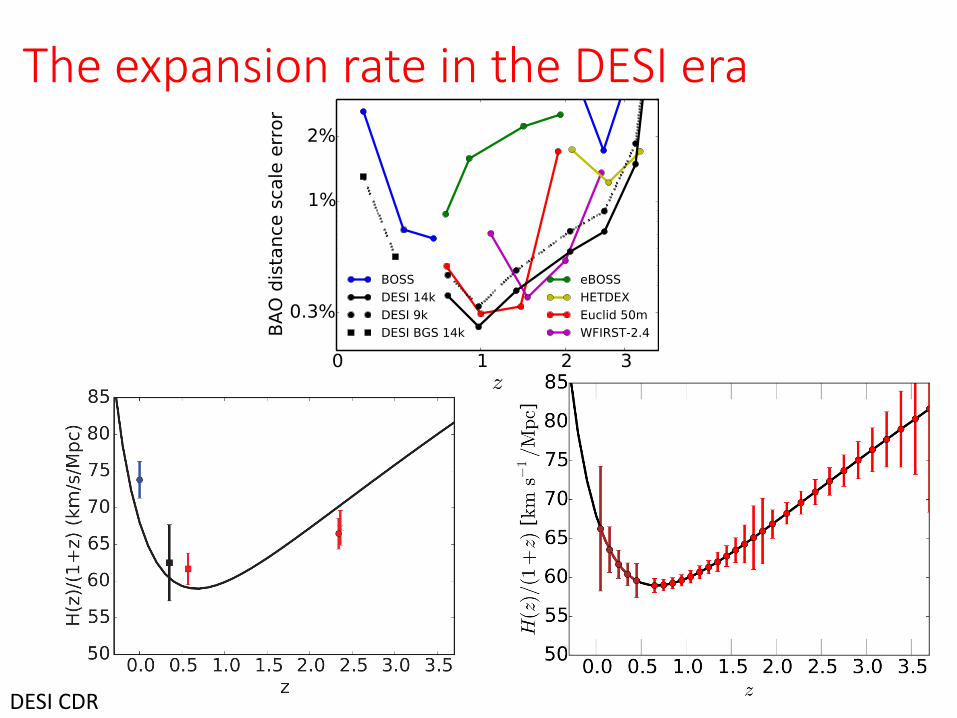
The expansion rate in the DESI era
14 December 2017DESI CDR
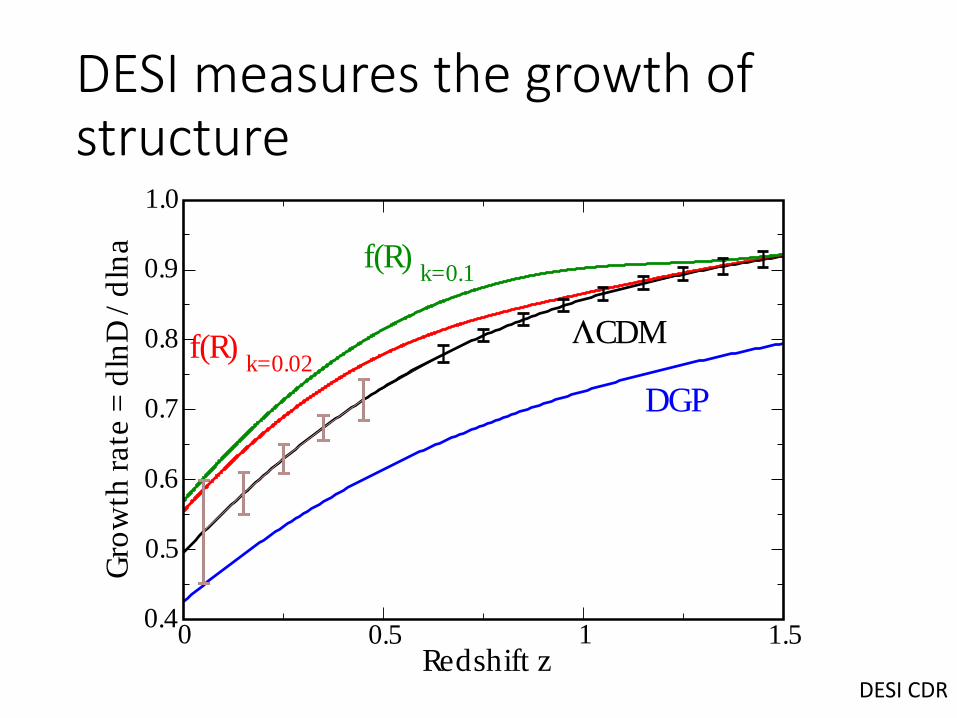
DESI measures the growth of structure
0 0.5 1 1.5Redshift z
0.4
0.5
0.6
0.7
0.8
0.9
1.0
Gro
wth
rate
= d
lnD
/ d
lna
DGP
f(R)k=0.02
CDM
f(R)k=0.1
DESI CDR
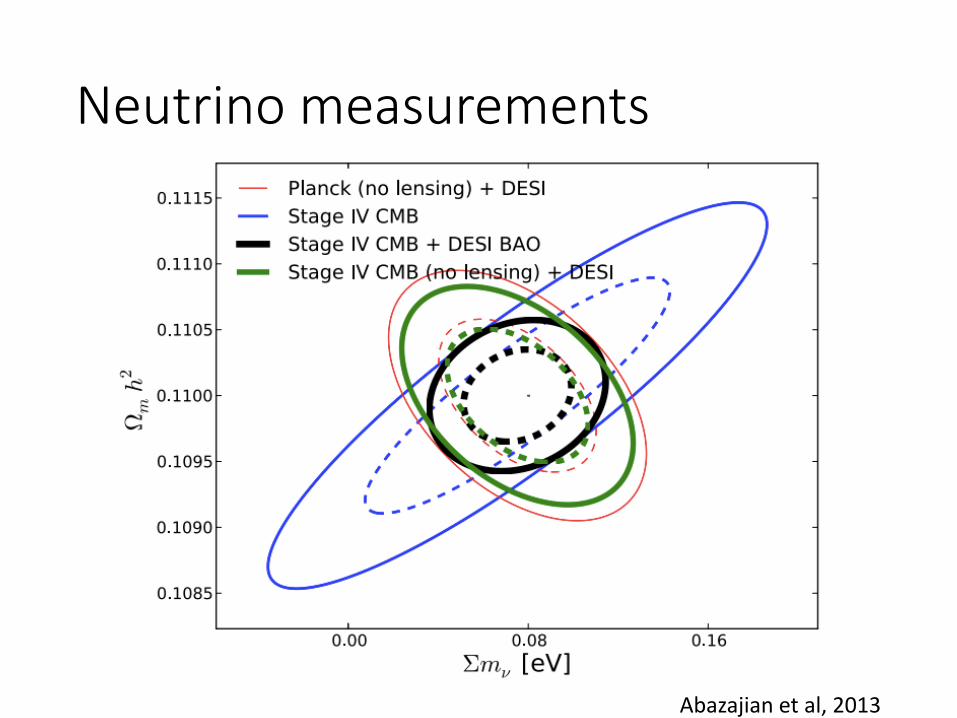
Neutrino measurements
Abazajian et al, 2013
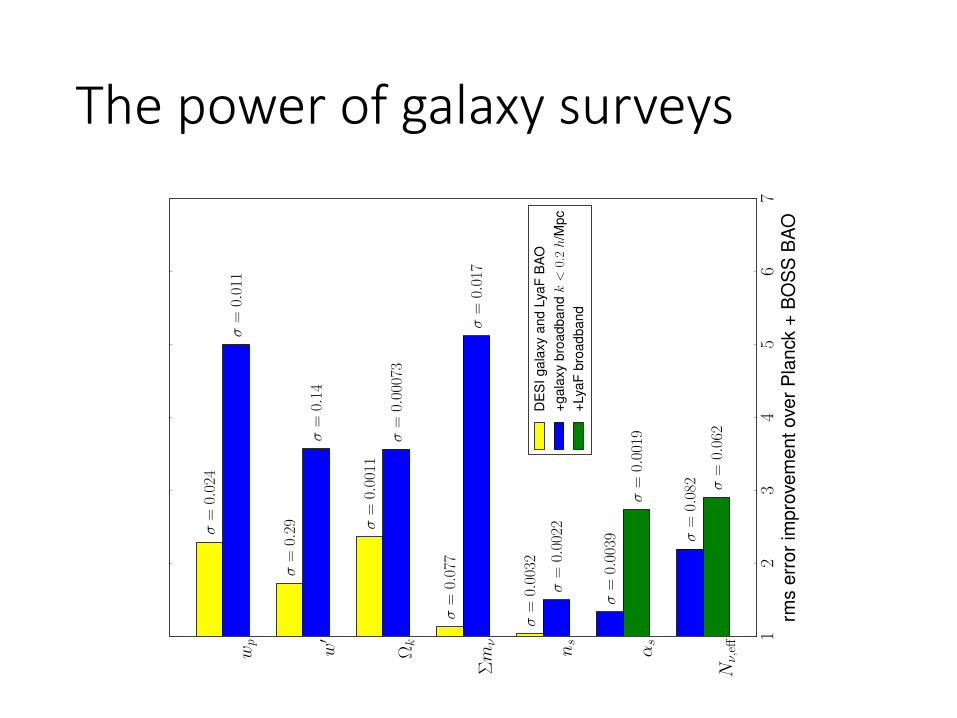
The power of galaxy surveys