Embed Size (px)
Citation preview
Banks in Switzerland 2019


Banks in Switzerland 2019
Volume 104


Banks in Switzerland 2019 3
Contents
Page
Banks in Switzerland 2019 5
1 Number of banks 9
2 Balance sheet 10 Balance sheet total 10 Assets 14 Liabilities 16
3 Derivativefinancialinstruments 18
4 Fiduciary transactions 20
5 Securities holdings in bank custody accounts 22
6 Income statement as well as appropriation ofprofitandcoverageoflosses 26 Summary 26 Result from interest operations 26 Result from commission business and services 27 Result from trading activities and the fair value option 27 Other result from ordinary activities 27 Personnel expenses as well as general and administrative expenses 27 Depreciation, value adjustments and provisions 27 Operating result 28 Extraordinary income and extraordinary expenses 28 Resultoftheperiod(profit/loss) 28
7 Numberofstaff 31
8 Average rate of interest and distribution by rate of interest 32

Banks in Switzerland 2019 5
Banks in Switzerland 2019
This publication contains data on the individual financial statements of banks (parent companies) as required by law. In the case of the big banks, in particular, these statements may deviate from the group financial statements. The breakdown of the banks’ balance sheets and income statements is subject to the accounting rules issued by FINMA for banks, securities dealers, financial groups and conglomerates (ARB, FINMA-Circ. 15/01).
RoundingdiffeRencesThe figures used in the text, tables and charts have been rounded. The use of such rounded figures in calculations (totals, balances, rates of change, proportions) may therefore result in deviations from the exact values.
Table 1
KEY FIGURES 2019
2019 2018 1 Year-on-year change
Number of banks 246 248 – 2
Balance sheet total (in CHF millions) 3 317 638 3 225 003 + 2.9%
Operating result (in CHF millions) – 2 209 12 780 – 117.3%
Result of the period 2 (profit / loss, in CHF millions) 752 11 512 – 93.5%
Fiduciary transactions (in CHF millions) 196 988 160 039 + 23.1%
Securities holdings in bank custody accounts 3 (in CHF millions) 6 780 092 5 849 280 + 15.9%
Number of staff (in full-time equivalents) 106 084 107 388 – 1 304
1 Figures may have been revised since their inclusion in last year’s publication.2 Individual banks' profits and losses are offset against each other.3 At offices in Switzerland. Securities held by branches abroad are not included.
Source: SNB

Banks in Switzerland 20196
Table 2
KEY FIGURES bY banK catEGoRY 2019
Number of banks
Balance sheet total
Operating result
Result of the period
(profit / loss)1
Fiduciary transactions
Number of staff 2
In CHF millions In CHF millions In CHF millions In CHF millions In full-time equivalents
All banks in Switzerland
2015 266 3 026 117 6 857 15 788 114 016 123 890
2016 261 3 101 375 7 913 7 908 120 429 120 840
2017 253 3 249 443 11 323 9 767 138 248 108 939
2018 248 3 225 003 12 780 11 512 160 039 107 388
2019 246 3 317 638 – 2 209 752 196 988 106 084
Cantonal banks
2015 24 537 441 3 253 2 741 1 160 17 360
2016 24 553 231 3 312 2 783 1 157 17 294
2017 24 575 343 3 585 2 936 1 226 17 322
2018 24 600 318 3 735 2 934 1 807 17 357
2019 24 626 727 3 834 3 196 2 088 17 585
Big banks
2015 3 1 424 231 667 10 175 17 984 53 016
2016 4 1 454 808 592 1 793 26 388 50 399
2017 4 1 566 435 3 216 3 161 33 185 38 307
2018 4 1 520 781 4 742 4 913 41 698 37 050
2019 4 1 540 711 – 9 918 – 5 581 68 325 35 549
Regional and savings banks
2015 62 113 076 554 422 25 3 836
2016 62 116 141 570 418 22 3 845
2017 62 118 131 579 417 26 3 855
2018 60 120 283 551 409 30 3 915
2019 60 126 317 607 439 30 3 978
Raiffeisen banks
2015 1 202 412 913 727 2 8 807
2016 1 215 262 840 736 15 8 868
2017 1 225 253 1 081 894 12 9 079
2018 1 225 333 699 541 20 9 215
2019 1 248 345 930 835 17 9 295
Stock exchange banks
2015 44 210 049 155 314 39 091 14 010
2016 43 226 300 1 187 1 103 39 586 14 838
2017 43 223 990 1 449 1 155 43 409 15 210
2018 43 228 729 1 552 1 521 50 702 15 723
2019 42 223 697 1 294 1 108 58 114 15 572
Banks in Switzerland 2019 7
Number of banks
Balance sheet total
Operating result
Result of the period
(profit / loss)1
Fiduciary transactions
Number of staff 2
In CHF millions In CHF millions In CHF millions In CHF millions In full-time equivalents
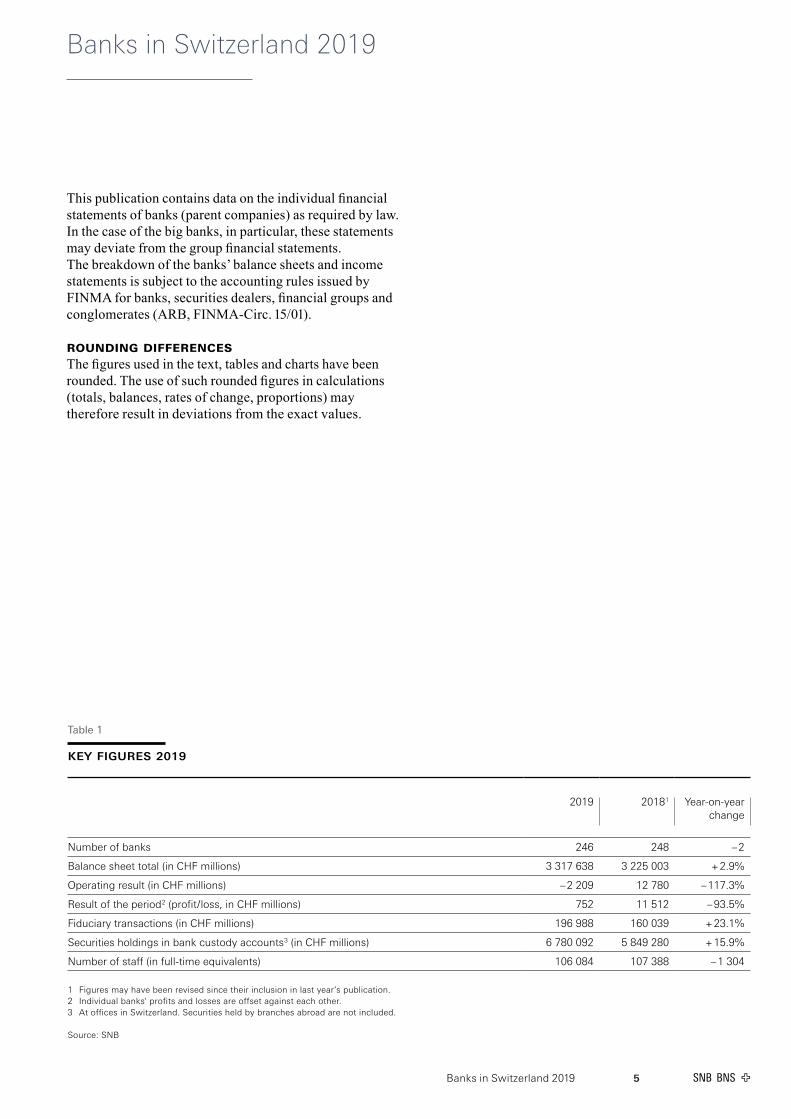
Other banking institutions
2015 14 198 580 1 079 856 1 793 7 933
2016 14 205 693 1 221 946 1 610 7 849
2017 14 209 474 903 711 1 687 7 749
2018 14 209 730 832 664 1 936 7 672
2019 16 223 743 185 34 2 136 7 866
Private bankers
2015 7 6 699 51 48 1 158 614
2016 6 5 942 62 43 1 131 519
2017 6 6 198 78 50 1 346 531
2018 5 6 323 64 63 1 633 523
2019 5 5 753 95 66 1 896 534
Foreign-controlled banks
2015 85 260 962 – 1 416 52 137 17 231
2016 81 248 080 – 230 – 142 50 188 16 131
2017 76 231 299 74 226 57 117 15 809
2018 74 222 561 214 235 61 861 14 805
2019 71 224 190 495 482 64 065 14 560
Branches of foreign banks
2015 26 72 667 187 88 666 1 084
2016 26 75 919 360 228 332 1 096
2017 23 93 320 359 217 240 1 079
2018 23 90 944 389 232 353 1 129
2019 23 98 153 270 172 316 1 145
1 Individual banks' annual profit and annual loss are offset against each other.2 Part-time jobs, apprenticeships and trainee posts are weighted.
Source: SNB


99Banks in Switzerland 2019
1 Number of banks
The number of banks in Switzerland declined by two in 2019, from 248 to 246.
Two new banks were established in the other banking institutions category. Two stock exchange banks and one foreign-controlled bank were acquired by other institutions. Additionally, one foreign-controlled bank lost its status as a bank.
One foreign-controlled bank was reclassified and is now allocated to the stock exchange banks category.
nUmbER oF banKS
Total at 31.12.2018
Additions Change of bank category
(reclassification)
Removals Total at 31.12.2019
Cantonal banks 24 24
Big banks 4 4
Regional and savings banks 60 60
Raiffeisen banks 1 1
Stock exchange banks 43 +1 2 42
Other banking institutions 14 2 16
Private bankers 5 5
Foreign-controlled banks 74 – 1 2 71
Branches of foreign banks 23 23
Total 248 2 4 246
Source: SNB
Table 3
Chart 1
number of banksBy bank category
Number
0
50
100
150
200
250
300
350
2005 2006 2007 2008 2009 2010 2011 2012 2013 2014 2015 2016 2017 2018 2019
Cantonal banksBig banksRegional and savings banks
Raiffeisen banksStock exchange banksOther banking institutions
Private bankersForeign-controlled banksBranches of foreign banks
Source: SNB

Banks in Switzerland 201910
2 Balance sheet
balancE ShEEt total
In 2019, the aggregate balance sheet total for all banks in Switzerland rose by 2.9% or CHF 92.6 billion to CHF 3,317.6 billion. While stock exchange banks (CHF – 5.0 billion or – 2.2%) and private bankers (CHF – 0.6 billion or – 9.0%) posted declines in their balance sheet totals, all other categories recorded increases, in particular the cantonal banks (CHF 26.4 billion or 4.4%), Raiffeisen banks (CHF 23.0 billion or 10.2%) and big banks (CHF 19.9 billion or 1.3%).
Both the domestic and foreign components recorded an increase in assets and liabilities alike.
As regards the currency breakdown, domestically there were increases in particular in assets and liabilities in Swiss francs, with the former CHF 78.8 billion or 4.3% higher and the latter up CHF 66.7 billion or 4.2%. In the foreign component, assets denominated in US dollars rose by CHF 3.7 billion or 0.5% and precious metals assets were CHF 2.9 billion or 106.9% higher. As regards foreign liabilities, there were increases in particular in stocks denominated in US dollars and Swiss francs, which rose by CHF 16.4 billion or 2.5% and by CHF 16.0 billion or 8.7% respectively.
Chart 2
balance sheet total, by bank category, 2019
Cantonal banks 18.9%Big banks 46.4%Regional and savings banks 3.8%Raiffeisen banks 7.5%Stock exchange banks 6.7%Other banking institutions 6.7%Private bankers 0.2%Foreign-controlled banks 6.8%Branches of foreign banks 3.0%
Total: CHF 3,317.6 billion
Source: SNB

Banks in Switzerland 2019 11
Chart 5
assets and liabilities, domestic and foreign, 2019By bank category
Cantonal banks
Big banks
Regional and savings banks
Raiffeisen banks
Stock exchange banks
Other banking institutions
Private bankers
Foreign-controlled banks
Branches of foreign banks
0 250 500 750 1 000 1 250 1 500 1 750
CHF billions
Domestic assets Foreign assets Domestic liabilities Foreign liabilities
Source: SNB
Chart 3
assets, by currency, 2019
Swiss franc 60.4%US dollar 22.8%Euro 7.4%Yen 1.6%Other currencies 7.0%Precious metals 0.7%
Total: CHF 3,317.6 billion
Source: SNB
Chart 4
liabilities, by currency, 2019
Swiss franc 56.3%US dollar 25.2%Euro 10.4%Yen 1.4%Other currencies 6.1%Precious metals 0.7%
Total: CHF 3,317.6 billion
Source: SNB
Banks in Switzerland 201912
Table 4
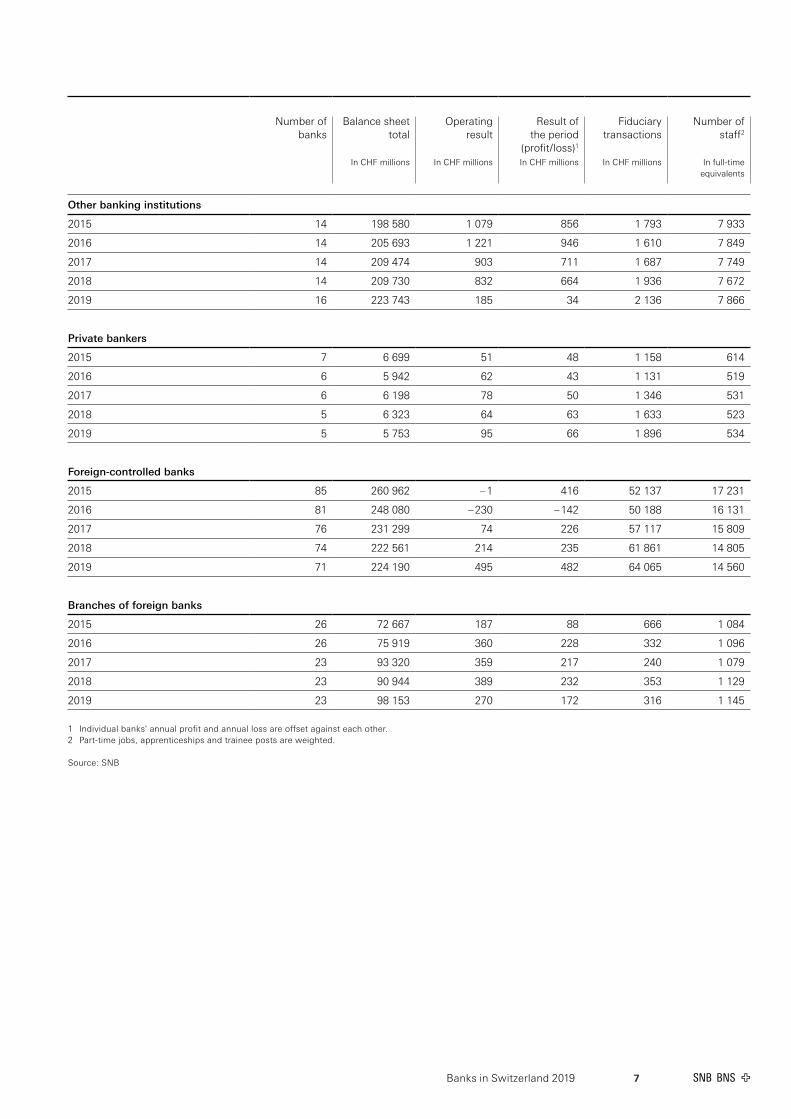
aSSEtS
In CHF millions
Domestic Foreign Total2019 Year-on-year
change2019 Year-on-year
change2019 Year-on-year
change
Liquid assets 497 285 + 6.0% 45 655 + 12.4% 542 940 + 6.5%
Amounts due from banks 93 472 + 10.8% 158 924 + 1.2% 252 396 + 4.6%
Amounts due from securities financing transactions 19 461 + 5.5% 177 727 – 5.8% 197 188 – 4.8%
Amounts due from customers 171 130 + 4.0% 448 038 + 2.6% 619 168 + 3.0%
Mortgage loans 1 042 641 + 3.2% 22 082 + 1.9% 1 064 723 + 3.2%
Trading portfolio assets 33 303 + 14.1% 174 589 + 19.8% 207 892 + 18.8%
Positive replacement values of derivative financial instruments 9 592 – 1.9% 27 435 – 9.6% 37 028 – 7.7%
Other financial instruments at fair value 1 553 + 19.1% 3 933 + 16.2% 5 486 + 17.0%
Financial investments 91 987 + 3.5% 133 161 – 6.9% 225 149 – 2.9%
Accrued income and prepaid expenses 4 150 – 0.4% 4 536 – 5.5% 8 687 – 3.1%
Participations 27 968 – 3.4% 90 223 – 11.6% 118 192 – 9.8%
Tangible fixed assets 19 139 – 0.4% 1 915 – 8.5% 21 055 – 1.2%
Intangible assets 2 444 – 53.3% 280 + 49.8% 2 724 – 49.8%
Other assets 11 016 + 21.7% 3 998 – 35.8% 15 013 – 1.8%
Capital not paid in – –
Total assets 2 025 142 + 4.3% 1 292 496 + 0.8% 3 317 638 + 2.9%
Source: SNB
Chart 6
selected assets CHF billions
0
200
400
600
800
1 000
1 200
2005 2006 2007 2008 2009 2010 2011 2012 2013 2014 2015 2016 2017 2018 2019
Amounts due from banksAmounts due from customers
Liquid assetsMortgage loans
Amounts due from securities financing transactions
Source: SNB
Banks in Switzerland 2019 13
Table 5
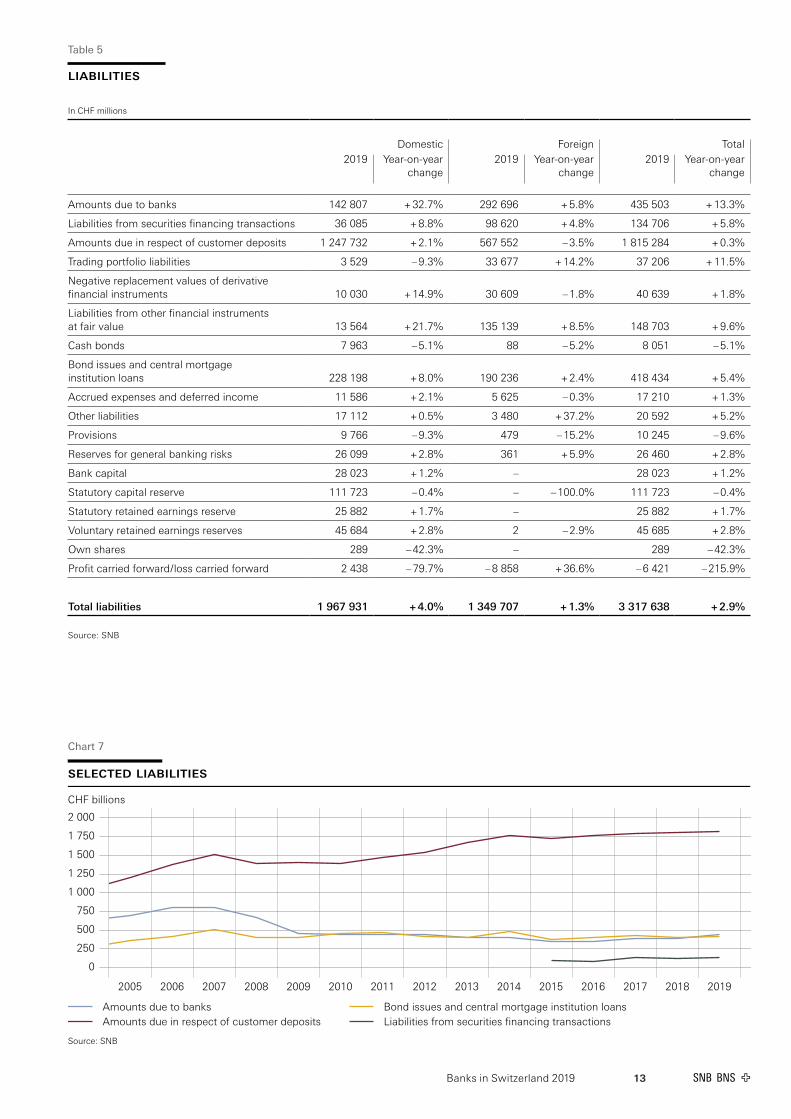
lIabIlItIES
In CHF millions
Domestic Foreign Total2019 Year-on-year
change2019 Year-on-year
change2019 Year-on-year
change
Amounts due to banks 142 807 + 32.7% 292 696 + 5.8% 435 503 + 13.3%
Liabilities from securities financing transactions 36 085 + 8.8% 98 620 + 4.8% 134 706 + 5.8%
Amounts due in respect of customer deposits 1 247 732 + 2.1% 567 552 – 3.5% 1 815 284 + 0.3%
Trading portfolio liabilities 3 529 – 9.3% 33 677 + 14.2% 37 206 + 11.5%
Negative replacement values of derivative financial instruments 10 030 + 14.9% 30 609 – 1.8% 40 639 + 1.8%
Liabilities from other financial instruments at fair value 13 564 + 21.7% 135 139 + 8.5% 148 703 + 9.6%
Cash bonds 7 963 – 5.1% 88 – 5.2% 8 051 – 5.1%
Bond issues and central mortgage institution loans 228 198 + 8.0% 190 236 + 2.4% 418 434 + 5.4%
Accrued expenses and deferred income 11 586 + 2.1% 5 625 – 0.3% 17 210 + 1.3%
Other liabilities 17 112 + 0.5% 3 480 + 37.2% 20 592 + 5.2%
Provisions 9 766 – 9.3% 479 – 15.2% 10 245 – 9.6%
Reserves for general banking risks 26 099 + 2.8% 361 + 5.9% 26 460 + 2.8%
Bank capital 28 023 + 1.2% – 28 023 + 1.2%
Statutory capital reserve 111 723 – 0.4% – – 100.0% 111 723 – 0.4%
Statutory retained earnings reserve 25 882 + 1.7% – 25 882 + 1.7%
Voluntary retained earnings reserves 45 684 + 2.8% 2 – 2.9% 45 685 + 2.8%
Own shares 289 – 42.3% – 289 – 42.3%
Profit carried forward / loss carried forward 2 438 – 79.7% – 8 858 + 36.6% – 6 421 – 215.9%
Total liabilities 1 967 931 + 4.0% 1 349 707 + 1.3% 3 317 638 + 2.9%
Source: SNB
Chart 7
selected liabilities CHF billions
0
250
500
750
1 000
1 250
1 500
1 750
2 000
2005 2006 2007 2008 2009 2010 2011 2012 2013 2014 2015 2016 2017 2018 2019
Amounts due to banksAmounts due in respect of customer deposits
Bond issues and central mortgage institution loansLiabilities from securities financing transactions
Source: SNB

Banks in Switzerland 201914
aSSEtS
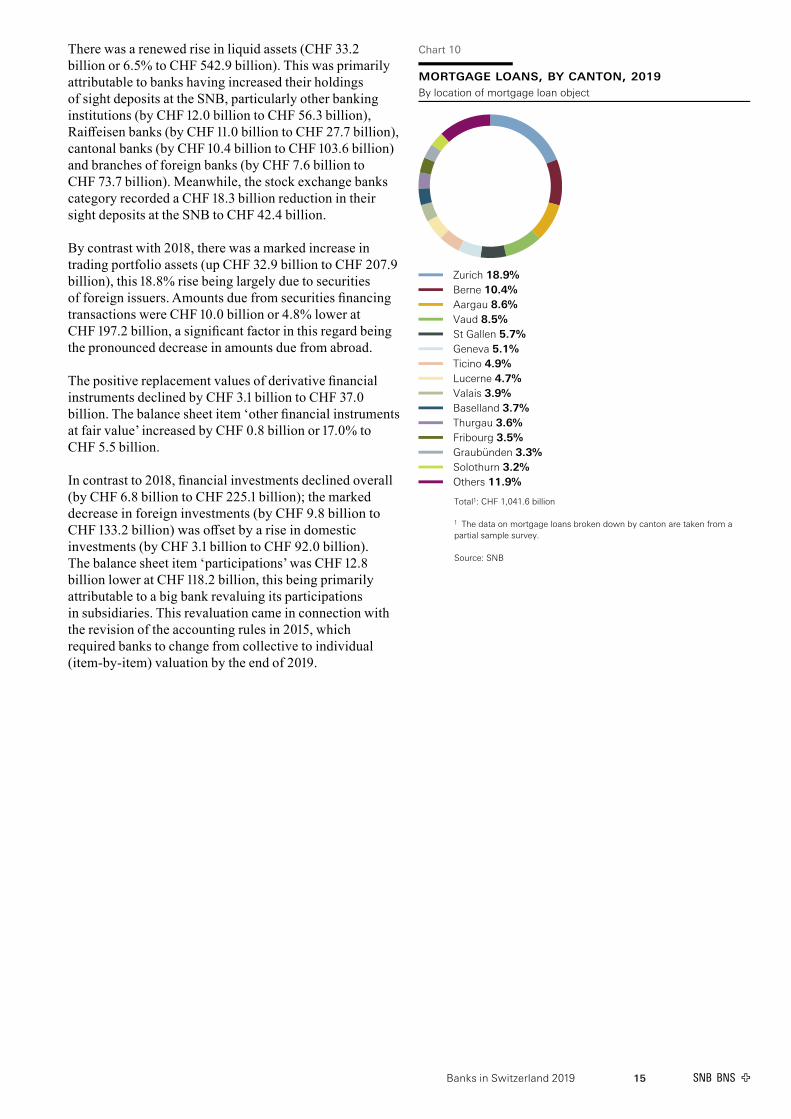
Domestic mortgage loans continued to rise, and by the end of 2019 stood at CHF 1,042.6 billion, an increase of CHF 32.5 billion or 3.2%. They thus make up over 30% of the balance sheet total. There were marked increases in absolute terms recorded by cantonal banks (CHF 15.7 billion or 4.2%), Raiffeisen banks (CHF 5.7 billion or 3.2%) and big banks (CHF 4.1 billion or 1.5%). Fixed-interest mortgage loans made up around 81% of the total domestic mortgage loans.
Amounts due from customers – the balance sheet item under which the remaining customer loans are recorded – accounted for just under one-fifth of the aggregate balance sheet total. Foreign counterparties made up around 72% of these claims. All in all, amounts due from customers rose by CHF 17.9 billion to CHF 619.2 billion, an increase of 3.0%. Higher numbers were posted in particular by the big banks category (up 1.7% or CHF 6.2 billion to CHF 367.1 billion) and stock exchange banks (up 11.3% or CHF 7.2 billion to CHF 71.0 billion).
Overall, amounts due from banks rose by CHF 11.0 billion to CHF 252.4 billion, this increase being almost entirely attributable to amounts due from domestic banks, which were CHF 9.1 billion or 10.8% higher. The largest increases were recorded by the big banks (CHF 9.8 billion or 23.3% to CHF 51.7 billion) and the Raiffeisen banks (CHF 1.0 billion or 55.0% to CHF 2.7 billion). Amounts due from foreign banks rose slightly overall by CHF 1.9 billion or 1.2%.
Chart 8
balance sheet, by assets, 2019
Liquid assets 16.4%Amounts due from banks 7.6%Amounts due from securities financing transactions 5.9%Amounts due from customers 18.7%Mortgage loans 32.1%Trading portfolio assets 6.3%Positive replacement values of derivative financialinstruments 1.1%Financial investments 6.8%Participations 3.6%Other 1.6%
Total: CHF 3,317.6 billion
Source: SNB
Chart 9
developments in domestic mortgage loans,2019Circular areas represent domestic loan volumes
Year-on-year change in percent
–4%
–2%
0%
2%
4%
6%
8%
0% 1% 2% 3% 4% 5% 6% 7% 8%
Average growth rate over past ten years
Cantonal banksBig banks
Regional and savings banksRaiffeisen banks
Source: SNB
Banks in Switzerland 2019 15
There was a renewed rise in liquid assets (CHF 33.2 billion or 6.5% to CHF 542.9 billion). This was primarily attributable to banks having increased their holdings of sight deposits at the SNB, particularly other banking institutions (by CHF 12.0 billion to CHF 56.3 billion), Raiffeisen banks (by CHF 11.0 billion to CHF 27.7 billion), cantonal banks (by CHF 10.4 billion to CHF 103.6 billion) and branches of foreign banks (by CHF 7.6 billion to CHF 73.7 billion). Meanwhile, the stock exchange banks category recorded a CHF 18.3 billion reduction in their sight deposits at the SNB to CHF 42.4 billion.
By contrast with 2018, there was a marked increase in trading portfolio assets (up CHF 32.9 billion to CHF 207.9 billion), this 18.8% rise being largely due to securities of foreign issuers. Amounts due from securities financing transactions were CHF 10.0 billion or 4.8% lower at CHF 197.2 billion, a significant factor in this regard being the pronounced decrease in amounts due from abroad.
The positive replacement values of derivative financial instruments declined by CHF 3.1 billion to CHF 37.0 billion. The balance sheet item ‘other financial instruments at fair value’ increased by CHF 0.8 billion or 17.0% to CHF 5.5 billion.
In contrast to 2018, financial investments declined overall (by CHF 6.8 billion to CHF 225.1 billion); the marked decrease in foreign investments (by CHF 9.8 billion to CHF 133.2 billion) was offset by a rise in domestic investments (by CHF 3.1 billion to CHF 92.0 billion). The balance sheet item ‘participations’ was CHF 12.8 billion lower at CHF 118.2 billion, this being primarily attributable to a big bank revaluing its participations in subsidiaries. This revaluation came in connection with the revision of the accounting rules in 2015, which required banks to change from collective to individual (item-by-item) valuation by the end of 2019.
Chart 10
mortgage loans, by canton, 2019 By location of mortgage loan object .
Zurich 18.9%Berne 10.4%Aargau 8.6%Vaud 8.5%St Gallen 5.7%Geneva 5.1%Ticino 4.9%Lucerne 4.7%Valais 3.9%Baselland 3.7%Thurgau 3.6%Fribourg 3.5%Graubünden 3.3%Solothurn 3.2%Others 11.9%
Total1: CHF 1,041.6 billion
1 The data on mortgage loans broken down by canton are taken from apartial sample survey.
Source: SNB
Banks in Switzerland 201916
lIabIlItIES
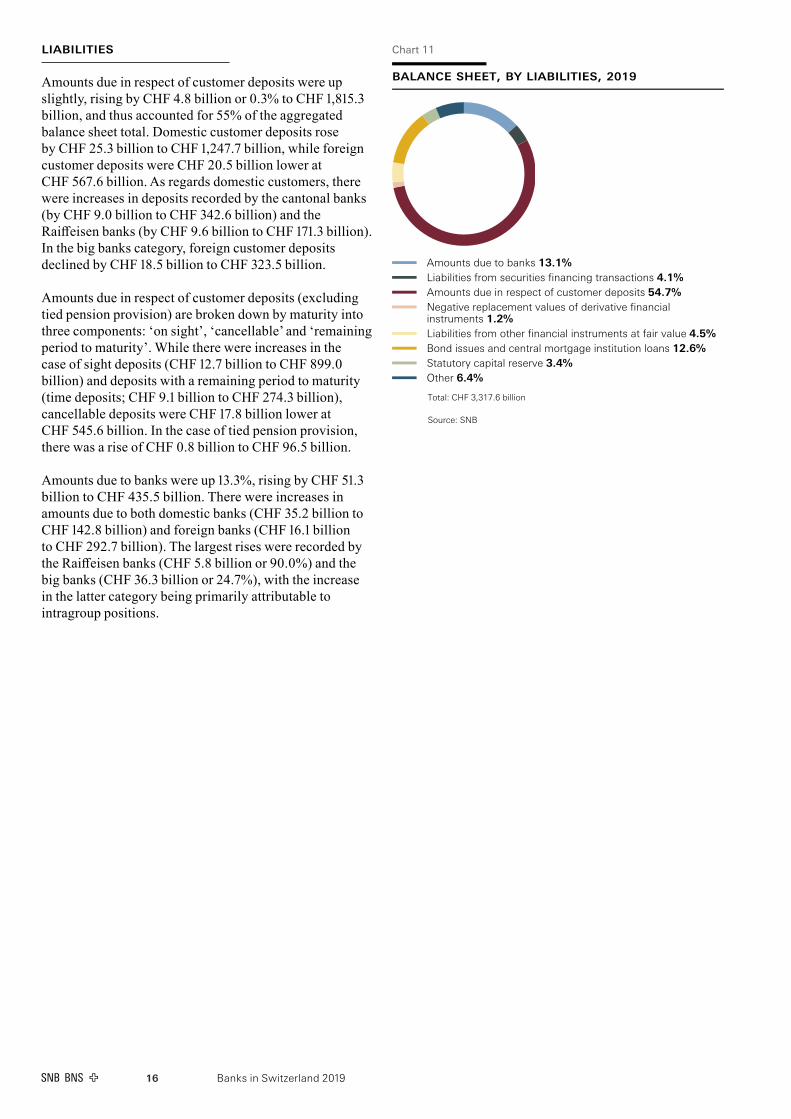
Amounts due in respect of customer deposits were up slightly, rising by CHF 4.8 billion or 0.3% to CHF 1,815.3 billion, and thus accounted for 55% of the aggregated balance sheet total. Domestic customer deposits rose by CHF 25.3 billion to CHF 1,247.7 billion, while foreign customer deposits were CHF 20.5 billion lower at CHF 567.6 billion. As regards domestic customers, there were increases in deposits recorded by the cantonal banks (by CHF 9.0 billion to CHF 342.6 billion) and the Raiffeisen banks (by CHF 9.6 billion to CHF 171.3 billion). In the big banks category, foreign customer deposits declined by CHF 18.5 billion to CHF 323.5 billion.
Amounts due in respect of customer deposits (excluding tied pension provision) are broken down by maturity into three components: ‘on sight’, ‘cancellable’ and ‘remaining period to maturity’. While there were increases in the case of sight deposits (CHF 12.7 billion to CHF 899.0 billion) and deposits with a remaining period to maturity (time deposits; CHF 9.1 billion to CHF 274.3 billion), cancellable deposits were CHF 17.8 billion lower at CHF 545.6 billion. In the case of tied pension provision, there was a rise of CHF 0.8 billion to CHF 96.5 billion.
Amounts due to banks were up 13.3%, rising by CHF 51.3 billion to CHF 435.5 billion. There were increases in amounts due to both domestic banks (CHF 35.2 billion to CHF 142.8 billion) and foreign banks (CHF 16.1 billion to CHF 292.7 billion). The largest rises were recorded by the Raiffeisen banks (CHF 5.8 billion or 90.0%) and the big banks (CHF 36.3 billion or 24.7%), with the increase in the latter category being primarily attributable to intragroup positions.
Chart 11
balance sheet, by liabilities, 2019
Amounts due to banks 13.1%Liabilities from securities financing transactions 4.1%Amounts due in respect of customer deposits 54.7%Negative replacement values of derivative financialinstruments 1.2%Liabilities from other financial instruments at fair value 4.5%Bond issues and central mortgage institution loans 12.6%Statutory capital reserve 3.4%Other 6.4%
Total: CHF 3,317.6 billion
Source: SNB
Banks in Switzerland 2019 17
The balance sheet item ‘bond issues and central mortgage institution loans’ rose by CHF 21.3 billion to CHF 418.4 billion. Of the CHF 16.9 billion increase domestically, bonds, warrant issues and convertible bonds accounted for CHF 8.6 billion and central mortgage institution loans for CHF 6.5 billion. Money market instruments issued abroad increased by CHF 23.3 billion, while bonds, warrant issues and convertible bonds issued abroad decreased by CHF 18.9 billion. The categories recording the largest rises were cantonal banks (CHF 11.5 billion) and big banks (CHF 3.8 billion).
Trading portfolio liabilities were CHF 3.8 billion higher at CHF 37.2 billion, this rise being in large part attributable to the CHF 4.6 billion increase in big banks’ foreign liabilities to CHF 32.7 billion. The negative replacement values of derivative financial instruments rose by CHF 0.7 billion to CHF 40.6 billion. Liabilities from other financial instruments at fair value were significantly higher at CHF 148.7 billion, an increase of CHF 13.0 billion.
There were year-on-year increases in liabilities from securities financing transactions both in Switzerland (CHF 2.9 billion to CHF 36.1 billion) and abroad (CHF 4.5 billion to CHF 98.6 billion).
18 Banks in Switzerland 2019
3 Derivative financial instruments
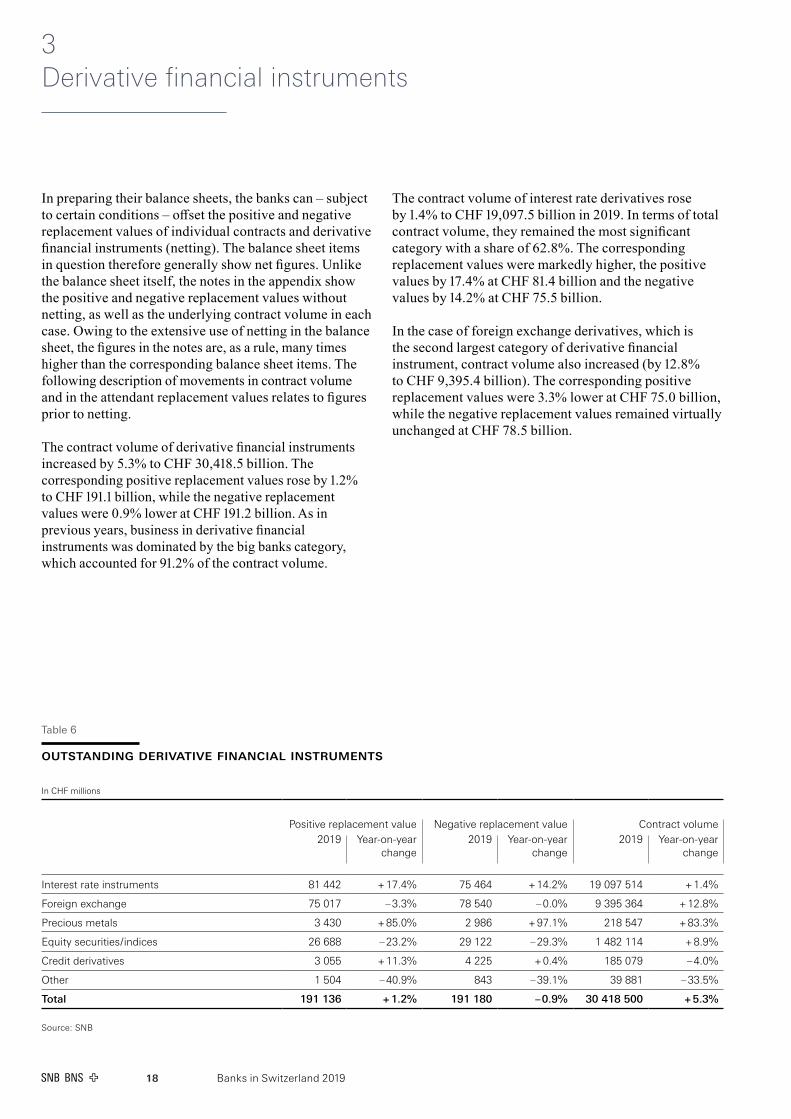
In preparing their balance sheets, the banks can – subject to certain conditions – offset the positive and negative replacement values of individual contracts and derivative financial instruments (netting). The balance sheet items in question therefore generally show net figures. Unlike the balance sheet itself, the notes in the appendix show the positive and negative replacement values without netting, as well as the underlying contract volume in each case. Owing to the extensive use of netting in the balance sheet, the figures in the notes are, as a rule, many times higher than the corresponding balance sheet items. The following description of movements in contract volume and in the attendant replacement values relates to figures prior to netting.
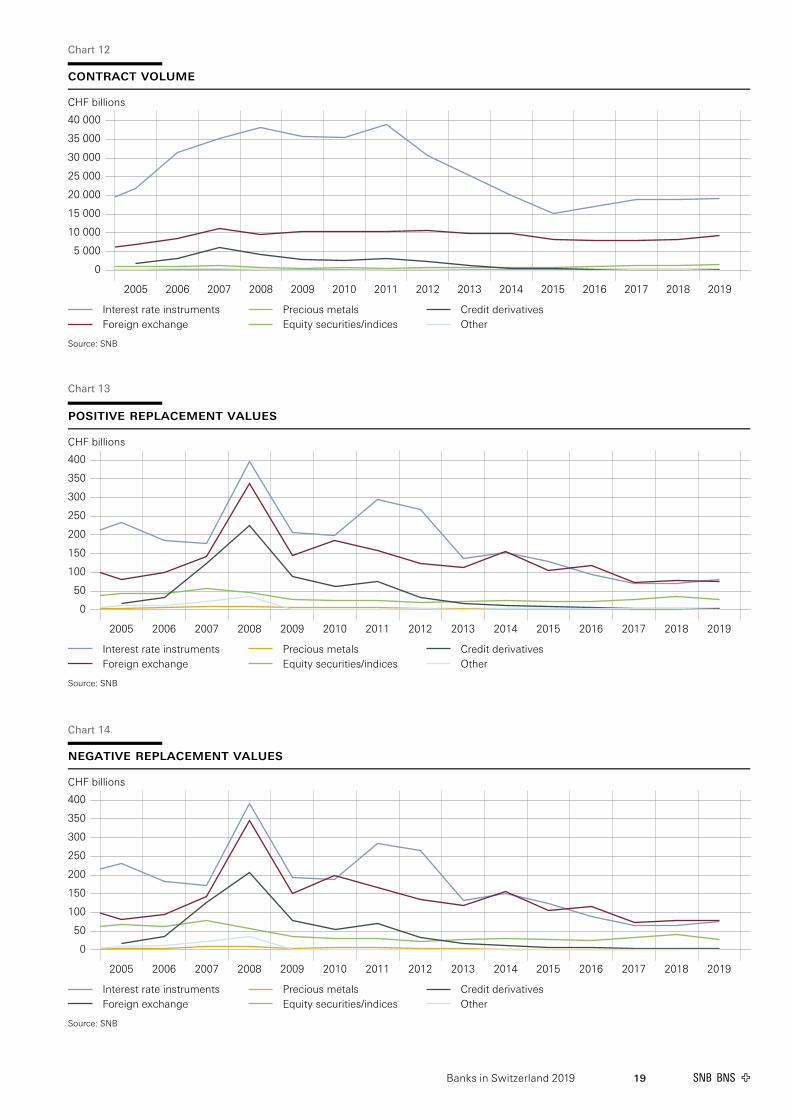
The contract volume of derivative financial instruments increased by 5.3% to CHF 30,418.5 billion. The corresponding positive replacement values rose by 1.2% to CHF 191.1 billion, while the negative replacement values were 0.9% lower at CHF 191.2 billion. As in previous years, business in derivative financial instruments was dominated by the big banks category, which accounted for 91.2% of the contract volume.
The contract volume of interest rate derivatives rose by 1.4% to CHF 19,097.5 billion in 2019. In terms of total contract volume, they remained the most significant category with a share of 62.8%. The corresponding replacement values were markedly higher, the positive values by 17.4% at CHF 81.4 billion and the negative values by 14.2% at CHF 75.5 billion.
In the case of foreign exchange derivatives, which is the second largest category of derivative financial instrument, contract volume also increased (by 12.8% to CHF 9,395.4 billion). The corresponding positive replacement values were 3.3% lower at CHF 75.0 billion, while the negative replacement values remained virtually unchanged at CHF 78.5 billion.
Table 6
oUtStandInG dERIvatIvE FInancIal InStRUmEntS
In CHF millions
Positive replacement value Negative replacement value Contract volume2019 Year-on-year
change2019 Year-on-year
change2019 Year-on-year
change
Interest rate instruments 81 442 + 17.4% 75 464 + 14.2% 19 097 514 + 1.4%
Foreign exchange 75 017 – 3.3% 78 540 – 0.0% 9 395 364 + 12.8%
Precious metals 3 430 + 85.0% 2 986 + 97.1% 218 547 + 83.3%
Equity securities / indices 26 688 – 23.2% 29 122 – 29.3% 1 482 114 + 8.9%
Credit derivatives 3 055 + 11.3% 4 225 + 0.4% 185 079 – 4.0%
Other 1 504 – 40.9% 843 – 39.1% 39 881 – 33.5%
Total 191 136 + 1.2% 191 180 – 0.9% 30 418 500 + 5.3%
Source: SNB
Banks in Switzerland 2019 19
Chart 12
contract volume CHF billions
0
5 000
10 000
15 000
20 000
25 000
30 000
35 000
40 000
2005 2006 2007 2008 2009 2010 2011 2012 2013 2014 2015 2016 2017 2018 2019
Interest rate instrumentsForeign exchange
Precious metalsEquity securities/indices
Credit derivativesOther
Source: SNB
Chart 14
negative replacement values CHF billions
0
50
100
150
200
250
300
350
400
2005 2006 2007 2008 2009 2010 2011 2012 2013 2014 2015 2016 2017 2018 2019
Interest rate instrumentsForeign exchange
Precious metalsEquity securities/indices
Credit derivativesOther
Source: SNB
Chart 13
positive replacement values CHF billions
0
50
100
150
200
250
300
350
400
2005 2006 2007 2008 2009 2010 2011 2012 2013 2014 2015 2016 2017 2018 2019
Interest rate instrumentsForeign exchange
Precious metalsEquity securities/indices
Credit derivativesOther
Source: SNB

Banks in Switzerland 201920
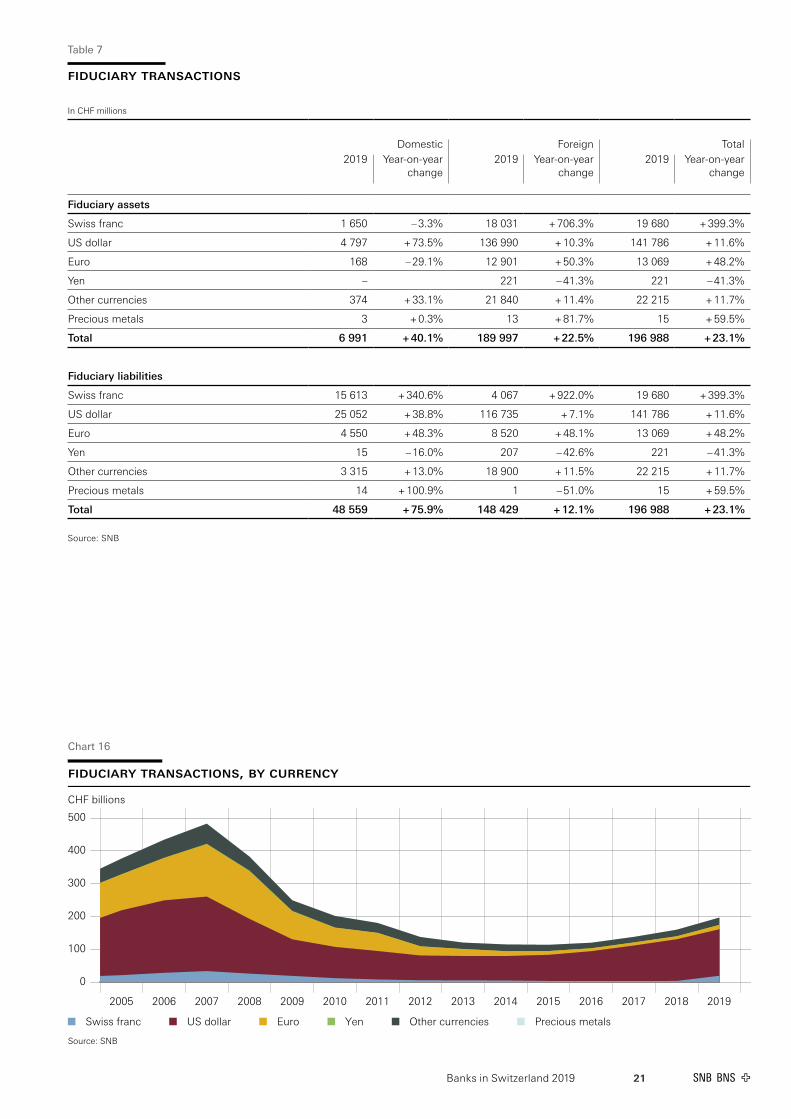
Fiduciary funds administered by banks have been increasing since 2015, and this continued in 2019 with a rise of CHF 36.9 billion or 23.1% to CHF 197.0 billion. However, this value is still well below the high of CHF 482.9 billion set in 2007.
Fiduciary funds are invested in the currency in which they are received, i.e. the banks do not carry out any foreign exchange translation. Fiduciary funds invested in US dollars rose by CHF 14.8 billion to CHF 141.8 billion. The US dollar remained the most important investment currency, with a share of 72.0%. There was a pronounced rise in fiduciary deposits invested in Swiss francs of CHF 15.7 billion to CHF 19.7 billion, increasing that currency’s share from 2.5% to 10.0%. Fiduciary investments in Swiss francs were higher in the big banks category above all, as the latter increasingly offered such investments to their customers as an alternative to on-balance-sheet deposits. Fiduciary funds invested in euros were up CHF 4.2 billion at CHF 13.1 billion, but their share remained comparatively small at 6.6%.
The breakdown of fiduciary funds by origin shows the make-up in terms of client domicile. As in 2018, there were increases in the case of both domestic deposits (CHF 20.9 billion or 75.9% higher at CHF 48.6 billion, with fiduciary funds in Swiss francs showing a 340.6% rise to CHF 15.6 billion) and fiduciary deposits from abroad (up CHF 16.0 billion or 12.1% to CHF 148.4 billion). Deposits from developed countries increased by 25.8%, those from offshore financial centres by 14.0%, and those from developing countries by 4.6%.
4 Fiduciary transactions
Chart 15
fiduciary deposits from abroad, by regionand country, 2019
Developed countries 24.7%United Kingdom 6.3%Cyprus 4.8%France (incl. French Guyana, Monaco, Réunion, West Indies[FR]) 2.2%Other developed countries 11.3%
Offshore financial centres 44.5%West Indies (UK) 16.4%Bahamas 5.2%Panama 4.4%Other offshore financial centres 18.5%
Developing countries 30.7%Saudi Arabia 5.1%United Arab Emirates 4.5%Russian Federation 2.0%Other developing countries 19.2%
Total1: CHF 140.7 billion
1 The data on fiduciary deposits from abroad broken down by region andcountry are taken from a partial sample survey. Country breakdowns as perthe Bank for International Settlements (BIS).
Source: SNB
Banks in Switzerland 2019 21
Table 7
FIdUcIaRY tRanSactIonS
In CHF millions
Domestic Foreign Total2019 Year-on-year
change2019 Year-on-year
change2019 Year-on-year
change
Fiduciary assets
Swiss franc 1 650 – 3.3% 18 031 + 706.3% 19 680 + 399.3%
US dollar 4 797 + 73.5% 136 990 + 10.3% 141 786 + 11.6%
Euro 168 – 29.1% 12 901 + 50.3% 13 069 + 48.2%
Yen – 221 – 41.3% 221 – 41.3%
Other currencies 374 + 33.1% 21 840 + 11.4% 22 215 + 11.7%
Precious metals 3 + 0.3% 13 + 81.7% 15 + 59.5%
Total 6 991 + 40.1% 189 997 + 22.5% 196 988 + 23.1%
Fiduciary liabilities
Swiss franc 15 613 + 340.6% 4 067 + 922.0% 19 680 + 399.3%
US dollar 25 052 + 38.8% 116 735 + 7.1% 141 786 + 11.6%
Euro 4 550 + 48.3% 8 520 + 48.1% 13 069 + 48.2%
Yen 15 – 16.0% 207 – 42.6% 221 – 41.3%
Other currencies 3 315 + 13.0% 18 900 + 11.5% 22 215 + 11.7%
Precious metals 14 + 100.9% 1 – 51.0% 15 + 59.5%
Total 48 559 + 75.9% 148 429 + 12.1% 196 988 + 23.1%
Source: SNB
Chart 16
fiduciary transactions, by currency CHF billions
0
100
200
300
400
500
2005 2006 2007 2008 2009 2010 2011 2012 2013 2014 2015 2016 2017 2018 2019
Swiss franc US dollar Euro Yen Other currencies Precious metals
Source: SNB

Banks in Switzerland 201922
5 Securities holdings in bank custody accounts
The information on stocks of securities relates to open custody accounts of customers at the domestic offices of banks in Switzerland. These include holdings that banks manage for domestic customers as well as those they manage or hold in custody for foreign customers.1
Stocks of securities in custody accounts of customers at banks increased by 15.9% or CHF 930.8 billion to CHF 6,780.1 billion. Custody account holdings were up for all categories of securities. Stocks of shares were 23.5% higher at CHF 2,717.0 billion, with the increase in share prices being a significant contributory factor. At 40.1% of the total, this remains the most important category of security.
Stocks of collective investment scheme units – the second largest category with a 35.6% share – also increased, up 13.6% to CHF 2,414.5 billion. In the case of bonds, stocks were 7.1% higher at CHF 1,354.7 billion, while structured products also recorded a rise, up 11.8% to CHF 204.1 billion. Stocks of money market instruments also showed an increase, rising 17.8% to CHF 89.7 billion.
With a share of 52.5%, the Swiss franc remained the most important investment currency. The corresponding stocks were up 19.0% at CHF 3,558.3 billion. Securities in US dollars increased by 11.5% to CHF 1,745.3 billion, bringing their share to 25.7%. Stocks in euros were 11.6% higher at CHF 966.9 billion, thus accounting for 14.3% of the total.
1 For the purposes of this publication, managed securities holdings do not refer to all kinds of asset management mandate held by banks. Rather, the portfolios designated here as ‘managed’ indicate that the bank implements transaction decisions on behalf of the owner or their asset manager, maintains interest and/or dividend payments and provides information under tax legislation (custody account statements, tax statements). Custody of securities, by contrast, is understood to mean mere safekeeping. Further notes can be found at data.snb.ch, Table selection, Banks, Notes – Banks, Surveys.
All investor categories registered increases in stocks at the end of the year. With a share of 75.9%, institutional investors2 remained the largest category. Their stocks rose by 16.1% to CHF 5,146.9 billion, with foreign institutional investors accounting for more than half (CHF 374.8 billion) of this increase. Stocks held by private customers were up 14.8% at CHF 1,288.6 billion, while those of commercial customers3 were 17.9% higher at CHF 344.7 billion.
Stocks held by resident custody account holders increased by 16.5% to CHF 3,401.4 billion, and those of non-residents by 15.3% to CHF 3,378.7 billion. As at the end of the 2019 financial year, non-resident custody account holders held 49.8% of the total securities holdings in Switzerland.
2 Institutional investors: financial corporations including banks outside Switzerland and social security funds.3 Commercial customers: non-financial corporations, public sector, and non-profit institutions serving households.
Chart 17
holdings of securities in bank custodyaccounts, by currency, 2019
Swiss franc 52.5%US dollar 25.7%Euro 14.3%Pound sterling 3.4%Yen 1.0%Other currencies 3.1%
Total: CHF 6,780.1 billion
Source: SNB

Banks in Switzerland 2019 23
Chart 18
holdings of securities in bank custody accounts, by category of security CHF billions
0
1 000
2 000
3 000
4 000
5 000
6 000
7 000
2005 2006 2007 2008 2009 2010 2011 2012 2013 2014 2015 2016 2017 2018 2019
Money market instrumentsBonds
SharesUnits in collective investment schemes
Structured productsOther
Source: SNB
Chart 19
holdings of securities in bank custody accounts, by domicile and business sector ofcustody account holder CHF billions
0
1 000
2 000
3 000
4 000
5 000
6 000
7 000
2005 2006 2007 2008 2009 2010 2011 2012 2013 2014 2015 2016 2017 2018 2019
Non-resident custody account holders, private customersNon-resident custody account holders, commercial customersNon-resident custody account holders, institutional investors
Resident custody account holders, private customersResident custody account holders, commercial customersResident custody account holders, institutional investors
Source: SNB

Banks in Switzerland 201924
Table 8
SEcURItIES holdInGS In banK cUStodY accoUntS
In CHF billions
All currencies CHF EUR2019 Year-on-year
change2019 Year-on-year
change2019 Year-on-year
change
Resident custody account holders
Private customers 711 + 16.7% 491 + 18.1% 80 + 8.8%
Commercial customers 249 + 20.7% 195 + 21.1% 19 + 9.9%
Institutional investors 2 441 + 16.1% 1 611 + 17.1% 224 + 13.0%
Total 3 401 + 16.5% 2 297 + 17.7% 323 + 11.8%
Non-resident custody account holders
Private customers 578 + 12.5% 76 + 20.6% 142 + 7.6%
Commercial customers 96 + 11.0% 5 + 8.5% 30 + 8.8%
Institutional investors 2 706 + 16.1% 1 179 + 21.8% 472 + 12.8%
Total 3 379 + 15.3% 1 261 + 21.6% 644 + 11.4%
Resident and non-resident custody account holders
Private customers 1 289 + 14.8% 567 + 18.5% 222 + 8.0%
Commercial customers 345 + 17.9% 201 + 20.7% 49 + 9.2%
Institutional investors 5 147 + 16.1% 2 791 + 19.0% 696 + 12.9%
Total 6 780 + 15.9% 3 558 + 19.0% 967 + 11.6%
Source: SNB

Banks in Switzerland 2019 25
In CHF billions
USD Other currencies2019 Year-on-year
change2019 Year-on-year
change
Resident custody account holders
Private customers 111 + 21.3% 29 + 2.3%
Commercial customers 26 + 15.8% 9 + 65.0%
Institutional investors 462 + 14.2% 145 + 15.1%
Total 598 + 15.5% 183 + 14.5%
Non-resident custody account holders
Private customers 303 + 10.9% 56 + 25.1%
Commercial customers 45 + 5.7% 15 + 38.5%
Institutional investors 799 + 9.2% 256 + 20.3%
Total 1 147 + 9.5% 327 + 21.9%
Resident and non-resident custody account holders
Private customers 414 + 13.5% 85 + 16.3%
Commercial customers 71 + 9.2% 24 + 47.3%
Institutional investors 1 260 + 11.0% 400 + 18.4%
Total 1 745 + 11.5% 510 + 19.1%
Banks in Switzerland 201926
6 Income statement as well as appropriation of profit and coverage of losses
SUmmaRY
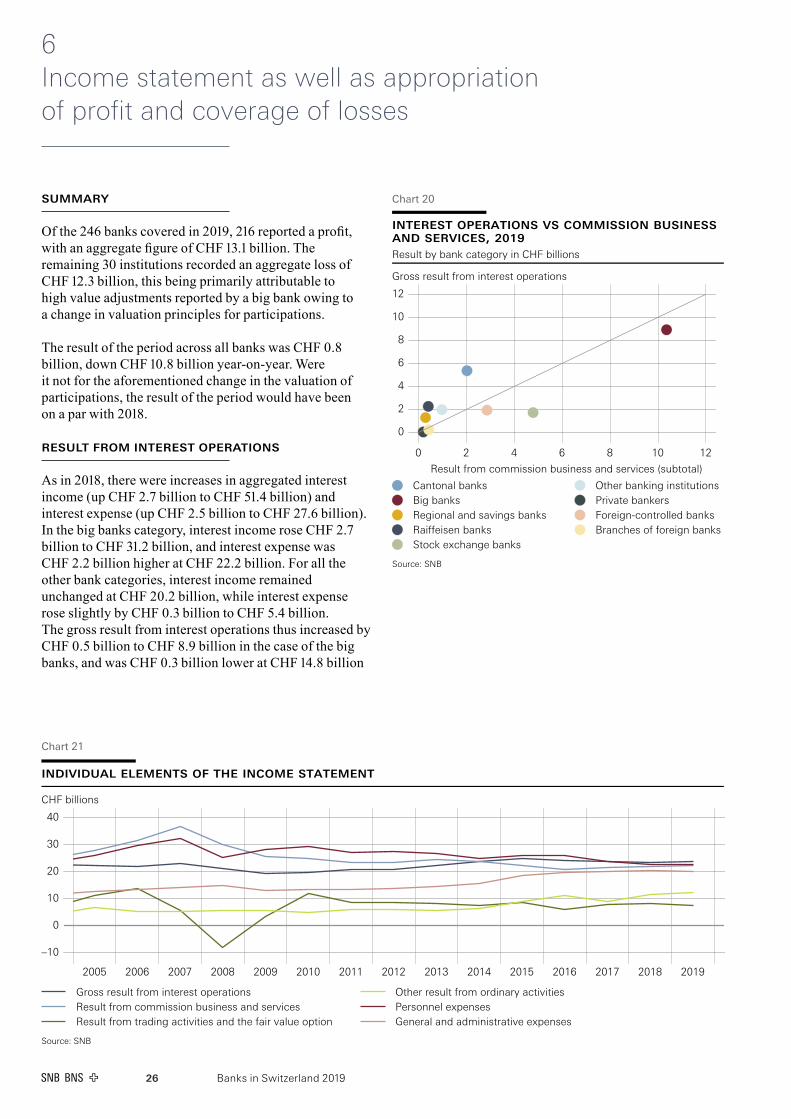
Of the 246 banks covered in 2019, 216 reported a profit, with an aggregate figure of CHF 13.1 billion. The remaining 30 institutions recorded an aggregate loss of CHF 12.3 billion, this being primarily attributable to high value adjustments reported by a big bank owing to a change in valuation principles for participations.
The result of the period across all banks was CHF 0.8 billion, down CHF 10.8 billion year-on-year. Were it not for the aforementioned change in the valuation of participations, the result of the period would have been on a par with 2018.
RESUlt FRom IntERESt opERatIonS
As in 2018, there were increases in aggregated interest income (up CHF 2.7 billion to CHF 51.4 billion) and interest expense (up CHF 2.5 billion to CHF 27.6 billion). In the big banks category, interest income rose CHF 2.7 billion to CHF 31.2 billion, and interest expense was CHF 2.2 billion higher at CHF 22.2 billion. For all the other bank categories, interest income remained unchanged at CHF 20.2 billion, while interest expense rose slightly by CHF 0.3 billion to CHF 5.4 billion. The gross result from interest operations thus increased by CHF 0.5 billion to CHF 8.9 billion in the case of the big banks, and was CHF 0.3 billion lower at CHF 14.8 billion
Chart 21
individual elements of the income statement CHF billions
–10
0
10
20
30
40
2005 2006 2007 2008 2009 2010 2011 2012 2013 2014 2015 2016 2017 2018 2019
Gross result from interest operationsResult from commission business and servicesResult from trading activities and the fair value option
Other result from ordinary activitiesPersonnel expensesGeneral and administrative expenses
Source: SNB
Chart 20
interest operations vs commission businessand services, 2019Result by bank category in CHF billions
Gross result from interest operations
0
2
4
6
8
10
12
0 2 4 6 8 10 12
Result from commission business and services (subtotal)
Cantonal banksBig banksRegional and savings banksRaiffeisen banksStock exchange banks
Other banking institutionsPrivate bankersForeign-controlled banksBranches of foreign banks
Source: SNB

Banks in Switzerland 2019 27
for all the other bank categories. Therefore overall, the gross result from interest operations increased marginally by CHF 0.2 billion (or 1.0%) to CHF 23.8 billion.
Value adjustments and losses related to interest business amounting to CHF 0.8 billion were offset against the gross result from interest operations to give the net result from interest operations, which showed an increase of CHF 0.1 billion or 0.4% to CHF 23.0 billion.
RESUlt FRom commISSIon bUSInESS and SERvIcES
The result from commission business and services increased slightly, rising by CHF 0.4 billion to CHF 22.4 billion. There were differing developments for the various income components and the commission expense. While commission income from lending activities fell by 10.3% to CHF 1.9 billion, that from securities trading and investment activities increased by 3.1% to CHF 21.3 billion and that from other services by 4.2% to CHF 4.4 billion. Commission expense was 4.4% higher at CHF 5.2 billion.
RESUlt FRom tRadInG actIvItIES and thE FaIR valUE optIon
The result from trading activities and the fair value option decreased by CHF 0.8 billion to CHF 7.4 billion, this decline being primarily attributable to the big banks category (down CHF 0.8 billion).
othER RESUlt FRom oRdInaRY actIvItIES
The 'other result from ordinary activities' item was up by CHF 0.9 billion at CHF 12.5 billion. There were differing developments as regards the individual components, however. Income from participations increased by CHF 0.4 billion to CHF 7.5 billion. The big banks category
recorded a rise of CHF 0.3 billion and thus had a significant impact in this regard. Under this item they report the dividend payments they receive from their subsidiaries, and the latter also include institutions in Switzerland with their own banking licence. The result from the disposal of financial investments stood at CHF 0.2 billion, an increase of CHF 0.1 billion. The remaining components all registered declines: other ordinary income by CHF 0.2 billion to CHF 4.5 billion, the result from real estate by CHF 0.1 billion to CHF 0.8 billion, and other ordinary expenses by CHF 0.6 billion to CHF 0.5 billion.
pERSonnEl ExpEnSES aS wEll aS GEnERal and admInIStRatIvE ExpEnSES
Personnel expenses increased by CHF 0.2 billion to CHF 22.7 billion. The general and administrative expenses were CHF 0.4 billion lower at CHF 20.2 billion. The resultant operating expenses thus decreased in total across all banks by CHF 0.3 billion to CHF 42.9 billion.
dEpREcIatIon, valUE adjUStmEntS and pRovISIonS
In 2019, the ‘value adjustments on participations and depreciation and amortisation of tangible fixed assets and intangible assets’ item was significantly higher, up CHF 16.1 billion to CHF 23.8 billion. The big banks category accounted for CHF 21.1 billion of this figure following a rise of CHF 15.7 billion. This resulted from changes made by a big bank to the valuation principles for participations in light of the revision of the accounting rules in 2015, thus complying with the requirement to change from collective to individual (item-by-item) valuation before the transition period expired at the end of 2019.
Chart 22
operating result and result of the period CHF billions
–40
–30
–20
–10
0
10
20
30
2005 2006 2007 2008 2009 2010 2011 2012 2013 2014 2015 2016 2017 2018 2019
Operating result Result of the period (profit/loss) Extraordinary income Extraordinary expenses
Source: SNB
Banks in Switzerland 201928
The ‘changes to provisions and other value adjustments, and losses’ item stood at CHF 0.9 billion, a decrease of CHF 0.3 billion.
opERatInG RESUlt
Aggregated across all banks, the operating result was negative in 2019, with a decline of CHF 15.0 billion leading to a loss of CHF 2.2 billion. The big banks category was a significant factor in this regard, posting an operating result of CHF – 9.9 billion, a drop of CHF 14.7 billion. Taken together, the other bank categories reported an operating result totalling CHF 7.7 billion, down CHF 0.3 billion on 2018.
ExtRaoRdInaRY IncomE and ExtRaoRdInaRY ExpEnSES
Extraordinary income amounted to CHF 5.7 billion in 2019, an increase of CHF 4.4 billion. This came against the backdrop of a reversal made by a big bank of a value adjustment in previous years. Extraordinary expenses were CHF 0.1 billion lower at CHF 0.1 billion.
RESUlt oF thE pERIod (pRoFIt/loSS)
The changes in reserves for general banking risks (CHF – 0.5 billion) and the deduction of taxes (CHF 2.2 billion) are taken into account in calculating the ‘result of the period (profit/loss)’ item. Of the 246 banks covered, 216 reported a profit (2018: 216 of 248). Aggregate profits increased by CHF 0.3 billion to CHF 13.1 billion. The remaining 30 institutions (2018: 32) recorded losses. The aggregate losses were CHF 11.1 billion higher than in 2018 and totalled CHF 12.3 billion.
Taking all banks together, the aggregate result of the period was thus CHF 0.8 billion, down CHF 10.8 billion year-on-year.
The different bank categories registered contrasting results. Following a decline of CHF 10.5 billion, the big banks recorded a loss of CHF 5.6 billion, this being influenced to a significant degree by one of the banks in this category revaluing its participations. All the other bank categories reported profits totalling CHF 6.3 billion, with the cantonal banks (CHF 3.2 billion) and stock exchange banks (CHF 1.1 billion) leading the way.
Banks in Switzerland 2019 29
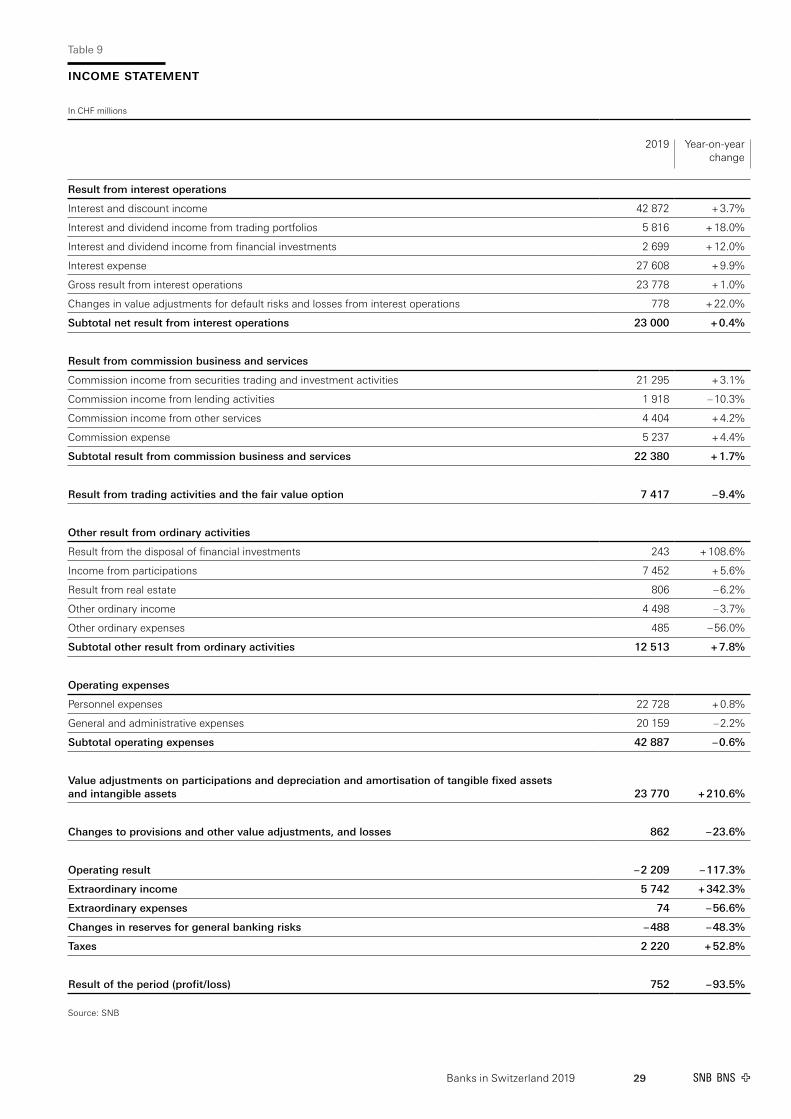
Table 9
IncomE StatEmEnt
In CHF millions
2019 Year-on-year change
Result from interest operations
Interest and discount income 42 872 + 3.7%
Interest and dividend income from trading portfolios 5 816 + 18.0%
Interest and dividend income from financial investments 2 699 + 12.0%
Interest expense 27 608 + 9.9%
Gross result from interest operations 23 778 + 1.0%
Changes in value adjustments for default risks and losses from interest operations 778 + 22.0%
Subtotal net result from interest operations 23 000 + 0.4%
Result from commission business and services
Commission income from securities trading and investment activities 21 295 + 3.1%
Commission income from lending activities 1 918 – 10.3%
Commission income from other services 4 404 + 4.2%
Commission expense 5 237 + 4.4%
Subtotal result from commission business and services 22 380 + 1.7%
Result from trading activities and the fair value option 7 417 – 9.4%
Other result from ordinary activities
Result from the disposal of financial investments 243 + 108.6%
Income from participations 7 452 + 5.6%
Result from real estate 806 – 6.2%
Other ordinary income 4 498 – 3.7%
Other ordinary expenses 485 – 56.0%
Subtotal other result from ordinary activities 12 513 + 7.8%
Operating expenses
Personnel expenses 22 728 + 0.8%
General and administrative expenses 20 159 – 2.2%
Subtotal operating expenses 42 887 – 0.6%
Value adjustments on participations and depreciation and amortisation of tangible fixed assets and intangible assets 23 770 + 210.6%
Changes to provisions and other value adjustments, and losses 862 – 23.6%
Operating result – 2 209 – 117.3%
Extraordinary income 5 742 + 342.3%
Extraordinary expenses 74 – 56.6%
Changes in reserves for general banking risks – 488 – 48.3%
Taxes 2 220 + 52.8%
Result of the period (profit / loss) 752 – 93.5%
Source: SNB

30 Banks in Switzerland 2019
Table 10
appRopRIatIon oF pRoFIt and covERaGE oF loSSES
In CHF millions
2019 Year-on-year change
Result of the period (profit / loss) 752 – 93.5%
Profit carried forward / loss carried forward 4 682 – 10.6%
Distributable profit / accumulated loss 5 433 – 67.6%
Appropriation of profit 12 215 + 1.6%
Allocation to statutory retained earnings reserve 526 – 5.1%
Allocation to voluntary retained earnings reserves 2 550 + 28.5%
Distributions from distributable profit
Distribution to shareholders, company members, proprietors, etc. 8 012 – 2.0%
Allocation to cantons and municipalities 1 001 – 14.5%
Interest on endowment capital 72 + 4.3%
Subtotal distributions from distributable profit 9 085 – 3.5%
Other appropriation of profit
Emoluments 3 – 2.1%
Allocation to staff pension schemes 2 + 83.3%
Other appropriation 49 – 25.8%
Subtotal other appropriation of profit 54 – 23.0%
Coverage of losses 361
Transfers from statutory retained earnings reserve 61
Transfers from voluntary retained earnings reserves 300
New profit / loss carried forward – 6 421 – 215.9%
Source: SNB
Banks in Switzerland 2019 31
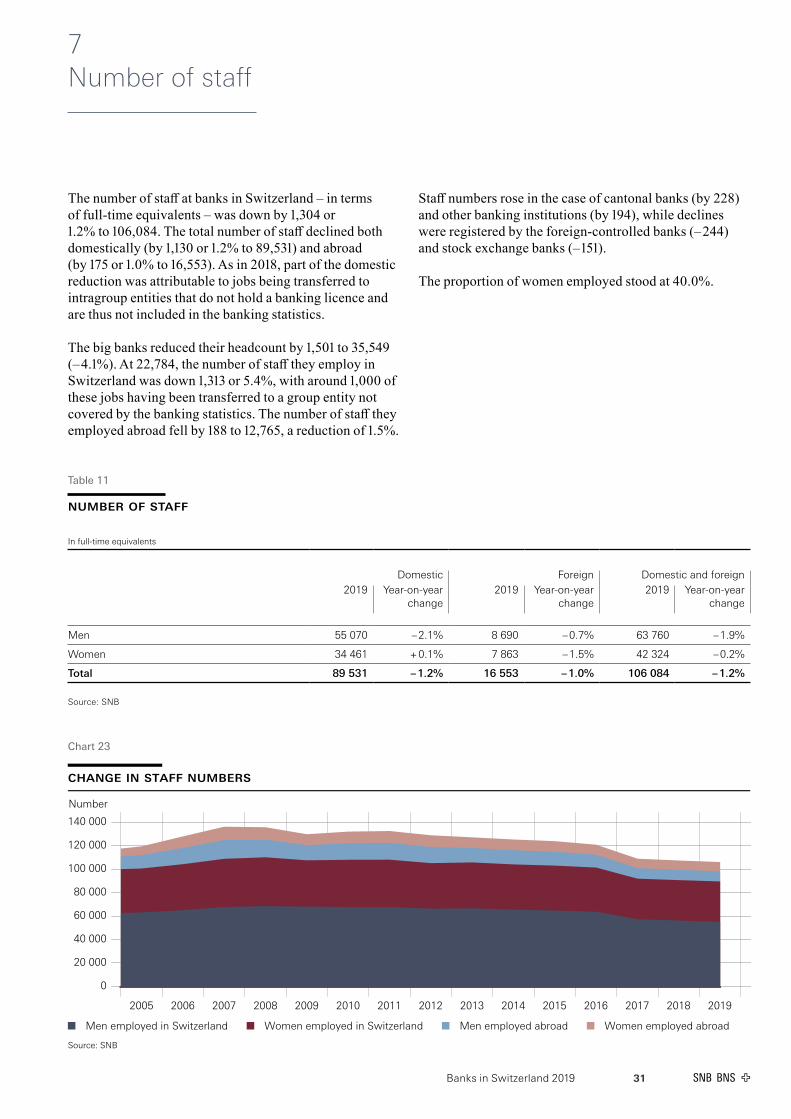
7 Number of staff
The number of staff at banks in Switzerland – in terms of full-time equivalents – was down by 1,304 or 1.2% to 106,084. The total number of staff declined both domestically (by 1,130 or 1.2% to 89,531) and abroad (by 175 or 1.0% to 16,553). As in 2018, part of the domestic reduction was attributable to jobs being transferred to intragroup entities that do not hold a banking licence and are thus not included in the banking statistics.
The big banks reduced their headcount by 1,501 to 35,549 (– 4.1%). At 22,784, the number of staff they employ in Switzerland was down 1,313 or 5.4%, with around 1,000 of these jobs having been transferred to a group entity not covered by the banking statistics. The number of staff they employed abroad fell by 188 to 12,765, a reduction of 1.5%.
Staff numbers rose in the case of cantonal banks (by 228) and other banking institutions (by 194), while declines were registered by the foreign-controlled banks (– 244) and stock exchange banks (– 151).
The proportion of women employed stood at 40.0%.
nUmbER oF StaFF
In full-time equivalents
Domestic Foreign Domestic and foreign2019 Year-on-year
change2019 Year-on-year
change2019 Year-on-year
change
Men 55 070 – 2.1% 8 690 – 0.7% 63 760 – 1.9%
Women 34 461 + 0.1% 7 863 – 1.5% 42 324 – 0.2%
Total 89 531 – 1.2% 16 553 – 1.0% 106 084 – 1.2%
Source: SNB
Table 11
Chart 23
change in staff numbers Number
0
20 000
40 000
60 000
80 000
100 000
120 000
140 000
2005 2006 2007 2008 2009 2010 2011 2012 2013 2014 2015 2016 2017 2018 2019
Men employed in Switzerland Women employed in Switzerland Men employed abroad Women employed abroad
Source: SNB

Banks in Switzerland 201932
8 Average rate of interest and distribution by rate of interest
The following comments refer to the average rate of interest, weighted by stocks, on balance sheet items denominated in Swiss francs.
The average rate of interest on domestic mortgage loans1 declined by 9 basis points to 1.37%. As in the preceding years, all bank categories recorded decreases, ranging from – 4 basis points (stock exchange banks and branches of foreign banks) to – 10 basis points (cantonal banks). The average rate of interest on amounts due from domestic customers was 11 basis points lower at 1.75%.
1 Not comparable with the reference interest rate for tenancies. For this rate, only banks in Switzerland whose domestic mortgage loans in Swiss francs exceed a total amount of CHF 300 million are required to report data.
The average rate of interest on domestic amounts due in respect of customer deposits was down by 1 basis point to 0.11%. The most pronounced decline in this regard was registered by the foreign-controlled banks category, down 4 basis points to 0.07%. The only category to record an increase was branches of foreign banks (up 18 basis points to – 0.13%). The average rate of interest on liabilities from cash bonds fell by 10 basis points to 0.81%, while that on liabilities from bonds, warrant bonds and convertible bonds was 16 basis points lower at 0.93%.
The average rate of interest on amounts due from/to domestic banks in Swiss francs decreased, both on the claims side (by 11 basis points to – 0.01%) and the liabilities side (by 9 basis points to 0.01%).
Chart 24
average rate of interest on selected balance sheet items
%
0.0
0.5
1.0
1.5
2.0
2.5
3.0
3.5
2008 2009 2010 2011 2012 2013 2014 2015 2016 2017 2018 2019
Domestic mortgage loans, in CHF Amounts due in respect of domestic customer deposits, in CHF
Source: SNB


Published by Swiss National Bank Statistics P.O. Box, CH-8022 Zurich Telephone + 41 58 631 00 00
Further [email protected]
LanguagesGerman, French and English
DesignInterbrand Ltd, Zurich
Typeset and printed byNeidhart + Schön Group AG, Zurich
Date of publicationJune 2020
ISSN 1661-6995 (printed version) ISSN 1661-9420 (online version)
Accessing SNB publicationsSwiss National Bank publications are available at www.snb.ch, Publications.
Publication dates are listed at www.snb.ch, Media, Time schedule.
Many of the publications are available in printed form, either as single copies or as a subscription, from: Swiss National Bank, Library P.O. Box, CH-8022 Zurich Telephone + 41 58 631 11 50 Fax + 41 58 631 50 48 Email: [email protected]
Copyright ©The Swiss National Bank (SNB) respects all third-party rights, in particular rights relating to works protected by copyright (information or data, wordings and depictions, to the extent that these are of an individual character).
SNB publications containing a reference to a copyright (© Swiss National Bank/SNB, Zurich/year, or similar) may, under copyright law, only be used (reproduced, used via the internet, etc.) for non-commercial purposes and provided that the source is mentioned. Their use for commercial purposes is only permitted with the prior express consent of the SNB.
General information and data published without reference to a copyright may be used without mentioning the source.
To the extent that the information and data clearly derive from outside sources, the users of such information and data are obliged to respect any existing copyrights and to obtain the right of use from the relevant outside source themselves.
Limitation of liabilityThe SNB accepts no responsibility for any information it provides. Under no circumstances will it accept any liability for losses or damage which may result from the use of such information. This limitation of liability applies, in particular, to the topicality, accuracy, validity and availability of the information.
© Swiss National Bank, Zurich/Berne 2020