Embed Size (px)
Citation preview

Managerial FinanceExplanatory factors of bank dividend policy: revisitedJohn Theis Amitabh S. Dutta
Article information:To cite this document:John Theis Amitabh S. Dutta, (2009),"Explanatory factors of bank dividend policy: revisited", ManagerialFinance, Vol. 35 Iss 6 pp. 501 - 508Permanent link to this document:http://dx.doi.org/10.1108/03074350910956963
Downloaded on: 12 April 2016, At: 00:05 (PT)References: this document contains references to 15 other documents.To copy this document: [email protected] fulltext of this document has been downloaded 2159 times since 2009*
Users who downloaded this article also downloaded:(2015),"Corporate dividend policy revisited", Managerial Finance, Vol. 41 Iss 2 pp. 126-144 http://dx.doi.org/10.1108/MF-03-2014-0077(2007),"Dividend policy: a review", Managerial Finance, Vol. 33 Iss 1 pp. 4-13 http://dx.doi.org/10.1108/03074350710715773(2013),"Did dividend policy change during the financial crisis?", Managerial Finance, Vol. 39 Iss 6 pp.584-606 http://dx.doi.org/10.1108/03074351311322861
Access to this document was granted through an Emerald subscription provided by emerald-srm:320367 []
For AuthorsIf you would like to write for this, or any other Emerald publication, then please use our Emerald forAuthors service information about how to choose which publication to write for and submission guidelinesare available for all. Please visit www.emeraldinsight.com/authors for more information.
About Emerald www.emeraldinsight.comEmerald is a global publisher linking research and practice to the benefit of society. The companymanages a portfolio of more than 290 journals and over 2,350 books and book series volumes, as well asproviding an extensive range of online products and additional customer resources and services.
Emerald is both COUNTER 4 and TRANSFER compliant. The organization is a partner of the Committeeon Publication Ethics (COPE) and also works with Portico and the LOCKSS initiative for digital archivepreservation.
*Related content and download information correct at time of download.
Dow
nloa
ded
by A
mer
ican
Uni
vers
ity in
Cai
ro A
t 00:
05 1
2 A
pril
2016
(PT
)
Bank dividendpolicy
501
Managerial FinanceVol. 35 No. 6, 2009
pp. 501-508# Emerald Group Publishing Limited
0307-4358DOI 10.1108/03074350910956963
Explanatory factors of bankdividend policy: revisited
John Theis and Amitabh S. DuttaD. Abbott Turner College of Business, Columbus State University,
Columbus, Georgia, USA
Abstract
Purpose – The purpose of this paper is to examine the Dickens et al. model of bank holdingcompany dividend policy. They identified five explanatory factors in a sample of bank holdingcompanies (BHCs). Banking companies typically pay larger dividends and more often than industrialfirms. Investors often look at the dividends as being important return variables.Design/methodology/approach – In this study, a sample of 99 firms with 2006 data fromgovernmental reports and Yahoo is used in regression equations to test the relationship of the fiveidentified variables with dividend yields. The analysis is extended to investigate non-linearitiesbetween dividend yield and insider ownership.Findings – The paper finds that the original model is robust, but not all variables keep theirsignificance. Insider holdings have a non-linear relationship with dividend yields.Practical implications – The significant factors affecting bank dividend policy help dividendseeking investors find BHCs that return higher dividend yields.Originality/value – This paper reveals a non-linear link between insider holdings and dividendyields among BHCs.
Keywords Insider holdings, Dividends, Business policy, Banks, Holding companies
Paper type Research paper
1. IntroductionThis study reexamines the factors explaining bank holding company (BHC) dividendpolicy. In the initial paper, Dickens et al. (2003) identified five factors that helped explainbank dividend policy for a sample of banks in 1998. The first model in this studyreplicates the Dickens et al. (2003) study to verify whether their findings hold up for adifferent sample of banks in another period. Other models use asset growth and otherindependent variables to test whether they can add more explanatory power to themodel. The 99 bank holding companies (BHCs) located in Yahoo Finance’s Southeast andMid-Atlantic regions comprise the study’s sample. Yahoo Finance not only providesdaily price and dividends per share, but also the insider holdings variable.
This study confirms and extends the Dickens et al. (2003) model by incorporatingthe impact of non-linearity in insider holdings on bank dividend policy. There are tworeasons to extend the study into the effect of insider holding non-linearity. First,research suggests insider holdings affect debt and dividend policy non-linearly, both inindustrial firms and banks (Morck et al., 1988; Wruck, 1989; Gorton and Rosen, 1995).The second and more important reason is Dickens et al. (2003) performed decileanalysis which revealed the possibility of a non-linear relationship between theindependent variables and dividend yield. This study’s conclusion offers a potentialexplanation for the non-linear relationships between the variables.
2. Literature reviewThe association between insider holdings, as a measure to alleviate agency problems,and agency costs is typically researched and explained on samples of industrial firms.Rozeff (1982) and Easterbrook (1984) were among the earliest proponents of an existing
The current issue and full text archive of this journal is available atwww.emeraldinsight.com/0307-4358.htm
Dow
nloa
ded
by A
mer
ican
Uni
vers
ity in
Cai
ro A
t 00:
05 1
2 A
pril
2016
(PT
)
MF35,6
502
agency relationship. Casey et al. (1999), in a more recent application of the Rozeff model,show dividends changed with the Tax Reform Act of 1986. Dickens et al. (2003)explicitly study bank dividend policy and a set of factors explaining it. Five of theirmodel’s seven variables significantly impact bank dividend policy. The significantvariables are investment opportunities, size, insider holdings, dividend history andrisk.
The relationship between insider holdings and the market value of a firm is notlinear, as seen by Morck et al. (1988) in examining a sample of Fortune 500 industrialfirms. They report the market value of the firm first increases as insider holdingsincrease from 0 to 5 per cent. As insider holdings increase from 5 to 25 per cent, themarket value of the firm decreases. As insider holdings increase beyond 25 per cent, themarket value of the firms again increases. They argue their results are evidence ofmanagerial entrenchment. While lower and higher levels of insider holdings supportthe notion that insider holdings lead to lower agency costs, the middle level ofownership is a range over which managerial control seems to be linked with asignificantly lower market price of equity.
The Morck et al. (1988) non-linearity results may be sample and/or time dependent.However, Wruck (1989) confirms the range of ‘‘entrenchment’’ reported by Morck et al.She finds in a sample of firms announcing a private equity sale firm value increasessignificantly for firms with low and high levels of insider holdings. Her findingsconfirm that, in a middle range of insider holdings, firm value decreases significantly.
In a study tracking the decline of banking in the USA, Gorton and Rosen (1995), finda non-linear relation between insider shareholdings and risk-taking in lending activity.Using a sample of 458 BHCs, they present a model illustrating how managerialownership of banks can lead to entrenchment, resulting in management activities thatreduce firm value. Gorton and Rosen’s findings support the non-linear effect of insiderholdings reported by Morck et al. (1988) for their sample.
Collins et al. (1995) report BHCs often have significant levels of insider holdings –especially among smaller, regional BHCs, like ones in this study. In an earlier paper,Collins et al. (1994), find the level of managerial discretion within BHCs has increaseddue to recent growth in the number of products offered, markets served and servicesprovided.
Dutta et al. (2007) recent study examines the debt and dividend policy of a sample of65 BHCs and how the level of insider holdings impacts such policy. They find lowerlevels of insider holdings are negatively related with dividend payout, but higher levelsof insider holdings are positively related. Their results support the non-linearrelationship between insider holdings and bank dividends.
Based on these research studies, the Dickens et al. (2003) model explaining bankdividend policy would be enhanced by incorporating the non-linearity of insiderholdings and explicitly adding a growth variable. In the Dickens et al. modelinvestment opportunities evidenced by the market to book ratio acts as a prima facieproxy for future growth.
3. Data and methodologyIn total, 99 BHCs appearing in either the Yahoo! Finance Southeast or Mid-Atlanticregional bank holding company index comprise the sample. Sample firms also filedconsolidated Uniform Bank Holding Company Performance Report (UPBR) for 2007with bank regulators and had insider holding information available at Yahoo! Finance.From an initial sample of 120 BHCs, only the 99 sample firms met all criteria.
Dow
nloa
ded
by A
mer
ican
Uni
vers
ity in
Cai
ro A
t 00:
05 1
2 A
pril
2016
(PT
)
Bank dividendpolicy
503
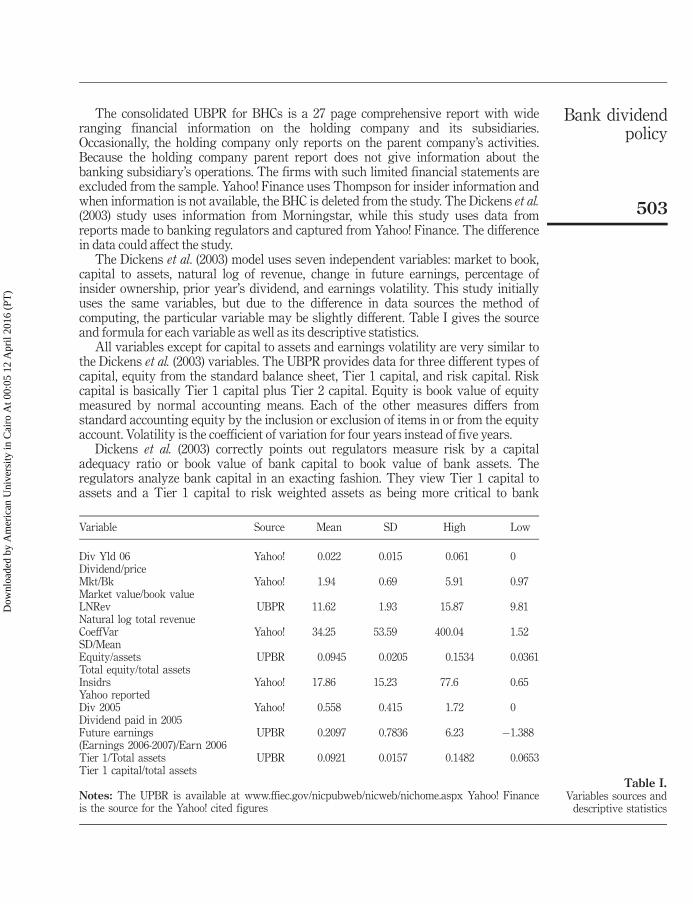
The consolidated UBPR for BHCs is a 27 page comprehensive report with wideranging financial information on the holding company and its subsidiaries.Occasionally, the holding company only reports on the parent company’s activities.Because the holding company parent report does not give information about thebanking subsidiary’s operations. The firms with such limited financial statements areexcluded from the sample. Yahoo! Finance uses Thompson for insider information andwhen information is not available, the BHC is deleted from the study. The Dickens et al.(2003) study uses information from Morningstar, while this study uses data fromreports made to banking regulators and captured from Yahoo! Finance. The differencein data could affect the study.
The Dickens et al. (2003) model uses seven independent variables: market to book,capital to assets, natural log of revenue, change in future earnings, percentage ofinsider ownership, prior year’s dividend, and earnings volatility. This study initiallyuses the same variables, but due to the difference in data sources the method ofcomputing, the particular variable may be slightly different. Table I gives the sourceand formula for each variable as well as its descriptive statistics.
All variables except for capital to assets and earnings volatility are very similar tothe Dickens et al. (2003) variables. The UBPR provides data for three different types ofcapital, equity from the standard balance sheet, Tier 1 capital, and risk capital. Riskcapital is basically Tier 1 capital plus Tier 2 capital. Equity is book value of equitymeasured by normal accounting means. Each of the other measures differs fromstandard accounting equity by the inclusion or exclusion of items in or from the equityaccount. Volatility is the coefficient of variation for four years instead of five years.
Dickens et al. (2003) correctly points out regulators measure risk by a capitaladequacy ratio or book value of bank capital to book value of bank assets. Theregulators analyze bank capital in an exacting fashion. They view Tier 1 capital toassets and a Tier 1 capital to risk weighted assets as being more critical to bank
Table I.Variables sources and
descriptive statistics
Variable Source Mean SD High Low
Div Yld 06 Yahoo! 0.022 0.015 0.061 0Dividend/priceMkt/Bk Yahoo! 1.94 0.69 5.91 0.97Market value/book valueLNRev UBPR 11.62 1.93 15.87 9.81Natural log total revenueCoeffVar Yahoo! 34.25 53.59 400.04 1.52SD/MeanEquity/assets UPBR 0.0945 0.0205 0.1534 0.0361Total equity/total assetsInsidrs Yahoo! 17.86 15.23 77.6 0.65Yahoo reportedDiv 2005 Yahoo! 0.558 0.415 1.72 0Dividend paid in 2005Future earnings UPBR 0.2097 0.7836 6.23 �1.388(Earnings 2006-2007)/Earn 2006Tier 1/Total assets UPBR 0.0921 0.0157 0.1482 0.0653Tier 1 capital/total assets
Notes: The UPBR is available at www.ffiec.gov/nicpubweb/nicweb/nichome.aspx Yahoo! Financeis the source for the Yahoo! cited figures
Dow
nloa
ded
by A
mer
ican
Uni
vers
ity in
Cai
ro A
t 00:
05 1
2 A
pril
2016
(PT
)
MF35,6
504
solvency than accounting capital to assets. This study includes several capitaladequacy ratios for testing. All capital to asset ratios should have a positiverelationship to dividend yield because all measure the regulator perceived risk in theholding company’s operation. While BHCs can file for bankruptcy, normally they donot file unless the subsidiary bank or banks are closed by regulators. The regulator’sperception of the bank’s capitalization should be highly important to management.
In the Dickens et al. (2003) model, the book to market ratio is a proxy for investmentopportunities. Investors perceive the market value of the BHC’s assets less its liabilitiesto be greater than the book value of its common stock. A large market to book ratiomeans management makes good investment decisions. The UBPR includes a variablemeasuring annual asset growth. This study uses the asset growth variable to furtherinvestigate the investment opportunities available for management as a determinant ofdividend policy. The expected sign of both investment opportunity variables isnegative.
Insider holdings may have a non-linear relationship with dividends. In Dutta et al.(2007) low levels of insider ownership are consistent with low dividends. In general,dividends increased with the level of ownership. Both Dickens et al. (2003) and Duttaet al. found the relationship to be non-linear. Extended models test the non-linearrelationship of dividends with insider ownership squared and the square root of insiderownership. The anticipated sign of this variable is negative.
Prior dividends should have a positive and strong relationship with futuredividends. Fama and Babiak (1968) argue for a simple explanation. Firms set adividend level and tend to let it remain. Later research including Bhattacharya (1979)and Miller and Rock (1985), look at dividends as a signaling device to tell outsiders thefirm has strong cash flows and that it is valuable. Goyal and Welch (2003) point outthat dividend yields are highly autocorrelated. Their finding lends evidence to Famaand Babiak’s argument. Once a dividend is set, firms are loath to reduce it. Theanticipated sign of the prior dividend variable is positive.
Barclay et al. (1995) use abnormal earnings for a signaling variable. This study usesthe same future earnings variable as Dickens et al. (2003) to model management’ssignaling. The percentage change in income from 2006 to 2007 acts as an additionalsignaling parameter in the model. The anticipated sign is positive for future earnings.
Firms with stable earnings tend to pay dividends while firms with fluctuatingearnings do not. Dickens et al. (2003) investigated variability of earnings using thecoefficient of variation for five years. This study uses the coefficient of variation forfour years ending with 2006. The higher the coefficient of variation, the lowerdividends yield.
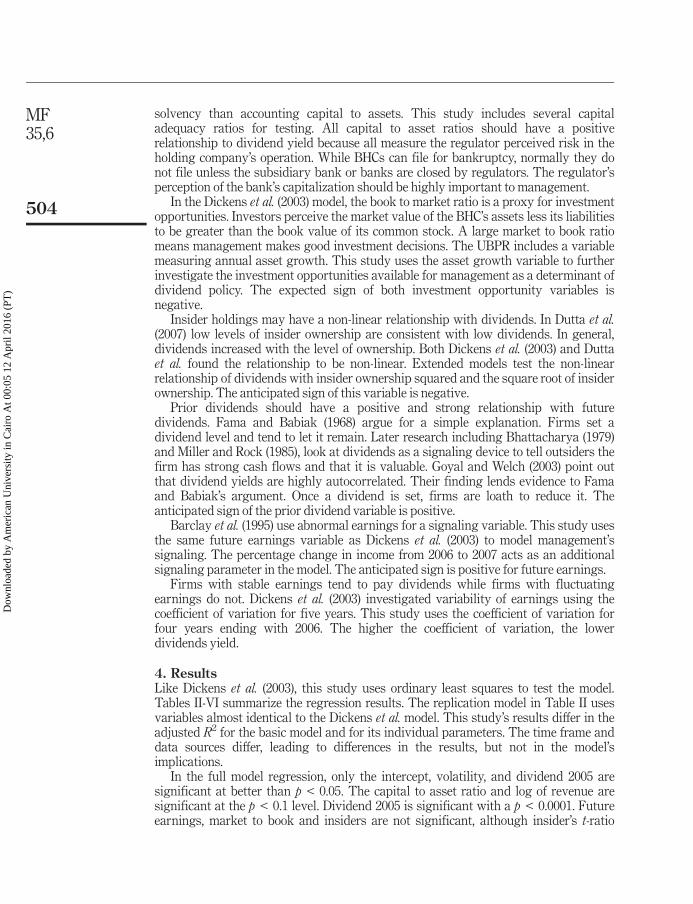
4. ResultsLike Dickens et al. (2003), this study uses ordinary least squares to test the model.Tables II-VI summarize the regression results. The replication model in Table II usesvariables almost identical to the Dickens et al. model. This study’s results differ in theadjusted R2 for the basic model and for its individual parameters. The time frame anddata sources differ, leading to differences in the results, but not in the model’simplications.
In the full model regression, only the intercept, volatility, and dividend 2005 aresignificant at better than p < 0.05. The capital to asset ratio and log of revenue aresignificant at the p < 0.1 level. Dividend 2005 is significant with a p < 0.0001. Futureearnings, market to book and insiders are not significant, although insider’s t-ratio
Dow
nloa
ded
by A
mer
ican
Uni
vers
ity in
Cai
ro A
t 00:
05 1
2 A
pril
2016
(PT
)
Bank dividendpolicy
505
is�1.64, or a p value of 0.1051. The results differ from Dickens et al. (2003) in which allbut capital to asset ratio and volatility were significant.
Dividend 2005’s relationship with 2006 dividend yields is positive and the mostsignificant of all independent variables. In a regression containing the two dividendvariables yields and dividend 2005 as the independent variable, the adjusted R2 is 0.49with its significance at better than the p < 0.0001 level. BHCs paying dividends in 2005likely paid a similar dividend in 2006. BHCs in the sample show a strong connectionbetween prior dividends and today’s dividends. Another model may discern whetherthe connection arises from Fama and Babiak (1968) with its premise or of the signalinghypothesis proposed by Bhattacharya (1979) and Miller and Rock (1985).
Capital to assets is positive and significant at p < 0.1. Tier 1 capital to total assets isalso positive and with the same significance as capital to assets. Table III summarizesthese results. Dividing Tier 1 capital by risk weighted assets yielded insignificantresults in the full model. The risk component in the dividend decision appearsidentified with a basic capital ratio among the sample firms.
The market to book ratio did not perform as well as the annual asset growthvariable in the main model regression. It was almost significant at p < 0.1051. Neithermarket to book nor annual asset growth are strong indicators of investmentopportunities in the sample BHCs. Additional study may provide more insight into abetter measure for investment opportunities. The addition of an explicit annual growthvariable did not enhance the trade-offs between paying dividends and reinvesting inthe bank’s total assets. The variable used was growth in assets over the previous year.As this variable was not significant and did not improve the model, the results are notshown. The results are available from the authors on request.
This study’s model provides a vehicle to examine the non-linear relationshipbetween insider holdings and dividend yield. Replacing insider holdings with thesquare and the square root of insider holdings in the basic model gives a sense ofexisting non-linearities. Each insider variable enters the model in turn and provides
Table II.Results for the basic
model – adjustedR2 ¼ 0.5443
Intercept Mkt to Bk LNRev CoeffVar Equity/assets Insidrs Div 2005 Future earnings
0.029(2.09)*
�0.0022(�1.34)
�0.0020(�1.86)**
�0.0005(�2.09)*
0.1133(1.97)**
�0.00012(�1.64)
0.024(7.21)***
�0.00087(�0.64)
Notes: The regression coefficients are under the relevant variable name. Underneath eachcoefficient value is its t-ratio. Superscripts denote the parameter’s significance. The superscript*, ** and *** indicate significance at p < 0.05, p < 0.1 and p < 0.0001, respectively
Table III.Results for Tier 1/total
assets – adjustedR2 ¼ 0.5408
Intercept Mkt to Bk LNRev CoeffVar Tier 1/assets Insidrs Div 2005 Future earnings
0.019(1.03)
�0.003(�2.00)*
�0.0011(�0.89)
�0.00003(�1.84)**
0.1373(1.79)**
�0.00014(�1.98)*
0.024(7.29)***
�0.00109(�0.81)
Notes: The regression coefficients are under the relevant variable name. Underneath eachcoefficient value is its t-ratio. Superscripts denote the parameter’s significance. The superscript*, ** and *** indicate significance at p < 0.05, p < 0.1 and p < 0.0001, respectively
Dow
nloa
ded
by A
mer
ican
Uni
vers
ity in
Cai
ro A
t 00:
05 1
2 A
pril
2016
(PT
)
MF35,6
506
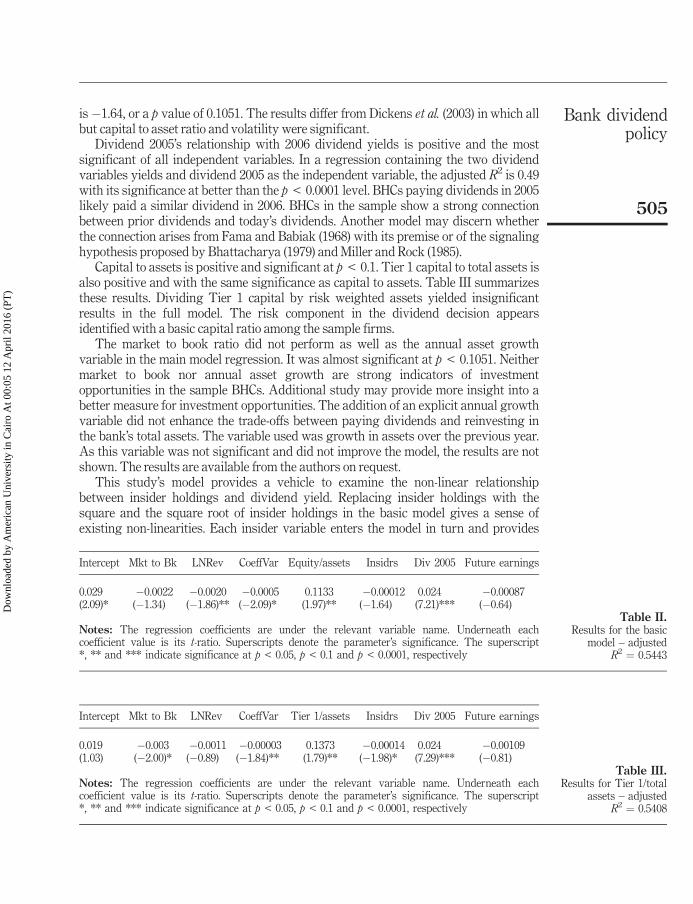
insight into non-linearities through an examination of changes in other variables andthe model’s fit as demonstrated by its adjusted R2.
Tables II-VI present the step-by-step development of the enhanced model. Table IVshows the regression of the model with insiders squared substituting for insiderholdings used in the basic model shown in Table II. The essential signs and levels ofsignificance remain practically unchanged, except for each significant variable inTable II having slightly higher t ratios. The insiders squared variable itself issignificant and negative at the p ¼ 0.10 level as compared to insiders which isinsignificant [p ¼ 0.1051]. There is little change in adjusted R2 between Table II, 0.5443and Table IV, 0.5454.
In Table V, the insiders square-root variable enters the basic model in place of theinsiders. The relationships across all variables are almost identical with Table IV.Square root insiders is significant and negative at the p ¼ 0.10 level and the adjustedR2 is also practically unchanged at 0.5467.
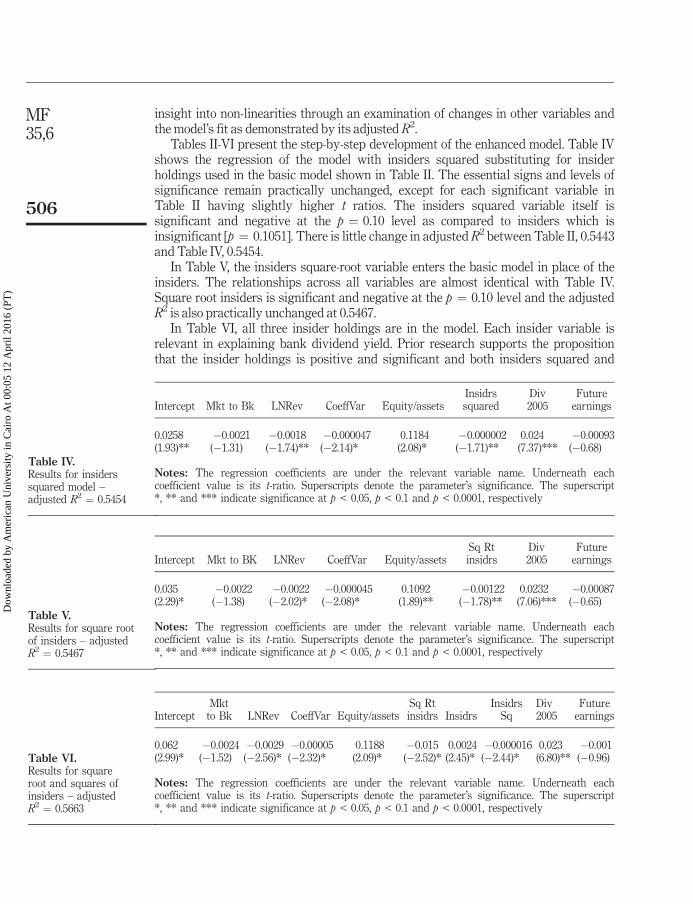
In Table VI, all three insider holdings are in the model. Each insider variable isrelevant in explaining bank dividend yield. Prior research supports the propositionthat the insider holdings is positive and significant and both insiders squared and
Table VI.Results for squareroot and squares ofinsiders – adjustedR2 ¼ 0.5663
InterceptMkt
to Bk LNRev CoeffVar Equity/assetsSq Rtinsidrs Insidrs
InsidrsSq
Div2005
Futureearnings
0.062(2.99)*
�0.0024(�1.52)
�0.0029(�2.56)*
�0.00005(�2.32)*
0.1188(2.09)*
�0.015(�2.52)*
0.0024(2.45)*
�0.000016(�2.44)*
0.023(6.80)**
�0.001(�0.96)
Notes: The regression coefficients are under the relevant variable name. Underneath eachcoefficient value is its t-ratio. Superscripts denote the parameter’s significance. The superscript*, ** and *** indicate significance at p < 0.05, p < 0.1 and p < 0.0001, respectively
Table IV.Results for insiderssquared model –adjusted R2 ¼ 0.5454
Intercept Mkt to Bk LNRev CoeffVar Equity/assetsInsidrssquared
Div2005
Futureearnings
0.0258(1.93)**
�0.0021(�1.31)
�0.0018(�1.74)**
�0.000047(�2.14)*
0.1184(2.08)*
�0.000002(�1.71)**
0.024(7.37)***
�0.00093(�0.68)
Notes: The regression coefficients are under the relevant variable name. Underneath eachcoefficient value is its t-ratio. Superscripts denote the parameter’s significance. The superscript*, ** and *** indicate significance at p < 0.05, p < 0.1 and p < 0.0001, respectively
Table V.Results for square rootof insiders – adjustedR2 ¼ 0.5467
Intercept Mkt to BK LNRev CoeffVar Equity/assetsSq Rtinsidrs
Div2005
Futureearnings
0.035(2.29)*
�0.0022(�1.38)
�0.0022(�2.02)*
�0.000045(�2.08)*
0.1092(1.89)**
�0.00122(�1.78)**
0.0232(7.06)***
�0.00087(�0.65)
Notes: The regression coefficients are under the relevant variable name. Underneath eachcoefficient value is its t-ratio. Superscripts denote the parameter’s significance. The superscript*, ** and *** indicate significance at p < 0.05, p < 0.1 and p < 0.0001, respectively
Dow
nloa
ded
by A
mer
ican
Uni
vers
ity in
Cai
ro A
t 00:
05 1
2 A
pril
2016
(PT
)
Bank dividendpolicy
507
square root insiders are negative and significant. The one drawback to this approach isthe problem of multicollinearity. One indicator of multicollinearity is a large increase incoefficients of other explanatory variables between Table VI and previous ones. Theresults of Table VI are very interesting, but not exactly as anticipated. All three insidervariables are significant at less than p ¼ 0.02 level. The insider holdings variable issignificant and positive, the insider squared and square root insiders are bothsignificant and negative. This analysis is clearly indicative of non-linear relationshipsbetween the level of insider holdings and dividend yield in the sample. The signs arecontrary to prior expectations, but they are significant. In order to delve more deeplyand accurately into these relationships requires further examination on a largersample. The overall fit of Table VI is slightly better relative to the basic model, with anAdjusted R2 of 0.5663, as compared to 0.5443.
5. ConclusionThis study proposed to execute two primary objectives. First, to test the Dickens et al.(2003) model on explanatory factors for bank dividend policy by using a differentsample, different data sources, and a different time frame from their study. The earliermodel is quite robust and this study’s results support several of the explanatory factorsproposed by Dickens et al. Using the BHC’s dividends as the dependent variable, thisstudy finds four of the seven variables in the 2003 model are significant. Earningsvolatility and natural log of revenue are significant and negative and past dividendspaid and equity-to-assets are both significant and positive. The Dickens et al (2003)model found five of the seven variables significant. It must be acknowledged that thisstudy’s basic model and the Dickens et al one differ in the significance of individualvariables. Summary statistics for the samples used in the 2003 and 2008 models(Tables II to VI and I, respectively) show size and scale variations in explanatoryvariables across the studies which could account for differences in the results. Overall,based on this study’s results, the Dickens et al. model appears robust.
This study’s second objective is to determine whether insider holdings of BHCshave a non-linear relationship with bank dividend yields and if that relationship mightexplain observed anomalies. The results from several models lead us to conclude a non-linear relationship exists between insider holdings and bank dividend yield. Furtherresearch on the exact nature of the relationship is necessary to achieve generalizableresults.
References
Barclay, M.J., Smith, C.W. Jr and Watts, R.L. (1995), ‘‘The determinants of corporate leverage anddividend policy’’, Journal of Applied Corporate Finance, Vol. 7 No. 4, Winter, pp. 4-19.
Bhattacharya, S. (1979), ‘‘Imperfect information, dividend policy, and the ‘Bird-in-the-Hand’fallacy’’, Bell Journal of Economics, Vol. 10 No. 1, Spring, pp. 259-70.
Casey, K.M., Anderson, D.C., Mesak, H.I. and Dickens, R.N. (1999), ‘‘Examining the impact of the1986 Tax Reform Act on corporate dividend policy: a new methodology’’, The FinancialReview, Vol. 34 No. 3, pp. 33-46.
Collins, M.C., Blackwell, D.W. and Sinkey, J.F. Jr (1994), ‘‘Financial innovation, investmentopportunity and corporate policy choices for large bank holding companies’’, TheFinancial Review, Vol. 29, pp. 223-47.
Collins, M.C., Blackwell, D.W. and Sinkey, J.F. Jr (1995), ‘‘The relationship between corporatecompensation policies and investment opportunities: empirical evidence for large bankholding companies’’, Financial Management, Vol. 24, pp. 40-53.
Dow
nloa
ded
by A
mer
ican
Uni
vers
ity in
Cai
ro A
t 00:
05 1
2 A
pril
2016
(PT
)
MF35,6
508
Dickens, R.N., Casey, K.M. and Newman, J.A. (2003), ‘‘Bank dividend policy: explanatory factors’’,Quarterly Journal of Business and Economics, Vol. 41 Nos. 1-2, pp. 3-13.
Dutta, A.S., Collins, M.C. and Wansley, J.W. (2007), ‘‘Managerial ownership and dividend policy inthe US banking industry’’, (under review, and a working paper available from the authors).
Easterbrook, F.H. (1984), ‘‘Two agency-cost explanations of dividends,’’ American EconomicReview, Vol. 74 No. 4, pp. 650-9.
Fama, E.F. and Babiak, H. (1968), ‘‘Dividend policy: an empirical analysis’’, Journal of theAmerican Statistical Association, Vol. 63 No. 324, pp. 1132-61.
Gorton, G. and Rosen, R. (1995), ‘‘Corporate control, portfolio choice, and the decline of banking’’,The Journal of Finance, pp. 1377-420.
Goyal, A. and Welch, I. (2003), ‘‘Predicting the equity premium with dividend ratios’’,Management Science, Vol. 49 No. 5, pp. 639-54.
Miller, M. and Rock, K. (1985), ‘‘Dividend policy under asymmetric information’’, The Journal ofFinance, Vol. 40 No. 4, pp. 1031-51.
Morck, R., Shleifer, A. and Vishny, R. (1988), ‘‘Management ownership and market valuation: anempirical analysis’’, Journal of Financial Economics, Vol. 20 Nos. 1-2, pp. 293-315.
Rozeff, M.S. (1982), ‘‘Growth, beta and agency costs as determinants of dividend payout ratios’’,The Journal of Financial Research, Vol. 5 No. 3, pp. 249-59.
Wruck, K.H. (1989), ‘‘Equity ownership concentration and firm value: evidence from privateequity financings’’, Journal of Financial Economics, Vol. 23 No. 1, pp. 3-28.
Corresponding authorJohn Theis can be contacted at: [email protected]
To purchase reprints of this article please e-mail: [email protected] visit our web site for further details: www.emeraldinsight.com/reprints
Dow
nloa
ded
by A
mer
ican
Uni
vers
ity in
Cai
ro A
t 00:
05 1
2 A
pril
2016
(PT
)
This article has been cited by:
1. Badar Nadeem Ashraf School of Management, Huazhong University of Science and Technology, Wuhan,China Changjun Zheng School of Management, Huazhong University of Science and Technology, Wuhan,China . 2015. Shareholder protection, creditor rights and bank dividend policies. China Finance ReviewInternational 5:2, 161-186. [Abstract] [Full Text] [PDF]
2. Badar Nadeem Ashraf, Sidra Arshad, Mohammad Morshedur Rahman, Muhammad Abdul Kamal, KhalidKhan. 2015. Regulatory hypothesis and bank dividend payouts: Empirical evidence from Italian bankingsector. Journal of Financial Engineering 02, 1550009. [CrossRef]
3. William C Handorf. 2015. Bank holding company dividend policy, regulatory guidance and the GreatRecession. Journal of Banking Regulation . [CrossRef]
4. Tao Zeng. 2011. Intercorporate Ownership, Taxes, and Corporate Payout Choices*. Accounting Perspectives10:10.1111/apr.2011.10.issue-4, 265-283. [CrossRef]
Dow
nloa
ded
by A
mer
ican
Uni
vers
ity in
Cai
ro A
t 00:
05 1
2 A
pril
2016
(PT
)