Embed Size (px)
Citation preview

BANK SUPERVISION DEPARTMENT
BANKING SECTOR IN SERBIA
First Quarter Report 2017
June 2017

2
Contents:
1 BASIC INFORMATION .................................................................................... 3 1.1 Selected parameters of the Serbian banking sector ...................................... 3 1.2 Concentration and competition ..................................................................... 4
2 PROFITABILITY ............................................................................................... 6 2.1 Profitability indicators ................................................................................. 6
2.2 Structure of the results .................................................................................. 7 2.3 Operating income ......................................................................................... 9 2.4 Operating expenses ..................................................................................... 10
3 BANKING SECTOR ASSETS ......................................................................... 11 3.1 Level and structure ..................................................................................... 11 3.2 Classified assets .......................................................................................... 13 3.3. Loans ......................................................................................................... 14
3.4. Non-performing loans ............................................................................... 16 4 BANKING SECTOR LIABILITIES ................................................................ 23
4.1 Structure of the sources of funding ............................................................ 23 4.2 Deposits ...................................................................................................... 24
4.3 Total borrowing of banks ........................................................................... 26 4.4 External liabilities ....................................................................................... 27 4.5 Subordinated liabilities ............................................................................... 28
5 OFF-BALANCE SHEET ITEMS ..................................................................... 29 6 BANK LIQUIDITY .......................................................................................... 31
7 CAPITAL ADEQUACY ................................................................................... 32 8 FOREIGN EXCHANGE RISK ......................................................................... 34
9 NBS REGULATORY ACTIVITY ................................................................... 35

Banking Sector in Serbia – First Quarter Report 2017
3
1 BASIC INFORMATION
1.1 Selected parameters of the Serbian banking sector1
At end-March 2017, the Serbian banking sector numbered 31 banks2 consisting of
1,716 business units (three units fewer than a quarter earlier) that employed a total of
23,798 persons (49 persons fewer than a quarter earlier).
Table 1.1 Selected parameters of the Serbian banking sector
(in RSD bln, in %)
Number of
banks
Assets Capital Network Employment
Amount Share Amount Share
Number of
business units
1)
Share Number of employees
Share
Banks in domestic ownership 9
754 23.5%
139 21.8%
543 31.6%
6,297 26.5%
State-owned 6 543 16.9% 79 12.4% 438 25.5% 5,211 21.9% Privately-
owned 3 211 6.6% 60 9.4% 105 6.1% 1,086 4.6%
Banks in foreign ownership 21 2,454 76.5% 500 78.2% 1,173 68.4% 17,501 73.5%
Italy 2 867 27.0% 182 28.4% 243 14.2% 4,218 17.7%
Austria 3 499 15.5% 98 15.3% 210 12.2% 3,223 13.5%
Greece 4 392 12.2% 94 14.8% 282 16.4% 4,195 17.6%
France 2 325 10.1% 51 7.9% 179 10.4% 2,259 9.5%
Other 10 371 11.6% 75 11.8% 259 15.1% 3,606 15.2%
Total banking sector 30 3,208 100.0% 639 100.0% 1,716 100.0% 23,798 100.0%
1) Business units include all business network parts: headquarters, branches, branch offices, teller units and other business
units.
Source: NBS.
The downward trend in banking sector employment extended into the first quarter of
2017. Employment fell by a total of 49 persons in Q1 as 14 banks reduced their number of
employees by a total of 133 persons and 13 banks hired a total of 84 new people. Changes
in the number of business units in Q1 2017 were as follows: six banks scaled down their
network by closing a total of 13 units, while three banks opened 10 new business units.
At end-March 2017, the total net balance sheet assets of the Serbian banking sector
equalled RSD 3,208.0 bln (a 1.0% decrease from end-2016) and total capital RSD 638.7 bln
(up by 1.0% from end-2016).
Compared with the previous quarter, the market share of banks in the majority
ownership of domestic entities (private entities and the Republic of Serbia) edged up in
both nominal and relative terms (from 23.3% to 23.5%). A change in ownership with one
1 All data in the Report are based on reports that banks are required to submit to the NBS. These reports have
not been audited by external auditors or verified by NBS on-site supervisors. 2 Bank of China Srbija a.d. Beograd was licensed on 20 December 2016, but data on its operations are not
included.

National Bank of Serbia
4
foreign-owned bank and transition into the ownership of domestic entities is the main
reason for the above change. Consequently, the share of banks in the majority ownership of
foreign entities declined (from 76.7% to 76.5%).
Banks from Italy, Austria, Greece and France (11 banks) continued to account for
the dominant share in total banking sector assets – 64.8%, showing a barely perceptible
decrease of 0.2 pp relative to the end of 2016.
1.2 Concentration and competition
The Serbian banking sector still maintains an acceptable degree of competition and low
concentration of activities. The Herfindahl Hirschman index3 values indicate the absence of
concentration in all observed categories. As is common for the Serbian banking sector, the
highest level of the index was observed in deposits (chiefly household deposits), while the
lowest figure was noted for gross total loans and loans to households.
Table 1.2.1 Concentration and competition indicators
(share in %)
Top 5 banks Top 10 banks HHI 1)
Assets 54.7 77.7 811
Gross lending (total) 51.2 74.5 732
Household loans 50.1 76.3 732
Corporate loans 52.7 78.4 772
Deposits (total) 54.5 78.4 826
Household deposits 57.0 80.4 944
Income (total) 51.2 75.6 733
Interest 50.8 75.7 733
Fees and commissions 57.2 80.5 877 1)
Herfindahl Hirschman Index of concentration
Source: NBS.
In Q1 2017, the ten biggest banks in Serbia increased their market share in terms of the
banking sector’s net balance sheet assets and deposits (as at 31 March 2017: 77.6% and
78.4%, respectively), while their share of gross loans declined to 74.5%.
3 The Herfindahl Hirschman Index (HHI) is calculated as the sum of square values of individual bank shares in
the category observed (assets, loans, deposits, etc.). The HHI up to 1,000 indicates that there is no market
concentration; 1,000–1800 indicates moderate concentration; above 1,800 indicates high concentration.

Banking Sector in Serbia – First Quarter Report 2017
5
In terms of balance sheet assets, there was no change in the rankings of the top ten
banks in Serbia at end-March 2017. Banca Intesa a.d. Beograd maintained the leading
position among the top ten banks, as its share rose by 0.1 pp from the previous quarter.
(RSD bln, %)
Amount Share Ranking Amount Share Ranking Amount Share Ranking
Banca Intesa A.D.- Beograd 478 15.7 1 551 17.0 1 550 17.1 1
Komercijalna banka A.D.-
Beograd410 13.5 2 400 12.3 2 382 11.9 2
Unicredit Bank Srbija A.D.-
Beograd305 10.0 3 332 10.2 3 317 9.9 3
Raif f eisen Banka A.D.- Beograd 238 7.8 4 254 7.8 4 260 8.1 4
Societe Generale banka Srbija
A.D.- Beograd225 7.4 5 236 7.3 5 245 7.6 5
Agroindustrijska komercijalna
banka AIK banka akcionarsko
društv o, Beograd
178 5.9 6 184 5.7 6 187 5.8 6
Eurobank A.D.- Beograd 141 4.6 7 151 4.6 7 150 4.7 7
Erste Bank A.D.- Nov i Sad 121 4.0 10 143 4.4 8 145 4.5 8
Banka Poštanska štedionica A.D.-
Beograd129 4.2 8 133 4.1 9 132 4.1 9
Vojv ođanska banka A.D.- Nov i Sad 122 4.0 9 126 3.9 10 126 3.9 10
Source: NBS
Table 1.2.2. Top ten banks according to the total assets criterion
31/03/2016 31/12/2016 31/03/2017
Δ Г Δ Т

National Bank of Serbia
6
2 PROFITABILITY
2.1 Profitability indicators 4
At end-Q1 2017, the Serbian banking sector boasted a positive result of RSD 18.1 bln,
which is an improvement relative to the corresponding period last year.
A total of 24 banks operated with profit equalling RSD 18.6 bln, while six banks
reported losses in the total amount of RSD 0.5 bln. The profit and loss generating items of
the banking sector were concentrated: seven banks with the highest net profit contributed
75.5% to total banking sector profit, while one bank with the highest net loss accounted for
57.3% of total banking sector losses. The six banks operating with a loss at the end of the
quarter account for an extremely low market share of 1.8%.
4 In line with the amendments to accounting regulations (Chart of Accounts and forms of financial statements),
the methodology for calculating some profitability indicators has been changed, starting from 31 December
2014.
8.097.25
14.33
18.13
-10
0
10
20
3.2014. 3.2015. 3.2016. 3.2017.
Profit Loss Net result
Source: National Bank of Serbia.
Chart 2.1.1 Pre tax result(in RSD bln)

Banking Sector in Serbia – First Quarter Report 2017
7
The increase in the banking sector’s profitability at end-Q1 2017 was accompanied by a
y-o-y improvement in profitability indicators both in terms of the return on assets (ROA)
and return on equity (ROE). ROA equalled 2.25% at end-Q1 2017 (rising by 0.37 pp y-o-y)
and ROЕ 11.41% (up by 2.23 pp y-o-y).
2.2 Structure of the results
The key impetus to improvement in the banking sector’s net profit was an increase in
other income which measured RSD 3.7 bln in Q1 2017, up by RSD 2.7 bln. The major part
of the increase is attributable to higher income due to a RSD 1.9 bln reduction in liabilities
recorded with one foreign bank.
The second factor exerting a favourable effect on profitability in the observed quarter
was a further reduction in net credit losses, which equalled RSD 1.2 bln – 52.8% lower than
what was recorded in the same period of 2016 (RSD 2.5 bln). This resulted from the fact
that net expenses from indirect write-offs of on-balance sheet items dropped by 28.3% y-o-
y (from RSD 2.4 bln to RSD 1.7 bln). Banks recorded a net income of RSD 384 mln from
collected write-offs, whereas in the corresponding period last year direct write-offs resulted
in net expenses of RSD 334 mln. Provisioning for credit-risk off-balance sheet items
generated net income in the first quarters of both 2016 and 2017, with net income in 2017
equalling RSD 153 mln (RSD 62 mln lower than in Q1 2016).
Q1 2017 was also marked by lower net interest income, while net income from fees and
commissions rose 6.2% relative to the same period a year earlier.
1.15
0.98
1.882.255.42
4.69
9.18
11.41
-1.0
1.0
3.0
5.0
7.0
9.0
11.0
13.0
3.2014. 3.2015. 3.2016. 3.2017.
ROA ROE
Source: National Bank of Serbia.
Chart 2.1.2 Banking sector profitability indicators(in %)
National Bank of Serbia
8
Net interest gains equalled RSD 30.5 bln, down by 1.8% relative to Q1 2016, due to the
continued fall in interest income (by RSD 2.4 bln y-o-y) which was steeper than the
decrease in interest expenses (by RSD 1.8 bln y-o-y). As for the banking sector’s total
interest income in the observed quarter, 74.7% was generated on loans, 20.4% on securities
and 2.1% on deposits, while on the expense side, expenses on deposits were dominant with
73.4%, followed by loans with 18.7% and securities with 6.4%. The sharpest decrease was
recorded for interest income on dinar loans – by 6.2% (or RSD 1.8 bln). In terms of the
composition of total interest expenses, the largest decline was recorded in interest expenses
on FX deposits (by RSD 1.1 bln or 37.7%).
Unlike interest income and expenses which did not reach 2016 levels, income and
expenses from fees and commissions rose by 6.9% and 8.5% respectively, which, put
together, pushed net income from fees and commissions up by 6.2% or RSD 514 mln.
At end-Q1 2017, net profit on securities equalled RSD 1.4 bln, up by RSD 1.1 bln from
a year earlier. The rise is attributable to higher net income recorded with financial assets
held for trading (by RSD 676 mln), financial assets available for sale and assets initially
recognised at fair value through the income statement, while hedging activities (hedging
derivatives) recorded net expenses. Within financial assets held for trading, income and
expenses on the changes in the value of derivatives held for trading were dominant,
accounting for over 90% of these assets and posting a net income of RSD 783 mln.
0
2
4
6
8
10
12
14
16
18
20
Net result Мarch 2016
Net interest Net fees Other income net Operatingexpenses
Credit losses Exchange rateeffect
Net result March2017
Source: National Bank of Serbia.
Chart 2.2 Structure of net result(in RSD bln)

Banking Sector in Serbia – First Quarter Report 2017
9
At end-Q1 2017, the net exchange rate effect on the banking sector’s result was
positive given that net income on this account amounted to RSD 1.6 bln, recording,
however, a fall by 29.9% y-o-y. Net exchange rate losses in respect of foreign currency
receivables and liabilities came at RSD 3.3 bln (compared to net losses of RSD 8.0 bln in
2016), while net exchange rate gains from receivables and liabilities with an agreed
currency clause amounted to RSD 4.9 bln (compared to net gains of RSD 10.2 bln in the
same period a year earlier).
2.3 Operating income
In Q1 2017, the banking sector’s total operating income equalled RSD 45.9 bln, up by
7.3% relative to the same period a year earlier. The major driver of this increase was the
rise in other income, previously described as the key generator of generated profit.
(in RSD mln)
Result Net interest Net f ees Credit lossesExchange rate
ef f ect
31/03/2017 18,131 30,484 8,759 -1,197 1,555
31/03/2016 14,331 31,048 8,246 -2,537 2,218
27% -2% 6% -53% -30%
Source: NBS
Table 2.2. Changes in key elements of bank profitability
Change:
72.7%71.3% 72.6% 66.4%
20.1%18.5%
19.3% 19.1%
6.1%
4.9%5.2%
3.4%
-20
-10
0
10
20
30
40
50
3.2014. 3.2015. 3.2016 3.2017
Net interest Net fees Income from securities Other income Exchange rate effect
Source: National Bank of Serbia
Chart 2.3 Operating income structure(in RSD bln, in %)

National Bank of Serbia
10
2.4 Operating expenses
In Q1 2017, operating expenses5 of the Serbian banking sector equalled RSD 26.6 bln,
up by 2.6% y-o-y. Within operating expenses, salaries, salary compensations and other
personal expenses increased by 2.2% (making up 39.3% of total operating expenses) and
the “Other expenses” category by 3.6% y-o-y (making up 53.9% of operating expenses).
Depreciation costs (6.8% of operating expenses) dropped by 2.7%.
5 Operating expenses include: salaries, salary compensations and other personal expenses, depreciation costs
and other expenses (costs of material, production services, intangible costs…), in accordance with the amended
methodology.
Salaries, salaries
compensations and other personal
expenses; 10.4 bln; 39%
Depreciation costs; 1.8
bln; 7%
Other expenses; 14.3
bln; 54%
Source: National Bank of Serbia.
Chart 2.4. Structure of operating expenses31 March 2017

Banking Sector in Serbia – First Quarter Report 2017
11
3 BANKING SECTOR ASSETS
3.1 Level and structure
The total net balance sheet assets of the Serbian banking sector at end-March 2017
equalled RSD 3,208.0 bln, indicating a decrease of RSD 33.5 bln or 1.0% from end-2016.
Loans and receivables held a dominant share in the banking sector assets – 61.9% (as a
result of the business models of banks which are based on traditional credit-deposit
operations), with a rising trend of 1.5 pp q-o-q. Other prominent items were financial assets
available for sale (17.6%) and cash and assets held with the central bank (13.3%), which
rose by 0.5 pp and dropped by 1.6 pp, respectively, in the period observed.
2,8
24
2,9
44
3,0
43
3,2
08
2,9
69
3,0
48
3,2
42
0
500
1,000
1,500
2,000
2,500
3,000
3,500
2014. 2015. 2016. 2017.
March December
Source: National Bank of Serbia.
Chart 3.1.1 Total banking sector assets(in RSD bln)

National Bank of Serbia
12
Table 3.1 Change in key asset items of the banking sector
(in RSD mln, in %)
Amount Change relative to prior periods
Nominal Relative
31/03/2017 31/12/2016 31/03/2016 31/12/2016 31/03/2016
Cash and assets with the central bank 426,910 -57,206 -12,716 -11.8% -2.9%
Loans and receivables 1,984,882 26,645 135,485 1.4% 7.3%
from banks and OFO 218,187 7,829 11,730 3.7% 5.7%
from customers 1,766,694 18,816 123,755 1.1% 7.5%
Financial assets 673,641 -489 48,555 -0.1% 7.8%
at fair value through the income statement and held for trading
22,212 926 3,046 4.3% 15.9%
initially recognised at fair value through the income statement
7,726 1,295 3,478 20.1% 81.9%
available for sale 563,895 8,979 59,782 1.6% 11.9%
held to maturity 79,808 -11,689 -17,750 -12.8% -18.2%
Property, plant and equipment 51,766 -664 155 -1.3% 0.3%
Investment property 16,149 -750 -1,452 -4.4% -8.2%
Other 54,621 -1,073 -5,350 -1.9% -8.9%
Banking sector balance sheet total 3,207,967 -33,537 164,677 -1.0% 5.4%
Source: NBS.
Cash and assets held with the central bank,
427. bln, 13%
Loans and receivables from banks and other
financial organisations, 218. bln, 7%
Loans and receivables from clients, 1767. bln,
55%
Financial assets available for sale, 564.
bln, 18%
Property, plant and equipment and
Investment property, 68. bln, 2%
Other assets, 164. bln, 5%
Source: National Bank of Serbia.
Chart 3.1.2 Banking sector assets structure31 March 2017

Banking Sector in Serbia – First Quarter Report 2017
13
3.2 Classified assets
At end-March 2017, total classified assets (on- and off-balance sheet) equalled RSD
2,958.3 bln, up by RSD 16.5 bln or 0.6% from a quarter earlier. Balance sheet assets
subject to classification decreased by RSD 0.7 bln, while off-balance sheet items subject to
classification rose by RSD 17.1 bln. Within the structure of on-balance sheet items subject
to classification, major changes were recorded with long-term loans which rose by RSD
20.3 bln (and the share in the total balance sheet assets subject to classification to 68.1%)
and with deposits with banks and other on-balance sheet items, which declined by RSD
16.7 bln and RSD 6.4 bln, respectively. Under off-balance sheet items, the highest increase
in absolute terms was recorded with contingent liabilities – by RSD 18.1 bln. This category
makes up 60.4% of total classified off-balance sheet items.
The most significant change in the structure of classified balance sheet assets compared
to the previous quarter is a RSD 19.9 bln increase in balance sheet assets classified in
category A (mostly short-term and long-term loans), while balance sheet assets classified in
the remaining categories B, C, D, and E shrank by RSD 5.9, 8.7, 2.7 and 3.2 bln
respectively. Consequently, the overall structure improved, as the share of the two worst
categories dropped by 0.3 pp, hence bad assets accounted for 18.9% of total classified
balance sheet assets.
53% 50%53% 53%
20% 22%
23% 23%
7% 8%
9% 9%4% 4%
3% 3%16% 16%
12% 12%
2,783 2,793 2,942 2,958
0
500
1,000
1,500
2,000
2,500
3,000
12.2014. 12.2015. 12.2016. 03.2017.
А B C D E
Chart 3.2 Total classified assets( in RSD bin , in % )
Source: National Bank of Serbia.
Source: National Bank of Serbia.

National Bank of Serbia
14
An increase in total classified off-balance sheet items by RSD 17.1 bln resulted from an
increase in categories A and B (by RSD 10.1 and 12.9 bln, respectively), mostly under
contingent liabilities. However, due to a RSD 5.9 bln increase in category D and an RSD
11.4 bln decrease in category C, the share of bad assets increased from 4.5% to 5.1% in
total classified off-balance sheet items.
The share of assigned receivables equalled RSD 8.2 bln in Q1 2017. The amount of
assigned receivables in Q1 2017 was lower than in Q4 2016 when the highest level of
assignments was recorded in a single quarter – RSD 25.1 bln. The reason behind this is the
clean-up of banks’ balance sheets at the end of the business year 2016, i.e. the tendency of
banks to improve the quality of their credit portfolios thereby attaining a higher profitability
level reflected through banks’ final accounts.
As a result of the above movements, the calculated balance sheet regulatory provisions
dropped by RSD 5.7 bln or 1.4% in Q1 and came at RSD 405.5 bln. Calculated off-balance
sheet regulatory provisions also declined – by RSD 0.3 bln or 2.0% to RSD 14.6 bln.
Due to such changes, the total required reserves for estimated losses arising from credit
risk (which for each borrower represents a positive difference between the amount of
regulatory provisions and the sum of allowances for impairment of balance sheet assets and
provisions for losses on off-balance sheet items) decreased by RSD 5.8 bln or 3.5% in the
same period, and came at RSD 160.6 bln.
3.3. Loans
In Q1 2017, gross loans of the Serbian banking sector recorded a nominal increase of
RSD 11.2 bln or 0.6% q-o-q, reaching RSD 1,984.0 bln. In net terms (after reduction for
allowances for impairment), this growth measured 0.8%.
In gross terms, credit activity rose the most in the household segment, by 2.9% (i.e.
RSD 21.5 bln q-o-q), while the finance and insurance sector recorded the greatest
contraction – 39.3% (down by RSD 9.7 mln from a quarter before), referring mainly to
domestic banks. The corporate sector also recorded a gross nominal increase in credit
activity (by RSD 2.2 bln or 0.2% q-o-q), hence this sector continued to account for the
largest share of total gross loans (44.5%).
A RSD 2.5 bln decrease in allowances for impairment to total loans at the level of the
banking sector was primarily due to a RSD 3.1 bln drop in allowances for impairment to
corporate loans and, to a lesser extent, to those referring to the finance and insurance
sectors. The sector of entrepreneurs accounted for the largest percent6 of allowances for
6 Excluding the sector of Other clients which includes banks and legal persons undergoing
bankruptcy.

Banking Sector in Serbia – First Quarter Report 2017
15
impairment (15.6%), while corporates and households (the most important sectors)
recorded 11.3% and 6.1%, respectively.
Table 3.3 Change in the level of net loans
(in RSD mln, in %)
Amount
Change relative to prior periods
Nominal Relative
31/03/2017 31/12/2016 31/03/2016 31/12/2016 31/03/2016
Finance and insurance 14,978 -9,679 1,153 -39.3% 8.3%
Public sector 30,010 -793 -282 -2.6% -0.9%
Public enterprises 99,180 -4,585 -43,053 -4.4% -30.3%
Households 762,153 21,497 79,103 2.9% 11.6%
Companies 883,554 2,177 76,421 0.2% 9.5%
Foreign persons and foreign banks 26,721 -1,324 3,325 -4.7% 14.2%
Other sectors 167,416 3,904 -12,253 2.4% -6.8%
Total loans 1,984,012 11,197 104,414 0.6% 5.6%
Source: NBS.
As regards the currency structure of the banking sector’s loan portfolio at end-Q1 2017,
the share of FX and FX-indexed loans was 69.7%. The prevalent currency of loan
indexation in Serbia was the euro, with EUR loans making up 63.0% (90.3% of total gross
FX and FX-indexed loans), which is both a nominal and a relative decrease compared to
end-2016. The Swiss franc accounted for 4.9% (7.0% of total gross FX and FX-indexed
loans) and the US dollar for 1.6% (2.3% of total gross FX and FX-indexed loans). In
relative and nominal terms, the share of loans in the Swiss franc decreased, while the share
of US dollar loans increased from the quarter before.
At end-Q1 2017, the dinar portfolio comprised 30.3% of total gross loans, slightly more
than in the quarter earlier (29.6%), due to the rise in cash loans (by RSD 16.2 bln). Оf FX-
indexed loans, the greatest increase was recorded in current assets and liquidity loans of
corporates (by RSD 5.0 bln) and housing loans of households (by RSD 4.3 bln), while the
sharpest fall was registered in current assets and liquidity loans extended to public
enterprises (by RSD 3.5 bln).

National Bank of Serbia
16
The structure of gross loans by remaining maturity remained broadly the same: short-
term loans made up 18.4%, long-term loans 71.6%, matured loans 8.6% аnd overnight
loans 1.4%.
3.4. Non-performing loans
Monitoring the level and trend of non-performing loans (NPLs) is vital for identifying
potential problems in the collection of receivables and monitoring of credit risk, as these
loans and the indicators associated with them may signal deterioration in the quality of the
loan portfolio of the banking sector. Further analysis of NPLs and the related allowances
for loan impairment, regulatory provisions and capital provides insight into the banking
sector’s capacity to absorb losses arising from NPLs.
According to the methodology applied by the NBS, an NPL means the total outstanding
debt under an individual loan (including the amount of arrears):
- where the payment of principal and interest is 90 days or more past due its original
maturity date;
Source: National Bank of Serbia.
EUR1250. bln
63%
CHF; 96. bln; 5%
USD; 32. bln; 2%
RSD; 600. bln;
30%
Other; 6. bln; 0%
Due; 170. bln;
9%
Up to 3 m; 108. bln; 5%
3 to 6 m; 84. bln;
4%
6 to 12 m; 201. bln; 10%
Over 1 year
1421. bln72%
Chart 3.3 Banking sector gross loan portfolio structure(in RSD bln)(31 March 2017)

Banking Sector in Serbia – First Quarter Report 2017
17
- where at least 90 days of interest payments have been added to the loan balance,
capitalized, refinanced or delayed by agreement;
- where payments are less than 90 days overdue, but the bank has assessed that the
borrower’s repayment ability has deteriorated and doubts that the payments will be made in
full.
Gross NPLs
A declining trend in the banking sector’s total gross NPLs continued into Q1 2017.
Recording a drop of RSD 4.0 bln, they came at RSD 341.7 bln. A decrease was recorded
across all of the sectors observed, except in public enterprises and private households and
farmers. Of this reduction in gross NPLs,7 RSD 3.9 bln was due to direct write-offs, while a
smaller part of RSD 0.5 bln was due to the assignment of receivables.
The fall in gross NPLs by 1.2%, along with a slight increase in total loans by 0.1%, led
to a 0.2 pp drop in the NPL ratio relative to a quarter earlier, to 16.8%.
7 Calculated based on the NPL 3 report which banks submit to the NBS.
59%51%
50% 50%
16%
17%
20% 20%
25%32%
30% 30%
421.3 424.6
345.8 341.7
21.5 21.6
17.0 16.8
0
5
10
15
20
25
0
100
200
300
400
500
600
12.2014. 12.2015. 12.2016. 03.2017.
Corporates Households Other Total Gross NPL %
Chart 3.4.1 Gross non performing loans (NPL)(in RSD bln)
Source: National Bank of Serbia.

National Bank of Serbia
18
Observed by sector, corporates continued to account for the largest share of gross NPLs
(RSD 155.7 bln at end-March 2017), with a RSD 2.0 bln (1.3%) decrease in the nominal
amount and an unchanged share in total NPLs (45.6%). Next in line were non-financial
legal persons in bankruptcy, whose NPLs amounted to RSD 80.3 bln (RSD 81.1 bln at end-
2016), making up 23.5% of the total, the same as in the quarter before.
In the household sector, gross NPLs stood at RSD 68.4 bln, or 20.0% of the total.
NPL coverage
At end-Q1 2017, the coverage of total gross NPLs by loan loss reserves equalled
118.6%, while allowances for impairment ensured the coverage of 68.1%.
0
5
10
15
20
25
30
35
40
45
50
12.2014. 12.2015. 12.2016. 03.2017.
Households
Corporate sectors( Pubilc enterprizes + Private companies)
Total NPL
Other sectors
Source: National Bank of Serbia..
Chart 3.4.2. NPL ratio for main sectors(in %)
54.9 62.3
67.8 68.1
114.5 114.2 118.9 118.6
0
20
40
60
80
100
120
140
160
180
12.2014. 12.2015. 12.2016. 03.2017.IFRS provision (NPL) ** / NPL Calculated reserve* / NPL
* Calculated reserve for potential losses on balance-sheet lending (loan loss reserve);
Chart 3.4.3 NPL coverage(in %)
Source: National Bank of Serbia.
Banking Sector in Serbia – First Quarter Report 2017
19
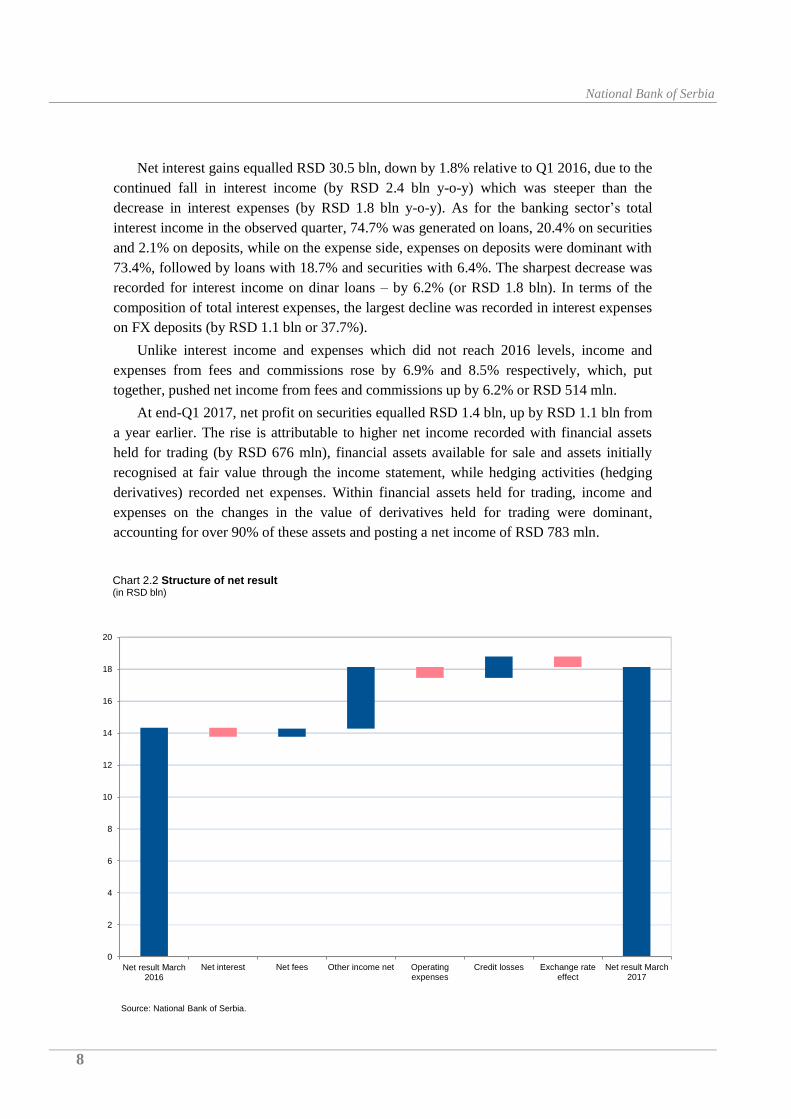
The data indicate that the coverage of total gross NPLs by loan loss reserves is
constantly high, while the coverage by allowances for impairment shows a continuous
rising trend.
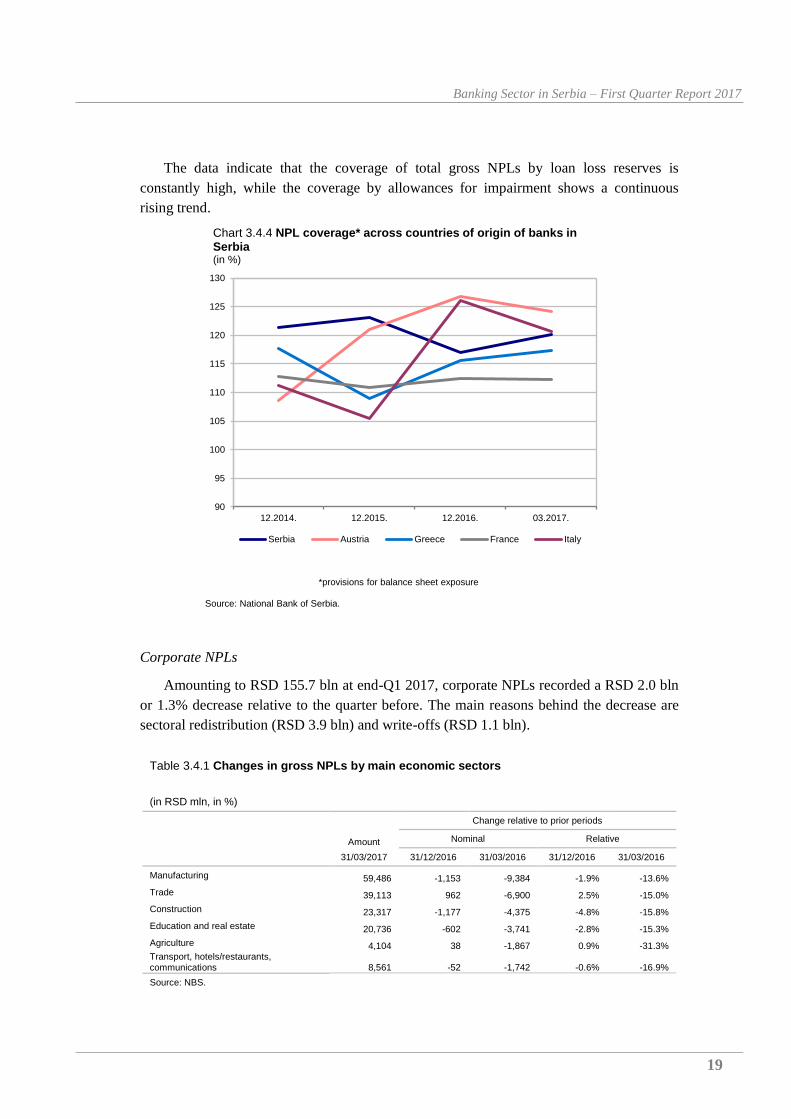
Corporate NPLs
Amounting to RSD 155.7 bln at end-Q1 2017, corporate NPLs recorded a RSD 2.0 bln
or 1.3% decrease relative to the quarter before. The main reasons behind the decrease are
sectoral redistribution (RSD 3.9 bln) and write-offs (RSD 1.1 bln).
Table 3.4.1 Changes in gross NPLs by main economic sectors
(in RSD mln, in %)
Amount
Change relative to prior periods
Nominal Relative
31/03/2017 31/12/2016 31/03/2016 31/12/2016 31/03/2016
Manufacturing 59,486 -1,153 -9,384 -1.9% -13.6%
Trade 39,113 962 -6,900 2.5% -15.0%
Construction 23,317 -1,177 -4,375 -4.8% -15.8%
Education and real estate 20,736 -602 -3,741 -2.8% -15.3%
Agriculture 4,104 38 -1,867 0.9% -31.3% Transport, hotels/restaurants, communications 8,561 -52 -1,742 -0.6% -16.9%
Source: NBS.
90
95
100
105
110
115
120
125
130
12.2014. 12.2015. 12.2016. 03.2017.
Serbia Austria Greece France Italy
Chart 3.4.4 NPL coverage* across countries of origin of banks in Serbia(in %)
*provisions for balance sheet exposure
Source: National Bank of Serbia.
National Bank of Serbia
20
Observed by sector, the biggest share in total corporate NPLs continued to be held by
manufacturing (38.2%, with a 19.8% gross NPL ratio), followed by trade (25.1%, with a
13.3% gross NPL ratio) and construction (15.0%, with a 28.3% gross NPL ratio). In Q1, the
ratio markedly declined in all sectors except in trade and agriculture. Construction,
manufacturing and transport recorded the most sizeable decreases (by 2.0 pp, 0.3 pp and 0.3
pp, respectively).
Table 3.4.2 Corporate NPL ratio by sector
(in %)
Change relative to prior periods (pp)
31/03/2017 31/12/2016 31/03/2016
Construction 28.3% -2.0 -9.4
Real estate and education 26.2% -0.2 -4.6
Manufacturing 19.8% -0.3 -4.3
Trade 13.3% 0.2 -4.5
Agriculture 5.9% 0.2 -3.2
Transport 13.4% -0.3 -5.4
Source: NBS.
Chart 3.4.5 Private corporates NPL structure(31 March 2017)
Agriculture4 bln3%
Processing industry60 bln38%
Electricity0.4 bln
0%Construction
23 bln15%
Commerce39 bln25%
Hotel, restaurants and communication
9 bln6%
Real estate and education
21 bln13%
28.3%
13.3%
5.9%
19.8%
13.3%
26.2%
13.4%
Gross NPL indicator
Source: National Bank of Serbia.

Banking Sector in Serbia – First Quarter Report 2017
21
Natural persons’ NPLs8
Measuring 9.6% at end-Q1 2017, the share of gross NPLs of natural persons declined
by 0.4 pp compared to the previous quarter.
At end-Q1 2017, natural persons’ NPLs equalled RSD 82.6 bln, dropping by 1.3% from
end-2016. All types of loans, except cash loans and current account overdrafts, recorded a
decrease.
Table 3.4.3 Changes in gross non-performing loans to natural persons by category
(in RSD mln, in %)
Amount
Change relative to prior periods
Nominal Relative
31/03/2017 31/12/2016 31/03/2016 31/12/2016 31/03/2016
Housing loans 30,129 -962 -2,829 -3.1% -8.6%
Cash loans 21,264 134 -1,609 0.6% -7.0%
Credit cards 4,416 -54 -589 -1.2% -11.8%
Current account overdrafts 4,098 83 -186 2.1% -4.3%
Consumer loans 3,780 -101 72 -2.6% 2.0%
Other 18,940 -165 -541 -0.9% -2.8%
Total 82,627 -1,066 -5,682 -1.3% -6.4%
Source: NBS.
The category of housing construction loans accounted for a dominant share both in
lending to natural persons (42.1%) and in gross NPLs of natural persons (36.5%). Cash
loans came next with a 34.6% share in total loans extended to natural persons and a 25.7%
share in total NPLs of natural persons.
Table 3.4.4 Gross NPL ratio for natural persons by category
(in %)
Change relative to prior periods (pp)
31/03/2017 31/12/2016 31/03/2016
Housing construction 8.3% -0.4 -1.2
Cash loans 7.2% -0.4 -2.7
Credit cards 12.6% 0.1 -1.1
Current account overdrafts 15.5% -0.7 -0.8
Consumer loans 21.2% -0.4 -0.6
Source: NBS.
8 They include: households, entrepreneurs, private households with employed persons and registered farmers.
National Bank of Serbia
22
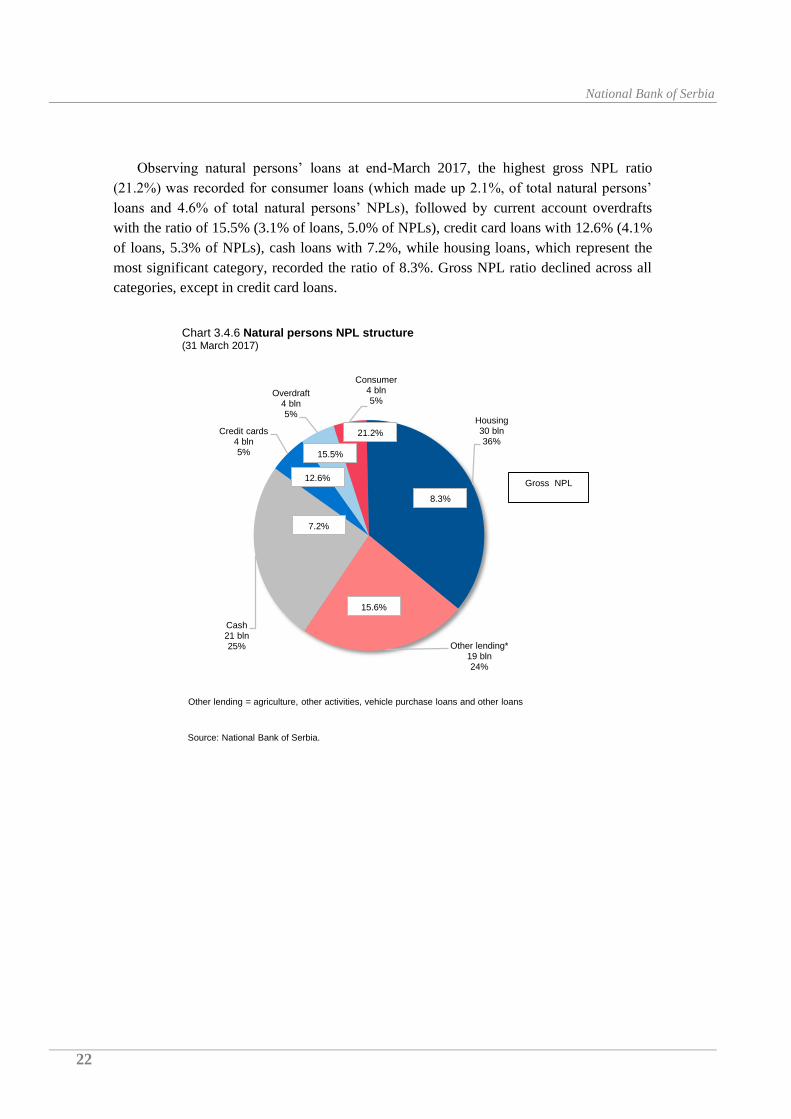
Observing natural persons’ loans at end-March 2017, the highest gross NPL ratio
(21.2%) was recorded for consumer loans (which made up 2.1%, of total natural persons’
loans and 4.6% of total natural persons’ NPLs), followed by current account overdrafts
with the ratio of 15.5% (3.1% of loans, 5.0% of NPLs), credit card loans with 12.6% (4.1%
of loans, 5.3% of NPLs), cash loans with 7.2%, while housing loans, which represent the
most significant category, recorded the ratio of 8.3%. Gross NPL ratio declined across all
categories, except in credit card loans.
Cash21 bln25%
Credit cards4 bln5%
Overdraft4 bln5%
Consumer4 bln5%
Housing30 bln36%
Other lending*19 bln24%
15.6%
7.2%
15.5%
8.3%
12.6%Gross NPL
21.2%
Other lending = agriculture, other activities, vehicle purchase loans and other loans
Chart 3.4.6 Natural persons NPL structure(31 March 2017)
Source: National Bank of Serbia.

Banking Sector in Serbia – First Quarter Report 2017
23
4 BANKING SECTOR LIABILITIES
4.1 Structure of the sources of funding
Deposits9 were the primary source of bank funding in Serbia, making up 69.6% of total
liabilities. At end-Q1 2017, own sources of funding made up 19.9% and borrowing 7.1% of
total liabilities.
Compared to the end of the previous quarter, total banking sector liabilities decreased
by RSD 39.7 bln (1.5%), chiefly on account of a RSD 42.9 bln drop (1.7%) in item
Deposits and other liabilities to other clients. As total banking sector capital went up in Q1
2017 by RSD 6.2 bln (1.0%), its share in total banking sector balance sheet liabilities also
increased (from 19.5% to 19.9%).
The currency structure showed that dinar sources of funding mildly declined in Q1,
from 42.8% to 42.5%. As regards the FX portion of liabilities, EUR-denominated liabilities
remained dominant, making up 89.3% of total FX liabilities, while the rest were mostly
liabilities in USD (6.4%) and CHF (3.4%).
9 Including transaction and other deposits as part of items: Deposits and other liabilities to banks, other financial
organisations and the central bank and Deposits to other clients.
Table 4.1 Change in key items of banking sector liabilities (in RSD mln, in %)
Change relative to prior periods
Amount Nominal Relative
31/03/2017 31/12/2016 31/03/2016 31/12/2016 31/03/2016
Deposits and other liabilities 2,470,352 -42,872 171,120 -1.7% 7.4%
to banks, OFO and the central bank 266,216 -45,028 -53,023 -14.5% -16.6%
to other customers 2,204,136 2,156 224,144 0.1% 11.3%
Securities issued and other borrowings 123 0 -1 0.0% -0.5%
Subordinated liabilities 45,269 -302 -18,859 -0.7% -29.4%
Provisions 11,558 -203 -141 -1.7% -1.2%
Share capital and other capital 402,754 1,241 -353 0.3% -0.1%
Profit 77,886 -1,216 8,558 -1.5% 12.3%
Loss 44,532 482 -280 1.1% -0.6%
Reserves and unrealised losses 202,586 6,665 -204 3.4% -0.1%
Other 41,971 3,632 4,275 9.5% 11.3%
Total banking sector liabilities 3,207,967 -33,537 164,677 -1.0% 5.4%
Source: NBS.

National Bank of Serbia
24
4.2 Deposits
Total deposits with banks stood at RSD 2,234.1 bln at end-Q1 2017, down by RSD
18.3 bln (0.8%) q-o-q. While household transaction deposits went up by RSD 15.2 bln (in
the segment of FX transaction deposits), the drop mainly stemmed from a decline in
deposits of corporates by RSD 20.0 bln (mostly dinar transaction deposits) and non-
residents (оther FX deposits).
Due to a decrease in dinar transaction deposits, the share of FX and FX-indexed
deposits edged up mildly, from 69.3% to 70.4%, and the euro accounted for a dominant
88.7% share of the portfolio. The rest of FX and FX-indexed deposits were mainly in USD
(7.3%) and CHF (3.1%).
Short-term deposits10
accounted for the bulk of bank deposits in Serbia. Demand
deposits made up over one half (59.9%) of total deposits, followed by deposits with the
remaining maturity of up to one year with 32.9%, while deposits with the remaining
maturity of over one year accounted for 7.2% of total deposits. A quarterly increase is
notable in respect of demand deposits (1.0 pp), while both short-term and long-term
deposits posted a decrease (by 0.5 pp in both categories).
10 At remaining maturity.
614
619
632
639
2,3
55
2,4
29
2,6
09
2,5
69
0
500
1,000
1,500
2,000
2,500
3,000
12.2014. 12.2015. 12.2016. 03.2017.
Capital Liabilities
Source: National Bank of Sebia.
Chart 4.1 Banking sector capital and liabilities (in RSD bln)

Banking Sector in Serbia – First Quarter Report 2017
25
In terms of initial (agreed) maturity, demand deposits were still dominant (59.7%),
followed by deposits with the remaining maturity of up to one year (28.0%), while 12.3%
of all deposits were agreed for over one year term. In the quarter observed, the share of
long-term deposits decreased further, mostly in favour of demand deposits.
Compared to the end of the previous quarter, household savings deposits11
dropped by
RSD 2.8 bln (0.4%) and at end-Q1 2017 stood at RSD 792.7 bln. The drop did not result
from the withdrawal, but from the maturing of savings and transfer to the transaction FX
deposits accounts, which recorded an increase of 20.0 bln in the period observed. FX
savings represented the dominant category in total savings deposits of households, with the
share of 94.1%, while dinar savings stood at 5.9% at end-March 2017. Q-o-q, dinar savings
rose by RSD 1.4 bln, while FX savings declined by RSD 4.2 bln.
At end-Q1 2017, total household deposits in foreign currency equalled RSD 1,077.0 bln
(rising by 1.5% from the end of the previous quarter) and consisted mainly of savings
deposits (73.6%).
11
Accounts 402 and 502 in the Chart of Accounts, sector 6 (domestic and foreign natural persons – residents).
Table 4.2. Changes in deposits levels
(in RSD mln, in %)
Amount
Change relative to prior periods
Nominal Relative
31/03/2017 31/12/2016 31/03/2016 31/12/2016 31/03/2016
Finance and insurance sector 59,432 -2,411 -8 -3.9% 0.0%
Public sector 39,070 -874 1,913 -2.2% 5.1%
Public enterprises 140,540 2,268 15,483 1.6% 12.4%
Households 1,224,937 15,153 83,890 1.3% 7.4%
Companies 495,033 -19,976 96,729 -3.9% 24.3%
Foreign entities and foreign banks 135,385 -11,346 15,979 -7.7% 13.4%
Other sectors 139,659 -1,146 17,508 -0.8% 14.3%
Total deposits 2,234,056 -18,331 231,494 -0.8% 11.6%
Source: NBS.

National Bank of Serbia
26
4.3 Total borrowing of banks
At end-Q1 2017, total credit borrowing of the banking sector amounted to RSD 228.9
bln, down by RSD 24.6 bln (9.7%) q-o-q. The decline was recorded in all items, most
notably in loans received, by RSD 11.1 bln.
Table 4.3 Changes in the level of bank borrowing
(in RSD mln, in %)
Amount
Change relative to prior periods
Nominal Relative
31/03/2017 31/12/2016 31/03/2016 31/12/2016 31/03/2016
Overnight loans 41,216 -9,267 -643 -18.4% -1.5%
Loans received 180,729 -11,089 -57,891 -5.8% -24.3%
Other financial liabilities 6,994 -4,223 888 -37.6% 14.5%
Total borrowing 228,939 -24,579 -57,646 -9.7% -20.1%
Source: NBS.
Sectoral structure Currency structure Maturity structure
Chart 4.2 Banking sector deposits structure(31 March 2017)
Up to 3 m1,647bln
74%
3 to 6 m146bln
6%
6 to 12 m281bln
13%
Ov er 1 y ear
160bln
7%
Households
1,225bln
55%
Corp. (public
and
priv ate)
636bln28%
Foreign entities
135bln
6%
Other depositors
238bln
11%
Source: National Bank of Serbia.
RSD660bln
30%
EUR1,396bln
62%
Other currencie
s
178bln
8%

Banking Sector in Serbia – First Quarter Report 2017
27
Loans received were the largest individual borrowing item (received predominantly
from parent banks and international financial institutions), accounting for 78.9% (end-2016:
75.7%), followed by liabilities under overnight loans with 18.0% (end-2016: 19.9%). Other
financial liabilities made up 3.1% (end-2016: 4.4%).
Banks that are majority foreign-owned accounted for 91.2% of total credit borrowing of
the banking sector, 87.0% of overnight loans, 92.2% of loans received and 90.3% of other
financial liabilities.
The dominant currency of borrowing was the euro, accounting for RSD 196.3 bln (end-
2016: RSD 216.2 bln) or 85.7% of total borrowing. Dinar liabilities stood at RSD 24.0 bln
(end 2016: RSD 26.9 bln) or 10.5% of total borrowing, while banks’ debt in Swiss francs
was RSD 7.0 bln (end-2016: RSD 7.9 bln), or 3.1% of total borrowing.
4.4 External liabilities
At end-Q1 2017, banks’ total external liabilities under credit operations stood at RSD
139.9 bln, dropping by RSD 14.2 bln (9.2%) from the quarter earlier. External credit debt
remained highly concentrated, given that of the 18 banks which borrowed externally, three
banks accounted for 55.5% of the total debt. Also, only one bank took overnight foreign
loans.
In spite of the increase in overnight loans, long-term loans continued to account for the
dominant 80.6% share in the maturity structure of external borrowing (end-2016: 75.6%).
Table 4.4 Changes in bank external borrowing
(in RSD mln, in %)
Amount
Change relative to prior periods
Nominal Relative
31/03/2017 31/12/2016 31/03/2016 31/12/2016 31/03/2016
Overnight loans 11,281 -6,055 8,625 -34.9% 324.7%
Loans received 127,473 -7,833 -49,537 -5.8% -28.0%
Other financial liabilities 1,176 -304 188 -20.5% 19.0%
Total borrowing 139,929 -14,191 -40,724 -9.2% -22.5%
Source: NBS.
As regards the currency composition of external credit borrowing, the share of the euro
again increased slightly, reaching 94.9% (end-2016: 94.6%, end-2015: 88.4%). The Swiss
franc share remained unchanged at 4.9% (at end-2014 and end-2015 it exceeded 10%).

National Bank of Serbia
28
4.5 Subordinated liabilities
Total subordinated liabilities of banks in Serbia reached RSD 45.0 bln at end-Q1 2017,
decreasing by RSD 0.5 bln (1.1%) relative to the previous quarter, which marked a
continuation of the downward trend.
Of total subordinated liabilities, 67.7% were liabilities toward foreign banks, 17.5%
toward foreign legal persons, 13.8% to international financial institutions and 1.0% to
corporates.
Subordinated liabilities in euros kept a dominant share of 82.1%; liabilities in Swiss
francs made up 16.5%, those in dinars 1.0% and the remaining 0.4% were in other
currencies.
Subordinated liabilities were highly concentrated – of the 16 banks with subordinated
debt, two banks accounted for 34.5% of all subordinated liabilities.
Given the regulatory restrictions on the inclusion of subordinated liabilities in
supplementary and/or regulatory capital, banks were able to include only 45.9% of total
subordinated debt in supplementary capital.
Banking Sector in Serbia – First Quarter Report 2017
29
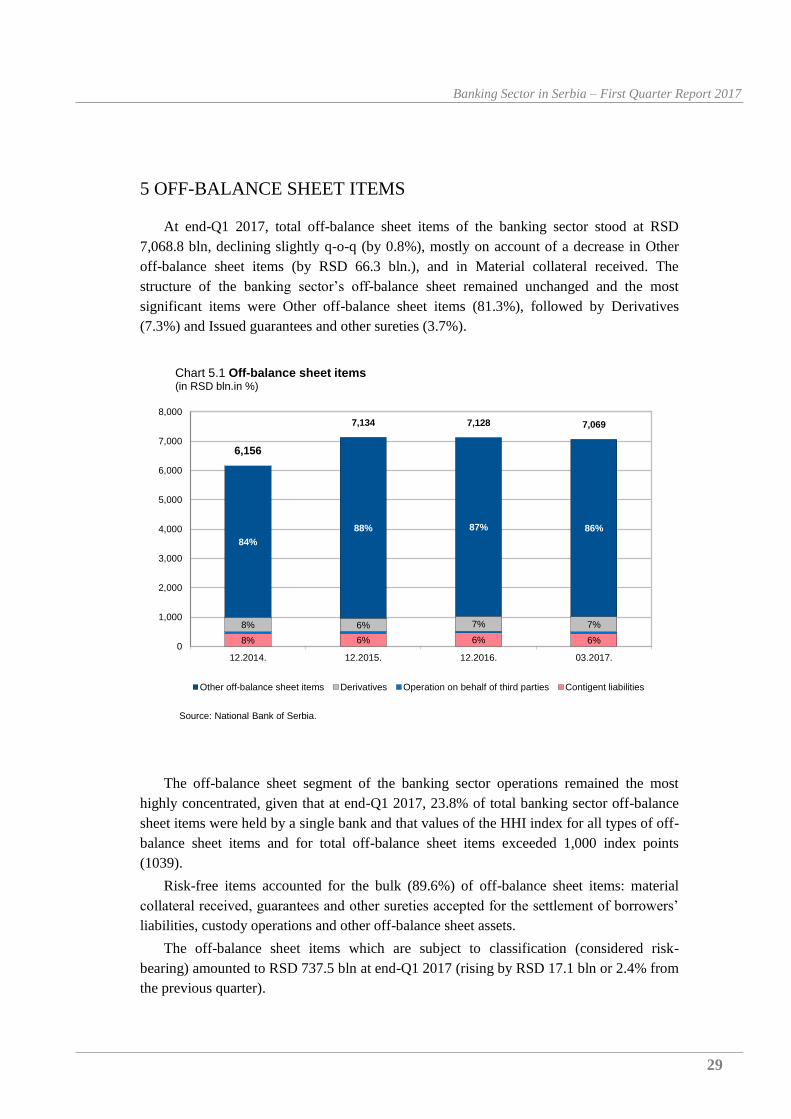
5 OFF-BALANCE SHEET ITEMS
At end-Q1 2017, total off-balance sheet items of the banking sector stood at RSD
7,068.8 bln, declining slightly q-o-q (by 0.8%), mostly on account of a decrease in Other
off-balance sheet items (by RSD 66.3 bln.), and in Material collateral received. The
structure of the banking sector’s off-balance sheet remained unchanged and the most
significant items were Other off-balance sheet items (81.3%), followed by Derivatives
(7.3%) and Issued guarantees and other sureties (3.7%).
The off-balance sheet segment of the banking sector operations remained the most
highly concentrated, given that at end-Q1 2017, 23.8% of total banking sector off-balance
sheet items were held by a single bank and that values of the HHI index for all types of off-
balance sheet items and for total off-balance sheet items exceeded 1,000 index points
(1039).
Risk-free items accounted for the bulk (89.6%) of off-balance sheet items: material
collateral received, guarantees and other sureties accepted for the settlement of borrowers’
liabilities, custody operations and other off-balance sheet assets.
The off-balance sheet items which are subject to classification (considered risk-
bearing) amounted to RSD 737.5 bln at end-Q1 2017 (rising by RSD 17.1 bln or 2.4% from
the previous quarter).
8% 6% 6% 6%
8% 6% 7% 7%
84%
88% 87% 86%
6,156
7,134 7,128 7,069
0
1,000
2,000
3,000
4,000
5,000
6,000
7,000
8,000
12.2014. 12.2015. 12.2016. 03.2017.
Other off-balance sheet items Derivatives Operation on behalf of third parties Contigent liabilities
Chart 5.1 Off-balance sheet items(in RSD bln.in %)
Source: National Bank of Serbia.

National Bank of Serbia
30
At end-Q1 2017, contingent liabilities12
equalled RSD 440.3 bln (down by RSD 18.8
bln, or 4.1% q-o-q), making up 6.2% of total off-balance sheet items (end of the previous
quarter: 6.4%).
Table 5.1 Changes in off-balance sheet items in the Serbian banking sector
(in RSD mln, in %)
Amount
Change relative to prior periods
Nominal Relative
31/03/2017 31/12/2016 31/03/2016 31/12/2016 31/03/2016
Issued guarantees and other sureties 264,300 -5,718 10,474 -2.1% 4.1%
Receivables under derivatives 518,997 10,679 108,502 2.1% 26.4% Contingent liabilities and other irrevocable commitments 176,054 -12,999 -3,578 -6.9% -2.0%
Securities received as collateral 179,807 -1,765 30,869 -1.0% 20.7%
Sureties for liabilities 92,522 -299 6,490 -0.3% 7.5%
Other off-balance sheet assets 5,747,553 -66,308 -136,786 -1.1% -2.3%
Other 89,555 16,736 8,864 23.0% 11.0%
Total off-balance sheet assets 7,068,788 -59,673 24,835 -0.8% 0.4%
Source: NBS.
12 Issued guarantees and other sureties, irrevocable commitments regarding undisbursed loans and placements, and other
irrevocable commitments.

Banking Sector in Serbia – First Quarter Report 2017
31
6 BANK LIQUIDITY
Based on the long-term historical record of all basic liquidity indicators, Serbia’s
banking sector has been characterised by considerable excess liquidity. At end-Q1 2017,
the average monthly liquidity ratio was 2.20, rising from end-2016 (2.05) and being
considerably above the regulatory floor of 1.0. The narrow liquidity ratio for the banking
sector measured 1.81 (regulatory floor – 0.7).
The share of liquid assets in total banking sector balance sheet assets has been broadly
stable, reaching 36.3% at end-Q1 2017.
At end-Q1 2017, banks’ investments in NBS repo securities increased relative to
December 2016, from RSD 33.8 bln to RSD 59.3 bln. The number of banks which invested
in repo securities also increased (from 9 to 19 banks). As opposed to repo placements, the
portfolio of government securities, amounting to RSD 634.8 bln at end-March 2017,
decreased by 0.2% from the previous quarter. For quite some time, the share of securities in
euros has shown an upward tendency, reaching 38.8% in the period observed (up by 0.3 pp
q-o-q).
2.162.09 2.05
2.20
1.68 1.67 1.701.81
1.03 0.990.92 0.93
0.36 0.34 0.37 0.36
0.00
0.50
1.00
1.50
2.00
2.50
3.00
12.2014. 12.2015. 12.2016. 03.2017.
Liquidity indicator Narrow liquidity indicator
Loan to deposit ratio LTD Liquid assets to total assets
Chart 6.1 Banking sector liquidity indicators
Source: National Bank of Serbia.

National Bank of Serbia
32
7 CAPITAL ADEQUACY
The Serbian banking sector is well-capitalised, both from the aspect of compliance with
the prescribed capital adequacy ratio and the structure of regulatory capital. At end-March
2017, the capital adequacy ratio of the Serbian banking sector averaged 22.34% (up by 0.51
pp from end-2016), which is well above the domestic regulatory minimum (12%) and the
minimum according to Basel standards (8%).
The capital adequacy ratio was 0.51 pp stronger than a quarter earlier, because the
regulatory capital increased more than total capital requirements (3.3% vs. 0.9%).
In the structure of capital requirements, capital requirements for credit risk held the
dominant share (87.6%), given the traditional, lending-oriented business models of banks.
Next were capital requirements for operational risk (11.4%), while the share of capital
requirements for market risks was negligible (1%).
303 331
380 396
45 41
38 37
-8
-8 -8 -9
19.9620.89
21.8322.34
0
5
10
15
20
-150
-50
50
150
250
350
450
550
650
12.2014. 12.2015. 12.2016. 03.2017.
Deductibles Tier 2 Tier 1 CAR
Chart 7.1 Regulatory capital and CAR*(in RSD bln, CAR in %)
* CAR = Regulatory capital adequacy ratio
Source: National Bank of Serbia.

Banking Sector in Serbia – First Quarter Report 2017
33
Throughout 2016 and in early 2017, regulatory capital of the banking sector was rising
moderately. The observed quarter saw a 3.3% increase (in absolute amount: RSD 13.6 bln),
while the growth rate for 2016 was 12.9%.
Regulatory capital consists of: Tier 1 capital, the highest quality segment (92.3%) and
Tier 2 or supplementary capital (7.7%).
At end-Q1 2017, the banking sector’s Tier 1 capital (before deductions from regulatory
capital) stood at RSD 396.4 bln, up by 4.3% (or RSD 16.4 bln) compared to end-2016. The
greatest contribution to the increase in the banking sector’s Tier 1 capital was the release of
RSD 8.1 bln of required reserves for estimated losses arising from credit risk and an
increase in reserves by RSD 7.5 bln.
After the remaining prescribed deductions, Tier 1 capital equalled RSD 391.6 bln,
which was RSD 15.8 bln more than at end-2016.
Tier 2 capital of the banking sector (before deductions from regulatory capital),
comprising mostly subordinated liabilities (56.1%) and revaluation reserves (36.8%),
decreased from a quarter earlier – by RSD 1.7 bln (4.3%), to RSD 36.8 bln. Subordinated
liabilities eligible for inclusion in Tier 2 capital shrunk by 6.4% (to RSD 20.6 bln), while
revaluation reserves edged down slightly (by RSD 0.2 mln) compared to the previous
quarter. After the remaining prescribed deductions from capital, Tier 2 capital amounted to
RSD 32.5 bln, down by RSD 6.4 bln (2.2%) q-o-q.
The leverage13
ratio of banks rose slightly from a quarter earlier. At end-March 2017,
on-balance sheet capital came at 19.91% оf total bank balance sheet assets.
13
Balance sheet capital to balance sheet assets ratio.
87.6%
1.0% 11.4%
Credit risk Market risk Operational risk
Chart 7.2 Capital requirements
(in %)(31 March 2017)
Source: National Bank of Serbia.

National Bank of Serbia
34
8 FOREIGN EXCHANGE RISK
At end-Q1 2017, Serbia’s banking sector posted a long FX position worth RSD 11.2
bln (excluding the positions in gold). Twenty two banks ended March 2017 with a net long
FX position, while the remaining eight banks showed a net short FX position.
On 31 March 2017, banks in Serbia operated at net long positions in euros and US
dollars (RSD 8.15 bln and RSD 2.30 bln, respectively), while at the same time posting a net
short position in Swiss francs (RSD 1.59 bln).
The foreign exchange risk ratio for the banking sector equalled 2.66% at end-Q1 2017,
indicating a relatively low FX risk compared to the regulatory cap (20% of banks’ capital).
9.48
5.49
8.44 8.15
4.22
13.56
1.34
3.37
3.93
4.44
2.742.66
0
1
2
3
4
5
6
0
2
4
6
8
10
12
14
16
12.2014. 12.2015. 12.2016. 03.2017.
Long EUR Short EUR FX ratio
Chart 8.1 Quarterly breakdown of the sector's long and short FX position (in EUR) and foreign exchange risk ratio(in RSD bln)
Source: National Bank of Serbia
Banking Sector in Serbia – First Quarter Report 2017
35
9 NBS REGULATORY ACTIVITY
As regards the NBS regulatory activity in bank supervision, during Q1 2017 no new
regulations were issued and there were no amendments to the existing ones.