Embed Size (px)
Citation preview
NREL is a national laboratory of the U.S. Department of Energy Office of Energy Efficiency & Renewable Energy Operated by the Alliance for Sustainable Energy, LLC This report is available at no cost from the National Renewable Energy Laboratory (NREL) at www.nrel.gov/publications.
Contract No. DE-AC36-08GO28308
Banking on Solar: An Analysis of Banking Opportunities in the U.S. Distributed Photovoltaic Market David Feldman and Travis Lowder National Renewable Energy Laboratory
Technical Report NREL/TP-6A20-62605 November 2014
NREL is a national laboratory of the U.S. Department of Energy Office of Energy Efficiency & Renewable Energy Operated by the Alliance for Sustainable Energy, LLC This report is available at no cost from the National Renewable Energy Laboratory (NREL) at www.nrel.gov/publications.
Contract No. DE-AC36-08GO28308
National Renewable Energy Laboratory 15013 Denver West Parkway Golden, CO 80401 303-275-3000 • www.nrel.gov
Banking on Solar: An Analysis of Banking Opportunities in the U.S. Distributed Photovoltaic Market David Feldman and Travis Lowder National Renewable Energy Laboratory
Prepared under Task No. SM13.1030
Technical Report NREL/TP-6A20-62605 November 2014
NOTICE
This report was prepared as an account of work sponsored by an agency of the United States government. Neither the United States government nor any agency thereof, nor any of their employees, makes any warranty, express or implied, or assumes any legal liability or responsibility for the accuracy, completeness, or usefulness of any information, apparatus, product, or process disclosed, or represents that its use would not infringe privately owned rights. Reference herein to any specific commercial product, process, or service by trade name, trademark, manufacturer, or otherwise does not necessarily constitute or imply its endorsement, recommendation, or favoring by the United States government or any agency thereof. The views and opinions of authors expressed herein do not necessarily state or reflect those of the United States government or any agency thereof.
This report is available at no cost from the National Renewable Energy Laboratory (NREL) at www.nrel.gov/publications.
Available electronically at http://www.osti.gov/scitech
Available for a processing fee to U.S. Department of Energy and its contractors, in paper, from:
U.S. Department of Energy Office of Scientific and Technical Information P.O. Box 62 Oak Ridge, TN 37831-0062 phone: 865.576.8401 fax: 865.576.5728 email: mailto:[email protected]
Available for sale to the public, in paper, from:
U.S. Department of Commerce National Technical Information Service 5285 Port Royal Road Springfield, VA 22161 phone: 800.553.6847 fax: 703.605.6900 email: [email protected] online ordering: http://www.ntis.gov/help/ordermethods.aspx
Cover Photos: (left to right) photo by Pat Corkery, NREL 16416, photo from SunEdison, NREL 17423, photo by Pat Corkery, NREL 16560, photo by Dennis Schroeder, NREL 17613, photo by Dean Armstrong, NREL 17436, photo by Pat Corkery, NREL 17721.
NREL prints on paper that contains recycled content.
iv
This report is available at no cost from the National Renewable Energy Laboratory (NREL) at www.nrel.gov/publications.
Acknowledgments The authors wish to thank the U.S. Department of Energy (DOE) for the sponsorship and guidance on this work. We also appreciate the critical reviews by the following individuals, which greatly improved and informed the analysis contained herein:
• Kenneth Alston, DOE • Daniel Boff, DOE • Jason Coughlin, National Renewable Energy Laboratory (NREL) • Shayle Kann, GTM Research • Sylvain Mansier, Sungage Financial • Michael Mendelsohn, NREL • Michael Mittleman, Kilowatt Financial • Ammar Qusaibaty, DOE
v
This report is available at no cost from the National Renewable Energy Laboratory (NREL) at www.nrel.gov/publications.
List of Acronyms ABA American Banker’s Association APR annual percentage rate CEFIA Clean Energy Finance and Investment Authority DOE U.S. Department of Energy FDIC Federal Deposit Insurance Corporation Fed United States Federal Reserve GDP gross domestic product HELOC home equity line of credit ITC investment tax credit LCOE levelized cost of energy MACRS modified accelerated cost recovery system NCUA National Credit Union Administration O&M operations and maintenance OCC Office of the Comptroller of the Currency PACE property assessed clean energy PBI production-based incentive P&I principal and interest PPA power purchase agreement PV photovoltaic REC renewable energy credit RPS renewable portfolio standard TPO third-party ownership UCC Uniform Commercial Code WACC weighted average cost of capital
vi
This report is available at no cost from the National Renewable Energy Laboratory (NREL) at www.nrel.gov/publications.
Executive Summary This report provides a high-level overview of the developing U.S. solar loan product landscape, from both a market and economic perspective. It covers current and potential U.S. solar lending institutions; currently available loan products; loan program structures and post-loan origination options; risks and uncertainties of the solar asset class as it pertains to lenders; and an economic analysis comparing loan products to third party-financed systems in California.
Solar-specific loan financing is growing in the United States—2014 in particular saw several new loan product announcements and program launches (See Footnote 2 in the Introduction). A solar loan financing arrangement differs from third-party ownership (TPO) in several key aspects, including: the retention of ownership rights by the system host and its associated tax benefits and other incentives; the fixed nature of its monthly payment (similar to a lease but not a power purchase agreement [PPA]); and the variability in the size of payments based on the interest rate and tenor of the loan (i.e., individual payments spread over a longer period will be smaller in size).
Several analysts and industry stakeholders have indicated that solar loans will increasingly capture market share relative to the TPO model in the coming years. While the actual competitiveness of the loan option in solar finance will be determined by the offerings in the market, this report attempts to provide a framework for understanding how loan structures could affect the ultimate cost to distributed PV consumers. Solar loans have the potential to provide an economical option (from an LCOE perspective) for homeowners and businesses to finance the purchase of a solar system, retaining the benefits of ownership that TPO systems cannot provide while avoiding the large upfront cost of a PV system.
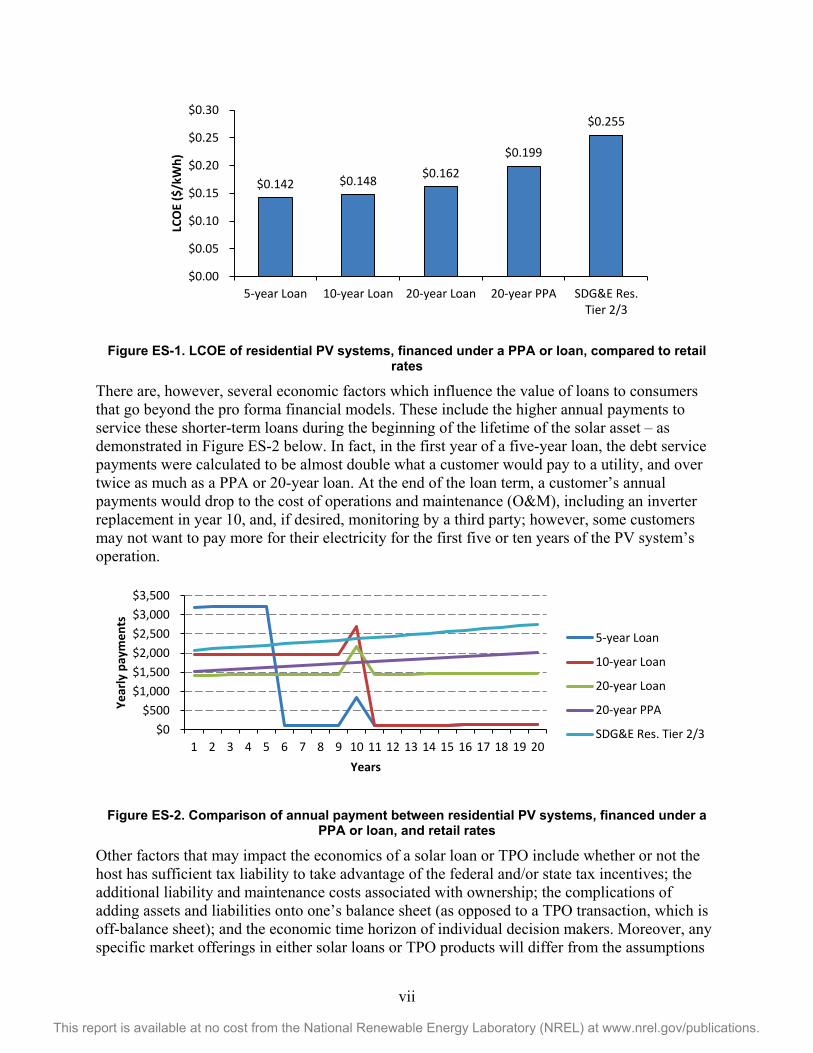
Section 4 of this report presents the results of an economic analysis comparing the economics of residential and commercial customers using solar loans to those using TPO to finance on-site PV generation. As demonstrated in Figure ES-1 below, the levelized cost of energy (LCOE) for residential systems with solar loans was lower than the LCOE for residential systems with PPAs by 19% to 29% (varying by the term of the loan), due to the higher cost of capital necessary for the sponsor and tax equity in a PPA transaction.
vii
This report is available at no cost from the National Renewable Energy Laboratory (NREL) at www.nrel.gov/publications.
Figure ES-1. LCOE of residential PV systems, financed under a PPA or loan, compared to retail rates
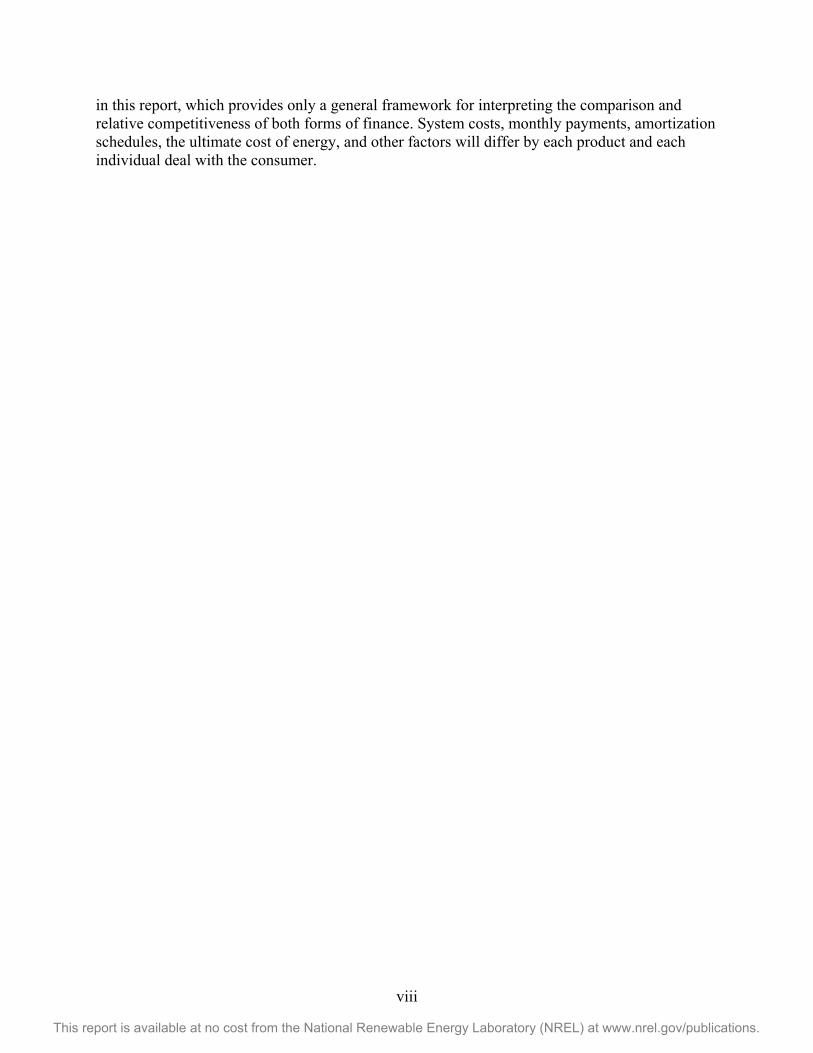
There are, however, several economic factors which influence the value of loans to consumers that go beyond the pro forma financial models. These include the higher annual payments to service these shorter-term loans during the beginning of the lifetime of the solar asset – as demonstrated in Figure ES-2 below. In fact, in the first year of a five-year loan, the debt service payments were calculated to be almost double what a customer would pay to a utility, and over twice as much as a PPA or 20-year loan. At the end of the loan term, a customer’s annual payments would drop to the cost of operations and maintenance (O&M), including an inverter replacement in year 10, and, if desired, monitoring by a third party; however, some customers may not want to pay more for their electricity for the first five or ten years of the PV system’s operation.
Figure ES-2. Comparison of annual payment between residential PV systems, financed under a PPA or loan, and retail rates
Other factors that may impact the economics of a solar loan or TPO include whether or not the host has sufficient tax liability to take advantage of the federal and/or state tax incentives; the additional liability and maintenance costs associated with ownership; the complications of adding assets and liabilities onto one’s balance sheet (as opposed to a TPO transaction, which is off-balance sheet); and the economic time horizon of individual decision makers. Moreover, any specific market offerings in either solar loans or TPO products will differ from the assumptions
$0.142 $0.148 $0.162 $0.199
$0.255
$0.00
$0.05
$0.10
$0.15
$0.20
$0.25
$0.30
5-year Loan 10-year Loan 20-year Loan 20-year PPA SDG&E Res.Tier 2/3
LCO
E ($
/kW
h)
$0$500
$1,000$1,500$2,000$2,500$3,000$3,500
1 2 3 4 5 6 7 8 9 10 11 12 13 14 15 16 17 18 19 20
Year
ly p
aym
ents
Years
5-year Loan
10-year Loan
20-year Loan
20-year PPA
SDG&E Res. Tier 2/3
viii
This report is available at no cost from the National Renewable Energy Laboratory (NREL) at www.nrel.gov/publications.
in this report, which provides only a general framework for interpreting the comparison and relative competitiveness of both forms of finance. System costs, monthly payments, amortization schedules, the ultimate cost of energy, and other factors will differ by each product and each individual deal with the consumer.
ix
This report is available at no cost from the National Renewable Energy Laboratory (NREL) at www.nrel.gov/publications.
Table of Contents 1 Introduction ......................................................................................................................................... 11 2 The U.S. Solar Market ......................................................................................................................... 13
2.1 Solar Policy: Fundamentals for Growth ...................................................................................... 13 2.2 Third-party Ownership: A Market Solution ................................................................................ 14 2.3 Solar Loans: A Nascent Option ................................................................................................... 17
3 Solar Loans: Lenders, Processes, Products, and Risks ................................................................ 18 3.1 Lenders ........................................................................................................................................ 18
3.1.1 Banks .............................................................................................................................. 18 3.1.2 Credit Unions ................................................................................................................. 18 3.1.3 Non-Depository Private Entities Associated with Lending ............................................ 18 3.1.4 Non-Depository Public Entities Associated with Lending ............................................. 19
3.2 Regulation ................................................................................................................................... 20 3.3 Processes and Business Models .................................................................................................. 21 3.4 The Solar Loan Product Landscape ............................................................................................. 23 3.5 Challenges in Lending to the Solar Asset Class .......................................................................... 24
4 Economics of Financing a PV System Through a PPA versus a Loan ......................................... 25 4.1 Pro Forma Financial Models ....................................................................................................... 25
4.1.1 Pro Forma Financial Model Description ........................................................................ 25 4.1.2 Residential/Commercial PPA Pro Forma Financial Model............................................ 26 4.1.3 Residential Loan Pro Forma Financial Model ............................................................... 26 4.1.4 Commercial Loan Pro Forma Financial Model .............................................................. 27
4.2 Results of Residential Pro Forma Financial Models ................................................................... 28 4.3 Results of Commercial Pro Forma Financial Models ................................................................. 29 4.4 Economic Factors Beyond the Pro Forma Financial Models ...................................................... 30
5 Conclusion .......................................................................................................................................... 35
x
This report is available at no cost from the National Renewable Energy Laboratory (NREL) at www.nrel.gov/publications.
Figures and Tables Figure ES-1. LCOE of residential PV systems, financed under a PPA or loan, compared to retail rates... vii Figure ES-2. Comparison of annual payment between residential PV systems, financed under a PPA or
loan, and retail rates ............................................................................................................... vii Figure 1. State renewable portfolio standards with solar and DG set-asides .............................................. 13 Figure 2. Distributed PV systems installed in California, with and without incentives, by quarter ........... 14 Figure 3. Third-party market share of annual residential installations, by state ......................................... 15 Figure 4. Average U.S. PV system price by market segment ..................................................................... 15 Figure 5. Historic and projected annual distributed U.S. PV installations by sector: 2007-2016 ............... 16 Figure 6. U.S. solar workforce & value of installed PV systems, by sector (annually) .............................. 17 Figure 7. LCOE of residential PV systems, financed under a PPA or loan, compared to retail rates ........ 28 Figure 8. Comparison of annual payment between residential PV systems, financed under a PPA or loan,
and retail rates ........................................................................................................................ 28 Figure 9. LCOE of commercial PV systems, financed under a PPA or loan, compared to retail rates ...... 29 Figure 10. Comparison of annual payment between commercial PV systems, financed under a PPA or
loan, and retail rates ............................................................................................................... 30 Figure 11. LCOE comparison of PV systems, financed by loans, over 20 and 30 year lifetime ................ 31 Figure 12. Average U.S. federal taxes incurred in 2010, by quintile .......................................................... 33 Table 1. U.S. Bank and Non-Bank Regulators ........................................................................................... 21 Table 2. Overview of Solar Loan Options Available in the 2014 Market .................................................. 23 Table 3. Basic Model Assumptions ............................................................................................................ 25 Table A-1. Basic Assumptions for Residential and Commercial Pro Forma Financial Models ................. 40 Table A-2. Assumptions Specific to Loan Pro Forma Financial Models ................................................... 40 Table A-3. Assumptions Specific to PPA Pro Forma Financial Models Using an All-Equity Sale-
Leaseback Transaction for Residential & Commercial Projects ............................................ 41 Table A-4 Assumptions for SolarCity’s Cost of Capital Using Capital Asset Pricing Model (CAPM) ..... 41 Table A-5. Assumptions for “Commercial” Customer’s Cost of Capital Using CAPM ............................ 42 Table A-6. Assumptions for “Residential” Customer Cost of Capital ........................................................ 42
11
This report is available at no cost from the National Renewable Energy Laboratory (NREL) at www.nrel.gov/publications.
1 Introduction The growth in distributed (and particularly residential) solar photovoltaics (PV) deployment in the U.S. has been facilitated in large part through the third-party ownership (TPO) model. In 2013, TPO represented some 66% of the U.S. residential solar market, and a considerable portion of the commercial market (Litvak 2014). The success of the TPO model is attributable in part to its economic proposition: TPO can provide consumers access to PV-generated electricity at a price that is competitive with those consumers’ utility (i.e., retail) rates. However, in the last two years, another solar financing option is becoming commensurately competitive and has begun to capture market share: loans.
Until recently, loan financing for distributed solar installations was largely done through home equity loans or home equity lines of credit (HELOCs), commercial loans, and other standardized loan products available to homeowners and businesses for general expenditures. Historically, solar-specific loans—i.e., products for which the underwriting, loan terms, lender security interest, and other programmatic aspects are all designed for financing solar installations exclusively1—have not had much market presence. Prior to the fall of 2013, there were few widely available (i.e., not jurisdictionally limited, such as property assessed clean energy programs or on-bill financing in a utility’s service territory) solar loan options in the United States. However, from the period between approximately October 2013 and October 2014, at least nine new solar-specific loan programs were announced, and several more have begun operations without a formal announcement.2
A solar loan financing arrangement differs from TPO in several key aspects, including:
• Ownership: When financing through a loan, the system host retains ownership of the PV assets. Third-party ownership, as the name implies, entails ownership and maintenance by the solar company and its investor partners.
• Tax benefits and other incentives: Owners of loan-financed systems receive all applicable tax benefits and incentives available to the solar assets (this follows from ownership). As of October 2014, these benefits and incentives could include: the 30% federal investment tax credit (ITC) for individuals (see Section 3), production-based incentives (PBIs), renewable energy credits (RECs), and others. When leasing a system through a TPO arrangement, these benefits typically go to the third party. Additionally, third-party owners can make use of the accelerated depreciation schedule to increase the system cost savings—homeowners cannot.
• Monthly payments: A solar loan is typically amortized through monthly payments of both principal and interest (P&I). In contrast, TPO systems are paid for via either a monthly fixed rate in a lease arrangement, or a charge per unit of electricity produced by the system (on a $/kWh basis) in a PPA arrangement. It is common for both leases and PPAs
1 Some loan products, such as the New York State Energy Research and Development Authority’s (NYSERDA) on-bill program, can be designed to finance both solar installations and energy efficiency upgrades. 2 Loan programs launched during this period include those offered by: Admirals Bank; Digital Credit Union (in partnership with SunPower and more recently Sungage); Dividend Solar; Lightstream; Mosaic; OneRoof Energy; SolarCity; Sungage Financial; WJ Bradley (in partnership with SunEdison); and others
12
This report is available at no cost from the National Renewable Energy Laboratory (NREL) at www.nrel.gov/publications.
to contain annual escalators that step up the charges by a specified percentage (typically around 3%) each year.
• Effect on home valuation: Some studies suggest that homeowners could increase the value of their home when they install and own a solar system on their rooftop (Hoen et al. 2013; Desmarais 2013). While no comparable study has yet been performed on TPO systems, the National Renewable Energy Laboratory’s (NREL’s) communications with appraisers and homeowners in California, as well as speculations made in recent news articles (Wade 2014) suggest that systems financed through a PPA or a lease may not be rolled toward the value of the home (appraisers may, in fact, count them a deduction against the home value), and could complicate the sales process. It is important to note, however, that the effect that each financing option has on home value is still not well understood. Additional data, regulatory decision making, and the development of industry best practices will be necessary before the market arrives at a standard method for appraising solar assets.
• Cost: The cost to finance a system through a loan is largely determined by the interaction between the loan amount, the applicable interest rate, and the tenor or term of the loan. For example, a $20,000 loan with a 6% annual percentage rate (APR) of interest and a 15-year maturity will add an extra $18,000 in costs to the principal amount, or about an extra $100 a month in interest payments. TPO systems are typically financed on a portfolio basis through complex financial structures that bring in tax equity investors to monetize the 30% ITC and depreciation expense. The weighted average cost of capital (WACC) of these structures reflects, principally, the tax equity’s yield on their investment, the cost of any associated debt, and the sponsor’s (i.e., the solar company’s) cost of equity. The resulting cost of the system will be influenced by this WACC, which is typically higher than the cost of capital on the loan.
This report provides a high-level overview of the developing U.S. solar loan product landscape, from both a market and economic perspective. It covers current and potential U.S. solar lending institutions; currently available loan products; loan program structures and post-loan origination options; risks and uncertainties of the solar asset class as it pertains to lenders; and an economic analysis comparing loan products to third party-financed systems in California. The report begins (Section 2) with an overview of the U.S. distributed solar market to contextualize the discussions to follow. For readers already familiar with this information, the authors recommend beginning at Section 3 on page 18.
The penultimate section of the report (Section 4) provides an economic analysis of solar loans versus TPO. The authors built three pro forma financial models to calculate the levelized cost of energy (LCOE) for a residential loan, a commercial loan, and a TPO PPA in the state of California. These LCOE figures are used to compare the system costs associated with each financing arrangement, and—for the residential loan and TPO PPA—to compare with the retail rates of one of California’s three investor-owned utilities. This report finds that the single largest differentiating factor influencing LCOE in the models was the cost to finance the solar assets—namely the interest rate on the loan, and the WACC in the TPO PPA. Accordingly, the modeled LCOE for solar loans was lower than the TPO LCOE in this analysis.
13
This report is available at no cost from the National Renewable Energy Laboratory (NREL) at www.nrel.gov/publications.
2 The U.S. Solar Market 2.1 Solar Policy: Fundamentals for Growth The relatively high levels of year-over-year growth recently achieved in the U.S. photovoltaic (PV) market is largely due to the financial incentives and support policies available from the federal, state and local governments. Historically, national incentives have been provided primarily through the U.S. tax code, in the form of a 30% ITC given in the first year of operation, either under section 48 or 25D of the tax code. The section 48 credit is used by businesses (e.g., all commercial and utility-scale installations and to third-party owned residential, government, or non-profit installations), and in 2017 will revert to 10%. The 25D credit is for persons using the solar property for residential purposes and, unlike the section 48 credit, will cease to exist in 2017. Businesses which claim the ITC have the additional benefit of using an accelerated 5-year tax depreciation schedule for the solar asset; together they are commonly referred to as “tax benefits.”
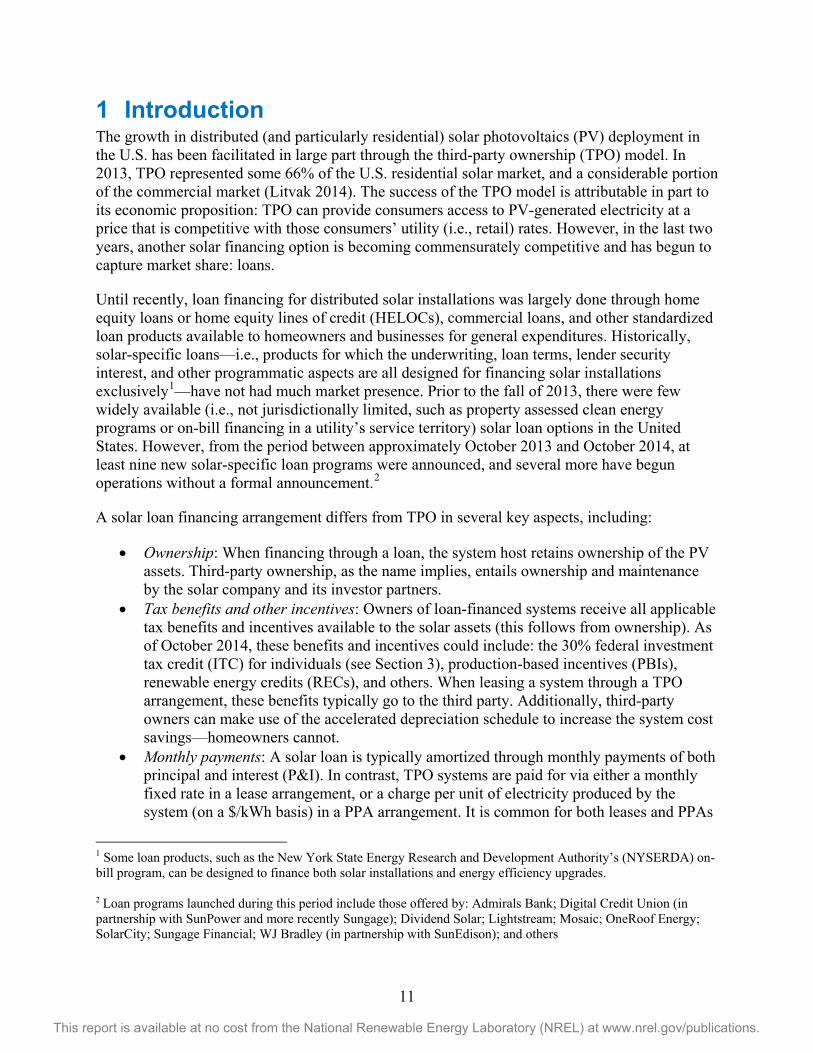
At the state level, renewable portfolio standards (RPSs) have proven to be one of the most significant drivers of renewable energy deployment in the United States. An RPS, also called a renewable electricity standard (RES), requires electricity suppliers to purchase or generate a targeted amount of renewable energy by a certain date. Although design details can vary considerably, RPS policies typically enforce compliance through penalties, and many include the trading of renewable energy certificates (RECs). As of November 2013, seventeen states and Washington, D.C. had RPS policies with specific solar provisions (Barbose 2013).
Figure 1. State renewable portfolio standards with solar and DG set-asides
Source: Barbose (2013)
As an alternative to RECs, states have incentivized PV deployment through up-front cash grants, performance-based cash grants, state and local tax credits, and feed-in tariffs. Local jurisdictions without strong state solar mandates (e.g., Austin, Texas) have also developed solar initiatives as well. Recently, PV systems have been installed in certain markets in the U.S. (e.g., Hawaii, California) without the need for state or local incentives, either because retail electricity rates in those markets are relatively high, or the cost to install the systems has fallen to relatively low levels. As shown in Figure 2, in the fourth quarter of 2013, only 36% of distributed systems
NV: 1.5% solar by 20252.4x multiplier for PV until 2015
PA: 0.5% solar PV by 2020
NJ: 4.1% solar electric by 2027
AZ: 4.5% customer-sited DG by 2025 (half from residential)
NY: 878 GWh retail DG by 2015
CO: 3% DG by 2020 for IOUs (half from retail DG)1% DG by 2020 for coops3x multiplier for munis/coops for solar installed before July 2015
DC: 2.5% solar by 2023
WA: 2x multiplier for DG
NM: 4% solar electric by 2020, 0.6% customer-sited DG by 2020
DE: 3.5% solar by 20253x multiplier for solar installed before Jan. 2015 (applies only to solar used for general RPS target)
MD: 2% solar by 2020
Set-aside
Multiplier
NC: 0.2% solar by 2018
NH: 0.3% solar electric by 2014
Set-aside with multiplierTX: 2x multiplier for all non-wind
OH: 0.5% solar electric by 2024
MA: 456 GWh customer-sited solar PV (no specified target year)
MO: 0.3% solar electric by 2021
MI: 3x multiplier for solarOR: 20 MW solar PV by 20202x multiplier for PV installed before 2016
IL: 1.5% solar PV by 2025,1% DG by 2015 (50% <25 kW)
MN: 1.5% solar by 2020 for IOUs
Note: Compliance years are designated by the calendar year in which they begin
14
This report is available at no cost from the National Renewable Energy Laboratory (NREL) at www.nrel.gov/publications.
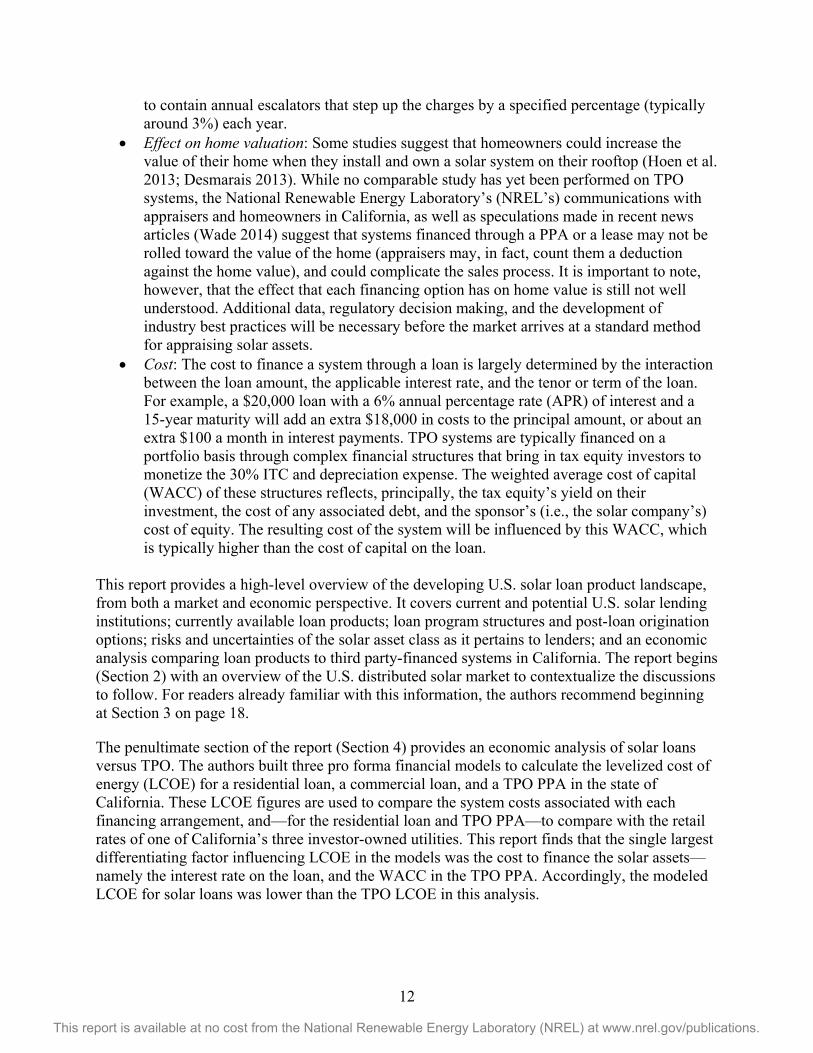
installed in California received assistance from the California Solar Initiative (CSI), the state’s largest incentive program. This was down from 88% just two years earlier.
Figure 2. Distributed PV systems installed in California, with and without incentives, by quarter
Sources: CSI (2014); SEIA & GTM (2014) As state and local incentive programs wind down, or exhaust their budgets, many analysts expect a larger share of systems to be installed with only the federal incentives.
2.2 Third-party Ownership: A Market Solution Given the current state of the United States PV market, benefiting from ownership of solar assets often requires, among other things:
• A large upfront investment of capital • Sufficient expected taxable income to utilize a solar system’s tax benefits • Knowledge of the local and state permitting and incentive programs (due to the fractured
nature of U.S. electric industry and PV incentive programs) • An understanding of the potential risks and uncertainties associated with long-term
ownership of a relatively new asset class.
One business model that attempts to overcome these obstacles is third-party solar ownership. Under this arrangement, a third-party entity purchases, owns and operates the PV system on a homeowner or business’s roof or property. In exchange, the homeowner or business signs a long-term contract (i.e., 15-25 years) to lease the system or purchase the electricity generated by the system (power purchase agreement, or PPA); typically at a rate less than the price of retail electricity rates. The homeowner or business benefits from on-site solar PV generation at or below electric utility costs, but without the upfront outlay of capital or any complications associated with operating a system. This model has gained significant market share in many states across the U.S., with third-party systems comprising approximately 60% to 80% of
0%10%20%30%40%50%60%70%80%90%100%
0
50
100
150
200
250
Q4 '11 Q1 '12 Q2 '12 Q3 '12 Q4 '12 Q1 '13 Q2 '13 Q3 '13 Q4 '13
% o
f Tot
al Q
uart
erly
Inst
alla
tions
Qua
rter
ly In
stal
latio
sn (M
W)
With CSI Incentive W/O CSI Incentives % W/ Incentives
15
This report is available at no cost from the National Renewable Energy Laboratory (NREL) at www.nrel.gov/publications.
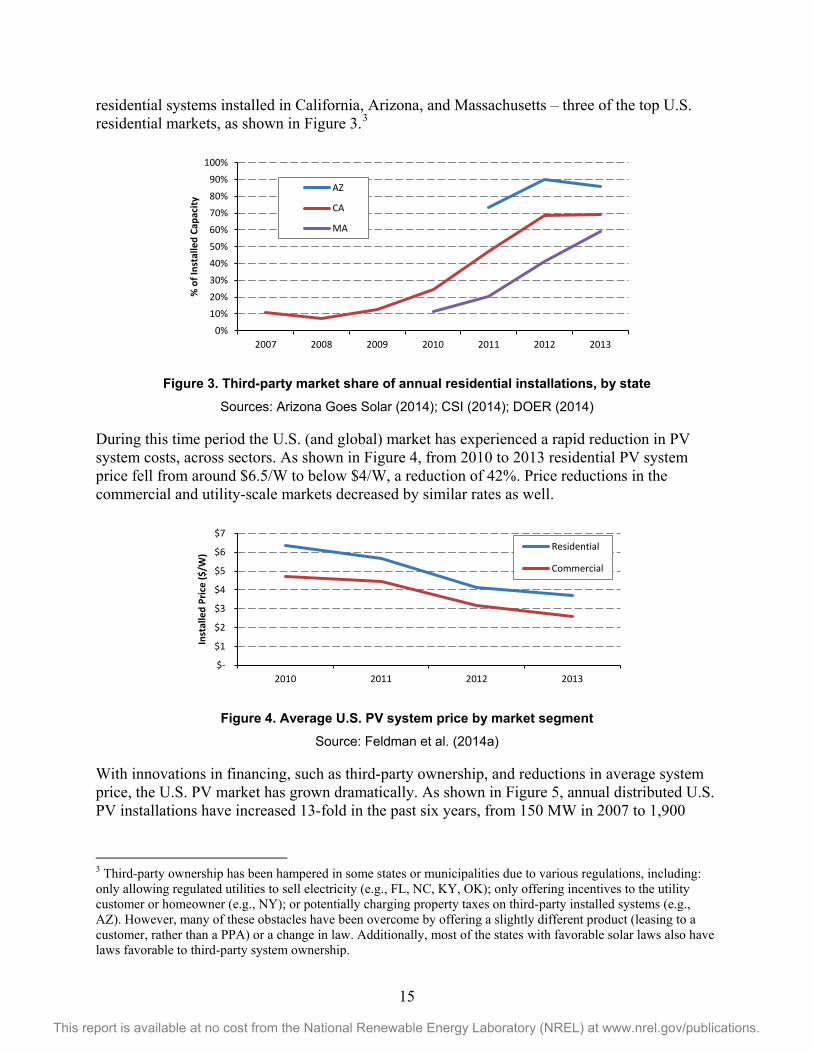
residential systems installed in California, Arizona, and Massachusetts – three of the top U.S. residential markets, as shown in Figure 3.3
Figure 3. Third-party market share of annual residential installations, by state
Sources: Arizona Goes Solar (2014); CSI (2014); DOER (2014)
During this time period the U.S. (and global) market has experienced a rapid reduction in PV system costs, across sectors. As shown in Figure 4, from 2010 to 2013 residential PV system price fell from around $6.5/W to below $4/W, a reduction of 42%. Price reductions in the commercial and utility-scale markets decreased by similar rates as well.
Figure 4. Average U.S. PV system price by market segment Source: Feldman et al. (2014a)
With innovations in financing, such as third-party ownership, and reductions in average system price, the U.S. PV market has grown dramatically. As shown in Figure 5, annual distributed U.S. PV installations have increased 13-fold in the past six years, from 150 MW in 2007 to 1,900
3 Third-party ownership has been hampered in some states or municipalities due to various regulations, including: only allowing regulated utilities to sell electricity (e.g., FL, NC, KY, OK); only offering incentives to the utility customer or homeowner (e.g., NY); or potentially charging property taxes on third-party installed systems (e.g., AZ). However, many of these obstacles have been overcome by offering a slightly different product (leasing to a customer, rather than a PPA) or a change in law. Additionally, most of the states with favorable solar laws also have laws favorable to third-party system ownership.
0%
10%
20%
30%
40%
50%
60%
70%
80%
90%
100%
2007 2008 2009 2010 2011 2012 2013
% o
f Ins
talle
d Ca
paci
ty AZ
CA
MA
$-
$1
$2
$3
$4
$5
$6
$7
2010 2011 2012 2013
Inst
alle
d Pr
ice
($/W
)
Residential
Commercial
16
This report is available at no cost from the National Renewable Energy Laboratory (NREL) at www.nrel.gov/publications.
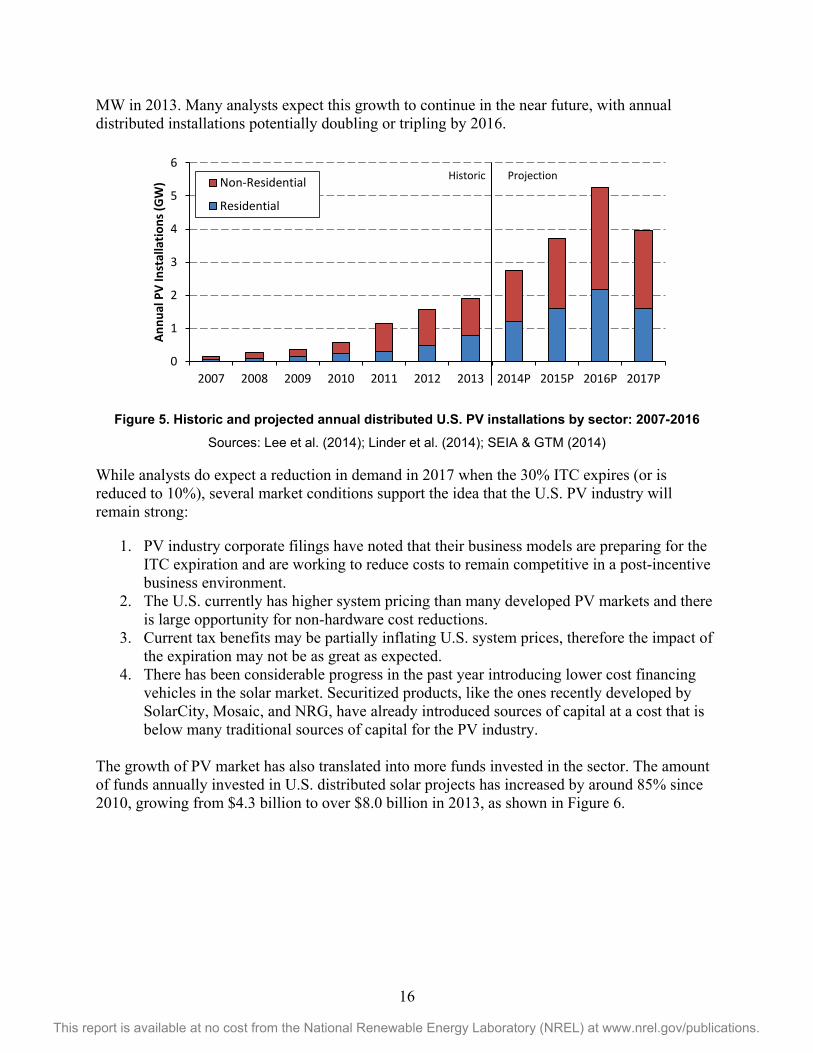
MW in 2013. Many analysts expect this growth to continue in the near future, with annual distributed installations potentially doubling or tripling by 2016.
Figure 5. Historic and projected annual distributed U.S. PV installations by sector: 2007-2016
Sources: Lee et al. (2014); Linder et al. (2014); SEIA & GTM (2014)
While analysts do expect a reduction in demand in 2017 when the 30% ITC expires (or is reduced to 10%), several market conditions support the idea that the U.S. PV industry will remain strong:
1. PV industry corporate filings have noted that their business models are preparing for the ITC expiration and are working to reduce costs to remain competitive in a post-incentive business environment.
2. The U.S. currently has higher system pricing than many developed PV markets and there is large opportunity for non-hardware cost reductions.
3. Current tax benefits may be partially inflating U.S. system prices, therefore the impact of the expiration may not be as great as expected.
4. There has been considerable progress in the past year introducing lower cost financing vehicles in the solar market. Securitized products, like the ones recently developed by SolarCity, Mosaic, and NRG, have already introduced sources of capital at a cost that is below many traditional sources of capital for the PV industry.
The growth of PV market has also translated into more funds invested in the sector. The amount of funds annually invested in U.S. distributed solar projects has increased by around 85% since 2010, growing from $4.3 billion to over $8.0 billion in 2013, as shown in Figure 6.
0
1
2
3
4
5
6
2007 2008 2009 2010 2011 2012 2013 2014P 2015P 2016P 2017P
Annu
al P
V In
stal
latio
ns (G
W) Non-Residential
Residential
Historic Projection
17
This report is available at no cost from the National Renewable Energy Laboratory (NREL) at www.nrel.gov/publications.
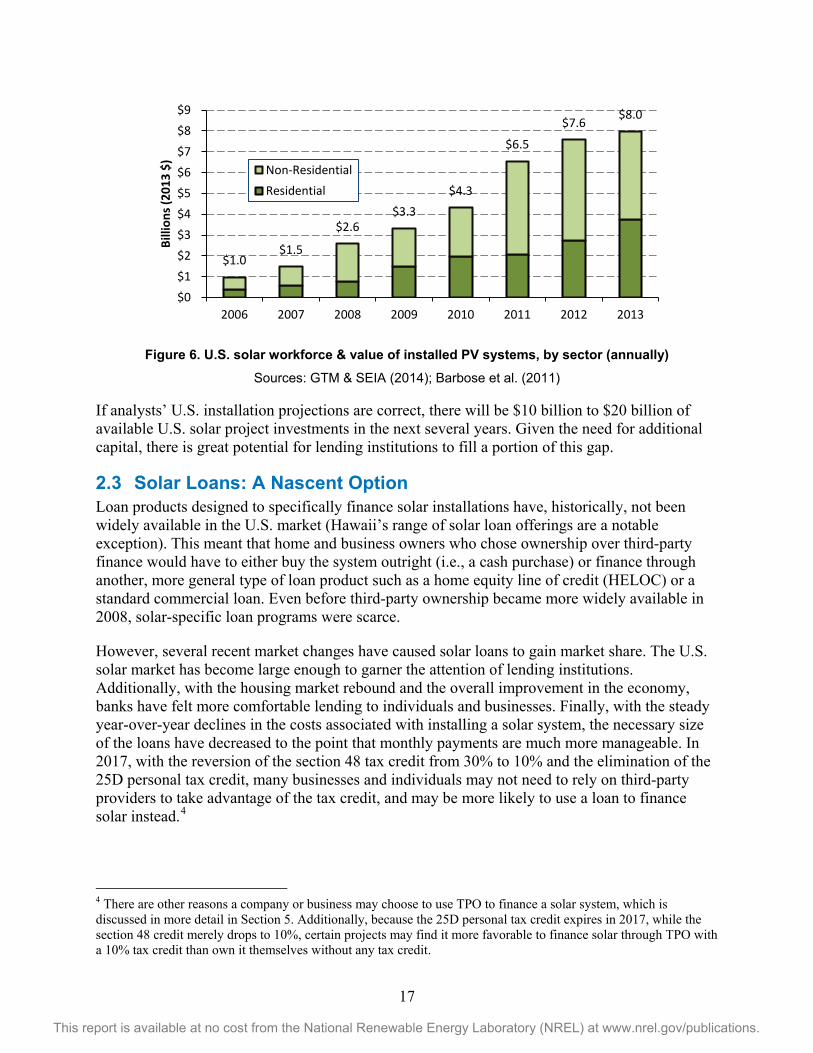
Figure 6. U.S. solar workforce & value of installed PV systems, by sector (annually)
Sources: GTM & SEIA (2014); Barbose et al. (2011)
If analysts’ U.S. installation projections are correct, there will be $10 billion to $20 billion of available U.S. solar project investments in the next several years. Given the need for additional capital, there is great potential for lending institutions to fill a portion of this gap.
2.3 Solar Loans: A Nascent Option Loan products designed to specifically finance solar installations have, historically, not been widely available in the U.S. market (Hawaii’s range of solar loan offerings are a notable exception). This meant that home and business owners who chose ownership over third-party finance would have to either buy the system outright (i.e., a cash purchase) or finance through another, more general type of loan product such as a home equity line of credit (HELOC) or a standard commercial loan. Even before third-party ownership became more widely available in 2008, solar-specific loan programs were scarce.
However, several recent market changes have caused solar loans to gain market share. The U.S. solar market has become large enough to garner the attention of lending institutions. Additionally, with the housing market rebound and the overall improvement in the economy, banks have felt more comfortable lending to individuals and businesses. Finally, with the steady year-over-year declines in the costs associated with installing a solar system, the necessary size of the loans have decreased to the point that monthly payments are much more manageable. In 2017, with the reversion of the section 48 tax credit from 30% to 10% and the elimination of the 25D personal tax credit, many businesses and individuals may not need to rely on third-party providers to take advantage of the tax credit, and may be more likely to use a loan to finance solar instead.4
4 There are other reasons a company or business may choose to use TPO to finance a solar system, which is discussed in more detail in Section 5. Additionally, because the 25D personal tax credit expires in 2017, while the section 48 credit merely drops to 10%, certain projects may find it more favorable to finance solar through TPO with a 10% tax credit than own it themselves without any tax credit.
$1.0 $1.5
$2.6 $3.3
$4.3
$6.5
$7.6 $8.0
$0$1$2$3$4$5$6$7$8$9
2006 2007 2008 2009 2010 2011 2012 2013
Billi
ons (
2013
$)
Non-ResidentialResidential
18
This report is available at no cost from the National Renewable Energy Laboratory (NREL) at www.nrel.gov/publications.
3 Solar Loans: Lenders, Processes, Products, and Risks
3.1 Lenders Several types of financial entities can participate in the solar loan value chain. To categorize these entities, this report distinguishes between depository institutions—which comprise banks and credit unions—and non-depository institutions, namely finance companies and other types of capital providers (hedge funds, private equity, etc.). 3.1.1 Banks A bank is an institution that accepts deposits and channels these deposits into lending activities, making loans to its customer base. In this sense, a bank is a financial intermediary that allocates capital from savers (depositors) to those seeking capital (borrowers). The efficient flow of capital is a touchstone of most healthy modern economies, and banks serve this core function (Heffernan 2005; Gup 2011). Banks can offer products and services to both commercial businesses and individuals (retail).
As of October 2014, there were about 6,800 active banks in the United States, accounting for a total asset base of $14.7 trillion and deposits of about $9.4 trillion (ABA 2014). Smaller banks, commonly referred to as “community” banks, constitute over 95% of all U.S. banking institutions but manage less than 1/6 of total banking assets. The rest of U.S. banking assets are consolidated within 390 banks, with the top five managing over half of the $14.7 trillion (The Fed 2014a) in U.S. banking assets. As a comparison, U.S. gross domestic product— the total value of all U.S. goods and services—was about $16.8 trillion in 2013 (The Fed 2014b).
3.1.2 Credit Unions Credit unions, while outwardly similar to banks, are generally not classified as banking institutions. They are depository entities that offer loans and other financial products to their members, but they are distinguished by their not-for-profit tax status (which exempts them from federal income tax) and their organization around affiliations of federal, state, or corporate scope. There are, for example, credit unions for members of certain branches of the military, for members of certain trade unions, or for workers at certain companies (Heffernan 2005). Because of their tax advantaged status, credit unions are generally able to offer slightly higher deposit rates than those of traditional banks, as well as slightly lower interest rates on loans (NCUA 2014a).There are over 6,500 credit unions in the United States with assets totaling over $1 trillion. Credit union membership comprises over 97 million Americans (NCUA 2014b).
3.1.3 Non-Depository Private Entities Associated with Lending This category is comprised of a range of finance companies and capital providers that could or currently do participate in the solar loan value chain. These include not only solar companies such as SolarCity, Sungage Financial, Kilowatt Financial, OneRoof, and others, but also hedge funds, private equity, and other types of investors with large balance sheets.
Solar loan programs sponsored by finance companies cannot make use of depositor capital, and therefore require some other source to fund loan origination. These sources could be public or private and could be depository or non-depository. Common sources of capital include:
19
This report is available at no cost from the National Renewable Energy Laboratory (NREL) at www.nrel.gov/publications.
• Large banks, such as Bank of America or Citibank, which can provide aggregation facilities (also known as “warehouses”) to pool loans once they have been originated
• Hedge funds, private equity, or other types of managed pools of capital pools • State-level entities, such as green banks or development authorities (see Connecticut and
New York for examples of loan programs backed by state institutions) • “Crowdsourced” capital or peer-to-peer loans facilitated through platforms such as
Mosaic. The cost of capital for depository institutions is typically much lower than that of the non-depository entities. Banks do not currently pay more than a few basis points on their checking and savings accounts, which means that they can access capital at nearly risk-free rates (Bankrate 2014). Non-depository institutions do not enjoy such an arrangement, and must pay rates on their capital that reflect the perceived level of risk associated with their business and balance sheet. While banks may be able to draw on pools of lower cost capital to fund their loan portfolios, they do face regulatory costs to a degree often in excess of finance companies. For example: a bank’s cost of capital (the rate it pays on deposits) averages around 1% and the interest rate it charges on solar loans is 6%. Instead of capturing all of the 5% difference between its cost of funds and the rate of return on its solar loans, the bank may be required to devote a portion of this difference to purchasing high quality assets to hold in reserve as per safety and soundness regulations (see Section 3.2). Additionally, finance companies have options that can reduce the interest rate that they offer on their solar loans to levels below their own cost of capital. Such options include interest rate buydowns from the solar installer (referred to as “dealer discounts” in this paper; see Section 3.4), protracted loan maturities, and others. 3.1.4 Non-Depository Public Entities Associated with Lending Federal, state, and municipal governments and utilities may also participate in the solar loan process. These entities do not have access to low-cost capital through deposits (as do banks) but through taxpayer funds and through typically lower rates paid on debt relative to private corporations and individuals.
Public entities may allocate capital to solar loan programs through a variety of vehicles, including green banks, public benefit corporations (such as port authorities), credit enhancements, bonding, or through actual administration of a loan program. Property assessed clean energy (PACE) programs, for example, require participation from both state and local governments. The state legislature must first pass PACE-enabling legislation so that tax assessments can be placed on properties seeking to finance solar installations or energy retrofits. Adopting municipalities may either issue bonds to fund these improvement projects, or may administer the program if private lenders are participating. Additionally, the state may also participate in PACE lending through a green bank, as does Connecticut’s Clean Energy Finance and Investment Authority (CEFIA), which administers the state’s commercial PACE program and has originated loans. CEFIA also provides credit enhancements for certain financial transactions that fall under its mandate.
20
This report is available at no cost from the National Renewable Energy Laboratory (NREL) at www.nrel.gov/publications.
3.2 Regulation Lending in the United States is a highly regulated business, though the regulations and regulators can vary considerably based on the geographic location and type of lender in question, as well as the markets in which that lender participates.
At one end of the spectrum is the banking industry, which is one of the most heavily regulated in the world. The stringency of the rules governing banks’ capital requirements, asset mix, risk management, and other aspects of its business derives from a long history of bank failures throughout U.S. history. Large-scale bank failures can freeze the flow of capital in advanced economies, and the loss of consumer deposits can be deleterious to GDP.
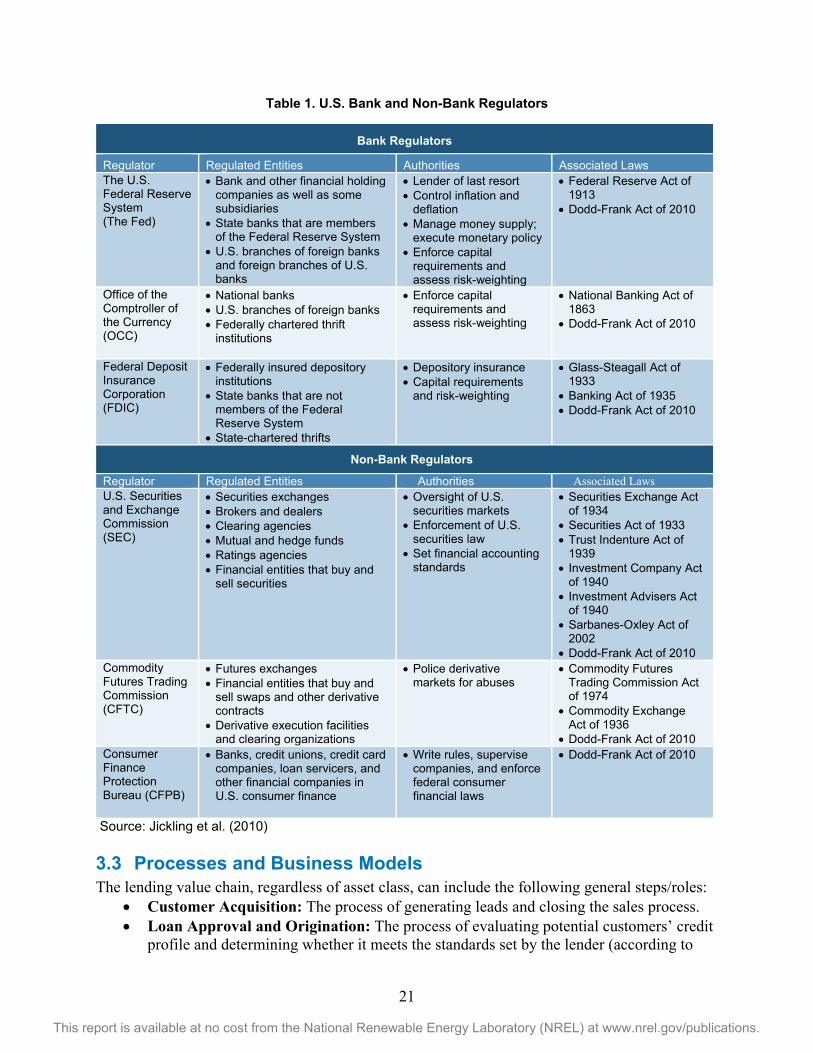
For these reasons and others, banks are subject to heightened regulation relative to other industries. Three separate federal agencies are responsible for monitoring and ensuring the health of banks in the United States: the Office of the Comptroller of the Currency (OCC), The Federal Reserve Banking System (the Fed), and the Federal Deposit Insurance Corporation (FDIC). Each regulator oversees a different class of banks, though there is some overlap in scope between the three agencies (see Table 1). Additionally, banks can also be regulated at the state level, depending on their charter.
Banking regulations in the United States are largely focused on five areas of protection:
1. Ensuring safety and soundness to protect against potential bank failures and therefore losses to FDIC funds and potentially depositors
2. Insuring deposits 3. Ensuring capital adequacy, which, like safety and soundness requirements, ensures that
banks have enough Tier 1 (i.e., very low risk) capital to weather economic shocks 4. Ensuring compliance with consumer protection laws 5. Mitigating the systemic risk of the largest financial institutions to the national and global
economy (Jickling 2010).
Credit unions, while similar to banks in terms of products and services, do not fall under the supervision of the three U.S. bank regulators, and therefore are not necessarily subject to these same regulations. Credit unions have their own federal regulator, the National Credit Union Administration or NCUA, which does provide depository insurance and must examine and evaluate credit unions according to the riskiness of their assets. However, because credit unions are not considered to be systemically risky, they are not subject to the same stringent capital requirements and safety and soundness measures as banks (CRS 2010).
Non-depository finance companies fall under the purview of several regulators, depending on their location and activities in the marketplace. These regulators include: state lending authorities; the Securities and Exchange Commission (SEC) for entities that buy and sell securities; the Commodity Futures Trading Commission (CFTC), which is responsible for the oversight of derivative contracts and trading; and the Consumer Finance Protection Bureau (CFPB), which is the newly-created federal agency to guard against predatory financial practices that harm individuals.
21
This report is available at no cost from the National Renewable Energy Laboratory (NREL) at www.nrel.gov/publications.
Table 1. U.S. Bank and Non-Bank Regulators
Source: Jickling et al. (2010) 3.3 Processes and Business Models The lending value chain, regardless of asset class, can include the following general steps/roles:
• Customer Acquisition: The process of generating leads and closing the sales process. • Loan Approval and Origination: The process of evaluating potential customers’ credit
profile and determining whether it meets the standards set by the lender (according to
Bank Regulators
Regulator Regulated Entities Authorities Associated Laws The U.S. Federal Reserve System (The Fed)
• Bank and other financial holding companies as well as some subsidiaries
• State banks that are members of the Federal Reserve System
• U.S. branches of foreign banks and foreign branches of U.S. banks
• Lender of last resort • Control inflation and
deflation • Manage money supply;
execute monetary policy • Enforce capital
requirements and assess risk-weighting
• Federal Reserve Act of 1913
• Dodd-Frank Act of 2010
Office of the Comptroller of the Currency (OCC)
• National banks • U.S. branches of foreign banks • Federally chartered thrift
institutions
• Enforce capital requirements and assess risk-weighting
• National Banking Act of 1863
• Dodd-Frank Act of 2010
Federal Deposit Insurance Corporation (FDIC)
• Federally insured depository institutions
• State banks that are not members of the Federal Reserve System
• State-chartered thrifts
• Depository insurance • Capital requirements
and risk-weighting
• Glass-Steagall Act of 1933
• Banking Act of 1935 • Dodd-Frank Act of 2010
Non-Bank Regulators
Regulator Regulated Entities Authorities Associated Laws U.S. Securities and Exchange Commission (SEC)
• Securities exchanges • Brokers and dealers • Clearing agencies • Mutual and hedge funds • Ratings agencies • Financial entities that buy and
sell securities
• Oversight of U.S. securities markets
• Enforcement of U.S. securities law
• Set financial accounting standards
• Securities Exchange Act of 1934
• Securities Act of 1933 • Trust Indenture Act of
1939 • Investment Company Act
of 1940 • Investment Advisers Act
of 1940 • Sarbanes-Oxley Act of
2002 • Dodd-Frank Act of 2010
Commodity Futures Trading Commission (CFTC)
• Futures exchanges • Financial entities that buy and
sell swaps and other derivative contracts
• Derivative execution facilities and clearing organizations
• Police derivative markets for abuses
• Commodity Futures Trading Commission Act of 1974
• Commodity Exchange Act of 1936
• Dodd-Frank Act of 2010 Consumer Finance Protection Bureau (CFPB)
• Banks, credit unions, credit card companies, loan servicers, and other financial companies in U.S. consumer finance
• Write rules, supervise companies, and enforce federal consumer financial laws
• Dodd-Frank Act of 2010
22
This report is available at no cost from the National Renewable Energy Laboratory (NREL) at www.nrel.gov/publications.
their particular underwriting criteria). If a particular customer’s credit is approved, then the loan will be originated, i.e., disbursed to the appropriate party according to the terms of the loan.
• Servicing: The servicer maintains the collection accounts associated with a particular loan portfolio and is responsible for ensuring the borrowers’ repayment.
• Aggregation/Warehousing: Loans are booked as assets on the balance sheet. The loan originator has the option to aggregate and hold these assets, or sell them down to a warehouse facility if they have secured one with a large bank or financial institution. A warehouse facility is essentially a fund which “buys” the loan assets from the originator (typically at a discount), allowing the initial loan holder to free up balance sheet capacity and originate additional loans.
• Securitization: The loan holder—i.e., the originator, the warehouse provider, or some other buyer—may securitize the loan portfolio, provided that it is of sufficient volume, and the anticipated credit rating on the transaction will allow the issuer to earn a favorable rate on the resulting debt. It is worth noting that the financial assets derived from loan securitizations—known as collateralized loan obligations (CLOs)—have been in lower demand since the financial crisis. Accordingly, while securitization is still an option for some loan holders, it may not be a primary consideration (Lowder et al. 2013).
The value chain specific to solar loans includes the following asset-level steps/roles:
• Installation: This encompasses all the physical processes of the PV system construction on the borrower’s rooftop.
• Operations and Maintenance: While all TPO contracts include operations and maintenance (O&M) of the solar system for the life of the contract, there is currently no such standard offering in the loan product marketplace. Some loan programs offer O&M services bundled into the loan amount (e.g., Mosaic and Dividend Solar), though with others (Admirals Bank, most PACE programs), O&M remains the responsibility of the system owner. O&M services in the loan market reportedly do not feature the same extent of coverage as do those in TPO financings.5
Much like in the TPO market, solar loan business models can either tend toward aggregation (i.e., a single company fulfills several of the functions along the loan value chain) or disaggregation (functions along the value chain are mostly fulfilled by strategic partners). A vertically integrated company like SolarCity provides an example of the aggregated model, where the customer acquisition, underwriting/origination, installation, O&M, loan aggregation, and securities issuance could all be performed in-house or through subsidiaries.
Conversely, Sungage Financial provides an example of the disaggregated model. Sungage performs customer acquisition, loan origination, and servicing in-house, but relies on strategic partners to fulfill other aspects of the value chain. Installation is performed by vendors in Sungage’s dealer network, and these installers also provide workmanship warranties as a sort of O&M service. Sungage Financial operates an origination platform through which it aggregates demand and develops portfolios of loans that are capitalized by third-party investors.
5 As of October 2014.
23
This report is available at no cost from the National Renewable Energy Laboratory (NREL) at www.nrel.gov/publications.
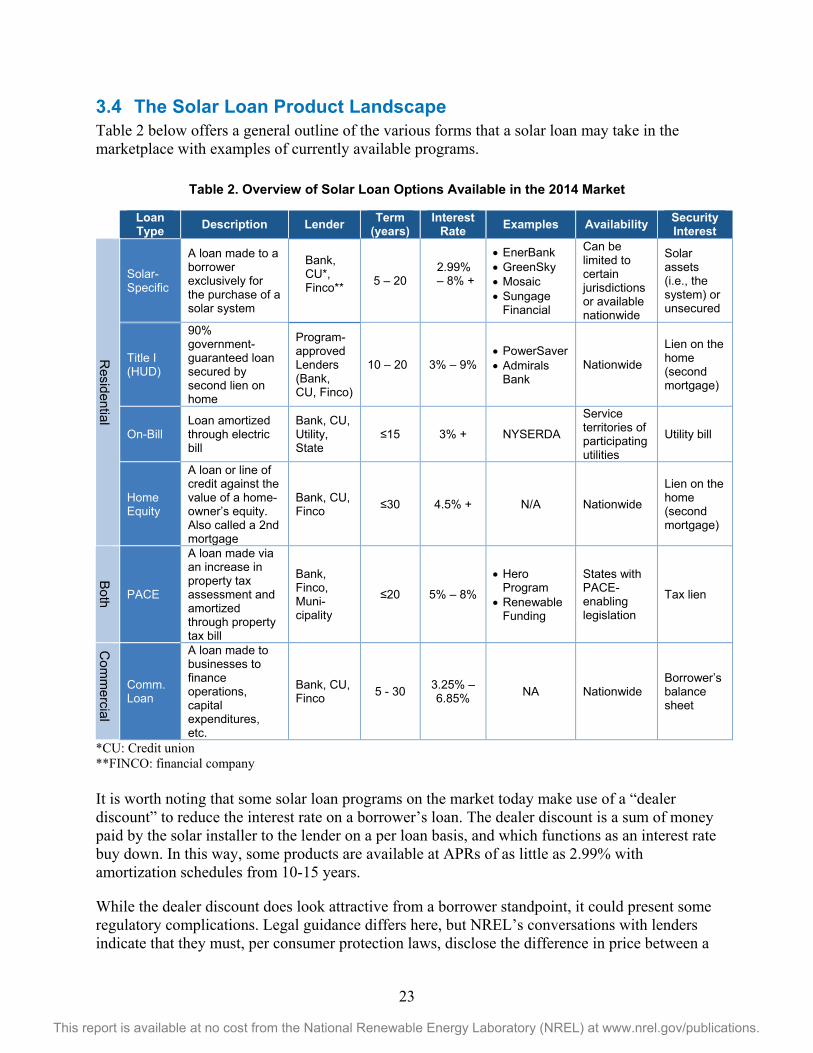
3.4 The Solar Loan Product Landscape Table 2 below offers a general outline of the various forms that a solar loan may take in the marketplace with examples of currently available programs.
Table 2. Overview of Solar Loan Options Available in the 2014 Market
*CU: Credit union **FINCO: financial company It is worth noting that some solar loan programs on the market today make use of a “dealer discount” to reduce the interest rate on a borrower’s loan. The dealer discount is a sum of money paid by the solar installer to the lender on a per loan basis, and which functions as an interest rate buy down. In this way, some products are available at APRs of as little as 2.99% with amortization schedules from 10-15 years.
While the dealer discount does look attractive from a borrower standpoint, it could present some regulatory complications. Legal guidance differs here, but NREL’s conversations with lenders indicate that they must, per consumer protection laws, disclose the difference in price between a
Loan Type Description Lender Term
(years) Interest
Rate Examples Availability Security Interest
Residential
Solar- Specific
A loan made to a borrower exclusively for the purchase of a solar system
Bank, CU*, Finco**
5 – 20 2.99% – 8% +
• EnerBank • GreenSky • Mosaic • Sungage
Financial
Can be limited to certain jurisdictions or available nationwide
Solar assets (i.e., the system) or unsecured
Title I (HUD)
90% government-guaranteed loan secured by second lien on home
Program- approved Lenders (Bank, CU, Finco)
10 – 20 3% – 9% • PowerSaver • Admirals
Bank Nationwide
Lien on the home (second mortgage)
On-Bill Loan amortized through electric bill
Bank, CU, Utility, State
≤15 3% + NYSERDA
Service territories of participating utilities
Utility bill
Home Equity
A loan or line of credit against the value of a home-owner’s equity. Also called a 2nd mortgage
Bank, CU, Finco ≤30 4.5% + N/A Nationwide
Lien on the home (second mortgage)
Both
PACE
A loan made via an increase in property tax assessment and amortized through property tax bill
Bank, Finco, Muni-cipality
≤20 5% – 8%
• Hero Program
• Renewable Funding
States with PACE-enabling legislation
Tax lien
Com
mercial
Comm. Loan
A loan made to businesses to finance operations, capital expenditures, etc.
Bank, CU, Finco 5 - 30 3.25% –
6.85% NA Nationwide Borrower’s balance sheet
24
This report is available at no cost from the National Renewable Energy Laboratory (NREL) at www.nrel.gov/publications.
system financed with a dealer discount (which would be higher to account for the dealer’s contribution), and one where no such discount was applied (which would be closer to the benchmarked per-watt cost in that market). There is still a degree of uncertainty as to the best practices in dealer discounts, though with the volume of loan products coming on the market making use of this feature, some clarity will likely be forthcoming.
3.5 Challenges in Lending to the Solar Asset Class Investor understanding of the solar asset class is improving (recent securitizations and high deal volumes over the last several years have contributed to this outcome), though loan products in particular may have to contend with a number of outstanding risks. These include: a lack of historical performance and credit data (this is an issue for other types of solar financings as well); regulatory treatment of solar loans; complications with the characterization of solar assets as fixtures versus personal property (depending on whether they are financed via a lease/PPA or a loan); the rights of secured-solar lenders in foreclosure situations; and other issues without experiential learning or legal precedent may present some barriers to the growth of the solar loan market.
Banks in particular face a number of regulatory and legal challenges associated with the solar asset class. At current system prices, PV assets typically necessitate a longer amortization schedule to ensure that monthly payments are not too burdensome for customers. However, long term loans—greater than five years—can carry considerable interest rate risk, whereby a rise in market rates can negatively impact the bank’s income on a fixed-rate asset (such as a solar loan). This can either occur through the opportunity cost of holding a loan that generates interest income at below the new market rate, or by shrinking the spread between a bank’s cost of capital and its return on capital until the loan reaches maturity. There is an option for banks to hedge against interest rate risks by the use of derivatives such as interest rate swaps or caps, but these strategies may be beyond the level of sophistication at which many banks are comfortable. Hedging, moreover, does come at a cost.
Additionally, regulators may also review a bank’s loan portfolio unfavorably if its portfolio is heavily weighted in un-hedged, long-dated assets, or if the portfolio is over-hedged. Hedges and loans with long maturities have higher risk weightings, and federally insured banks—per regulatory requirements codified in the 2010 Dodd-Frank legislation—must hold certain ratios of Tier 1 (i.e., high quality or risk free) capital against risky assets. This Tier 1 capital, while contributing to the safety and soundness of the financial institution, cannot be “put to work” in the market, thus limiting the ability of banks and other investors to direct resources to emerging markets such as solar. And because banks tend to be relationship-driven, they may allocate their increasingly scant capital to existing customers instead of opportunities in perceived riskier markets.
25
This report is available at no cost from the National Renewable Energy Laboratory (NREL) at www.nrel.gov/publications.
4 Economics of Financing a PV System Through a PPA versus a Loan
This section compares the economic attractiveness, to an individual or business, of using a loan versus a PPA to finance a PV installation. It also discusses non-economic factors that might influence an individual or business in their decision making. The results of the economic models do not demonstrate which option is the most efficient for every circumstance; rather, the analysis and subsequent discussion attempts to highlight some of the key factors a company or individual should think about in determining which financing method is best for their specific circumstance.
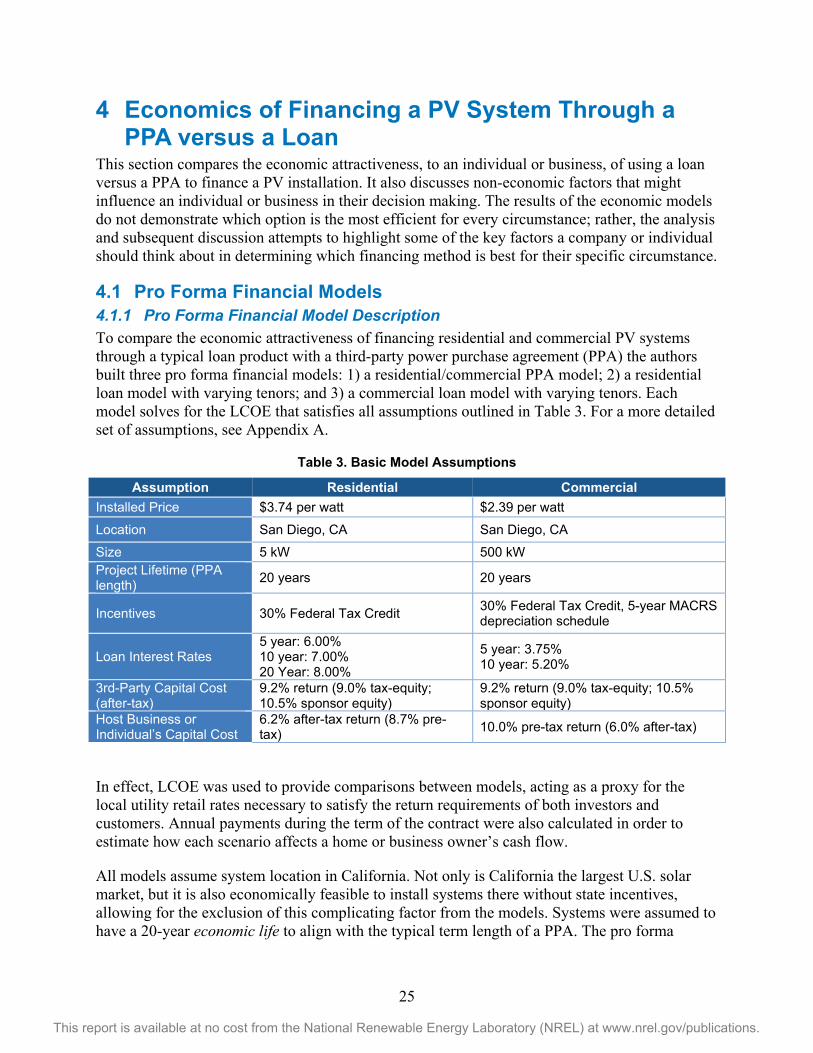
4.1 Pro Forma Financial Models 4.1.1 Pro Forma Financial Model Description To compare the economic attractiveness of financing residential and commercial PV systems through a typical loan product with a third-party power purchase agreement (PPA) the authors built three pro forma financial models: 1) a residential/commercial PPA model; 2) a residential loan model with varying tenors; and 3) a commercial loan model with varying tenors. Each model solves for the LCOE that satisfies all assumptions outlined in Table 3. For a more detailed set of assumptions, see Appendix A.
Table 3. Basic Model Assumptions
Assumption Residential Commercial Installed Price $3.74 per watt $2.39 per watt
Location San Diego, CA San Diego, CA
Size 5 kW 500 kW Project Lifetime (PPA length) 20 years 20 years
Incentives 30% Federal Tax Credit 30% Federal Tax Credit, 5-year MACRS depreciation schedule
Loan Interest Rates 5 year: 6.00% 10 year: 7.00% 20 Year: 8.00%
5 year: 3.75% 10 year: 5.20%
3rd-Party Capital Cost (after-tax)
9.2% return (9.0% tax-equity; 10.5% sponsor equity)
9.2% return (9.0% tax-equity; 10.5% sponsor equity)
Host Business or Individual’s Capital Cost
6.2% after-tax return (8.7% pre-tax) 10.0% pre-tax return (6.0% after-tax)
In effect, LCOE was used to provide comparisons between models, acting as a proxy for the local utility retail rates necessary to satisfy the return requirements of both investors and customers. Annual payments during the term of the contract were also calculated in order to estimate how each scenario affects a home or business owner’s cash flow.
All models assume system location in California. Not only is California the largest U.S. solar market, but it is also economically feasible to install systems there without state incentives, allowing for the exclusion of this complicating factor from the models. Systems were assumed to have a 20-year economic life to align with the typical term length of a PPA. The pro forma
26
This report is available at no cost from the National Renewable Energy Laboratory (NREL) at www.nrel.gov/publications.
models also calculate cash flows in years 20 through 30 to measure additional benefits beyond the life of the contract, but within what is typically considered the lifetime of a PV asset.
The discount rates for residential and commercial customers were assumed to be 6.2% after-tax (8.7% pre-tax) and 6.0% after-tax (10.0% pre-tax) respectively, based on assumptions and calculations outlined in Appendix A. Although third-party providers might have additional costs (mostly attributable to the cost of capital associated with deploying TPO systems) (Feldman 2013b), we assume that system price and operating expenses are not affected by differences in financing method.
4.1.2 Residential/Commercial PPA Pro Forma Financial Model In the PPA pro forma model, the contract price per kWh given to residential and commercial customers was determined by the calculated LCOE, reduced by the customer’s discount rate (i.e., PPA = LCOE × [1 − discount rate]. The commercial discount rate was increased by the commercial entity’s tax rate so as to provide it with an after-tax return, comparable with self-ownership using a loan (i.e., PPA = LCOE × �1 − discount rate
1 − tax rate�).
It was assumed that projects were financed using a sale-leaseback transaction between the developer (sponsor) and a tax-equity provider.6 The sponsor funds 15% of the project cost (in the form of an upfront lease prepayment, which the sponsor expenses over the contract lifetime). The sponsor is required to make yearly lease payments to the tax-equity provider and to pay operating expenses associated with the project. In exchange, it receives all PPA revenues from the system host. Based on industry data, the sponsor is assumed to require a 10.5% after-tax rate of return. For a more detailed set of assumptions, see SolarCity’s calculated cost of capital in Appendix A. The tax-equity provider funds 85% of the asset, net of lease prepayments, and in exchange receives lease payments from the developer, and an investment tax credit and 5-year modified accelerated cost recovery system (MACRS) depreciation associated with the project. Based on industry data, the tax-equity provider is assumed to require a 9.0% after-tax rate of return (Martin 2014). In the model, the developer leases the system for 80% of the term of the contract, at the end of which it purchases the system back from the tax-equity investor for 20% of the original installed price. This ensures that the arrangement qualifies as an ‘operating’ rather than ‘capital’ lease.7 The net cash flow providing the return to each participant is calculated on an after-tax basis.
4.1.3 Residential Loan Pro Forma Financial Model In the pro forma model, the residential homeowner obtains a loan for the full cost of the project, but immediately pays down 30% of the principal in the first year with the benefits of the 30%
6 There are currently several popular structures to financing a tax-equity investment in a solar asset; these include a sale-leaseback, a partnership flip, and an inverted lease. The choice between these structures is in large part affected by the preferences of the tax-equity provider and the needs and ability of the developer or sponsor. The sale-leaseback structure was chosen for this analysis because of its prevalence in the marketplace; however, a different financing structure would not affect the general outcome of this analysis assuming the same financial hurdle rates apply.
7 In capital leases, the lessee effectively owns the asset under tax and accounting rules.
27
This report is available at no cost from the National Renewable Energy Laboratory (NREL) at www.nrel.gov/publications.
investment tax credit. While the homeowner receives no revenue from the PV system, its yearly benefit is calculated as the electricity expense savings, or the calculated LCOE (i.e., utility retail rate) multiplied by the expected PV system production. LCOE is adjusted in the model to provide the homeowner with an 8% return on cash flows (net of loan payments, O&M, and energy savings). The homeowner is responsible for all operating expenses, including principal and interest payments on the loan. While the interest on certain loans currently available in the marketplace is tax deductible, it is not assumed in this model; the assumption would further reduce the calculated LCOE. As the PV system is built for personal use, the homeowner does not deduct any depreciation expense, as in the case of a commercial enterprise. However, also unlike a commercial entity, the reduced electricity expenses occur on an after-tax basis (i.e., the benefit is not reduced by the tax rate). The residential loan model creates pro formas for 5-, 10-, and 20-year debt terms to reflect the range of loan products currently available in the marketplace. Longer tenors are generally harder to finance, require more paperwork, and have higher interest rates due to the increased risk. Based on market data and private conversations with industry, the interest rates used for this model were 6%, 7%, and 8% for the 5-, 10- and 20-year debt terms, respectively (Admirals 2014).
4.1.4 Commercial Loan Pro Forma Financial Model In the commercial loan pro forma model, the business obtains a loan for the full cost of the project, but pays down 30% of the principal within the first year because they also receive a 30% investment tax credit in that time frame. Also like the homeowner, the business receives no revenue from the PV system, so their yearly benefit is calculated as electricity expense savings (the calculated LCOE multiplied by the expected PV system production). The LCOE is adjusted to provide the business with a 9% return. The business is responsible for all operating expenses, including principal and interest payments on the loan. It also expenses the cost basis of the PV system using the 5-year MACRS schedule, as well as the interest associated with the loan. However, unlike a homeowner, because utility expenses reduce the operating income of a commercial entity, the utility bill savings from PV produce higher operating income and thus higher taxes. The model captures this impact as well.
Commercial entities typically borrow money under shorter time horizons than residential homeowners, including the loan products available for PV installations. Therefore, the pro formas created in the commercial loan model use 5- and 10-year debt terms. Based on private market data, the interest rates used were 3.75% and 5.20%, for the 5- and 10- year debt terms, respectively.
28
This report is available at no cost from the National Renewable Energy Laboratory (NREL) at www.nrel.gov/publications.
4.2 Results of Residential Pro Forma Financial Models
Figure 7. LCOE of residential PV systems, financed under a PPA or loan, compared to retail rates
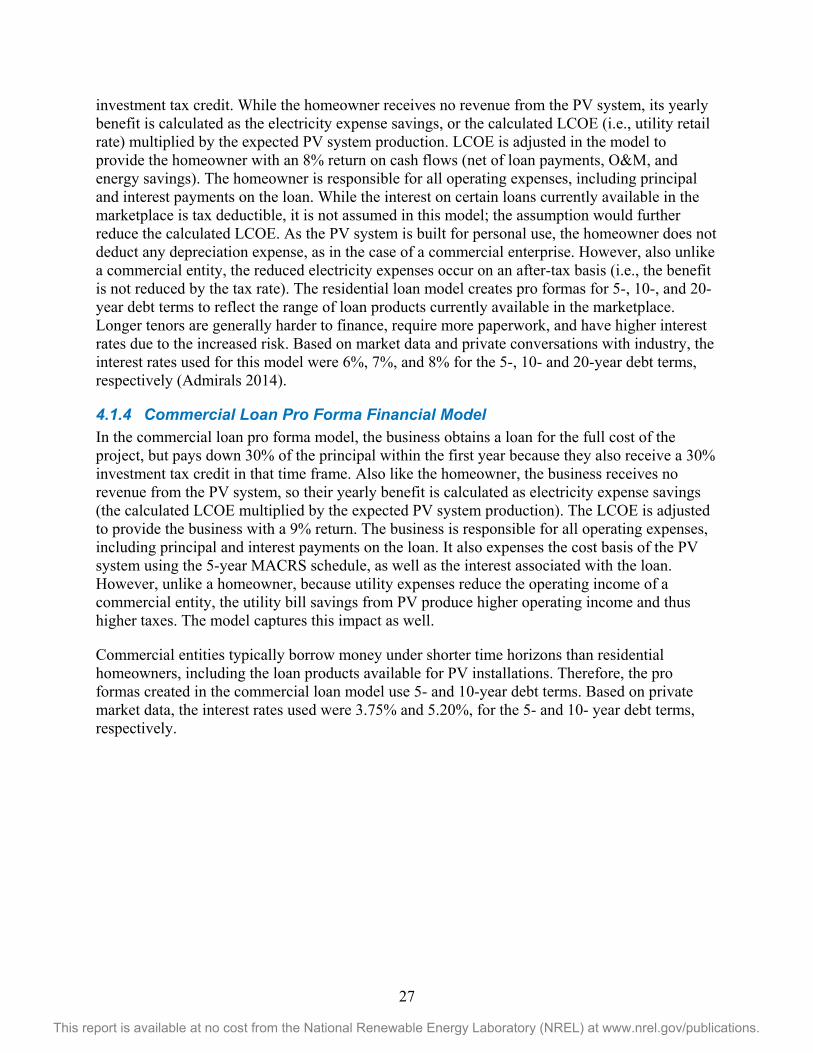
The results of the pro forma financial models show that using either the PPA or bank loan to finance a residential PV system offered savings over utility retail rates (based on San Diego Gas and Electric’s [SDG&E] blended residential rate for Tiers 2 and 38) as demonstrated in Figure 7. However, the cost of energy for the bank loans was lower than the cost of energy for a PPA by 19% to 29% (varying by the term of the loan), due to the higher cost of capital necessary for the sponsor and tax equity in a PPA transaction. Similarly, because the interest rates for the shorter loans were lower than longer term loans they were also able to provide a lower cost of energy.
Figure 8. Comparison of annual payment between residential PV systems, financed under a PPA
or loan, and retail rates
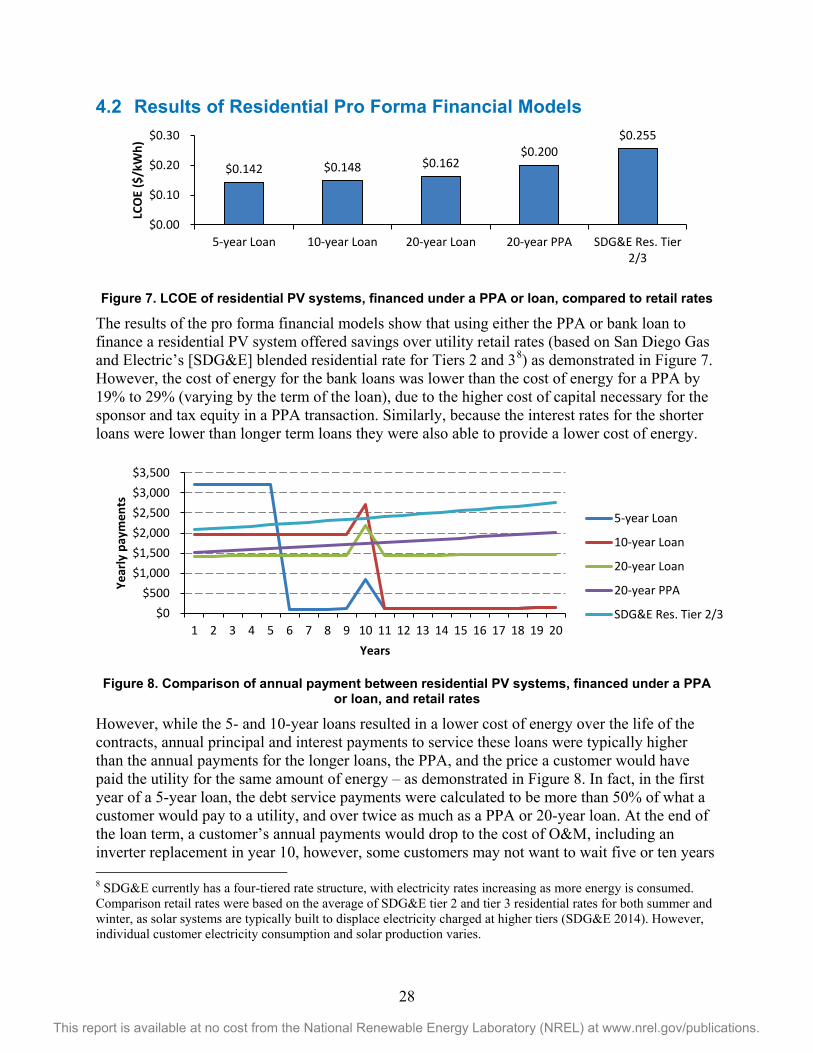
However, while the 5- and 10-year loans resulted in a lower cost of energy over the life of the contracts, annual principal and interest payments to service these loans were typically higher than the annual payments for the longer loans, the PPA, and the price a customer would have paid the utility for the same amount of energy – as demonstrated in Figure 8. In fact, in the first year of a 5-year loan, the debt service payments were calculated to be more than 50% of what a customer would pay to a utility, and over twice as much as a PPA or 20-year loan. At the end of the loan term, a customer’s annual payments would drop to the cost of O&M, including an inverter replacement in year 10, however, some customers may not want to wait five or ten years 8 SDG&E currently has a four-tiered rate structure, with electricity rates increasing as more energy is consumed. Comparison retail rates were based on the average of SDG&E tier 2 and tier 3 residential rates for both summer and winter, as solar systems are typically built to displace electricity charged at higher tiers (SDG&E 2014). However, individual customer electricity consumption and solar production varies.
$0.142 $0.148 $0.162 $0.200
$0.255
$0.00
$0.10
$0.20
$0.30
5-year Loan 10-year Loan 20-year Loan 20-year PPA SDG&E Res. Tier2/3
LCO
E ($
/kW
h)
$0$500
$1,000$1,500$2,000$2,500$3,000$3,500
1 2 3 4 5 6 7 8 9 10 11 12 13 14 15 16 17 18 19 20
Year
ly p
aym
ents
Years
5-year Loan
10-year Loan
20-year Loan
20-year PPA
SDG&E Res. Tier 2/3
29
This report is available at no cost from the National Renewable Energy Laboratory (NREL) at www.nrel.gov/publications.
to start saving money. Additionally, a customer may not want the liability of a potentially high cost of repair or replacement to the system, such as the assumed inverter replacement in year 10. A PPA customer has a hedge against the cost of electricity, including the cost of maintaining the solar system.
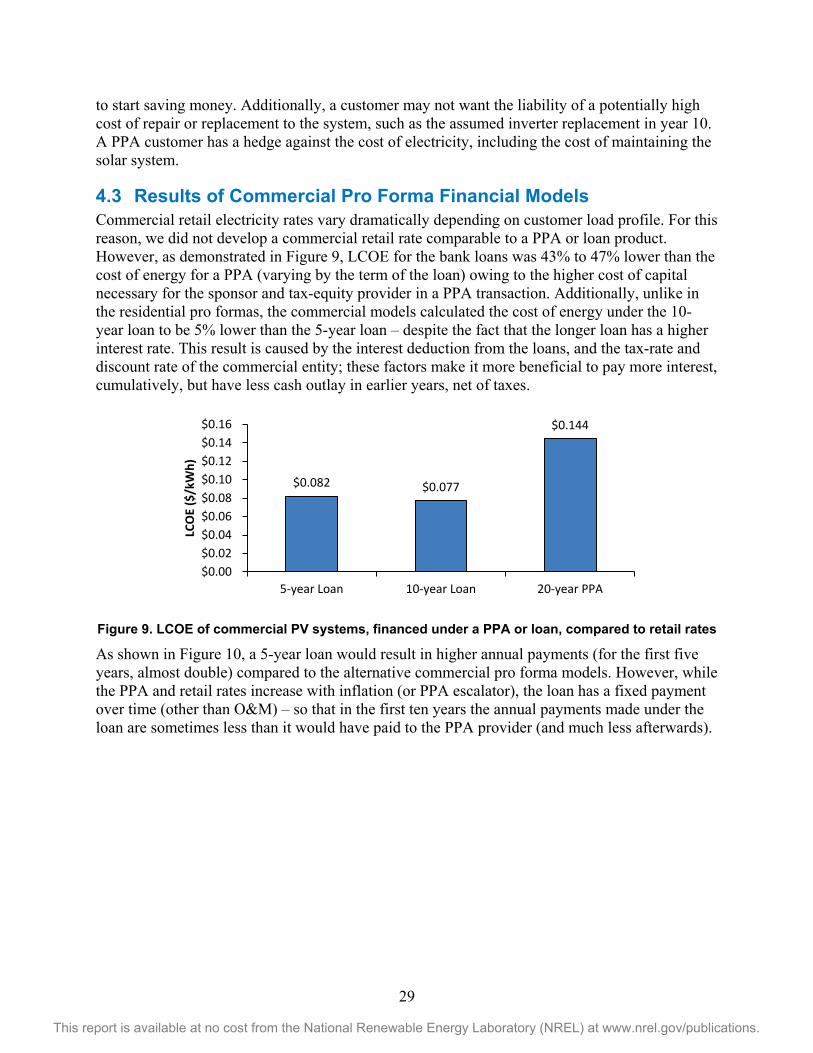
4.3 Results of Commercial Pro Forma Financial Models Commercial retail electricity rates vary dramatically depending on customer load profile. For this reason, we did not develop a commercial retail rate comparable to a PPA or loan product. However, as demonstrated in Figure 9, LCOE for the bank loans was 43% to 47% lower than the cost of energy for a PPA (varying by the term of the loan) owing to the higher cost of capital necessary for the sponsor and tax-equity provider in a PPA transaction. Additionally, unlike in the residential pro formas, the commercial models calculated the cost of energy under the 10-year loan to be 5% lower than the 5-year loan – despite the fact that the longer loan has a higher interest rate. This result is caused by the interest deduction from the loans, and the tax-rate and discount rate of the commercial entity; these factors make it more beneficial to pay more interest, cumulatively, but have less cash outlay in earlier years, net of taxes.
Figure 9. LCOE of commercial PV systems, financed under a PPA or loan, compared to retail rates
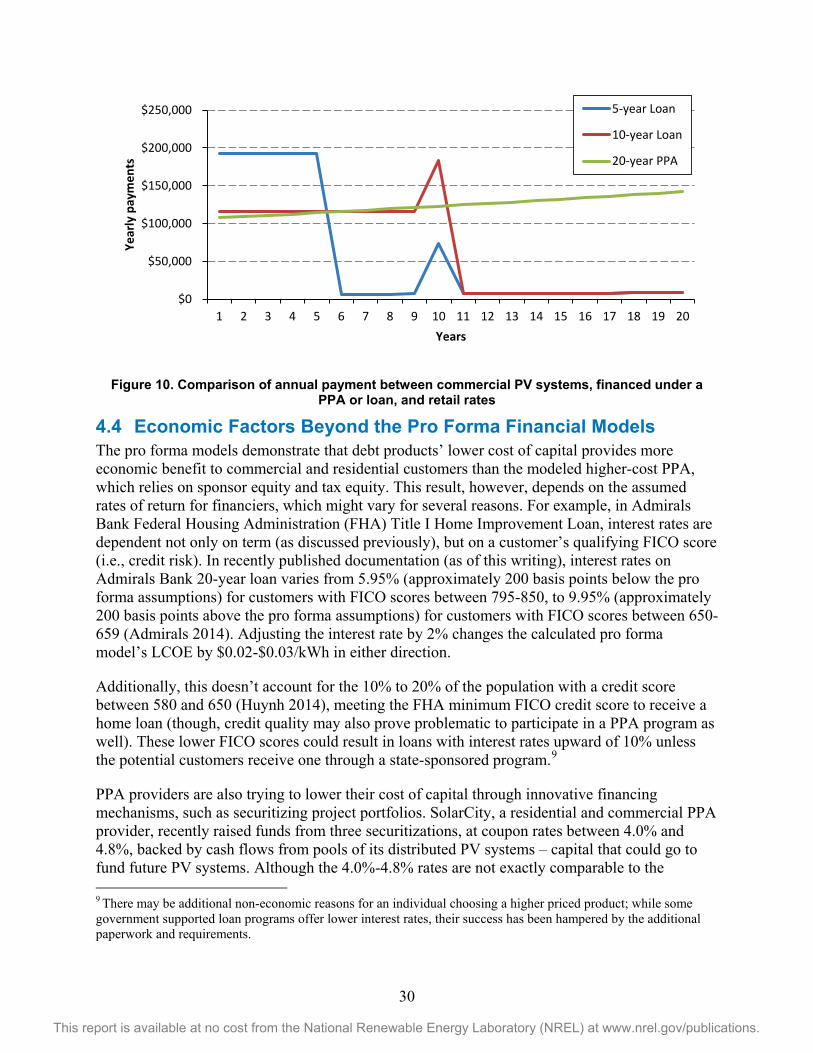
As shown in Figure 10, a 5-year loan would result in higher annual payments (for the first five years, almost double) compared to the alternative commercial pro forma models. However, while the PPA and retail rates increase with inflation (or PPA escalator), the loan has a fixed payment over time (other than O&M) – so that in the first ten years the annual payments made under the loan are sometimes less than it would have paid to the PPA provider (and much less afterwards).
$0.082 $0.077
$0.144
$0.00$0.02$0.04$0.06$0.08$0.10$0.12$0.14$0.16
5-year Loan 10-year Loan 20-year PPA
LCO
E ($
/kW
h)
30
This report is available at no cost from the National Renewable Energy Laboratory (NREL) at www.nrel.gov/publications.
Figure 10. Comparison of annual payment between commercial PV systems, financed under a PPA or loan, and retail rates
4.4 Economic Factors Beyond the Pro Forma Financial Models The pro forma models demonstrate that debt products’ lower cost of capital provides more economic benefit to commercial and residential customers than the modeled higher-cost PPA, which relies on sponsor equity and tax equity. This result, however, depends on the assumed rates of return for financiers, which might vary for several reasons. For example, in Admirals Bank Federal Housing Administration (FHA) Title I Home Improvement Loan, interest rates are dependent not only on term (as discussed previously), but on a customer’s qualifying FICO score (i.e., credit risk). In recently published documentation (as of this writing), interest rates on Admirals Bank 20-year loan varies from 5.95% (approximately 200 basis points below the pro forma assumptions) for customers with FICO scores between 795-850, to 9.95% (approximately 200 basis points above the pro forma assumptions) for customers with FICO scores between 650-659 (Admirals 2014). Adjusting the interest rate by 2% changes the calculated pro forma model’s LCOE by $0.02-$0.03/kWh in either direction.
Additionally, this doesn’t account for the 10% to 20% of the population with a credit score between 580 and 650 (Huynh 2014), meeting the FHA minimum FICO credit score to receive a home loan (though, credit quality may also prove problematic to participate in a PPA program as well). These lower FICO scores could result in loans with interest rates upward of 10% unless the potential customers receive one through a state-sponsored program.9
PPA providers are also trying to lower their cost of capital through innovative financing mechanisms, such as securitizing project portfolios. SolarCity, a residential and commercial PPA provider, recently raised funds from three securitizations, at coupon rates between 4.0% and 4.8%, backed by cash flows from pools of its distributed PV systems – capital that could go to fund future PV systems. Although the 4.0%-4.8% rates are not exactly comparable to the 9 There may be additional non-economic reasons for an individual choosing a higher priced product; while some government supported loan programs offer lower interest rates, their success has been hampered by the additional paperwork and requirements.
$0
$50,000
$100,000
$150,000
$200,000
$250,000
1 2 3 4 5 6 7 8 9 10 11 12 13 14 15 16 17 18 19 20
Year
ly p
aym
ents
Years
5-year Loan
10-year Loan
20-year PPA
31
This report is available at no cost from the National Renewable Energy Laboratory (NREL) at www.nrel.gov/publications.
required returns in the model, they do represent a significant reduction in the cost of capital normally required for TPO financing of a portfolio of PV assets.
Additional factors might make a loan more attractive than a PPA. Homeowners are sometimes able to claim the interest payments on several loan products—including some used to finance a residential PV systems—as a tax deduction (e.g., home equity loan). These deductions would provide an even larger economic return, thus lowering the cost of energy.10
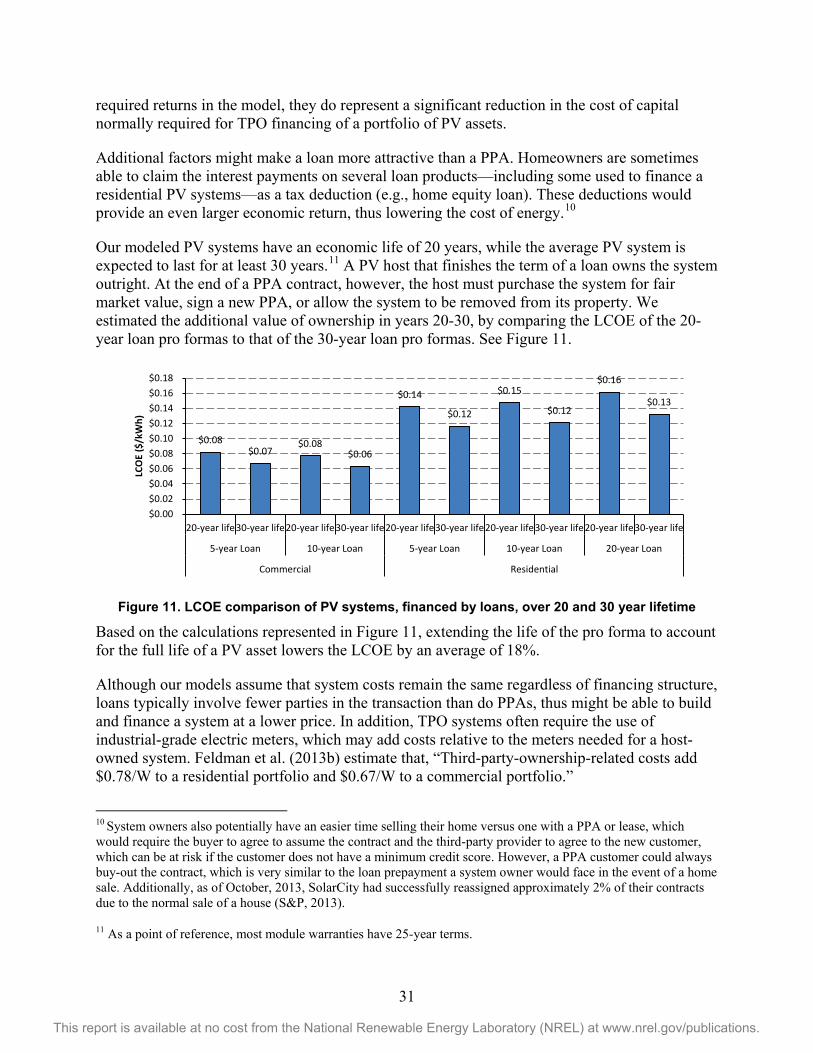
Our modeled PV systems have an economic life of 20 years, while the average PV system is expected to last for at least 30 years.11 A PV host that finishes the term of a loan owns the system outright. At the end of a PPA contract, however, the host must purchase the system for fair market value, sign a new PPA, or allow the system to be removed from its property. We estimated the additional value of ownership in years 20-30, by comparing the LCOE of the 20-year loan pro formas to that of the 30-year loan pro formas. See Figure 11.
Figure 11. LCOE comparison of PV systems, financed by loans, over 20 and 30 year lifetime
Based on the calculations represented in Figure 11, extending the life of the pro forma to account for the full life of a PV asset lowers the LCOE by an average of 18%.
Although our models assume that system costs remain the same regardless of financing structure, loans typically involve fewer parties in the transaction than do PPAs, thus might be able to build and finance a system at a lower price. In addition, TPO systems often require the use of industrial-grade electric meters, which may add costs relative to the meters needed for a host-owned system. Feldman et al. (2013b) estimate that, “Third-party-ownership-related costs add $0.78/W to a residential portfolio and $0.67/W to a commercial portfolio.”
10 System owners also potentially have an easier time selling their home versus one with a PPA or lease, which would require the buyer to agree to assume the contract and the third-party provider to agree to the new customer, which can be at risk if the customer does not have a minimum credit score. However, a PPA customer could always buy-out the contract, which is very similar to the loan prepayment a system owner would face in the event of a home sale. Additionally, as of October, 2013, SolarCity had successfully reassigned approximately 2% of their contracts due to the normal sale of a house (S&P, 2013).
11 As a point of reference, most module warranties have 25-year terms.
$0.08 $0.07
$0.08 $0.06
$0.14
$0.12
$0.15
$0.12
$0.16
$0.13
$0.00$0.02$0.04$0.06$0.08$0.10$0.12$0.14$0.16$0.18
20-year life30-year life20-year life30-year life20-year life30-year life20-year life30-year life20-year life30-year life
5-year Loan 10-year Loan 5-year Loan 10-year Loan 20-year Loan
Commercial Residential
LCO
E ($
/kW
h)
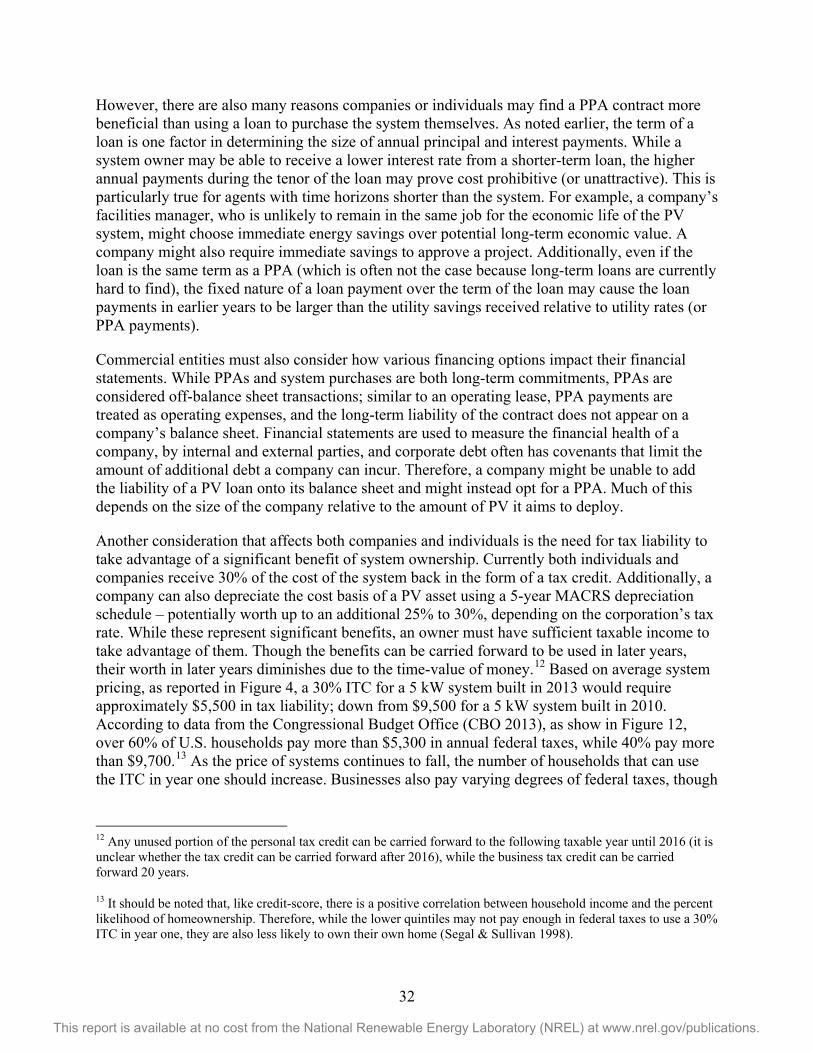
32
This report is available at no cost from the National Renewable Energy Laboratory (NREL) at www.nrel.gov/publications.
However, there are also many reasons companies or individuals may find a PPA contract more beneficial than using a loan to purchase the system themselves. As noted earlier, the term of a loan is one factor in determining the size of annual principal and interest payments. While a system owner may be able to receive a lower interest rate from a shorter-term loan, the higher annual payments during the tenor of the loan may prove cost prohibitive (or unattractive). This is particularly true for agents with time horizons shorter than the system. For example, a company’s facilities manager, who is unlikely to remain in the same job for the economic life of the PV system, might choose immediate energy savings over potential long-term economic value. A company might also require immediate savings to approve a project. Additionally, even if the loan is the same term as a PPA (which is often not the case because long-term loans are currently hard to find), the fixed nature of a loan payment over the term of the loan may cause the loan payments in earlier years to be larger than the utility savings received relative to utility rates (or PPA payments).
Commercial entities must also consider how various financing options impact their financial statements. While PPAs and system purchases are both long-term commitments, PPAs are considered off-balance sheet transactions; similar to an operating lease, PPA payments are treated as operating expenses, and the long-term liability of the contract does not appear on a company’s balance sheet. Financial statements are used to measure the financial health of a company, by internal and external parties, and corporate debt often has covenants that limit the amount of additional debt a company can incur. Therefore, a company might be unable to add the liability of a PV loan onto its balance sheet and might instead opt for a PPA. Much of this depends on the size of the company relative to the amount of PV it aims to deploy.
Another consideration that affects both companies and individuals is the need for tax liability to take advantage of a significant benefit of system ownership. Currently both individuals and companies receive 30% of the cost of the system back in the form of a tax credit. Additionally, a company can also depreciate the cost basis of a PV asset using a 5-year MACRS depreciation schedule – potentially worth up to an additional 25% to 30%, depending on the corporation’s tax rate. While these represent significant benefits, an owner must have sufficient taxable income to take advantage of them. Though the benefits can be carried forward to be used in later years, their worth in later years diminishes due to the time-value of money.12 Based on average system pricing, as reported in Figure 4, a 30% ITC for a 5 kW system built in 2013 would require approximately $5,500 in tax liability; down from $9,500 for a 5 kW system built in 2010. According to data from the Congressional Budget Office (CBO 2013), as show in Figure 12, over 60% of U.S. households pay more than $5,300 in annual federal taxes, while 40% pay more than $9,700.13 As the price of systems continues to fall, the number of households that can use the ITC in year one should increase. Businesses also pay varying degrees of federal taxes, though
12 Any unused portion of the personal tax credit can be carried forward to the following taxable year until 2016 (it is unclear whether the tax credit can be carried forward after 2016), while the business tax credit can be carried forward 20 years.
13 It should be noted that, like credit-score, there is a positive correlation between household income and the percent likelihood of homeownership. Therefore, while the lower quintiles may not pay enough in federal taxes to use a 30% ITC in year one, they are also less likely to own their own home (Segal & Sullivan 1998).
33
This report is available at no cost from the National Renewable Energy Laboratory (NREL) at www.nrel.gov/publications.
the degree to which an individual business can use a credit largely dependents on business size, PV system size (e.g., 5 kW, 5 MW), and the business’ ability to adjust incurred income.
Figure 12. Average U.S. federal taxes incurred in 2010, by quintile
Source: CBO (2013)
Depreciation is also an important difference when considering residential PV system ownership versus a third-party PPA provider. While both are able to claim a 30% investment tax credit (under Section 48 for a business and Section 25D for a homeowner), a business is also able to expense the cost basis of PV asset, using the 5-year MACRS schedule, which can offer a benefit worth an additional 30% of the cost of a system. While the ability to depreciate an asset, particularly at such an accelerated schedule, is a significant advantage, the corresponding disadvantage a PPA provider has compared to a homeowner is that they must pay taxes on any income generated from a PPA; in contrast, the electricity savings a homeowner experiences from a PV asset are all after-tax (i.e., an individual cannot deduct the cost of her personal utility bill on her taxes). The net gain or loss between the benefits of depreciation and the additional taxes depends on several factors, including the discount-rate and tax rate of the potential third-party system owner, the discount rate of the homeowner, the price of the PPA, the avoided cost of electricity, and the price of the PV system.
Businesses or individuals that own PV and those that finance it through a PPA also face different risk and reward considerations. 14 To a business or individual with a PPA the only risk of unexpectedly lower PV generation is the additional cost of electricity that must be sourced from the utility. In contrast, a PV owner must pay for the system, including O&M, regardless of system performance unless there is a production guarantee. If state and/or local incentives are required to make a system economical, system owners may also be exposed to issues such as
14 The additional perceived risk in a loan could translate into a higher discount rate by the customer than with a TPO system (i.e., the customer will want a higher return for owning rather than leasing the system). A separate analysis was performed to look at the impact the change in customer’s discount rate had on the model. While there was an increase in LCOE, particularly for loans with shorter terms (due to the increased cash outlay by the customer of principal and interest payments), the higher discount rates did not change the analysis significantly. This is due to the fact that the loan is the primary source of financing host-owned projects in this analysis and therefore the yield of the loan has a much larger impact on the cost of energy than the cost of capital for the customer.
$427 $3,419 $8,013
$15,918
$61,216
$0
$10,000
$20,000
$30,000
$40,000
$50,000
$60,000
$70,000
Lowest QuintileSecond Quintile Middle Quintile Fourth Quintile HighestQuintile
Fede
ral T
axes
Pai
d ($
201
0)
U.S. Income Group, by Population
Avg. Federal Taxes Incurred, per Household
34
This report is available at no cost from the National Renewable Energy Laboratory (NREL) at www.nrel.gov/publications.
renewable energy credit (REC) price volatility and delays in disbursements from grant programs. Further, there is a risk of interconnection delays and lost production while waiting for the utility to approve the system’s operation.15
A system owner might also incur unforeseen O&M costs. For example, inverters do not typically have warranties for the full life of a PV system (which is why our model assumes an inverter replacement in year 10). While a system with a PPA may similarly require an inverter replacement in year 10, this cost is built into the PPA price. A system owner, on the other hand, must pay all O&M costs and so, in any given year, might incur costs higher than would have been incurred using a PPA.
Some loan programs currently on the market feature quality assurance components, which could mitigate some of the more significant O&M risks. For example, the solar finance company Mosaic and the inverter manufacturer Enphase have recently partnered to create a loan program in which Mosaic serves as the originator and initial loan holder, and Enphase provides O&M services over the 20-year life of the loan. The cost of this service is built into the principal amount, which gets amortized over the loan term. Another solar loan originator, Sungage, currently requires its installers to make production guarantees, so that system owners can have a reasonable expectation of system functionality through the loan term. While this is not a full O&M service, it does ensure some form of quality assurance, which could reduce the incident of defaults across Sungage’s loan pool (assuming installers remain in business to honor the guarantees).
Many of these risks of PV ownership are small (such as system under production) can be hedged against (for example, by selling long-term REC contracts), or can be borne by another party (for example, by requiring a production guarantee from the installer or delaying payment for the system until receipt of state rebates and interconnection). Regardless, customers likely must educate themselves about PV risks and benefits more when they are buying a system than when they are entering into a PPA or other TPO contract.
15 There is also a risk of a change in rate structures, such as net metering. However this is mostly a risk that the holder of a PPA and a system owner share.
35
This report is available at no cost from the National Renewable Energy Laboratory (NREL) at www.nrel.gov/publications.
5 Conclusion In June of 2014, GTM Research released its second update on the residential solar financing landscape. The report predicted that the TPO market, which has been a large driver of residential PV deployment for the last several years, would peak in 2014 and gradually cede share to loans and alternative forms of financing (such as PACE) thereafter (Litvak 2014).
While the actual competitiveness of the loan option in solar finance will be determined by the offerings in the market, this report attempts to provide a framework for understanding how loan structures could affect the ultimate cost to distributed PV consumers. Solar loans have the potential to provide an economical option (from an LCOE perspective) for homeowners and businesses to finance the purchase of a solar system, retaining the benefits of ownership that TPO systems cannot provide while avoiding the large upfront cost of a PV system. According to the analysis, solar loans at 5-, 10-, and 20-year maturities delivered a lower LCOE than a 20-year TPO PPA, representing a reduction of 19% to 47%. Both loans and TPO were found to generate electricity at a rate lower than the blended rate for SDG&E’s second and third tiers of residential rates.
It is important to emphasize that while solar loans may result in a lower cost of generation to the consumer, thus reducing the lifetime costs associated with the system, the monthly payments on a loan may not necessarily reflect these favorable economics. Depending on the interest rate, the principal and the tenor of the loan, monthly P&I could be higher than the system owner would pay under both a TPO arrangement and the utility rate. However, the faster the loan is paid down, the more “free” electricity the host will enjoy post-financing, offsetting utility bills at no additional cost for the remaining useful life of the system. This becomes something of an optimization exercise for consumers deciding on a financing option, who may weigh their ability to make possibly higher monthly payments against the ultimate savings a loan could provide over the system lifetime. From a qualitative survey of the solar-specific loan options available in the market or in the planning phase as of this writing, NREL has determined that most products fall into the range of 5 to 20 year maturities. Of note, SolarCity has recently announced that it intends to roll out a 30-year product (Wesoff 2014), which would match typical mortgage maturities and could reduce monthly payments to a level highly competitive with or lower than utility rates in markets with lower power prices.
There are other factors, beyond loan tenor, that may impact the economics of a solar loan and TPO: the hosts’ requirement for a tax liability to take advantage of the federal tax incentives; the additional liability and maintenance costs associated with ownership; the complications of adding assets and liabilities onto one’s balance sheet (as opposed to a TPO transaction which is an off-balance sheet); and the economic time horizon of individual decision makers. Individual decision makers will have to determine how these risks and benefits compare with their own economic profile.
A broader range of loan financing options with flexible interest rates and maturities, coupled with deeper market penetration, could help reduce the financing costs associated with installing solar, and thus provide another trajectory for the achievement of the U.S. Department of Energy’s SunShot goals. Distributed solar continues to perform robustly in terms of both growth and its ability to attract investment; the wider availability of financing, the diversity of financing options, and the competitive rates at which to finance in this space, will all prove influential to the ultimate success of this market, both in the near term and post-ITC.
36
This report is available at no cost from the National Renewable Energy Laboratory (NREL) at www.nrel.gov/publications.
References Admirals Bank Home Improvement Lending. (2014). “Title I Secured & Unsecured Rate Matrix.” Effective Date January 1, 2014.
The American Banker’s Association (ABA). (2014). The Business of Banking: What Every Policy Maker Needs to Know. Accessed July 25, 2014: http://www.aba.com/Tools/Economic/Documents/Businessofbanking.pdf.
Arizona Goes Solar. (2014). Information collected from the utilities Arizona Public Service and Salt River Project. Accessed April 7, 2014: http://arizonagoessolar.org/UtilityIncentives/ArizonaPublicService.aspx; http://arizonagoessolar.org/UtilityIncentives/SaltRiverProject.aspx.
Bankrate. (2014). “Checking and Savings.” Accessed September 15, 2014: http://www.bankrate.com/checking.aspx.
Barbose, G.; Darghouth, N.; Wiser, R. (2011). Tracking the Sun IV: An Historical Summary of the Installed Cost of Photovoltaics in the United States from 1998 to 2010. Berkeley, CA: Lawrence Berkeley National Laboratory. Accessed September 2014: http://eetd.lbl.gov/ea/emp/reports/lbnl-5047e.pdf
Barbose, G. (2013). “State RPS Policies and Solar Energy Impacts, Experiences, Challenges, and Lessons Learned.” Lawrence Berkeley National Laboratory. SEIA Webinar, November 21, 2013. http://emp.lbl.gov/sites/all/files/seia-webinar-nov-2013.pdf
Bolinger, M. (2014). An Analysis of the Costs, Benefits, and Implications of Different Approaches to Capturing the Value of Renewable Energy Tax Incentives. Berkeley, CA: Lawrence Berkeley National Laboratory. Accessed September 2014: http://emp.lbl.gov/sites/all/files/lbnl-6610e.pdf
California Solar Initiative (CSI). (2014). “Current CSI Data.” Accessed April 4, 2014: www.californiasolarstatistics.ca.gov/current_data_files/.
Congress of the United States Congressional Budget Office (CBO). (2013). The Distribution of Household Income and Federal Taxes 2010.
Credit Suisse Research Institute. (2013). “Credit Suisse Global Investment Returns Yearbook 2013.”
Federal Reserve Economic Data (FRED). (2014). Economic Research Division. Federal Reserve Bank of St. Louis. http://research.stlouisfed.org/fred2
Desmarais, L. (2013). The Impact of Photovoltaic Systems on Market Value and Marketability: A Case Study of 30 Single-Family Homes in the North and Northwest Denver Metro Area. Denver, CO: Colorado Energy Office. Accessed September 3, 2014: http://www.colorado.gov/cs/Satellite?blobcol=urldata&blobheadername1=Content-Disposition&blobheadername2=Content-Type&blobheadervalue1=inline;+filename%3D%22PV_Case+Studies.pdf%22&blobheadervalue2=application/pdf&blobkey=id&blobtable=MungoBlobs&blobwhere=1251900073057&ssbinary=true.
37
This report is available at no cost from the National Renewable Energy Laboratory (NREL) at www.nrel.gov/publications.
FDIC (2012). FDIC Community Banking Study. Accessed January 6, 2014: https://www.fdic.gov/regulations/resources/cbi/study.html.
The United States Federal Reserve System (The Fed). (2014a). Holding Companies with Assets Greater Than $10 Billion. Accessed February 18, 2014: https://www.ffiec.gov/nicpubweb/nicweb/top50form.aspx.
The Fed. (2014b). Financial Accounts of the United States. Federal Reserve Statistical Release. Accessed June 10, 2014: http://www.federalreserve.gov/releases/z1/current/accessible/f6.htm.
Feldman D.; Barbose, G.; Margolis, R.; Darghouth, N.; James, T.; Weaver, S.; Goodrich, A.; Wiser. R. (2014a). Photovoltaic System Pricing Trends: Historical, Recent, and Near-Term Projections. 2014 Edition. NREL/PR-6A20-62558. Golden, CO: National Renewable Energy Laboratory.
Feldman D.; Friedman, B.; Margolis, R. (2013b). Financing, Overhead, and Profit: An In-Depth Discussion of Costs Associated with Third-Party Financing of Residential and Commercial Photovoltaic Systems. NREL/TP-6A20-60401. Golden, CO: National Renewable Energy Laboratory.
Federal Housing Finance Agency (FHFA). (July 6, 2010). FHFA Statement on Certain Energy Retrofit Loan Programs.
Gup, B. (2011). Banking and Financial Institutions: A Guide for Directors, Investors, and Borrowers. Hoboken, NJ: Wiley & Sons Ltd.
Heffernan, S. (2005). Modern Banking. West Sussex, England: Wiley & Sons Ltd.
Hoen, B.; Klise, G.; Graff-Zivin, J.; Thayer, M.; Seel, J.; Wiser, R. (2013). Exploring California PV Home Premiums. Berkeley, CA: Lawrence Berkeley National Laboratory. Accessed September 3, 2014: http://emp.lbl.gov/publications/exploring-california-pv-home-premiums.
Huynh, F. (February 3, 2014). “US Credit Quality Continues to Inch Forward.” FICO Banking Analytics Blog. http://bankinganalyticsblog.fico.com/2014/02/us-credit-quality-continues-to-inch-forward.html.
Jickling, M.; Murphy, E. (2010). Who Regulates Whom?An Overview of U.S. Financial Supervision. The Congressional Research Service. Accessed March 18, 2014: http://fas.org/sgp/crs/misc/R40249.pdf.
Lee, B.; Daniels, T.; Boril, B. (2014). “Sell-off provides a better entry point – Remain Attractive on Solar.” Goldman Sachs Equity Research.
Linder, S.; Lilinshtein, J.; Culver, N.; Di Capua, M.; Chase, J. (2014). H1 2014 US PV Market Outlook. Bloomberg New Energy Finance.
Litvak, N. (2014). U.S. Residential Solar Financing: 2014-2018. Boston, MA: GTM Research.
38
This report is available at no cost from the National Renewable Energy Laboratory (NREL) at www.nrel.gov/publications.
Lowder, T.; Mendelsohn, M. (2013). The Potential of Securitization in Solar PV Finance. NREL/TP-6A20-60230. Golden, CO: The National Renewable Energy Laboratory. Accessed July 31, 2014: http://www.nrel.gov/docs/fy14osti/60230.pdf
Martin, K. (February 2014). “Cost of Capital: 2014 Outlook.” Chadbourne & Parke Project Finance News: February 2014.
Massachusetts Department of Energy Resources (DOER). (2014). “RPS Solar Carve-Out Qualified Units.” Accessed March 26, 2014: http://www.mass.gov/eea/docs/doer/rps-aps/solar-carve-out-units.xlsx.
The National Credit Union Administration (NCUA). (2014a). “Credit Union and Bank Rates”. Accessed March 21, 2014: http://www.ncua.gov/DataApps/Pages/CUBNKMain.aspx.
NCUA. (2014b). “Credit Union Online.” Accessed March 21 2014: https://cuonline.ncua.gov/.
Newell, S.; Spees, K.; Pfeifenberger, J.; Mudge, R.; DeLucia, M.; Carlton, R. (2012). ERCOT Investment Incentives and Resource Adequacy. The Brattle Group.
Peterson, L. (2012). “Primary Tax Equity Finance Structures Common to the U.S. Domestic Solar Energy Industry: June 2012.” Reznick Group.
Pomerleau, K.; Borean, R. (2014). “How High are Capital Gains Tax Rates in Your State?” Tax Foundation. http://taxfoundation.org/blog/how-high-are-capital-gains-tax-rates-your-state
San Diego Gas & Electric (SDG&E). (2014). “Total Residential Electric Rates.” Accessed July 23, 2014: http://www.sdge.com/total-residential-electric-rates
Segal, L. M.; Sullivan, D.G. (1998). “Trends in Homeownership: Race, Demographics, and Income.” Economic Perspectives Federal Reserve Bank of Chicago (22); pp. 53-72.
Shah, V.; Booream-Phelps, J.; Min, S. (2013). “Distributed Generation to Herald New US Growth Era.” Deutsche Bank Market Research.
Solar Energy Industry Association (SEIA) and GTM Research. (2014a). U.S. Solar Market Insight Report: 2013 Year-In-Review. Washington, D.C.: Solar Energy Industry Association.
SEIA and GTM Research. (2014b). U.S. Solar Market Insight Report: Q2 2014. Washington, D.C.: Solar Energy Industry Association.
Standard & Poor’s Ratings Services (S&P). (2013). “SolarCity LMC Series I LLC (Series 2013-1).”
U.S Department of Energy (DOE). (2012). SunShot Vision Study. DOE/GO-102012-3037. Washington, DC: U.S. Department of Energy. Accessed April 2014: http://www1.eere.energy.gov/solar/pdfs/47927.pdf
39
This report is available at no cost from the National Renewable Energy Laboratory (NREL) at www.nrel.gov/publications.
Wade, W. (2014). “Rooftop Solar Leases Scaring Buyers When Homeowners Sell.” Bloomberg. Accessed June 25, 2014: http://www.bloomberg.com/news/2014-06-23/rooftop-solar-leases-scaring-buyers-when-homeowners-sell.html.
Wesoff, E. (2014). SolarCity Quietly Moving to Loans and Customer-Owned Solar. Greentech Media. Accessed August 1, 2014: http://www.greentechmedia.com/articles/read/SolarCity-Quietly-Moving-to-Loans-and-Customer-Owned-Solar.
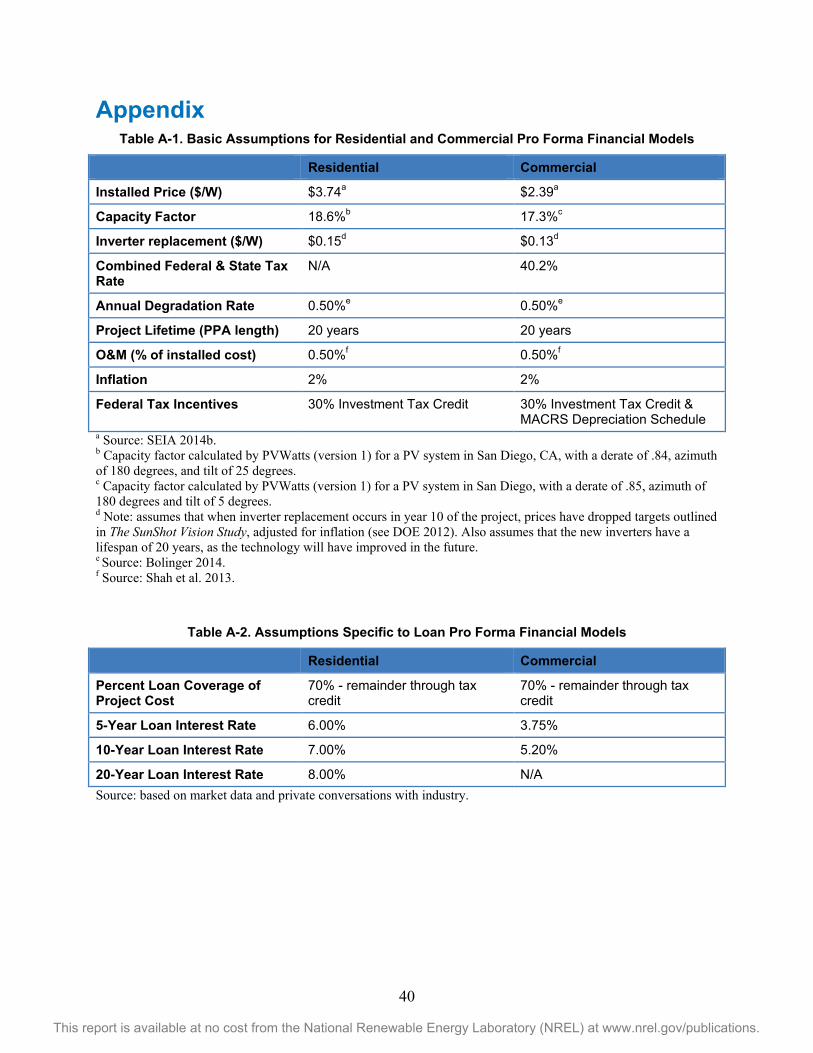
40
This report is available at no cost from the National Renewable Energy Laboratory (NREL) at www.nrel.gov/publications.
Appendix Table A-1. Basic Assumptions for Residential and Commercial Pro Forma Financial Models
Residential Commercial
Installed Price ($/W) $3.74a $2.39a
Capacity Factor 18.6%b 17.3%c
Inverter replacement ($/W) $0.15d $0.13d
Combined Federal & State Tax Rate
N/A 40.2%
Annual Degradation Rate 0.50%e 0.50%e
Project Lifetime (PPA length) 20 years 20 years
O&M (% of installed cost) 0.50%f 0.50%f
Inflation 2% 2%
Federal Tax Incentives 30% Investment Tax Credit 30% Investment Tax Credit & MACRS Depreciation Schedule
a Source: SEIA 2014b. b Capacity factor calculated by PVWatts (version 1) for a PV system in San Diego, CA, with a derate of .84, azimuth of 180 degrees, and tilt of 25 degrees. c Capacity factor calculated by PVWatts (version 1) for a PV system in San Diego, with a derate of .85, azimuth of 180 degrees and tilt of 5 degrees. d Note: assumes that when inverter replacement occurs in year 10 of the project, prices have dropped targets outlined in The SunShot Vision Study, adjusted for inflation (see DOE 2012). Also assumes that the new inverters have a lifespan of 20 years, as the technology will have improved in the future. e Source: Bolinger 2014. f Source: Shah et al. 2013.
Table A-2. Assumptions Specific to Loan Pro Forma Financial Models
Residential Commercial
Percent Loan Coverage of Project Cost
70% - remainder through tax credit
70% - remainder through tax credit
5-Year Loan Interest Rate 6.00% 3.75%
10-Year Loan Interest Rate 7.00% 5.20%
20-Year Loan Interest Rate 8.00% N/A Source: based on market data and private conversations with industry.
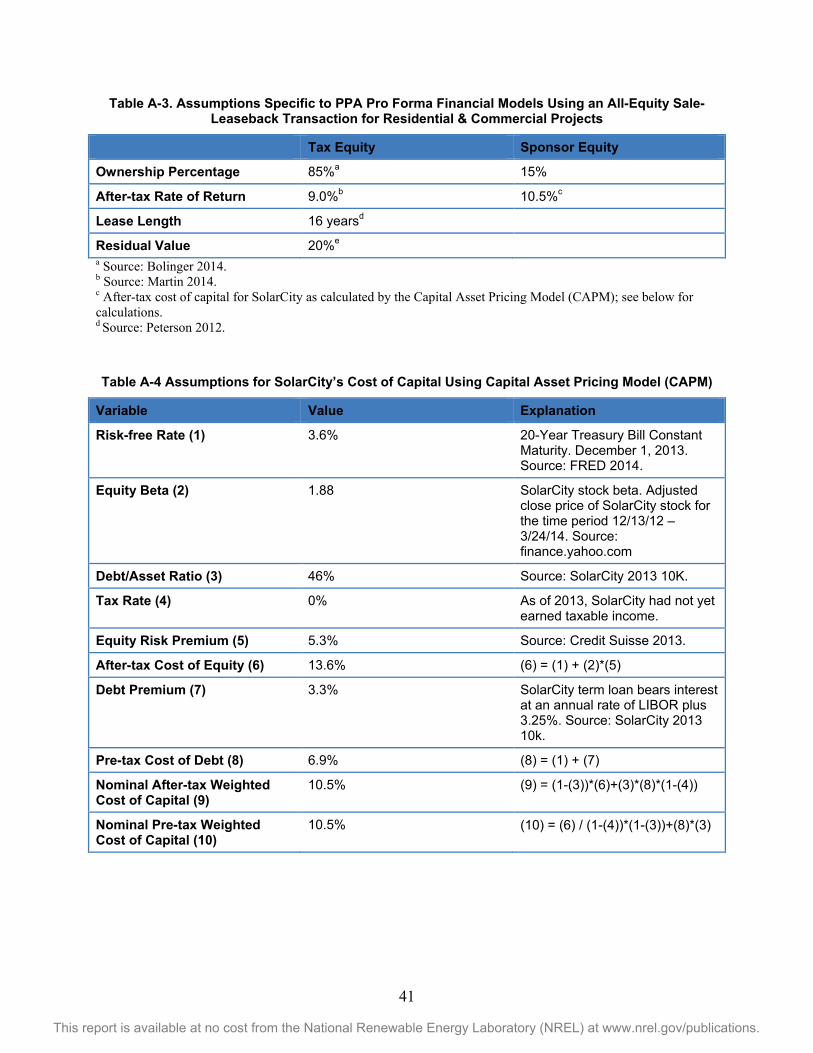
41
This report is available at no cost from the National Renewable Energy Laboratory (NREL) at www.nrel.gov/publications.
Table A-3. Assumptions Specific to PPA Pro Forma Financial Models Using an All-Equity Sale-Leaseback Transaction for Residential & Commercial Projects
Tax Equity Sponsor Equity
Ownership Percentage 85%a 15%
After-tax Rate of Return 9.0%b 10.5%c
Lease Length 16 yearsd
Residual Value 20%e a Source: Bolinger 2014. b Source: Martin 2014. c After-tax cost of capital for SolarCity as calculated by the Capital Asset Pricing Model (CAPM); see below for calculations. d Source: Peterson 2012.
Table A-4 Assumptions for SolarCity’s Cost of Capital Using Capital Asset Pricing Model (CAPM)
Variable Value Explanation
Risk-free Rate (1) 3.6% 20-Year Treasury Bill Constant Maturity. December 1, 2013. Source: FRED 2014.
Equity Beta (2) 1.88 SolarCity stock beta. Adjusted close price of SolarCity stock for the time period 12/13/12 – 3/24/14. Source: finance.yahoo.com
Debt/Asset Ratio (3) 46% Source: SolarCity 2013 10K.
Tax Rate (4) 0% As of 2013, SolarCity had not yet earned taxable income.
Equity Risk Premium (5) 5.3% Source: Credit Suisse 2013.
After-tax Cost of Equity (6) 13.6% (6) = (1) + (2)*(5)
Debt Premium (7) 3.3% SolarCity term loan bears interest at an annual rate of LIBOR plus 3.25%. Source: SolarCity 2013 10k.
Pre-tax Cost of Debt (8) 6.9% (8) = (1) + (7)
Nominal After-tax Weighted Cost of Capital (9)
10.5% (9) = (1-(3))*(6)+(3)*(8)*(1-(4))
Nominal Pre-tax Weighted Cost of Capital (10)
10.5% (10) = (6) / (1-(4))*(1-(3))+(8)*(3)
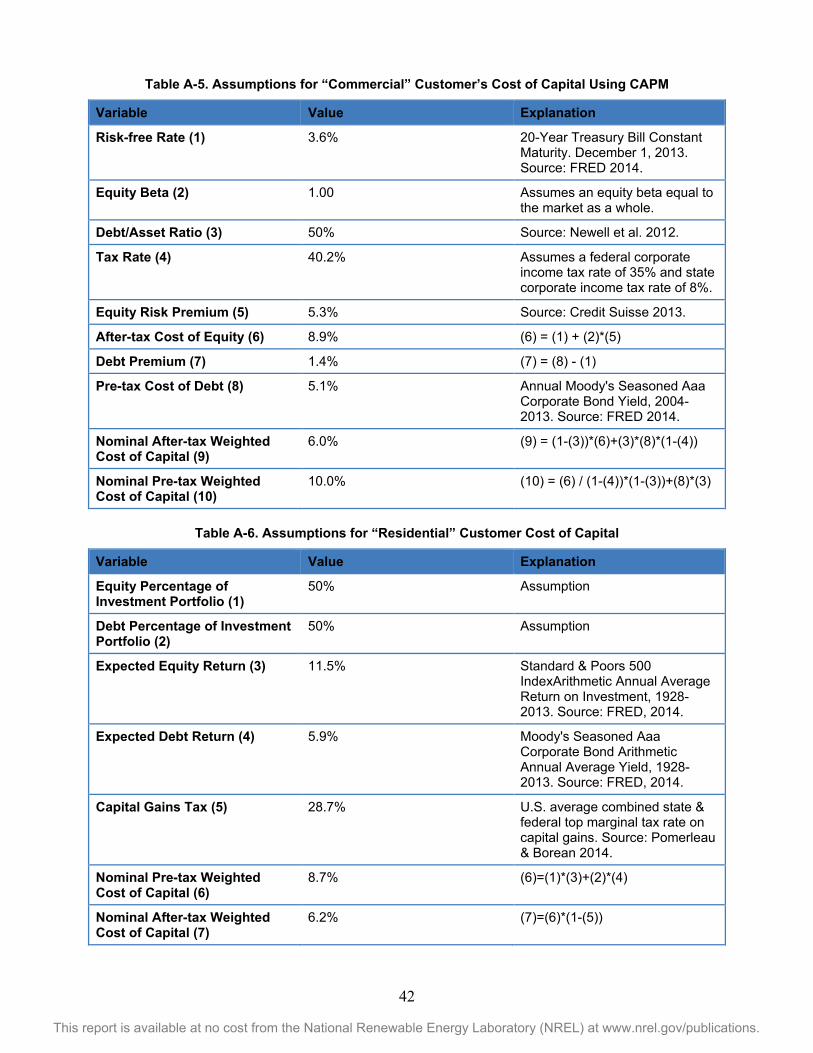
42
This report is available at no cost from the National Renewable Energy Laboratory (NREL) at www.nrel.gov/publications.
Table A-5. Assumptions for “Commercial” Customer’s Cost of Capital Using CAPM
Variable Value Explanation
Risk-free Rate (1) 3.6% 20-Year Treasury Bill Constant Maturity. December 1, 2013. Source: FRED 2014.
Equity Beta (2) 1.00 Assumes an equity beta equal to the market as a whole.
Debt/Asset Ratio (3) 50% Source: Newell et al. 2012.
Tax Rate (4) 40.2% Assumes a federal corporate income tax rate of 35% and state corporate income tax rate of 8%.
Equity Risk Premium (5) 5.3% Source: Credit Suisse 2013.
After-tax Cost of Equity (6) 8.9% (6) = (1) + (2)*(5)
Debt Premium (7) 1.4% (7) = (8) - (1)
Pre-tax Cost of Debt (8) 5.1% Annual Moody's Seasoned Aaa Corporate Bond Yield, 2004-2013. Source: FRED 2014.
Nominal After-tax Weighted Cost of Capital (9)
6.0% (9) = (1-(3))*(6)+(3)*(8)*(1-(4))
Nominal Pre-tax Weighted Cost of Capital (10)
10.0% (10) = (6) / (1-(4))*(1-(3))+(8)*(3)
Table A-6. Assumptions for “Residential” Customer Cost of Capital
Variable Value Explanation
Equity Percentage of Investment Portfolio (1)
50% Assumption
Debt Percentage of Investment Portfolio (2)
50% Assumption
Expected Equity Return (3) 11.5% Standard & Poors 500 IndexArithmetic Annual Average Return on Investment, 1928-2013. Source: FRED, 2014.
Expected Debt Return (4) 5.9% Moody's Seasoned Aaa Corporate Bond Arithmetic Annual Average Yield, 1928-2013. Source: FRED, 2014.
Capital Gains Tax (5) 28.7% U.S. average combined state & federal top marginal tax rate on capital gains. Source: Pomerleau & Borean 2014.
Nominal Pre-tax Weighted Cost of Capital (6)
8.7% (6)=(1)*(3)+(2)*(4)
Nominal After-tax Weighted Cost of Capital (7)
6.2% (7)=(6)*(1-(5))