Embed Size (px)
Citation preview
72
Business Systems Research Vol. 6 No. 1 / March 2015
Banking Competition and Efficiency:
Empirical Analysis on the Bosnia and
Herzegovina Using Panzar-Rosse Model
Deni Memić University Sarajevo School of Science Technology, Faculty of Economics, Bosnia and
Herzegovina
Abstract
Background: Competition in the banking industry has been an important topic in the
scientific literature as researchers tried to assess the level of competition in the
banking sector. Objectives: This paper has an aim to investigate the market structure
and a long term equilibrium of the banking market in Bosnia and Herzegovina
nationwide as well as on its constitutional entities as well as to evaluate the
monopoly power of banks during the years 2008-2012. Methods/Approach: The
paper is examining the market structure using the most frequently applied measures
of concentration k-bank concentration ratio (CRk) and Herfindahl-Hirschman Index
(HHI) as well as evaluating the monopoly power of banks by employing Panzar-Rosse
“H-statistic”. Results: The empirical results using CRk and HHI show that Bosnia and
Herzegovina banking market has a moderately concentrated market with a
concentration decreasing trend. The Panzar-Rosse “H-statistic” suggests that banks in
Bosnia and Herzegovina operate under monopoly or monopolistic competition
depending on the market segment. Conclusions: Banks operating on the banking
market in Bosnia and Herzegovina seem to be earning their total and interest
revenues under monopoly or perfectly collusive oligopoly.
Keywords: Bosnia and Herzegovina; Herfindahl-Hirschman Index; Panzar-Rosse
model; Banking; Market system; Monopolies; Competitive strategy
JEL classification: G21, D40, D50, L11
Paper type: Research article
Received: 26th July, 2014
Accepted: 15th February, 2015
Citation: Memić, D. (2015). “Banking Competition and Efficiency: Empirical Analysis
on the Bosnia and Herzegovina Banking Industry Using Panzar-Rosse Model”, Business
Systems Research, Vol. 6, No.1, pp. 72-92.
DOI: 10.1515/bsrj-2015-0005
Introduction Banks have an ultimate goal to create loans enhancing the financial flows in the
economy generated from the collected deposit base. Having the role of the
financial intermediation the financial system should by definition enhance efficiency
and competitiveness on the financial market.

73
Business Systems Research Vol. 6 No. 1 / March 2015
The wealth and the profitability of banks’ customers is highly affected by the
competition on the banking sector through the tendency of lowering the products
and service costs (Ritter, Silber, Udell, 2014).
Competition has been in the scientific and practical focus in the past decades,
not only in the banking but also in other business industries around the world. Most of
the previous research focuses on the competitive behaviour in one or several
countries, using the respective baking industry data sets (Abdul Majid & Sufian, 2007,
Al-Muharrami, 2009a, Al-Muharrami 2009b, Anzoategui, Martinez, & Rocha, 2012,
Bikker & Groeneveld, 1998, Coccorese, 2013, Hondroyiannis & Papapetrou, 1999).
Even though the existing literature does not unfold a unique approach towards the
problem of competition on different banking markets, several approaches are
common to most of the research. Bikker and Haaf (2002) note that the existing
literature on measurement of competition can be divided into two major groups (a)
Structure-Conduct-Performance (SCP) paradigm and the efficiency hypothesis (EH)
paradigm on one side and (b) a number of formal approaches with roots in Industrial
Organization theory.
The SCP methodology analyses if a highly concentrated market leads to collusive
behaviour with larger banks which leads to their superior market performance. The
efficiency hypothesis here tests whether it is the efficiency of larger banks that
enables their superior market performance. The SCP paradigm relates the
profitability to the market structure, using the number of banks/companies as
exogenous variables in regressions of industrial profitability. The paradigm was
criticized due to the theoretical possibility in which an industry has no entry and exit
barriers which enables high level of competition in a highly concentrated market
(Arrawatia & Misra, 2012). One of the most commonly used measures for
competition based on the structural approach is the Herfindahl-Hirschman index
(Rhodes, 1993).
On the other side the non-structural models of competitive behavior have
emerged such as Iwata model, the Bresnahan model, and the Panzar-Rosse (P-R)
model (Panzar & Rosse, 1982, 1987).
In recent years, significant number of research was focused on competition in the
banking industry due to the fact that tendencies for liberalization, innovations and
merger and consolidation of financial services sector have called for assessing the
level of competition in the banking sector (Arrawatia & Misra, 2012). Higher level of
bank competition is expected to have a decreasing effect of bank product and
service prices, which by theory lead to accelerated investments and economy
growth. There are also potential negative effects of the increasing banking
competition in the form of the increased risk appetite which may lead to decreasing
profitability and efficiency (Mishkin, 2013).
The main purpose of this paper is to investigate the market structure of banking
market in Bosnia and Herzegovina and to evaluate the monopoly power of banks
operating in the Bosnian market during the period 2008-2012. Ever since the recent
war, Bosnian banking market has undergone structural reforms which include
privatization, modernization, financial integration, foreign capital inflow and the
challenging effects of the global financial crisis.
This paper has a primary goal to measure the degree of competition in Bosnia
and Herzegovina banking market as well as to investigate the possible impact of the
market concentration on competition. The paper also focuses on the comparison of
the Bosnian banking market with other banking markets, with regards to the levels of
concentration and competition.
74
Business Systems Research Vol. 6 No. 1 / March 2015
Unlike in the European Union where the Economic and Monetary Union (EMU) has
generally influenced a significant change of the financial framework, the Bosnian
banking market is still to be considered as highly underdeveloped, despite of the
fact that majority of the market share is held by the banks in the foreign (mainly EU
banks) ownership.
Most of the reviewed literature focuses on the concentration and competition
measurement using the Panzar-Rosse model (Panzar & Rosse, 1982, 1987). This paper
fills the gap in the literature by extending the geographical boundaries of the
structural approach and Panzar-Rosse model application on assessing the
competition and efficiency on the banking market in Bosnia and Herzegovina, since
to our knowledge no similar research using data from Bosnia and Herzegovina has
been conducted, with an exception to the study of performance analysis and
benchmarking of commercial Banks from Bosnia and Herzegovina (Memić & Škaljić-
Memić, 2013).
The organization of the paper is as follows. Section 2 presents the reviewed
literature on the banking competition and efficiency. Section 3 presents the used
methodology and data while Section 4 shows the results. Section 5 summarizes the
paper with the concluding remark.
Literature review The first use of the Panzar-Rosse H-statistic was conducted on the newspaper
industry.
Several studies have measured the degree of competition and tested the market
for equilibrium using structural and non-structural methods. One study used a panel
data set covering the period from 1986 – 2004 using data from 67 different countries
(Bikker, Shaffer, & Spierdijk, 2009). The study has shown that Panzar-Rose price or
revenue functions cannot be used to measure the degree of banking competition,
as the authors concluded that the Panzar-Rosse H-statistic needs requires more
information costs, market equilibrium and market demand elasticity.
De Rozas (2007) used data reported by Spanish depositary institutions covering
the period from 1986 – 2005. The study uses 92% of aggregate assets of credit
institutions sector, which is fairly representative and comprehensive. Author used the
Panzar-Rosse methodology and has shown that the level of competition is higher
than reported in the previous literature. Author has also reported that on the Spanish
sample in case of large banks the market gets close to perfect competition, and no
apparent relationship between competition and market is found.
Italian banking system has also been analysed using data from the period 1988-
2000 with the final data set including 104 observations (Coccorese, 2002). The study
uses non-linear simultaneous-equation model with an ultimate goal to identify the
degree of competitiveness characterizing eight Italian largest banks. The study shows
that the degree of competition on the Italian market is considerable and that there
is no conflict between competition and concentration.
One paper evaluated the degree of competition among Italian banks between
the period 1986-1996, also employing the Panzar-Rosse H-statistic (Coccorese, 2013).
All of the used banks were classified into of the three groups on the basis of their
respective size. The study uses total revenues as the dependent variable, as the
models were created for each of the observed years. The results have shown that
the model coefficients for the factor prices always positive and statistically
significant. The main conclusion of the study is that the Italian banks have operated
under the monopolistic competition in the period 1988-1996, and that the banks
have been in the long-run equilibrium in only four of the observed years.
75
Business Systems Research Vol. 6 No. 1 / March 2015
Carbó, Humphrey, Maudos, & Molyneux (2009) used banking market data from 14
European countries over the period 1995-2001, to assess the competition and pricing
power in European banking. Among other indicators four indicators they used net
interest margin, Lerner index, returns on assets, Panzar-Rosse H-statistic, and HHI
market concentration, and have shown that competition often gives conflicting
predictions of competitive behavior across and within countries.
Another study assessed the degree of competitiveness in the banking industry of
the EU in total as well as the degree of competitiveness in individual countries (Bikker
& Groeneveld, 1998). The data panel used in this study covers the period 1989- 1996
and have shown that mainly large banks play a greater role in the financial
intermediation process. Their results suggest that national banking sectors in the EU
are not identical.
Bikker & Haaf (2000) applied the Panzar-Rosse model to banks from 23 European
and non-European countries for the years 1988-1998. They have reported that
banking markets in the industrial world are mainly operating under monopolistic
competition. They also find that competition and bank size are proportional and that
in some countries the competition has increased significantly over time.
Maudos & Solís, (2009) have analysed the 43 commercial banks operating in
Mexico over the period 1993-2005. The study uses net interest margin as the
dependent variable and shows that it can be explained by average operating costs
and by market power. The results show that net interest margin is mainly determined
by average operating costs and the Lerner index (Maudos & Solís, 2009).
Al-Muharrami (2009) analysed the market structure of the banking market of Saudi
Arabia using data during the period 1993-2006. The Panzar-Rosse methodology
results show that Saudi Arabia banking industry has a status of a monopolistic
competition, and that the market is not highly concentrated as well as that it shows
signs of concentration decline.
Greece banking market competition and concentration has also been assessed is
several studies. Delis, Staikouras, & Varlagas (2008) analyzed panel data of Greek
banks over the period 1993-2004 and found that the static models used tend to
underestimate the level of market power.
Number of other studies has used the Panzar-Rosse method to measure the
degree of competition in the banking sector. Pruteanu-Podpiera, Weill, & Schobert
(2008) analyzed the Czech Banking Industry, Nathan & Neave (1989) banks in
Canada, Anzoategui, Martinez, & Rocha (2010) applied similar methodology to the
Middle East and Northern Africa Region, Mamatzakis, Staikouras, & Koutsomanoli-
Fillipaki (2005) analysed the degree of concentration and competition in the
enlarged European Union banking environment over the period 1998–2002, Liu,
Molyneux, & Wilson (2013) measured competition and stability in 11 European
countries over the period 2000-2008, Matthews, Murinde, & Zhao (2007) reported an
empirical assessment of competitive conditions among the major British banks,
during a period of major structural change and found a monopolistic competition,
Yildirim & Philippatos (2007) used the data from eleven Latin American countries for
the period 1993 to 2000 to find that banks appear to be earning their revenues under
monopolistic competition, which was proven in many other developed and
emerging financial systems.
To our knowledge, this is the first research conducted with the aim of measuring
competition and efficiency of banks in Bosnia and Herzegovina using the Panzar-
Rosse and HHI methodology. The significance of the research is that it offers an
insight into the Bosnian banking market from the competition and efficiency
76
Business Systems Research Vol. 6 No. 1 / March 2015
perspective, which can be usefully in the desired country’s economic integration
into the European Union and its developed financial markets.
Methodology Structural approach: CRk and HHI indexes
The structural approach to the measurement of competition from the SCP
methodology has the goal to investigate whether a highly concentrated banking
market can create an environment in which larger banks behave in a monopolistic
direction. Such a behaviour usually causes collusive behaviour among banks which
leads to an incensement of their profits. The SCP paradigm assumes that a higher
bank concentration allows a higher degree of cooperation between them such that
the banks might set higher prices and consequently gain substantial profits (Bain,
1956).
The EH paradigm suggests that market structure is determined by the efficiency
whereas profits are generated by large firms since the concentration is highly
dependent on efficiency. Both the SCP and EH approaches use the same measures
of concentrations. These measures of concentrations are k-bank concentration ratio
(CRk) and Herfindahl- Herschman Index (HHI).
The Concentration ratio (CRk) shows the level of concentration within an observed
industry, measured by the market share held by the substantially small number of
firms (banks). CR takes the following form:
𝐶𝑅𝑘 = ∑ 𝑀𝑆𝑖 =
𝑛
𝑖=1
∑𝑖
𝑛
𝑛
𝑖=1
(1)
Whereas 𝑀𝑆𝑖 represents the individual market shares of banks on the market. The
market shares are usually calculated as the ratio of individual bank's assets to total
industry assets. As there are no preset rules for an appropriate value of k, the total
number of banks included in the analysis is usually an arbitrary decision (Tushaj ,
2010), depending from the goal of the research and the size of the analyzed market.
In the existing literature the value of k is most commonly a combination of numbers 3,
5, 8, 10. The CR index may be considered as the concentration curve which ranges
from zero to one, whereas the value of zero represents an infinite number of equally
sized banks, while the value of one represents the situation in which the k banks
create the total industry.
The Herfindahl-Hirschman Index (HHI) is a statistical measure of a market
concentration developed by the economists A.O. Hirschman and O.C. Herfindahl.
HHI measure has reached a significant level of use ever since it was adopted by the
Department of Justice of the Federal Reserve where it was used to measure the
effects of mergers on competitiveness. This measure takes into consideration the
number of firms (banks) by calculating their respective relative market shares
(Rhoades, 1993). HHI is calculated as the sum of squares of market shares (𝑀𝑆𝑖)of all
individual banks (i=1,…n) taking participation on the analyzed market. This measure
does not however take into consideration the geographic dimension of the bank
concentration on one market and has been detected as relatively poor and
unreliable measure of competition (Bikker et al., 2009; Shaffer, 1993; Shaffer and
DiSalvo, 1994). HHI has the following form:
77
Business Systems Research Vol. 6 No. 1 / March 2015
𝐻𝐻𝐼 = ∑ 𝑀𝑆𝑖2
𝑛
𝑖=1
(2)
The HHI index ranges between 1 𝑛⁄ and 1 and it can take the value of 1 𝑛⁄ when all
banks in a market have an equal size. The other extreme value of 1 HHI index
reaches in the case of monopoly.
Nonstrucutural approach: Panzar-Rosse model The weaknesses expressed by the structural or SCP and EH approaches are overrun
by the new empirical industrial organization (NEIO). NEIO analyses the deviations
between observed and marginal cost pricing, without using market structure
indictors in order to assess the market concentration and competition (Al-Muharrami
et al, 2006). These methods create models of industry equilibrium with the final
outcome such that indicates the type of competitive conduct and estimates the
reduced form revenue equations of the market participants. Such model is
suggested by Panzar-Rosse (1987). John C. Panzar and James N. Rosse developed
an empirical test which discriminates between different competitiveness market
structures such as oligopoly, monopolistically competitive and perfectly competitive
markets. Panzar-Rosse model (P-R model) creates a reduced-form equation (R^*)
that relates specific indicators of bank revenues to a set to vector of input prices as
well as other variables. The model produces an indicator of competition called H-
statistic, which is calculated as the sum of elasticises of gross revenue with respect to
given input process (Bikker et al., 2009).
The P-R model is based on the general equilibrium market model and assumes
that banks will use different pricing strategies as a response to changes to their input
prices, heavily depending on the competitive environment of the market (Rozas &
Luis, 2007).
The reduced form revenue equations (R*) of the market participants are derived
from marginal revenue and cost functions and an equilibrium position which
assumes zero profit. The zero profit condition is expressed as follows:
𝑅𝑖(𝑦𝑖∗, 𝑍𝑖
𝑅) = 𝐶𝑖(𝑦𝑖∗, 𝑊𝑖 , 𝑍𝑖
𝐶) (3)
where 𝑅𝑖(−) and 𝐶𝑖(−) represent the revenue and cost functions for bank 𝑖, 𝑦𝑖
represents the output of the bank, 𝑊𝑖 represents the K-dimensional vector of factor
input prices bank 𝑖, 𝑊𝑖 = (𝑤1𝑖, … , 𝑤𝐾𝑖), 𝑍𝑖𝑅 represents the vector of J exogenous
variables affecting the revenue function 𝑍𝑖𝑅 = (𝑍1𝑖
𝑅 , … , 𝑍𝐽𝑖𝑅) and 𝑍𝑖
𝐶 represents the
vector of L exogenous variables affecting the cost function 𝑍𝑖𝑅 = (𝑍1𝑖
𝐶 , … , 𝑍𝐽𝑖𝐶 ).
Observing at individual bank level marginal revenues must be equal to marginal
costs, as follows:
𝑅𝑖′ (𝑦𝑖
∗, 𝑍𝑖𝑅) = 𝐶𝑖
′(𝑦𝑖∗, 𝑊𝑖 , 𝑍𝑖
𝐶) (4)
Therefore the indicator given by the P-R model as elasticities of total revenues of
an individual bank are calculated by the bank’s input prices (). The sum of such
elasticities is called H-statistic, which gives information about the competitive
situation on the market, and is given as follows:
78
Business Systems Research Vol. 6 No. 1 / March 2015
𝐻 = ∑ (𝜕𝑅𝑖
∗
𝜕𝑤𝑘𝑖𝑋
𝑤𝑘𝑖
𝑅𝑖∗ )
𝐾
𝑘=1
(5)
The interpretation of the P-R H-statistic depends on its value. Depending on the
model, the H-statistic is used to measure (a) competitive environment and (b) market
equilibrium.
H-statistic with negative values indicates at monopoly or perfectly collusive
oligopoly. Monopoly or perfectly collusive oligopoly assumes that a rise in input
prices increases marginal costs and, by setting them equal to marginal revenues,
reduces equilibrium output and the bank’s revenues. Negative values of H-statistic
can also be a product of the so-called operating in isolation whereas only weak
substitutes to the product of the analyzed firm exist.
H-statistic with values between 0 and 1 indicates monopolistic competition. In
monopolistic competition there is product differentiation between the outputs of the
different banks, the profit maximizing banks are confronted with a falling aggregate
demand curve and behave like monopolists, which results in equalizing marginal
costs and marginal revenues in the equilibrium state. By market exit and entry of
imperfect substitutes, the demand curve always shifts in a way that the monopolist
earns zero profits.
H-statistic equal to 1 indicates perfect competition in market equilibrium, assuming
that the banks’ cost functions are linearly homogeneous to the factor prices, the
production functions are homothetic, factor prices are exogenous to the individual
bank, and the elasticity of the perceived demand of the individual firm is
nondecreasing in the number of (symmetric) rivals as well as free market entry and
exit (Panzar & Rosse, 1987).
Panzar-Rosse H-statistic can be used for a long-run equilibrium test with return on
assets (ROA) as the dependent variable instead of the revenue or the price
regression equation. If the value of H-statistic is lower than 0 it indicates non-
equilibrium, whereas H-statistic equal to 1 indicates equilibrium.
Table 1
Competitive environment and equilibrium test
Scenario Value Description
Competitive environment
a H ≤ 0 Monopoly or perfectly collusive oligopoly
b 0 < H < 1 Monopolistic competition
c H = 1 Perfect competition, natural monopoly in a perfectly contestable
market, or sales maximizing firm subject to a break-even
constraint
Equilibrium test
a H < 0 Disequilibrium
b H=1 Equilibrium
Source: Panzar & Rosse (1982, 1987), Molyneux et al. (1994).
In order to assess the H-statistic values this paper uses two revenue and one price
equations, as well as a model with ROA as dependent variable for conducting the
long-run equilibrium test.
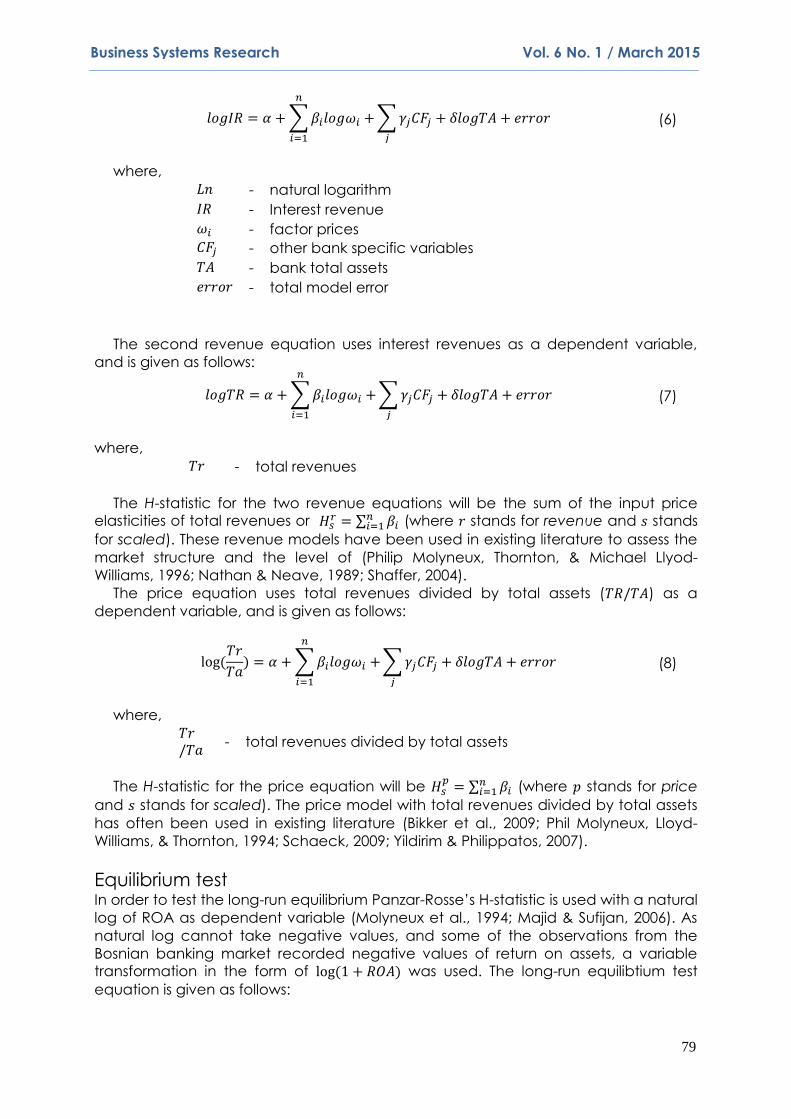
The first revenue equation uses interest revenues as a dependent variable, and is
given as follows:
79
Business Systems Research Vol. 6 No. 1 / March 2015
𝑙𝑜𝑔𝐼𝑅 = 𝛼 + ∑ 𝛽𝑖𝑙𝑜𝑔𝜔𝑖 +
𝑛
𝑖=1
∑ 𝛾𝑗𝐶𝐹𝑗 + 𝛿𝑙𝑜𝑔𝑇𝐴 + 𝑒𝑟𝑟𝑜𝑟
𝑗
(6)
where,
𝐿𝑛 - natural logarithm
𝐼𝑅 - Interest revenue
𝜔𝑖 - factor prices
𝐶𝐹𝑗 - other bank specific variables
𝑇𝐴 - bank total assets
𝑒𝑟𝑟𝑜𝑟 - total model error
The second revenue equation uses interest revenues as a dependent variable,
and is given as follows:
𝑙𝑜𝑔𝑇𝑅 = 𝛼 + ∑ 𝛽𝑖𝑙𝑜𝑔𝜔𝑖 +
𝑛
𝑖=1
∑ 𝛾𝑗𝐶𝐹𝑗 + 𝛿𝑙𝑜𝑔𝑇𝐴 + 𝑒𝑟𝑟𝑜𝑟
𝑗
(7)
where,
𝑇𝑟 - total revenues
The H-statistic for the two revenue equations will be the sum of the input price elasticities of total revenues or 𝐻𝑠
𝑟 = ∑ 𝛽𝑖𝑛𝑖=1 (where 𝑟 stands for revenue and 𝑠 stands
for scaled). These revenue models have been used in existing literature to assess the
market structure and the level of (Philip Molyneux, Thornton, & Michael Llyod-
Williams, 1996; Nathan & Neave, 1989; Shaffer, 2004).
The price equation uses total revenues divided by total assets (𝑇𝑅/𝑇𝐴) as a
dependent variable, and is given as follows:
log (
𝑇𝑟
𝑇𝑎) = 𝛼 + ∑ 𝛽𝑖𝑙𝑜𝑔𝜔𝑖 +
𝑛
𝑖=1
∑ 𝛾𝑗𝐶𝐹𝑗 + 𝛿𝑙𝑜𝑔𝑇𝐴 + 𝑒𝑟𝑟𝑜𝑟
𝑗
(8)
where,
𝑇𝑟/𝑇𝑎
- total revenues divided by total assets
The H-statistic for the price equation will be 𝐻𝑠𝑝
= ∑ 𝛽𝑖𝑛𝑖=1 (where 𝑝 stands for price
and 𝑠 stands for scaled). The price model with total revenues divided by total assets
has often been used in existing literature (Bikker et al., 2009; Phil Molyneux, Lloyd-
Williams, & Thornton, 1994; Schaeck, 2009; Yildirim & Philippatos, 2007).
Equilibrium test In order to test the long-run equilibrium Panzar-Rosse’s H-statistic is used with a natural
log of ROA as dependent variable (Molyneux et al., 1994; Majid & Sufijan, 2006). As
natural log cannot take negative values, and some of the observations from the
Bosnian banking market recorded negative values of return on assets, a variable transformation in the form of log (1 + 𝑅𝑂𝐴) was used. The long-run equilibtium test
equation is given as follows:
80
Business Systems Research Vol. 6 No. 1 / March 2015
log (1 + 𝑅𝑂𝐴) = 𝛼 + ∑ 𝛽𝑖𝑙𝑜𝑔𝜔𝑖 +
𝑛
𝑖=1
∑ 𝛾𝑗𝐶𝐹𝑗 + 𝛿𝑙𝑜𝑔𝑇𝐴 + 𝑒𝑟𝑟𝑜𝑟
𝑗
(9)
where,
𝑅𝑂𝐴 - return on assets, measured as net result before tax divided by total assets
The long-run equilibrium test measures the sum of the elasticity of return on assets
with respect to input prices. In the scenario of the H-statistic (in some literature referred as E-statistic) taking the value of 0 or 𝐻 = ∑ 𝛽𝑖 = 0𝑛
𝑖=1 , the banking market is in
long-run equilibrium. If the H-statistic is not equal to 0 than the market is considered
not to be in equilibrium (tested using F-test) as proposed in previous research (Al-
Muharrami, 2009a; Coccorese, 2013).
Data and results Assessing the competition on the banking market in Bosnia and Herzegovina carries
several problems. Due to the low level of awareness and resources, no research has
been conducted on this topic using the data from the Bosnian banking market.
Bosnian banking market is highly decentralized due to the constitutional provisions
and consists of two separate banking markets / entities, each having their own
regulations, regulatory authorities and none of them being the Central Bank. Lack of
a centralized research database consisting of necessary financial data from the
banking market is one of the main issues in conducting such a research.
All publicly available financial statements of banks operating in both entities in the
panel period 2008-2012 are used in the empirical part of this research. As some of
the banks’ financial statements were not publicly available, they are not included in
the sample. The data for 2007 are not included due to a relatively high share of
missing financial statements. Table 2 gives an overview of the number of
observations in the observed period.
Table 2
Number of observations in the observed period
Year 2008 2009 2010 2011 2012 Total
Included # of banks 20 23 23 24 24 130
Total # of banks 30 30 29 29 28 178
% included 69,0% 79,3% 79,3% 82,8% 82,8% 73,0%
Source: Author’s calculations
The bank-years not included in the analysis are small banks, banks which faced
bankruptcy procedures in the observed periods and one banks operating under
principles of Islamic banking. The study also excludes development banks due to
their different technology, structure and goal to the commercial banks (Al-
Muharrami, 2008). The included data relevance is insured as in all observed years the
included share of total assets does not drop below 85% of total bank industry assets.
The final dataset includes 140 observations. The data is obtained from both
constitutional entities Federation of Bosnia and Herzegovina and Republika Srpska.
The Table 3 gives an overview of the calculated𝐶𝑅3, 𝐶𝑅5, 𝐶𝑅8 and HHI indexes for
loans, deposits and assets.
The 𝐶𝑅𝑘 indicators calculated for loans, deposits and total assets show a
decreasing concentration trend between 2008 and 2012. The concentration of loans

81
Business Systems Research Vol. 6 No. 1 / March 2015
for top three banks has decreased from 47,3% in 2008 to 34,4% in 2012. The similar
trend was detected for top 5 and top 8 banks. The HHI index for loans ranged from
0,095 in 2008 and was decreased to 0,059 in 2012. The concentration indicators for
deposits show a slight increase in all 𝐶𝑅3, 𝐶𝑅5, 𝐶𝑅8 groups in 2009 compared to 2008
indicating an increasing customer confidence in largest banks. The indicators were
relatively unchanged in 2010, but were decreasing ever since. The HHI index for
deposits has also increased from 0,101 in 2008 to 0,109 and 0,110 in 2009 and 2010
respectively. Following the 𝐶𝑅𝑘 trends it has decreased in 2011 and 2012, indicating a
decreasing concentration of deposits among large banks. As assets are mainly
consisted of loans on the banking market in Bosnia and Herzegovina, 𝐶𝑅𝑘 and HHI
indicators for total assets are following the indexes for loans in the observed period.
The asset concentration for the largest 3 banks has decreased from 47,5% in 2008 to
39,6% in 2012, for largest 5 banks from 62,6% to 51,8% and from 75,3% to 64,8% for
largest 8 banks. The HHI indicator for assets has ranged from 0,099 in 2008 to 0,076 in
2012 and indicated a very low concentration. Generally the Bosnian market can be
considered as one with very low concentration measured by Herfindahl-Hirschman
Index applied to loans, deposits and total assets.
Table 3
Results of concentration ratios and Herfindahl-Hirschman Index
Year
2008 2009 2010 2011 2012
Loans
𝐂𝐑𝟑 47,3% 42,9% 39,5% 36,8% 34,4%
𝐂𝐑𝟓 61,8% 58,3% 54,2% 50,1% 46,3%
𝐂𝐑𝟖 73,6% 70,4% 65,6% 61,3% 58,1%
𝐇𝐇𝐈 0,095 0,083 0,073 0,066 0,059
Deposits
𝐂𝐑𝟑 47,0% 49,2% 49,4% 47,9% 46,6%
𝐂𝐑𝟓 61,7% 62,3% 61,5% 60,3% 58,3%
𝐂𝐑𝟖 73,5% 73,8% 73,8% 72,5% 70,4%
𝐇𝐇𝐈 0,101 0,109 0,110 0,107 0,102
Assets
𝐂𝐑𝟑 47,5% 47,0% 43,3% 41,1% 39,6%
𝐂𝐑𝟓 62,6% 60,7% 56,5% 54,3% 51,8%
𝐂𝐑𝟖 75,3% 74,0% 69,7% 65,3% 64,8%
𝐇𝐇𝐈 0,099 0,097 0,086 0,083 0,076
Source: Author’s calculations
The paper includes two revenue and one price equations, as well as a model with
ROA as dependent variable for conducting the long-run equilibrium test. The first log-
log revenue equation, with interest revenue as the dependent variable:
𝑙𝑜𝑔𝐼𝑅 = 𝐶 + 𝛽1𝑙𝑜𝑔𝑃𝐹𝑖 + 𝛽2𝑙𝑜𝑔𝑃𝐿𝑖 + 𝛽3𝑙𝑜𝑔𝑃𝐾𝑖 + 𝛿𝑙𝑜𝑔𝑇𝐴 + 𝛾1𝑙𝑜𝑔𝐶𝐴𝑃𝐴𝑆𝑆𝑖
+ 𝛾2𝑙𝑜𝑔𝐿𝑂𝐴𝑁𝐴𝑆𝑆𝑖 + 𝛾3𝑙𝑜𝑔𝐵𝑅𝑖 + 𝛾4𝑙𝑜𝑔𝐿𝑇𝐷𝑖+𝛾5𝐷5𝑖
+ 𝛾6𝐷𝐸𝑖 + 𝑒𝑟𝑟𝑜𝑟
(10)
where 𝐿𝑛 - natural logarithm
𝐼𝑅 - interest revenue
𝑃𝐹𝑖 - ratio of interest expenses and total deposits
82
Business Systems Research Vol. 6 No. 1 / March 2015
𝑃𝐿𝑖 - ratio of personnel expenses and number of employees
𝑃𝐾𝑖 - ratio of other operating costs and fixed assets
𝑇𝐴 - bank total assets 𝐶𝐴𝑃𝐴𝑆𝑆𝑖 - ratio of risk capital and total assets
𝐿𝑂𝐴𝑁𝐴𝑆𝑆𝑖 - ratio of loans and total assets
𝐵𝑅𝑖 - ratio of number of branches and total number of branches
𝐿𝑇𝐷𝑖 - ratio of loans and deposits
𝐷5𝑖 - dummy variable for the largest 5 banks
𝐷𝐸𝑖 - dummy variable for constitutional entitiy
𝑒𝑟𝑟𝑜𝑟 - total model error
The second log-log revenue equation, uses total revenue as the dependent
variable and is given as follows:
𝑙𝑜𝑔𝑇𝑅 = 𝐶 + 𝛽1𝑙𝑜𝑔𝑃𝐹𝑖 + 𝛽2𝑙𝑜𝑔𝑃𝐿𝑖 + 𝛽3𝑙𝑜𝑔𝑃𝐾𝑖 + 𝛿𝑙𝑜𝑔𝑇𝐴 + 𝛾1𝑙𝑜𝑔𝐶𝐴𝑃𝐴𝑆𝑆𝑖
+ 𝛾2𝑙𝑜𝑔𝐿𝑂𝐴𝑁𝐴𝑆𝑆𝑖 + 𝛾3𝑙𝑜𝑔𝐵𝑅𝑖 + 𝛾4𝑙𝑜𝑔𝐿𝑇𝐷𝑖+𝛾5𝐷5𝑖
+ 𝛾6𝐷𝐸𝑖 + 𝑒𝑟𝑟𝑜𝑟
(11)
The log-log price equation uses ratio of total revenues to total assets as the
dependent variable and is given as follows:
log (
𝑇𝑅
𝑇𝐴) = 𝐶 + 𝛽1𝑙𝑜𝑔𝑃𝐹𝑖 + 𝛽2𝑙𝑜𝑔𝑃𝐿𝑖 + 𝛽3𝑙𝑜𝑔𝑃𝐾𝑖 + 𝛿𝑙𝑜𝑔𝑇𝐴
+ 𝛾1𝑙𝑜𝑔𝐶𝐴𝑃𝐴𝑆𝑆𝑖 + 𝛾2𝑙𝑜𝑔𝐿𝑂𝐴𝑁𝐴𝑆𝑆𝑖 + 𝛾3𝑙𝑜𝑔𝐵𝑅𝑖
+ 𝛾4𝑙𝑜𝑔𝐿𝑇𝐷𝑖+𝛾5𝐷5𝑖 + 𝛾6𝐷𝐸𝑖 + 𝑒𝑟𝑟𝑜𝑟
(12)
For the revenue and price equations 𝐻 − 𝑠𝑡𝑎𝑡𝑖𝑠𝑡𝑖𝑐 = 𝛽1 + 𝛽2 + 𝛽3.
In order to assess the long-run equilibrium Panzar-Rosse’s H-statistic the following
equation is used:
log (1 + 𝑅𝑂𝐴) = 𝐶 + 𝛽1𝑙𝑜𝑔𝑃𝐹𝑖 + 𝛽2𝑙𝑜𝑔𝑃𝐿𝑖 + 𝛽3𝑙𝑜𝑔𝑃𝐾𝑖 + 𝛿𝑙𝑜𝑔𝑇𝐴
+ 𝛾1𝑙𝑜𝑔𝐶𝐴𝑃𝐴𝑆𝑆𝑖 + 𝛾2𝑙𝑜𝑔𝐿𝑂𝐴𝑁𝐴𝑆𝑆𝑖 + 𝛾3𝑙𝑜𝑔𝐵𝑅𝑖
+ 𝛾4𝑙𝑜𝑔𝐿𝑇𝐷𝑖+𝛾5𝐷5𝑖 + 𝛾6𝐷𝐸𝑖 + 𝑒𝑟𝑟𝑜𝑟
(13)
where the H-statistic is tested for equilibrium as 𝐻 − 𝑠𝑡𝑎𝑡𝑖𝑠𝑡𝑖𝑐 = 𝛽1 + 𝛽2 + 𝛽3 = 0.
All of the models are created for the whole country, as well as for each of the
Bosnian entities. For the whole country P-R model with natural logarithm of interest
revenue (IR) used as dependent variable, cost of funds (𝑃𝐹) and cost of labor (𝑃𝐿)
have a statically significant effect on the interest income, with relatively high
coefficients. Cost of funds (𝑃𝐹) variable is positively related to interest income which
can be justified by the fact that more deposit funds collected by the bank by theory
leads to more loans and consecutively more interest income, ceteris paribus
(significant at 1%). Cost of labor (𝑃𝐿) variable is negatively related to interest income
(significant at 5%). The size of bank’s assets (𝐴𝑆𝑆) as well as share of loans in total
assets (𝐿𝑂𝐴𝑁𝐴𝑆𝑆) is expectedly positively related to interest income and is significant
at 1%. Ratio of number of branches to total number of branches also exhibits
83
Business Systems Research Vol. 6 No. 1 / March 2015
expectedly a positive relationship to interest income, as bank has more branches, it
should have more loan exposed customers (significant at 10%). Loan to deposit ratio
(𝐿𝑇𝐷) seems to have a negative relationship with interest income. Indicator of largest
five banks in Bosnia and Herzegovina as well as entity in which banks operate, does
not seem to have statistically significant effect on the level of interest income. The
Wald test does not reject the hypothesis of monopolistic market structure where H-
statistic=0 at the 5% significance level. It however rejects the hypothesis of perfectly
competitive market structure where H-statistic=1 at the 5% significance level. The
estimation of H=0,084 suggests that bank interest revenues in the sample period
appear to be earned in conditions of monopolistic market structure on the banking
market in Bosnia and Herzegovina.
P-R model created for Federation of Bosnia and Herzegovina with natural
logarithm of interest revenue used as dependent variable, cost of funds (𝑃𝐹) and
cost of capital o (𝑃𝐾) have a statically significant effect on the interest income. Both
variables (𝑃𝐹 and 𝑃𝐾) variables are positively related to interest income. Cost of
funds is significant at 1%, while cost of capital is significant at 5%. Cost of funds has
significantly higher effect on the interest income than cost of capital. Unlike for the
model created for on the whole country level, cost of labor has an insignificant
effect on interest income. The size of bank’s assets (𝐴𝑆𝑆) as well as share of loans in
total assets (𝐿𝑂𝐴𝑁𝐴𝑆𝑆) is expectedly positively related to interest income and is
significant at 1%. Ratio of number of branches to total number of branches also
exhibits expectedly a positive relationship to interest income, similar to the one
detected on the country level. The Wald test does not reject the hypothesis of
monopolistic market structure in Federation of Bosnia and Herzegovina where H-
statistic=0 at the 5% significance level. It however rejects the hypothesis of perfectly
competitive market structure where H-statistic=1 at the 5% significance level. The
estimation of H=0,105 suggests that bank interest revenues in the sample period
appear to be earned in conditions of monopolistic market structure on the banking
market in Federation of Bosnia and Herzegovina.
P-R model created for Republika Srpska with natural logarithm of interest revenue
used as dependent variable, out of the three used factor prices, only cost of funds
(𝑃𝐹) have a statically significant effect on the interest income (significant at 1%), with
very high regression coefficient. The size of bank’s assets (𝐴𝑆𝑆) as well as share of
loans in total assets (𝐿𝑂𝐴𝑁𝐴𝑆𝑆) is expectedly positively related to interest income and
is significant at 1%. These rations are exhibiting similar effects on the dependent
variable in all three models. Loan to deposit ratio (𝐿𝑇𝐷) seems to have a negative
relationship with interest income in Republika Srpska, similar to the country-level
model. The Wald test rejects the hypothesis of monopolistic market structure in
Federation of Bosnia and Herzegovina where H-statistic=0 at, as well as hypothesis of
perfectly competitive market structure where H-statistic=1 at the 5% significance
level. The estimation of H=0,783 indicates the conclusion that bank interest revenues
in the sample period in Republika Srpska appear to be earned in conditions of
monopolistic competition market structure.
The second revenue model is created on the basis of total revenues (𝑇𝑅) as
dependent variable. On the whole country level the following variables are
statistically significant: 𝑃𝐹, 𝑃𝐿, 𝐴𝑆𝑆, 𝐿𝑂𝐴𝑁𝐴𝑆𝑆, 𝐵𝑅, 𝐿𝑇𝐷, and 𝐷𝑢𝑚𝑚𝑦𝐸. We remark that
𝑃𝐹, 𝐴𝑆𝑆, 𝐿𝑂𝐴𝑁𝐴𝑆𝑆, 𝐵𝑅 are in positive, while 𝑃𝐿, 𝐿𝑇𝐷 and 𝐷𝑢𝑚𝑚𝑦𝐸 are in negative
relation to total revenues. The cost of funds with a positive coefficient shows that the
increased costs of funds leading to the higher revenue, while cost of labour with a
negative sign implicates that the increased cost of labour leading to the lower total
revenues. The Wald test rejects the hypothesis of monopolistic market structure in

84
Business Systems Research Vol. 6 No. 1 / March 2015
Federation of Bosnia and Herzegovina where H-statistic=0 at 5% significance level, as
well as hypothesis of perfectly competitive market structure where H-statistic=1 at the
5% significance level. The estimation of H= -0,268 indicates the conclusion that bank
total revenues in the sample period in Bosnia and Herzegovina appear to be earned
in conditions of monopoly or perfectly collusive oligopoly market structure.
For the model using total revenues as dependent variable using data from
Federation of Bosnia and Herzegovina, the following variables are statistically
significant: 𝑃𝐹, 𝑃𝐿, 𝐴𝑆𝑆, 𝐵𝑅 and 𝐿𝑇𝐷. We remark that 𝑃𝐹, 𝐴𝑆𝑆, 𝐵𝑅 are in positive, while
𝑃𝐿, 𝐿𝑇𝐷 are in negative relation to total revenues. The cost of funds with a positive
coefficient shows that the increased costs of funds leading to the higher revenue,
while cost of labour with a negative sign implicates that the increased cost of labour
leading to the lower total revenues. The directions of the relationships between the
dependent and independent variabels are the same as in the whole country model.
The Wald test does not reject the hypothesis of monopolistic market structure in
Federation of Bosnia and Herzegovina where H-statistic=0 at 5% significance level. It
however rejects the hypothesis of perfectly competitive market structure where H-
statistic=1 at the 5% significance level. The estimation of H= 0,033 indicates the
conclusion that bank total revenues in the sample period in Federation of Bosnia and
Herzegovina appear to be earned in conditions of monopoly or perfectly collusive
oligopoly market structure.
For the model using total revenues as dependent variable using data from
Republika Srpska, the following variables are statistically significant: 𝑃𝐹, 𝐴𝑆𝑆, 𝐵𝑅 and
𝐿𝑇𝐷. We remark that 𝑃𝐹, 𝐴𝑆𝑆, 𝐵𝑅 are in positive, while 𝑃𝐿, 𝐿𝑇𝐷 are in negative
relation to total revenues. The cost of funds with a positive coefficient shows that the
increased costs of funds leading to the higher revenue, while cost of labour with a
negative sign implicates that the increased cost of labour leading to the lower total
revenues. The directions of the relationships between the dependent and
independent variabels are the same as in the whole country model. The Wald test
does not reject the hypothesis of monopolistic market structure in Federation of
Bosnia and Herzegovina where H-statistic=0 at 5% significance level. It however
rejects the hypothesis of perfectly competitive market structure where H-statistic=1 at
the 5% significance level. The estimation of H= -0,058 indicates the conclusion that
bank total revenues in the sample period in Federation of Bosnia and Herzegovina
appear to be earned in conditions of monopoly or perfectly collusive oligopoly
market structure.
The P-R price model is created on the basis of ratio of total revenues to total assets
(TR/TA) as dependent variable. On the whole country level the following variables
are statistically significant: 𝑃𝐹, 𝑃𝐿, 𝐴𝑆𝑆, 𝐶𝐴𝑃𝐴𝑆𝑆, 𝐿𝑂𝐴𝑁𝐴𝑆𝑆, 𝐵𝑅, 𝐿𝑇𝐷, and 𝐷𝑢𝑚𝑚𝑦𝐸. The
model shows that 𝑃𝐹, 𝐶𝐴𝑃𝐴𝑆𝑆, 𝐿𝑂𝐴𝑁𝐴𝑆𝑆, 𝐵𝑅 are in positive, while 𝑃𝐿, 𝐴𝑆𝑆, 𝐿𝑇𝐷 and
𝐷𝑢𝑚𝑚𝑦𝐸 are in negative relation to total revenues to total asset ratio. The Wald test
rejects the hypothesis of monopolistic market structure in of Bosnia and Herzegovina
where H-statistic=0 at 5% significance level, as well as hypothesis of perfectly
competitive market structure where H-statistic=1 at the 5% significance level. The
estimation of H= -0,268 indicates the conclusion that bank total revenues in the
sample period in Bosnia and Herzegovina appear to be earned in conditions of
monopoly or perfectly collusive oligopoly market structure.
The model created with data from Federation of Bosnia and Herzegovina the
following variables are statistically significant: 𝑃𝐹, 𝑃𝐿, 𝐴𝑆𝑆, 𝐵𝑅, 𝐿𝑇𝐷. The model shows
that 𝑃𝐹, 𝐶𝐴𝑃𝐴𝑆𝑆, 𝐿𝑂𝐴𝑁𝐴𝑆𝑆, 𝐵𝑅 are in positive, while 𝑃𝐿, 𝐴𝑆𝑆, 𝐿𝑇𝐷 and 𝐷𝑢𝑚𝑚𝑦𝐸 are in
negative relation to total revenues to total asset ratio. The Wald test did not reject
the hypothesis of monopolistic market structure in of Bosnia and Herzegovina where

85
Business Systems Research Vol. 6 No. 1 / March 2015
H-statistic=0 at 5% significance level. The Wald test rejected the hypothesis of
perfectly competitive market structure where H-statistic=1 at the 5% significance
level. The estimation of H= 0,033 indicates that bank total revenues in the sample
period in Federation of Bosnia and Herzegovina appear to be earned in conditions
of monopoly or perfectly collusive oligopoly market structure.
The model created with data from Republika Srpska the following variables are
statistically significant:𝑃𝐹, 𝐴𝑆𝑆, 𝐿𝑂𝐴𝑁𝐴𝑆𝑆, 𝐿𝑇𝐷. The model indicates that𝑃𝐹, 𝐴𝑆𝑆,
𝐿𝑂𝐴𝑁𝐴𝑆𝑆 are in positive, while 𝐿𝑇𝐷 is in negative relation to total revenues to total
asset ratio. The Wald test did not reject the hypothesis of monopolistic market
structure in of Bosnia and Herzegovina where H-statistic=0 at 5% significance level.
The Wald test rejected the hypothesis of perfectly competitive market structure
where H-statistic=1 at the 5% significance level. The estimation of H= -0,058 indicates
that bank total revenues in the sample period in Federation of Bosnia and
Herzegovina appear to be earned in conditions of monopoly or perfectly collusive
oligopoly market structure.
We also tested the banking market of Bosnia and Herzegovina as well as its entities
for long-run equilibrium using an adequate transformation of ratio of pre-tax net
profit to total asset (1+ROA) as the dependent variable. The Wald test for models for
whole country as well as for the Republika Srpska model do rejected the null
hypothesis H-statistic=0, which indicated that in the observed period the two banking
markets are not in a long run equilibrium, while the model for Federation of Bosnia
and Herzegovina, shows that its banking market is in the long-run equilibrium, as the
Wald test does not reject the hypothesis that H-statistic=0.
Conclusions
This paper investigated the market structure of the banking market in Bosnia and
Herzegovina and its constitutional entities using k-bank concentration ratio
(〖CR〗_k) and Herfindahl-Hirschman Index (HHI) and the monopoly of banks using
the Panzar-Rosse H-statistic during the period of 2008 – 1012. The results show that the
both concentration ratios calculated for loans, deposits and total assets are
exhibiting fairly high level but have a decreasing trend between 2008 and 2012. The
Panzar-Rosse H-statistic suggests that banking market of Bosnia and Herzegovina
observed as a whole and banking markets of constitutional entities that act as
separate banking markets, tend to exhibit similar market structure results in most of
the created models. Banks operating on the banking market in Bosnia and
Herzegovina seem to be earning their total and interest revenues under monopoly or
perfectly collusive oligopoly, with an exception for the Republika Srpska market in the
model using interest revenues as dependent variable, with the H-statistic of 0,783
indicates monopolistic competition.
The estimates of the Panzar-Rosse H-statistics of a static model suggest that the
Bosnia and Herzegovina Republika Srpska banking market were characterized by
disequilibrium and equilibrium for Federation of Bosnia and Herzegovina over the
period between 2008 and 2012. In other words the study has shown that there was
some correlation between return on assets and the prices of used factor inputs. As to
our knowledge no similar studies have been conducted so far on either the Bosnia
and Herzegovina or to its neighbouring countries, no comparative conclusions are
viable.
This research and its results are limited to one country and bank financial data
published on their own or regulatory authorities’ and financial markets’ web sites. We
propose further research in this area, using data from more than one developing
country, and their comparison to results obtained for developed countries. Such
86
Business Systems Research Vol. 6 No. 1 / March 2015
insight may help understand if any competition or efficiency differences exist
between developed and developing banking markets.
References 1. Abdul Majid, M. Z., Sufian, F. (2007), “Market Structure and Competition in
Emerging Market: Evidence from Malaysian Islamic Banking Industry”, MPRA
Paper, available at: http://mpra.ub.uni-muenchen.de/12126/1/ / (June 12, 2014).
2. Al-Muharrami, S. (2009a), “Analysis of competitiveness in Qatar banking industry”,
International Journal of Business Innovation and Research, Vol. 3 No. 2, pp. 168–
181.
3. Al-Muharrami, S. (2009b), “The competition and market structure in the Saudi
Arabia banking”, Journal of Economic Studies, Vol. 36 No. 5, pp. 446–460
4. Al-Muharrami, S., Matthews, K., Khabari, Y. (2006), “Market structure and
competitive conditions in the Arab GCC banking system”, Vol. 30 No. 12, pp.
3487–3501.
5. Anzoategui, D., Martinez, P. M. S., Rocha, R. R. (2010), “Bank Competition in the
Middle East and Northern Africa Region”, Review of Middle East Economics and
Finance, Vol. 6 No. 2, pp. 26–48.
6. Anzoategui, D., Pería, M. S. M., Melecky, M. (2012), “Bank competition in Russia: An
examination at different levels of aggregation”, Emerging Markets Review, Vol. 13
No. 1, pp. 42–57.
7. Bain, J. S. (1956), “Barriers to new competition: their character and consequences
in manufacturing industries”, Cambridge, MA: Harvard University Press.
8. Bikker, J. A., Groeneveld, J. M. (1998), “Competition and Concentration in the EU
Banking Industry”, Research Series Supervision, Netherlands Central Bank,
Directorate Supervision.
9. Bikker, J. A., Haaf, K. (2002), “Competition, concentration and their relationship:
An empirical analysis of the banking industry”, Journal of Banking & Finance, Vol.
26. No. 11, pp. 2191–2214.
10. Bikker, J. A., Shaffer, S., Spierdijk, L. (2009), “Assessing competition with the Panzar-
Rosse model: the role of scale, costs, and equilibrium”, Review of Economic and
Statistics, Vol. 94, No. 4, pp. 1025-1044.
11. Brämer, P., Gischer, H., Richter, T., Weiß, M. (2013), “Competition in banks’ lending
business and its interference with ECB monetary policy”, Journal of International
Financial Markets, Institutions and Money, Vol. 25, pp. 144–162.
12. Carbó, S., Humphrey, D., Maudos, J., Molyneux, P. (2009), “Cross-country
comparisons of competition and pricing power in European banking”, Vol. 28.
No. 1, pp. 115–134.
13. Chen, S.-H., Liao, C.-C. (2011), “Are foreign banks more profitable than domestic
banks? Home- and host-country effects of banking market structure,
governance, and supervision”, Journal of Banking & Finance, Vol. 35. No. 4, pp.
819–839.
14. Coccorese, P. (2002), “Competition Among Dominant Firms in Concentrated
Markets: Evidence from the Italian Banking Industry”, Working Paper No. 89.
Centre for Studies in Economics and Finance (CSEF), University of Naples, Italy.
15. Coccorese, P. (2004), “Banking competition and macroeconomic conditions: a
disaggregate analysis”, Journal of International Financial Markets, Institutions and
Money, Vol. 14. No. 3, pp. 203–219.
16. Coccorese, P. (2005), “Competition in markets with dominant firms: A note on the
evidence from the Italian banking industry”, Journal of Banking & Finance, Vol.
29. No. 5, pp. 1083–1093.

87
Business Systems Research Vol. 6 No. 1 / March 2015
17. Coccorese, P. (2008a), “An investigation on the causal relationships between
banking concentration and economic growth, International Review of Financial
Analysis”, Vol. 17. No. 3, pp. 557–570.
18. Coccorese, P. (2008b), “Bank competition and regional differences”, Economics
Letters, Vol. 101 No. 1, pp. 13–16.
19. Coccorese, P. (2009), “Market power in local banking monopolies”, Journal of
Banking & Finance, Vol. 33. No. 7, pp. 1196–1210.
20. Coccorese, P. (2013), “Assessing the competitive conditions in the Italian banking
system: some empirical evidence”, PSL Quarterly Review, Vol. 51. No. 205, pp.
171-191.
21. Coccorese, P., Pellecchia, A. (2013), “Multimarket contact, competition and
pricing in banking”, Journal of International Money and Finance, Vol. 37, pp. 187–
214.
22. Dahl, D., Shrieves, R. E. (1999), “The extension of international credit by US banks:
a disaggregated analysis 1988–1994”, Journal of International Money and
Finance, Vol. 18. No. 1, pp. 153–167.
23. Delis, M. D. (2010), “Competitive conditions in the Central and Eastern European
banking systems”, Omega, Vol. 38. No. 5, pp. 268–274.
24. Delis, M. D., Staikouras, K. C., Varlagas, P. T. (2008), “On the Measurement of
Market Power in the Banking Industry”, Journal of Business Finance & Accounting,
Vol. 35. No. 7, pp. 1023–1047.
25. Fosu, S. (2013), “Banking competition in Africa: Subregional comparative studies”,
Emerging Markets Review, Vol. 15, pp. 233–254.
26. Hondroyiannis, G., Lolos, S., Papapetrou, E. (1999), “Assessing competitive
conditions in the Greek banking system”, Journal of International Financial
Markets, Institutions and Money, Vol. 9. No. 4, pp. 377–391.
27. Gischer, H., Stiele, M. (2009), “Competition Tests with a Non-Structural Model: the
Panzar–Rosse Method Applied to Germany’s Savings Banks”, German Economic
Review, Vol. 10. No. 1, pp. 50–70.
28. Goddard, J., Wilson, J. O. S. (2009), “Competition in banking: A disequilibrium
approach”, Journal of Banking & Finance, Vol. 33. No. 12, pp. 2282–2292.
29. Günalp, B., Çelik, T. (2006), “Competition in the Turkish banking industry”, Applied
Economics,Vol. 38. No. 11, pp. 1335–1342.
30. Hondroyiannis, G., Lolos, S., Papapetrou, E. (1999b), “Assessing competitive
conditions in the Greek banking system”, Journal of International Financial
Markets, Institutions and Money, Vol. 9. No. 4, pp. 377–391.
31. Kasman, A. (2010), “Consolidation and Competition in the Banking Industries of
the EU Member and Candidate Countries”, Emerging Markets Finance and
Trade, Vol. 46. No. 6, pp. 121–139.
32. Klein, M. A. (1971), “A Theory of the Banking Firm”, Journal of Money, Credit and
Banking, Vol. 3. No. 2, pp. 205.
33. Lerner, A. P. (1934), “The Concept of Monopoly and the Measurement of
Monopoly Power”, The Review of Economic Studies, Vol. 1. No. 3, pp. 157–175.
34. Liu, H., Molyneux, P., Nguyen, L. H. (2012), “Competition and risk in South East
Asian commercial banking”, Applied Economics, Vol. 44. No. 28, pp. 3627–3644.
35. Liu, H., Molyneux, P., Wilson, J. O. S. (2013), “Competition and Stability in European
Banking: A Regional Analysis”, The Manchester School, Vol. 81. No. 2, pp. 176–201.
36. Lloyd-Williams, D. M., Molyneux, P., Thornton, J. (1994), “Market structure and
performance in Spanish banking”, Journal of Banking & Finance, Vol. 18. No. 3,
pp. 433–443.
37. Majid, M. Z. A., Sufian, F. (2006), “Consolidation and Competition in Emerging

88
Business Systems Research Vol. 6 No. 1 / March 2015
Market: An Empirical Test for Malaysian Banking Industry”, Economic Change and
Restructuring, Vol. 39 No. 1-2, pp. 105–124.
38. Mamatzakis, E., Staikouras, C., Koutsomanoli-Fillipaki, N. (2005), “Competition and
concentration in the banking sector of the South Eastern European region”,
Emerging Markets Review, Vol. 6. No. 2, pp. 192–209.
39. Masood, O., Sergi, B. S. (2011a), “China’s banking system, market structure, and
competitive conditions”, Frontiers of Economics in China, Vol. 6. No. 1, pp. 22–35.
40. Matthews, K., Murinde, V., Zhao, T. (2007), “Competitive conditions among the
major British banks”, Journal of Banking & Finance, Vol. 31. No. 7, pp. 2025–2042.
41. Maudos, J., Solís, L. (2009), “The determinants of net interest income in the
Mexican banking system: An integrated model”, Journal of Banking & Finance,
Vol. 33. No. 10, pp. 1920–1931.
42. Memić, D., Škaljić-Memić, S. (2013), “Performance Analysis and Benchmarking of
Commercial Banks Operating in Bosnia and Herzegovina: a DEA Approach”,
Business Systems Research, Vol. 4. No. 2, pp. 17-37.
43. Mishkin, F.S. (2013). The Economics of Money, Banking and Financial Institutions,
Pearson.
44. Molyneux, P., Forbes, W. (1995), “Market structure and performance in European
banking”, Applied Economics, Vol. 27. No. 2, pp. 155–159.
45. Molyneux, P., Lloyd-Williams, D. M., Thornton, J. (1994), “Competitive conditions in
european banking”, Journal of Banking & Finance, Vol. 18. No. 3, pp. 445–459.
46. Molyneux, P., Thornton, J., Michael Llyod-Williams, D. (1996), “Competition and
market contestability in Japanese commercial banking”, Journal of Economics
and Business, Vol. 48. No. 1, pp. 33–45.
47. Nathan, A., Neave, E. H. (1989), “Competition and Contestability in Canada’s
Financial System: Empirical Results”, Canadian Journal of Economics, Vol. 22. No.
3, pp. 576–94.
48. Panzar, J. C., Rosse, J. N. (1982). Structure, Conduct, and Comparative Statistics.
Bell Telephone Laboratories, Incorporated.
49. Panzar, J. C., Rosse, J. N. (1987), “Testing For “Monopoly” Equilibrium”, The Journal
of Industrial Economics, Vol. 35. No. 4, pp. 443.
50. Pawłowska, M. (2011), “Competition in the Polish Banking Market Prior to Recent
Crisis for the Period 1997-2007 - Empirical Results Obtained with the Use of Three
Different Models”, Bank i Kredyt, Vol. 42. No. 5, pp. 5-40.
51. Pruteanu-Podpiera, A., Weill, L., Schobert, F. (2008), “Banking Competition and
Efficiency: A Micro-Data Analysis on the Czech Banking Industry”, Comparative
Economic Studies, Vol. 50. No. 2, pp. 253–273.
52. Rezitis, A. N. (2010), “Evaluating the state of competition of the Greek banking
industry”, Journal of International Financial Markets, Institutions and Money, Vol.
20. No. 1, pp. 68–90.
53. Rhoades, S. A. (1993), “Herfindahl-Hirschman Index”, The Federal Reserve Bulletin,
Vol. 79, pp. 188-189
54. Ritter, L.S., Silber, W.L., Udell, G.F. (2014). Principles of Money, Banking & Financial
Markets, Pearson.
55. de Rozas, L. G. (2007), “Testing for competition in the Spanish banking industry:
The Panzar-Rosse approach revisited”, Banco de España Research Paper No.
WP-0726. Banco de España.
56. Sanyal, P., Shankar, R. (2011), “Ownership, competition, and bank productivity:
An analysis of Indian banking in the post-reform period”, International Review of
Economics & Finance, Vol. 20. No. 2, pp. 225–247.
57. Shaffer, S. (1989), “Competition in the U.S. banking industry”, Economics Letters,
89
Business Systems Research Vol. 6 No. 1 / March 2015
Vol. 29. No. 4, pp. 321–323.
58. Shaffer, S. (1993), “A Test of Competition in Canadian Banking”, Journal of
Money, Credit and Banking, Vol. 25. No. 1, pp. 49.
59. Shaffer, S., DiSalvo, J. (1994), 2Conduct in a banking duopoly”, Journal of Banking
& Finance, Vol. 18. No. 6, pp. 1063–1082.
60. Slovin, M. B., Sushka, M. E., Polonchek, J. A. (1999), “An analysis of contagion and
competitive effects at commercial banks”, Journal of Financial Economics, Vol.
54. No. 2, pp. 197–225.
61. Staikouras, C. K., Koutsomanoli-Fillipaki, A. (2006), “Competition and
Concentration in the New European Banking Landscape”, European Financial
Management, Vol. 12. No. 3, pp. 443–482.
62. Tabak, B. M., Fazio, D. M., Cajueiro, D. O. (2012), “The relationship between
banking market competition and risk-taking: Do size and capitalization matter?”,
Journal of Banking & Finance, Vol. 36. No. 12, pp. 3366–3381.
63. Trivieri, F. (2007), “Does cross-ownership affect competition?: Evidence from the
Italian banking industry”, Journal of International Financial Markets, Institutions
and Money Vol. 17 No. 1, pp. 79–101.
64. Yanelle, M.-O. (1997), “Banking Competition and Market Efficiency”, The Review
of Economic Studies, Vol. 64. No. 2, pp. 215–239.
65. Yildirim, H. S., Philippatos, G. C. (2007a), “Restructuring, consolidation and
competition in Latin American banking markets”, Journal of Banking & Finance,
Vol. 31. No. 3, pp. 629–639.
66. Yildirim, H. S., Philippatos, G. C. (2007b), “Efficiency of Banks: Recent Evidence
from the Transition Economies of Europe, 1993–2000”, The European Journal of
Finance, Vol. 13. No. 2, pp. 123–143.
About the author
Dr. Deni Memić holds a position of an assistant professor at Sarajevo School of
Science and Technology teaching courses of Accounting, Advanced Financial
Reporting, Risk Management, Money and Banking. Dr. Deni Memić is a licensed
Investment advisor and Court expert. He is the youngest PhD in history of School of
Economics and Business Sarajevo. Previously held positions of CRO at Privredna
banka Sarajevo, Director of Retail Risk Management and Rehabilitation at Hypo
Alpe Adria Bank. Main fields of expertize: banking, portfolio management, Basel
Accords, IFRS standards, risk modelling, financial analysis, default prediction and
others. Author can be contacted at [email protected]
90
Business Systems Research Vol. 6 No. 1 / March 2015
Appendices
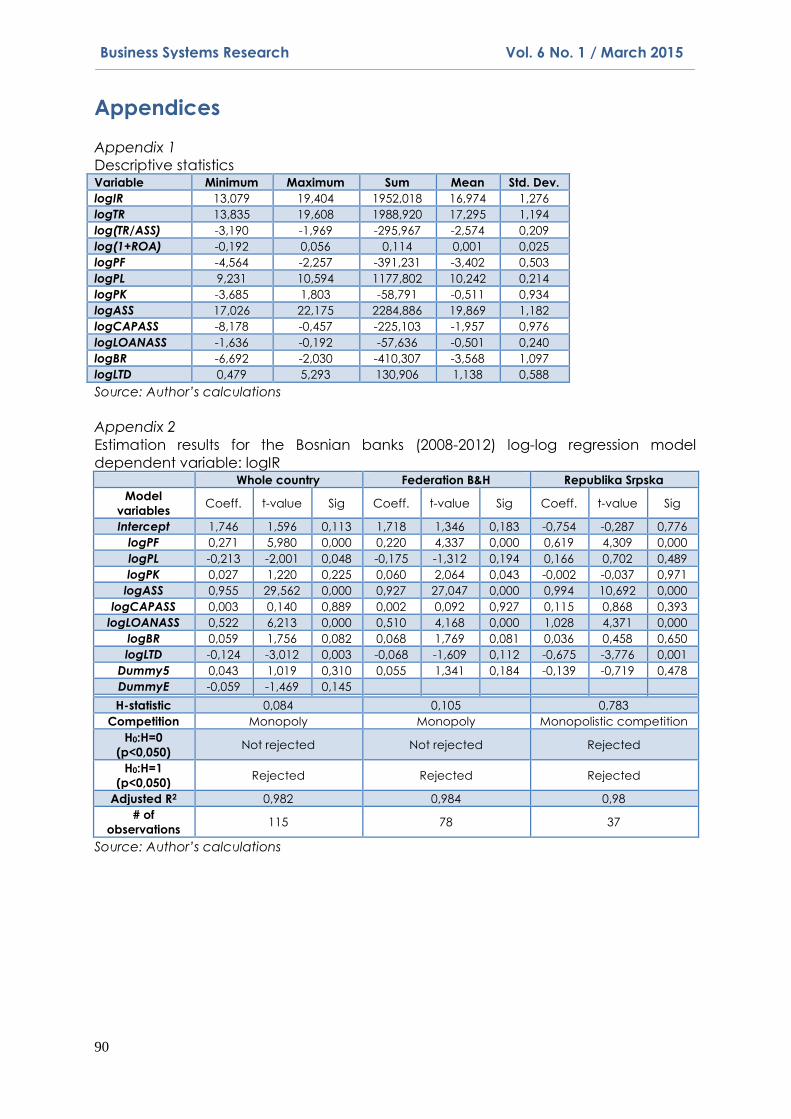
Appendix 1
Descriptive statistics Variable Minimum Maximum Sum Mean Std. Dev.
logIR 13,079 19,404 1952,018 16,974 1,276
logTR 13,835 19,608 1988,920 17,295 1,194
log(TR/ASS) -3,190 -1,969 -295,967 -2,574 0,209
log(1+ROA) -0,192 0,056 0,114 0,001 0,025
logPF -4,564 -2,257 -391,231 -3,402 0,503
logPL 9,231 10,594 1177,802 10,242 0,214
logPK -3,685 1,803 -58,791 -0,511 0,934
logASS 17,026 22,175 2284,886 19,869 1,182
logCAPASS -8,178 -0,457 -225,103 -1,957 0,976
logLOANASS -1,636 -0,192 -57,636 -0,501 0,240
logBR -6,692 -2,030 -410,307 -3,568 1,097
logLTD 0,479 5,293 130,906 1,138 0,588
Source: Author’s calculations
Appendix 2
Estimation results for the Bosnian banks (2008-2012) log-log regression model
dependent variable: logIR
Whole country Federation B&H Republika Srpska
Model
variables Coeff. t-value Sig Coeff. t-value Sig Coeff. t-value Sig
Intercept 1,746 1,596 0,113 1,718 1,346 0,183 -0,754 -0,287 0,776
logPF 0,271 5,980 0,000 0,220 4,337 0,000 0,619 4,309 0,000
logPL -0,213 -2,001 0,048 -0,175 -1,312 0,194 0,166 0,702 0,489
logPK 0,027 1,220 0,225 0,060 2,064 0,043 -0,002 -0,037 0,971
logASS 0,955 29,562 0,000 0,927 27,047 0,000 0,994 10,692 0,000
logCAPASS 0,003 0,140 0,889 0,002 0,092 0,927 0,115 0,868 0,393
logLOANASS 0,522 6,213 0,000 0,510 4,168 0,000 1,028 4,371 0,000
logBR 0,059 1,756 0,082 0,068 1,769 0,081 0,036 0,458 0,650
logLTD -0,124 -3,012 0,003 -0,068 -1,609 0,112 -0,675 -3,776 0,001
Dummy5 0,043 1,019 0,310 0,055 1,341 0,184 -0,139 -0,719 0,478
DummyE -0,059 -1,469 0,145
H-statistic 0,084 0,105 0,783
Competition Monopoly Monopoly Monopolistic competition
H0:H=0
(p<0,050) Not rejected Not rejected Rejected
H0:H=1
(p<0,050) Rejected Rejected Rejected
Adjusted R2 0,982 0,984 0,98
# of
observations 115 78 37
Source: Author’s calculations
91
Business Systems Research Vol. 6 No. 1 / March 2015
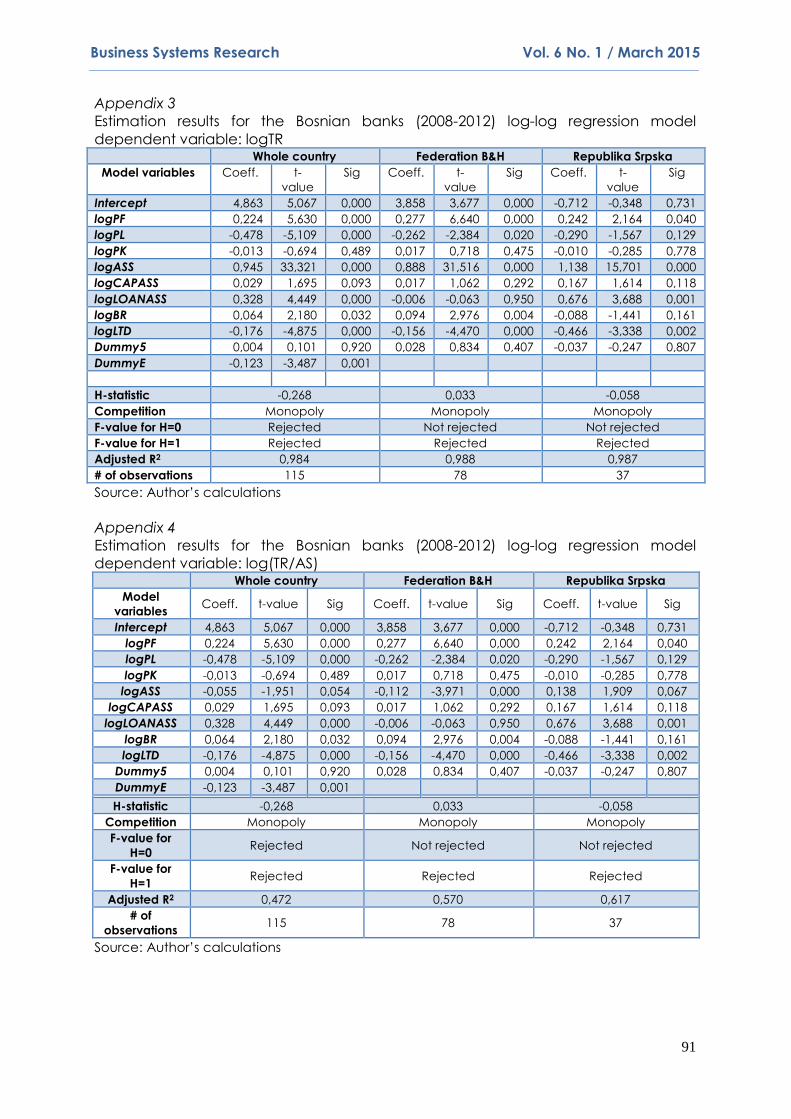
Appendix 3
Estimation results for the Bosnian banks (2008-2012) log-log regression model
dependent variable: logTR Whole country Federation B&H Republika Srpska
Model variables Coeff. t-
value
Sig Coeff. t-
value
Sig Coeff. t-
value
Sig
Intercept 4,863 5,067 0,000 3,858 3,677 0,000 -0,712 -0,348 0,731
logPF 0,224 5,630 0,000 0,277 6,640 0,000 0,242 2,164 0,040
logPL -0,478 -5,109 0,000 -0,262 -2,384 0,020 -0,290 -1,567 0,129
logPK -0,013 -0,694 0,489 0,017 0,718 0,475 -0,010 -0,285 0,778
logASS 0,945 33,321 0,000 0,888 31,516 0,000 1,138 15,701 0,000
logCAPASS 0,029 1,695 0,093 0,017 1,062 0,292 0,167 1,614 0,118
logLOANASS 0,328 4,449 0,000 -0,006 -0,063 0,950 0,676 3,688 0,001
logBR 0,064 2,180 0,032 0,094 2,976 0,004 -0,088 -1,441 0,161
logLTD -0,176 -4,875 0,000 -0,156 -4,470 0,000 -0,466 -3,338 0,002
Dummy5 0,004 0,101 0,920 0,028 0,834 0,407 -0,037 -0,247 0,807
DummyE -0,123 -3,487 0,001
H-statistic -0,268 0,033 -0,058
Competition Monopoly Monopoly Monopoly
F-value for H=0 Rejected Not rejected Not rejected
F-value for H=1 Rejected Rejected Rejected
Adjusted R2 0,984 0,988 0,987
# of observations 115 78 37
Source: Author’s calculations
Appendix 4
Estimation results for the Bosnian banks (2008-2012) log-log regression model
dependent variable: log(TR/AS)
Whole country Federation B&H Republika Srpska
Model
variables Coeff. t-value Sig Coeff. t-value Sig Coeff. t-value Sig
Intercept 4,863 5,067 0,000 3,858 3,677 0,000 -0,712 -0,348 0,731
logPF 0,224 5,630 0,000 0,277 6,640 0,000 0,242 2,164 0,040
logPL -0,478 -5,109 0,000 -0,262 -2,384 0,020 -0,290 -1,567 0,129
logPK -0,013 -0,694 0,489 0,017 0,718 0,475 -0,010 -0,285 0,778
logASS -0,055 -1,951 0,054 -0,112 -3,971 0,000 0,138 1,909 0,067
logCAPASS 0,029 1,695 0,093 0,017 1,062 0,292 0,167 1,614 0,118
logLOANASS 0,328 4,449 0,000 -0,006 -0,063 0,950 0,676 3,688 0,001
logBR 0,064 2,180 0,032 0,094 2,976 0,004 -0,088 -1,441 0,161
logLTD -0,176 -4,875 0,000 -0,156 -4,470 0,000 -0,466 -3,338 0,002
Dummy5 0,004 0,101 0,920 0,028 0,834 0,407 -0,037 -0,247 0,807
DummyE -0,123 -3,487 0,001
H-statistic -0,268 0,033 -0,058
Competition Monopoly Monopoly Monopoly
F-value for
H=0 Rejected Not rejected Not rejected
F-value for
H=1 Rejected Rejected Rejected
Adjusted R2 0,472 0,570 0,617
# of
observations 115 78 37
Source: Author’s calculations

92
Business Systems Research Vol. 6 No. 1 / March 2015
Appendix 5
Estimation results for the Bosnian banks (2008-2012) log-log regression model
dependent variable: log(1+ROA) log(1+ROA) Whole country Federation B&H Republika Srpska
Model
variables Coeff. t-value Sig Coeff. t-value Sig Coeff. t-value Sig
Intercept -0,022 -0,178 0,859 -0,216 -1,655 0,102 -0,458 -1,482 0,150
logPF -0,031 -6,007 0,000 -0,019 -3,678 0,000 -0,047 -2,812 0,009
logPL -0,027 -2,204 0,030 0,004 0,285 0,777 -0,033 -1,198 0,241
logPK -0,002 -0,712 0,478 0,000 0,132 0,895 0,008 1,378 0,180
logASS 0,009 2,499 0,014 0,004 1,182 0,241 0,031 2,807 0,009
logCAPASS 0,000 0,198 0,844 -0,001 -0,276 0,783 0,005 0,290 0,774
logLOANASS 0,027 2,814 0,006 -0,021 -1,715 0,091 0,041 1,485 0,149
logBR -0,003 -0,848 0,398 -0,003 -0,719 0,474 -0,016 -1,717 0,097
logLTD 0,012 2,524 0,013 0,009 2,057 0,043 0,005 0,218 0,829
Dummy5 -0,005 -1,055 0,294 -0,004 -1,010 0,316 -0,001 -0,044 0,965
DummyE -0,004 -0,802 0,424
H-statistic -0,060 -0,015 -0,073
Equilibrium Disequilibrium Equilibrium Disequilibrium
F-value for
H=0 Rejected Not rejected Rejected
Adjusted R2 0,342 0,222 0,629
# of
observations 115 78 37
Source: Author’s calculations