Embed Size (px)
Citation preview

Journal of Economic Cooperation and Development, 39, 4 (2018), 43-74
Banking Characteristics of Millennials
Jennifer Brodmann1, Blake Rayfield2, M. Kabir Hassan3 and Anh Thu Mai4
This paper looks at the characteristics of the Millennial generation, compares
them to other generations, and explores how the characteristics of Millennials
influence their banking behavior, specifically their choice to utilize financial
products and services commonly associated with financial institutions. The
results indicate that Millennials differ from Generation X and Baby Boomers in
several aspects, including utilization of mobile banking, accumulation of student
loan debt, and perception of financial knowledge. Through differences in means
tests and probit regression, the results from this study reflect how these factors
influence Millennials’ interest in and utilization of financial products and
services typically offered by banks.
Keywords: Millennials, Financial Institutions, Financial Services
JEL Classification: G21, G23, G30
1 Introduction
The Millennial population is ascendant on both a domestic and
international scale, with half of the global population being younger than
30 as of 2012 (Boumphrey, 2012). Fry (2015) states that "More than one-
in-three American workers today are Millennials (adults ages 18 to 34 in
2015), and this year they surpassed Generation X to become the largest
share of the American workforce.” Figure 1 shows the upward trend of
1 University of New Orleans Kirschman Hall, Department of Economics and Finance
Email: [email protected] 2 University of New Orleans Kirschman Hall, Department of Economics and Finance
Email: [email protected] 3 University of New Orleans Kirschman Hall, Department of Economics and Finance
Email: [email protected] 4 University of New Orleans Kirschman Hall, Department of Economics and Finance
Email: [email protected]

44 Banking Characteristics of Millennials
Millennial dominance in the U.S. adult population from the U.S. Census
Bureau. Cudmore, Patton, Ng, and McClure (2010) state that “Millennial
spending power is a market force of significance that captures the interest
of many players in the economy, to include the financial services firms,
trying to capture some of this wealth.” This study categorizes the
Millennial generation as individuals who are 13 to 34 years of age. We
examine the differences in characteristics of the Millennial generation in
comparison to the two preceding generations, Generation X (Gen X), and
Baby Boomers.
The Millennial generation is going through major milestones that include
pursuing general education, college education, and employment. There
are several ways that Millennials differ from past generations. In contrast
to the Gen X and Baby Boomer generations, Millennials are the most
diverse generation in American history (Wey Smola and Sutton, 2002).
Moreover, a vast majority of Millennials have attended college and have
college degrees, even more so than other generations (Levenson, 2010).
Figure 1: The Increase of Millennial Dominance in the U.S. Adult Population
Source: US Census Bureau
In addition, the Baby Boomer generation is entering retirement age while
the Millennials are entering the workforce (Dohm, 2000; Perry, 2015).
The Council of Economic Advisers (2014) found that over 60 percent of
adult Millennials have attended college, exceeding the Baby Boomers, 46
0%
20%
40%
60%
80%
100%
2008 2010 2012 2016 2020
Percentage of Millennials Millennial Contribution in Adult Population

Journal of Economic Cooperation and Development 45
percent of whom attended college. Furthermore, Millennials are the first
generation to grow up enjoying both the access to and the benefits of the
internet, which has shaped their views on technology, communication,
and commerce. Their early adoption of technology and internet utilization
has provided opportunities for alternative financial services that target this
generation of consumers. Payment transfers can now be done through
internet-based service providers such as Paypal, Venmo, Square, Stripe,
and Braintree. Financing can be accessed through peer-to-peer lending
platforms such as Zopa, Prosper, and Lending Club, which are
marketplaces where lenders can issue loans to individuals and small
businesses (Mateescu, 2015).
Survey studies have been conducted by financial institutions and firms
that specialize in financial services, such as Wells Fargo, Standard &
Poor’s, KPMG Capital, and Oracle. Pew Research Center (2014) shows
that previous generations think Millennials face a tougher economy than
they faced when starting out, which reflects the current public sentiment
on the U.S. economy and employment opportunities for previous
generations.
Previous literature finds that student loan debt is a major factor affecting
the personal finance decisions of Millennials. Levenson (2010) states,
"Millennials have about twice the college credentials than their
predecessors in the tail end of the Baby Boom and leading edge of
Generation X, and they reached that point by doubling both college
attendance (without graduation) and 4-year college graduation."
Millennials have higher levels of debt in comparison to previous
generations due to the necessity of obtaining student loans to cover rising
education costs while earning college degrees (Nava, Karp, and Nash-
Stacey, 2014; Kern, 2016). The student loan debt burden is also more
pronounced, exceeding the national average, for young adult students
from lower socioeconomic status (Houle, 2013). Efforts for addressing
this student loan issue have led to alternative financing methods such as
Income Sharing Agreements (ISA) where universities advance the student
money to cover education expenses, and in turn, the student agrees to pay
a fixed percentage of their income for a set amount of years (Friedman,
2015). Student loan refinancing demand is also rising, with financial
institutions providing refinancing options for students to obtain more
affordable interest rates, which has been considered more advantageous
for college graduates with higher incomes (Paquette, 2014). The rise in

46 Banking Characteristics of Millennials
student loan balances is seen in Figure 2 which shows student loan
balance growth by age group in 2015.
Figure 2: Total Student Loan Balance Growth by Age Group 2015
Source: FRBNY Consumer Credit Panel/Equifax, Standard & Poor’s 2015
Since the Millennial generation is comprised mainly of college educated
and college graduates, two primary outcomes arise. Student loan debt is
high amongst Millennials, and there is greater competition in obtaining
work with more of the workforce having college degrees. Total student
loan growth, seen in Figure 2, consists primarily of people who are 39
years or younger in age, which consists mostly of Millennials. Because of
this, there is growing pressure for Millennials to obtain a job after
graduation and pay off student loan debt.
There are several factors that may influence a Millennial's financial
decisions, such as student loan debt, relocation, and level of education.
Demographic characteristics and characteristics of financial institutions
come into play in a Millennial’s decision to invest in financial services
and products and to use a given financial institution. This paper examines
the characteristics of the Millennial, what influences Millennials’
financial decisions, and what types of financial products and services are
of interest to and utilized by Millennials.
0
0.2
0.4
0.6
0.8
1
1.2
1.4
2004 2005 2006 2007 2008 2009 2010 2011 2012 2013 2014
under 30 30-39 40-49 50-59 60+

Journal of Economic Cooperation and Development 47
2 Literature Review
Millennials have entered and dominated the workforce (DelCampo,
Haggerty, Haney, and Knippel, 2011), which makes them the largest
consumption targets for traditional financial institutions. Cudmore,
Patton, Ng, & McClure (2010) emphasize that each generation cohort
embraces distinctive characteristics and that financial institutions must
customize their offerings to accommodate the demand of that targeted
generation – the Millennial. Research reveals that Millennials are
delaying marriage and household formation; this factor contributes to the
slow recovery of the housing market, the decline in rates of
homeownership, and the increase in demand for housing rentals (Nava,
Karp, Nash-Stacey, 2014). In agreement with this, another research paper
furthered the discussion on Millennials having higher levels of debt in
comparison to previous generations due to Millennials obtaining student
loans to cover rising education costs (Kern 2016). Another study sampled
a large proportion of Millennials, especially ones with lower-income,
having sufficient savings to cover unexpected expenses. That study
emphasized the need for a combination of initiatives that promotes
financial capability and financial inclusion for effective determinants of
“financial outcomes.” (Friedline and West, 2015). Millennials, when
compared to previous generations, have incurred different demands and
preferences for financial services.
The retirement preparedness of different generations is explored in
several research studies. Lee, Hassan, & Lawrence (2016a) examines the
differences in retirement preparedness of the Generation X, Y, and
“hippie” generations and finds that the “hippie” generation is more
prepared for retirement compared to Generation X and Y. Hassan &
Lawrence (2001) studies gender differences in retirement preparedness
and states that women have higher chances of facing events that can
reduce their economic well-being and can be subject to pay inequality,
which can impact their level of retirement savings. Hassan & Lawrence
(2011) analyze how individuals in their fifties from the 1995 Survey of
Consumer Finances have prepared for retirement and find that good
health, work history, and income have a positive effect on retirement
eligibility and that age and education levels have a negative effect on
pension plan eligibility. Lee, Hassan, & Lawrence (2016b) study the 2016
Survey of Consumer Finances and find that health, age, and gender effect
retirement planning.

48 Banking Characteristics of Millennials
The loyalty of Millennials towards any specific financial institution
depends on their satisfaction, lower fees, relevant product options, and
helpful customer service (Perry, 2015). Millennials have been exposed to
technology at early ages, and many use both personal and internet
banking; yet factors such as marriage status, education level, and
utilization of ATMs, direct deposit, direct bill payment, and computer
software tremendously affect the inclination of Millennials to become
tech-savvy and to adopt internet banking (Kim and DeVaney, 2016).
Interestingly, a study on the use of internet banking among Millennials in
Trinidad and Tobago questions the validity of technological inclination
being the reason Millennials continue to use internet banking despite the
limited access to these services at those physical locations. Indeed, its
findings support the initial proposition that loyalty towards internet
banking depends both on customers’ rational consideration, rather than
innovative inclinations, and on governmental support (Rambocas and
Arjoon, 2012). That research, however, was only limited to students as its
main subjects, which is a relatively homogeneous group and therefore
cannot be generalized to portray a more diverse population.
This paper looks to fill this gap in the academic literature by constructing
a national scale survey administered to respondents throughout the United
States. This study aims to provide additional insight into the
characteristics of potential Millennial bank clients, including what
financial institution characteristics they perceive to be important in their
choice of utilizing financial products and services. The final sample
consists of university students, professors, young professionals, and
Amazon Mechanical Turk (AMT) panelists in the United States. Several
studies utilize AMTs for survey respondents. Mason and Suri (2012)
conclude that utilizing AMTs as respondents can be used as a “useful
tool” to conduct research studies. Shapiro, Chandler, and Mueller (2013)
find that AMTs provide “several advantages for clinical research while
providing insight into potential problems, such as misrepresentation, that
researchers should address when collecting data online." We have
screened our AMT respondents by adding in screening questions to make
sure that the respondents were seriously answering the questions.
Among current research literature, Hussain and Wong (2015) embrace
similar perspectives and methods, constructing the quantitative
description of Millennials as consumers for banks for marketing purposes
targeting product demands. Specifically, the Millennial generation
Journal of Economic Cooperation and Development 49
(sometimes referred to as Generation Y) was segmented based on
different demographic factors. However, the Hussain and Wong (2015)
survey was limited to a sample of 110 Millennial students from a
university in Northern California; most of the respondents were between
the ages of 21 and 23. Remedying that limitation, this paper contributes
to the existing literature by examining a larger dataset consisting of 400
respondents spanning from Baby Boomers to Millennials. A comparison
study is conducted to examine the differences in characteristics between
generations as well as to gauge the interest and probability of generations
to utilize financial institutions.
Alternative financial services should be further examined for financial
institutions to effectively compete in a changing industry. Traditional
financial institutions need to not only adjust for the shift of customer
generation mentioned above but also prepare for threats coming from
alternative financial services competing for current market shares. Peer-
to-peer lending operations – “which provide efficient alternative markets
for lending and saving” – and Neobanks – “which offer highly accessible
yet purely online services that compete directly with retail banks” are new
forms of financial services available to Millennials that provide valuable
services without requiring consumers to have access to a physical banking
branch. Despite this rigorous competition, traditional banking remains
stable. "Even among Millennials, branches are still key, as 53 percent say
they visit a branch because they feel it is more secure and they seek more
personalized service, especially for their own personal finances" (Chang,
2014). However, the reality that Millennials are more inclined to use new
and alternative financial services and providers in comparison to previous
generations (Herbst-Murphy and Weed, 2015) deserves attention from
traditional banks in consideration of modifying their products to maintain
their competitive advantages in the current and future marketplace. The
objective of this study is not just collecting and compiling data, but also
developing empirical models that can be used to estimate the propensity
to utilize financial products and services that are associated with financial
institutions.
3 Hypotheses
Findings from previous survey reports have outlined the bank
characteristics that Millennials value, namely mobile banking, ethical
business practices, low fees, and low transactions costs. KPMG Capital

50 Banking Characteristics of Millennials
(2014) found four clear bank characteristics that Millennials in their
sample wanted: personalized service, a focus on convenience, being
progressive with social and technological advancement, and taking a
results-oriented approach to helping the Millennial bank client.
Pew Research Center (2015) stated that 84 percent of American adults
utilize the internet and that young adults are more inclined to use the
internet in comparison to previous generations. This has been a growing
trend, which the report has tracked from 2000 to 2015 and can be seen in
Figures 3 and 4. Gattiker and Stollemeir (1992) proposed that there is a
strong relationship between a person's age and the level of acceptance of
new technology. Millennials have grown up with wider access to the
internet, personal computers, and smartphones in comparison to previous
generations. The Board of Governors of the Federal Reserve System
(2014) suggested that an increase in smartphone use leads to an increase
in the usage of mobile banking services. Thus, a bank offering mobile and
online banking could have the potential to influence a Millennial’s choice
in using a given financial institution. We hypothesize that access to
mobile and online banking will have a significant impact on a Millennial’s
propensity to bank with a given banking entity.
Hypothesis 1 (H1): Millennials value mobile banking and online banking
more than previous generations do.
Hypothesis 1 relates Millennials’ banking habits to available technology.
To investigate this hypothesis, we employ several methods. Panel A of
Table 4 shows the mean of the variables of interest. In Panel A, we
conduct a difference in means tests for each of the generations measuring
Smartphone Use, Laptop Use, Use Mobile Banking, and Use Online
Banking. In addition, we conduct one-tailed tests to determine whether
the Millennial generation differs in Smartphone Use, Laptop Use, Use
Mobile Banking, and Use Online Banking. We employ one-sided tests to
determine if mobile banking is greater in the Millennial generation
compared to others. If the value is positive and significant, it indicates
that the Millennial response for any given variable is larger. The results
of Millennials and Generation X, Generation Z and X, Millennial and
Generation Z, and Smartphone Use, Laptop Use, and Use Mobile Banking
are positive and significant. Millennial and Generation Z and Use Online
Banking is positive and significant. Overall, the data shows significant
heterogeneity between generations at almost all levels.

Journal of Economic Cooperation and Development 51
In Panel B, we employ a probit regression with the dependent variable
being Mobile Banking Value and the independent variables being
Millennial, Generation X, and Baby Boomer. We specify two interaction
terms. The first independent variable is Use Laptop*Millennial . The
second independent variable is Use Smartphone* Millennial. We also
include controls for each generation. The final specification for Table IV
Panel B is reflected in Equation (1).
(1) 𝑀𝑜𝑏𝑖𝑙𝑒 𝐵𝑎𝑛𝑘𝑖𝑛𝑔 𝑉𝑎𝑙𝑢𝑒= 𝛽𝑐𝑜𝑛𝑡𝑟𝑜𝑙𝑠 𝑓𝑜𝑟 𝑔𝑒𝑛𝑒𝑟𝑎𝑡𝑖𝑜𝑛 + 𝛽𝐿𝑎𝑝𝑡𝑜𝑝 ∗𝑀𝑖𝑙𝑙𝑒𝑛𝑛𝑖𝑎𝑙
+ 𝛽𝑆𝑚𝑎𝑟𝑡𝑝ℎ𝑜𝑛𝑒 ∗ 𝑀𝑖𝑙𝑙𝑒𝑛𝑛𝑖𝑎𝑙 + 𝜖
Survey respondents were asked if they value mobile banking. From this
question, we create the variable Mobile Banking Value. Using this
response, we employ a second probit regression with additional controls
for both bank and individual characteristics. Those controls include Low
transaction costs and fees, ATM vicinity, Customer Service, Financial
Advising, Financial Coaching, Online Banking, Ethical Business
Practices, Community Involvement, and Networking Events. Our main
variable of interest is a Millennial indicator variable which equals 1 if the
respondent is a Millennial and zero otherwise. The final specification for
this model is shown in Equation (2).
(2)
𝑀𝑜𝑏𝑖𝑙𝑒 𝐵𝑎𝑛𝑘𝑖𝑛𝑔 𝑉𝑎𝑙𝑢𝑒 = ∝ +𝛽𝑚𝑖𝑙𝑙𝑒𝑛𝑛𝑖𝑎𝑙 + 𝛽𝐿𝑜𝑤 𝑐𝑜𝑠𝑡𝑠 𝑎𝑛𝑑 𝑓𝑒𝑒𝑠 + 𝛽𝐴𝑇𝑀 𝑣𝑖𝑐𝑖𝑛𝑖𝑡𝑦
+ 𝛽𝐶𝑢𝑠𝑡𝑜𝑚𝑒𝑟 𝑆𝑒𝑟𝑣𝑖𝑐𝑒 + 𝛽𝐹𝑖𝑛𝑎𝑛𝑐𝑖𝑎𝑙 𝐴𝑑𝑣𝑖𝑠𝑖𝑛𝑔
+ 𝛽𝐹𝑖𝑛𝑎𝑛𝑐𝑖𝑎𝑙 𝐶𝑜𝑎𝑐ℎ𝑖𝑛𝑔 + 𝛽𝑂𝑛𝑙𝑖𝑛𝑒 𝐵𝑎𝑛𝑘𝑖𝑛𝑔
+ 𝛽𝐸𝑡ℎ𝑖𝑐𝑎𝑙 𝐵𝑢𝑠𝑖𝑛𝑒𝑠𝑠 𝑃𝑟𝑎𝑐𝑡𝑖𝑐𝑒𝑠
+ 𝛽𝐶𝑜𝑚𝑚𝑢𝑛𝑖𝑡𝑦 𝐼𝑛𝑣𝑜𝑙𝑣𝑒𝑚𝑒𝑡 + 𝛽𝑁𝑒𝑡𝑤𝑜𝑟𝑘𝑖𝑛𝑔 + 𝜖
Hypothesis 2 (H2): Student loan debt hinders financial product
utilization.
For Hypothesis 2, we investigate the relationship between Millennials’
economic circumstances and financial product use. We categorize these
variables as “wealth formation” variables because they are products
generally associated with wealth formation. The literature shows
Millennials are affected by student loans in several ways. Millennials may
delay household formation, a major vessel of wealth, for a variety of

52 Banking Characteristics of Millennials
reasons. A major factor can be rising student loan debt. Rising college
costs are also keeping Millennials in co-residence with their parents
(Bleemer, Brown, Lee, and Van der Klaauw, 2014). In addition,
Millennials are choosing to have fewer children in comparison to previous
generations, due to increases in costs of living and day care (Astone,
Martin, and Peters, 2015).
We investigate Millennials’ relationship with banking using two methods.
To provide initial evidence we employ analysis of a difference in means
testing. Table III reports difference in mean testing for several survey
questions administered. The second method employs a probit regression
to investigate products associated with wealth formation, Mutual Funds,
Stocks, and Savings. We categorize the savings variable by the subject’s
propensity to save—Disagree, Somewhat Disagree, Neutral, Somewhat
Agree, Agree, and Strongly Agree. After adding controls for age, the final
specification is reflected in Equation (3).
(3) Student Loans =∝ + 𝛽𝑀𝑢𝑡𝑢𝑎𝑙 𝐹𝑢𝑛𝑑 + 𝛽𝑆𝑡𝑜𝑐𝑘𝑠 + 𝛽𝑆𝑎𝑣𝑖𝑛𝑔𝑠,𝑖
+ 𝛽𝐺𝑒𝑛𝑒𝑟𝑎𝑡𝑖𝑜𝑛 𝐶𝑜𝑛𝑡𝑟𝑜𝑙𝑠,𝑖 + 𝜖
Hypothesis 3 (H3): Millennials’ perceived financial knowledge affects
utilization of financial products and services.
For Hypothesis 3, we investigate the impact of perceived financial
knowledge on the interest in and utilization of financial products and
services by Millennials, Generation X, and Baby Boomers. Several terms
have been used interchangeably to refer to the concept of financial
knowledge throughout the extant literature. Huston (2010) found that
financial literacy and financial knowledge have been used synonymously
in previous academic literature, specifically 76 percent of the research
studies included in his paper’s sample. In contrast, Remund (2010) stated
that the academic literature concurrent with his paper considered financial
literacy to be a combination of financial knowledge, financial ability, and
skills. For the sake of clarity, we will solely use the term "financial
knowledge." The survey question assessing this factor states “What would
you consider to be your level of financial knowledge, overall?”

Journal of Economic Cooperation and Development 53
Increased access to the internet and technology has given Millennials the
opportunity to utilize social networks and research services and products
from financial institutions in a faster, possibly more efficient, manner,
which can impact their level of financial knowledge. Even though this
access to new technology may impact Millennials’ financial knowledge
level, Friedline and West (2015) have found that the financial capability
of Millennials is quite low, especially for low-income Millennials. Yet,
Millennials who have even taken personal finance classes at the university
level may not have higher levels of financial literacy due to lack of
motivation (Mandell and Klein, 2007). Gender differences have been
found to impact enthusiasm for learning personal finance topics (Chen
and Volpe, 2002). We examine the difference between the level of
perceived financial knowledge the Millennial asserts and the interest in
and utilization of financial products and services in this paper’s
administered survey. To test Hypothesis 3, we employ the following
probit regression seen in Equation (4):
(4) 𝑃𝑒𝑟𝑐𝑖𝑒𝑣𝑒𝑑 𝐹𝑖𝑛 𝐾𝑛𝑜𝑤𝑙𝑒𝑑𝑔𝑒 = ∝ + 𝛽𝑓𝑖𝑛𝑎𝑛𝑐𝑖𝑎𝑙 𝑝𝑟𝑜𝑑𝑢𝑐𝑡𝑠,𝑖 + 𝜖
4 Data and Results
National data regarding the ways in which financial institutions should
approach serving this new generation is collected using a survey
administered to potential Millennial banking clients through the survey
software Qualtrics. The survey was developed by referencing two
Generation Y surveys conducted by Azmi and Madden (2015a, 2015b).
Questions were added and updated to suit testing this study’s three
hypotheses, which assess bank characteristics, utilization of and interest
in financial products and services, and perceived financial knowledge.
The survey used in this study was administered to 468 total respondents.
The respondents consisted of university students, professors, young
professionals, and Amazon Mechanical Turks (AMT). Amazon
Mechanical Turks are Human Intelligence Task Workers who can be
contracted out to take surveys. AMTs have been included as respondents
for academic behavioral research studies (see Buhrmester, Kwang, &
Gosling, 2011). Paolacci and Chandler, J. (2014) states that "MTurk data
facilitates the collection of well-powered samples that, ceteris paribus,
better reflect the available workforce.”

54 Banking Characteristics of Millennials
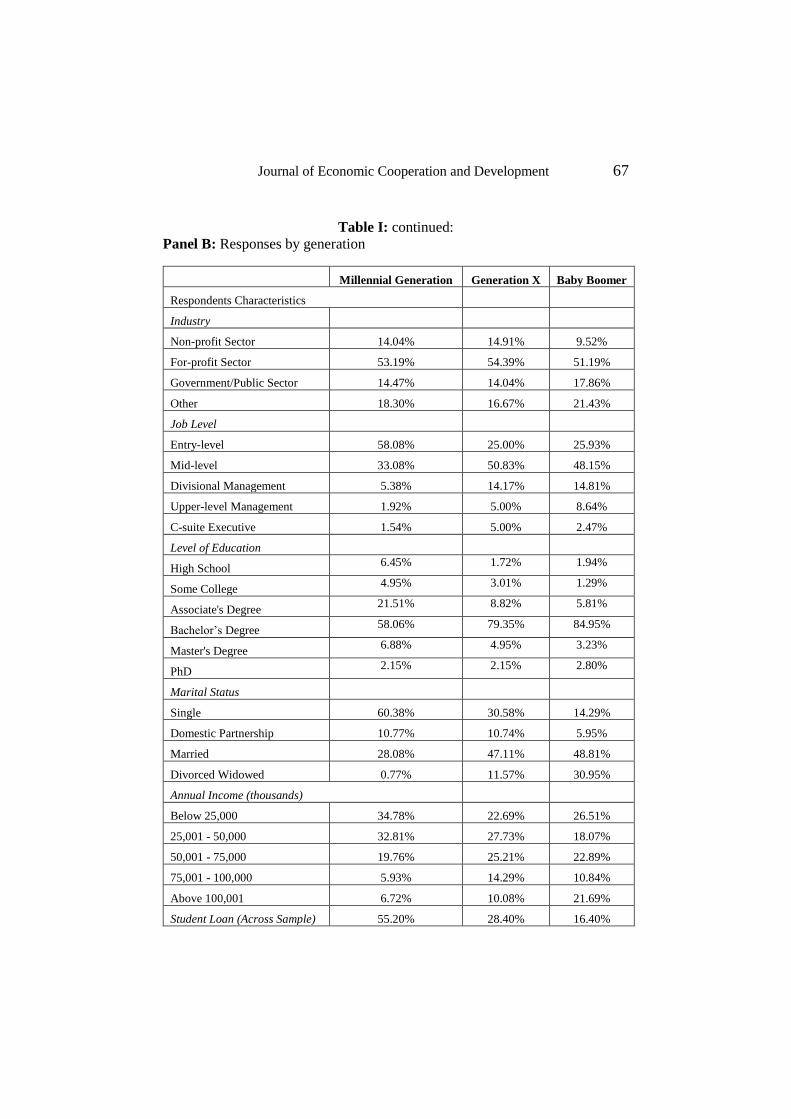
The total sample consists of 468 responses. Table I shows the
characteristics of the full survey sample, first with all generations and then
segmented by Millennials, Generation X, and Baby Boomers. The
majority of Millennials, Generation X, and Baby Boomers work in the
for-profit sector (49% of all generations and 53%, 54%, 51% for each
generation respectively). The majority of Millennials have annual income
below $50,000 (33% from $50,000 to $25,001 and 35% below $25,000).
This reflects the segmentation of labor in the workforce by generation.
For job-level, Millennials primarily are at entry-level (58%) and mid-
level (33%). Generation X and Baby Boomers are predominantly at mid-
level (51% and 48% respectively). For education level, 51 percent of
Millennials have an associate’s degree, 58.06 percent have a Bachelor’s
degree, 16 percent have a Master’s degree, and 12 percent had some
college but did not graduate. 43 percent of Generation X have an
associate's degree, and 24 percent have a Master's degree, which is a
greater percentage than both Millennials (16%) and Baby Boomers
(21%). For marital status, 60 percent of Millennials are single, and 28
percent are married. The plurality of Generation X is married at 47
percent, with 31 percent being single and 12 percent being
divorced/widowed. The plurality of Baby Boomers is married at 49
percent, with 31 percent being divorced/widowed. In addition, domestic
partnerships have almost doubled from the Baby Boomers to Generation
X from 6 to 11 percent and remained steady with Millennials at 11
percent.
Table II shows the descriptive statistics. The mean age of the full sample
is 37 years. More than half (56 percent) of the respondents are Millennials.
Generation X comprises 26 percent and Baby Boomers comprise 18
percent of the sample. The sample consists of 262 Millennial respondents,
with a mean age of 27 years. The mean number of dependents for
Millennials is 1.51, 2.09 for Generation X, and 1.87 for Baby Boomers.
The mean level of financial knowledge is 47.45 for Millennials, 49.74 for
Generation X, and 61.25 for Baby Boomers. The difference in financial
knowledge between Millennials and Generation X is relatively small, yet
there is a much larger difference in financial knowledge between
Generation X and Baby Boomers (difference of 11.51). This jump in
perceived financial knowledge from Generation X to Baby Boomers may
stem from Baby Boomers being more acclimated to personal finance and
financial planning for a longer period of time. Baek and DeVaney (2004)

Journal of Economic Cooperation and Development 55
have found that the majority of Baby Boomers are comfortable with
investing and have adequate investment and debt-to-asset ratios, which
may explain their heightened level of perceived financial knowledge.
Table III shows difference in means testing for some variables of interest.
We employ two-tailed testing to not to imply any specific direction for
the difference. Many of the differences across generations are significant.
We see the number of dependents is significant across generations,
reaching a peak for Generation X. We do not see a significant difference
between Millennials and Baby Boomers. Annual income seems to
increase with age from $46,320 for Millennials to $55,600 for Generation
X to $79,950 for Baby Boomers.
The number of relocations increases with each generation. However, if
we consider the number of relocations controlled for generation or age,
we can conclude that Millennials on average relocate more. Further
studies should include more analysis on this result. Lastly, perceived
financial knowledge provides interesting results; while it would seem that
perceived financial knowledge should increase with generation, we do not
see a significant difference between Millennials and Generation X. This
invites more analysis which we interpret in Hypothesis 3.
Hypothesis 1 is Millennials value mobile banking and online banking
more than previous generations. The results of the analysis are shown in
Table IV. This relationship between customers and technology is
important because of the increased frequency of mobile use. Table IV,
Panel A shows that there is greater use of smartphones by the Millennial
generation. Figure 3 and 4 illustrates how mobile banking is becoming
increasingly important. Figure 4 shows that while internet usage has
increased overtime, Millennials tend to use the internet in greater
proportions. Because of their familiarity with internet technology,
Millennials may value mobile and online technology more than other
generations.

56 Banking Characteristics of Millennials
Source: Pew Research Center Surveys 2000-2015
Source: Pew Research Center Surveys 2000-2015
To further investigate this relationship, we employ a probit model in Panel
B. The dependent variable is Mobile Banking Value and the independent
variables are control variables for Millennial, Generation X, and the Baby

Journal of Economic Cooperation and Development 57
Boomer generation. To investigate the interest of Millennials in online
and mobile banking, we employ two interaction terms Use Laptop *
Millennial and Use Smartphone * Millennial. The results show little
evidence that Millennials value online banking. However, the results
show that millennials have a strong preference for mobile banking.
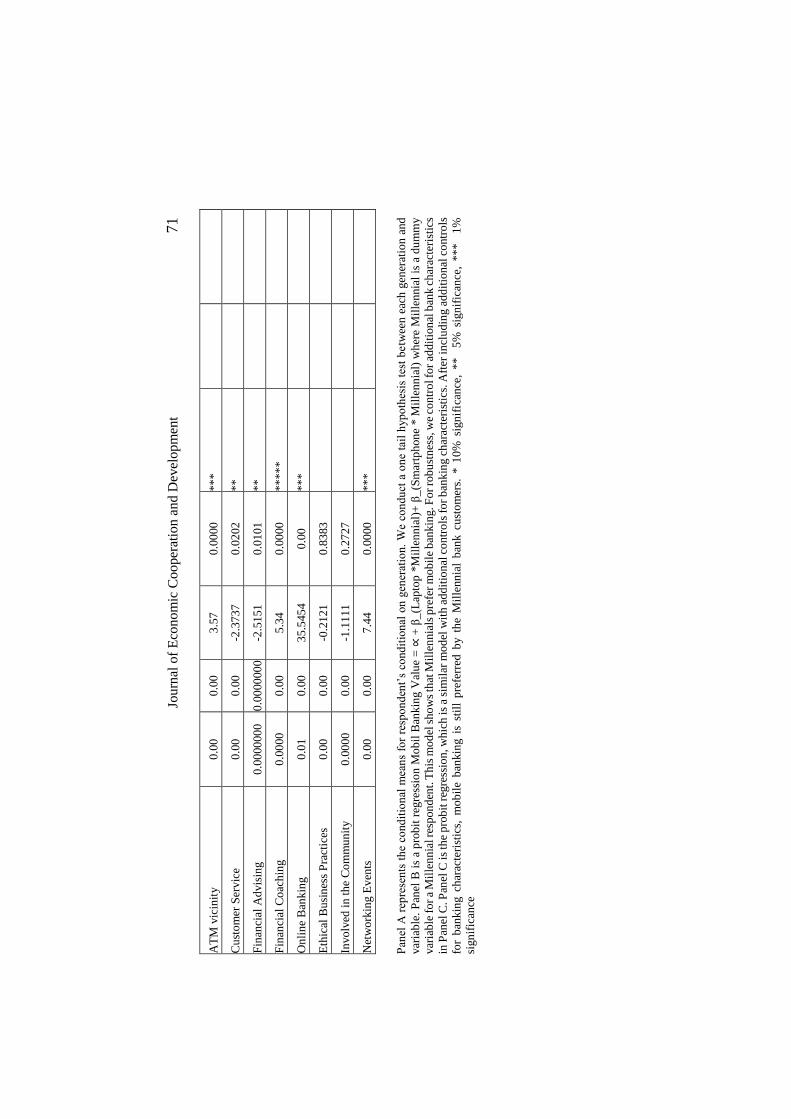
To further test this relationship, we employ a second probit model. This
model regresses Mobile Banking Value on several control variables and a
Millennial indicator variable. The model results reveal that, after
controlling for several other bank preferences, if Millennials prefer
mobile banking services. We expect a positive and significant coefficient
for the Millennial indicator variable. Table IV, Panel C displays the
results of this model. The results suggest that millennials prefer mobile
banking.
Hypothesis 2 is Student loan debt hinders financial product utilization.
Student loans have been shown to impact financial decisions such as
homeownership (Cooper and Wang, 2014; Houle and Berger, 2014). If
student loans are affecting the wealth formation of Millennials, then
demand for these financial products may also be affected.
To test this hypothesis, we employ a probit regression. The results can be
found in Table V. For the dependent variable, we use student loans. We
use the independent variables Use of Mutual Funds, Stock Investments,
and Savings. For savings, we use propensity to save and we control for
generation. We find that people who use mutual funds are less likely to
have student loans and those who do not use savings are more likely to
have student loans.
We use all response options for savings. The results indicate that when a
someone saves less, they are more likely to have student loans. These
results indicate that student loan debt may drive down use of traditional
financial products. If these financial products offer a greater rate of return
for financial institutions, this may become a problem in the future.
Hypothesis 3 is Millennials’ perceived financial knowledge affects
utilization of financial products and services. To test this hypothesis, we
employ a linear regression. For the dependent variable, we use perceived
financial knowledge. This number is calculated by asking respondents
their financial knowledge on a scale of 0 to 100. Subsequently, we use
58 Banking Characteristics of Millennials
this number as the dependent variable in a regression and include the use
of several financial products. Controlling for several financial products
allows us to determine if there is strong correlation between any financial
product and perceived financial knowledge. The results of the regression
are in Table VI.
Table VI shows that perceived financial knowledge is increasing between
generations except for Millennials and Generation X. Panel 1 reports the
results for only the Millennials subgroup. The relation between perceived
financial knowledge and financial products is relatively weak, apart from
stocks. The level of stock investment is positively related to perceived
financial knowledge. This would seem to indicate that financial
knowledge translates to more investments in the stock market.
We also investigate the relationship between perceived financial
knowledge and financial products for all generations. This regression tells
a similar story. Financial knowledge is not only remaining positively
related to stock investments, but also to mutual funds. The coefficient on
mutual funds is larger in magnitude to stock investment. We hypothesize
that greater financial knowledge is correlated with complex financial
products, such as stocks and mutual funds.
5 Conclusion
The findings of this study suggest that there are several ways that
Millennials differ from older and younger generations. This can be seen
from their marital status, education level, income, and adoption of new
technology. Results from the survey reflect that the majority of
Millennials are using laptops and online banking as well as smartphones
and mobile banking, yet prefer mobile banking over online banking due
to high smartphone usage. We determine that Millennials prefer mobile
to online banking. This relationship is unique to the Millennial generation.
Millennials’ economic circumstances, such as student loans, may prevent
them from consuming financial products generally associated with wealth
formation.
Millennials have lower levels of perceived financial knowledge in
comparison to Generation X and Baby Boomers. As perceived financial
knowledge grows, Millennials and other generations tend to invest in
complex financial products such as stocks and bonds. Previous studies
Journal of Economic Cooperation and Development 59
have found a relationship between financial education, financial literacy,
and beneficial financial outcomes (Fox, Bartholomae, and Lee, 2005;
Lusardi, 2003). Simplified training to improve knowledge of finance can
be effective at increasing financial literacy (Drexler, Fischer, and Schoar,
2014). Financial coaching may also be an effective way to increase
financial knowledge and literacy by providing individual support through
setting and monitoring goals (Collins and O'Rourke, 2010). Young
Americans may have limited financial literacy and rely heavily on debt
(Brown, Grigsby, van der Klaauw, Wen, and Zafar, 2016). Our study
reveals that over half of Millennials respondents are burdened with
student loan debt. Incorporating means of training Millennial consumers
may potentially increase financial literacy, thereby increasing perceived
financial knowledge, and ultimately improving debt repayment behavior.
The findings also reveal how much Millennials value mobile banking, as
they consider it to be the most important bank characteristic. Financial
institutions should adopt mobile and online banking services to garner
client interest from Millennials and members of Generation X. The
collected data and empirical results suggest ways in which financial
institutions can best approach serving the Millennial generation.
This study has limitations as well as potential extensions. A factor that
can affect Millennial utilization of financial products and services is risk
tolerance, which was not included in this study. Hallahan, Faff, and
McKenzie (2004) have found that there is a negative and significant
relationship between age and risk tolerance. The level of risk tolerance
associated with age may influence Millennials’ interest in and utilization
of financial products and services. This can be further explored in future
research. Perceived control over outcomes can affect an individual’s
propensity to save, maintain a budget, and control spending (Perry and
Morris, 2005). Measures to control for this should be added in future
studies. Also, perceived financial knowledge, not actual financial
knowledge, was addressed. Huston (2010) examined the various types of
measures used in academic literature to assess financial literacy. These
measures, administered through interviews and surveys, incorporated four
distinct content areas, namely the basics of money, borrowing, investing,
and resource protection. Pursuing a study that compares perceived
financial knowledge to actual knowledge would further extend the current
research literature.

60 Banking Characteristics of Millennials
References
Azmi, W. N. W. & Madden, R. (2015a), “Financial knowledge and
behaviour of Gen Y,” Asian Institute of Finance.
Azmi, W. N. W. & Madden, R. (2015b), “State of ethics in the financial
services industry,” Asian Institute of Finance.
Astone, N. M., Martin, S., & Peters, H. (2015, April), “Millennial
childbearing and the Recession,” Retrieved April 23, 2016, from
http://www.urban.org/sites/default/files/alfresco/publication-
pdfs/2000203-Millennial-Childbearing-and-the-Recession.pdf
Urban Institute.
Baek, E., & DeVaney, S. A. (2004), “Assessing the Baby Boomers'
financial wellness using financial ratios and a subjective
measure,” Family and Consumer Sciences Research Journal, 32, 321-
348.
Bleemer, Z., Brown, M., Lee, D., & Van der Klaauw, W. (2014), “Debt,
jobs, or housing: What's keeping millennials at home?,” FRB of New York
Staff Report, 700.
Board of Governors Of The Federal Reserve System. (2014), “Consumers
and mobile financial services 2014,” Retrieved October 2016.
http://www.federalreserve.gov/econresdata/consumers-and-mobile-
financial-services-report-201403.pdf
Boumphrey, S. (2012), “Special Report: The World's youngest
populations,” Retrieved October 28, 2016, from http://blog. Euro
monitor.com/2012/02/special-report-the-worlds-youngest-
populations.html
Brown, M., Grigsby, J., Van der Klaauw, W., Wen, J., & Zafar, B. (2016),
“Financial education and the debt behavior of the young,” Review of
Financial Studies, hhw006.
Buhrmester, M. D., Kwang, T., & Gosling, S. D. (2011), “Amazon's
Mechanical Turk: A new source of inexpensive, yet high quality data,”
Perspectives on Psychological Science, 6, 3–5.

Journal of Economic Cooperation and Development 61
Chang, E. (2014), “Do Millennials really want to eliminate banks?”.
MainStreet.
Chen, H., & Volpe, R. P. (1998),” An analysis of personal financial
literacy among college students,” Financial Services Review, 7, 107-128.
Chen, H., & Volpe, R. P. (2002), “Gender differences in personal
financial literacy among college students,” Financial Services Review, 11,
289-307.
Collins, J. M. & O’Rourke, C. M. (2010), “Financial education and
counseling – still holding promise,” Journal of Consumer Affairs, 44,
483–489.
Cooper, D., & Wang, J. C. (2014), “Student loan debt and economic
outcomes. Current policy perspective No. 14-7,” Federal Reserve Bank
of Boston.
Council of Economic Advisers (2014), “15 Economic facts about
Millennials,” whitehouse.gov. Retrieved October 28, 2016, from
https://www.whitehouse.gov/sites/default/files/docs/millennials_report.p
df
Cudmore, B. A., Patton, J., Ng, K., & McClure, C. (2010), “The
millennials and money management,” Journal of Management and
Marketing Research, 4, 1-28.
Delcampo, R. G., Haggerty, L. A., Haney, M. J., & Knippel, L. A.
(2011),” Managing the multi-generational workforce,” Surrey, UK &
Burlington, VT: Gower.
Dohm, A. (2000), “Gauging the labor force effects of retiring baby-
boomers,” Monthly Lab. Rev., 123, 17.
Drexler, A., Fischer, G., & Schoar, A. (2014), “Keeping it simple:
Financial literacy and rules of thumb,” American Economic Journal:
Applied Economics, 6, 1-31.
Fox, J. J., Bartholomae S., and Lee, J. (2005), “Building the case for
financial education,” Journal of Consumer Affairs, 39, 195–214.

62 Banking Characteristics of Millennials
Friedline, T., & West, S. (2015), “Financial education is not enough:
Millennials may need financial capability,” Kansas State University
School of Social Welfare Research Brief.
Fry, R. (2015), “Millennials surpass Gen Xers as the largest generation in
U.S. labor force,” Retrieved October 28, 2016, from http://www.
pewresearch.org/fact-tank/2015/05/11/millennials-surpass-gen-xers-as-
the-largest-generation-in-u-s-labor-force/
Gattiker, U. E., & Stollenmaier, R. S. (Eds.). (1992), Technology-
mediated communication: Technological innovation and human
resources (Vol. 3), Oxford: Walter De Gruyter.
Hallahan, T. A., Faff, R. W., & McKenzie, M. D. (2004), “An empirical
investigation of personal financial risk tolerance,” Financial Services
Review,13, 57.
Hassan, M. K., & Lawrence, S. (2001). Retirement Savings: Similarities
and Differences between Men & (and) Women in Their Forties. J.
Retirement Plan., 4, 27.
Hassan, M.K., & Lawrence, S. B. (2011). Retirement savings of the hip
generation: A study of retirement preparation among individuals in their
fifties. Southwestern Economic Review, 34, 115-130.
Herbst-Murphy, S., & Weed, G. (2014), “Millennials with money: A new
look at who uses GPR prepaid cards,” FRB of Philadelphia-Payment
Cards Center Discussion Paper, (14-3).
Herbst-Murphy, S., & Weed, G. (2015), “Millennials with money
revisited: Updates from the 2014 Consumer Payments Monitor,” FRB of
Philadelphia Payment Cards Center Discussion Paper, (15-6).
Houle, J., & Berger, L. (2014), “Is student loan debt discouraging home
buying among young adults,” Association for Public Policy and
Management.
Houle, J. N. (2013), “Disparities in debt parents’ socioeconomic resources
and young adult student loan debt,” Sociology of Education,
0038040713512213.

Journal of Economic Cooperation and Development 63
Hussain, Mahmood, and Wong. The online banking behavior of
Generation Y (January 14, 2015). XIV International Business and
Economy Conference Bangkok, Thailand, January 5-8, 2015. Available
at SSRN: [G1] [G2] http://ssrn.com/abstract=2549898 or
http://dx.doi.org/10.2139/ssrn.2549898[G3]
Huston, S. J. (2010), “Measuring financial literacy,” Journal of Consumer
Affairs, 44, 296-316.
Johnson, S.D., & Larson, S.J. (2009), “Millennials: Strategies for
financial planning with a new generation,” Journal of Financial Planning,
22, 65-71
Kim, H., & DeVaney, S. (2016), “Banking Behavior Among the
Millennials,” Consumer Interests Annual, 62.
Kern, S. (2016), “Falling behind to get ahead: The Millennial student debt
trap?,” ABA Banking Journal, 108, 30.
KPMG Capital (2014), “Banking on the future: The expectations of the
Gen Y professional,” Retrieved from https://www.kpmg.com/AU/
en/IssuesAndInsights/ArticlesPublications/banking-on-the-
future/Documents/banking-on-the-future-2015-report.pdf
Lee, Yun Doo, Hassan, M.K., and Lawrence S. (2016b), “Are There any
Differences between the Hippies Cohort and X&Y Cohort Regarding
Adequate Preparation for Retirement,” Paper Presented at the 2016
Academy of Financial Services Annual Meetings, Las Vegas, Nevada,
October 20-21, 2016.
Lee, Yun Doo, Hassan, M.K., and Lawrence S. (2016b). “An Analysis of
Financial Preparation for Retirement: A Study of Retirement Preparation
of Men and Women in Their Positive Savings Periods,” Paper Presented
at the 2016 Academy of Financial Services Annual Meetings, Las Vegas,
Nevada, October 20-21, 2016.
Levenson, A. R. (2010), “Millennials and the world of work: An
economist’s perspective,” Journal of Business and Psychology, 25, 257-
264.
64 Banking Characteristics of Millennials
Lusardi, A. (2003), “Saving and the Effectiveness of Financial
Education,” PRC Working Paper 2003-14. Retrieved from
http://rider.wharton.upenn.edu/∼prc/PRC/WP/WP2003-14.pdf
Mandell, L., & Klein, L. S. (2007), “Motivation and financial literacy,”
Financial Services Review, 16, 105
Mason, W., & Suri, S. (2012), “Conducting behavioral research on
Amazon’s Mechanical Turk,” Behavior research methods, 44(1), 1-23.
Mateescu, A. (2015, June 1), “Peer-to-Peer Lending,” Retrieved October
8, 2016, from http://datasociety.net/pubs/dcr/PeertoPeerLending.pdf
Nava, M., Karp, N., and Nash-Stacey, B. (2014), “The Millennials
paradox,” US Banking Watch, BBVA Research.
Paquette, D. (2014), “Student loan refinancing will save you money — if
you don't actually need it,” Retrieved October 08, 2016, from
https://www.washingtonpost.com/news/storyline/wp/2014/10/15/student
-loan-refinancing-will-save-you-money-if-you-dont-actually-need-it/
Paolacci, G., & Chandler, J. (2014), “Inside the Turk: Understanding
Mechanical Turk as a participant pool,” Current Directions in
Psychological Science, 23(3), 184-188.
Perry, M. (2015), “Finding Middle Ground: Expectations of and
Enrollment Strategies for Millennial Students,” College and
University, 90(3), 39.
Perry, V. G., & Morris, M. D. (2005), “Who is in control? The role of
self‐perception, knowledge, and income in explaining consumer financial
behavior,” Journal of Consumer Affairs, 39, 299-313.
Pew Research Center (2014), “Millennials in adulthood,” Retrieved
October 28, 2016, from http://www.pewsocialtrends.org/2014/03/07/
millennials-in-adulthood/
Rambocas, M., & Arjoon, S. (2012), “Using diffusion of innovation
theory to model customer loyalty for internet banking: A millennial
perspective,” International Journal of Business and Commerce, 1, 1-14.

Journal of Economic Cooperation and Development 65
Remund, D. L. (2010), “Financial literacy explicated: The case for a
clearer definition in an increasingly complex economy,” Journal of
Consumer Affairs, 44, 276-295.
Shapiro, D. N., Chandler, J., & Mueller, P. A. (2013), “Using Mechanical
Turk to study clinical populations,” Clinical Psychological Science, 1(2),
213-220.
Sprouse, J. (2011), “A validation of Amazon Mechanical Turk for the
collection of acceptability judgments in linguistic theory,” Behavior
research methods, 43(1), 155-167.
Wey Smola, K., & Sutton, C. D. (2002), “Generational differences:
Revisiting generational work values for the new millennium,” Journal of
Organizational Behavior, 23, 363-382

66 Banking Characteristics of Millennials
Appendix A: Profile of Survey sample, Descriptive Statistics and
Regression Tables
Table I: Characteristics of All Generations of the Survey Sample
Panel A:
Respondents Characteristics Number of Respondents % of Sample
All Generations
Industry
Non-profit Sector 58 12%
For-profit Sector 230 49%
Government/Public Sector 65 14%
Other 80 17%
Job Level
Entry-level 202 43%
Mid-level 186 40%
Divisional Management 43 9%
Upper-level Management 18 4%
C-suite Executive 12 3%
Level of Education
High School 47 10.11%
Some College 43 9.25%
Associate's Degree 168 36.13%
Bachelor’s Degree 104 22.37%
Masters' Degree 70 15.05%
PhD 33 7.10%
Marital Status
Single 206 44%
Domestic Partnership 46 10%
Married 171 37%
Divorced Widowed 42 9%
Annual Income (thousands)
Below 25,000 137 29%
25,001 - 50,000 131 28%
50,001 - 75,000 99 21%
75,001 - 100,000 41 9%
Above 100,001 47 10%
Student Loan 250 53%
Data was taken from the 2015-2016 Qualtrics survey administered in this study. The results
include the characteristics of all generations and segmented by Millennials, Generation X, and
Baby Boomers for the respondents in the survey. Table I represents summary statistics for the
survey. Panel A represents survey responses in aggregate, and Panel B represents responses in
proportion to each generation.
Journal of Economic Cooperation and Development 67
Table I: continued:
Panel B: Responses by generation
Millennial Generation Generation X Baby Boomer
Respondents Characteristics
Industry
Non-profit Sector 14.04% 14.91% 9.52%
For-profit Sector 53.19% 54.39% 51.19%
Government/Public Sector 14.47% 14.04% 17.86%
Other 18.30% 16.67% 21.43%
Job Level
Entry-level 58.08% 25.00% 25.93%
Mid-level 33.08% 50.83% 48.15%
Divisional Management 5.38% 14.17% 14.81%
Upper-level Management 1.92% 5.00% 8.64%
C-suite Executive 1.54% 5.00% 2.47%
Level of Education
High School 6.45% 1.72% 1.94%
Some College 4.95% 3.01% 1.29%
Associate's Degree 21.51% 8.82% 5.81%
Bachelor’s Degree 58.06% 79.35% 84.95%
Master's Degree 6.88% 4.95% 3.23%
PhD 2.15% 2.15% 2.80%
Marital Status
Single 60.38% 30.58% 14.29%
Domestic Partnership 10.77% 10.74% 5.95%
Married 28.08% 47.11% 48.81%
Divorced Widowed 0.77% 11.57% 30.95%
Annual Income (thousands)
Below 25,000 34.78% 22.69% 26.51%
25,001 - 50,000 32.81% 27.73% 18.07%
50,001 - 75,000 19.76% 25.21% 22.89%
75,001 - 100,000 5.93% 14.29% 10.84%
Above 100,001 6.72% 10.08% 21.69%
Student Loan (Across Sample) 55.20% 28.40% 16.40%

68 Banking Characteristics of Millennials
Table II: Summary Statistics
Mean Median Standard Deviation
Variable
All Generations n = 468
Age 36.74 33 13.34
Number of Dependents 1.73 1 1.11
Annual Income (thousands) 54.89 40 63.42
Number of Relocation 7.11 5 6.06
Financial Knowledge 50.56 55 26.03
Millennial Generation n = 262
Age 27.36 28 4.06
Number of Dependents 1.51 1 0.93
Annual Income (thousands) 46.32 31 55.97
Number of Relocation 3.62 4 4.20
Financial Knowledge 47.45 51 27.31
Generation X n = 122
Age 40.93 40 4.78
Number of Dependents 2.09 2 1.29
Annual Income (thousands) 55.61 46.5 47.10
Number of Relocation 3.54 6 6.07
Financial Knowledge 49.74 53.5 23.69
Baby Boomer n = 84
Age 59.93 59.5 8.24
Number of Dependents 1.87 1 1.24
Annual Income (thousands) 79.95 55.5 92.14
Number of Relocation 4.00 10 8.20
Financial Knowledge 61.25 63.5 25.13
Data was taken from the 2015-2016 Qualtrics survey administered in this study. The
results include the characteristics of all generations and segmented by Millennials,
Generation X, and Baby Boomers for the respondents in the survey.

Journ
al o
f E
conom
ic C
ooper
atio
n a
nd D
evel
opm
ent
69
Tab
le I
II:
Tw
o-t
aile
d t
-tes
ts o
f m
eans
Dat
a w
as t
aken
fro
m t
he
20
15
-20
16 Q
ual
tric
s su
rvey
ad
min
iste
red
in
th
is s
tud
y.
We
test
th
e m
ean
to
det
erm
ine
dif
fere
nce
s b
etw
een
gen
erati
on
s. T
he
left
mo
st c
olu
mn
s re
pre
sen
t th
e co
ndit
ion
al m
ean
s fr
om
res
po
nd
ent
answ
ers.
Th
e ri
gh
tmo
st c
olu
mn
s re
pre
sen
t th
e ab
solu
te d
iffe
ren
ce o
f th
e co
nd
itio
nal
mea
ns.
Sig
nif
ican
ce w
as c
alcu
late
d u
sin
g t
wo
-tai
led
P-v
alu
es.
Th
e re
sult
s sh
ow
res
pon
ses
var
y b
y g
ener
atio
n i
n t
he
sam
ple
.
* 1
0%
sig
nif
ican
ce,
**
5%
sig
nif
ican
ce,
***
1%
sig
nif
ican
ce
Mea
n
Ab
solu
te D
iffe
ren
ce
Mil
len
ni
al
Gen
X
Ba
by
Bo
om
ers
|Mil
len
nia
l -
Gen
X|
|Mil
len
nia
l -
Ba
by
Bo
om
ers|
|Ba
by
Boo
mer
s -
Gen
X|
Va
ria
ble
Ag
e 2
7.3
5
40
.92
59
.92
13
.57
**
*
32
.57
**
*
19
.00
**
*
Nu
mb
er o
f D
epen
den
ts
1.5
0
2.0
9
1.8
6
0.5
8
**
*
0.3
6
**
0
.22
An
nu
al
Inco
me
(th
ou
san
ds)
4
6.3
2
55
.61
79
.95
9.2
8
**
*
33
.63
**
*
24
.34
**
Nu
mb
er o
f R
elo
cati
on
3.6
1
3.5
4
4.0
0
0.0
8
**
*
0.3
8
**
*
0.4
6
**
*
Fin
an
cia
l K
no
wle
dg
e 4
7.4
4
49
.74
61
.25
2.3
0
1
3.8
0
**
*
11
.51
**
*

70 B
ankin
g C
har
acte
rist
ics
of
Mil
lennia
ls
Ta
ble
IV
: H
ypoth
esis
1 T
est
Res
ult
s fr
om
Dif
fere
nce
s in
Mea
ns
and P
robit
Reg
ress
ion
Pan
el A
: M
ean
s
Mea
n
Dif
fere
nce
in
Mea
ns
Tes
tin
g
M
ille
nn
ial
Gen
X
Ba
by
Bo
om
ers
Mil
len
nia
l >
Gen
Z M
ille
nn
ial
> G
en X
G
en Z
> G
en X
M
ille
nn
ial
> G
en Z
Sm
artp
ho
ne
use
0
.96
0.9
2
0.7
9
0.0
6***
0
.11
***
0
.11
***
0
.06
***
Lap
top
use
6
.14
6.0
8
5.9
2
-0.0
3*
0.0
5***
0
.05
***
-0
.03
Use
Mo
bil
e B
ankin
g
0.7
5
0.5
5
0.3
4
0.2
***
0.2
1***
0
.21
***
0
.2***
Use
On
lin
e b
ankin
g
0.7
4
0.6
6
0.6
1
0.0
8**
0.0
3
0.0
3
0.0
8**
Pan
el B
: P
rob
it R
egre
ssio
n
Dep
end
ent:
Mob
ile
Ba
nki
ng
Va
lue
Coef
fici
en
t S
E
t-st
at
p-v
alu
e
Mil
len
nia
l -0
.87
87
0.5
757
-1.5
151
0.1
313
Gen
X
0.1
2
0.1
1
1.1
3
0.2
6
Bab
y B
oo
mer
-0
.44
0.1
4
-3.2
4
0.0
0
**
*
Use
Lap
top
* M
ille
nn
ial
-0.1
111
0.4
646
-0.2
525
0.8
080
Use
Sm
artp
ho
ne
* M
ille
nn
ial
1.7
272
0.5
252
3.3
232
0.0
0
**
*
Pan
el C
: P
rob
it R
egre
ssio
n
Dep
end
ent:
Mob
ile
Ba
nki
ng
Va
lue
Coef
fici
en
t S
E
t-st
at
p-v
alu
e
Inte
rcep
t -1
.13
13
0.0
303
-37
.353
5
0.0
000
**
*
Mil
len
nia
l 0
.12
12
0.0
101
12
.23
0.0
000
**
*
Lo
w t
ran
sact
ion
co
sts
and
fee
s 0
.00
0.0
0
-5.5
454
0.0
000
00
**
*
Journ
al o
f E
conom
ic C
ooper
atio
n a
nd D
evel
opm
ent
7
1
Pan
el A
rep
rese
nts
th
e co
nd
itio
nal
mea
ns
for
resp
on
den
t’s
cond
itio
nal
on
gen
erat
ion.
We
con
du
ct a
on
e ta
il h
yp
oth
esis
tes
t b
etw
een
eac
h g
ener
atio
n a
nd
var
iab
le.
Pan
el B
is
a p
rob
it r
egre
ssio
n M
ob
il B
ankin
g V
alu
e =
∝ +
β_
(Lap
top
*M
ille
nn
ial)
+ β
_(S
mar
tph
on
e * M
ille
nn
ial)
wh
ere
Mil
len
nia
l is
a d
um
my
var
iab
le f
or
a M
ille
nn
ial re
spon
den
t. T
his
mo
del
sh
ow
s th
at M
ille
nnia
ls p
refe
r m
ob
ile
ban
kin
g. F
or
rob
ust
nes
s, w
e co
ntr
ol fo
r ad
dit
ion
al b
ank c
har
acte
rist
ics
in P
anel
C. P
anel
C is
the
pro
bit
reg
ress
ion
, w
hic
h is
a si
mil
ar m
od
el w
ith
ad
dit
ion
al c
ontr
ols
fo
r b
ankin
g c
har
acte
rist
ics.
Aft
er in
clu
din
g a
dd
itio
nal
co
ntr
ols
for
ban
kin
g c
har
acte
rist
ics,
mo
bil
e b
ankin
g i
s st
ill
pre
ferr
ed b
y t
he
Mil
lenn
ial
ban
k c
ust
om
ers.
* 1
0%
sig
nif
ican
ce,
**
5%
sig
nif
ican
ce,
***
1%
sign
ific
ance
AT
M v
icin
ity
0.0
0
0.0
0
3.5
7
0.0
000
**
*
Cu
sto
mer
Ser
vic
e
0.0
0
0.0
0
-2.3
737
0.0
202
**
Fin
anci
al A
dvis
ing
0.0
000
00
0
0.0
000
00
0
-2.5
151
0.0
101
**
Fin
anci
al C
oac
hin
g
0.0
000
0.0
0
5.3
4
0.0
000
**
**
*
On
lin
e B
ankin
g
0.0
1
0.0
0
35
.545
4
0.0
0
**
*
Eth
ical
Bu
sin
ess
Pra
ctic
es
0.0
0
0.0
0
-0.2
121
0.8
383
Invo
lved
in t
he
Co
mm
un
ity
0
.00
00
0.0
0
-1.1
111
0.2
727
Net
wo
rkin
g E
ven
ts
0.0
0
0.0
0
7.4
4
0.0
000
**
*

72 B
ankin
g C
har
acte
rist
ics
of
Mil
lennia
ls
Tab
le V
: H
ypoth
esis
2 R
esult
s fr
om
Pro
bit
Reg
ress
ion
Dep
end
ent:
Stu
den
t L
oans
Co
effi
cien
t S
tan
da
rd E
rro
r
t-S
tat
p-v
alu
e
(Inte
rcep
t)
-0.8
1
0.4
4
-1.8
3
0.0
7
*
Use
Mutu
al F
und
-0
.41
0
.26
-1.5
4
0.1
0
*
Invest
in S
tock
s 0
.36
0.2
5
1.4
4
0.1
5
Sav
ings|
Dis
agre
e
1.3
6
0.4
7
2.8
9
0.0
0
**
*
Sav
ings|
So
mew
hat
Dis
agre
e
1.7
7
0.3
9
4.5
3
0.0
0
**
*
Sav
ings|
Neu
tral
1
.79
0.4
4
4.0
7
0.0
0
**
*
Sav
ings|
So
mew
hat
Agre
e
-0.0
01
0.5
16
2.3
96
0.0
2
**
Sav
ings|
Agre
e
-0.0
03
0.4
035
2.9
97
0.0
0
**
Sav
ings|
Str
on
gly
Agre
e
-0.8
1
0.4
4
-1.8
3
0.0
7
*
Tab
le V
rep
rese
nts
a p
rob
it m
od
el w
ith s
tud
ent
loan
s as
the
dep
end
ent
var
iab
le a
nd
wea
lth
fo
rmat
ion p
rod
uct
s as
ind
epend
ent
var
iab
les.
Gen
erat
ion c
on
tro
ls a
re a
lso
in
clud
ed.
The
resu
lts
sho
w t
hat
a r
esp
ond
ent
who
invest
s in
mutu
al
fund
s an
d h
as
savin
gs
is l
ess
likel
y t
o
hav
e st
ud
ent
loan
s. *
10
% s
ignif
ican
ce,
**
5%
sig
nif
icance
, **
*
1%
sig
nif
icance

Journal of Economic Cooperation and Development 73
Table VI: Hypothesis 3
Panel 1: Millennial Generation Only Dependent: Perceived Financial Knowledge Coefficient Standard Error T-Stat P-value (Intercept) 44.85 6.80 6.60 0.00 ***
Savings Accounts -1.97 4.31 -0.46 0.65 Fixed Deposit Accounts 5.44 5.09 1.07 0.29 Credit Cards 1.74 4.14 0.42 0.67 Debit Cards -6.14 7.72 -0.80 0.43 Mutual Funds 5.70 5.43 1.05 0.29 Mortgage (Property, Land) 4.94 4.69 1.05 0.29 Construction Loan 8.62 13.86 0.62 0.53 Auto Loan -0.12 4.18 -0.03 0.98 Student Loan 1.07 3.52 0.31 0.76 Insurance 2.83 4.16 0.68 0.50 Pension Funds -0.99 5.87 -0.17 0.87 Mortgage Refinance 1.76 8.86 0.20 0.84 Stocks 9.92 5.16 1.92 0.06 **
Bonds -5.84 6.44 -0.91 0.37 IRA 5.02 5.05 0.99 0.32 Credit Lines -1.27 4.59 -0.28 0.78 Certificate of Deposit 4.54 5.75 0.79 0.43 Panel 2: Full Sample
Dependent: Perceived Financial Knowledge Coefficient Standard Error T-Stat P-value (Intercept) 46.25 4.39 10.53 0.00 ***
Savings Accounts 0.34 3.13 0.11 0.91 Fixed Deposit Accounts 1.66 3.04 0.55 0.59 Credit Cards 3.26 3.19 1.02 0.31 Debit Cards -9.13 4.55 -2.01 0.05 *
Mutual Funds 10.61 3.36 3.16 0.00 **
Mortgage (Property, Land) 4.33 3.00 1.44 0.15 Construction Loan 3.36 5.03 0.67 0.50 Auto Loan -0.68 2.90 -0.24 0.81 Student Loan 2.05 2.41 0.85 0.40 Insurance -0.08 3.29 -0.02 0.98 Pension Funds -1.80 3.22 -0.56 0.58 Mortgage Refinance -2.05 3.72 -0.55 0.58 Stocks 8.29 3.42 2.42 0.02 *
Bonds 0.66 3.66 0.18 0.86 IRA 1.76 3.14 0.56 0.58 Credit Lines -1.32 2.88 -0.46 0.65 Certificate of Deposit 3.36 3.27 1.03 0.30
Table VI is an investigation into how the use of financial products is affected by perceived
financial knowledge. Panel A is a subset of only Millennials, and Panel B represents the full
sample. Results show that as perceived financial knowledge increases so does use of complex
financial products (Stocks and Mutual Funds).
* 10% significance, ** 5% significance, *** 1% significance