Embed Size (px)
Citation preview
MONTHLYBULLETIN
BANKASLOVENIJE
March, 2002Vol. 11 No. 3
BANK OF SLOVENIA
4
BANKA SLOVENIJE
Monthly Bulletin
Published by: BANK OF SLOVENIA Slovenska 35, 1000 Ljubljana Slovenia
tel.: +386 (1) 4719000fax.: +386 (1) 2515516Telex: 31214 BS LJB SIE-mail: [email protected]://www.bsi.si/SWIFT: BSLJ SI 2X
Publication and other public use of data from this publication ispermitted subject to statement of the source.Publication is available on the Web.For PGP key see last page.
ISSN 1318-0770
Printed by: Geodetski inštitut Slovenije, Ljubljana
Ta publikacija je na voljo tudi v slovenščini.
Mr. Janez KOŠAK, Vice GovernorMr. Janez FABIJAN, Financial StatisticsMr. Uroš ČUFER, Analaysis & Research DepartmentMrs. Danica PRELOVŠEK, Central Banking OperationsMr. Janko TRATNIK, International Department
Ljubljana, April 23, 2002
Editorial Board:

5
BANKA SLOVENIJE
Monthly Bulletin
TABLE OF CONTENTS
REPUBLIC OF SLOVENIA:General Information 6
REVIEW OF CURRENT DEVELOPMENTS (Graphs) 7 Real Sector
Public FinanceExternal Transactions
Money and Banks Financial Markets
STATISTICAL TABLES 19Money and Banks 21Financial Markets 38Balance of Payments and External Position 56Real Sector 71
Public Finance 76
BANKING INSTITUTIONS IN SLOVENIA 79
NOTES ON METHODOLOGY 87
ADVANCE RELEASE CALENDAR 101

6
BANKA SLOVENIJE
Monthly Bulletin
REPUBLIC OF SLOVENIA:GENERAL INFORMATION
2000 2001 2002
latest actual
Area (sq.km) 20,273 20,273 20,273
Population 1,990,094 1,992,969 1,992,969
Population growth (in %) 0.12 0.07 0.07
Density (persons/sq.km) 98 98 98
Population of Ljubljana 270,506 … …
Origin of value added (in %):
Agriculture 3.3 … …
Industry 31.4 … …
Construction 6.0 … …
Services 59.3 … …
GDP real annual change (in %) 4.6 3.0 …
Industrial production annual change (in %) 6.2 2.9 4.1
Total employment annual change (in %) 1.7 1.7 1.5
Standardised unemployment rate (in %) 7.0 6.4 …
Inflation rate (in %) 8.9 7.0 7.6
General government:
revenue (as % of GDP) 42.7 43.0 …
surplus/deficit ( as % of GDP) -1.4 -1.4 …
Trade balance (in USD million) -1,081 -621.7 745.4
Current account (in USD million) -594 -66.9 29.1
Current account receipts as % of GDP 62.9 … …
Foreign exchange reserves (in USD million) 4,370 5,740.4 5,688.2
Foreign debt (in USD million) 6,217 6,717.0 6,633.0
Debt servicing ratio (in %) 9.1 … …
Currency unit: Slovenian tolar (SIT)
Latest BS exchange rates: tolars for 1 USD 253.0949
(April 23, 2002) tolars for 1 EUR 224.7230

7
BANKA SLOVENIJE
Monthly Bulletin
REVIEW OF CURRENTDEVELOPMENTS: GRAPHS
1. Real Sector2. Public Finance3. External Transactions4. Money and Banks5. Financial Markets
8
BANKA SLOVENIJE
Monthly Bulletin

9
BANKA SLOVENIJE
Monthly Bulletin
1.1. GROSS DOMESTICPRODUCT
1995 = 100(seasonally adjusted)
* Real GDP* Real Value Added:
- Construction- Trade- Transport
Source: Tables 4.2.,4.7. and suplementary data
1.2. INDUSTRY
1992 = 100(seasonally adjusted)
* Output* Employment* Productivity
Source: Table 4.3.
1.3. TRAVEL
Annual growth rates (y/y) in %
* Overnights, foreign* Border crossings, foreign
Source: Table 4.4.
THE
REAL
SECTOR
10
BANKA SLOVENIJE
Monthly Bulletin
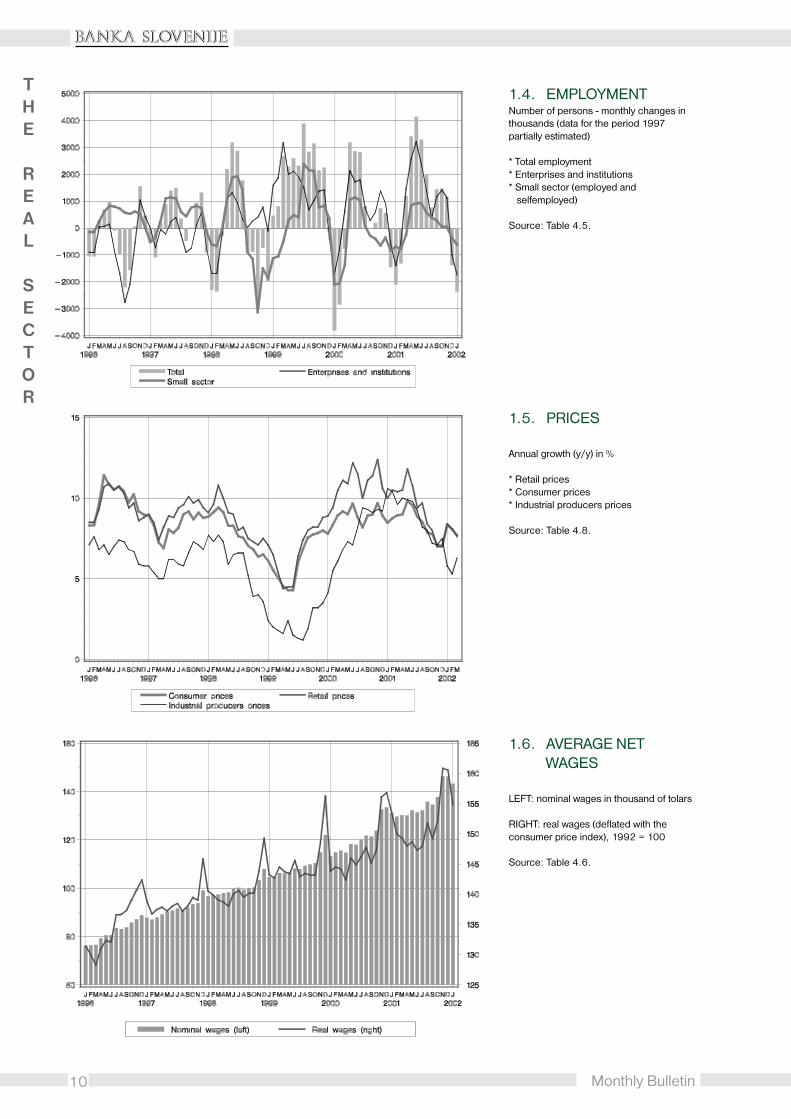
1.4. EMPLOYMENTNumber of persons - monthly changes inthousands (data for the period 1997partially estimated)
* Total employment* Enterprises and institutions* Small sector (employed and selfemployed)
Source: Table 4.5.
1.5. PRICES
Annual growth (y/y) in %
* Retail prices* Consumer prices* Industrial producers prices
Source: Table 4.8.
1.6. AVERAGE NET WAGES
LEFT: nominal wages in thousand of tolars
RIGHT: real wages (deflated with theconsumer price index), 1992 = 100
Source: Table 4.6.
THE
REAL
SECTOR

11
BANKA SLOVENIJE
Monthly Bulletin
1.7. REGISTEREDHOUSEHOLDSINCOME
Registered payments to households in SITbillion at constant (consumer) prices oflatest month
* Net wages and salaries* Other receipts from work and employment* Transfer receipts
Source: Table 4.7.
2.1. FISCAL REVENUE
In SIT billion at constant prices of latestmonth
* Social contributions: for health care, pension and disability fund, and unemployment
Source: Agency of RS for Payments.
2.2. ALLOCATION OFFISCAL REVENUE
In SIT billion at constant prices of latestmonth
Source: Agency of RS for Payments.
PUBLIC
FINANCE

12
BANKA SLOVENIJE
Monthly Bulletin
3.1.BALANCE OF PAYMENTS: CURRENT ACCOUNT
In USD million
Source: Table 3.3.
3.2. TRADE BALANCE
Total merchandise trade
In USD million
Source: Table 3.5.
3.3. SERVICES
In USD million
* Travel: receipts, expenditure, balance* Balance of total Services.
Source: Table 3.3.
EXTERNAL
TRANSACTIONS

13
BANKA SLOVENIJE
Monthly Bulletin
3.4. FINANCIAL ACCOUNTFrom data on securities excluded:
- amount of USD 465.4 million in July 1996 representing the repayment of credits based on issue of government bonds- issue of government bonds in May 1998 (556.6 mio USD)- in June 1998 repayment of govern - ment bonds, issued in exchange for a part of allocated foreign debt, in the amount of USD 453.2 million, financed with an issue of government bonds in May1998
In USD million
Source: Table 3.4.
3.5. TURNOVER ON THEFOREIGNEXCHANGEMARKET
In USD million monthly
* bank purchases from enterprises,* banksales to enterprises* net bank purchases (balance).* net purchases of exchange offices (balance; negative values indicate net
sales of exchange offices).
Source: Table 2.13.1.
3.6. FOREIGN EXCHANGE RESERVES
In USD million at end of month
Source: Table 3.8.
EXTERNAL
TRANSACTIONS

14
BANKA SLOVENIJE
Monthly Bulletin
4.1. MONETARYAGGREGATES
Deflated with the retail price index, in SITbillion at prices of last month:
* M3* M2* M1* Currency in circulation
Source: Table 1.1.
4.2. REAL GROWTH OF MONETARY AGGREGATES
In % monthly (seasonally adjusted):
* M3* M2* M1
Source: Table 1.1.
4.3. MAINCOMPONENTS OF MONEY (M3)
Deflated with the retail price index, in SITbillion at prices of last month:
* Currency in circulation* Total demand deposits* Tolar time and savings deposits* Households foreign currency deposits
Source: Table 1.1.
MONEY
AND
BANKS
15
BANKA SLOVENIJE
Monthly Bulletin
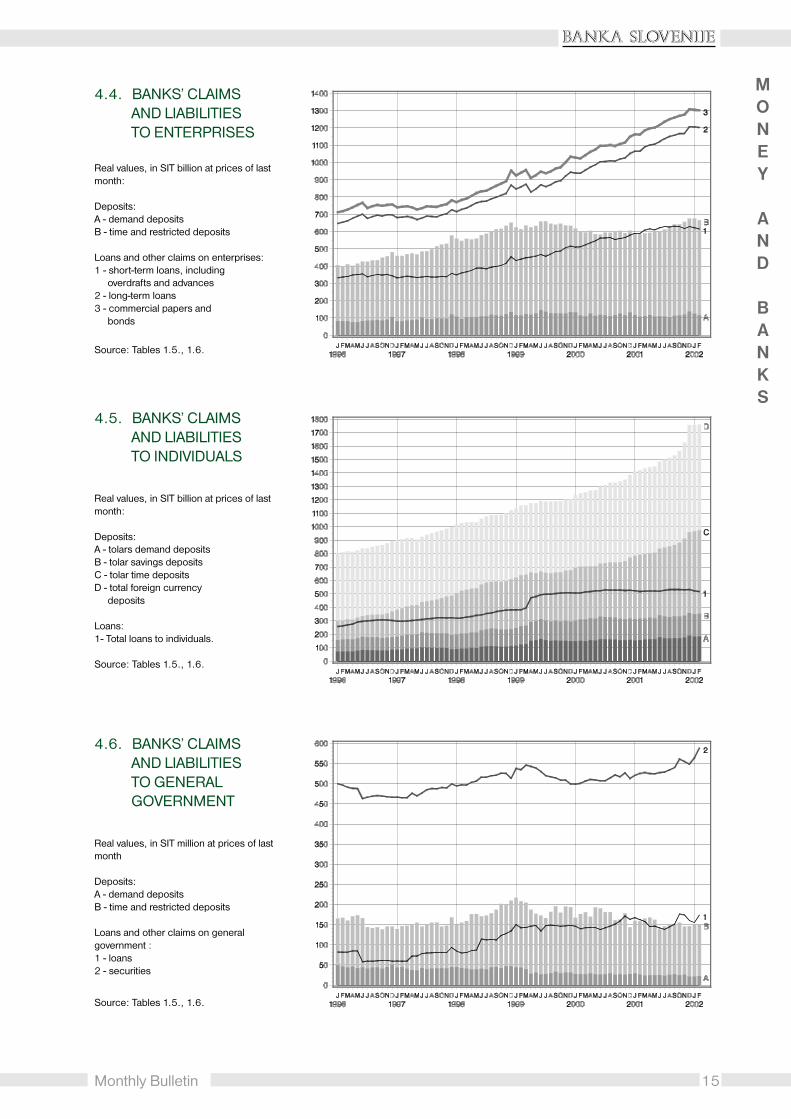
4.4. BANKS’ CLAIMS AND LIABILITIES TO ENTERPRISES
Real values, in SIT billion at prices of lastmonth:
Deposits:A - demand depositsB - time and restricted deposits
Loans and other claims on enterprises:1 - short-term loans, including overdrafts and advances2 - long-term loans3 - commercial papers and bonds
Source: Tables 1.5., 1.6.
4.5. BANKS’ CLAIMS AND LIABILITIES TO INDIVIDUALS
Real values, in SIT billion at prices of lastmonth:
Deposits:A - tolars demand depositsB - tolar savings depositsC - tolar time depositsD - total foreign currency deposits
Loans:1- Total loans to individuals.
Source: Tables 1.5., 1.6.
4.6. BANKS’ CLAIMS AND LIABILITIES TO GENERAL GOVERNMENT
Real values, in SIT million at prices of lastmonth
Deposits:A - demand depositsB - time and restricted deposits
Loans and other claims on generalgovernment :1 - loans2 - securities
Source: Tables 1.5., 1.6.
MONEY
AND
BANKS

16
BANKA SLOVENIJE
Monthly Bulletin
5.1. BANK OF SLOVENIA INTEREST RATES
Nominal interest rates and TolarIndexation Clause (TOM) in % p.a..
Source: Table 2.1., 2.2. and 2.3.
5.2. INTEREST RATES FOR BANK OF SLOVENIA BILLS
Real interest rates in % p.a.
Source: Table 2.3.
5.3. INTERBANK MONEY MARKET RATES AND GENERAL LEGAL PENAL RATE
Nominal interest ratesand Tolar Indexation Clause (TOM)in % p.a.
Source: Table 2.1. and 2.2..
FINANCIAL
MARKETS

17
BANKA SLOVENIJE
Monthly Bulletin
5.5. THE LJUBLJANA STOCK
EXCHANGETURNOVER BYTYPE OFSECURITES
Monthly data in mio SIT
PIF = Privatization Investment Fund SharesSTS = Short - Term Securities
Source: Table 2.9.
5.6. SLOVENIANSTOCK
EXCHANGEINDEX(SBI) AND
BOND INDEX (BIO)
Daily data
Source: Table 2.11. and suplementarydata
5.4. COMMERCIAL BANKS INTEREST RATES
Real interest rates over TolarIndexation Clause in % p.a.
Source: Table 2.4.1.
FINANCIAL
MARKETS
18
BANKA SLOVENIJE
Monthly Bulletin
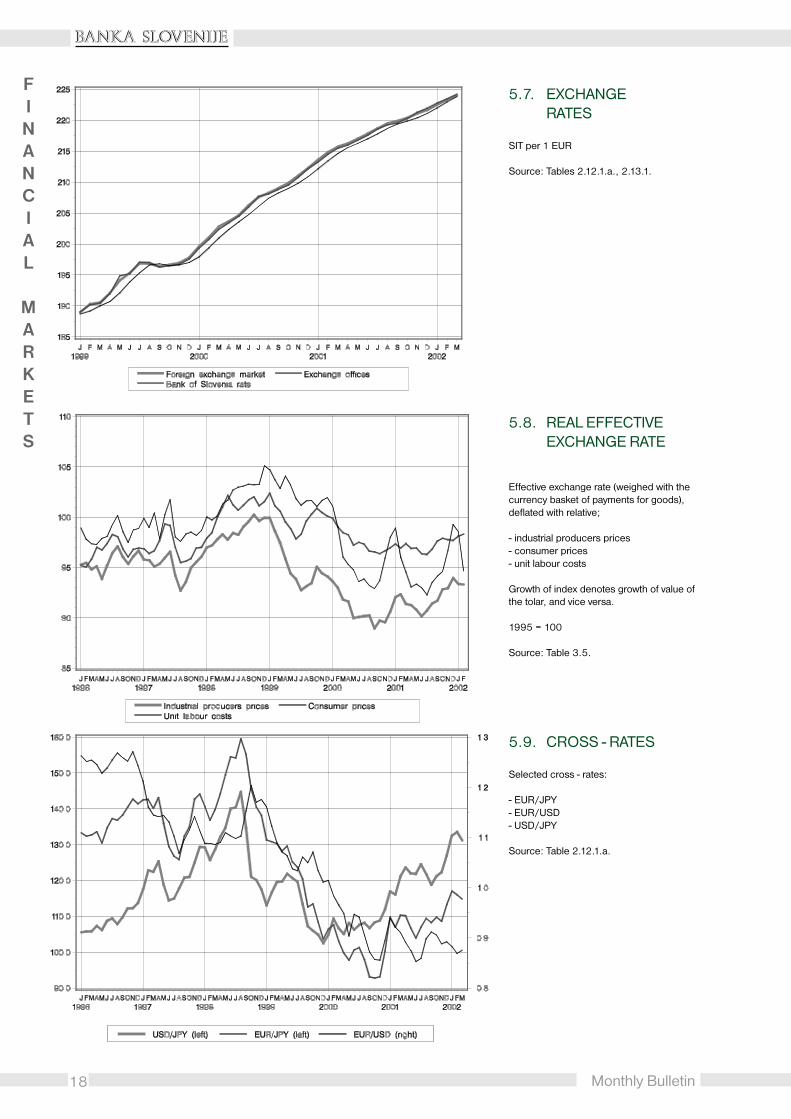
5.7. EXCHANGERATES
SIT per 1 EUR
Source: Tables 2.12.1.a., 2.13.1.
5.8. REAL EFFECTIVEEXCHANGE RATE
Effective exchange rate (weighed with thecurrency basket of payments for goods),deflated with relative;
- industrial producers prices- consumer prices- unit labour costs
Growth of index denotes growth of value ofthe tolar, and vice versa.
1995 = 100
Source: Table 3.5.
5.9. CROSS - RATES
Selected cross - rates:
- EUR/JPY- EUR/USD- USD/JPY
Source: Table 2.12.1.a.
FINANCIAL
MARKETS

19
�������������
Monthly Bulletin
�����������������
MONEY AND BANKSMain monetary aggregates (Statistical Definitions)Monetary Survey - Consolidated Balance Sheet of the Monetary systemBalance Sheet of the Bank of SloveniaBalance Sheet of Deposit Money BanksDeposit Money Banks’ Claims on Domestic Non-monetary SectorsDeposit Money Banks’ Liabilities to Domestic Non-monetary SectorsDeposit Money Banks’ Claims on Non-residentsDeposit Money Banks’ Liabilities to Non-residentsBank of Slovenia 10-day balance sheet
FINANCIAL MARKETSBank of Slovenia Interest RatesInterbank Money Market Rates and Indexation ClauseInterest Rates for Bank of Slovenia BillsAverage Commercial Banks’ Interest Rates(Tolar Indexation Clause)Average Commercial Banks’ Interest Rates(Foreign Exchange Indexation Clause)Average Effective Commercial Banks’ Interest Rates(Tolar Indexation Clause)Average Effective Commercial Banks’ Interest Rates(Foreign Exchange Indexation Clause)Government Short-Term Securities RatesGovernment Long-Term Securities RatesNetwork of Commercial BanksMap: Number of Bank units in Local comunityModern Instruments of PaymentPayment CardsOther Modern Instruments of PaymentThe Ljubljana Stock Exchange: Turnover by Market Segmentand Type of SecuritiesThe Ljubljana Stock Exchange: Market Capitalization and Turnover RatioThe Ljubljana Stock Exchange: Slovenian Stock ExchangeIndex and Bond IndexSelected Bank of Slovenia Exchange RatesSelected Bank of Slovenia Exchange Rates: Daily ratesTurnover and Foreign Exchange Market RatesTurnover and Foreign Exchange Market Rates: Daily rates
1.1.11.2.1.3.1.4.1.5.1.6.1.7.1.8.1.9.
2.2.1.2.2.2.3.2.4.1.
2.4.2.
2.5.1.
2.5.2.
2.6.1.2.6.2.2.7.
2.8.2.8.1.2.8.2.2.9.
2.10.2.11.
2.12.1.2.12.2.2.13.1.2.13.2

20
�������������
Monthly Bulletin
BALANCE OF PAYMENTS AND EXTERNAL POSITIONBalance of PaymentsBalance of Payments 1988-1992Balance of Payments - Current AccountBalance of Payments - Capital and Financial AccountMerchandise Trade; The Effective Exchange RateMerchandise Trade by sections of SITC and by end useComposition of Foreign TradeInternational LiquidityExternal DebtExternal Debt: Regional Composition and Breakdown by CreditorsPayments Effected to the Fiduciary AccountInternational Investment Position of Slovenia
THE REAL SECTORDerivation and Expenditure on Gross Domestic ProductQuarterly Real Gross Domestic ProductIndustryTravelEmployment and UnemploymentAverage Wages and SalariesRegistered Households IncomePrices
PUBLIC FINANCEGeneral Government Revenues and ExpenditureGeneral Government RevenuesGeneral Government ExpenditureGeneral Govenment FinancingDebt of Republic of Slovenia
������������������������������������������������������� Legend: - no occurence ... not available
. provisional or estimated * corrected data
/ average 0 value less than 0.5
1,2,3,... footnote, explained in Notes on MethologySums of part figures may differ from totals due to roundings.
3.3.1.3.2.3.3.3.4.3.5.3.6.3.7.3.8.3.9.3.10.3.11.3.12.
4.4.1.4.2.4.3.4.4.4.5.4.6.4.7.4.8.
5.5.1.5.2.5.3.5.45.5

21
�������������
Monthly Bulletin
1.1. Main money aggregates (Statistical Definitions) MONEY
AND
BANKS
Column
Code1996 Nov. 62,358 43,496 5,844 12,002 142,707 528,948 351,831 111,698 210,910 751,859 1,103,690 Dec. 65,283 46,586 5,617 2,424 153,576 536,303 356,083 117,486 224,476 763,203 1,119,286 1997 Jan. 64,157 46,791 5,081 4,206 152,559 556,617 359,332 116,029 221,797 782,621 1,141,952 Feb. 64,663 46,281 5,081 2,100 149,679 570,496 358,873 116,025 219,424 792,019 1,150,893 Mar. 67,189 46,992 4,895 571 153,677 587,085 357,763 119,076 225,761 813,416 1,171,179 Apr. 68,316 48,703 4,779 3,050 156,648 606,884 356,072 121,798 229,744 839,677 1,195,749 May 69,705 48,234 4,445 4,194 158,915 618,585 355,160 122,384 233,064 855,843 1,211,003 Jun. 71,392 50,156 4,629 11,533 163,521 628,757 352,064 126,177 239,542 879,832 1,231,896 Jul. 74,292 51,595 4,904 7,048 169,847 643,241 352,486 130,791 249,043 899,333 1,251,819 Aug. 74,389 51,937 4,989 5,823 170,663 665,694 359,747 131,316 250,042 921,558 1,281,304 Sep. 75,005 53,434 4,960 5,083 169,465 687,142 364,939 133,400 249,430 941,656 1,306,595 Oct. 76,465 52,776 5,064 12,626 170,294 697,002 368,624 134,305 251,824 961,451 1,330,075 Nov. 76,002 53,500 5,582 8,197 173,123 717,891 371,343 135,084 254,707 980,794 1,352,137 Dec. 77,909 55,774 5,468 8,287 182,439 737,634 374,314 139,151 265,816 1,011,736 1,386,051 1998 Jan. 75,337 57,361 5,265 9,342 185,071 765,322 381,548 137,963 265,673 1,040,337 1,421,885 Feb. 74,850 54,208 6,626 3,629 180,289 783,528 384,408 135,684 261,766 1,048,922 1,433,330 Mar. 76,231 55,773 6,417 2,939 180,273 807,371 384,889 138,422 262,922 1,073,231 1,458,120 Apr. 78,789 58,215 6,389 0 185,029 825,403 385,920 143,393 270,206 1,095,609 1,481,530 May 80,720 60,021 6,011 2,710 190,680 837,040 384,884 146,752 277,411 1,117,161 1,502,045 Jun. 81,568 63,448 6,547 2,000 193,960 861,478 382,226 151,563 282,075 1,145,553 1,527,779 Jul. 85,709 64,738 6,786 161 207,211 875,445 384,370 157,233 299,706 1,175,313 1,559,683 Aug. 86,330 64,906 6,976 0 207,810 891,729 387,070 158,212 301,117 1,192,845 1,579,916 Sep. 88,093 65,666 7,474 0 211,666 904,304 389,469 161,233 307,234 1,211,538 1,601,007 Oct. 88,603 66,716 7,187 0 210,761 921,532 388,309 162,506 306,551 1,228,084 1,616,393 Nov. 87,663 67,207 6,917 0 211,179 941,990 392,869 161,787 305,759 1,247,749 1,640,617 Dec. 90,666 73,107 7,285 0 228,662 947,894 400,967 171,059 326,614 1,274,508 1,675,474 1999 Jan. 89,027 69,961 7,039 0 224,412 979,152 409,555 166,026 320,477 1,299,629 1,709,184 Feb. 89,580 73,529 7,238 0 227,073 985,764 413,245 170,347 323,891 1,309,655 1,722,900 Mar. 91,928 69,638 7,209 3,194 233,486 989,389 416,179 168,775 332,623 1,325,206 1,741,385 Apr. 96,706 75,953 7,089 0 241,868 989,686 416,008 179,749 345,664 1,335,349 1,751,358 May 98,048 72,294 6,621 4,903 242,576 984,199 419,759 176,962 347,245 1,336,347 1,756,106 Jun. 100,832 77,465 6,730 4,500 260,522 986,876 424,879 185,027 368,085 1,359,461 1,784,339 Jul. 102,109 80,088 6,723 0 267,240 1,005,180 433,747 188,920 376,073 1,381,252 1,815,000 Aug. 98,614 78,537 7,186 581 267,197 1,017,953 460,178 184,338 372,998 1,391,532 1,851,710 Sep. 100,447 77,672 7,853 6,600 261,730 1,030,831 480,564 185,972 370,030 1,407,461 1,888,025 Oct. 102,481 79,311 7,165 1,935 263,898 1,039,924 490,494 188,957 373,543 1,415,402 1,905,897 Nov. 100,950 78,818 7,530 2,233 265,343 1,052,297 497,644 187,298 373,823 1,428,353 1,925,997 Dec. 109,758 81,635 7,646 645 274,308 1,053,548 505,203 199,040 391,713 1,445,906 1,951,109 2000 Jan. 108,690 79,417 7,420 0 263,757 1,065,361 513,176 195,527 379,867 1,445,228 1,958,404 Feb. 104,050 78,157 7,303 138 260,547 1,075,646 528,872 189,510 371,901 1,447,685 1,976,557 Mar. 103,417 77,874 6,914 968 258,366 1,090,558 543,951 188,206 368,697 1,460,222 2,004,173 Apr. 106,320 79,943 7,369 1,067 265,310 1,091,945 555,104 193,633 378,999 1,472,011 2,027,115 May 105,749 81,691 7,454 1,129 266,831 1,109,385 571,907 194,894 380,034 1,490,548 2,062,455 Jun. 106,385 81,120 7,848 1,750 271,572 1,111,417 581,945 195,354 385,805 1,498,972 2,080,917 Jul. 108,851 83,825 8,736 0 279,357 1,129,572 594,570 201,412 396,944 1,526,516 2,121,086 Aug. 106,509 82,091 8,604 0 277,062 1,146,713 610,581 197,204 392,175 1,538,888 2,149,469 Sep. 108,882 81,306 8,727 0 278,130 1,157,602 629,035 198,915 395,738 1,553,340 2,182,375 Oct. 109,998 84,199 9,055 0 281,472 1,172,494 639,442 203,252 400,525 1,573,019 2,212,461 Nov. 108,550 83,193 8,955 0 282,043 1,181,114 659,228 200,698 399,548 1,580,662 2,239,890 Dec. 113,429 85,296 9,874 0 295,462 1,187,928 677,003 208,599 418,765 1,606,692 2,283,695 2001 Jan. 108,331 82,913 9,496 0 284,914 1,218,103 678,219 200,740 402,741 1,620,844 2,299,063 Feb. 107,030 84,036 9,432 0 280,901 1,242,681 693,114 200,498 397,363 1,640,044 2,333,158 Mar. 109,032 85,094 9,030 0 281,999 1,277,270 704,959 203,156 400,060 1,677,330 2,382,289 Apr. 111,461 86,769 9,247 0 288,100 1,297,595 725,853 207,478 408,809 1,706,404 2,432,257 May 111,987 88,409 10,332 0 293,915 1,330,258 734,408 210,728 416,233 1,746,491 2,480,899 Jun. 114,749 87,245 9,286 0 299,277 1,339,421 751,331 211,279 423,311 1,762,732 2,514,063 Jul. 117,797 88,555 9,849 0 306,101 1,368,213 758,241 216,200 433,746 1,801,959 2,560,200 Aug. 113,863 87,496 9,861 0 303,048 1,404,078 773,488 211,221 426,773 1,830,851 2,604,338 Sep. 116,464 87,733 11,038 0 302,933 1,437,207 772,240 215,236 430,436 1,867,643 2,639,883 Oct. 119,439 90,627 10,482 0 305,601 1,463,664 788,937 220,548 435,522 1,899,186 2,688,123 Nov. 121,495 92,328 12,172 0 315,831 1,491,283 817,405 225,996 449,498 1,940,781 2,758,186 Dec. 133,306 97,134 15,293 0 341,009 1,538,276 873,561 245,733 489,608 2,027,884 2,901,445 2002 Jan. 132,013 94,132 14,997 0 336,949 1,598,990 * 921,694 * 241,142 483,959 2,082,949 * 3,004,643 *
Feb. 128,450 97,870 13,811 0 331,189 1,632,470 * 927,837 * 240,131 473,450 2,105,920 * 3,033,757 *
Mar. 130,538 97,147 14,029 0 335,719 1,655,103 934,378 241,714 480,286 2,135,389 3,069,767
Millions of Tolars Currency in
circulation
1
Government time deposits
at BS
Demand deposits at
BS
Bank reserves
2 3 4
Foreign currency
deposits at banks
7
Demand deposits at
banks
5 9 10
M3
11
Tolar time and savings
deposits at banks
6
M2M1Base money
8

22
�������������
Monthly Bulletin
1.2. Monetary Survey - Consolidated Balance Sheet of the Monetary SystemMONEY
AND
BANKS
Column
Code
1991 31. Dec. 6,499 112,806 119,305 8,650 5,582 3,495 2,154 91 11,3221992 31. Dec. 70,769 203,903 274,671 8,880 13,061 8,771 2,198 149 24,1791993 31. Dec. 104,006 188,794 292,801 18,783 16,401 188,670 2,842 162 208,0761994 31. Dec. 190,058 291,049 481,107 15,650 25,083 224,939 5,148 40 255,2101995 31. Dec. 250,853 301,750 552,602 15,283 43,367 264,609 7,511 28 315,5151996 31. Dec. 329,814 365,174 694,988 15,518 30,055 278,714 10,597 23 319,3891997 31. Dec. 559,274 316,253 875,527 15,668 39,837 302,420 30,026 20 372,3041998 31. Dec. 594,096 322,847 916,943 16,012 71,378 300,676 35,230 13 407,2971999 31. Dec. 629,764 355,720 985,484 16,612 120,689 299,625 6,539 1,268 428,1212000 31. Dec. 724,662 462,885 1,187,547 17,752 132,304 325,156 20,200 1,325 478,9842001 31. Dec. 861,616 819,738 1,681,354 9,807 135,872 388,086 24,247 0 548,205 2001 31. Jan. 738,999 484,594 1,223,593 17,775 138,053 329,671 18,885 1,387 487,996 28. Feb. 751,077 509,608 1,260,685 17,861 135,593 342,730 18,433 1,372 498,128 31. Mar. 753,166 521,766 1,274,932 18,092 134,501 352,802 16,805 1,380 505,487 30. Apr. 855,309 529,023 1,384,332 18,175 131,581 364,759 8,622 1,426 506,387 31. May 863,644 559,742 1,423,386 18,607 136,324 368,021 6,454 1,439 512,239 30. Jun. 886,103 556,464 1,442,567 18,653 129,319 376,162 9,911 1,448 516,840 31. Jul. 901,899 551,674 1,453,574 17,912 120,774 381,786 15,087 1,468 519,115 31. Aug. 823,958 563,057 1,387,015 17,890 126,840 381,146 15,184 1,478 524,647 30. Sep. 831,679 571,906 1,403,584 17,924 134,558 383,257 15,049 1,500 534,365 31. Oct. 841,988 613,863 1,455,851 17,966 155,691 381,114 19,801 1,054 557,660 30. Nov. 842,880 * 718,942 * 1,561,822 9,566 150,288 379,828 23,747 410 554,273 31. Dec. 861,616 * 819,738 * 1,681,354 * 9,807 135,872 * 388,086 * 24,247 0 548,205 *
2002 31. Jan. 881,207 * 817,435 * 1,698,642 * 9,605 132,559 * 415,093 25,065 0 572,718 *
28. Feb. 929,749 804,358 1,734,107 9,608 147,990 424,773 30,026 0 602,788
Millions of Tolars
9=5+6+7+87 85 63=1+2 41 2
Other general government
Loans etc. Securities Loans Securities
Bank of Slovenia
Assets
Foreign assets
Total
Domestic assets
Deposit money banks
Claims of BS on central
governmentTotal
Claims of banks on general government
Central government
Column
Code
1991 31. Dec. 0 72,693 72,693 9,176 29,496 60 4 64 38,736 35,4071992 31. Dec. 0 116,809 116,809 24,183 53,844 862 2,573 3,436 81,463 104,6621993 31. Dec. 1,541 139,615 141,156 32,721 79,430 909 2,596 3,506 115,657 186,9621994 31. Dec. 923 159,153 160,075 47,285 115,894 1,104 5,954 7,059 170,237 319,3141995 31. Dec. 522 186,869 187,391 59,965 139,961 1,370 2,607 3,977 203,903 404,7741996 31. Dec. 242 206,358 206,600 66,839 163,327 1,601 3,325 4,926 235,091 515,7671997 31. Dec. 58 206,294 206,352 78,122 187,948 2,149 2,283 4,432 270,503 727,1621998 31. Dec. 170 214,973 215,142 93,655 233,202 3,531 2,324 5,855 332,711 929,4691999 31. Dec. 124 283,362 283,486 125,011 268,595 3,846 2,306 6,152 399,757 1,015,3912000 31. Dec. 109 375,816 375,924 119,818 295,818 4,941 3,412 8,352 423,988 1,118,7442001 31. Dec. 278 441,829 442,107 142,110 344,452 6,707 8,941 15,648 502,210 1,432,323 2001 31. Jan. 47 359,662 359,710 106,898 280,797 4,933 3,965 8,898 396,593 1,152,291 28. Feb. 33 366,318 366,351 108,532 273,607 4,572 4,350 8,922 391,061 1,175,834 31. Mar. 55 386,982 387,037 113,308 280,871 4,287 4,232 8,519 402,698 1,201,741 30. Apr. 120 389,957 390,077 114,878 293,233 4,286 4,745 9,031 417,143 1,210,098 31. May 151 389,909 390,059 113,236 286,222 4,428 4,248 8,676 408,134 1,238,638 30. Jun. 96 389,438 389,534 124,349 303,593 5,094 4,727 9,821 437,763 1,232,398 31. Jul. 323 398,971 399,293 115,933 294,400 4,267 4,979 9,246 419,578 1,273,817 31. Aug. 147 394,092 394,238 116,304 292,356 4,439 4,981 9,420 418,079 1,304,002 30. Sep. 1,110 394,355 395,465 122,649 306,081 5,162 4,168 9,330 438,061 1,328,541 31. Oct. 382 412,398 412,780 124,670 305,435 4,743 5,416 10,159 440,264 1,357,122 30. Nov. 519 427,262 427,781 126,546 316,523 5,158 7,104 12,262 455,331 1,388,821 31. Dec. 278 441,829 * 442,107 * 142,110 344,452 * 6,707 8,941 15,648 502,210 * 1,432,323 *
2002 31. Jan. 559 437,239 437,798 129,418 329,756 5,712 6,890 12,602 471,776 1,486,433 28. Feb. 272 480,387 480,659 130,028 326,580 5,732 6,798 12,531 469,139 1,504,346
Millions of Tolars
Central government
TotalDemand
deposits at banks
Demand deposits at BS
Enterprises and NFI
Total
M2
Tolar savings and time
deposits at banks
109=4+5+8
Liabilities
Foreign liabilities M1
Bank of Slovenia
Deposit money banks
Total Currency in circulation
1 2 3=1+2 4 5 6 7 8=6+7
23
�������������
Monthly Bulletin
MONEY
AND
BANKS
109,176 2,467 10,371 418 82 122,514 142,486 35,597 297,388188,514 26,329 22,016 393 516 237,768 270,826 59,411 604,908237,781 23,446 55,225 1,639 394 318,484 545,342 72,319 910,462290,987 34,903 91,567 3,761 1,767 422,985 693,845 95,555 1,270,507397,226 36,341 160,488 8,221 4,529 606,804 937,602 111,696 1,601,900471,569 38,016 207,221 6,480 2,897 726,182 1,061,090 109,887 1,865,965532,116 38,091 240,901 9,714 2,646 823,470 1,211,442 125,301 2,212,269674,610 62,201 302,822 15,637 4,726 1,059,996 1,483,304 141,638 2,541,885781,436 66,974 438,910 27,589 10,230 1,325,139 1,769,872 164,405 2,919,761944,982 77,298 494,986 38,010 13,547 1,568,823 2,065,559 199,875 3,452,981
1,163,204 86,334 535,784 43,641 15,413 1,844,376 2,402,388 226,547 4,310,290
958,445 79,612 494,803 40,462 12,267 1,585,590 2,091,361 201,562 3,516,515968,271 78,279 494,072 41,648 14,007 1,596,276 2,112,265 202,262 3,575,212
1,002,568 77,730 501,582 42,841 14,208 1,638,929 2,162,509 206,125 3,643,5651,020,407 78,731 506,612 41,651 14,982 1,662,382 2,186,944 209,263 3,780,5401,036,196 78,600 512,484 43,893 15,121 1,686,294 2,217,139 208,893 3,849,4181,055,323 79,530 512,897 43,662 15,107 1,706,520 2,242,012 214,721 3,899,3001,073,561 81,027 520,435 43,887 15,170 1,734,079 2,271,106 212,153 3,936,8321,086,638 83,141 525,613 43,775 15,176 1,754,343 2,296,880 213,882 3,897,7761,101,169 86,426 529,858 45,109 15,132 1,777,693 2,329,982 220,348 3,953,9141,116,348 86,860 532,936 44,546 15,270 1,795,959 2,371,586 224,800 4,052,2371,119,751 93,900 533,919 46,979 15,351 1,809,900 2,373,739 225,770 4,161,3311,163,204 * 86,334 * 535,784 * 43,641 * 15,413 * 1,844,376 * 2,402,388 * 226,547 * 4,310,290 *
1,180,126 * 84,340 * 534,740 45,520 15,840 1,860,566 * 2,442,888 * 225,060 * 4,366,589 *
1,187,837 86,823 533,081 45,347 15,456 1,868,545 2,480,941 226,582 4,441,630
15=10+...+14 18=3+16+171716=4+9+151412 1310 11
Loans etc. SecuritiesSecuritiesLoans etc.
Total
Assets
Other assetsTotal
Domestic assets
Total
Claims of banks on other sectors
Enterprises Nonmon. fin. institutions
Individuals
74,143 63,181 137,324 2,649 0 2,649 1,640 1,063 82,018 297,388186,125 128,207 314,332 3,919 15,446 19,365 3,209 1,280 149,913 604,908302,618 210,311 512,929 6,755 24,391 31,146 3,395 1,887 219,950 910,462
0 489,551 245,455 735,007 12,553 24,229 36,782 21,460 6,086 311,097 1,270,5077,800 616,477 325,422 941,899 29,266 27,804 57,070 37,105 5,740 372,695 1,601,900
0 750,858 384,410 1,135,268 27,408 24,747 52,155 69,598 3,982 398,361 1,865,9659,000 1,006,664 404,668 1,411,332 47,561 19,246 66,807 64,688 5,435 457,656 2,212,269
0 1,262,180 428,099 1,690,279 48,769 24,427 73,195 61,425 8,504 493,339 2,541,8850 1,415,148 497,783 1,912,932 52,341 11,599 63,939 71,387 8,189 579,828 2,919,7610 1,542,732 663,618 2,206,350 65,875 13,327 79,202 76,113 9,715 705,676 3,452,981
19,896 1,954,430 922,242 2,876,672 96,079 17,529 113,608 39,731 11,232 826,939 4,310,290
0 1,548,884 691,886 2,240,770 65,942 14,232 80,174 80,232 10,042 745,588 3,516,5150 1,566,895 702,398 2,269,293 67,205 16,720 83,926 87,402 10,850 757,391 3,575,2120 1,604,439 725,500 2,329,939 68,603 15,186 83,789 73,595 9,944 759,261 3,643,5660 1,627,240 725,717 2,352,957 73,058 15,584 88,643 168,148 9,937 770,778 3,780,540
8,037 1,654,809 755,455 2,410,264 76,218 15,757 91,975 162,775 9,676 784,669 3,849,41813,812 1,683,973 761,917 2,445,890 79,000 15,029 94,029 134,082 9,917 825,847 3,899,30015,916 1,709,311 767,744 2,477,055 79,244 19,869 99,113 131,862 8,894 820,615 3,936,83215,937 1,738,018 776,759 2,514,778 81,772 19,862 101,634 47,495 13,067 826,564 3,897,776
2,400 1,769,001 786,192 2,555,194 83,853 21,294 105,146 46,950 8,324 842,835 3,953,91419,850 1,817,237 800,036 2,617,273 85,217 20,707 105,924 47,954 12,904 855,402 4,052,23718,257 1,862,409 843,328 2,705,738 91,876 18,519 110,395 48,600 8,871 859,947 4,161,33119,896 1,954,430 922,242 * 2,876,672 * 96,079 17,529 113,608 39,731 11,232 * 826,939 * 4,310,290 *
16,020 1,974,230 937,209 2,911,438 101,087 15,337 116,423 37,412 11,313 852,205 * 4,366,589 *
10,527 1,984,012 944,984 2,928,996 103,306 15,447 118,753 45,098 11,320 856,804 4,441,630
Total
Liabilities
Other liabilities
Restricted deposits
Other for. curr. liabil. to cent.
governmentTotal
Securities
Foreign currency
TolarTotalGovernment
time deposits at BS
M3
Foreign curr. deposits at
banks
Total
11 12=9+10+11 13 14=12+13 15 16 17=15+16 18 2119 20

24
�������������
Monthly Bulletin
1.3. Balance Sheet of the Bank of SloveniaMONEY
AND
BANKS
Column
Code
1991 31. Dec. 6 - - 177 6,180 0 6,364 135 6,499 8,6501992 31. Dec. 10 - - 19 70,047 559 70,635 134 70,769 8,8501993 31. Dec. 17 2,314 6 51 94,750 6,727 103,864 142 104,006 18,5991994 31. Dec. 16 2,377 8 46 162,992 11,559 176,998 13,060 190,058 15,3661995 31. Dec. 16 2,411 8 37 200,671 26,275 229,417 21,435 250,853 14,8621996 31. Dec. 17 2,619 19 37 267,619 54,735 325,046 4,768 329,814 15,0541997 31. Dec. 16 2,939 13 29 362,171 187,124 552,292 6,983 559,274 15,1321998 31. Dec. 15 10,544 38 40 254,050 321,861 586,548 7,548 594,096 15,4311999 31. Dec. 18 21,174 316 245 166,983 430,803 619,540 10,223 629,764 15,9092000 31. Dec. 20 18,719 838 37 209,002 482,847 711,463 13,199 724,662 16,8292001 31. Dec. 16,869 20,217 1,261 105 215,739 588,344 842,535 19,082 861,616 8,509 2001 31. Jan. 20 18,771 840 39 207,439 497,236 724,346 14,653 738,999 16,852 28. Feb. 20 18,007 954 28 234,120 483,153 736,281 14,796 751,077 16,938 31. Mar. 20 19,447 981 34 225,496 491,765 737,743 15,423 753,166 17,169 30. Apr. 20 19,246 971 27 303,479 516,321 840,064 15,244 855,309 17,152 31. May 20 20,671 1,104 39 257,281 568,501 847,617 16,027 863,644 17,584 30. Jun. 16,847 20,779 1,110 39 266,742 561,401 866,918 19,185 886,103 17,629 31. Jul. 16,133 20,156 1,092 34 262,286 583,357 883,059 18,841 901,899 16,889 31. Aug. 16,002 19,926 1,169 30 197,154 571,338 805,618 18,340 823,958 16,867 30. Sep. 17,071 19,814 1,162 33 201,791 573,459 813,331 18,348 831,679 16,851 31. Oct. 16,453 19,909 1,168 29 196,860 590,219 824,638 17,350 841,988 16,893 30. Nov. 16,614 20,200 1,257 37 200,411 * 585,440 823,958 * 18,922 842,880 * 8,469 31. Dec. 16,869 20,217 1,261 105 215,739 * 588,344 842,535 * 19,082 861,616 * 8,509 2002 31. Jan. 17,638 20,482 1,278 51 201,205 * 619,736 860,390 * 20,817 881,207 * 8,307 28. Feb. 18,628 25,694 1,341 18 211,548 651,622 908,851 20,898 929,749 8,310
Assets
Claims on general
governmentTotal
Foreign assets
Other claimsTotal
International monetary reserves (exc. Forex. Repos)
Gold
5
Reserve position with
IMF
SDRs Currency Deposits
7=1+...+6
Securities
1 2 3 4
Millions of Tolars
108 9=7+86
Column
Code
1991 31. Dec. 9,769 6,089 - 0 6,089 4 - 1,640 1,644 42 181992 31. Dec. 25,532 6,335 - 4,381 10,716 2,573 - 3,209 5,782 109 7531993 31. Dec. 34,612 10,483 - 5,112 15,595 2,596 - 3,395 5,991 197 7121994 31. Dec. 50,618 27,466 - 1,047 28,513 5,954 - 21,460 27,414 0 1,1041995 31. Dec. 63,904 33,681 - 1,494 35,175 2,607 7,800 37,105 47,512 0 1,3701996 31. Dec. 71,441 43,093 - 0 43,093 3,325 0 18,972 22,297 34 1,5661997 31. Dec. 85,653 55,067 - 0 55,067 2,283 9,000 11,833 23,116 0 2,1491998 31. Dec. 104,667 62,863 - 0 62,863 2,324 0 16,177 18,500 1,616 1,9151999 31. Dec. 142,489 61,253 - 0 61,253 2,306 0 23,946 26,252 1,684 2,1622000 31. Dec. 139,644 66,801 - 0 66,801 3,412 0 35,664 39,076 2,592 2,3492001 31. Dec. 165,777 78,594 35,372 0 113,966 8,941 19,896 31,185 60,023 3,118 3,589 2001 31. Jan. 123,576 67,146 - 0 67,146 3,965 0 39,032 42,996 2,726 2,208 28. Feb. 125,232 70,791 - 0 70,791 4,350 0 45,852 50,202 2,370 2,201 31. Mar. 129,286 72,923 - 0 72,923 4,232 0 30,438 34,670 2,088 2,199 30. Apr. 135,288 76,800 - 0 76,800 4,745 0 125,526 130,271 2,104 2,183 31. May 131,142 69,166 - 0 69,166 4,248 8,037 118,160 130,444 2,276 2,152 30. Jun. 142,250 69,156 - 0 69,156 4,727 13,812 110,089 128,628 2,465 2,629 31. Jul. 135,562 70,735 130 0 70,865 4,979 15,916 108,437 129,332 2,111 2,156 31. Aug. 135,223 64,419 1,910 0 66,329 4,981 15,937 24,785 45,703 2,206 2,233 30. Sep. 139,743 72,474 3,550 0 76,024 4,168 2,400 24,363 30,931 2,880 2,282 31. Oct. 144,031 76,164 2,790 0 78,954 5,416 19,850 25,090 50,357 2,575 2,168 30. Nov. 146,789 77,154 2,120 0 79,274 7,104 18,257 25,280 50,641 2,671 2,487 31. Dec. 165,777 78,594 35,372 0 113,966 8,941 19,896 31,185 60,023 3,118 3,589 2002 31. Jan. 150,634 66,644 60 0 66,704 6,890 16,020 28,696 51,606 3,253 2,459 28. Feb. 150,918 89,849 31,793 0 121,642 6,798 10,527 36,345 53,671 3,079 2,653
Millions of Tolars
Liabilities
11
Nonmonetary financial
institutions9=6+7+8 101 2 3 4 5=2+3+4 6 7 8
Foreign currency deposits
Demand deposits
Time depositsForeign currency deposits
Notes issue
Deposits
Deposits of banks
Total
General government deposits
Total
Other demand deposits
Giro and reserves accounts
Time deposits Enterprises

25
�������������
Monthly Bulletin
MONEY
AND
BANKS
934 0 0 1,005 458 2,396 447 977 3,821 336 19,307- 152 15,000 0 443 15,595 99 600 16,295 1,988 97,902- 351 13,611 1,488 395 15,845 147 10 16,002 1,506 140,113- 0 13,784 12,574 3,281 29,639 252 8 29,899 4,865 240,189- 66 7,667 16,804 18,295 42,832 223 1 43,056 3,620 312,391- 209 1,269 13,650 291 15,418 298 0 15,716 3,540 364,124- 0 0 13,675 4,160 17,834 245 0 18,079 5,233 597,719- 0 0 3,454 174 3,628 280 0 3,909 5,263 618,699- 859 2,065 22,397 152 25,474 349 0 25,823 5,681 677,177- 0 0 21,760 112 21,871 375 0 22,246 5,362 769,100- 0 0 260,909 75 260,984 400 0 261,384 9,522 1,141,031
- 2,698 0 20,972 111 23,782 331 0 24,113 5,561 785,525- 0 0 17,982 111 18,093 339 0 18,432 5,231 791,678- 3,806 0 25,627 93 29,526 383 0 29,909 5,347 805,590- 0 5,200 40,979 91 46,270 363 0 46,633 5,842 924,936- 0 0 55,856 91 55,947 386 0 56,333 5,633 943,194- 763 8,000 68,219 91 77,073 371 0 77,444 5,957 987,133- 0 0 69,038 91 69,129 379 0 69,508 4,856 993,152- 0 0 88,731 91 88,822 404 0 89,226 4,941 934,991- 0 4,000 117,928 82 122,010 409 0 122,419 5,061 976,010- 0 0 149,441 75 149,516 388 0 149,905 7,170 1,015,956- 0 0 188,440 * 75 188,515 * 388 0 188,903 * 7,162 1,047,414- 0 0 260,909 * 75 260,984 * 400 0 261,384 * 9,522 * 1,141,031 *
- 1,002 0 255,376 * 75 256,453 * 345 0 256,797 * 6,282 * 1,152,593 *
- 0 0 274,329 75 274,404 255 0 274,659 5,889 1,218,608
1211 1413 16=11+...+1515 1817 2019=16+..+18
Loans
Rediscounts Lombard loans Liquidity loansRepurchase agreements
Other loans
Total
Assets
21
Other assetsTotal
Claims on domestic banks
Other claimsDepositsTotal
60 7,793 0 0 0 54 0 - - 1,390 302 19,307862 17,361 2,443 38,317 40,760 38 521 - - 8,293 5,396 97,902909 22,496 2,827 47,558 50,385 365 332 1,541 4,572 19,741 6,069 140,113
1,104 57,031 12,447 87,321 99,768 1,823 156 923 4,695 21,090 4,086 240,1891,370 84,057 6,623 120,049 126,671 1,915 420 522 4,763 26,291 3,847 312,3911,601 66,990 16,317 162,130 178,447 860 15 242 5,174 36,734 4,222 364,1242,149 80,333 75,781 289,192 364,973 2,294 0 58 5,805 52,314 6,289 597,7193,531 84,895 80,103 282,379 362,483 4,299 0 170 5,772 51,596 4,817 618,6993,846 91,350 27,371 310,388 337,759 4,295 2 124 6,868 86,479 7,811 677,1774,941 110,818 6,946 358,324 365,270 4,583 2 109 7,534 56,915 84,225 769,1006,707 180,696 125,912 458,777 584,689 4,906 31 278 8,013 152,721 43,920 1,141,031
4,933 115,076 8,610 368,217 376,827 4,619 2 47 7,555 102,375 55,447 785,5254,572 125,565 7,837 370,303 378,140 4,528 2 33 7,609 102,375 48,194 791,6784,287 111,879 13,662 378,087 391,749 4,587 3 55 7,827 102,375 57,830 805,5904,286 211,357 20,406 386,324 406,730 5,164 2 120 7,746 102,375 56,154 924,9364,428 204,039 34,516 393,029 427,544 4,640 3 151 8,077 102,375 65,223 943,1945,094 202,878 36,185 399,357 435,542 4,478 2 96 8,119 123,414 70,354 987,1334,267 204,463 33,129 417,304 450,432 4,434 1 323 7,989 152,056 37,891 993,1524,439 116,471 52,895 428,374 481,269 5,328 1 147 7,898 152,056 36,599 934,9915,162 112,117 78,627 438,381 517,008 4,484 1 1,110 7,854 152,056 41,636 976,0104,743 134,053 80,229 442,538 522,767 5,471 1 382 7,891 152,056 49,304 1,015,9565,158 135,072 111,780 447,770 559,550 4,475 19 519 7,987 152,056 40,948 1,047,4146,707 180,696 125,912 458,777 584,689 4,906 31 278 8,013 152,721 * 43,920 * 1,141,031 *
5,712 124,023 191,550 472,914 664,464 4,517 31 559 8,118 187,518 * 12,729 * 1,152,593 *
5,732 181,045 158,004 511,674 669,678 4,403 32 272 8,151 187,518 16,589 1,218,608
14 16=14+1515 1817 2019
Capital and reserves
2221
TotalMoney
transfers in transit
Deposits and loans of IFO
Allocation of SDRs
Total
13=5+9+12
Deposits
Li abi l i t i es
Total
23
Other liabilities
Restricted depositsTotal
12=10+11
Bank of Slovenia bills
Tolar billsForeign
currency bills

26
�������������
Monthly Bulletin
1.4. Balance Sheet of Deposit Money BanksMONEY
AND
BANKS
Column
Code
1991 31. Dec. 593 6,109 32,281 0 3,032 35,313 7,496 36,419 83,786 5,0031992 31. Dec. 1,349 6,334 61,470 31,794 3,268 96,533 10,555 75,892 139,734 28,9861993 31. Dec. 2,065 10,483 92,996 38,077 2,406 133,479 18,651 99,112 196,125 206,4851994 31. Dec. 3,592 27,475 76,127 82,418 2,993 161,539 26,454 163,635 226,458 246,8361995 31. Dec. 4,278 33,681 66,371 106,958 9,263 182,593 33,705 231,411 351,697 288,4161996 31. Dec. 5,016 43,093 66,790 160,917 6,102 233,809 39,398 240,696 445,827 303,4411997 31. Dec. 8,019 55,067 43,515 345,084 10,442 399,040 48,552 280,751 523,292 326,3901998 31. Dec. 11,577 62,863 48,240 344,486 19,026 411,752 58,599 381,326 659,751 347,5721999 31. Dec. 18,120 61,253 59,886 327,910 28,322 416,119 68,170 474,481 832,512 350,3412000 31. Dec. 20,618 66,801 97,647 365,317 30,327 493,292 79,131 588,093 963,257 386,7362001 31. Dec. 24,655 78,594 134,983 584,164 30,027 749,174 89,848 679,119 1,133,781 457,190 2001 31. Jan. 17,479 67,146 82,985 376,790 30,944 490,719 85,315 593,953 971,381 392,829 28. Feb. 17,503 70,791 84,495 378,097 31,234 493,826 77,834 601,596 978,587 405,051 31. Mar. 16,790 72,923 69,741 391,697 31,834 493,271 80,743 623,258 994,296 414,469 30. Apr. 21,243 76,800 77,615 406,666 33,887 518,168 81,632 624,237 1,003,003 427,373 31. May 18,757 69,166 79,318 427,465 35,742 542,525 85,327 622,566 1,027,459 430,317 30. Jun. 18,765 69,156 85,107 435,480 37,638 558,225 87,080 646,742 1,017,290 439,224 31. Jul. 20,513 70,735 86,496 450,364 37,862 574,722 86,029 658,002 1,029,712 446,377 31. Aug. 19,825 64,419 95,609 481,158 37,740 614,507 89,494 662,390 1,046,166 447,771 30. Sep. 18,007 72,475 96,118 516,899 38,418 651,435 100,622 669,144 1,055,978 453,230 31. Oct. 20,333 76,164 74,621 522,627 29,382 626,630 100,203 691,964 1,077,155 451,473 30. Nov. 21,228 77,154 74,820 559,337 29,778 663,935 101,243 680,741 1,092,700 456,411 31. Dec. 24,655 78,594 134,983 * 584,164 30,027 * 749,174 * 89,848 * 679,119 * 1,133,781 * 457,190 *
2002 31. Jan. 22,224 66,644 81,348 663,619 31,620 * 776,587 * 93,375 * 679,926 * 1,144,709 * 483,104 28. Feb. 21,898 89,849 108,935 668,592 31,423 808,950 85,386 694,091 1,164,804 495,090
Assets
Domestic assets
Millions of Tolars
Reserves
CashGiro and reserves
accounts
Claims on the monetary system
Deposits, loans and
other
BS billsBanks'
securities
Total
Claims on non-monetary sectors
Overdrafts and advances
Loans-up to 1
year1Loans-over 1
year
Commercial papers and
bonds1 2 3 4 5 6=3+4+5 7 8 9 10
Column
Code
1991 31. Dec. 1,922 1,398 34,161 37,480 29,496 7,133 28,274 1,009 65,912 63,1811992 31. Dec. 3,526 15,606 58,986 78,118 53,844 20,382 84,280 1,241 159,747 128,2071993 31. Dec. 43,349 15,479 53,241 112,069 79,430 29,873 157,088 1,521 267,913 210,3111994 31. Dec. 29,971 29,639 52,406 112,016 115,894 41,893 277,421 4,263 439,472 245,4551995 31. Dec. 28,782 41,665 39,299 109,746 139,961 54,676 350,098 3,825 548,560 325,4221996 31. Dec. 34,184 15,277 38,573 88,035 163,327 65,159 450,608 3,122 682,216 384,4101997 31. Dec. 8,684 17,834 37,372 63,891 187,948 79,059 648,103 3,141 918,251 404,6681998 31. Dec. 8,594 3,528 42,535 54,656 233,202 99,660 829,809 4,204 1,166,875 428,0991999 31. Dec. 11,966 25,474 50,050 87,489 268,595 124,482 890,909 3,894 1,287,880 497,7832000 31. Dec. 17,353 22,083 82,016 121,452 295,818 147,961 970,783 5,132 1,419,694 663,6182001 31. Dec. 42,708 260,984 59,366 363,058 344,452 170,654 1,261,670 6,325 1,783,101 922,242 2001 31. Jan. 12,809 35,190 72,044 120,043 280,797 149,053 1,003,238 5,423 1,438,511 691,886 28. Feb. 14,165 18,093 72,315 104,573 273,607 152,021 1,023,813 6,321 1,455,762 702,398 31. Mar. 16,311 29,526 55,564 101,401 280,871 150,811 1,050,930 5,357 1,487,969 725,500 30. Apr. 17,492 46,270 62,728 126,490 293,233 154,095 1,056,003 4,773 1,508,103 725,717 31. May 17,583 55,947 64,146 137,676 286,222 152,321 1,086,317 5,036 1,529,896 755,455 30. Jun. 17,020 77,943 70,020 164,982 303,593 161,296 1,071,102 5,440 1,541,430 761,917 31. Jul. 23,867 69,129 64,981 157,977 294,400 158,883 1,114,934 4,459 1,572,676 767,744 31. Aug. 28,304 88,822 67,787 184,913 292,356 157,927 1,146,075 7,740 1,604,097 776,759 30. Sep. 31,446 122,010 63,407 216,863 306,081 160,599 1,167,941 3,840 1,638,462 786,192 31. Oct. 26,551 149,516 47,491 223,558 305,435 160,699 1,196,423 7,433 1,669,991 800,036 30. Nov. 27,608 188,515 * 45,661 261,785 * 316,523 161,795 1,227,026 4,395 1,709,740 843,328 31. Dec. 42,708 260,984 * 59,366 * 363,058 * 344,452 * 170,654 1,261,670 * 6,325 * 1,783,101 * 922,242 *
2002 31. Jan. 26,503 256,453 * 58,147 341,103 * 329,756 170,468 1,315,965 6,796 1,822,985 937,209 28. Feb. 18,163 274,404 62,909 355,476 326,580 173,550 1,330,796 6,917 1,837,843 944,984
9=5+6+7+8 107 85 63 4=1+2+31 2
Millions of Tolars
Liabilities to non-monetary sectors
TotalForeign currency
depositsDemand deposits
Savings deposits
Time depositsRestricted deposits
Tolar depositsLoans from
banks
Liabilities
Domestic liabilities
Liabilities to the monetary system
TotalDeposits Loans from BS
27
�������������
Monthly Bulletin
MONEY
AND
BANKS
1,132 133,836 36,659 212,510 17,079 13,052 2,974 9,131 70,569 112,806 325,3166,779 261,946 54,128 420,289 44,247 19,741 6,226 15,822 117,866 203,903 624,1926,186 526,559 71,206 743,792 105,169 18,189 7,597 5,220 52,620 188,794 932,587
14,812 678,195 91,239 962,040 169,188 26,599 13,539 29,990 51,732 291,049 1,253,08917,091 922,319 108,316 1,251,187 193,118 25,995 19,601 32,961 30,074 301,750 1,552,93716,209 1,045,571 106,453 1,433,942 252,458 29,282 20,218 32,075 31,141 365,174 1,799,11616,788 1,195,773 119,917 1,777,817 181,729 49,448 23,309 29,465 32,301 316,253 2,094,06920,044 1,467,292 136,392 2,089,877 177,168 49,878 31,520 31,312 32,969 322,847 2,412,72327,755 1,753,260 158,788 2,407,539 191,115 56,630 34,547 38,908 34,520 355,720 2,763,26030,589 2,047,807 194,656 2,823,174 274,568 67,257 47,380 36,678 37,001 462,885 3,286,05832,643 2,392,581 217,275 3,462,280 601,167 69,973 74,704 35,570 38,324 819,738 4,282,018
30,108 2,073,586 196,124 2,845,053 290,914 64,516 54,170 37,726 37,268 484,594 3,329,64731,337 2,094,404 197,154 2,873,678 311,836 65,091 57,161 38,015 37,505 509,608 3,383,28531,651 2,144,417 200,939 2,928,339 324,848 66,159 54,959 38,134 37,666 521,766 3,450,10532,524 2,168,769 203,554 2,988,533 328,734 66,657 57,856 37,987 37,789 529,023 3,517,55632,864 2,198,532 203,393 3,032,375 354,487 67,926 61,321 38,072 37,935 559,742 3,592,11633,023 2,223,360 208,928 3,078,433 347,314 68,870 63,557 38,668 38,054 556,464 3,634,89733,074 2,253,194 207,450 3,126,613 343,953 68,468 61,745 39,245 38,263 551,674 3,678,28733,169 2,278,990 209,071 3,186,812 355,701 66,863 63,613 38,529 38,351 563,057 3,749,86933,085 2,312,058 215,458 3,269,433 363,740 66,233 64,900 38,588 38,445 571,906 3,841,33832,824 2,353,620 217,734 3,294,481 402,561 67,933 65,920 38,919 38,530 613,863 3,908,34433,078 2,364,173 218,700 3,345,190 501,039 * 67,793 72,461 38,996 38,653 718,942 * 4,064,132 *
32,643 * 2,392,581 * 217,275 * 3,462,280 * 601,167 * 69,973 * 74,704 * 35,570 * 38,324 819,738 * 4,282,018 *
32,168 * 2,433,283 * 218,995 * 3,517,734 * 589,622 * 78,884 71,341 39,055 * 38,533 817,435 * 4,335,168 *
31,962 2,471,333 220,913 3,612,943 571,974 80,966 70,733 41,987 38,698 804,358 4,417,301
Total
Assets
Domestic assets
Total Total
Foreign assets
Shares and participations
Total Other assetsLoans
SecuritiesLoans to non-
monetary sectors
Other claims (on NBY)
Claims on banks
Currency and deposits
11 12=7+...+11 13 14=1+2+6+12 15 16 17 18 2119 20=15+...+19
0 129,093 2,679 62,921 20,449 252,623 7,694 59,698 5,301 72,693 325,3160 287,955 10,657 102,750 27,903 507,382 11,195 89,231 16,384 116,809 624,1920 478,224 19,008 141,773 41,899 792,972 4,729 109,945 24,941 139,615 932,5870 684,927 20,782 219,691 56,520 1,093,936 6,224 122,389 30,540 159,153 1,253,0890 873,982 45,066 262,841 74,432 1,366,068 2,650 144,259 39,960 186,869 1,552,937
50,626 1,117,251 37,082 285,245 65,144 1,592,757 18,515 137,721 50,123 206,358 1,799,11652,855 1,375,773 52,418 320,370 75,323 1,887,775 19,315 130,801 56,178 206,294 2,094,06945,248 1,640,223 57,649 354,932 90,291 2,197,751 28,159 130,857 55,956 214,973 2,412,72347,441 1,833,104 59,670 391,808 107,826 2,479,897 38,151 190,382 54,829 283,362 2,763,25940,449 2,123,761 86,989 443,764 134,277 2,910,242 39,537 271,118 65,161 375,816 3,286,058
8,546 2,713,889 126,652 481,523 155,066 3,840,188 39,218 312,692 89,919 441,829 4,282,018
41,200 2,171,597 87,988 440,509 149,848 2,969,985 25,668 268,380 65,615 359,662 3,329,64741,550 2,199,710 91,913 452,552 168,218 3,016,960 30,323 270,528 65,467 366,318 3,383,28543,157 2,256,626 92,101 457,321 155,674 3,063,123 47,896 269,458 69,628 386,982 3,450,10542,622 2,276,442 98,072 460,359 166,236 3,127,599 44,152 276,584 69,221 389,957 3,517,55644,615 2,329,966 102,925 468,125 163,516 3,202,207 32,126 286,121 71,663 389,909 3,592,11623,993 2,327,341 106,235 461,998 184,903 3,245,460 34,607 281,174 73,657 389,438 3,634,89723,425 2,363,845 112,340 465,735 179,420 3,279,317 38,610 287,389 72,971 398,971 3,678,28722,710 2,403,566 114,649 466,997 185,652 3,355,777 34,674 286,578 72,839 394,092 3,749,86922,587 2,447,241 118,847 470,443 193,589 3,446,984 33,037 286,842 74,476 394,355 3,841,33822,864 2,492,891 119,153 463,969 196,375 3,495,945 35,387 298,903 78,108 412,398 3,908,34423,320 2,576,388 123,526 465,678 209,493 3,636,870 * 34,739 311,242 81,281 427,262 4,064,132 *
8,546 2,713,889 * 126,652 481,523 * 155,066 * 3,840,188 * 39,218 * 312,692 89,919 * 441,829 * 4,282,018 *
8,716 2,768,909 129,038 479,520 * 179,360 * 3,897,929 * 36,299 316,526 84,414 437,239 4,335,168 *
8,753 2,791,579 130,709 485,263 173,886 3,936,914 76,868 320,300 83,220 480,387 4,417,301
Total
Liabilities
Total
Domestic liabilities Foreign liabilities
Liabilities to banks
Borrowings1
Liabilities to non-monetary
sectors
Total
11 12=9+10+11 13 14 15 16=4+12+.+15 20=17+18+1917 18 21
Other for. curr. liabilities to
govt.1
TotalSecurities
issuedCapital and
reservesOther
liabilities Deposits
19

28
�������������
Monthly Bulletin
1.5. Deposit Money Banks’ Claims on Domestic Non-monetary SectorsMONEY
AND
BANKS
Column
Code
1991 31. Dec. 5,858 31,957 30,595 68,410 1,870 3,133 5,003 1,132 74,5451992 31. Dec. 8,634 69,157 61,399 139,190 11,543 17,443 28,986 6,779 174,9551993 31. Dec. 16,172 91,359 110,255 217,786 11,914 188,257 200,172 6,186 424,1431994 31. Dec. 25,173 141,712 151,834 318,719 10,704 229,843 240,547 14,812 574,0781995 31. Dec. 33,690 201,767 268,076 503,533 16,954 266,913 283,866 17,091 804,4901996 31. Dec. 39,012 223,784 364,200 626,996 13,343 281,998 295,341 16,209 938,5471997 31. Dec. 47,740 262,670 448,887 759,297 19,165 294,935 314,100 16,788 1,090,1851998 31. Dec. 57,074 323,942 580,271 961,287 49,904 287,836 337,740 20,044 1,319,0711999 31. Dec. 67,409 404,342 715,648 1,187,399 75,140 255,477 330,617 27,755 1,545,7722000 31. Dec. 77,856 497,606 793,113 1,368,576 102,395 253,332 355,726 30,589 1,754,8922001 31. Dec. 87,005 585,226 905,967 1,578,198 162,771 262,675 425,446 32,643 2,036,288 2001 30. Jun. 85,638 550,594 837,044 1,473,276 140,843 263,315 404,158 33,023 1,910,457 31. Jul. 84,800 561,637 842,178 1,488,615 146,096 265,068 411,164 33,074 1,932,853 31. Aug. 87,948 564,564 848,386 1,500,898 155,709 259,517 415,227 33,169 1,949,293 30. Sep. 98,066 570,785 852,754 1,521,605 159,797 260,820 420,617 33,085 1,975,307 31. Oct. 98,593 590,791 862,172 1,551,557 162,601 256,509 419,110 32,824 2,003,491 30. Nov. 99,611 582,093 870,893 1,552,598 167,251 257,698 424,950 33,078 2,010,626 31. Dec. 87,005 * 585,226 * 905,967 * 1,578,198 * 162,771 * 262,675 * 425,446 * 32,643 * 2,036,288 *
2002 31. Jan. 90,547 * 583,416 * 903,744 1,577,706 * 188,698 262,511 451,209 32,168 * 2,061,084 *
28. Feb. 82,954 596,989 907,208 1,587,151 208,640 252,607 461,247 31,962 2,080,361
1991 31. Dec. 2,277 30,895 21,377 54,549 1,333 165 1,499 968 57,0161992 31. Dec. 4,036 64,992 42,453 111,481 5,145 15,066 20,211 6,118 137,8101993 31. Dec. 2,902 82,795 69,115 154,812 2,519 15,279 17,799 5,647 178,2571994 31. Dec. 6,248 129,730 78,680 214,658 6,434 15,423 21,858 13,045 249,5611995 31. Dec. 7,109 188,829 131,812 327,749 6,772 16,703 23,475 12,866 364,0901996 31. Dec. 5,554 208,974 185,655 400,183 7,756 16,379 24,135 13,881 438,2001997 31. Dec. 6,206 234,447 225,713 466,365 11,962 11,725 23,688 14,404 504,4571998 31. Dec. 7,082 294,903 272,305 574,290 33,772 13,107 46,879 15,322 636,4901999 31. Dec. 6,759 347,933 272,012 626,703 36,733 11,880 48,614 17,526 692,8432000 31. Dec. 8,065 422,579 292,729 723,373 47,094 12,360 59,454 17,043 799,8692001 31. Dec. 10,018 503,909 349,541 863,468 66,637 2,145 68,782 17,552 949,802 2001 30. Jun. 10,694 481,142 309,688 801,524 48,725 12,823 61,548 17,982 881,054 31. Jul. 11,448 489,079 312,492 813,019 50,159 12,897 63,056 17,971 894,046 31. Aug. 11,304 485,573 316,539 813,415 52,107 12,974 65,080 18,061 896,556 30. Sep. 11,895 490,725 318,362 820,982 55,719 12,686 68,405 18,021 907,408 31. Oct. 11,000 491,938 320,218 823,156 56,510 12,727 69,237 17,623 910,016 30. Nov. 12,382 483,586 326,498 822,466 63,488 12,576 76,064 17,836 916,366 31. Dec. 10,018 * 503,909 * 349,541 * 863,468 * 66,637 * 2,145 * 68,782 * 17,552 * 949,802 *
2002 31. Jan. 13,275 * 499,812 * 351,776 864,863 * 65,463 2,161 67,625 16,650 * 949,138 *
28. Feb. 13,622 498,303 351,883 863,808 67,725 2,161 69,887 16,828 950,523
1991 31. Dec. 73 0 845 918 536 2,959 3,495 - 4,4141992 31. Dec. 21 0 3,086 3,106 6,398 2,373 8,771 - 11,8781993 31. Dec. 172 100 3,004 3,276 9,395 172,961 182,357 - 185,6331994 31. Dec. 758 0 2,837 3,594 4,270 214,380 218,650 - 222,2441995 31. Dec. 210 0 2,524 2,735 10,182 249,877 260,059 - 262,7931996 31. Dec. 369 0 2,919 3,288 5,587 265,028 270,614 - 273,9021997 31. Dec. 1,085 10 11,289 12,384 7,203 282,927 290,130 - 302,5141998 31. Dec. 2,932 90 34,999 38,021 16,132 274,713 290,844 - 328,8651999 31. Dec. 2,511 8,316 86,077 96,904 38,407 242,328 280,735 0 377,6392000 31. Dec. 4,373 5,550 97,791 107,714 55,301 239,647 294,948 0 402,6622001 31. Dec. 3,024 3,482 123,562 130,068 95,891 260,451 356,342 0 486,410 2001 30. Jun. 11,956 5,433 104,963 122,352 92,118 248,977 341,095 0 463,447 31. Jul. 6,938 2,984 104,014 113,936 95,937 250,635 346,572 0 460,509 31. Aug. 7,269 8,884 104,385 120,538 103,602 244,998 348,601 0 469,139 30. Sep. 15,040 8,777 104,908 128,725 104,078 246,566 350,644 0 479,370 31. Oct. 15,550 23,181 111,003 149,734 106,091 242,659 348,750 0 498,485 30. Nov. 15,405 17,334 111,502 144,242 103,763 244,603 348,366 0 492,609 31. Dec. 3,024 * 3,482 * 123,562 * 130,068 * 95,891 * 260,451 * 356,342 * 0 486,410 *
2002 31. Jan. 5,283 * 3,458 117,921 126,661 * 122,991 260,272 383,262 0 509,924 *
28. Feb. 2,233 13,457 118,340 134,030 140,671 250,368 391,039 0 525,069
Millions of Tolars
Overdrafts etc. Up to 1 year Over 1 year
Tolar loans
5 6
Claims
7=5+6 8
Tolar claims
Central government
Total
3 4=1+2+3 9=4+7+82
Enterprises and non-profit institutions
1
Shares and participations
Total
Total Marketable Investment
Commercial papers and bonds
Total
29
�������������
Monthly Bulletin
MONEY
AND
BANKS
1.5. Deposit Money Banks’ Claims on Domestic Non-monetary Sectors
1,638 4,461 53,191 59,290 0 59,290 133,8361,921 6,735 78,336 86,991 0 86,991 261,9462,479 7,753 85,870 96,102 6,314 102,416 526,5591,281 21,923 74,625 97,828 6,289 104,118 678,195
15 29,644 83,621 113,280 4,550 117,829 922,319386 16,912 81,626 98,924 8,100 107,025 1,045,571811 18,081 74,406 93,298 12,290 105,588 1,195,773
1,525 57,384 79,480 138,389 9,832 148,221 1,467,292761 70,139 116,864 187,764 19,724 207,488 1,753,260
1,275 90,487 170,144 261,906 31,009 292,915 2,047,8072,843 93,893 227,814 324,550 31,744 356,293 2,392,581
1,443 96,148 180,246 277,836 35,066 312,902 2,223,3601,229 96,365 187,534 285,128 35,214 320,341 2,253,1941,546 97,826 197,780 297,152 32,544 329,697 2,278,9902,555 98,358 203,224 304,138 32,613 336,751 2,312,0581,610 101,173 214,983 317,765 32,363 350,129 2,353,6201,632 98,648 221,807 322,086 31,461 353,547 2,364,1732,843 * 93,893 * 227,814 * 324,550 * 31,744 356,293 * 2,392,581 *
2,828 96,510 * 240,965 * 340,304 * 31,895 372,199 * 2,433,283 *
2,432 97,102 257,596 357,130 33,843 390,973 2,471,333
1,638 4,461 48,528 54,627 0 54,627 111,6431,917 6,735 68,381 77,033 0 77,033 214,8432,471 7,753 72,745 82,969 0 82,969 261,2271,270 12,187 62,872 76,329 0 76,329 325,890
2 11,071 58,403 69,476 0 69,476 433,567368 16,094 54,924 71,386 0 71,386 509,585717 18,081 46,952 65,751 0 65,751 570,208
1,397 47,911 51,012 100,320 0 100,320 736,811626 69,374 84,733 154,733 834 155,567 848,410
1,144 88,011 132,454 221,609 802 222,411 1,022,2802,699 92,070 204,968 299,736 0 299,736 1,249,538
1,294 94,124 158,382 253,799 0 253,799 1,134,8531,016 94,354 165,171 260,541 0 260,541 1,154,5881,349 95,781 176,093 273,223 0 273,223 1,169,7792,394 96,460 181,332 280,187 0 280,187 1,187,5951,451 99,324 192,417 293,192 0 293,192 1,203,2081,482 96,839 198,965 297,285 0 297,285 1,213,6512,699 92,070 * 204,968 * 299,736 * 0 299,736 * 1,249,538 *
2,635 95,113 * 217,515 * 315,263 * 65 315,328 * 1,264,466 *
2,275 95,743 226,011 324,029 109 324,138 1,274,660
- 0 4,663 4,663 0 4,663 9,077- 0 9,955 9,955 0 9,955 21,832- 0 13,125 13,125 6,314 19,439 205,072- 9,736 11,753 21,489 6,289 27,778 250,022- 15,415 25,218 40,632 4,550 45,182 307,976- 64 26,703 26,767 8,100 34,867 308,769- 0 27,453 27,453 12,290 39,744 342,257- 9,473 23,884 33,358 9,832 43,189 372,054- 28 23,757 23,785 18,890 42,675 420,314- 29 24,561 24,590 30,208 54,798 457,460- 139 5,665 5,804 31,744 37,548 523,958
- 69 6,898 6,967 35,066 42,033 505,480- 58 6,779 6,838 35,214 42,051 502,560- 85 6,217 6,302 32,544 38,846 507,985- 85 5,747 5,833 32,613 38,446 517,815- 85 5,872 5,957 32,363 38,321 536,805- 86 5,960 6,046 31,461 37,507 530,116- 139 5,665 5,804 31,744 37,548 523,958 *
- 135 5,763 5,898 31,830 37,728 547,653 *
- 131 13,828 13,959 33,734 47,693 572,762
TotalTotal
Over 1 year
Foreign currency loans
Total
Foreign currency securities
Claims
Up to 1 year
Total
11 12 13=10+11+12 16=9+15
Enterprises and non-profit institutions
Central government
Foreign currency claims
10 14 15=13+14
Overdrafts etc.
�������(continued)

30
�������������
Monthly Bulletin
1.5. Deposit Money Banks’ Claims on Domestic Non-monetary Sectors (continued)
MONEY
AND
BANKS
Column
Code
1991 31. Dec. 3,380 758 6,233 10,371 - - - - 10,371 0 10,3711992 31. Dec. 4,502 3,492 14,018 22,012 - - - - 22,012 4 22,0161993 31. Dec. 12,954 6,989 35,274 55,217 - - - - 55,217 7 55,2251994 31. Dec. 17,788 8,402 65,366 91,556 - - - - 91,556 11 91,5671995 31. Dec. 26,287 7,298 126,890 160,475 - - - - 160,475 13 160,4881996 31. Dec. 32,996 5,894 168,312 207,203 - - - - 207,203 18 207,2211997 31. Dec. 40,336 6,344 194,128 240,807 - - - - 240,807 94 240,9011998 31. Dec. 46,955 7,902 247,838 302,695 - - - - 302,695 127 302,8221999 31. Dec. 57,897 26,650 351,401 435,947 - - - - 435,947 2,962 438,9102000 31. Dec. 65,196 32,210 394,436 491,842 - - - - 491,842 3,144 494,9862001 31. Dec. 73,832 37,883 420,489 532,204 - - - - 532,204 3,580 535,784 2001 30. Jun. 62,777 35,029 411,525 509,331 - - - - 509,331 3,566 512,897 31. Jul. 66,184 36,263 414,328 516,775 - - - - 516,775 3,660 520,435 31. Aug. 69,125 36,978 415,909 522,012 - - - - 522,012 3,601 525,613 30. Sep. 70,858 37,477 417,976 526,311 - - - - 526,311 3,547 529,858 31. Oct. 71,955 38,034 419,350 529,339 - - - - 529,339 3,597 532,936 30. Nov. 71,703 38,223 420,434 530,360 - - - - 530,360 3,559 533,919 31. Dec. 73,832 37,883 420,489 532,204 - - - - 532,204 3,580 535,784 2002 31. Jan. 71,836 37,688 421,468 530,992 - - - - 530,992 3,748 534,740 28. Feb. 66,973 38,120 424,327 529,420 - - - - 529,420 3,661 533,081
1991 31. Dec. - 52 2,102 2,154 0 9 9 82 2,245 - 2,2451992 31. Dec. - 416 1,781 2,198 0 3 3 145 2,346 - 2,3461993 31. Dec. - 535 2,308 2,842 0 16 16 145 3,004 - 3,0041994 31. Dec. - 1,612 3,536 5,148 0 40 40 0 5,188 - 5,1881995 31. Dec. - 2,081 5,430 7,511 0 28 28 0 7,539 - 7,5391996 31. Dec. - 3,969 6,628 10,597 0 23 23 0 10,620 - 10,6201997 31. Dec. - 14,653 15,373 30,026 0 17 17 4 30,046 - 30,0461998 31. Dec. - 11,919 23,310 35,230 0 9 9 4 35,242 - 35,2421999 31. Dec. - 4,217 2,262 6,479 0 1,268 1,268 0 7,746 60 7,8072000 31. Dec. - 16,280 3,867 20,147 0 1,325 1,325 0 21,473 52 21,5252001 31. Dec. - 19,933 4,287 24,220 0 0 0 0 24,220 27 24,247 2001 30. Jun. - 6,526 3,351 9,878 0 1,448 1,448 0 11,326 33 11,360 31. Jul. - 11,769 3,285 15,054 0 1,468 1,468 0 16,521 34 16,555 31. Aug. - 11,790 3,360 15,150 0 1,478 1,478 0 16,628 34 16,662 30. Sep. - 11,672 3,344 15,016 0 1,500 1,500 0 16,516 34 16,549 31. Oct. - 16,297 3,471 19,767 0 1,054 1,054 0 20,821 34 20,855 30. Nov. - 20,245 3,469 23,713 0 410 410 0 24,123 34 24,157 31. Dec. - 19,933 4,287 24,220 0 0 0 0 24,220 27 24,247 2002 31. Jan. - 20,861 4,177 25,037 0 0 0 0 25,037 27 25,065 28. Feb. - 25,874 4,124 29,998 0 0 0 0 29,998 27 30,026
1991 31. Dec. 128 252 38 418 0 0 0 82 500 0 5001992 31. Dec. 76 256 61 393 0 0 0 516 909 0 9091993 31. Dec. 145 939 555 1,639 0 0 0 394 2,032 0 2,0321994 31. Dec. 379 1,967 1,416 3,761 0 0 0 1,767 5,528 0 5,5281995 31. Dec. 84 3,559 1,420 5,063 0 305 305 4,224 9,592 3,157 12,7491996 31. Dec. 92 4,946 687 5,725 0 569 569 2,328 8,622 754 9,3761997 31. Dec. 114 7,217 2,383 9,714 0 266 266 2,380 12,361 0 12,3611998 31. Dec. 105 9,128 1,819 11,052 0 7 7 4,719 15,779 4,584 20,3631999 31. Dec. 243 17,226 3,897 21,366 0 1 1 10,229 31,596 6,223 37,8192000 31. Dec. 223 20,987 4,290 25,499 0 0 0 13,547 39,046 12,510 51,5562001 31. Dec. 131 20,019 8,089 28,239 244 78 322 15,091 43,652 15,402 59,054 2001 30. Jun. 210 22,465 7,517 30,192 0 67 67 15,040 45,299 13,470 58,769 31. Jul. 230 21,542 8,059 29,832 0 68 68 15,102 45,002 14,055 59,057 31. Aug. 250 21,340 8,192 29,782 0 68 68 15,108 44,958 13,993 58,951 30. Sep. 273 22,134 8,165 30,571 0 68 68 15,063 45,703 14,537 60,240 31. Oct. 88 21,341 8,131 29,561 0 69 69 15,201 44,830 14,986 59,816 30. Nov. 121 22,705 8,990 31,816 0 109 109 15,242 47,167 15,162 62,330 31. Dec. 131 20,019 * 8,089 * 28,239 * 244 78 322 15,091 * 43,652 * 15,402 * 59,054 *
2002 31. Jan. 154 21,597 8,401 30,152 244 78 322 15,518 45,992 15,368 61,360 28. Feb. 126 21,236 8,533 29,895 244 78 322 15,134 45,351 15,453 60,804
Marketable InvestmentTotalOverdrafts
etc.Up to 1 year Over 1 year
1 2
Nonmonetary financial institutions
11=9+10109=4+7+87=5+6 8
Individuals
Other general government
5 63 4=1+2+3
Millions of Tolars
Total
Claims
Foreign currency claimsTotal
Tolar claims
Shares and participations
Tolar loans Commercial papers and bonds
Total

31
�������������
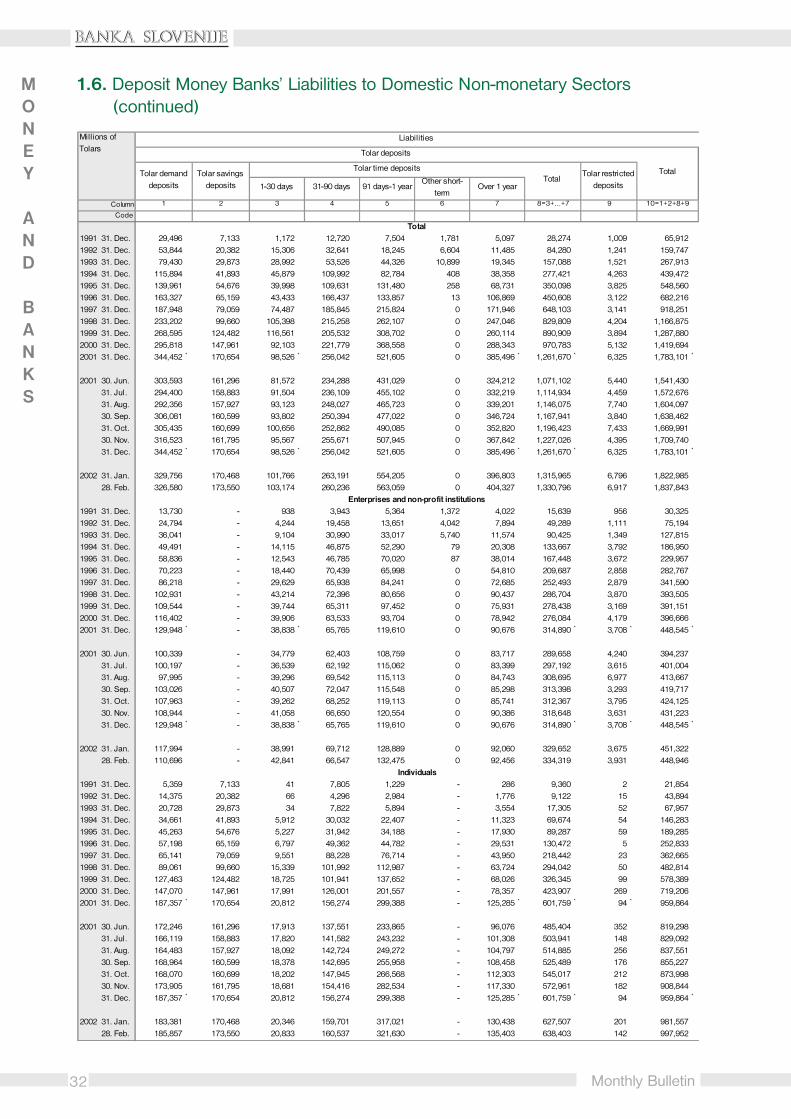
Monthly Bulletin
1.6. Deposit Money Banks’ Liabilities to Domestic Non-monetary Sectors MONEY
AND
BANKS
Column
Code
1991 31. Dec. 10,372 167 972 892 251 748 3,030 51 13,454 27 13,4801992 31. Dec. 14,542 10,889 8,887 1,608 1,244 1,736 24,364 115 39,021 64 39,0851993 31. Dec. 22,442 19,686 14,713 5,415 1,049 3,646 44,509 121 67,071 122 67,1931994 31. Dec. 31,084 25,136 21,713 7,443 170 4,875 59,337 418 90,839 170 91,0091995 31. Dec. 35,103 20,432 15,643 21,184 0 8,290 65,549 94 100,746 202 100,9481996 31. Dec. 34,410 16,290 23,514 12,862 0 12,344 65,010 260 99,679 50,871 150,5501997 31. Dec. 33,318 30,385 22,045 25,358 0 14,039 91,828 158 125,303 53,105 178,4081998 31. Dec. 37,127 41,721 33,121 29,942 0 24,349 129,133 135 166,396 45,512 211,9081999 31. Dec. 26,448 50,308 34,172 27,168 0 27,328 138,976 490 165,914 47,971 213,8852000 31. Dec. 25,749 22,075 26,812 26,168 0 32,892 107,948 527 134,224 41,157 175,3812001 31. Dec. 21,201 28,448 24,492 36,181 0 35,692 124,814 269 146,284 9,430 155,714 2001 30. Jun. 24,071 18,805 26,897 30,782 0 34,258 110,742 695 135,508 24,811 160,319 31. Jul. 22,388 28,211 22,867 34,751 0 34,070 119,900 413 142,701 24,551 167,251 31. Aug. 24,789 27,267 24,655 36,665 0 34,428 123,015 359 148,163 24,152 172,315 30. Sep. 26,767 22,914 25,603 38,576 0 34,151 121,244 245 148,257 24,016 172,273 31. Oct. 24,272 32,152 26,582 36,423 0 33,898 129,055 371 153,698 23,756 177,454 30. Nov. 25,339 23,881 25,382 35,107 0 35,352 119,721 258 145,318 24,218 169,536 31. Dec. 21,201 28,448 24,492 36,181 0 35,692 124,814 269 146,284 9,430 155,714 2002 31. Jan. 21,270 32,099 24,057 38,124 0 37,340 131,620 385 153,275 10,247 163,521 28. Feb. 23,053 28,587 23,430 40,534 0 38,671 131,222 274 154,550 10,206 164,756
1991 31. Dec. 35 26 0 19 157 42 244 - 279 2,732 3,0111992 31. Dec. 133 107 0 2 1,318 79 1,505 - 1,638 4,363 6,0001993 31. Dec. 219 168 0 1 4,110 572 4,850 - 5,069 4,853 9,9221994 31. Dec. 658 716 11,372 644 159 1,852 14,743 - 15,401 1,637 17,0371995 31. Dec. 759 1,796 15,262 6,088 172 4,496 27,814 0 28,573 673 29,2451996 31. Dec. 1,496 1,905 23,122 10,215 13 10,184 45,440 0 46,936 364 47,3001997 31. Dec. 3,272 4,922 9,634 29,511 0 41,273 85,340 81 88,693 0 88,6931998 31. Dec. 4,082 5,124 7,749 38,520 0 68,536 119,929 149 124,160 0 124,1601999 31. Dec. 5,139 7,783 4,108 46,430 0 88,830 147,151 137 152,426 528 152,9542000 31. Dec. 6,596 12,131 5,432 47,129 0 98,152 162,845 157 169,598 2,427 172,0242001 31. Dec. 5,946 10,429 9,511 66,425 0 133,842 220,207 2,255 228,408 10,644 239,052 2001 30. Jun. 6,937 10,075 7,438 57,623 0 110,162 185,298 152 192,388 7,803 200,190 31. Jul. 5,695 8,933 9,468 62,057 0 113,442 193,900 282 199,878 8,806 208,684 31. Aug. 5,088 8,467 11,106 64,674 0 115,233 199,480 148 204,716 8,323 213,039 30. Sep. 7,325 12,003 10,050 66,940 0 118,817 207,810 126 215,261 8,931 224,192 31. Oct. 5,131 11,040 10,084 67,981 0 120,879 209,984 3,055 218,169 8,877 227,046 30. Nov. 8,335 11,947 9,224 69,751 0 124,774 215,696 324 224,356 9,682 234,037 31. Dec. 5,946 10,429 9,511 66,425 0 133,842 220,207 2,255 228,408 10,644 239,052 2002 31. Jan. 7,111 10,330 9,720 70,171 0 136,964 227,186 2,534 236,831 10,719 247,550 28. Feb. 6,973 10,913 9,721 68,421 0 137,797 226,852 2,570 236,395 11,731 248,126
Millions of Tolars
TotalForeign currency
liabilities
Total
Liabilities
Other short-term
Over 1 year
Tolar deposits
Tolar demand deposits
Tolar time deposits
Total general government
Nonmonetary financial institutions
TotalTolar
restricted deposits1-30 days 31-90 days
91 days-1 year
1 2 3 4 5 6 7=2+...+6 8 11=9+109=1+7+8 10
32
�������������
Monthly Bulletin
1.6. Deposit Money Banks’ Liabilities to Domestic Non-monetary Sectors (continued)
MONEY
AND
BANKS
Column
Code
1991 31. Dec. 29,496 7,133 1,172 12,720 7,504 1,781 5,097 28,274 1,009 65,9121992 31. Dec. 53,844 20,382 15,306 32,641 18,245 6,604 11,485 84,280 1,241 159,7471993 31. Dec. 79,430 29,873 28,992 53,526 44,326 10,899 19,345 157,088 1,521 267,9131994 31. Dec. 115,894 41,893 45,879 109,992 82,784 408 38,358 277,421 4,263 439,4721995 31. Dec. 139,961 54,676 39,998 109,631 131,480 258 68,731 350,098 3,825 548,5601996 31. Dec. 163,327 65,159 43,433 166,437 133,857 13 106,869 450,608 3,122 682,2161997 31. Dec. 187,948 79,059 74,487 185,845 215,824 0 171,946 648,103 3,141 918,2511998 31. Dec. 233,202 99,660 105,398 215,258 262,107 0 247,046 829,809 4,204 1,166,8751999 31. Dec. 268,595 124,482 116,561 205,532 308,702 0 260,114 890,909 3,894 1,287,8802000 31. Dec. 295,818 147,961 92,103 221,779 368,558 0 288,343 970,783 5,132 1,419,6942001 31. Dec. 344,452 * 170,654 98,526 * 256,042 521,605 0 385,496 * 1,261,670 * 6,325 1,783,101 *
2001 30. Jun. 303,593 161,296 81,572 234,288 431,029 0 324,212 1,071,102 5,440 1,541,430 31. Jul. 294,400 158,883 91,504 236,109 455,102 0 332,219 1,114,934 4,459 1,572,676 31. Aug. 292,356 157,927 93,123 248,027 465,723 0 339,201 1,146,075 7,740 1,604,097 30. Sep. 306,081 160,599 93,802 250,394 477,022 0 346,724 1,167,941 3,840 1,638,462 31. Oct. 305,435 160,699 100,656 252,862 490,085 0 352,820 1,196,423 7,433 1,669,991 30. Nov. 316,523 161,795 95,567 255,671 507,945 0 367,842 1,227,026 4,395 1,709,740 31. Dec. 344,452 * 170,654 98,526 * 256,042 521,605 0 385,496 * 1,261,670 * 6,325 1,783,101 *
2002 31. Jan. 329,756 170,468 101,766 263,191 554,205 0 396,803 1,315,965 6,796 1,822,985 28. Feb. 326,580 173,550 103,174 260,236 563,059 0 404,327 1,330,796 6,917 1,837,843
1991 31. Dec. 13,730 - 938 3,943 5,364 1,372 4,022 15,639 956 30,3251992 31. Dec. 24,794 - 4,244 19,458 13,651 4,042 7,894 49,289 1,111 75,1941993 31. Dec. 36,041 - 9,104 30,990 33,017 5,740 11,574 90,425 1,349 127,8151994 31. Dec. 49,491 - 14,115 46,875 52,290 79 20,308 133,667 3,792 186,9501995 31. Dec. 58,836 - 12,543 46,785 70,020 87 38,014 167,448 3,672 229,9571996 31. Dec. 70,223 - 18,440 70,439 65,998 0 54,810 209,687 2,858 282,7671997 31. Dec. 86,218 - 29,629 65,938 84,241 0 72,685 252,493 2,879 341,5901998 31. Dec. 102,931 - 43,214 72,396 80,656 0 90,437 286,704 3,870 393,5051999 31. Dec. 109,544 - 39,744 65,311 97,452 0 75,931 278,438 3,169 391,1512000 31. Dec. 116,402 - 39,906 63,533 93,704 0 78,942 276,084 4,179 396,6662001 31. Dec. 129,948 * - 38,838 * 65,765 119,610 0 90,676 314,890 * 3,708 * 448,545 *
2001 30. Jun. 100,339 - 34,779 62,403 108,759 0 83,717 289,658 4,240 394,237 31. Jul. 100,197 - 36,539 62,192 115,062 0 83,399 297,192 3,615 401,004 31. Aug. 97,995 - 39,296 69,542 115,113 0 84,743 308,695 6,977 413,667 30. Sep. 103,026 - 40,507 72,047 115,548 0 85,298 313,398 3,293 419,717 31. Oct. 107,963 - 39,262 68,252 119,113 0 85,741 312,367 3,795 424,125 30. Nov. 108,944 - 41,058 66,650 120,554 0 90,386 318,648 3,631 431,223 31. Dec. 129,948 * - 38,838 * 65,765 119,610 0 90,676 314,890 * 3,708 * 448,545 *
2002 31. Jan. 117,994 - 38,991 69,712 128,889 0 92,060 329,652 3,675 451,322 28. Feb. 110,696 - 42,841 66,547 132,475 0 92,456 334,319 3,931 448,946
1991 31. Dec. 5,359 7,133 41 7,805 1,229 - 286 9,360 2 21,8541992 31. Dec. 14,375 20,382 66 4,296 2,984 - 1,776 9,122 15 43,8941993 31. Dec. 20,728 29,873 34 7,822 5,894 - 3,554 17,305 52 67,9571994 31. Dec. 34,661 41,893 5,912 30,032 22,407 - 11,323 69,674 54 146,2831995 31. Dec. 45,263 54,676 5,227 31,942 34,188 - 17,930 89,287 59 189,2851996 31. Dec. 57,198 65,159 6,797 49,362 44,782 - 29,531 130,472 5 252,8331997 31. Dec. 65,141 79,059 9,551 88,228 76,714 - 43,950 218,442 23 362,6651998 31. Dec. 89,061 99,660 15,339 101,992 112,987 - 63,724 294,042 50 482,8141999 31. Dec. 127,463 124,482 18,725 101,941 137,652 - 68,026 326,345 99 578,3892000 31. Dec. 147,070 147,961 17,991 126,001 201,557 - 78,357 423,907 269 719,2062001 31. Dec. 187,357 * 170,654 20,812 156,274 299,388 - 125,285 * 601,759 * 94 * 959,864 2001 30. Jun. 172,246 161,296 17,913 137,551 233,865 - 96,076 485,404 352 819,298 31. Jul. 166,119 158,883 17,820 141,582 243,232 - 101,308 503,941 148 829,092 31. Aug. 164,483 157,927 18,092 142,724 249,272 - 104,797 514,885 256 837,551 30. Sep. 168,964 160,599 18,378 142,695 255,958 - 108,458 525,489 176 855,227 31. Oct. 168,070 160,699 18,202 147,945 266,568 - 112,303 545,017 212 873,998 30. Nov. 173,905 161,795 18,681 154,416 282,534 - 117,330 572,961 182 908,844 31. Dec. 187,357 * 170,654 20,812 156,274 299,388 - 125,285 * 601,759 * 94 959,864 *
2002 31. Jan. 183,381 170,468 20,346 159,701 317,021 - 130,438 627,507 201 981,557 28. Feb. 185,857 173,550 20,833 160,537 321,630 - 135,403 638,403 142 997,952
Total
Liabilities
Enterprises and non-profit institutions
31-90 days 91 days-1 year
5
Other short-term
Over 1 year
Individuals
Tolar deposits
TotalTolar restricted
depositsTolar demand
depositsTolar savings
deposits
Tolar time deposits
1-30 days
10=1+2+8+98=3+...+7 9
Millions of Tolars
Total
73 4 61 2

33
�������������
Monthly Bulletin
1.6. Deposit Money Banks’ Liabilities to Domestic Non-monetary Sectors (continued)
MONEY
AND
BANKS
7,376 30,031 2,611 15,202 17,812 7,962 63,181 129,09325,784 36,296 28,594 25,829 54,423 11,704 128,207 287,95540,068 39,989 63,870 47,872 111,742 18,512 210,311 478,22449,912 55,231 87,428 41,054 128,482 11,831 245,455 684,92764,145 85,335 111,633 53,333 164,966 10,977 325,422 873,98268,188 115,019 149,559 33,437 182,996 68,833 435,035 1,117,25165,975 117,202 167,933 34,679 202,612 71,734 457,522 1,375,77366,048 126,572 181,786 39,443 221,228 59,499 473,348 1,640,22397,130 142,907 201,683 45,954 247,637 57,550 545,224 1,833,104
117,302 147,429 306,788 79,360 386,148 53,188 704,067 2,123,761154,248 233,091 399,730 104,659 504,388 39,061 * 930,788 * 2,713,889 *
126,896 154,707 353,466 98,577 452,043 52,264 785,910 2,327,341129,165 152,852 362,650 100,643 463,293 45,859 791,170 2,363,845132,141 153,855 370,541 101,409 471,950 41,523 799,469 2,403,566131,392 159,397 366,031 102,217 468,247 49,742 808,779 2,447,241130,725 168,184 374,361 102,826 477,187 46,803 822,900 2,492,891144,058 181,543 391,103 103,655 494,758 46,289 866,648 2,576,388154,248 233,091 399,730 104,659 504,388 39,061 * 930,788 * 2,713,889 *
158,372 222,211 428,063 104,558 532,620 32,721 945,924 2,768,909155,569 224,787 432,404 107,123 539,526 33,855 953,736 2,791,579
1,051 - 0 0 0 7,956 9,007 39,3323,785 - 247 95 342 11,633 15,759 90,9534,327 - 3,676 149 3,825 18,512 26,663 154,4795,739 - 934 249 1,183 11,831 18,753 205,7024,016 - 505 166 671 10,977 15,664 245,6205,706 - 347 116 463 18,207 24,377 307,1445,065 - 541 63 605 18,879 24,549 366,1394,324 - 957 3 960 14,251 19,535 413,040
27,417 - 4,014 6 4,020 10,109 41,547 432,69744,427 - 28,765 47 28,812 12,738 85,978 482,64451,762 * - 31,848 275 32,123 30,515 * 114,400 * 562,945 *
49,624 - 39,604 256 39,859 28,271 117,755 511,99254,016 - 38,354 261 38,615 22,434 115,066 516,07056,422 - 43,345 286 43,631 18,814 118,867 532,53454,834 - 35,172 284 35,456 27,156 117,446 537,16351,376 - 35,421 271 35,692 23,940 111,007 535,13360,464 - 34,041 271 34,312 22,969 117,745 548,96751,762 * - 31,848 275 32,123 30,515 * 114,400 * 562,945 *
58,244 - 39,764 284 40,047 24,005 122,297 573,61954,586 - 46,572 286 46,857 25,102 126,546 575,491
6,298 30,031 2,611 12,470 15,081 6 51,416 73,27121,935 36,296 28,347 21,372 49,719 72 108,022 151,91635,619 39,989 60,195 42,869 103,064 - 178,673 246,63044,002 55,231 86,494 39,168 125,662 - 224,895 371,17859,927 85,335 111,127 52,494 163,622 - 308,884 498,16962,248 115,019 149,200 32,957 182,158 - 359,424 612,25760,673 117,202 167,378 34,615 201,994 - 379,869 742,53361,476 126,572 180,813 39,440 220,252 - 408,301 891,11468,659 142,907 197,665 45,947 243,612 - 455,179 1,033,56871,315 147,429 277,641 78,120 355,761 - 574,506 1,293,712
100,360 233,091 367,034 95,829 462,863 - 796,314 1,756,178 *
75,461 154,707 313,401 91,973 405,374 - 635,542 1,454,84073,065 152,852 323,410 93,420 416,830 - 642,747 1,471,83973,716 153,855 326,414 94,142 420,556 - 648,127 1,485,67874,894 159,397 329,595 94,500 424,095 - 658,386 1,513,61378,130 168,184 338,279 94,667 432,945 - 679,260 1,553,25882,119 181,543 356,437 94,905 451,342 - 715,004 1,623,847
100,360 233,091 367,034 95,829 462,863 - 796,314 1,756,178 *
97,542 222,211 387,064 95,846 482,910 - 802,662 1,784,21998,704 224,787 385,244 96,520 481,764 - 805,254 1,803,206
Enterprises and non-profit institutions
Short-term Long-term
11 12 14 18=10+17
Individuals
Foreign currency liabilities
Foreign currency restricted deposits
etc.Total
Foreign currency demand deposits
Foreign currency savings deposits
Foreign currency time deposits
13
Total
15=13+14 16
TotalTotal
Liabilities
17=11+12+15+16

34 ��
��
����
��
���
Monthly B
ulletin
MONEYANDBANKS
1.7. Deposit Money Banks’ Claims on Non-residents
Column
Code
1994 31. Dec. 12,591 227 12,818 25 12,843 156,597 16,981 9,391 26,372 182,970 13,539 29,965 51,732 278,206 291,0491995 31. Dec. 4 420 424 141 564 193,114 14,855 10,720 25,575 218,689 19,601 32,821 30,074 301,185 301,7501996 31. Dec. 0 150 150 106 256 252,458 16,910 12,221 29,132 281,590 20,218 31,969 31,141 364,918 365,1741997 31. Dec. 8,496 285 8,781 298 9,080 173,233 26,187 22,976 49,163 222,397 23,309 29,166 32,301 307,173 316,2531998 31. Dec. 0 441 441 497 939 177,168 25,216 24,220 49,437 226,604 31,520 30,814 32,969 321,908 322,8471999 31. Dec. 3,849 788 4,637 328 4,964 187,267 31,257 24,584 55,842 243,109 34,547 38,581 34,520 350,756 355,7202000 31. Dec. 15,673 414 16,087 1,260 17,347 258,896 39,362 27,481 66,843 325,739 47,380 35,418 37,001 445,538 462,8852001 31. Dec. 260,912 * 1,060 261,972 * 160 * 262,132 340,255 * 41,016 * 27,896 * 68,913 * 409,168 * 74,704 * 35,410 * 38,324 * 557,606 * 819,738 *
1999 30. Nov. 3,740 758 4,498 381 4,879 193,754 27,373 24,583 51,956 245,710 34,126 38,960 34,430 353,226 358,105 31. Dec. 3,849 788 4,637 328 4,964 187,267 31,257 24,584 55,842 243,109 34,547 38,581 34,520 350,756 355,720 2000 31. Jan. 3,872 704 4,576 414 4,990 187,497 28,388 24,685 53,074 240,571 34,925 37,846 34,726 348,068 353,057 29. Feb. 2,803 761 3,565 259 3,823 203,718 28,516 24,990 53,506 257,224 35,803 38,511 35,021 366,559 370,382 31. Mar. 1,615 3,253 4,868 161 5,029 204,308 29,329 25,503 54,832 259,140 36,121 38,759 35,295 369,315 374,344 30. Apr. 18,297 955 19,252 205 19,457 209,154 30,391 25,996 56,387 265,540 37,219 40,275 35,514 378,549 398,006 31. May 12,207 257 12,464 266 12,730 226,305 30,519 26,065 56,584 282,889 37,421 39,011 35,727 395,049 407,778 30. Jun. 12,096 593 12,688 152 12,841 227,074 30,125 26,179 56,304 283,378 37,367 37,006 35,931 393,682 406,523 31. Jul. 14,388 694 15,082 201 15,282 225,292 30,676 26,875 57,551 282,843 38,040 38,465 36,166 395,514 410,797 31. Aug. 11,517 768 12,285 167 12,452 234,773 31,951 27,458 59,408 294,182 39,936 37,616 36,611 408,344 420,797 30. Sep. 12,454 413 12,867 177 13,044 242,294 36,577 27,565 64,143 306,437 40,579 37,802 36,504 421,323 434,367 31. Oct. 17,211 564 17,774 177 17,951 240,273 39,286 28,106 67,393 307,665 42,136 38,359 36,678 424,838 442,789 30. Nov. 15,985 520 16,505 153 16,657 288,297 37,938 28,027 65,964 354,261 47,387 38,512 36,855 477,015 493,672 31. Dec. 15,673 414 16,087 1,260 17,347 258,896 39,362 27,481 66,843 325,739 47,380 35,418 37,001 445,538 462,885 2001 31. Jan. 20,347 299 20,647 1,219 21,866 270,567 36,768 27,448 64,217 334,784 54,170 36,507 37,268 462,728 484,594 28. Feb. 9,400 471 9,871 1,308 11,178 302,436 37,098 27,522 64,620 367,056 57,161 36,707 37,505 498,429 509,608 31. Mar. 20,080 339 20,419 189 20,609 304,768 37,616 28,204 65,820 370,588 54,959 37,945 37,666 501,157 521,766 30. Apr. 34,062 583 34,645 172 34,817 294,672 37,984 28,090 66,074 360,746 57,856 37,815 37,789 494,206 529,023 31. May 51,553 533 52,086 178 52,264 302,934 38,402 28,991 67,393 370,327 61,321 37,895 37,935 507,478 559,742 30. Jun. 63,688 567 64,255 149 64,404 283,627 39,647 28,657 68,303 351,930 63,557 38,519 38,054 492,061 556,464 31. Jul. 65,791 995 66,785 204 66,989 278,162 37,591 29,882 67,473 345,635 61,745 39,042 38,263 484,685 551,674 31. Aug. 86,643 876 87,519 178 87,697 269,057 37,150 28,837 65,987 335,045 63,613 38,351 38,351 475,360 563,057 30. Sep. 116,379 668 117,047 153 117,200 247,361 36,695 28,869 65,565 312,926 64,900 38,435 38,445 454,706 571,906 31. Oct. 148,895 523 149,418 172 149,590 253,666 37,404 30,007 67,410 321,076 65,920 38,746 38,530 464,273 613,863 30. Nov. 188,440 * 582 189,022 * 104 189,127 312,599 * 36,850 30,361 67,210 379,810 72,461 38,892 38,653 529,816 718,942 *
31. Dec. 260,912 * 1,060 261,972 * 160 * 262,132 340,255 * 41,016 * 27,896 * 68,913 * 409,168 * 74,704 * 35,410 * 38,324 * 557,606 * 819,738 *
2002 31. Jan. 255,376 * 5,307 260,683 * 105 * 260,788 334,246 41,110 32,467 73,577 407,823 71,341 38,950 38,533 556,647 817,435 *
28. Feb. 274,329 6,568 280,897 70 280,967 297,645 43,666 30,732 74,398 372,043 70,733 41,917 38,698 523,391 804,358
7 85=3+4 6 129=7+8 10=6+9
LoansCurrency and deposits
15=5+1413 14=10+…+1311
Total
TotalDeposits
Short-term loans Long-termShort-term
Tolar claims on non-monetary
sectors
Tolar claims
Total Total
Millions of Tolars
1 2 3=1+2 4
Tolar claims on banks
Claims on non-residents
Other foreign currency claims
For. curr. loans to non-monetary
sector
Foreign currency claims
Foreign currency
securitiesTotal
Foreign currency claims on banks
Total

35
��
��
����
��
���
Monthly B
ulletin
MONEYANDBANKS
1.8. Deposit Money Banks’ Liabilities to Non-residents
Column
Code
1994 31. Dec. 54 2,032 2,086 6,170 4,664 117,725 122,389 128,558 28,508 157,066 159,1531995 31. Dec. 216 1,759 1,975 2,434 4,288 139,972 144,259 146,693 38,201 184,894 186,8691996 31. Dec. 958 2,918 3,876 17,557 3,127 134,593 137,721 155,277 47,205 202,483 206,3581997 31. Dec. 401 3,762 4,162 18,914 1,572 129,230 130,801 149,716 52,416 202,132 206,2941998 31. Dec. 386 4,240 4,626 27,773 1,573 129,285 130,857 158,631 51,716 210,347 214,9731999 31. Dec. 3,698 6,538 10,236 36,525 4,606 183,704 188,310 224,835 48,292 273,126 283,3622000 31. Dec. 20,619 7,194 27,813 35,668 4,189 250,178 254,367 290,035 57,967 348,003 375,8162001 31. Dec. 42,399 * 15,546 * 57,945 * 29,788 2,024 277,700 279,723 309,511 74,373 * 383,884 * 441,829 *
1999 30. Nov. 4,087 6,771 10,858 18,330 338 179,251 179,589 197,919 47,563 245,482 256,340 31. Dec. 3,698 6,538 10,236 36,525 4,606 183,704 188,310 224,835 48,292 273,126 283,362 2000 31. Jan. 5,133 6,879 12,012 20,221 317 184,933 185,250 205,471 48,519 253,991 266,003 29. Feb. 5,734 6,819 12,553 19,116 380 188,091 188,471 207,587 49,977 257,564 270,117 31. Mar. 7,156 7,258 14,414 20,317 507 192,745 193,252 213,569 50,985 264,554 278,968 30. Apr. 7,637 6,743 14,380 21,981 713 201,376 202,090 224,071 51,476 275,547 289,927 31. May 10,290 7,002 17,292 23,276 1,101 201,020 202,121 225,397 50,708 276,105 293,398 30. Jun. 11,972 6,743 18,716 25,063 1,031 207,198 208,229 233,292 52,781 286,073 304,789 31. Jul. 14,942 6,739 21,682 21,619 853 210,189 211,042 232,661 51,749 284,410 306,092 31. Aug. 14,584 7,029 21,613 20,473 849 210,902 211,751 232,224 54,728 286,952 308,565 30. Sep. 19,353 6,796 26,149 21,407 840 212,404 213,244 234,651 56,158 290,808 316,957 31. Oct. 24,453 6,852 31,305 18,002 806 214,063 214,869 232,871 57,212 290,083 321,389 30. Nov. 20,494 7,159 27,653 18,812 924 250,933 251,857 270,669 58,537 329,206 356,859 31. Dec. 20,619 7,194 27,813 35,668 4,189 250,178 254,367 290,035 57,967 348,003 375,816 2001 31. Jan. 24,373 7,165 31,538 19,163 1,129 249,383 250,512 269,675 58,450 328,125 359,662 28. Feb. 25,619 7,031 32,650 23,231 1,121 250,880 252,001 275,232 58,437 333,669 366,318 31. Mar. 25,875 7,007 32,882 41,073 939 249,467 250,407 291,480 62,620 354,100 386,982 30. Apr. 34,556 7,166 41,722 30,622 746 254,812 255,558 286,180 62,055 348,235 389,957 31. May 32,443 7,070 39,513 22,073 1,376 262,355 263,730 285,803 64,592 350,396 389,909 30. Jun. 34,529 7,814 42,343 23,637 739 256,875 257,615 281,252 65,843 347,095 389,438 31. Jul. 38,992 7,708 46,701 25,266 736 261,005 261,741 287,007 65,263 352,270 398,971 31. Aug. 38,400 7,316 45,716 24,690 738 257,424 258,163 282,853 65,523 348,376 394,092 30. Sep. 36,299 8,435 44,734 26,345 740 256,495 257,235 283,580 66,041 349,621 394,355 31. Oct. 38,915 7,965 46,881 27,067 1,658 266,649 268,308 295,375 70,143 365,518 412,398 30. Nov. 39,114 10,238 49,353 27,313 1,455 278,098 279,554 306,866 71,043 377,909 427,262 31. Dec. 42,399 * 15,546 * 57,945 29,788 2,024 277,700 279,723 309,511 74,373 * 383,884 * 441,829 *
2002 31. Jan. 41,829 10,277 52,106 29,281 1,537 280,179 281,716 310,997 74,137 385,134 437,239 28. Feb. 71,654 8,996 80,650 41,349 1,747 282,417 284,164 325,513 74,224 399,737 480,387
TotalLoans
1 2 3=1+2
Tolar loans and deposits of banks
Tolar liabilities to non-monetary sectors
Total
Tolar liabilities
64
TotalTotalForeign currency
liabilities to non-monetary sectorsLong-term
Deposits
Foreign currency liabilities
Total
8=4+7
Short-term
Liabilities to non-residents
Foreign currency liabilities to banks
5 11=3+10
Millions of Tolars
9 10=8+97=5+6
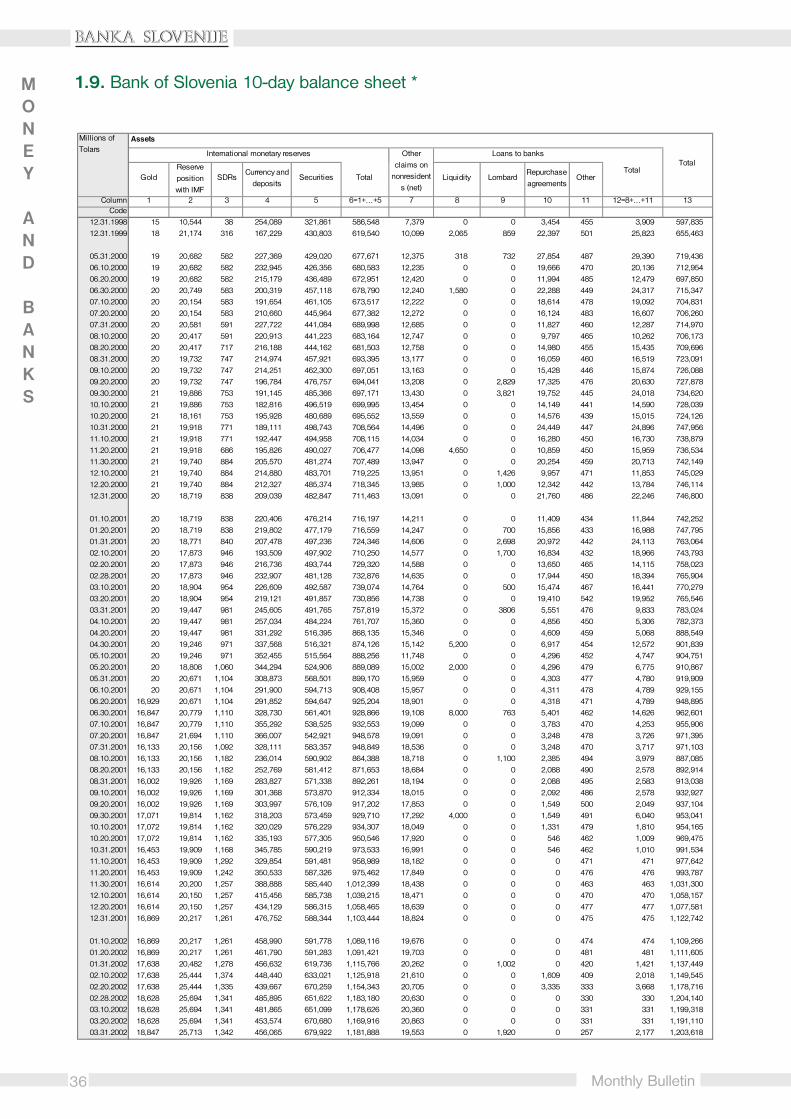
36
�������������
Monthly Bulletin
1.9. Bank of Slovenia 10-day balance sheet *
ColumnCode
12.31.1998 15 10,544 38 254,089 321,861 586,548 7,379 0 0 3,454 455 3,909 597,83512.31.1999 18 21,174 316 167,229 430,803 619,540 10,099 2,065 859 22,397 501 25,823 655,463
05.31.2000 19 20,682 582 227,369 429,020 677,671 12,375 318 732 27,854 487 29,390 719,43606.10.2000 19 20,682 582 232,945 426,356 680,583 12,235 0 0 19,666 470 20,136 712,95406.20.2000 19 20,682 582 215,179 436,489 672,951 12,420 0 0 11,994 485 12,479 697,85006.30.2000 20 20,749 583 200,319 457,118 678,790 12,240 1,580 0 22,288 449 24,317 715,34707.10.2000 20 20,154 583 191,654 461,105 673,517 12,222 0 0 18,614 478 19,092 704,83107.20.2000 20 20,154 583 210,660 445,964 677,382 12,272 0 0 16,124 483 16,607 706,26007.31.2000 20 20,581 591 227,722 441,084 689,998 12,685 0 0 11,827 460 12,287 714,97008.10.2000 20 20,417 591 220,913 441,223 683,164 12,747 0 0 9,797 465 10,262 706,17308.20.2000 20 20,417 717 216,188 444,162 681,503 12,758 0 0 14,980 455 15,435 709,69608.31.2000 20 19,732 747 214,974 457,921 693,395 13,177 0 0 16,059 460 16,519 723,09109.10.2000 20 19,732 747 214,251 462,300 697,051 13,163 0 0 15,428 446 15,874 726,08809.20.2000 20 19,732 747 196,784 476,757 694,041 13,208 0 2,829 17,325 476 20,630 727,87809.30.2000 21 19,886 753 191,145 485,366 697,171 13,430 0 3,821 19,752 445 24,018 734,62010.10.2000 21 19,886 753 182,816 496,519 699,995 13,454 0 0 14,149 441 14,590 728,03910.20.2000 21 18,161 753 195,928 480,689 695,552 13,559 0 0 14,576 439 15,015 724,12610.31.2000 21 19,918 771 189,111 498,743 708,564 14,496 0 0 24,449 447 24,896 747,95611.10.2000 21 19,918 771 192,447 494,958 708,115 14,034 0 0 16,280 450 16,730 738,87911.20.2000 21 19,918 686 195,826 490,027 706,477 14,098 4,650 0 10,859 450 15,959 736,53411.30.2000 21 19,740 884 205,570 481,274 707,489 13,947 0 0 20,254 459 20,713 742,14912.10.2000 21 19,740 884 214,880 483,701 719,225 13,951 0 1,426 9,957 471 11,853 745,02912.20.2000 21 19,740 884 212,327 485,374 718,345 13,985 0 1,000 12,342 442 13,784 746,11412.31.2000 20 18,719 838 209,039 482,847 711,463 13,091 0 0 21,760 486 22,246 746,800
01.10.2001 20 18,719 838 220,406 476,214 716,197 14,211 0 0 11,409 434 11,844 742,25201.20.2001 20 18,719 838 219,802 477,179 716,559 14,247 0 700 15,856 433 16,988 747,79501.31.2001 20 18,771 840 207,478 497,236 724,346 14,606 0 2,698 20,972 442 24,113 763,06402.10.2001 20 17,873 946 193,509 497,902 710,250 14,577 0 1,700 16,834 432 18,966 743,79302.20.2001 20 17,873 946 216,736 493,744 729,320 14,588 0 0 13,650 465 14,115 758,02302.28.2001 20 17,873 946 232,907 481,128 732,876 14,635 0 0 17,944 450 18,394 765,90403.10.2001 20 18,904 954 226,609 492,587 739,074 14,764 0 500 15,474 467 16,441 770,27903.20.2001 20 18,904 954 219,121 491,857 730,856 14,738 0 0 19,410 542 19,952 765,54603.31.2001 20 19,447 981 245,605 491,765 757,819 15,372 0 3806 5,551 476 9,833 783,02404.10.2001 20 19,447 981 257,034 484,224 761,707 15,360 0 0 4,856 450 5,306 782,37304.20.2001 20 19,447 981 331,292 516,395 868,135 15,346 0 0 4,609 459 5,068 888,54904.30.2001 20 19,246 971 337,568 516,321 874,126 15,142 5,200 0 6,917 454 12,572 901,83905.10.2001 20 19,246 971 352,455 515,564 888,256 11,748 0 0 4,296 452 4,747 904,75105.20.2001 20 18,808 1,060 344,294 524,906 889,089 15,002 2,000 0 4,296 479 6,775 910,86705.31.2001 20 20,671 1,104 308,873 568,501 899,170 15,959 0 0 4,303 477 4,780 919,90906.10.2001 20 20,671 1,104 291,900 594,713 908,408 15,957 0 0 4,311 478 4,789 929,15506.20.2001 16,929 20,671 1,104 291,852 594,647 925,204 18,901 0 0 4,318 471 4,789 948,89506.30.2001 16,847 20,779 1,110 328,730 561,401 928,866 19,108 8,000 763 5,401 462 14,626 962,60107.10.2001 16,847 20,779 1,110 355,292 538,525 932,553 19,099 0 0 3,783 470 4,253 955,90607.20.2001 16,847 21,694 1,110 366,007 542,921 948,578 19,091 0 0 3,248 478 3,726 971,39507.31.2001 16,133 20,156 1,092 328,111 583,357 948,849 18,536 0 0 3,248 470 3,717 971,10308.10.2001 16,133 20,156 1,182 236,014 590,902 864,388 18,718 0 1,100 2,385 494 3,979 887,08508.20.2001 16,133 20,156 1,182 252,769 581,412 871,653 18,684 0 0 2,088 490 2,578 892,91408.31.2001 16,002 19,926 1,169 283,827 571,338 892,261 18,194 0 0 2,088 495 2,583 913,03809.10.2001 16,002 19,926 1,169 301,368 573,870 912,334 18,015 0 0 2,092 486 2,578 932,92709.20.2001 16,002 19,926 1,169 303,997 576,109 917,202 17,853 0 0 1,549 500 2,049 937,10409.30.2001 17,071 19,814 1,162 318,203 573,459 929,710 17,292 4,000 0 1,549 491 6,040 953,04110.10.2001 17,072 19,814 1,162 320,029 576,229 934,307 18,049 0 0 1,331 479 1,810 954,16510.20.2001 17,072 19,814 1,162 335,193 577,305 950,546 17,920 0 0 546 462 1,009 969,47510.31.2001 16,453 19,909 1,168 345,785 590,219 973,533 16,991 0 0 546 462 1,010 991,53411.10.2001 16,453 19,909 1,292 329,854 591,481 958,989 18,182 0 0 0 471 471 977,64211.20.2001 16,453 19,909 1,242 350,533 587,326 975,462 17,849 0 0 0 476 476 993,78711.30.2001 16,614 20,200 1,257 388,888 585,440 1,012,399 18,438 0 0 0 463 463 1,031,30012.10.2001 16,614 20,150 1,257 415,456 585,738 1,039,215 18,471 0 0 0 470 470 1,058,15712.20.2001 16,614 20,150 1,257 434,129 586,315 1,058,465 18,639 0 0 0 477 477 1,077,58112.31.2001 16,869 20,217 1,261 476,752 588,344 1,103,444 18,824 0 0 0 475 475 1,122,742
01.10.2002 16,869 20,217 1,261 458,990 591,778 1,089,116 19,676 0 0 0 474 474 1,109,26601.20.2002 16,869 20,217 1,261 461,790 591,283 1,091,421 19,703 0 0 0 481 481 1,111,60501.31.2002 17,638 20,482 1,278 456,632 619,736 1,115,766 20,262 0 1,002 0 420 1,421 1,137,44902.10.2002 17,638 25,444 1,374 448,440 633,021 1,125,918 21,610 0 0 1,609 409 2,018 1,149,54502.20.2002 17,638 25,444 1,335 439,667 670,259 1,154,343 20,705 0 0 3,335 333 3,668 1,178,71602.28.2002 18,628 25,694 1,341 485,895 651,622 1,183,180 20,630 0 0 0 330 330 1,204,14003.10.2002 18,628 25,694 1,341 481,865 651,099 1,178,626 20,360 0 0 0 331 331 1,199,31803.20.2002 18,628 25,694 1,341 453,574 670,680 1,169,916 20,863 0 0 0 331 331 1,191,11003.31.2002 18,847 25,713 1,342 456,065 679,922 1,181,888 19,553 0 1,920 0 257 2,177 1,203,618
Currency and deposits
Securities Total
5 6=1+…+5
Millions of Tolars
Assets
TotalInternational monetary reserves Other
claims on nonresident
s (net)
Loans to banks
TotalGold
Reserve position with IMF
SDRs Liquidity LombardRepurchase agreements
Other
1 2 3 4 12=8+…+11 137 118 9 10
MONEY
AND
BANKS

37
�������������
Monthly Bulletin
Liabilities
ColumnCode
12.31.1998 104,667 62,863 5,856 173,387 282,379 16,177 0 298,556 0 - 80,103 45,789 597,83512.31.1999 142,489 61,253 6,152 209,893 310,388 23,946 0 334,334 0 - 27,371 83,865 655,463
05.31.2000 120,933 70,318 7,319 198,570 325,646 78,669 0 404,315 0 - 11,843 104,708 719,43606.10.2000 121,679 67,082 7,415 196,176 330,904 69,807 12 400,724 0 - 11,243 104,812 712,95406.20.2000 118,980 66,185 7,964 193,129 331,647 60,930 12 392,590 0 - 7,471 104,660 697,85006.30.2000 128,271 71,390 8,194 207,855 333,480 59,456 0 392,936 0 - 7,772 106,784 715,34707.10.2000 124,019 66,784 7,571 198,375 334,619 57,078 0 391,697 0 - 8,042 106,717 704,83107.20.2000 122,099 68,699 8,731 199,529 337,504 53,487 0 390,990 0 - 8,112 107,629 706,26007.31.2000 124,597 74,085 7,942 206,624 338,310 46,431 0 384,742 0 - 10,822 112,783 714,97008.10.2000 121,294 65,848 8,750 195,893 342,259 42,216 0 384,475 0 - 11,573 114,233 706,17308.20.2000 122,436 62,233 8,893 193,563 341,502 41,883 0 383,385 0 - 12,917 119,833 709,69608.31.2000 123,822 65,274 8,028 197,125 343,890 42,796 0 386,686 0 - 13,532 125,748 723,09109.10.2000 124,172 61,085 7,965 193,221 347,717 42,276 0 389,993 0 - 14,892 127,981 726,08809.20.2000 121,993 71,009 8,792 201,794 346,543 39,583 0 386,126 0 - 10,078 129,881 727,87809.30.2000 129,113 69,261 9,433 207,806 346,835 39,029 0 385,864 0 - 12,090 128,860 734,62010.10.2000 123,367 65,485 8,755 197,607 350,512 38,268 0 388,779 0 - 13,391 128,262 728,03910.20.2000 125,248 67,718 9,057 202,023 347,973 37,737 0 385,710 0 - 9,337 127,056 724,12610.31.2000 131,156 74,434 8,533 214,123 351,706 36,983 0 388,689 0 - 9,208 135,935 747,95611.10.2000 125,352 63,931 8,703 197,986 352,582 36,038 0 388,620 0 - 15,658 136,615 738,87911.20.2000 123,263 65,721 8,997 197,981 351,146 36,055 0 387,201 0 - 14,715 136,638 736,53411.30.2000 127,803 72,470 9,701 209,975 351,872 34,861 0 386,733 0 - 7,325 138,116 742,14912.10.2000 127,194 61,341 8,624 197,159 353,989 42,282 121 396,392 0 - 9,375 142,103 745,02912.20.2000 127,503 68,401 10,215 206,119 355,758 37,916 121 393,794 0 - 4,441 141,761 746,11412.31.2000 139,644 66,801 8,352 214,798 358,324 35,664 0 393,988 0 - 6,946 131,068 746,800
01.10.2001 124,576 65,454 9,358 199,387 365,401 34,141 0 399,542 0 - 6,246 137,076 742,25201.20.2001 124,500 64,482 9,422 198,404 365,226 34,624 0 399,850 0 - 6,046 143,495 747,79501.31.2001 123,576 67,146 8,898 199,620 368,217 39,032 0 407,249 0 - 8,610 147,585 763,06402.10.2001 124,587 65,248 8,931 198,766 369,223 27,307 0 396,531 0 - 8,140 140,357 743,79302.20.2001 120,793 69,201 9,861 199,855 367,862 45,822 0 413,685 0 - 5,261 139,223 758,02302.28.2001 125,232 70,791 8,922 204,945 368,127 45,630 0 413,757 0 - 7,837 139,366 765,90403.10.2001 125,735 67,798 8,665 202,198 373,695 45,711 0 419,407 0 - 8,797 139,877 770,27903.20.2001 123,225 67,824 9,694 200,743 375,015 35,627 0 410,642 0 - 13,623 140,539 765,54603.31.2001 129,286 72,923 8,519 210,727 378,087 30,438 0 408,525 0 - 13,662 150,110 783,02404.10.2001 125,212 66,706 8,705 200,623 383,502 31,000 0 414,501 0 - 18,612 148,637 782,37304.20.2001 127,565 69,436 9,449 206,450 385,133 125,898 0 511,031 0 - 22,989 148,080 888,54904.30.2001 135,288 76,800 9,031 221,119 386,324 125,526 0 511,850 0 - 20,406 148,464 901,83905.10.2001 127,589 65,597 9,124 202,310 389,110 124,719 0 513,829 1,984 - 39,207 147,422 904,75105.20.2001 130,387 61,192 9,085 200,664 389,641 124,445 0 514,086 4,008 - 45,075 147,033 910,86705.31.2001 131,142 69,166 8,676 208,984 393,029 118,160 0 511,188 8,037 - 34,516 157,184 919,90906.10.2001 132,228 66,964 8,357 207,548 396,506 117,341 2,766 516,613 9,049 - 38,567 157,377 929,15406.20.2001 129,479 72,075 9,762 211,316 396,712 110,094 17 506,788 10,041 - 38,840 181,910 948,89506.30.2001 142,250 69,156 9,821 221,227 399,357 110,089 0 509,447 13,812 - 36,185 181,930 962,60107.10.2001 135,929 73,777 9,032 218,738 409,012 93,838 0 502,850 6,814 3,140 41,007 183,356 955,90607.20.2001 135,925 64,257 10,121 210,303 414,009 109,023 0 523,032 3,727 20 49,437 184,876 971,39507.31.2001 135,562 70,735 9,246 215,543 417,304 108,437 0 525,741 15,916 130 33,129 180,645 971,10308.10.2001 133,171 62,680 9,284 205,135 421,591 26,706 0 448,297 10 235 50,881 182,527 887,08508.20.2001 130,557 73,428 10,484 214,469 422,536 26,607 0 449,143 1,611 2,890 44,510 180,292 892,91408.31.2001 135,223 64,419 9,420 209,061 428,374 25,485 0 453,743 15,937 1,910 52,895 180,076 913,03809.10.2001 131,511 81,477 9,932 222,920 432,133 25,310 0 457,443 7,438 6,360 59,271 179,496 932,92709.20.2001 132,886 67,627 11,248 211,762 433,369 24,766 0 458,136 829 1,095 84,957 180,325 937,10409.30.2001 139,743 72,474 9,330 221,547 438,381 24,363 0 462,744 2,400 3,550 78,627 184,173 953,04110.10.2001 135,111 76,991 9,248 221,350 439,336 25,117 0 464,453 83 2,300 82,117 183,863 954,16510.20.2001 137,962 64,994 10,280 213,236 439,070 25,035 0 464,104 4,808 150 103,718 183,458 969,47510.31.2001 144,031 76,164 10,159 230,354 442,538 25,090 0 467,628 19,850 2,790 80,229 190,683 991,53411.10.2001 140,533 61,887 10,352 212,773 444,720 24,807 0 469,527 9,621 100 95,069 190,551 977,64211.20.2001 139,599 74,510 13,923 228,032 444,635 24,550 0 469,185 4 11,390 95,435 189,741 993,78711.30.2001 146,789 77,154 12,262 236,204 447,770 25,280 0 473,050 18,257 2,120 111,780 189,889 1,031,30012.10.2001 146,101 76,621 12,583 235,305 451,582 25,081 15,354 492,017 61 3,300 137,508 189,967 1,058,15712.20.2001 154,802 66,594 19,935 241,331 453,233 34,890 17 488,140 70 9,430 145,052 193,559 1,077,58112.31.2001 165,777 78,594 15,648 260,019 458,777 31,185 0 489,962 19,896 35,372 125,912 191,580 1,122,742
01.10.2002 153,870 78,340 15,541 247,751 463,340 30,196 0 493,537 21 541 174,301 193,115 1,109,26601.20.2002 151,891 65,081 13,720 230,692 465,704 29,647 0 495,352 4,021 1,270 189,539 190,732 1,111,60501.31.2002 150,634 66,644 12,602 229,880 472,914 28,696 0 501,610 16,020 60 191,550 198,328 1,137,44902.10.2002 151,251 80,642 12,361 244,254 475,127 28,607 0 503,734 7,999 1,030 194,207 198,322 1,149,54502.20.2002 145,136 76,259 14,492 235,888 508,511 27,506 0 536,017 6,498 562 201,589 198,163 1,178,71602.28.2002 150,918 89,849 12,560 253,327 511,674 36,345 0 548,020 10,527 31,793 158,004 202,499 1,204,14003.10.2002 151,315 84,765 13,340 249,420 511,825 36,301 0 548,126 6,938 7,087 185,232 202,515 1,199,31803.20.2002 148,304 66,571 14,404 229,280 511,227 27,429 0 538,656 18,948 2,471 193,379 208,376 1,191,11003.31.2002 157,963 70,116 13,071 241,150 512,423 28,001 0 540,424 19,947 766 198,886 202,445 1,203,618
1311
TotalNotes issue
Banks` giro and reserves
Other demand deposits
Foreign currency bills
Government deposits in
for. curr.
Other Total
Tolar denominated
bills
Other liabilities
net
127 1095 6 8=5+6+7
Government time
deposits
Liabilities to residents in foreign currency
1 2 3 4=1+2+3
Millions of Tolars Base money
Total
Banks' time deposits - overnight deposits
MONEY
AND
BANKS

38
�������������
Monthly Bulletin
2.1. Bank of Slovenia Interest RatesFINANCIAL
MARKETS
2.2. Interbank Money Market Rates and Indexation Clause
ColumnCode
1993 20.33 21.33 1.00 55.31 - - - - -1994 16.00 17.00 1.00 48.53 - - - - -1995 11.50 12.50 1.00 31.54 - … - - …1996 10.00 11.00 1.00 27.76 - 14.34 - - 27.761997 10.00 11.00 1.00 26.84 - 13.38 - - 26.841998 10.00 11.00 1.00 26.55 - 10.64 - - 26.551999 8.00 9.00 1.00 20.68 - 8.60 - - 20.682000 8.67 9.67 1.00 24.65 9.56 8.84 10.62 - 24.652001 10.75 11.75 1.00 27.99 11.02 - 11.27 4.92 27.99
2000 Sep. 9.00 10.00 1.00 25.08 9.53 - 10.41 - 25.08 Oct. 9.00 10.00 1.00 24.78 9.60 - 10.79 - 24.78 Nov. 9.00 10.00 1.00 25.08 9.64 - 11.08 - 25.08 Dec. 10.00 11.00 1.00 27.86 10.93 - 11.85 - 27.86 2001 Jan. 10.00 11.00 1.00 26.56 10.75 - 11.38 - 26.56 Feb. 10.00 11.00 1.00 27.52 10.59 - 11.50 - 27.52 Mar. 10.00 11.00 1.00 26.56 11.22 - 11.46 - 26.56 Apr. 11.00 12.00 1.00 28.66 11.37 - 11.45 - 28.66 May 11.00 12.00 1.00 28.36 11.18 - 11.32 - 28.36 Jun. 11.00 12.00 1.00 29.98 11.03 - 11.16 - 29.98 Jul. 11.00 12.00 1.00 29.64 - - 11.03 5.50 29.64 Aug. 11.00 12.00 1.00 28.36 - - 11.13 5.50 28.36 Sep. 11.00 12.00 1.00 28.66 - - 11.03 5.50 28.66 Oct. 11.00 12.00 1.00 27.10 - - - 4.50 27.10 Nov. 11.00 12.00 1.00 27.35 - - - 4.50 27.35 Dec. 11.00 12.00 1.00 27.10 - - - 4.00 27.10 2002 Jan. 9.00 11.00 1.00 20.80 - - - 4.00 20.80 Feb. 9.00 11.00 1.00 21.61 9.54 - - 4.00 21.61 Mar. 9.00 11.00 1.00 22.06 - - - 4.00 22.06
1n n n
3
Lombard rate60-day
n8 96
Discount rateInterest rate
on banks' reserves
n2
General legal penal rate
Overnight deposit
Repo
7-day 28-day
Liqidity loan - of last resort
n4
n7
n5
n
Column
Code
1993 39.5 38.5 39.1 1.7 22.38 1.9 24.9 2.5 33.61994 29.2 28.6 29.1 1.4 18.73 0.6 6.9 -0.3 -4.11995 12.3 12.0 12.2 0.7 8.19 0.6 7.6 0.0 -0.41996 14.0 13.8 14.0 0.8 9.70 0.3 3.5 1.0 12.31997 9.7 9.6 9.7 0.7 8.84 0.3 3.7 1.5 19.61998 7.5 7.4 7.5 0.7 8.51 0.2 2.1 -0.4 -4.71999 6.9 6.8 6.9 0.5 6.27 0.4 4.7 1.7 22.12000 7.0 6.8 7.0 0.7 9.06 0.6 7.2 1.3 15.62001 6.9 6.7 6.9 0.7 8.62 0.4 4.7 0.9 10.4
2000 Sep. 6.3 5.9 6.3 0.7 8.88 0.3 4.3 1.3 17.2 Oct. 7.1 6.8 7.0 0.7 8.58 0.4 4.5 3.9 56.5 Nov. 6.2 5.8 6.1 0.7 8.88 0.5 5.7 -1.1 -12.7 Dec. 7.3 6.9 7.2 0.8 9.86 0.6 6.8 -6.7 -55.9 2001 Jan. 7.2 6.8 7.2 0.7 8.56 0.6 7.7 2.0 26.6
Feb. 7.5 7.4 7.5 0.7 9.52 0.6 7.5 0.9 12.2 Mar. 7.3 7.3 7.3 0.7 8.56 0.5 6.5 4.3 64.4 Apr. 7.6 7.4 7.6 0.7 8.86 0.3 3.9 -1.4 -16.2 May 7.5 7.4 7.5 0.7 8.56 0.4 4.2 5.2 82.5 Jun. 7.7 7.9 7.7 0.8 10.18 0.3 4.3 1.2 15.8 Jul. 7.5 7.5 7.5 0.8 9.84 0.4 4.7 -2.6 -26.9 Aug. 6.8 6.6 6.8 0.7 8.56 0.4 4.7 -3.4 -33.4 Sep. 6.7 6.1 6.7 0.7 8.86 0.3 3.1 -0.6 -7.3 Oct. 6.5 6.1 6.5 0.6 7.30 0.2 2.6 1.3 16.8 Nov. 5.9 5.3 5.9 0.6 7.55 0.3 3.4 2.2 29.9 Dec. 4.7 5.0 4.7 0.6 7.30 0.3 3.8 1.2 14.7 2002 Jan. 4.5 4.4 4.5 0.6 7.30 0.5 6.3 2.4 32.5 Feb. 4.7 4.8 4.7 0.6 8.11 0.4 4.8 0.4 5.9 Mar. - - 4.6 0.7 8.56 0.4 4.4 -0.3 -4.0
1 2 3n n n
9monthly annualized monthly
654
Interbank Market Revaluation Clauses
Foreign Exchange Clauses
EURDay
USDTolar Indexation Clause TOMAverageOvernight
annualized annualized7
monthly8

39
��
��
����
��
���
Monthly B
ulletin
2.3. Interest Rates for Bank of Slovenia Bills
Column
Code
1993 24.57 31.75 29.50 34.22 - - - - … … … 6.67 6.79 6.92 - - - … … … - - -1994 20.02 25.96 26.63 28.33 - … - … 6.00 25.96 5.25 5.16 5.28 5.41 … … … 4.14 4.47 4.65 … … …1995 5.91 9.24 9.03 10.20 … 12.78 - 11.00 … … … 4.23 4.24 4.29 4.33 4.33 4.34 5.63 5.67 5.70 5.76 5.82 5.881996 2.50 4.75 5.63 5.63 7.92 13.27 - 8.58 4.08 14.24 2.83 3.11 3.10 3.10 3.09 3.13 3.18 5.30 5.33 5.34 5.36 5.43 5.521997 2.50 4.00 5.00 5.00 7.83 12.98 14.33 9.00 4.08 13.29 2.83 3.17 3.20 3.23 3.27 3.33 3.41 5.55 5.61 5.62 5.68 5.78 5.891998 2.23 3.53 4.18 4.35 7.37 10.40 12.31 8.80 2.90 11.70 3.00 3.36 3.40 3.42 3.47 3.52 3.58 5.40 5.40 5.39 5.36 5.36 5.361999 1.70 2.70 3.20 3.30 5.23 7.13 9.08 7.13 2.50 8.94 2.31 2.75 2.80 2.83 2.87 2.92 2.98 5.16 5.25 5.30 5.36 5.44 5.542000 2.74 2.70 4.66 3.30 5.50 8.19 9.35 8.50 2.50 11.50 2.00 4.16 4.23 4.29 4.39 4.52 4.62 6.29 6.37 6.40 6.48 6.59 6.682001 6.00 - 7.83 - - 10.42 11.16 - - - - 4.08 4.04 4.00 4.46 4.37 4.35 3.55 3.52 3.50 5.16 5.07 5.05
1999 Oct. 1.70 2.70 3.20 3.30 5.50 7.00 9.00 7.00 2.50 9.98 2.00 2.77 3.27 3.30 3.27 3.48 3.60 5.36 6.02 5.95 5.93 5.97 6.06 Nov. 1.70 2.70 3.20 3.30 5.50 7.00 9.00 7.00 2.50 10.24 2.00 3.31 3.30 3.31 3.31 3.37 3.43 5.96 5.91 5.89 5.85 5.89 5.93 Dec. 1.70 2.70 3.20 3.30 5.50 7.00 9.00 8.50 2.50 11.27 2.00 3.31 3.30 3.31 3.31 3.37 3.43 6.02 5.97 5.96 5.94 6.04 6.16 2000 Jan. 1.70 2.70 3.20 3.30 5.50 7.00 9.00 8.50 2.50 11.29 2.00 3.05 3.16 3.22 3.37 3.58 3.77 5.77 5.89 5.95 6.07 6.28 6.50
Feb. 1.70 2.70 3.20 3.30 5.50 7.00 9.00 8.50 2.50 11.93 2.00 3.25 3.34 3.40 3.53 3.72 3.91 5.84 5.94 6.01 6.17 6.42 6.66 Mar. 2.00 2.70 4.00 3.30 5.50 8.00 9.00 8.50 2.50 11.29 2.00 3.53 3.61 3.67 3.80 3.97 4.11 6.00 6.07 6.14 6.27 6.47 6.68
Apr. 2.00 - 4.00 - - 8.00 9.00 8.50 - - - 3.70 3.75 3.79 3.89 4.06 4.16 6.03 6.13 6.20 6.35 6.56 6.68May 2.00 - 4.00 - - 8.00 9.00 8.50 - - - 4.21 4.31 4.37 4.50 4.68 4.82 6.55 6.67 6.74 6.91 7.16 7.34
Jun. 2.00 - 4.00 - - 8.00 9.00 - - - - 4.26 4.32 4.38 4.47 4.64 4.76 6.55 6.62 6.68 6.79 6.93 7.03 Jul. 2.00 - 4.00 - - 8.00 9.00 - - - - 4.35 4.46 4.54 4.73 4.89 5.02 6.49 6.56 6.60 6.74 6.81 6.89 Aug. 2.00 - 4.00 - - 8.00 9.00 - - - - 4.58 4.66 4.72 4.89 5.02 5.13 6.47 6.51 6.54 6.65 6.70 6.76
Sep. 4.00 - 6.00 - - 8.50 9.50 - - - - 4.57 4.65 4.79 4.87 4.99 5.08 6.47 6.49 6.60 6.57 6.58 6.60 Oct. 4.00 - 6.00 - - 8.50 9.50 - - - - 4.76 4.86 4.89 4.94 5.00 5.05 6.46 6.59 6.54 6.53 6.53 6.53
Nov. 4.50 - 6.50 - - 9.25 10.25 - - - - 4.87 4.88 4.90 4.92 4.94 4.97 6.46 6.59 6.54 6.53 6.53 6.53 Dec. 5.00 - 7.00 - - 10.00 11.00 - - - - 4.76 4.76 4.75 4.73 4.70 4.68 6.42 6.36 6.30 6.20 6.09 6.00 2001 Jan. 5.00 - 7.00 - - 10.00 11.00 - - - - 4.60 4.59 4.55 4.48 4.39 4.36 5.52 5.44 5.38 5.28 5.18 5.15
Feb. 5.00 - 7.00 - - 10.00 11.00 - - - - 4.59 4.57 4.53 4.43 4.35 4.33 5.32 5.23 5.17 5.04 4.95 4.94Mar. 6.50 - 8.50 - - 11.00 - - - - - 4.45 4.40 4.36 - - - 4.78 4.70 4.62 - - -
Apr. 6.50 - 8.50 - - 11.00 - - - - - 4.55 4.51 4.46 - - - 4.28 4.24 4.21 - - - May 6.50 - 8.50 - - 11.00 - - - - - 4.40 4.38 4.35 - - - 3.88 3.86 3.84 - - - Jun. 6.50 - 8.50 - - 11.00 11.50 - - - - 4.29 4.26 4.21 - - - 3.59 3.56 3.56 - - - Jul. - - 8.50 - - 11.00 11.50 - - - - 4.34 4.32 4.29 - - - 3.58 3.54 3.53 - - - Aug. - - 8.50 - - 11.00 11.50 - - - - 4.18 4.14 4.08 - - - 3.37 3.34 3.32 - - - Sep. - - 8.50 - - 11.00 11.50 - - - - 3.55 3.52 3.50 - - - 2.43 2.43 2.42 - - - Oct. - - 7.00 - - 11.00 11.50 - - - - 3.45 3.40 3.33 - - - 2.20 2.18 2.16 - - - Nov. - - 7.00 - - 9.00 10.83 - - - - 3.28 3.20 3.15 - - - 1.95 1.96 1.97 - - - Dec. - - 6.50 - - 8.00 10.08 - - - - 3.28 3.20 3.15 - - - 1.74 1.73 1.76 - - - 2002 Jan. - - - - - 7.75 8.77 - - - - 3.16 3.15 3.14 - - - 1.60 1.62 1.66 - - - Feb. - - - - - 7.75 8.94 - - - - 3.19 3.20 3.21 - - - 1.67 1.70 1.74 - - - Mar. - - - - - 8.00 9.81 - - - - 3.19 3.20 3.21 - - - 1.77 1.83 1.89 - - -
Tolar Bills
Number of days
270
In USD
Number of days
60 90 120 180 270
242321 2217 18 19 2014 161512 1310 1197 851 42 3
Twin Bills In EURBills with warrants
2 7 12 14 30
Number of days
60
nn n n nn n n r n r
Tolar part Forex. part
r r r r r r
90 120
r
360 60
rr
180
r r
270 360
r
FINANCIALMARKETS
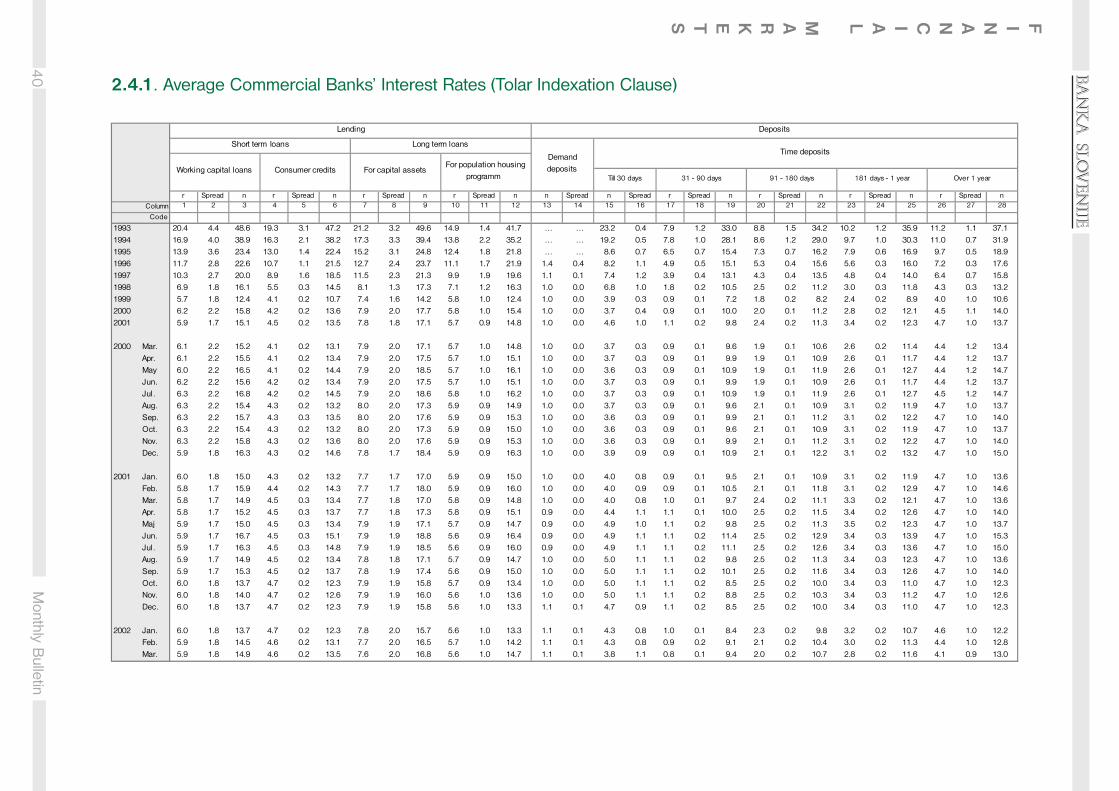
40 ��
��
����
��
���
Monthly B
ulletin
2.4.1. Average Commercial Banks’ Interest Rates (Tolar Indexation Clause)
Column
Code
1993 20.4 4.4 48.6 19.3 3.1 47.2 21.2 3.2 49.6 14.9 1.4 41.7 … … 23.2 0.4 7.9 1.2 33.0 8.8 1.5 34.2 10.2 1.2 35.9 11.2 1.1 37.11994 16.9 4.0 38.9 16.3 2.1 38.2 17.3 3.3 39.4 13.8 2.2 35.2 … … 19.2 0.5 7.8 1.0 28.1 8.6 1.2 29.0 9.7 1.0 30.3 11.0 0.7 31.91995 13.9 3.6 23.4 13.0 1.4 22.4 15.2 3.1 24.8 12.4 1.8 21.8 … … 8.6 0.7 6.5 0.7 15.4 7.3 0.7 16.2 7.9 0.6 16.9 9.7 0.5 18.91996 11.7 2.8 22.6 10.7 1.1 21.5 12.7 2.4 23.7 11.1 1.7 21.9 1.4 0.4 8.2 1.1 4.9 0.5 15.1 5.3 0.4 15.6 5.6 0.3 16.0 7.2 0.3 17.61997 10.3 2.7 20.0 8.9 1.6 18.5 11.5 2.3 21.3 9.9 1.9 19.6 1.1 0.1 7.4 1.2 3.9 0.4 13.1 4.3 0.4 13.5 4.8 0.4 14.0 6.4 0.7 15.81998 6.9 1.8 16.1 5.5 0.3 14.5 8.1 1.3 17.3 7.1 1.2 16.3 1.0 0.0 6.8 1.0 1.8 0.2 10.5 2.5 0.2 11.2 3.0 0.3 11.8 4.3 0.3 13.21999 5.7 1.8 12.4 4.1 0.2 10.7 7.4 1.6 14.2 5.8 1.0 12.4 1.0 0.0 3.9 0.3 0.9 0.1 7.2 1.8 0.2 8.2 2.4 0.2 8.9 4.0 1.0 10.62000 6.2 2.2 15.8 4.2 0.2 13.6 7.9 2.0 17.7 5.8 1.0 15.4 1.0 0.0 3.7 0.4 0.9 0.1 10.0 2.0 0.1 11.2 2.8 0.2 12.1 4.5 1.1 14.02001 5.9 1.7 15.1 4.5 0.2 13.5 7.8 1.8 17.1 5.7 0.9 14.8 1.0 0.0 4.6 1.0 1.1 0.2 9.8 2.4 0.2 11.3 3.4 0.2 12.3 4.7 1.0 13.7
2000 Mar. 6.1 2.2 15.2 4.1 0.2 13.1 7.9 2.0 17.1 5.7 1.0 14.8 1.0 0.0 3.7 0.3 0.9 0.1 9.6 1.9 0.1 10.6 2.6 0.2 11.4 4.4 1.2 13.4 Apr. 6.1 2.2 15.5 4.1 0.2 13.4 7.9 2.0 17.5 5.7 1.0 15.1 1.0 0.0 3.7 0.3 0.9 0.1 9.9 1.9 0.1 10.9 2.6 0.1 11.7 4.4 1.2 13.7 May 6.0 2.2 16.5 4.1 0.2 14.4 7.9 2.0 18.5 5.7 1.0 16.1 1.0 0.0 3.6 0.3 0.9 0.1 10.9 1.9 0.1 11.9 2.6 0.1 12.7 4.4 1.2 14.7 Jun. 6.2 2.2 15.6 4.2 0.2 13.4 7.9 2.0 17.5 5.7 1.0 15.1 1.0 0.0 3.7 0.3 0.9 0.1 9.9 1.9 0.1 10.9 2.6 0.1 11.7 4.4 1.2 13.7 Jul. 6.3 2.2 16.8 4.2 0.2 14.5 7.9 2.0 18.6 5.8 1.0 16.2 1.0 0.0 3.7 0.3 0.9 0.1 10.9 1.9 0.1 11.9 2.6 0.1 12.7 4.5 1.2 14.7 Aug. 6.3 2.2 15.4 4.3 0.2 13.2 8.0 2.0 17.3 5.9 0.9 14.9 1.0 0.0 3.7 0.3 0.9 0.1 9.6 2.1 0.1 10.9 3.1 0.2 11.9 4.7 1.0 13.7
Sep. 6.3 2.2 15.7 4.3 0.3 13.5 8.0 2.0 17.6 5.9 0.9 15.3 1.0 0.0 3.6 0.3 0.9 0.1 9.9 2.1 0.1 11.2 3.1 0.2 12.2 4.7 1.0 14.0 Oct. 6.3 2.2 15.4 4.3 0.2 13.2 8.0 2.0 17.3 5.9 0.9 15.0 1.0 0.0 3.6 0.3 0.9 0.1 9.6 2.1 0.1 10.9 3.1 0.2 11.9 4.7 1.0 13.7 Nov. 6.3 2.2 15.8 4.3 0.2 13.6 8.0 2.0 17.6 5.9 0.9 15.3 1.0 0.0 3.6 0.3 0.9 0.1 9.9 2.1 0.1 11.2 3.1 0.2 12.2 4.7 1.0 14.0 Dec. 5.9 1.8 16.3 4.3 0.2 14.6 7.8 1.7 18.4 5.9 0.9 16.3 1.0 0.0 3.9 0.9 0.9 0.1 10.9 2.1 0.1 12.2 3.1 0.2 13.2 4.7 1.0 15.0 2001 Jan. 6.0 1.8 15.0 4.3 0.2 13.2 7.7 1.7 17.0 5.9 0.9 15.0 1.0 0.0 4.0 0.8 0.9 0.1 9.5 2.1 0.1 10.9 3.1 0.2 11.9 4.7 1.0 13.6
Feb. 5.8 1.7 15.9 4.4 0.2 14.3 7.7 1.7 18.0 5.9 0.9 16.0 1.0 0.0 4.0 0.9 0.9 0.1 10.5 2.1 0.1 11.8 3.1 0.2 12.9 4.7 1.0 14.6Mar. 5.8 1.7 14.9 4.5 0.3 13.4 7.7 1.8 17.0 5.8 0.9 14.8 1.0 0.0 4.0 0.8 1.0 0.1 9.7 2.4 0.2 11.1 3.3 0.2 12.1 4.7 1.0 13.6
Apr. 5.8 1.7 15.2 4.5 0.3 13.7 7.7 1.8 17.3 5.8 0.9 15.1 0.9 0.0 4.4 1.1 1.1 0.1 10.0 2.5 0.2 11.5 3.4 0.2 12.6 4.7 1.0 14.0 Maj 5.9 1.7 15.0 4.5 0.3 13.4 7.9 1.9 17.1 5.7 0.9 14.7 0.9 0.0 4.9 1.0 1.1 0.2 9.8 2.5 0.2 11.3 3.5 0.2 12.3 4.7 1.0 13.7 Jun. 5.9 1.7 16.7 4.5 0.3 15.1 7.9 1.9 18.8 5.6 0.9 16.4 0.9 0.0 4.9 1.1 1.1 0.2 11.4 2.5 0.2 12.9 3.4 0.3 13.9 4.7 1.0 15.3 Jul. 5.9 1.7 16.3 4.5 0.3 14.8 7.9 1.9 18.5 5.6 0.9 16.0 0.9 0.0 4.9 1.1 1.1 0.2 11.1 2.5 0.2 12.6 3.4 0.3 13.6 4.7 1.0 15.0 Aug. 5.9 1.7 14.9 4.5 0.2 13.4 7.8 1.8 17.1 5.7 0.9 14.7 1.0 0.0 5.0 1.1 1.1 0.2 9.8 2.5 0.2 11.3 3.4 0.3 12.3 4.7 1.0 13.6 Sep. 5.9 1.7 15.3 4.5 0.2 13.7 7.8 1.9 17.4 5.6 0.9 15.0 1.0 0.0 5.0 1.1 1.1 0.2 10.1 2.5 0.2 11.6 3.4 0.3 12.6 4.7 1.0 14.0 Oct. 6.0 1.8 13.7 4.7 0.2 12.3 7.9 1.9 15.8 5.7 0.9 13.4 1.0 0.0 5.0 1.1 1.1 0.2 8.5 2.5 0.2 10.0 3.4 0.3 11.0 4.7 1.0 12.3 Nov. 6.0 1.8 14.0 4.7 0.2 12.6 7.9 1.9 16.0 5.6 1.0 13.6 1.0 0.0 5.0 1.1 1.1 0.2 8.8 2.5 0.2 10.3 3.4 0.3 11.2 4.7 1.0 12.6 Dec. 6.0 1.8 13.7 4.7 0.2 12.3 7.9 1.9 15.8 5.6 1.0 13.3 1.1 0.1 4.7 0.9 1.1 0.2 8.5 2.5 0.2 10.0 3.4 0.3 11.0 4.7 1.0 12.3 2002 Jan. 6.0 1.8 13.7 4.7 0.2 12.3 7.8 2.0 15.7 5.6 1.0 13.3 1.1 0.1 4.3 0.8 1.0 0.1 8.4 2.3 0.2 9.8 3.2 0.2 10.7 4.6 1.0 12.2 Feb. 5.9 1.8 14.5 4.6 0.2 13.1 7.7 2.0 16.5 5.7 1.0 14.2 1.1 0.1 4.3 0.8 0.9 0.2 9.1 2.1 0.2 10.4 3.0 0.2 11.3 4.4 1.0 12.8 Mar. 5.9 1.8 14.9 4.6 0.2 13.5 7.6 2.0 16.8 5.6 1.0 14.7 1.1 0.1 3.8 1.1 0.8 0.1 9.4 2.0 0.2 10.7 2.8 0.2 11.6 4.1 0.9 13.0
For population housing programm
Deposits
Demand deposits
Lending
Short term loans
Working capital loans Consumer credits
Long term loans
For capital assets
Time deposits
2n3
r Spread1
Spread5
r4
r7
n6
n9
Spread8
Spread11
r10
n13
n12
nSpread14 15 16 18
nSpread
181 days - 1 year
r Spread nr
Over 1 yearTill 30 days 31 - 90 days 91 - 180 days
n Spread r Spread nSpreadr1917 21 2220 24 2523 27 2826
FINANCIALMARKETS

41
��
��
����
��
���
Monthly B
ulletin
2.4.2. Average Commercial Banks’ Interest Rates (Foreign Exchange Indexation Clause)
Column
Code
1993 19.4 3.7 50.5 19.7 3.3 50.8 2.9 1.0 6.5 0.9 … … … 7.7 1.4 35.7 8.6 0.8 36.8 9.9 0.8 38.4 9.9 0.9 38.41994 16.8 3.8 25.0 17.1 3.7 25.3 2.6 0.5 5.2 0.7 … … … 7.5 2.0 15.1 8.3 1.6 15.9 9.0 1.8 16.6 10.7 1.1 18.41995 14.3 2.7 23.6 15.3 2.8 24.7 2.3 0.5 4.8 0.9 2.8 0.0 11.2 5.8 1.5 14.5 6.5 1.3 15.1 7.4 0.9 16.1 8.8 0.8 17.71996 12.2 3.1 16.6 13.1 2.7 17.6 1.5 0.3 3.1 0.4 0.5 0.0 4.4 3.9 1.2 8.0 4.4 1.1 8.5 5.1 0.7 9.2 6.4 0.9 10.51997 11.2 3.0 15.6 12.4 2.7 16.8 1.4 0.3 3.1 0.5 0.2 0.0 4.1 3.2 0.9 7.3 3.7 0.9 7.8 4.2 0.9 8.3 5.7 1.3 9.81998 9.4 2.8 11.7 10.5 2.2 12.9 1.4 0.3 3.1 0.5 0.1 0.0 2.3 1.7 0.2 3.9 2.5 0.2 4.7 3.0 0.2 5.2 4.3 0.7 6.61999 7.3 1.8 12.4 8.6 1.4 13.8 1.1 0.3 2.4 0.5 0.1 0.0 4.9 0.9 0.1 5.8 1.9 0.1 6.7 2.4 0.2 7.3 3.8 0.7 8.72000 7.2 1.9 15.0 8.8 1.6 16.6 0.9 0.2 3.2 1.3 0.1 0.0 7.3 0.9 0.0 8.2 2.0 0.1 9.4 2.8 0.1 10.2 4.5 1.1 12.02001 6.9 1.3 12.0 8.1 0.9 13.2 0.8 0.2 3.0 1.1 0.1 0.0 4.8 1.2 0.1 5.9 2.5 0.1 7.3 3.4 0.2 8.2 4.7 1.0 9.7
2000 Mar. 7.2 2.2 17.4 8.7 1.6 19.0 0.8 0.1 2.8 1.2 0.1 0.0 9.7 0.9 0.0 10.6 1.9 0.1 11.7 2.6 0.1 12.4 4.4 1.2 14.4 Apr. 6.8 1.7 14.9 8.7 1.6 16.9 0.8 0.1 2.9 1.2 0.1 0.0 7.7 0.9 0.0 8.6 1.9 0.1 9.7 2.6 0.1 10.4 4.4 1.2 12.3 May 7.0 2.0 14.5 8.7 1.6 16.3 0.8 0.2 3.0 1.2 0.1 0.0 7.1 0.9 0.0 8.0 1.9 0.1 9.1 2.6 0.1 9.8 4.4 1.2 11.8 Jun. 7.3 1.9 15.5 8.7 1.6 17.0 0.9 0.2 3.4 1.4 0.1 0.0 7.7 0.9 0.0 8.6 1.9 0.1 9.7 2.6 0.1 10.5 4.4 1.2 12.4 Jul. 7.3 1.9 16.0 8.7 1.6 17.6 0.9 0.2 3.4 1.4 0.1 0.0 8.2 0.9 0.0 9.1 1.9 0.1 10.2 2.6 0.1 11.0 4.4 1.2 12.9
Aug. 7.4 2.0 14.7 8.9 1.6 16.4 0.9 0.2 3.5 1.5 0.1 0.0 6.9 0.9 0.0 7.8 2.2 0.1 9.1 3.1 0.2 10.1 4.7 1.0 11.8 Sep. 7.4 1.9 12.0 8.9 1.6 13.7 0.9 0.2 3.6 1.5 0.1 0.0 4.4 0.9 0.0 5.3 2.1 0.1 6.6 3.1 0.2 7.5 4.7 1.0 9.2 Oct. 7.3 1.9 12.1 9.0 1.6 13.8 0.9 0.2 3.6 1.5 0.1 0.0 4.6 0.9 0.0 5.4 2.1 0.1 6.7 3.1 0.2 7.7 4.7 1.0 9.3 Nov. 7.4 1.8 13.4 9.0 1.6 15.2 0.9 0.2 3.6 1.5 0.1 0.0 5.8 0.9 0.0 6.6 2.1 0.1 7.9 3.1 0.2 8.9 4.7 1.0 10.6 Dec. 7.2 1.8 14.5 8.4 1.2 15.8 0.9 0.2 3.6 1.5 0.1 0.0 6.9 0.9 0.0 7.8 2.1 0.1 9.1 3.1 0.2 10.1 4.7 1.0 11.8 2001 Jan. 7.2 1.8 15.4 7.7 1.0 16.0 0.9 0.2 3.4 1.3 0.1 0.0 7.8 0.9 0.0 8.7 2.1 0.1 10.0 3.1 0.2 11.0 4.7 1.0 12.7
Feb. 6.8 1.5 14.8 8.4 1.1 16.5 1.0 0.2 3.2 1.4 0.1 0.0 7.6 0.9 0.0 8.5 2.1 0.1 9.8 3.1 0.2 10.8 4.7 1.0 12.5Mar. 6.8 1.5 13.7 8.1 1.5 15.1 0.9 0.2 3.2 1.4 0.1 0.0 6.6 1.0 0.1 7.6 2.4 0.1 9.0 3.3 0.2 10.0 4.7 1.0 11.5
Mar. 6.9 1.2 11.1 8.1 1.4 12.4 0.9 0.2 3.2 1.2 0.1 0.0 4.0 1.0 0.1 5.0 2.4 0.1 6.4 3.4 0.1 7.4 4.8 1.0 8.9May 7.0 1.2 11.4 8.2 1.4 12.7 0.9 0.2 3.3 1.2 0.1 0.0 4.3 1.1 0.1 5.4 2.5 0.1 6.8 3.5 0.2 7.8 4.8 0.9 9.2Jun. 6.9 1.2 11.6 8.5 0.5 13.1 0.9 0.2 3.2 1.2 0.1 0.0 4.4 1.3 0.1 5.7 2.6 0.2 7.1 3.5 0.2 8.0 4.8 0.9 9.3Jul. 6.9 1.2 11.9 8.4 0.5 13.5 0.8 0.2 3.1 1.1 0.1 0.0 4.8 1.3 0.1 6.1 2.6 0.2 7.5 3.5 0.2 8.3 4.8 0.9 9.7Aug. 7.0 1.2 12.1 8.5 0.5 13.6 0.8 0.2 3.1 1.1 0.1 0.0 4.8 1.3 0.1 6.1 2.7 0.2 7.5 3.5 0.2 8.4 4.8 0.9 9.7Sep. 7.1 1.3 10.4 8.5 0.8 11.9 0.8 0.2 2.9 1.1 0.1 0.0 3.2 1.3 0.1 4.5 2.6 0.1 5.8 3.5 0.2 6.7 4.7 1.0 8.0Oct. 6.9 1.2 9.6 7.7 0.7 10.5 0.7 0.1 2.4 1.0 0.1 0.0 2.6 1.3 0.1 3.9 2.6 0.2 5.3 3.4 0.2 6.1 4.7 1.0 7.4Nov. 6.9 1.2 10.6 7.4 0.7 11.1 0.7 0.1 2.3 0.9 0.1 0.0 3.5 1.3 0.2 4.8 2.6 0.2 6.2 3.4 0.2 7.0 4.7 1.0 8.3Dec. 6.9 1.2 10.9 7.7 0.7 11.8 0.7 0.1 2.2 0.9 0.1 0.0 3.9 1.3 0.1 5.2 2.6 0.2 6.5 3.4 0.2 7.4 4.7 1.0 8.7
2002 Jan. 7.0 1.5 13.8 8.0 0.6 14.8 0.7 0.1 2.2 0.9 0.1 0.0 6.4 1.2 0.1 7.6 2.5 0.2 9.0 3.3 0.2 9.9 4.7 1.0 11.3 Feb. 7.0 1.5 12.2 7.8 0.7 13.0 0.7 0.1 2.3 1.0 0.1 0.0 4.9 1.1 0.1 6.0 2.3 0.2 7.3 3.1 0.2 8.1 4.4 1.0 9.5 Mar. 7.0 1.5 11.7 7.8 0.7 12.5 0.7 0.1 2.3 1.0 0.1 0.0 4.5 1.0 0.1 5.5 2.2 0.2 6.7 2.9 0.2 7.4 4.2 0.9 8.8
24r(D)20
Spread21
n25
n22
r(D)23
SpreadSpread18
n19
n16
r(D)17
r(D)14
Spread15
Spread12
n1310
r(D)118
r(D)96
r(D)74
Spread51 2 3
91 - 180 days 181 days - 1 year Over 1 year
r(D) Spread n r(D) n Spread Spread
Lending Deposits
Short term working capital loans
Long term loans for capital assets
Demand
Foreign exchange deposits (EUR)
Time
Time deposits
Till 30 days 31 - 90 days
FINANCIALMARKETS
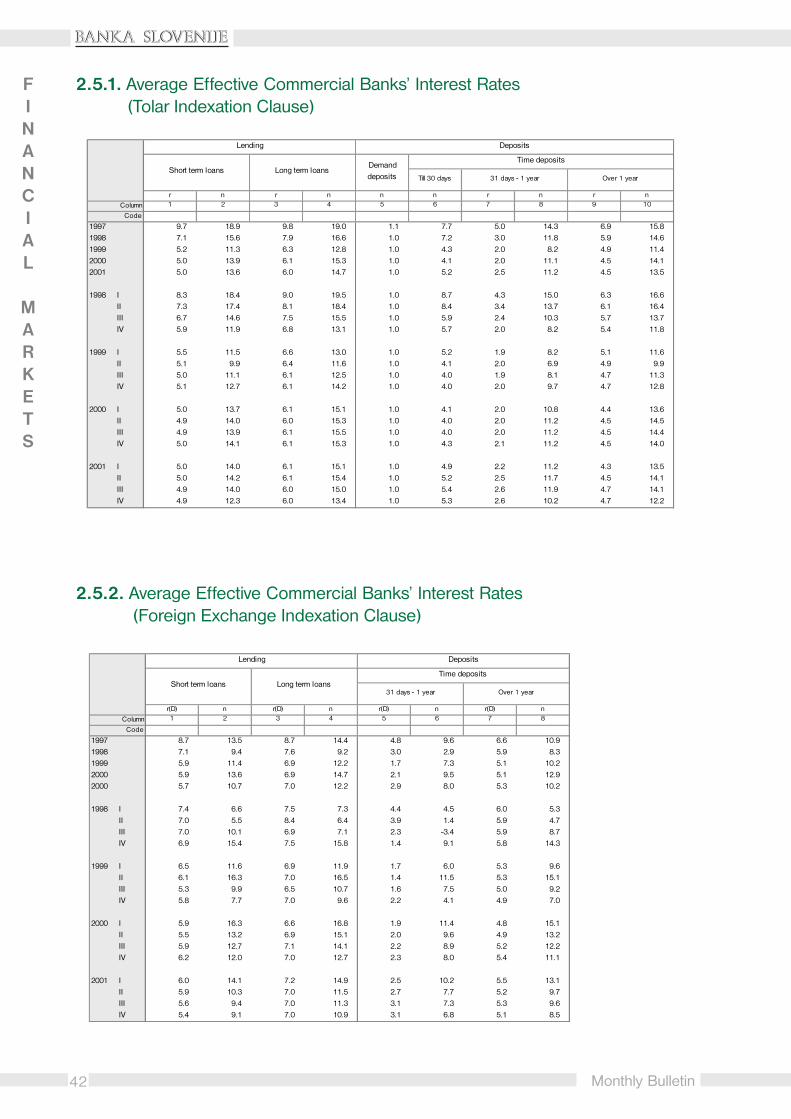
42
�������������
Monthly Bulletin
FINANCIAL
MARKETS
2.5.1. Average Effective Commercial Banks’ Interest Rates (Tolar Indexation Clause)
2.5.2. Average Effective Commercial Banks’ Interest Rates (Foreign Exchange Indexation Clause)
Column
Code
1997 9.7 18.9 9.8 19.0 1.1 7.7 5.0 14.3 6.9 15.81998 7.1 15.6 7.9 16.6 1.0 7.2 3.0 11.8 5.9 14.61999 5.2 11.3 6.3 12.8 1.0 4.3 2.0 8.2 4.9 11.42000 5.0 13.9 6.1 15.3 1.0 4.1 2.0 11.1 4.5 14.1
2001 5.0 13.6 6.0 14.7 1.0 5.2 2.5 11.2 4.5 13.5
1998 I 8.3 18.4 9.0 19.5 1.0 8.7 4.3 15.0 6.3 16.6II 7.3 17.4 8.1 18.4 1.0 8.4 3.4 13.7 6.1 16.4III 6.7 14.6 7.5 15.5 1.0 5.9 2.4 10.3 5.7 13.7IV 5.9 11.9 6.8 13.1 1.0 5.7 2.0 8.2 5.4 11.8
1999 I 5.5 11.5 6.6 13.0 1.0 5.2 1.9 8.2 5.1 11.6 II 5.1 9.9 6.4 11.6 1.0 4.1 2.0 6.9 4.9 9.9
III 5.0 11.1 6.1 12.5 1.0 4.0 1.9 8.1 4.7 11.3IV 5.1 12.7 6.1 14.2 1.0 4.0 2.0 9.7 4.7 12.8
2000 I 5.0 13.7 6.1 15.1 1.0 4.1 2.0 10.8 4.4 13.6II 4.9 14.0 6.0 15.3 1.0 4.0 2.0 11.2 4.5 14.5III 4.9 13.9 6.1 15.5 1.0 4.0 2.0 11.2 4.5 14.4IV 5.0 14.1 6.1 15.3 1.0 4.3 2.1 11.2 4.5 14.0
2001 I 5.0 14.0 6.1 15.1 1.0 4.9 2.2 11.2 4.3 13.5 II 5.0 14.2 6.1 15.4 1.0 5.2 2.5 11.7 4.5 14.1 III 4.9 14.0 6.0 15.0 1.0 5.4 2.6 11.9 4.7 14.1 IV 4.9 12.3 6.0 13.4 1.0 5.3 2.6 10.2 4.7 12.2
Lending Deposits
Time depositsDemand deposits Till 30 days 31 days - 1 year Over 1 year
Short term loans Long term loans
n2
r1
r3
n4
n5
n6n r
7nr
8 109
Column
Code
1997 8.7 13.5 8.7 14.4 4.8 9.6 6.6 10.91998 7.1 9.4 7.6 9.2 3.0 2.9 5.9 8.31999 5.9 11.4 6.9 12.2 1.7 7.3 5.1 10.22000 5.9 13.6 6.9 14.7 2.1 9.5 5.1 12.92000 5.7 10.7 7.0 12.2 2.9 8.0 5.3 10.2
1998 I 7.4 6.6 7.5 7.3 4.4 4.5 6.0 5.3II 7.0 5.5 8.4 6.4 3.9 1.4 5.9 4.7III 7.0 10.1 6.9 7.1 2.3 -3.4 5.9 8.7IV 6.9 15.4 7.5 15.8 1.4 9.1 5.8 14.3
1999 I 6.5 11.6 6.9 11.9 1.7 6.0 5.3 9.6II 6.1 16.3 7.0 16.5 1.4 11.5 5.3 15.1III 5.3 9.9 6.5 10.7 1.6 7.5 5.0 9.2IV 5.8 7.7 7.0 9.6 2.2 4.1 4.9 7.0
2000 I 5.9 16.3 6.6 16.8 1.9 11.4 4.8 15.1 II 5.5 13.2 6.9 15.1 2.0 9.6 4.9 13.2 III 5.9 12.7 7.1 14.1 2.2 8.9 5.2 12.2 IV 6.2 12.0 7.0 12.7 2.3 8.0 5.4 11.1 2001 I 6.0 14.1 7.2 14.9 2.5 10.2 5.5 13.1 II 5.9 10.3 7.0 11.5 2.7 7.7 5.2 9.7 III 5.6 9.4 7.0 11.3 3.1 7.3 5.3 9.6 IV 5.4 9.1 7.0 10.9 3.1 6.8 5.1 8.5
nr(D)6 87nr(D)
5r(D)3
n4
n2
r(D)1
Time deposits
Lending
31 days - 1 year Over 1 yearShort term loans Long term loans
Deposits
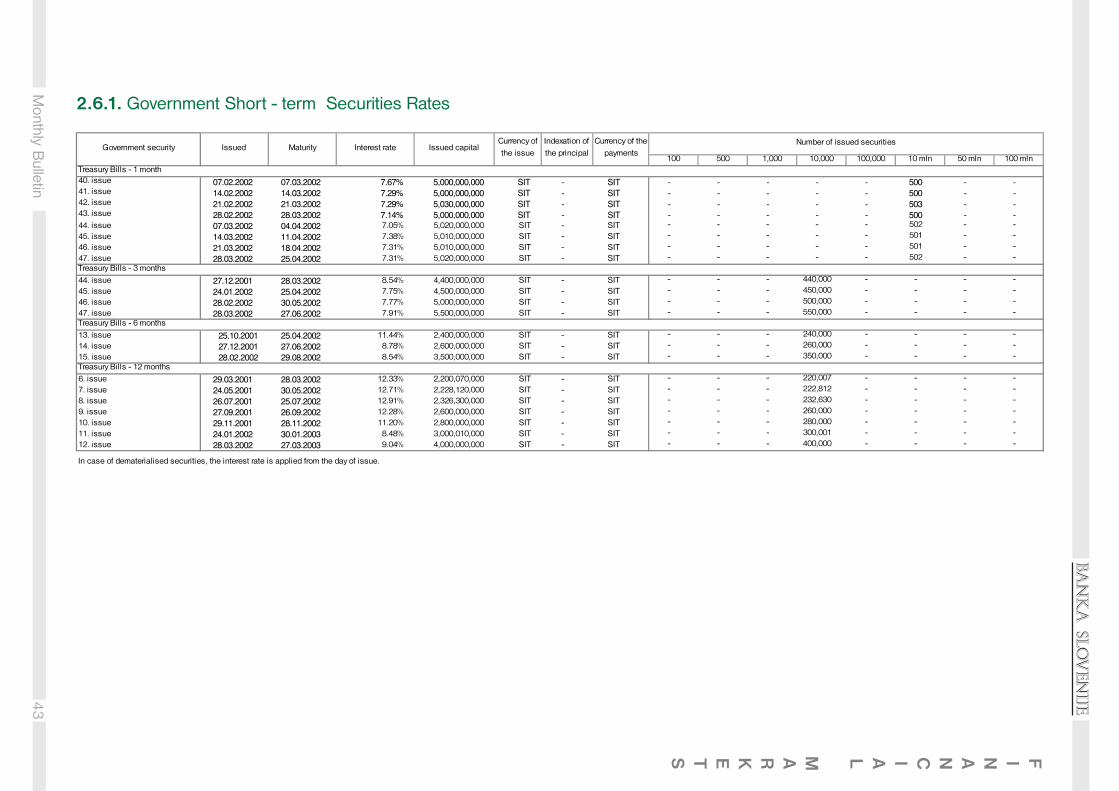
43
��
��
����
��
���
Monthly B
ulletin
FINANCIALMARKETS
2.6.1. Government Short - term Securities Rates
40. issue ����������� ����������� ����� ��������� �� � �� � � � � � �� � �41. issue ����������� ����������� ����� ��������� �� � �� � � � � � �� � �42. issue ����������� ����������� ����� ��������� �� � �� � � � � � �� � �43. issue ����������� ����������� ����� ��������� �� � �� � � � � � �� � �
44. issue ����������� ����������� 7.05% 5,020,000,000 SIT - SIT - - - - - 502 - -45. issue ����������� ����������� 7.38% 5,010,000,000 SIT - SIT - - - - - 501 - -46. issue ����������� ����������� 7.31% 5,010,000,000 SIT - SIT - - - - - 501 - -47. issue ����������� ���������� 7.31% 5,020,000,000 SIT - SIT - - - - - 502 - -
44. issue ����������� ����������� 8.54% 4,400,000,000 SIT - SIT - - - 440,000 - - - -45. issue ����������� ���������� 7.75% 4,500,000,000 SIT - SIT - - - 450,000 - - - -46. issue ����������� ���������� 7.77% 5,000,000,000 SIT - SIT - - - 500,000 - - - -47. issue ����������� ����������� 7.91% 5,500,000,000 SIT - SIT - - - 550,000 - - - -
13. issue ���������� ���������� 11.44% 2,400,000,000 SIT - SIT - - - 240,000 - - - -14. issue ����������� ����������� 8.78% 2,600,000,000 SIT - SIT - - - 260,000 - - - -15. issue ����������� ����������� 8.54% 3,500,000,000 SIT - SIT - - - 350,000 - - - -
6. issue ����������� ����������� 12.33% 2,200,070,000 SIT - SIT - - - 220,007 - - - -7. issue ���������� ���������� 12.71% 2,228,120,000 SIT - SIT - - - 222,812 - - - -8. issue ����������� ���������� 12.91% 2,326,300,000 SIT - SIT - - - 232,630 - - - -9. issue ����������� ����������� 12.28% 2,600,000,000 SIT - SIT - - - 260,000 - - - -10. issue ����������� ����������� 11.20% 2,800,000,000 SIT - SIT - - - 280,000 - - - -11. issue ����������� ����������� 8.48% 3,000,010,000 SIT - SIT - - - 300,001 - - - -12. issue ����������� ����������� 9.04% 4,000,000,000 SIT - SIT - - - 400,000 - - - -
In case of dematerialised securities, the interest rate is applied from the day of issue.
Indexation of the principal
1,000 100,00010,000500100
Number of issued securitiesGovernment security Issued Maturity Interest rate
Treasury Bills - 6 months
Treasury Bills - 12 months
10 mlnTreasury Bills - 1 month
50 mln
Currency of the payments
Issued capitalCurrency of the issue
Treasury Bills - 3 months
100 mln

44
�������������
Monthly Bulletin
2.6.2. Government Long - term Securities RatesFINANCIAL
MARKETS
Government securitiesRS04 04.04.1997 30.06.2022 8,00% 135,460,648 EUR - SITRS06 29.05.1997 15.02.2015 3,00% 43,711,900,000 SIT 90%DPC SITRS08 30.06.1993 31.05.2003 5.00% 49,356,539 EUR - SIT in EURRS10 15.10.1997 31.05.2007 4,50% 52,189,610,000 SIT TOM SITRS12 29.05.1998 29.05.2002 TOM + 4,50% 9,632,810,000 SIT - SITRS13 29.06.1998 29.06.2008 5.55% 54,555,355 EUR - SITRS14 01.06.1999 01.06.2003 TOM + 4,00% 6,304,000,000 SIT - SITRS16 24.02.2000 24.02.2003 TOM + 4,20% 6,000,000,000 SIT - SITRS17 24.02.2000 24.02.2005 TOM + 4,70% 9,000,000,000 SIT - SITRS18 26.04.2000 26.04.2010 6.00% 50,000,000 EUR - SITRS19 24.07.2000 24.07.2003 TOM + 4,20% 6,000,000,000 SIT - SITRS20 01.12.2000 01.12.2003 TOM + 4,20% 6,000,000,000 SIT - SITRS21 01.02.2001 01.03.2015 TOM + 1,00% 20,000,000,000 SIT - SITRS22 13.02.2001 13.02.2006 TOM + 4,70% 8,000,000,000 SIT - SITRS23 13.02.2001 13.02.2011 6.00% 40,000,000 EUR - SITRS24 13.03.2001 13.03.2004 TOM + 4,20% 11,000,000,000 SIT - SITRS25 18.04.2001 18.04.2006 TOM + 4,70% 8,000,000,000 SIT - SITRS26 01.06.2001 01.06.2011 5.375% 50,000,000 EUR - SITRS27 04.12.2001 04.12.2006 TOM + 4,70% 17,000,000,000 SIT - SITRS28 15.01.2002 15.01.2005 TOM + 4,20% 10,500,000,000 SIT - SITRS29 15.01.2002 15.01.2012 5.375% 32,803,700 EUR - SITRS30 01.01.2002 15.09.2008 TOM + 1,00% 30,000,000,000 SIT - SITRS31 15.01.2002 15.01.2007 TOM + 4,70% 2,947,680,000 SIT - SITRS32 15.01.2002 15.01.2012 5.375% 23,865,500 EUR - SITRS34 18.02.2002 18.02.2007 TOM + 4,20% 16,910,000,000 SIT - SITRS35 18.03.2002 18.03.2007 TOM + 4,20% 14,000,000,000 SIT - SITRS36 18.03.2002 18.03.2005 9.00% 3,790,000,000 SIT - SITPROMISSORY NOTE ZZZS 31.12.1996 22.03.2002 TOM + 4,00% 5,122,572,476 SIT - SITRS15 - serie E 16.11.1995 15.10.2002 5,10% 8,981,300,000 SIT TOM SITRS15 - serie F 16.11.1995 15.07.2003 5,20% 4,189,400,000 SIT TOM SITRS15 - serie G 16.11.1995 15.10.2004 5,35% 8,981,300,000 SIT TOM SITRS15 - serie H 16.11.1995 15.10.2005 5,55% 4,790,200,000 SIT TOM SITRS15 - serie I 16.11.1995 15.10.2006 5,70% 8,981,300,000 SIT TOM SITRS15 - serie J 16.11.1995 15.10.2007 5,90% 8,645,200,000 SIT TOM SITRS15 - serie K 16.11.1995 15.10.2008 6,10% 8,981,300,000 SIT TOM SITRS15 - serie L 16.11.1995 15.07.2009 6,25% 8,981,300,000 SIT TOM SITRS15 - serie M 16.11.1995 15.10.2010 6,50% 13,880,200,000 SIT TOM SITRS15 - serie N 16.11.1995 15.07.2005 5,55% 4,000,000,000 SIT TOM ali EUR SITRS15 - serie O 16.11.1995 15.07.2006 5,70% 4,000,000,000 SIT TOM ali EUR SITRS15 - serie P 16.11.1995 15.07.2007 5,90% 4,000,000,000 SIT TOM ali EUR SITRS15 - serie R 16.11.1995 15.07.2008 6,10% 4,000,000,000 SIT TOM ali EUR SITRS15 - serie S 16.11.1995 15.07.2009 6,25% 4,000,000,000 SIT TOM ali EUR SITRS15 - serie T 16.11.1995 15.07.2010 6,50% 4,000,000,000 SIT TOM ali EUR SITEurobondsEUROBOND - EUR 16.06.1997 16.06.2004 5.75% 204,516,753 EUR - EUREUROBOND - EUR 27.05.1998 27.05.2005 5.375% 500,000,000 EUR - EUREUROBOND - EUR 18.03.1999 18.03.2009 4.875% 400,000,000 EUR - EUREUROBOND - EUR 24.03.2000 24.03.2010 6.00% 500,000,000 EUR - EUREUROBOND - EUR 11.04.2001 11.04.2011 5.375% 450,000,000 EUR - EURNFA USD - 2 11.06.1996 27.12.2006 USD-LIBOR + 13/16% 219,895,000 USD - USDNFA EUR - 2 11.06.1996 27.12.2006 EUR-LIBOR + 13/16% 47,966,337 EUR - EUR
In case of dematerialised securities, the interest rate is applied from the day of issue.
Government security Issued Maturity Interest rateIndexation of the principal
Currency of the payments
Issued capitalCurrency of the issue
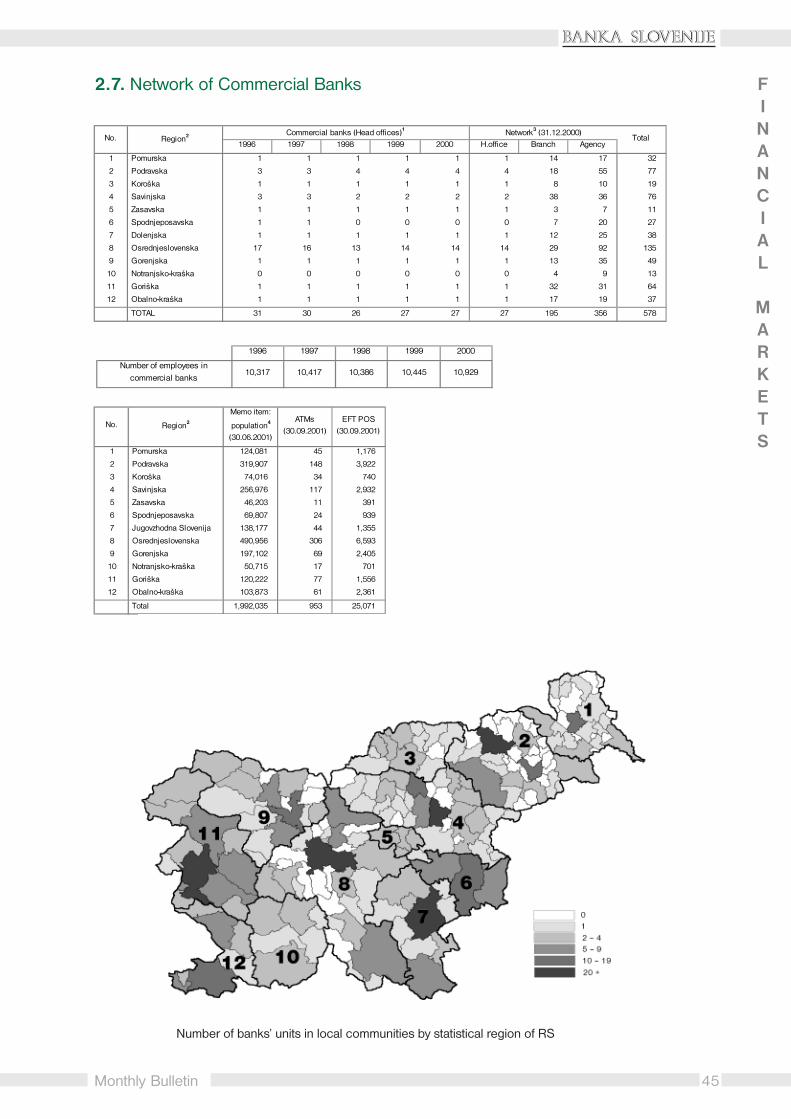
45
�������������
Monthly Bulletin
2.7. Network of Commercial Banks
1 Pomurska 1 1 1 1 1 1 14 17 32
2 Podravska 3 3 4 4 4 4 18 55 77
3 Koroška 1 1 1 1 1 1 8 10 19
4 Savinjska 3 3 2 2 2 2 38 36 76
5 Zasavska 1 1 1 1 1 1 3 7 11
6 Spodnjeposavska 1 1 0 0 0 0 7 20 27
7 Dolenjska 1 1 1 1 1 1 12 25 38
8 Osrednjeslovenska 17 16 13 14 14 14 29 92 135
9 Gorenjska 1 1 1 1 1 1 13 35 49
10 Notranjsko-kraška 0 0 0 0 0 0 4 9 13
11 Goriška 1 1 1 1 1 1 32 31 64
12 Obalno-kraška 1 1 1 1 1 1 17 19 37
TOTAL 31 30 26 27 27 27 195 356 578
TotalH.office Branch Agency1999 2000
No. Region2 Commercial banks (Head offices)1
1996 1997 1998Network3 (31.12.2000)
1 Pomurska 124,081 45 1,176
2 Podravska 319,907 148 3,922
3 Koroška 74,016 34 740
4 Savinjska 256,976 117 2,932
5 Zasavska 46,203 11 391
6 Spodnjeposavska 69,807 24 939
7 Jugovzhodna Slovenija 138,177 44 1,355
8 Osrednjeslovenska 490,956 306 6,593
9 Gorenjska 197,102 69 2,405
10 Notranjsko-kraška 50,715 17 701
11 Goriška 120,222 77 1,556
12 Obalno-kraška 103,873 61 2,361
Total 1,992,035 953 25,071
EFT POS (30.09.2001)
ATMs (30.09.2001)
Memo item:
population4
(30.06.2001)
No. Region2
�����������������������������Number of banks’ units in local communities by statistical region of RS
FINANCIAL
MARKETS
Number of employees in commercial banks
10,386 10,445 10,929
1999 2000
10,317 10,417
1996 1997 1998

46
�������������
Monthly Bulletin
FINANCIAL
MARKETS
2.8. Modern Payment Instruments
Volume of transactions in Slovenia
1996 18,543 5,717 18,419 5,841 21,315 2,945 24,260 - 1,212 725
1997 21,981 9,017 23,114 7,884 27,106 3,892 30,998 45 1,755 948
1998 25,993 12,245 28,147 10,091 33,231 5,006 38,238 1,216 2,278 1,278
1999 28,396 15,798 33,050 11,144 38,704 5,490 44,194 5,264 2,925 1,433
2000 31,830 20,103 38,426 13,506 44,209 7,724 51,933 13,933 3,745 1,558
2001 33,366 21,697 40,218 14,846 47,777 7,286 55,063 26,388 4,585 16,253
2000 I 6,574 4,453 8,616 2,411 9,643 1,384 11,027 2,039 673 313
II 8,133 4,973 9,709 3,397 11,322 1,784 13,106 3,094 868 375
III 9,495 5,443 10,157 4,781 11,932 3,006 14,938 3,942 1,251 507
IV 7,628 5,234 9,944 2,917 11,313 1,549 12,862 4,858 954 364
2001 I 9,525 5,018 9,493 5,050 11,821 2,722 14,543 5,402 901 340
II 7,938 5,509 10,337 3,110 11,955 1,492 13,448 6,458 1,183 395
III 7,908 5,381 10,062 3,227 11,793 1,496 13,289 6,824 1,515 483
IV 8,078 5,706 10,325 3,458 12,208 1,576 41,352 7,703 985 402
95ColumnCode
Domesticcards
6 7=1+2,3+4,5+6 81 2 3 4
Personal Total
licence banks enterprises cards cardsBusiness
10
Number of transaction
abroad4
In thousands
Cards issued in Slovenia
Cards issued
abroad3
Credit cards1
Debit cards2Under Issued by Issued by
1996 73,407 32,737 81,075 25,070 88,826 17,318 106,144 - 17,142 11,897
1997 90,417 52,743 108,891 34,270 120,034 23,128 143,160 239 25,565 17,162
1998 111,565 73,086 138,319 46,332 152,453 32,198 184,651 6,890 33,552 22,638
1999 127,134 97,561 167,751 56,945 185,451 39,245 224,695 30,034 42,727 27,284
2000 179,187 142,673 218,962 102,897 245,942 75,918 321,860 92,982 58,499 28,551
2001 186,422 170,049 251,098 105,373 287,814 68,657 356,471 162,896 77,047 31,956
2000 I 31,800 29,504 45,776 15,528 49,744 11,560 61,304 11,491 11,020 6,176
II 38,614 34,592 53,742 19,463 58,617 14,589 73,206 18,321 13,525 6,990
III 60,674 38,612 58,739 40,547 68,577 30,709 99,287 24,090 18,370 8,322
IV 48,099 39,965 60,706 27,358 69,004 19,060 88,064 31,080 15,584 7,063
2001 I 42,197 38,089 57,201 23,086 64,843 15,443 80,286 32,415 15,476 7,096
II 47,691 42,813 64,064 26,440 72,946 17,558 90,503 40,522 19,251 7,942
III 48,016 41,981 62,950 27,046 72,662 17,335 89,997 42,515 24,286 8,565
IV 49,395 46,290 66,883 28,801 77,363 18,321 95,684 47,444 18,034 8,306
95ColumnCode
Domesticcards
6 7=1+2,3+4,5+6 81 2 3 4
Issued by Personal Total
licence banks enterprises cards cardsBusiness
10
Value of transactions in Slovenia
Value of transaction
abroad4
Millions of Tolars Cards issued in Slovenia
Cards issued
abroad3
Credit cards1
Debit cards2Under Issued by
1996 31.dec. 309,259 159,653 343,521 125,391 404,456 64,456 468,912 -1997 31.dec. 382,150 212,567 421,228 173,489 515,261 79,456 594,717 289,3011998 31.dec. 350,567 243,296 415,666 178,197 510,145 83,718 593,863 775,032
1999 31.dec. 374,929 272,887 438,823 208,993 551,645 96,171 647,816 961,9822000 31.dec. 421,405 320,666 498,670 243,401 629,879 112,192 742,071 1,392,3792001 31.dec. 443,541 337,650 512,994 268,197 669,430 111,761 781,191 1,495,660
2000 31.mar. 361,493 276,627 443,439 194,681 537,726 100,394 638,120 1,073,345
30.jun. 374,440 281,083 449,406 206,117 550,432 105,091 655,523 1,101,16330.sep. 404,164 299,298 476,268 227,194 593,205 110,257 703,462 1,126,87431.dec. 421,405 320,666 498,670 243,401 629,879 112,192 742,071 1,392,379
2001 31.mar. 434,093 324,064 501,998 256,159 644,317 113,840 758,157 1,416,139
30.jun. 442,366 327,816 511,763 258,419 651,638 118,544 770,182 1,441,47730.sep. 449,213 330,290 512,244 267,262 662,588 116,915 779,503 1,477,001
31.dec. 443,541 337,650 512,994 268,197 669,430 111,761 781,191 1,495,660
Number of cards in circulation - cards issued in Slovenia
Credit cards1
Debit cards2Domestic Under Issued by Issued by Personal Business
Totalcards cards
Column 1 2 3
cards licence banks enterprises
4 5 6Code
87=1+2,3+4,5+6
2.8.1. Payment Cards
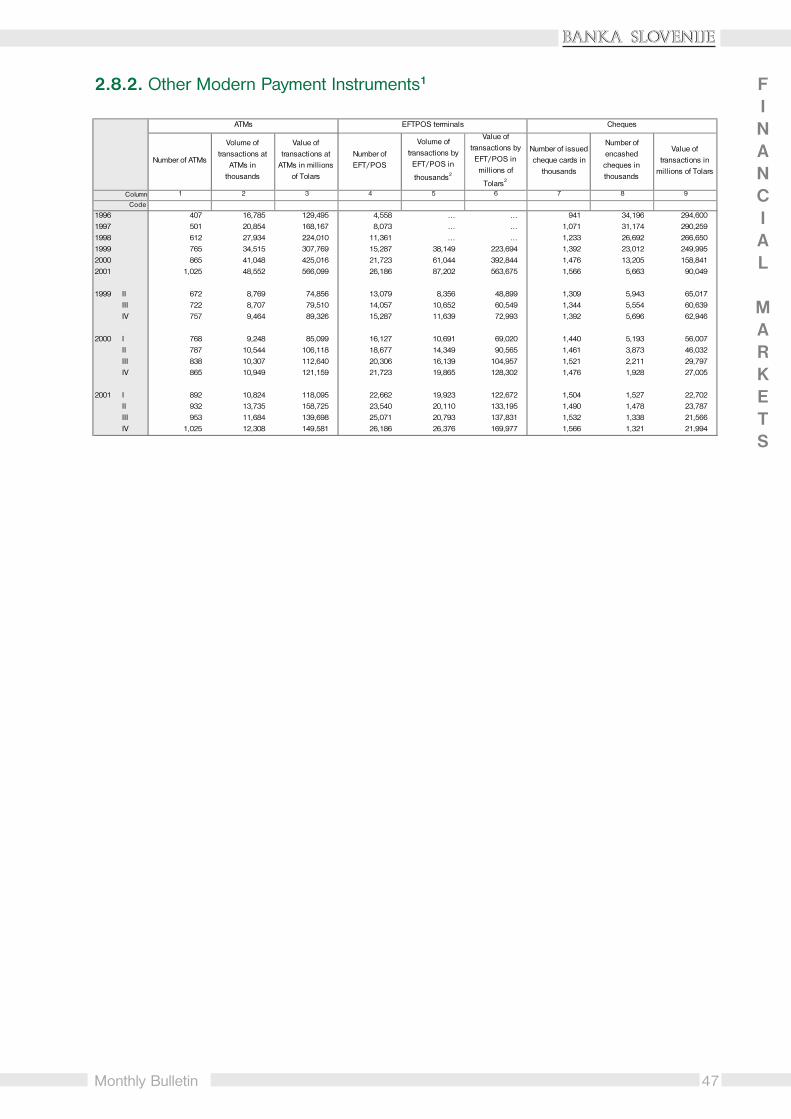
47
�������������
Monthly Bulletin
FINANCIAL
MARKETS
2.8.2. Other Modern Payment Instruments1
Column
Code
1996 407 16,785 129,495 4,558 … … 941 34,196 294,6001997 501 20,854 168,167 8,073 … … 1,071 31,174 290,2591998 612 27,934 224,010 11,361 … … 1,233 26,692 266,6501999 765 34,515 307,769 15,287 38,149 223,694 1,392 23,012 249,9952000 865 41,048 425,016 21,723 61,044 392,844 1,476 13,205 158,8412001 1,025 48,552 566,099 26,186 87,202 563,675 1,566 5,663 90,049
1999 II 672 8,769 74,856 13,079 8,356 48,899 1,309 5,943 65,017III 722 8,707 79,510 14,057 10,652 60,549 1,344 5,554 60,639IV 757 9,464 89,326 15,287 11,639 72,993 1,392 5,696 62,946
2000 I 768 9,248 85,099 16,127 10,691 69,020 1,440 5,193 56,007 II 787 10,544 106,118 18,677 14,349 90,565 1,461 3,873 46,032
III 838 10,307 112,640 20,306 16,139 104,957 1,521 2,211 29,797IV 865 10,949 121,159 21,723 19,865 128,302 1,476 1,928 27,005
2001 I 892 10,824 118,095 22,662 19,923 122,672 1,504 1,527 22,702II 932 13,735 158,725 23,540 20,110 133,195 1,490 1,478 23,787III 953 11,684 139,698 25,071 20,793 137,831 1,532 1,338 21,566IV 1,025 12,308 149,581 26,186 26,376 169,977 1,566 1,321 21,994
ATMs EFTPOS terminals Cheques
8 9631
Value of transactions by
EFT/POS in millions of
Tolars2
Number of issued cheque cards in
thousands
2 5 74
Volume of transactions by
EFT/POS in
thousands2
Number of encashed
cheques in thousands
Value of transactions in
millions of TolarsNumber of ATMs
Volume of transactions at
ATMs in thousands
Value of transactions at
ATMs in millions of Tolars
Number of EFT/POS

48
�������������
Monthly Bulletin
2.9. The Ljubljana Stock Exchange: Turnover by Market Segment and by Type of Securities
Column
Code
1992 13,583 - - - - 274 2.0 - - 8,154 60.0 5,155 38.01993 87,227 - - - - 34,795 39.9 - - 36,360 41.7 16,073 18.41994 112,830 - - - - 53,352 47.3 - - 33,014 29.3 26,464 23.51995 88,092 61,726 70.1 26,366 29.9 45,216 51.3 - - 22,738 25.8 20,138 22.91996 87,004 64,716 74.4 22,288 25.6 67,081 77.1 - - 13,221 15.2 6,702 7.71997 108,296 62,931 58.1 45,366 41.9 87,555 80.8 - - 11,526 10.6 9,216 8.51998 173,375 135,373 78.1 38,002 21.9 133,757 77.1 10,035.5 5.8 22,070 12.7 7,512 4.31999 265,631 164,842 62.1 100,789 37.9 168,383 63.4 55,503.4 20.9 35,298 13.3 6,446 2.42000 269,617 146,187 54.2 123,430 45.8 145,323 53.9 64,665.4 24.0 56,442 20.9 3,187 1.22001 348,644 233,299 66.9 115,344 33.1 237,140 68.0 57,054.1 16.4 51,620 14.8 2,830 0.8 1997 Aug. 8,339 4,579 54.9 3,761 45.1 7,558 90.6 - - 574 6.9 207 2.5 Sep. 7,788 4,619 59.3 3,169 40.7 6,903 88.6 - - 782 10.0 103 1.3 Oct. 7,443 3,900 52.4 3,542 47.6 6,118 82.2 - - 566 7.6 758 10.2 Nov. 5,706 4,439 77.8 1,267 22.2 5,244 91.9 - - 409 7.2 53 0.9 Dec. 16,417 8,361 50.9 8,055 49.1 7,901 48.1 - - 2,752 16.8 5,764 35.1 1998 Jan. 4,570 3,573 78.2 997 21.8 3,227 70.6 8.3 0.2 890 19.5 445 9.7 Feb. 9,219 7,862 85.3 1,358 14.7 7,894 85.6 27.8 0.3 581 6.3 717 7.8 Mar. 15,371 12,901 83.9 2,470 16.1 13,054 84.9 59.6 0.4 859 5.6 1,398 9.1 Apr. 7,787 5,787 74.3 2,001 25.7 6,197 79.6 102.6 1.3 546 7.0 941 12.1 May 6,766 4,930 72.9 1,836 27.1 5,448 80.5 300.0 4.4 715 10.6 303 4.5 Jun. 12,496 9,721 77.8 2,775 22.2 10,206 81.7 105.6 0.8 1,620 13.0 564 4.5 Jul. 17,119 12,790 74.7 4,329 25.3 14,453 84.4 211.3 1.2 1,539 9.0 916 5.3 Aug. 20,209 16,501 81.6 3,708 18.4 17,597 87.1 579.9 2.9 1,291 6.4 741 3.7 Sep. 13,979 11,228 80.3 2,750 19.7 12,426 88.9 883.7 6.3 619 4.4 50 0.4 Oct. 9,775 6,732 68.9 3,043 31.1 6,371 65.2 1,244.6 12.7 1,899 19.4 260 2.7 Nov. 20,177 15,112 74.9 5,065 25.1 13,515 67.0 3,560.1 17.6 2,978 14.8 123 0.6 Dec. 35,907 28,237 78.6 7,670 21.4 23,369 65.1 2,952.0 8.2 8,533 23.8 1,053 2.9 1999 Jan. 23,418 17,632 75.3 5,786 24.7 16,615 70.9 2,674.6 11.4 4,076 17.4 53 0.2 Feb. 22,830 17,691 77.5 5,139 22.5 18,057 79.1 2,485.1 10.9 1,943 8.5 345 1.5 Mar. 24,339 16,932 69.6 7,407 30.4 18,564 76.3 3,322.2 13.6 1,639 6.7 813 3.3 Apr. 17,122 10,096 59.0 7,027 41.0 9,390 54.8 2,366.0 13.8 3,474 20.3 1,892 11.0 May 14,105 9,491 67.3 4,615 32.7 9,645 68.4 2,804.3 19.9 1,462 10.4 194 1.4 Jun. 19,048 11,991 63.0 7,056 37.0 12,987 68.2 3,581.9 18.8 2,302 12.1 176 0.9 Jul. 9,993 5,979 59.8 4,014 40.2 6,748 67.5 1,524.1 15.3 1,571 15.7 149 1.5 Aug. 17,816 8,522 47.8 9,294 52.2 8,403 47.2 6,886.4 38.7 1,935 10.9 591 3.3 Sep. 23,546 12,504 53.1 11,042 46.9 12,753 54.2 6,511.9 27.7 4,184 17.8 97 0.4 Oct. 27,707 16,080 58.0 11,627 42.0 12,872 46.5 8,845.8 31.9 5,937 21.4 52 0.2 Nov. 21,428 11,197 52.3 10,231 47.7 12,477 58.2 5,235.5 24.4 2,515 11.7 1,201 5.6 Dec. 44,278 26,728 60.4 17,550 39.6 29,871 67.5 9,265.5 20.9 4,259 9.6 883 2.0 2000 Jan. 20,762 11,554 55.7 9,208 44.3 10,256 49.4 4,345.5 20.9 5,068 24.4 1,092 5.3 Feb. 21,753 10,951 50.3 10,802 49.7 10,865 49.9 3,305.7 15.2 7,524 34.6 59 0.3 Mar. 28,021 15,379 54.9 12,643 45.1 15,665 55.9 6,547.1 23.4 5,809 20.7 0 0.0 Apr. 16,776 9,681 57.7 7,095 42.3 7,910 47.2 2,850.0 17.0 5,758 34.3 257 1.5 May 15,167 7,441 49.1 7,726 50.9 6,580 43.4 4,907.1 32.4 3,680 24.3 0 0.0 Jun. 23,393 13,757 58.8 9,636 41.2 13,772 58.9 4,951.8 21.2 4,669 20.0 0 0.0 Jul. 17,555 11,221 63.9 6,334 36.1 11,596 66.1 1,895.1 10.8 4,063 23.1 0 0.0 Aug. 10,889 5,425 49.8 5,464 50.2 6,337 58.2 2,984.9 27.4 1,567 14.4 0 0.0 Sep. 18,966 7,240 38.2 11,726 61.8 10,132 53.4 5,935.5 31.3 2,899 15.3 0 0.0 Oct. 19,640 10,433 53.1 9,207 46.9 11,968 60.9 4,994.3 25.4 2,678 13.6 0 0.0 Nov. 23,572 12,273 52.1 11,299 47.9 12,147 51.5 7,658.9 32.5 3,766 16.0 0 0.0 Dec. 53,123 30,832 58.0 22,291 42.0 28,095 52.9 14,289.6 26.9 8,960 16.9 1,779 3.3 2001 Jan. 33,268 19,860 59.7 13,408 40.3 19,145 57.5 10,407.1 31.3 3,716 11.2 0 0.0 Feb. 18,737 12,525 66.8 6,212 33.2 10,102 53.9 2,764.4 14.8 5,630 30.0 241 1.3 Mar. 18,043 10,802 59.9 7,241 40.1 10,518 58.3 4,228.8 23.4 3,297 18.3 0 0.0 Apr. 17,513 11,623 66.4 5,890 33.6 10,035 57.3 3,344.3 19.1 4,085 23.3 50 0.3 May 26,114 17,542 67.2 8,572 32.8 17,835 68.3 4,335.0 16.6 3,594 13.8 350 1.3 Jun. 31,816 17,166 54.0 14,650 46.0 20,352 64.0 8,559.4 26.9 2,905 9.1 0 0.0 Jul. 30,807 24,675 80.1 6,131 19.9 24,653 80.0 1,951.2 6.3 4,203 13.6 0 0.0 Aug. 18,767 12,901 68.7 5,866 31.3 13,199 70.3 2,447.4 13.0 3,121 16.6 0 0.0 Sep. 35,868 23,082 64.4 12,785 35.6 30,066 83.8 3,705.2 10.3 2,091 5.8 5 0.0 Oct. 30,897 22,564 73.0 8,333 27.0 22,465 72.7 4,162.1 13.5 4,270 13.8 0 0.0 Nov. 40,230 28,126 69.9 12,104 30.1 30,143 74.9 4,562.9 11.3 4,338 10.8 1,186 2.9 Dec. 46,585 32,433 69.6 14,152 30.4 28,629 61.5 6,586.4 14.1 10,371 22.3 998 2.1 2002 Jan. 30,038 23,391 77.9 6,646 22.1 20,088 66.9 3,015.6 10.0 6,934 23.1 0 0.0 Feb. 30,660 17,551 57.2 13,109 42.8 14,684 47.9 7,442.1 24.3 8,533 27.8 0 0.0 Mar. 37,324 22,519 60.3 14,805 39.7 20,242 54.2 8,564.8 22.9 8,517 22.8 0 0.0
Mio SIT
Total Official Market Free Market Shares
Mio SIT Mio SIT % Mio SIT %761 4
PIF Bonds
2 5 8
% Mio SIT
Short-Term Securities
Turnover by Market Segment and by Type of Securities
10
%13
Mio SIT % Mio SIT11
Source: The Ljubljana Stock Exchange and computations in BS.
%9 123
FINANCIAL
MARKETS

49
�������������
Monthly Bulletin
2.10. The Ljubljana Stock Exchange: Market Capitalization and Turnover Ratio
Column
Code
1992 33,356 0.253 - - - - 2,538 0.108 - - 30,818 0.2651993 62,869 1.132 - - - - 18,593 1.871 - - 44,276 0.8211994 75,579 1.143 - - - - 27,642 1.930 - - 47,937 0.6891995 100,701 0.675 95,071 0.649 5,630 1.106 40,477 1.117 - - 60,224 0.3781996 177,183 0.453 140,101 0.462 37,081 0.420 124,990 0.537 - - 52,192 0.2531997 399,345 0.248 337,086 0.187 62,258 0.581 315,945 0.277 - - 83,400 0.1381998 710,252 0.234 524,334 0.258 185,918 0.164 483,037 0.277 82,106 0.122 145,108 0.1521999 919,692 0.282 635,850 0.259 283,842 0.332 566,462 0.297 132,468 0.419 220,763 0.1602000 1,138,432 0.234 808,009 0.181 330,422 0.364 705,093 0.206 178,324 0.363 255,015 0.2212001 1,379,969 0.251 985,291 0.237 394,677 0.285 849,989 0.279 169,061 0.337 360,919 0.143 1997 Oct. 400,200 0.017 262,647 0.015 137,553 0.020 315,203 0.019 - - 84,997 0.007 Nov. 373,224 0.015 302,996 0.015 70,228 0.017 288,634 0.018 - - 84,590 0.005 Dec. 399,344 0.027 337,086 0.025 62,258 0.037 315,945 0.025 - - 83,400 0.033 1998 Jan. 422,957 0.010 360,587 0.010 62,370 0.009 334,134 0.010 1,911 0.004 86,912 0.010 Feb. 438,341 0.019 375,990 0.021 62,351 0.010 350,062 0.023 1,693 0.016 86,587 0.007 Mar. 479,817 0.029 409,870 0.031 69,947 0.015 391,288 0.033 3,396 0.018 85,133 0.010 Apr. 496,903 0.014 419,605 0.014 77,298 0.014 405,973 0.015 5,435 0.019 85,494 0.006 May 497,022 0.013 419,883 0.012 77,139 0.020 406,562 0.013 6,705 0.045 83,755 0.009 Jun. 523,125 0.023 422,828 0.023 100,297 0.022 423,331 0.024 14,259 0.007 85,536 0.019 Jul. 607,406 0.027 467,186 0.027 140,221 0.024 476,558 0.030 16,283 0.013 114,565 0.013 Aug. 611,291 0.032 491,977 0.034 119,314 0.025 445,496 0.039 24,812 0.023 140,982 0.009 Sep. 612,050 0.023 487,257 0.023 124,793 0.022 443,052 0.028 27,626 0.032 141,372 0.004 Oct. 608,546 0.016 466,479 0.014 142,066 0.020 419,854 0.015 46,165 0.027 142,527 0.013 Nov. 647,780 0.031 488,833 0.031 158,947 0.031 440,304 0.031 64,583 0.055 142,893 0.021 Dec. 710,252 0.049 524,334 0.054 185,918 0.036 483,037 0.048 82,106 0.036 145,108 0.059 1999 Jan. 776,931 0.030 574,772 0.031 202,159 0.028 540,644 0.031 90,928 0.029 145,359 0.028 Feb. 796,969 0.028 587,859 0.030 209,110 0.023 558,826 0.032 93,815 0.026 144,328 0.013 Mar. 761,247 0.031 555,313 0.030 205,933 0.032 524,348 0.035 93,742 0.035 143,157 0.011 Apr. 747,787 0.020 551,663 0.018 196,125 0.026 516,083 0.018 87,598 0.027 144,106 0.024 May 759,399 0.018 548,506 0.017 210,893 0.021 519,257 0.019 96,653 0.029 143,488 0.010 Jun. 825,264 0.023 607,296 0.020 217,968 0.032 505,539 0.026 103,978 0.034 215,747 0.011 Jul. 858,194 0.011 628,782 0.010 229,412 0.017 526,128 0.013 114,326 0.013 217,740 0.007 Aug. 885,742 0.019 660,561 0.013 225,182 0.039 566,357 0.015 102,066 0.067 217,320 0.009 Sep. 893,925 0.026 646,792 0.019 247,133 0.044 566,064 0.023 118,911 0.055 208,950 0.020 Oct. 923,877 0.030 639,306 0.025 284,571 0.041 578,791 0.022 129,480 0.068 215,606 0.028 Nov. 899,672 0.022 633,297 0.018 266,375 0.034 555,842 0.022 127,673 0.041 216,157 0.012 Dec. 919,692 0.047 635,850 0.042 283,842 0.059 566,461 0.053 132,468 0.070 220,763 0.019 2000 Jan. 1,025,675 0.019 685,239 0.017 340,436 0.024 625,761 0.016 180,778 0.024 219,135 0.023 Feb. 1,015,726 0.021 692,143 0.016 323,582 0.033 610,579 0.018 166,231 0.020 238,915 0.031 Mar. 1,031,277 0.027 724,439 0.021 306,837 0.041 631,126 0.025 150,931 0.043 249,220 0.023 Apr. 1,036,131 0.016 729,886 0.013 306,244 0.022 629,390 0.013 150,764 0.019 255,976 0.022 May 1,019,044 0.015 718,622 0.010 300,421 0.026 614,924 0.011 143,749 0.034 260,371 0.014 Jun. 1,030,455 0.023 719,678 0.019 310,777 0.031 617,909 0.022 147,458 0.034 265,088 0.018 Jul. 1,020,058 0.017 713,209 0.016 306,849 0.021 629,171 0.018 145,077 0.013 245,810 0.017 Aug. 1,046,803 0.010 730,453 0.007 316,350 0.017 644,338 0.010 150,599 0.020 251,866 0.006 Sep. 1,014,816 0.019 709,251 0.010 305,565 0.038 616,679 0.016 144,900 0.041 253,237 0.011 Oct. 1,056,450 0.019 736,342 0.014 320,108 0.029 640,138 0.019 157,086 0.032 259,226 0.010 Nov. 1,071,994 0.022 758,279 0.016 313,715 0.036 666,417 0.018 166,338 0.046 239,240 0.016 Dec. 1,138,431 0.045 808,009 0.038 330,422 0.062 705,093 0.040 178,324 0.080 255,015 0.035 2001 Jan. 1,136,930 0.029 831,749 0.024 305,181 0.044 727,110 0.026 157,149 0.066 252,671 0.015 Feb. 1,130,714 0.016 822,039 0.015 308,676 0.019 714,794 0.014 161,352 0.017 254,568 0.022 Mar. 1,124,272 0.016 800,104 0.014 324,167 0.022 686,579 0.015 158,122 0.027 279,570 0.012 Apr. 1,123,874 0.016 803,091 0.014 320,783 0.018 677,996 0.015 152,906 0.022 292,972 0.014 May 1,160,611 0.022 836,392 0.021 324,219 0.025 712,106 0.025 148,245 0.029 300,261 0.012 Jun. 1,191,804 0.027 862,636 0.020 329,169 0.045 736,978 0.028 147,483 0.058 307,343 0.009 Jul. 1,221,661 0.025 887,589 0.028 334,072 0.018 759,319 0.032 153,164 0.013 309,177 0.014 Aug. 1,257,673 0.015 910,590 0.014 347,083 0.017 789,513 0.017 157,960 0.015 310,199 0.010 Sep. 1,263,876 0.028 909,602 0.025 354,274 0.036 785,343 0.038 163,408 0.023 315,126 0.007 Oct. 1,302,727 0.024 925,415 0.024 377,312 0.022 798,571 0.028 162,591 0.026 341,565 0.013 Nov. 1,353,788 0.029 958,360 0.029 395,428 0.028 835,697 0.036 167,120 0.027 350,971 0.012 Dec. 1,379,969 0.033 985,291 0.033 394,677 0.033 849,989 0.034 169,061 0.039 360,919 0.029 2002 Jan. 1,444,902 0.021 1,033,481 0.023 411,422 0.016 873,532 0.023 174,713 0.017 396,658 0.017 Feb. 1,481,247 0.021 1,043,120 0.017 438,127 0.030 873,347 0.017 186,136 0.040 421,763 0.020 Mar. 1,618,969 0.023 1,152,423 0.020 466,546 0.032 973,240 0.021 203,090 0.042 442,639 0.019
6 97 8 11 123
Mio SITRatio1 2 4 5
Mio SITMio SIT Ratio
Market Capitalization and Turnover Ratio
Total Official Market Free Market Shares PIF Bonds
Mio SIT Ratio
Source: The Ljubljana Stock Exchange and computations in BS.
RatioRatio10
Mio SIT Ratio Mio SIT
FINANCIAL
MARKETS
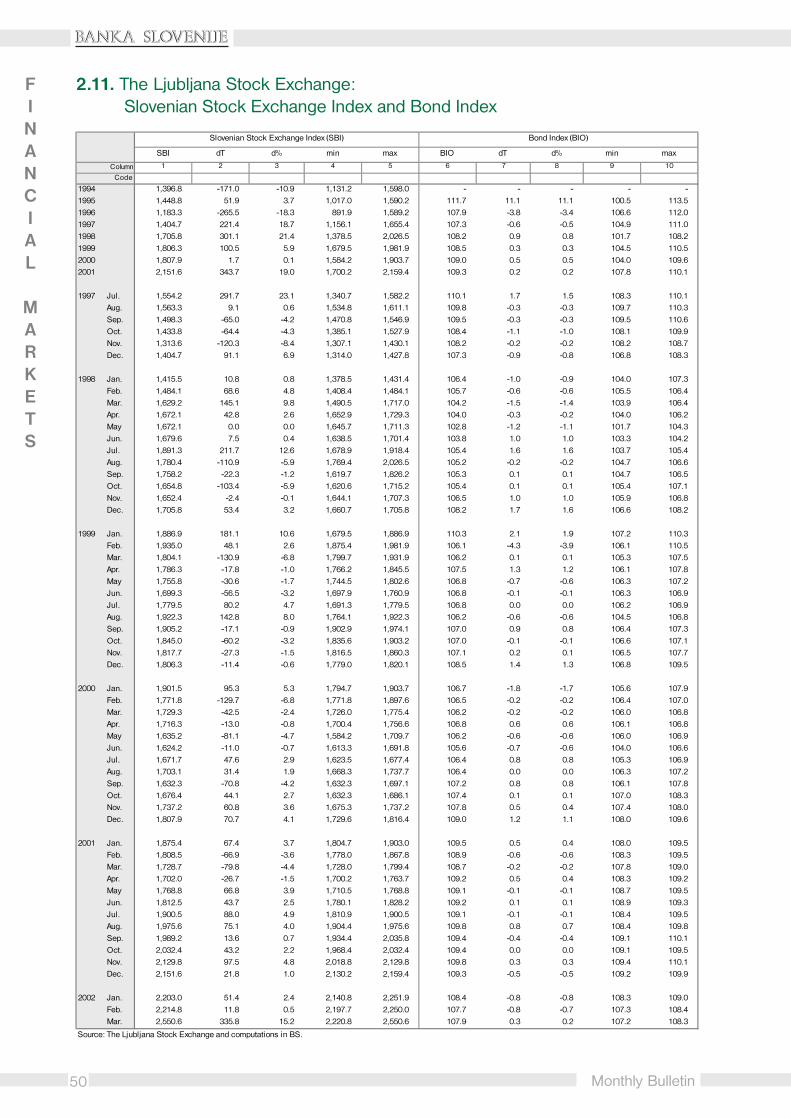
50
�������������
Monthly Bulletin
2.11. The Ljubljana Stock Exchange: Slovenian Stock Exchange Index and Bond Index
Column
Code
1994 1,396.8 -171.0 -10.9 1,131.2 1,598.0 - - - - -1995 1,448.8 51.9 3.7 1,017.0 1,590.2 111.7 11.1 11.1 100.5 113.51996 1,183.3 -265.5 -18.3 891.9 1,589.2 107.9 -3.8 -3.4 106.6 112.01997 1,404.7 221.4 18.7 1,156.1 1,655.4 107.3 -0.6 -0.5 104.9 111.01998 1,705.8 301.1 21.4 1,378.5 2,026.5 108.2 0.9 0.8 101.7 108.21999 1,806.3 100.5 5.9 1,679.5 1,981.9 108.5 0.3 0.3 104.5 110.52000 1,807.9 1.7 0.1 1,584.2 1,903.7 109.0 0.5 0.5 104.0 109.62001 2,151.6 343.7 19.0 1,700.2 2,159.4 109.3 0.2 0.2 107.8 110.1 1997 Jul. 1,554.2 291.7 23.1 1,340.7 1,582.2 110.1 1.7 1.5 108.3 110.1 Aug. 1,563.3 9.1 0.6 1,534.8 1,611.1 109.8 -0.3 -0.3 109.7 110.3 Sep. 1,498.3 -65.0 -4.2 1,470.8 1,546.9 109.5 -0.3 -0.3 109.5 110.6 Oct. 1,433.8 -64.4 -4.3 1,385.1 1,527.9 108.4 -1.1 -1.0 108.1 109.9 Nov. 1,313.6 -120.3 -8.4 1,307.1 1,430.1 108.2 -0.2 -0.2 108.2 108.7 Dec. 1,404.7 91.1 6.9 1,314.0 1,427.8 107.3 -0.9 -0.8 106.8 108.3 1998 Jan. 1,415.5 10.8 0.8 1,378.5 1,431.4 106.4 -1.0 -0.9 104.0 107.3 Feb. 1,484.1 68.6 4.8 1,408.4 1,484.1 105.7 -0.6 -0.6 105.5 106.4 Mar. 1,629.2 145.1 9.8 1,490.5 1,717.0 104.2 -1.5 -1.4 103.9 106.4 Apr. 1,672.1 42.8 2.6 1,652.9 1,729.3 104.0 -0.3 -0.2 104.0 106.2 May 1,672.1 0.0 0.0 1,645.7 1,711.3 102.8 -1.2 -1.1 101.7 104.3 Jun. 1,679.6 7.5 0.4 1,638.5 1,701.4 103.8 1.0 1.0 103.3 104.2 Jul. 1,891.3 211.7 12.6 1,678.9 1,918.4 105.4 1.6 1.6 103.7 105.4 Aug. 1,780.4 -110.9 -5.9 1,769.4 2,026.5 105.2 -0.2 -0.2 104.7 106.6 Sep. 1,758.2 -22.3 -1.2 1,619.7 1,826.2 105.3 0.1 0.1 104.7 106.5 Oct. 1,654.8 -103.4 -5.9 1,620.6 1,715.2 105.4 0.1 0.1 105.4 107.1 Nov. 1,652.4 -2.4 -0.1 1,644.1 1,707.3 106.5 1.0 1.0 105.9 106.8 Dec. 1,705.8 53.4 3.2 1,660.7 1,705.8 108.2 1.7 1.6 106.6 108.2 1999 Jan. 1,886.9 181.1 10.6 1,679.5 1,886.9 110.3 2.1 1.9 107.2 110.3 Feb. 1,935.0 48.1 2.6 1,875.4 1,981.9 106.1 -4.3 -3.9 106.1 110.5 Mar. 1,804.1 -130.9 -6.8 1,799.7 1,931.9 106.2 0.1 0.1 105.3 107.5 Apr. 1,786.3 -17.8 -1.0 1,766.2 1,845.5 107.5 1.3 1.2 106.1 107.8 May 1,755.8 -30.6 -1.7 1,744.5 1,802.6 106.8 -0.7 -0.6 106.3 107.2 Jun. 1,699.3 -56.5 -3.2 1,697.9 1,760.9 106.8 -0.1 -0.1 106.3 106.9 Jul. 1,779.5 80.2 4.7 1,691.3 1,779.5 106.8 0.0 0.0 106.2 106.9 Aug. 1,922.3 142.8 8.0 1,764.1 1,922.3 106.2 -0.6 -0.6 104.5 106.8 Sep. 1,905.2 -17.1 -0.9 1,902.9 1,974.1 107.0 0.9 0.8 106.4 107.3 Oct. 1,845.0 -60.2 -3.2 1,835.6 1,903.2 107.0 -0.1 -0.1 106.6 107.1 Nov. 1,817.7 -27.3 -1.5 1,816.5 1,860.3 107.1 0.2 0.1 106.5 107.7 Dec. 1,806.3 -11.4 -0.6 1,779.0 1,820.1 108.5 1.4 1.3 106.8 109.5 2000 Jan. 1,901.5 95.3 5.3 1,794.7 1,903.7 106.7 -1.8 -1.7 105.6 107.9 Feb. 1,771.8 -129.7 -6.8 1,771.8 1,897.6 106.5 -0.2 -0.2 106.4 107.0 Mar. 1,729.3 -42.5 -2.4 1,726.0 1,775.4 106.2 -0.2 -0.2 106.0 106.8 Apr. 1,716.3 -13.0 -0.8 1,700.4 1,756.6 106.8 0.6 0.6 106.1 106.8 May 1,635.2 -81.1 -4.7 1,584.2 1,709.7 106.2 -0.6 -0.6 106.0 106.9 Jun. 1,624.2 -11.0 -0.7 1,613.3 1,691.8 105.6 -0.7 -0.6 104.0 106.6 Jul. 1,671.7 47.6 2.9 1,623.5 1,677.4 106.4 0.8 0.8 105.3 106.9 Aug. 1,703.1 31.4 1.9 1,668.3 1,737.7 106.4 0.0 0.0 106.3 107.2 Sep. 1,632.3 -70.8 -4.2 1,632.3 1,697.1 107.2 0.8 0.8 106.1 107.8 Oct. 1,676.4 44.1 2.7 1,632.3 1,686.1 107.4 0.1 0.1 107.0 108.3 Nov. 1,737.2 60.8 3.6 1,675.3 1,737.2 107.8 0.5 0.4 107.4 108.0 Dec. 1,807.9 70.7 4.1 1,729.6 1,816.4 109.0 1.2 1.1 108.0 109.6 2001 Jan. 1,875.4 67.4 3.7 1,804.7 1,903.0 109.5 0.5 0.4 108.0 109.5 Feb. 1,808.5 -66.9 -3.6 1,778.0 1,867.8 108.9 -0.6 -0.6 108.3 109.5 Mar. 1,728.7 -79.8 -4.4 1,728.0 1,799.4 108.7 -0.2 -0.2 107.8 109.0 Apr. 1,702.0 -26.7 -1.5 1,700.2 1,763.7 109.2 0.5 0.4 108.3 109.2 May 1,768.8 66.8 3.9 1,710.5 1,768.8 109.1 -0.1 -0.1 108.7 109.5 Jun. 1,812.5 43.7 2.5 1,780.1 1,828.2 109.2 0.1 0.1 108.9 109.3 Jul. 1,900.5 88.0 4.9 1,810.9 1,900.5 109.1 -0.1 -0.1 108.4 109.5 Aug. 1,975.6 75.1 4.0 1,904.4 1,975.6 109.8 0.8 0.7 108.4 109.8 Sep. 1,989.2 13.6 0.7 1,934.4 2,035.8 109.4 -0.4 -0.4 109.1 110.1 Oct. 2,032.4 43.2 2.2 1,968.4 2,032.4 109.4 0.0 0.0 109.1 109.5 Nov. 2,129.8 97.5 4.8 2,018.8 2,129.8 109.8 0.3 0.3 109.4 110.1 Dec. 2,151.6 21.8 1.0 2,130.2 2,159.4 109.3 -0.5 -0.5 109.2 109.9 2002 Jan. 2,203.0 51.4 2.4 2,140.8 2,251.9 108.4 -0.8 -0.8 108.3 109.0 Feb. 2,214.8 11.8 0.5 2,197.7 2,250.0 107.7 -0.8 -0.7 107.3 108.4 Mar. 2,550.6 335.8 15.2 2,220.8 2,550.6 107.9 0.3 0.2 107.2 108.3
SBI dT d% min max BIO dT d% min max1 2 3 4 5 6
Source: The Ljubljana Stock Exchange and computations in BS.
Slovenian Stock Exchange Index (SBI) Bond Index (BIO)
9 107 8
FINANCIAL
MARKETS

51
�������������
Monthly Bulletin
2.12.1.a. Selected Bank of Slovenia Exchange Rates - Average rates
2.12.1.b. Selected Bank of Slovenia Exchange Rates - End of month rates
Column
Code
1992 105.0788 142.7462 57.9490 81.2870 0.6422 - - - - 0.42711993 132.2802 170.0252 76.6669 113.2419 1.0248 - - - - 0.04911994 152.3622 197.0006 94.2149 128.8086 1.2598 - - - - 21.21881995 153.1177 186.9737 100.2418 118.5185 1.2644 4.4366 0.9665 49.0672 3.9584 22.50091996 169.5098 211.4174 109.6247 135.3655 1.2453 4.9776 0.9097 50.3619 4.4139 24.88831997 180.3985 261.5308 110.0789 159.6893 1.3224 5.0803 0.8582 48.8393 4.7465 25.92231998 186.2659 275.2013 114.6526 166.1346 1.2743 5.1514 0.7841 47.8055 4.7157 26.06591999 193.6253 294.0493 120.9907 181.7704 1.6053 5.2556 0.7665 45.8644 4.3976 25.60992000 205.0316 336.5545 131.7159 222.6824 2.0673 5.7624 0.7888 51.2137 4.8181 26.90452001 217.1851 349.3743 143.8502 242.7488 1.9989 6.3822 0.8476 59.3171 5.0203 29.1298 2000 Sep. 208.2570 342.6127 135.9594 238.7818 2.2370 5.8790 0.7946 53.2528 4.8445 27.7513 Oct. 208.9808 354.1799 138.1430 243.9582 2.2514 5.9271 0.7953 52.6726 4.7878 27.8093 Nov. 209.8244 349.8069 137.8419 245.2146 2.2533 6.0647 0.7949 53.8688 4.8948 27.7702 Dec. 210.8993 343.8827 139.3605 235.5957 2.1040 6.0573 0.7964 54.4179 4.8524 27.8340 2001 Jan. 212.1631 334.2402 138.7142 225.9265 1.9317 6.0403 0.8008 54.9536 4.8588 27.8382 Feb. 213.4524 336.9310 138.9960 231.6497 1.9954 6.1646 0.8039 56.6546 4.8874 27.6994 Mar. 214.6175 340.5611 139.7180 235.6526 1.9455 6.2063 0.8058 58.0768 4.9139 27.9458 Apr. 215.5599 346.9789 141.1294 241.8551 1.9565 6.2416 0.8079 60.0338 4.9634 28.4024 May 216.2538 352.3103 140.9981 247.1487 2.0258 6.2930 0.8372 62.0490 5.0136 29.4953 Jun. 216.9950 356.6992 142.5240 254.4375 2.0880 6.3880 0.8757 64.0534 5.0730 29.6926 Jul. 217.7893 358.1409 143.8909 253.4753 2.0357 6.4360 0.8751 60.6471 5.1179 30.3157 Aug. 218.6749 349.3881 144.4226 243.4508 1.9988 6.4271 0.8729 57.3841 5.0768 29.3593 Sep. 219.3895 351.8858 147.0423 240.6709 2.0259 6.4228 0.8588 57.0552 5.0433 29.3631 Oct. 219.8574 352.3467 148.5301 242.7353 2.0026 6.5533 0.8624 58.6613 5.0475 29.6068 Nov. 220.3913 356.6170 150.2912 248.1792 2.0290 6.6205 0.8771 60.6144 5.1140 29.8314 Dec. 221.0769 356.3918 149.9460 247.8044 1.9517 6.7924 0.8934 61.6220 5.1339 30.0072 2002 Jan. 221.9922 360.2415 150.5535 251.4046 1.8971 6.9255 0.9117 61.9130 5.2238 29.6089 Feb. 222.9589 364.8031 150.8887 256.6023 1.9212 7.0142 0.9171 61.3277 5.2799 29.9054 Mar. 223.8126 363.6806 152.4773 255.6975 1.9489 7.1259 0.9155 61.7451 5.3391 30.3445
Tolars per 1 unit of currency, unless indicated otherwise
HRK
2 31 9 10
SKKPLNEUR GBP CHF HUFUSD JPY CZK
4 6 7 85
Column
Code
1992 31. Dec. 119.4741 149.2738 67.5004 98.7005 0.7925 - - - - 0.13001993 31. Dec. 147.8001 195.2084 89.8447 131.8420 1.1819 - - - - 0.02001994 31. Dec. 155.1327 197.6472 96.5088 126.4576 1.2687 - - - - 22.00001995 31. Dec. 161.4538 194.5444 109.4581 125.9902 1.2224 4.7260 0.9314 50.0004 4.2194 23.67701996 31. Dec. 175.4113 239.0169 104.6444 141.4792 1.2201 5.2536 0.8988 49.7196 4.4357 25.57861997 31. Dec. 186.7334 281.5091 116.3514 169.1792 1.3063 4.9700 0.8426 47.3093 4.8667 26.84961998 31. Dec. 188.9271 269.5999 117.7452 161.2011 1.3976 5.4048 0.7441 47.1241 4.3637 25.75021999 31. Dec. 197.3215 318.1579 122.9647 196.7705 1.9249 5.4681 0.7758 47.4582 4.6526 25.76172000 31. Dec. 211.5062 339.3329 138.9295 227.3771 1.9798 6.0387 0.7980 54.9224 4.8113 27.98182001 31. Dec. 221.4095 363.5027 149.5606 250.9458 1.9138 6.9234 0.9033 63.3051 5.1816 30.1816 2000 30. Sep. 208.6021 348.7746 136.6986 237.2366 2.1972 5.8692 0.7915 52.3022 4.7706 27.8177 31. Oct. 209.3755 360.4329 137.3494 246.4111 2.2687 6.0055 0.7953 52.9341 4.8254 27.7686 30. Nov. 210.3236 346.3257 138.9742 243.6839 2.2151 6.0822 0.7940 54.2505 4.9038 27.7776 31. Dec. 211.5062 339.3329 138.9295 227.3771 1.9798 6.0387 0.7980 54.9224 4.8113 27.9818 2001 31. Jan. 212.8398 338.2705 139.9893 231.9780 1.9862 6.1415 0.8030 56.1849 4.8828 27.6236 28. Feb. 214.0264 337.7942 139.2223 234.0365 2.0155 6.1863 0.8039 57.1957 4.8976 27.7488 31. Mar. 215.1747 348.1228 140.9872 244.1283 1.9519 6.2180 0.8073 59.7591 4.9329 28.1002 30. Apr. 215.8532 346.3626 140.8963 240.6122 1.9632 6.2412 0.8084 59.9959 4.9736 28.6783 31. May 216.6090 359.9352 142.0387 253.2254 2.1044 6.3460 0.8538 63.0778 5.0527 29.6355 30. Jun. 217.3637 359.8737 142.7114 256.2949 2.0638 6.4351 0.8896 64.4041 5.1532 29.6342 31. Jul. 218.2109 355.3923 144.4436 249.5550 1.9941 6.4460 0.8843 59.0477 5.0477 30.4241 31. Aug. 219.0722 350.3474 144.3734 241.0831 2.0139 6.4015 0.8686 56.8989 5.0536 29.0709 30. Sep. 219.6250 352.2454 148.6866 239.5822 2.0175 6.4786 0.8518 56.9183 5.0338 29.2350 31. Oct. 220.0956 352.9436 149.5621 242.7704 1.9940 6.5450 0.8596 59.1035 5.0365 29.8366 30. Nov. 220.7076 353.8115 150.6331 248.0418 2.0163 6.6358 0.8811 60.9639 5.0942 29.6818 31. Dec. 221.4095 363.5027 149.5606 250.9458 1.9138 6.9234 0.9033 63.3051 5.1816 30.1816 2002 31. Jan. 222.5694 363.9729 151.3254 257.0085 1.9410 6.9640 0.9154 62.3374 5.2514 29.4116 28. Feb. 223.3767 365.8914 151.2572 258.1494 1.9148 7.0399 0.9117 61.5295 5.3503 30.1930 31. Mar. 224.1923 366.0282 152.8549 257.2488 1.9421 7.2013 0.9217 62.4630 5.3587 30.3924
4 6 7 85
SKKPLNEUR GBP CHF HUFUSD JPY CZK
Tolars per 1 unit of currency, unless indicated otherwise
HRK
2 31 9 10
FINANCIAL
MARKETS

52
�������������
Monthly Bulletin
2.12.2. Selected Bank of Slovenia Exchange Rates: Daily rates
Column
Code
Dec. 29 221.4095 363.5027 149.5606 250.9458 1.9138 6.9234 0.9033 63.3051 5.1816 30.1816 Jan. 1 221.4470 363.5643 149.5859 250.9883 1.9141 6.9245 0.9035 63.3158 5.1825 30.1868 4 221.4992 354.1154 149.0172 245.0755 1.8588 6.9698 0.9046 62.0602 5.1778 30.0126 5 221.5596 355.9762 149.7834 247.4420 1.8914 6.9411 0.9123 62.9735 5.1765 29.9705 7 221.5596 355.9762 149.7834 247.4420 1.8914 6.9411 0.9123 62.9735 5.1765 29.9705 8 221.6175 357.9094 150.5963 249.4850 1.8961 6.9126 0.9113 63.6521 5.1729 29.9856 9 221.6771 358.8169 150.6266 249.1594 1.8789 6.8863 0.9118 63.3580 5.1757 29.8021 10 221.7378 358.2773 149.8633 248.5014 1.8783 6.8637 0.9091 62.4684 5.1772 29.6342 11 221.7778 359.0380 149.5669 248.5462 1.8766 6.9029 0.9106 62.1505 5.2109 29.6558 12 221.8170 358.7530 149.8764 248.7295 1.8836 6.8845 0.9077 61.6895 5.2138 29.6678 15 221.9156 360.3111 150.0444 248.5614 1.8875 6.8736 0.9102 61.8149 5.2215 29.6413 16 221.9337 360.0482 150.0566 248.9441 1.9004 6.8657 0.9112 61.6962 5.2194 29.4439 17 221.9932 361.7881 151.0055 251.8929 1.9169 6.9038 0.9117 61.2716 5.2263 29.5290 18 222.0535 361.5918 151.3967 252.0757 1.9092 6.8747 0.9117 60.7151 5.2416 29.4825 19 222.0935 361.7747 151.0737 252.0353 1.8973 6.9951 0.9142 60.4040 5.2579 29.4589 22 222.1672 360.8954 151.2473 251.4057 1.8950 6.8528 0.9116 60.6749 5.2410 29.4816 23 222.2251 359.0066 151.3073 251.4712 1.8729 6.8847 0.9139 60.8136 5.2573 29.3688 24 222.2476 358.5795 150.8809 250.9288 1.8727 6.9204 0.9138 61.2641 5.2491 29.4150 25 222.3113 361.2468 151.3867 253.8960 1.8885 6.9392 0.9133 61.4782 5.2612 29.3806 26 222.3763 362.9448 151.1941 256.8746 1.9123 6.9842 0.9151 61.5472 5.2580 29.4032 29 222.4382 363.6988 150.8772 258.7694 1.9337 6.9938 0.9128 62.6392 5.2487 29.3978 30 222.5021 364.2798 151.1974 258.2429 1.9365 6.9947 0.9168 62.8857 5.2689 29.3926 31 222.5694 363.9729 151.3254 257.0085 1.9410 6.9640 0.9154 62.3374 5.2514 29.4116 Feb. 1 222.5870 364.2995 150.8451 257.8626 1.9428 6.9689 0.9156 62.0434 5.2633 29.5126 2 222.6244 364.9580 150.6968 258.7452 1.9317 6.9788 0.9167 62.1370 5.2458 29.5242 5 222.6852 365.2373 150.3918 257.8569 1.9330 7.0027 0.9142 61.2344 5.2471 29.4682 6 222.7211 363.9828 150.9155 256.0601 1.9258 6.9873 0.9135 61.2006 5.2428 29.5363 7 222.7378 363.2384 151.3679 256.7287 1.9235 6.9933 0.9155 60.9856 5.2474 29.5185 8 222.7783 362.5949 151.3234 257.1904 1.9227 6.9946 0.9085 60.2918 5.2505 29.7569 12 222.8388 361.3993 151.0464 254.2081 1.8928 7.0230 0.9165 60.7223 5.2424 29.8555 13 222.8873 363.5415 150.9667 254.9031 1.9071 7.0334 0.9156 61.0784 5.2484 29.9314 14 222.9055 365.1794 150.8973 254.8365 1.9277 7.0319 0.9198 61.1521 5.2532 29.9572 15 222.9620 366.0516 150.3250 256.7208 1.9366 7.0402 0.9211 61.3291 5.2852 29.9882 16 223.0090 365.8884 150.5292 256.3322 1.9270 7.0494 0.9282 61.4214 5.2822 30.1673 19 223.0581 365.8489 150.6437 256.0649 1.9287 6.9979 0.9242 61.6932 5.2832 30.1605 20 223.1028 365.9223 150.8981 256.9421 1.9193 7.0074 0.9203 61.7005 5.2868 30.1698 21 223.1524 364.7473 150.7481 255.0022 1.9068 6.9943 0.9172 61.2972 5.3015 30.1794 22 223.1689 365.4313 150.8612 256.2509 1.9156 7.0080 0.9170 61.3810 5.3098 30.0872 23 223.2204 365.4558 150.8858 256.3395 1.9106 7.0417 0.9154 61.4357 5.3267 30.1076 26 223.2855 365.3231 151.1443 255.6802 1.9092 7.0404 0.9186 61.2093 5.3303 29.9383 27 223.3222 366.5827 151.2613 257.3726 1.9207 7.0293 0.9141 61.4096 5.3363 30.2171 28 223.3767 365.8914 151.2572 258.1494 1.9148 7.0399 0.9117 61.5295 5.3503 30.1930
Mar. 1 223.4149 365.7742 151.3959 258.1637 1.9247 7.0645 0.9103 61.3120 5.3579 30.15742 223.4299 365.9186 151.4471 257.5561 1.9298 7.0706 0.9123 60.9881 5.3529 30.24435 223.5214 366.5487 151.2528 258.7652 1.9566 7.1002 0.9151 61.8316 5.3667 30.26046 223.5581 365.9488 151.4929 257.7336 1.9525 7.0840 0.9177 61.9189 5.3308 30.26907 223.5958 365.1736 151.3954 256.9771 1.9477 7.0972 0.9158 61.7702 5.3207 30.39398 223.6546 363.0167 151.8464 255.3135 1.9835 7.0866 0.9155 61.4757 5.3135 30.37139 223.6882 362.6592 152.1688 254.5382 1.9852 7.0743 0.9096 61.3197 5.3080 30.317012 223.7273 363.4887 151.9783 255.9516 1.9864 7.0721 0.9150 61.7179 5.3155 30.318613 223.7609 362.6007 152.3842 256.3126 1.9888 7.0968 0.9142 61.7340 5.3175 30.385014 223.7926 361.3055 152.3850 255.9092 1.9806 7.0919 0.9136 61.6237 5.3286 30.427315 223.8239 360.0771 152.7495 253.9702 1.9738 7.0853 0.9119 61.3973 5.3355 30.473016 223.8550 360.9400 153.2519 253.3729 1.9605 7.0986 0.9129 61.5866 5.3171 30.512119 223.8817 362.3854 152.9769 254.6715 1.9395 7.1284 0.9140 61.9399 5.3242 30.429020 223.9125 361.9665 152.7787 253.4954 1.9313 7.1287 0.9139 61.8184 5.3274 30.357721 223.9442 362.1934 152.9360 254.7426 1.9334 7.1502 0.9163 61.9349 5.3320 30.375622 223.9739 362.6520 153.0817 253.3355 1.9229 7.1764 0.9188 61.7774 5.3503 30.341823 224.0126 363.2440 153.3703 254.5308 1.9181 7.2076 0.9183 61.9247 5.3630 30.309726 224.0467 364.7781 153.2991 255.7611 1.9203 7.2001 0.9194 62.0010 5.3670 30.208427 224.0784 365.4843 153.4153 256.4706 1.9241 7.2028 0.9202 62.1766 5.3633 30.298128 224.1193 364.7775 152.8781 256.1071 1.9344 7.2041 0.9206 62.3871 5.3681 30.344629 224.1581 365.9724 152.8316 257.2095 1.9418 7.2002 0.9216 62.4535 5.3579 30.387730 224.1923 366.0282 152.8549 257.2488 1.9421 7.2013 0.9217 62.4630 5.3587 30.3924
4 7 8
EUR GBP CHF USD JPY
2 31
PLN
6
SKK HRK
9
CZK
Tolars per 1 unit of currency, unless indicated otherwise105
HUF
FINANCIAL
MARKETS
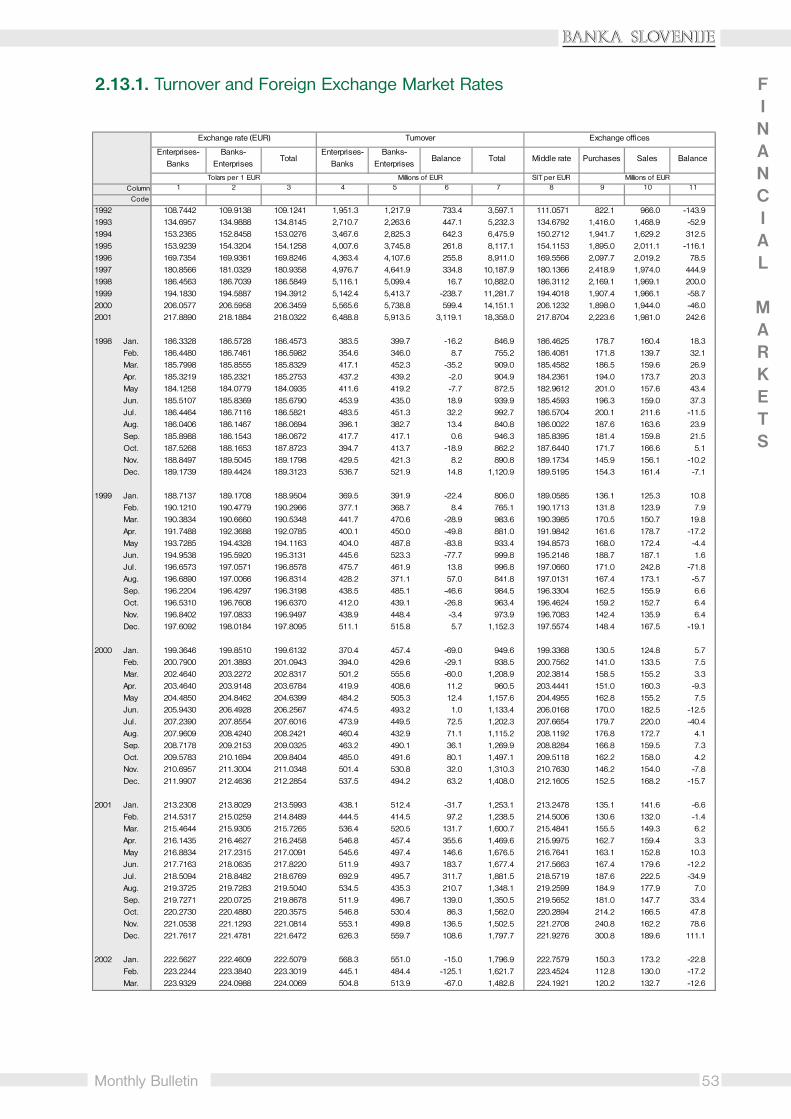
53
�������������
Monthly Bulletin
2.13.1. Turnover and Foreign Exchange Market Rates
Column
Code
1992 108.7442 109.9138 109.1241 1,951.3 1,217.9 733.4 3,597.1 111.0571 822.1 966.0 -143.91993 134.6957 134.9888 134.8145 2,710.7 2,263.6 447.1 5,232.3 134.6792 1,416.0 1,468.9 -52.91994 153.2365 152.8458 153.0276 3,467.6 2,825.3 642.3 6,475.9 150.2712 1,941.7 1,629.2 312.51995 153.9239 154.3204 154.1258 4,007.6 3,745.8 261.8 8,117.1 154.1153 1,895.0 2,011.1 -116.11996 169.7354 169.9361 169.8246 4,363.4 4,107.6 255.8 8,911.0 169.5566 2,097.7 2,019.2 78.51997 180.8566 181.0329 180.9358 4,976.7 4,641.9 334.8 10,187.9 180.1366 2,418.9 1,974.0 444.91998 186.4563 186.7039 186.5849 5,116.1 5,099.4 16.7 10,882.0 186.3112 2,169.1 1,969.1 200.01999 194.1830 194.5887 194.3912 5,142.4 5,413.7 -238.7 11,281.7 194.4018 1,907.4 1,966.1 -58.72000 206.0577 206.5958 206.3459 5,565.6 5,738.8 599.4 14,151.1 206.1232 1,898.0 1,944.0 -46.02001 217.8890 218.1884 218.0322 6,488.8 5,913.5 3,119.1 18,358.0 217.8704 2,223.6 1,981.0 242.6 1998 Jan. 186.3328 186.5728 186.4573 383.5 399.7 -16.2 846.9 186.4625 178.7 160.4 18.3 Feb. 186.4480 186.7461 186.5982 354.6 346.0 8.7 755.2 186.4081 171.8 139.7 32.1 Mar. 185.7998 185.8555 185.8329 417.1 452.3 -35.2 909.0 185.4582 186.5 159.6 26.9 Apr. 185.3219 185.2321 185.2753 437.2 439.2 -2.0 904.9 184.2361 194.0 173.7 20.3 May 184.1258 184.0779 184.0935 411.6 419.2 -7.7 872.5 182.9612 201.0 157.6 43.4 Jun. 185.5107 185.8369 185.6790 453.9 435.0 18.9 939.9 185.4593 196.3 159.0 37.3 Jul. 186.4464 186.7116 186.5821 483.5 451.3 32.2 992.7 186.5704 200.1 211.6 -11.5 Aug. 186.0406 186.1467 186.0694 396.1 382.7 13.4 840.8 186.0022 187.6 163.6 23.9 Sep. 185.8988 186.1543 186.0672 417.7 417.1 0.6 946.3 185.8395 181.4 159.8 21.5 Oct. 187.5268 188.1653 187.8723 394.7 413.7 -18.9 862.2 187.6440 171.7 166.6 5.1 Nov. 188.8497 189.5045 189.1798 429.5 421.3 8.2 890.8 189.1734 145.9 156.1 -10.2 Dec. 189.1739 189.4424 189.3123 536.7 521.9 14.8 1,120.9 189.5195 154.3 161.4 -7.1 1999 Jan. 188.7137 189.1708 188.9504 369.5 391.9 -22.4 806.0 189.0585 136.1 125.3 10.8 Feb. 190.1210 190.4779 190.2966 377.1 368.7 8.4 765.1 190.1713 131.8 123.9 7.9 Mar. 190.3834 190.6660 190.5348 441.7 470.6 -28.9 983.6 190.3985 170.5 150.7 19.8 Apr. 191.7488 192.3688 192.0785 400.1 450.0 -49.8 881.0 191.9842 161.6 178.7 -17.2 May 193.7285 194.4328 194.1163 404.0 487.8 -83.8 933.4 194.8573 168.0 172.4 -4.4 Jun. 194.9538 195.5920 195.3131 445.6 523.3 -77.7 999.8 195.2146 188.7 187.1 1.6 Jul. 196.6573 197.0571 196.8578 475.7 461.9 13.8 996.8 197.0660 171.0 242.8 -71.8 Aug. 196.6890 197.0066 196.8314 428.2 371.1 57.0 841.8 197.0131 167.4 173.1 -5.7 Sep. 196.2204 196.4297 196.3198 438.5 485.1 -46.6 984.5 196.3304 162.5 155.9 6.6 Oct. 196.5310 196.7608 196.6370 412.0 439.1 -26.8 963.4 196.4624 159.2 152.7 6.4 Nov. 196.8402 197.0833 196.9497 438.9 448.4 -3.4 973.9 196.7083 142.4 135.9 6.4 Dec. 197.6092 198.0184 197.8095 511.1 515.8 5.7 1,152.3 197.5574 148.4 167.5 -19.1 2000 Jan. 199.3646 199.8510 199.6132 370.4 457.4 -69.0 949.6 199.3368 130.5 124.8 5.7 Feb. 200.7900 201.3893 201.0943 394.0 429.6 -29.1 938.5 200.7562 141.0 133.5 7.5 Mar. 202.4640 203.2272 202.8317 501.2 555.6 -60.0 1,208.9 202.3814 158.5 155.2 3.3 Apr. 203.4640 203.9148 203.6784 419.9 408.6 11.2 960.5 203.4441 151.0 160.3 -9.3 May 204.4850 204.8462 204.6399 484.2 505.3 12.4 1,157.6 204.4955 162.8 155.2 7.5 Jun. 205.9430 206.4928 206.2567 474.5 493.2 1.0 1,133.4 206.0168 170.0 182.5 -12.5 Jul. 207.2390 207.8554 207.6016 473.9 449.5 72.5 1,202.3 207.6654 179.7 220.0 -40.4 Aug. 207.9609 208.4240 208.2421 460.4 432.9 71.1 1,115.2 208.1192 176.8 172.7 4.1 Sep. 208.7178 209.2153 209.0325 463.2 490.1 36.1 1,269.9 208.8284 166.8 159.5 7.3 Oct. 209.5783 210.1694 209.8404 485.0 491.6 80.1 1,497.1 209.5118 162.2 158.0 4.2 Nov. 210.6957 211.3004 211.0348 501.4 530.8 32.0 1,310.3 210.7630 146.2 154.0 -7.8 Dec. 211.9907 212.4636 212.2854 537.5 494.2 63.2 1,408.0 212.1605 152.5 168.2 -15.7 2001 Jan. 213.2308 213.8029 213.5993 438.1 512.4 -31.7 1,253.1 213.2478 135.1 141.6 -6.6 Feb. 214.5317 215.0259 214.8489 444.5 414.5 97.2 1,238.5 214.5006 130.6 132.0 -1.4 Mar. 215.4644 215.9305 215.7265 536.4 520.5 131.7 1,600.7 215.4841 155.5 149.3 6.2 Apr. 216.1435 216.4627 216.2458 546.8 457.4 355.6 1,469.6 215.9975 162.7 159.4 3.3 May 216.8834 217.2315 217.0091 545.6 497.4 146.6 1,676.5 216.7641 163.1 152.8 10.3 Jun. 217.7163 218.0635 217.8220 511.9 493.7 183.7 1,677.4 217.5663 167.4 179.6 -12.2 Jul. 218.5094 218.8482 218.6769 692.9 495.7 311.7 1,881.5 218.5719 187.6 222.5 -34.9 Aug. 219.3725 219.7283 219.5040 534.5 435.3 210.7 1,348.1 219.2599 184.9 177.9 7.0 Sep. 219.7271 220.0725 219.8678 511.9 496.7 139.0 1,350.5 219.5652 181.0 147.7 33.4 Oct. 220.2730 220.4880 220.3575 546.8 530.4 86.3 1,562.0 220.2894 214.2 166.5 47.8 Nov. 221.0538 221.1293 221.0814 553.1 499.8 136.5 1,502.5 221.2708 240.8 162.2 78.6 Dec. 221.7617 221.4781 221.6472 626.3 559.7 108.6 1,797.7 221.9276 300.8 189.6 111.1 2002 Jan. 222.5627 222.4609 222.5079 568.3 551.0 -15.0 1,796.9 222.7579 150.3 173.2 -22.8 Feb. 223.2244 223.3840 223.3019 445.1 484.4 -125.1 1,621.7 223.4524 112.8 130.0 -17.2 Mar. 223.9329 224.0988 224.0069 504.8 513.9 -67.0 1,482.8 224.1921 120.2 132.7 -12.6
1 2Tolars per 1 EUR
3
Enterprises-Banks
Banks-Enterprises
TotalEnterprises-
Banks
Turnover Exchange offices
Banks-Enterprises
Balance Total
Exchange rate (EUR)
5
Middle rate
11
Purchases Sales Balance
109Millions of EUR
8Millions of EUR SIT per EUR
6 74
FINANCIAL
MARKETS

54
�������������
Monthly Bulletin
2.13.2. Turnover and Foreign Exchange Market Rates - Daily rates
Column
Code
Dec. 27 221.9631 221.7292 221.9183 40.4 42.3 11.0 142.4 222.1566 24.4 13.0 11.5 28 222.0283 221.7949 221.9592 43.4 45.2 3.0 119.1 222.2386 22.7 12.8 9.9 31 222.0661 222.3688 222.0756 28.8 15.2 14.0 49.8 222.2504 13.6 6.1 7.5 Jan. 3 221.7830 221.1201 221.0914 11.2 26.1 -9.3 55.8 222.3616 11.5 12.7 -1.2 4 222.3535 222.5364 222.3236 21.2 24.1 -12.8 83.0 222.4846 9.7 13.2 -3.6 7 222.2332 222.1711 222.0111 21.8 23.9 -2.7 53.4 222.5552 10.0 11.1 -1.1 8 222.2002 221.6452 221.8254 16.6 31.3 -15.1 63.4 222.5751 8.4 10.6 -2.2 9 222.1689 221.9785 222.0470 18.3 28.7 -12.3 88.5 222.6025 8.0 9.2 -1.2 10 222.3490 222.3540 222.3961 39.0 22.6 16.3 91.8 222.6368 7.3 8.3 -1.0 11 222.4274 222.5310 222.4909 33.1 17.0 13.3 101.9 222.6659 7.3 9.9 -2.6 14 222.3608 221.7703 222.0191 26.9 41.5 -23.0 116.3 222.6991 5.8 6.1 -0.3 15 222.6820 222.1180 222.4972 34.8 21.4 12.2 96.5 222.7237 5.0 6.0 -1.0 16 222.6318 222.6753 222.6093 21.1 29.2 -2.7 96.9 222.7679 5.8 6.5 -0.8 17 222.4340 222.5606 222.4877 28.9 22.2 6.5 84.2 222.7353 5.7 6.3 -0.6 18 222.5970 222.8444 222.7066 32.0 18.5 17.0 73.5 222.8350 5.8 7.7 -1.9 21 222.5313 222.6561 222.5828 33.1 21.1 8.1 73.3 222.8599 6.5 6.5 0.0 22 222.6642 222.8482 222.7493 18.0 20.5 -6.3 63.0 222.9335 4.7 5.3 -0.5 23 222.5540 222.7891 222.7225 19.3 21.7 -14.8 70.0 222.9285 4.8 6.0 -1.2 24 222.8130 223.0498 222.9052 22.9 21.7 -6.2 80.0 222.9583 4.5 5.6 -1.1 25 222.7553 222.8871 222.8748 34.1 20.4 10.3 95.7 223.0359 5.4 6.3 -0.9 28 222.7633 222.8161 222.8005 20.6 23.9 -1.7 75.7 223.0033 5.9 5.8 0.0 29 222.8225 222.8268 222.8448 63.5 74.3 -2.3 173.9 223.1052 5.3 4.8 0.5 30 222.7150 222.9446 222.8255 22.9 21.4 -3.4 71.5 223.1129 5.2 5.3 -0.2 31 222.9668 223.2053 223.0256 29.0 19.3 13.7 88.7 223.1140 5.2 6.9 -1.6 Feb. 1 222.9950 223.3696 223.1410 20.4 20.7 -6.1 82.6 223.2136 5.1 7.0 -1.9 4 222.8893 223.0105 222.9689 16.9 28.9 -10.6 62.1 223.2125 6.0 6.0 0.0 5 222.7745 222.7216 222.8801 16.1 26.5 -17.8 76.3 223.2385 5.3 5.6 -0.3 6 223.0748 223.4415 223.2980 14.9 24.5 -9.2 84.7 223.2617 4.8 6.0 -1.1 7 223.0019 223.3831 223.1128 24.4 20.3 1.5 83.1 223.2687 5.2 8.9 -3.7 11 222.6830 222.6924 222.8189 21.4 35.2 -24.6 94.0 223.3201 6.9 6.2 0.7 12 223.1795 223.3758 223.1890 32.8 22.7 3.8 84.6 223.4482 4.6 5.4 -0.8 13 223.1800 223.4165 223.3000 18.1 23.6 -7.2 95.1 223.4531 4.9 5.5 -0.6 14 223.2374 223.3821 223.2773 26.6 23.4 2.6 96.9 223.4615 5.1 5.7 -0.6 15 223.1641 223.5030 223.2812 40.2 15.6 32.7 87.9 223.5156 5.5 8.0 -2.5 18 223.2132 223.1017 223.1869 24.9 33.0 -6.4 83.1 223.5355 5.9 6.4 -0.5 19 223.3950 223.4870 223.4302 16.4 33.3 -18.4 83.4 223.6035 4.7 5.9 -1.1 20 223.1415 223.3066 223.2723 22.5 26.9 -11.9 90.6 223.5817 5.6 6.4 -0.9 21 223.4322 223.7363 223.4663 30.4 19.5 5.4 67.2 223.4919 4.8 7.4 -2.6 22 223.4901 223.8015 223.5108 21.8 20.7 -32.7 140.3 223.7134 5.3 6.8 -1.5 25 223.3930 223.6272 223.4831 20.9 24.3 -0.4 61.5 223.7183 6.3 5.8 0.4 26 223.5443 223.8296 223.6840 24.0 29.6 -19.3 94.9 223.7859 5.0 5.1 -0.1 27 223.5817 223.7252 223.6981 24.5 23.9 -1.2 64.0 223.7669 5.6 5.3 0.2 28 223.5280 223.8376 223.6364 27.9 31.9 -5.4 89.4 223.7822 6.2 7.2 -1.0 Mar. 1 223.5294 223.9281 223.6657 21.7 18.7 3.1 61.8 223.8717 5.4 7.2 -1.8 4 223.6713 223.9326 223.7913 16.4 26.3 -15.5 73.3 223.9044 5.5 5.7 -0.2 5 223.6265 223.7522 223.7172 17.8 20.4 -21.9 62.6 223.9012 4.9 6.0 -1.1 6 223.6631 223.5628 223.6753 15.3 28.0 -14.7 79.8 223.9042 5.5 5.7 -0.2 7 223.3096 223.3193 223.4244 22.0 21.1 1.1 58.8 223.9555 4.1 4.9 -0.8 8 223.7160 223.9402 223.7503 24.7 17.2 6.5 48.4 224.0480 4.4 5.7 -1.3 11 224.0772 224.1017 224.0617 22.9 30.1 -7.3 70.9 224.0613 5.4 5.6 -0.2 12 223.8600 223.9852 223.8982 18.0 20.5 -17.9 67.0 224.1379 4.3 4.4 -0.2 13 223.8496 223.9085 223.8171 26.0 34.0 -7.2 81.5 224.1235 5.3 6.0 -0.7 14 223.7839 223.8582 223.8095 20.1 19.0 3.1 46.7 224.1374 4.9 5.8 -0.9 15 223.9434 224.2108 223.9558 51.2 17.0 33.6 87.5 224.2073 5.2 6.9 -1.7 18 224.0379 224.3550 224.1944 26.2 32.6 -4.2 73.4 224.2246 6.0 5.9 0.0 19 223.9709 224.1150 224.0514 25.3 27.9 -31.0 90.8 224.2915 4.5 5.3 -0.9 20 224.0688 224.3722 224.3655 20.6 22.9 -5.5 65.7 224.2915 4.5 5.2 -0.7 21 223.7978 224.1621 223.9102 24.4 17.3 15.2 61.1 224.2718 4.5 5.4 -0.9 22 224.1790 224.4944 224.2977 19.7 14.5 6.5 67.0 224.3902 5.3 6.0 -0.7 25 224.1779 224.3203 224.2588 25.7 26.1 1.5 60.5 224.3983 5.9 5.9 0.0 26 224.1437 224.3486 224.1659 20.5 37.1 -6.8 81.2 224.4549 4.9 5.0 -0.1 27 224.1312 224.2319 224.1934 19.5 34.3 -24.3 86.9 224.4571 5.3 5.1 0.3 28 224.2434 224.3987 224.3580 29.8 26.5 2.5 77.3 224.4590 5.6 5.6 0.0 29 224.2739 224.5773 224.4337 36.8 23.0 15.7 80.9 224.5582 7.5 8.6 -1.1
8Millions of EUR SIT per EUR
6 74
Middle rate
11
Purchases Sales Balance
109Millions of EUR
Enterprises-Banks
Turnover Exchange offices
Banks-Enterprises
Balance Total
Exchange rate (EUR)
51 2Tolars per 1 EUR
3
Enterprises-Banks
Banks-Enterprises
Total
FINANCIAL
MARKETS
55
�������������
Monthly Bulletin
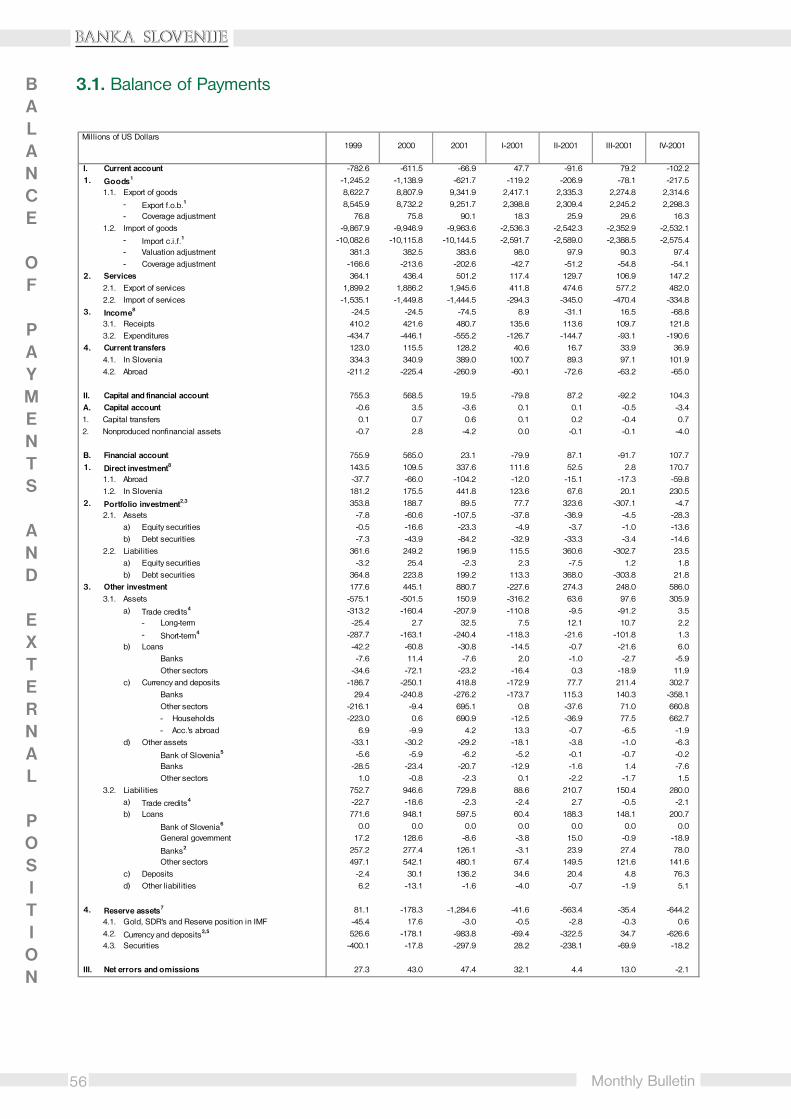
56
�������������
Monthly Bulletin
3.1. Balance of PaymentsBALANCE
OF
PAYMENTS
AND
EXTERNAL
POSITION
I. Current account -782.6 -611.5 -66.9 47.7 -91.6 79.2 -102.2 1. Goods1 -1,245.2 -1,138.9 -621.7 -119.2 -206.9 -78.1 -217.5
1.1. Export of goods 8,622.7 8,807.9 9,341.9 2,417.1 2,335.3 2,274.8 2,314.6- Export f.o.b.1 8,545.9 8,732.2 9,251.7 2,398.8 2,309.4 2,245.2 2,298.3- Coverage adjustment 76.8 75.8 90.1 18.3 25.9 29.6 16.3
1.2. Import of goods -9,867.9 -9,946.9 -9,963.6 -2,536.3 -2,542.3 -2,352.9 -2,532.1- Import c.i.f.1 -10,082.6 -10,115.8 -10,144.5 -2,591.7 -2,589.0 -2,388.5 -2,575.4- Valuation adjustment 381.3 382.5 383.6 98.0 97.9 90.3 97.4- Coverage adjustment -166.6 -213.6 -202.6 -42.7 -51.2 -54.8 -54.1
2. Services 364.1 436.4 501.2 117.4 129.7 106.9 147.22.1. Export of services 1,899.2 1,886.2 1,945.6 411.8 474.6 577.2 482.02.2. Import of services -1,535.1 -1,449.8 -1,444.5 -294.3 -345.0 -470.4 -334.8
3. Income8 -24.5 -24.5 -74.5 8.9 -31.1 16.5 -68.83.1. Receipts 410.2 421.6 480.7 135.6 113.6 109.7 121.83.2. Expenditures -434.7 -446.1 -555.2 -126.7 -144.7 -93.1 -190.6
4. Current transfers 123.0 115.5 128.2 40.6 16.7 33.9 36.94.1. In Slovenia 334.3 340.9 389.0 100.7 89.3 97.1 101.94.2. Abroad -211.2 -225.4 -260.9 -60.1 -72.6 -63.2 -65.0
II. Capital and financial account 755.3 568.5 19.5 -79.8 87.2 -92.2 104.3 A. Capital account -0.6 3.5 -3.6 0.1 0.1 -0.5 -3.4 1. Capital transfers 0.1 0.7 0.6 0.1 0.2 -0.4 0.7 2. Nonproduced nonfinancial assets -0.7 2.8 -4.2 0.0 -0.1 -0.1 -4.0
B. Financial account 755.9 565.0 23.1 -79.9 87.1 -91.7 107.7 1. Direct investment8 143.5 109.5 337.6 111.6 52.5 2.8 170.7
1.1. Abroad -37.7 -66.0 -104.2 -12.0 -15.1 -17.3 -59.81.2. In Slovenia 181.2 175.5 441.8 123.6 67.6 20.1 230.5
2. Portfolio investment2,3 353.8 188.7 89.5 77.7 323.6 -307.1 -4.72.1. Assets -7.8 -60.6 -107.5 -37.8 -36.9 -4.5 -28.3
a) Equity securities -0.5 -16.6 -23.3 -4.9 -3.7 -1.0 -13.6b) Debt securities -7.3 -43.9 -84.2 -32.9 -33.3 -3.4 -14.6
2.2. Liabilities 361.6 249.2 196.9 115.5 360.6 -302.7 23.5a) Equity securities -3.2 25.4 -2.3 2.3 -7.5 1.2 1.8b) Debt securities 364.8 223.8 199.2 113.3 368.0 -303.8 21.8
3. Other investment 177.6 445.1 880.7 -227.6 274.3 248.0 586.03.1. Assets -575.1 -501.5 150.9 -316.2 63.6 97.6 305.9
a) Trade credits4 -313.2 -160.4 -207.9 -110.8 -9.5 -91.2 3.5- Long-term -25.4 2.7 32.5 7.5 12.1 10.7 2.2- Short-term4 -287.7 -163.1 -240.4 -118.3 -21.6 -101.8 1.3
b) Loans -42.2 -60.8 -30.8 -14.5 -0.7 -21.6 6.0Banks -7.6 11.4 -7.6 2.0 -1.0 -2.7 -5.9Other sectors -34.6 -72.1 -23.2 -16.4 0.3 -18.9 11.9
c) Currency and deposits -186.7 -250.1 418.8 -172.9 77.7 211.4 302.7Banks 29.4 -240.8 -276.2 -173.7 115.3 140.3 -358.1Other sectors -216.1 -9.4 695.1 0.8 -37.6 71.0 660.8- Households -223.0 0.6 690.9 -12.5 -36.9 77.5 662.7- Acc.'s abroad 6.9 -9.9 4.2 13.3 -0.7 -6.5 -1.9
d) Other assets -33.1 -30.2 -29.2 -18.1 -3.8 -1.0 -6.3
Bank of Slovenia5 -5.6 -5.9 -6.2 -5.2 -0.1 -0.7 -0.2Banks -28.5 -23.4 -20.7 -12.9 -1.6 1.4 -7.6Other sectors 1.0 -0.8 -2.3 0.1 -2.2 -1.7 1.5
3.2. Liabilities 752.7 946.6 729.8 88.6 210.7 150.4 280.0a) Trade credits4 -22.7 -18.6 -2.3 -2.4 2.7 -0.5 -2.1b) Loans 771.6 948.1 597.5 60.4 188.3 148.1 200.7
Bank of Slovenia6 0.0 0.0 0.0 0.0 0.0 0.0 0.0General government 17.2 128.6 -8.6 -3.8 15.0 -0.9 -18.9
Banks2 257.2 277.4 126.1 -3.1 23.9 27.4 78.0Other sectors 497.1 542.1 480.1 67.4 149.5 121.6 141.6
c) Deposits -2.4 30.1 136.2 34.6 20.4 4.8 76.3d) Other liabilities 6.2 -13.1 -1.6 -4.0 -0.7 -1.9 5.1
4. Reserve assets7 81.1 -178.3 -1,284.6 -41.6 -563.4 -35.4 -644.24.1. Gold, SDR's and Reserve position in IMF -45.4 17.6 -3.0 -0.5 -2.8 -0.3 0.64.2. Currency and deposits2,5 526.6 -178.1 -983.8 -69.4 -322.5 34.7 -626.64.3. Securities -400.1 -17.8 -297.9 28.2 -238.1 -69.9 -18.2
III. Net errors and omissions 27.3 43.0 47.4 32.1 4.4 13.0 -2.1
Millions of US Dollars1999 III-2001 IV-20012000 2001 I-2001 II-2001
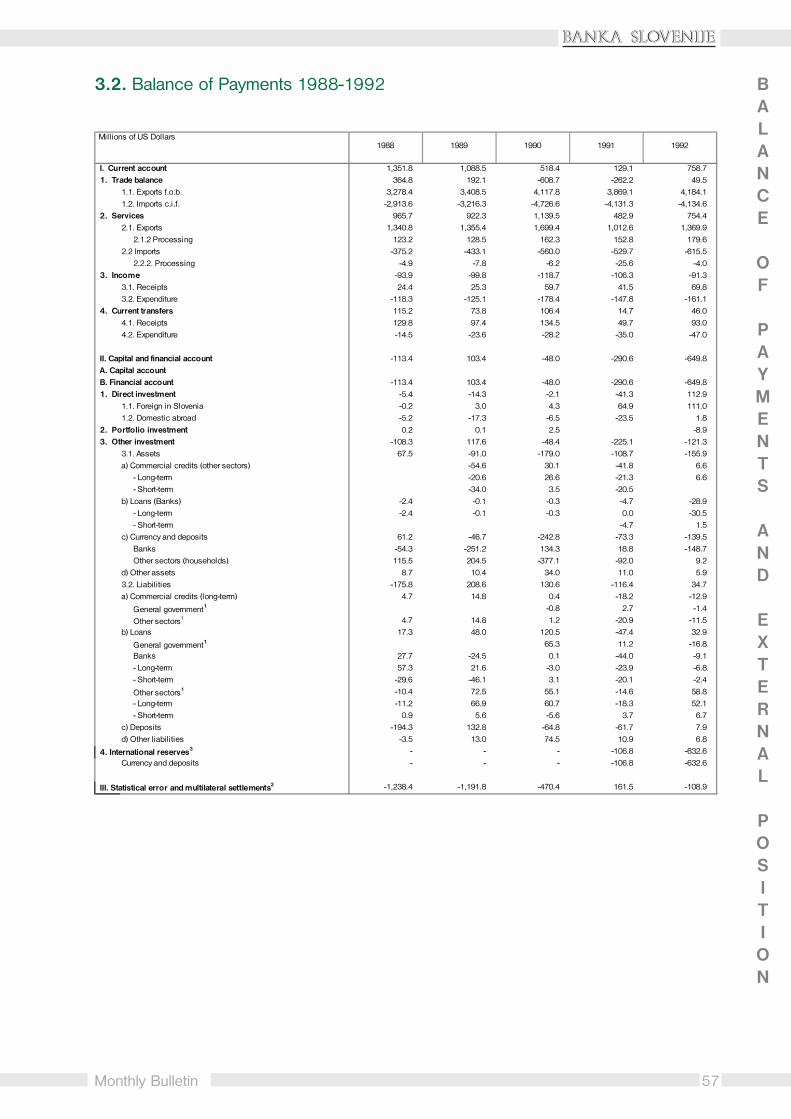
57
�������������
Monthly Bulletin
3.2. Balance of Payments 1988-1992 BALANCE
OF
PAYMENTS
AND
EXTERNAL
POSITION
I. Current account 1,351.8 1,088.5 518.4 129.1 758.7 1. Trade balance 364.8 192.1 -608.7 -262.2 49.5
1.1. Exports f.o.b. 3,278.4 3,408.5 4,117.8 3,869.1 4,184.11.2. Imports c.i.f. -2,913.6 -3,216.3 -4,726.6 -4,131.3 -4,134.6
2. Services 965.7 922.3 1,139.5 482.9 754.42.1. Exports 1,340.8 1,355.4 1,699.4 1,012.6 1,369.9
2.1.2 Processing 123.2 128.5 162.3 152.8 179.62.2 Imports -375.2 -433.1 -560.0 -529.7 -615.5
2.2.2. Processing -4.9 -7.8 -6.2 -25.6 -4.0 3. Income -93.9 -99.8 -118.7 -106.3 -91.3
3.1. Receipts 24.4 25.3 59.7 41.5 69.83.2. Expenditure -118.3 -125.1 -178.4 -147.8 -161.1
4. Current transfers 115.2 73.8 106.4 14.7 46.04.1. Receipts 129.8 97.4 134.5 49.7 93.04.2. Expenditure -14.5 -23.6 -28.2 -35.0 -47.0
II. Capital and financial account -113.4 103.4 -48.0 -290.6 -649.8 A. Capital account B. Financial account -113.4 103.4 -48.0 -290.6 -649.8 1. Direct investment -5.4 -14.3 -2.1 -41.3 112.9
1.1. Foreign in Slovenia -0.2 3.0 4.3 64.9 111.01.2. Domestic abroad -5.2 -17.3 -6.5 -23.5 1.8
2. Portfolio investment 0.2 0.1 2.5 -8.9 3. Other investment -108.3 117.6 -48.4 -225.1 -121.3
3.1. Assets 67.5 -91.0 -179.0 -108.7 -155.9a) Commercial credits (other sectors) -54.6 30.1 -41.8 6.6
- Long-term -20.6 26.6 -21.3 6.6- Short-term -34.0 3.5 -20.5
b) Loans (Banks) -2.4 -0.1 -0.3 -4.7 -28.9- Long-term -2.4 -0.1 -0.3 0.0 -30.5- Short-term -4.7 1.5
c) Currency and deposits 61.2 -46.7 -242.8 -73.3 -139.5Banks -54.3 -251.2 134.3 18.8 -148.7Other sectors (households) 115.5 204.5 -377.1 -92.0 9.2
d) Other assets 8.7 10.4 34.0 11.0 5.93.2. Liabilities -175.8 208.6 130.6 -116.4 34.7a) Commercial credits (long-term) 4.7 14.8 0.4 -18.2 -12.9
General government1 -0.8 2.7 -1.4
Other sectors1 4.7 14.8 1.2 -20.9 -11.5b) Loans 17.3 48.0 120.5 -47.4 32.9
General government1 65.3 11.2 -16.8Banks 27.7 -24.5 0.1 -44.0 -9.1- Long-term 57.3 21.6 -3.0 -23.9 -6.8- Short-term -29.6 -46.1 3.1 -20.1 -2.4
Other sectors1 -10.4 72.5 55.1 -14.6 58.8- Long-term -11.2 66.9 60.7 -18.3 52.1- Short-term 0.9 5.6 -5.6 3.7 6.7
c) Deposits -194.3 132.8 -64.8 -61.7 7.9d) Other liabilities -3.5 13.0 74.5 10.9 6.8
4. International reserves3 - - - -106.8 -632.6Currency and deposits - - - -106.8 -632.6
III. Statistical error and multilateral settlements2 -1,238.4 -1,191.8 -470.4 161.5 -108.9
1991 1992 Millions of US Dollars
1988 1989 1990

58
�������������
Monthly Bulletin
3.3. Balance of Payments - Current AccountBALANCE
OF
PAYMENTS
AND
EXTERNAL
POSITION
Column
Code
1992 926.2 8,065.0 -7,138.9 791.1 6,682.9 -5,891.8 180.3 1,219.3 -1,039.01993 191.9 7,745.2 -7,553.3 -154.2 6,082.9 -6,237.1 375.3 1,392.7 -1,017.31994 573.0 9,212.5 -8,639.5 -336.4 6,831.7 -7,168.1 643.0 1,809.1 -1,166.11995 -99.4 11,036.0 -11,135.3 -953.0 8,350.2 -9,303.3 578.2 2,027.5 -1,449.41996 31.4 11,151.2 -11,119.9 -824.9 8,352.6 -9,177.5 633.4 2,135.1 -1,501.61997 11.4 11,111.1 -11,099.7 -776.3 8,407.5 -9,183.8 630.3 2,047.5 -1,417.21998 -147.2 11,835.4 -11,982.5 -789.3 9,090.9 -9,880.2 492.5 2,027.5 -1,535.01999 -782.6 11,266.4 -12,048.9 -1,245.2 8,622.7 -9,867.9 364.1 1,899.2 -1,535.12000 -611.5 11,456.7 -12,068.1 -1,138.9 8,807.9 -9,946.9 436.4 1,886.2 -1,449.82001 -66.9 12,157.2 -12,224.1 -621.7 9,341.9 -9,963.6 501.2 1,945.6 -1,444.5 2000 Dec. -137.0 935.0 -1,072.0 -107.6 694.3 -801.9 35.5 152.7 -117.3 2001 Jan. 51.4 987.5 -936.1 -33.6 765.0 -798.6 51.2 150.3 -99.2 Feb. 5.0 963.2 -958.2 -48.4 766.6 -815.0 25.2 118.7 -93.5 Mar. -8.6 1,114.5 -1,123.2 -37.2 885.5 -922.7 41.0 142.7 -101.6 Apr. -25.8 956.8 -982.5 -81.9 743.8 -825.7 36.4 140.1 -103.7 May -51.5 1,040.6 -1,092.2 -92.5 802.4 -894.8 54.9 173.8 -119.0 Jun. -14.4 1,015.5 -1,029.9 -32.6 789.2 -821.7 38.4 160.7 -122.3 Jul. 13.4 1,082.5 -1,069.1 -26.8 812.0 -838.8 10.5 190.0 -179.5 Aug. 20.6 939.0 -918.3 -40.7 651.3 -692.0 42.2 221.0 -178.7 Sep. 45.2 1,037.3 -992.2 -10.7 811.5 -822.2 54.1 166.2 -112.1 Oct. 50.6 1,109.9 -1,059.3 -22.5 873.0 -895.5 56.2 165.6 -109.4 Nov. 16.2 1,029.6 -1,013.3 -71.8 791.6 -863.4 64.6 168.6 -104.0 Dec. -169.0 880.8 -1,049.8 -123.2 650.1 -773.2 26.5 147.8 -121.4 2002 Jan. 55.4 958.2 -902.8 -21.5 733.6 -755.1 49.4 151.9 -102.5 Feb. 29.1 934.9 -905.7 -29.7 745.4 -775.1 30.8 126.0 -95.2
Millions of US Dollars
1=2+3 2
Current account
Balance Receipts Expenditure
63 4=5+6
Goods1
97=8+9 85
Services
Exports ImportsBalance Exports Imports Balance
Column
Code
1992 -6.3 5.2 -11.4 -132.8 136.2 -269.0 -91.3 -1.5 - -1.5 -89.81993 -1.4 108.7 -110.1 -85.8 57.7 -143.5 -51.4 -7.7 8.0 -15.7 -43.61994 32.6 152.5 -119.9 -98.9 50.9 -149.8 169.8 201.3 217.3 -16.1 -31.41995 -37.8 124.8 -162.6 -107.8 68.5 -176.3 179.4 190.5 215.8 -25.3 -11.21996 -84.7 108.2 -192.9 -86.3 90.5 -176.8 132.2 209.7 233.7 -24.0 -77.51997 -75.9 108.3 -184.2 -110.7 101.2 -212.0 39.4 179.2 205.6 -26.3 -139.81998 -103.4 111.2 -214.6 -111.9 121.0 -232.9 27.9 178.7 205.9 -27.2 -150.81999 -113.4 118.1 -231.4 -115.6 125.9 -241.6 -24.5 174.5 199.4 -24.9 -199.02000 -90.6 123.0 -213.6 -130.1 131.6 -261.7 -24.5 159.5 186.4 -26.8 -184.02001 -90.3 142.8 -233.1 -122.7 155.9 -278.6 -74.5 156.4 182.8 -26.3 -230.9 2000 Dec. -11.8 12.8 -24.6 -10.1 15.6 -25.6 -82.1 12.5 15.1 -2.6 -94.6 2001 Jan. -5.6 11.6 -17.3 -10.1 15.0 -25.1 19.2 13.9 15.9 -2.0 5.3 Feb. -7.4 10.7 -18.0 -10.1 10.9 -21.0 25.3 13.5 15.5 -2.0 11.8 Mar. -7.4 10.8 -18.2 -6.9 15.0 -21.9 -35.6 13.2 15.5 -2.2 -48.8 Apr. -8.0 10.7 -18.6 -12.1 10.5 -22.6 6.7 13.0 15.2 -2.3 -6.3 May -7.4 12.3 -19.7 -10.6 14.3 -24.9 -20.7 12.9 14.9 -2.0 -33.6 Jun. -8.8 11.5 -20.4 -7.8 12.0 -19.9 -17.2 12.2 14.4 -2.2 -29.4 Jul. -6.0 12.0 -18.0 -10.1 14.1 -24.2 5.5 12.7 15.0 -2.3 -7.2 Aug. -5.8 12.1 -17.9 -13.0 12.1 -25.1 11.9 13.1 15.2 -2.1 -1.2 Sep. -7.8 10.8 -18.5 -7.2 13.9 -21.1 -0.8 13.3 15.4 -2.1 -14.1 Oct. -8.1 13.9 -22.1 -8.5 11.3 -19.8 9.7 13.1 15.5 -2.3 -3.4 Nov. -8.5 11.7 -20.1 -12.1 11.3 -23.4 13.5 12.8 15.1 -2.3 0.7 Dec. -9.7 14.7 -24.4 -14.3 15.3 -29.6 -92.0 12.7 15.3 -2.5 -104.7 2002 Jan. -8.2 16.3 -24.5 -10.8 11.8 -22.6 20.0 12.9 15.0 -2.1 7.1 Feb. -6.0 11.8 -17.8 -8.9 13.5 -22.4 20.7 12.9 14.6 -1.7 7.8
11=12+168=9+10 9 10764=5+6
Services
Receipts
2 31=2+3 5
Balance Exports Imports Expenditures Balance
Income
Business etc. services
Millions of US Dollars
BalanceExports ImportsBalanceBalance
Labor incomeOthers services

59
�������������
Monthly Bulletin
BALANCE
OF
PAYMENTS
AND
EXTERNAL
POSITION
-163.8 275.6 -439.4 389.0 671.0 -281.9 … … … 94.0 131.3 -37.356.7 446.2 -389.5 428.9 734.1 -305.2 … … … -22.9 46.1 -69.067.6 486.7 -419.0 523.3 913.0 -389.7 121.8 125.1 -3.3 -3.5 81.0 -84.569.3 505.3 -436.0 510.6 1,084.0 -573.3 112.0 135.5 -23.5 31.8 109.5 -77.673.3 480.7 -407.5 638.1 1,239.8 -601.6 48.8 92.6 -43.8 44.3 123.3 -79.097.2 464.5 -367.3 669.5 1,186.9 -517.5 27.2 79.9 -52.7 22.9 106.6 -83.7
131.2 540.0 -408.9 530.2 1,088.4 -558.2 38.2 73.4 -35.2 8.1 93.4 -85.3142.3 520.6 -378.3 414.6 953.6 -539.0 -6.0 58.2 -64.2 42.2 122.8 -80.7138.8 492.4 -353.7 440.1 960.8 -520.7 14.0 65.9 -51.9 64.3 112.4 -48.0180.5 498.6 -318.1 477.2 994.9 -517.7 23.5 69.0 -45.5 33.2 84.6 -51.4
11.2 45.0 -33.8 36.6 62.4 -25.8 5.5 8.2 -2.7 4.0 8.8 -4.8
11.0 36.5 -25.5 50.9 73.6 -22.7 -0.8 3.2 -4.0 5.8 10.4 -4.610.2 34.9 -24.7 35.9 59.0 -23.1 2.4 4.4 -2.0 -5.9 -1.2 -4.713.3 39.5 -26.1 39.8 67.3 -27.5 3.4 7.5 -4.2 -1.2 2.6 -3.816.5 39.0 -22.4 43.9 77.8 -33.9 2.3 4.5 -2.2 -6.3 -2.3 -4.010.7 42.8 -32.1 48.4 82.1 -33.7 2.1 6.3 -4.2 11.6 16.1 -4.414.2 40.3 -26.1 38.4 84.7 -46.2 -1.6 3.7 -5.3 4.0 8.4 -4.416.4 44.1 -27.7 9.4 108.1 -98.8 1.0 6.8 -5.8 -0.2 4.9 -5.018.2 44.3 -26.0 30.1 130.3 -100.2 5.5 11.6 -6.1 7.2 10.6 -3.417.7 41.4 -23.7 51.1 94.6 -43.5 2.7 4.4 -1.7 -2.4 1.1 -3.513.7 42.6 -28.9 52.9 84.9 -32.0 3.6 5.7 -2.1 2.7 7.1 -4.523.3 48.6 -25.4 43.4 69.9 -26.5 3.7 7.7 -4.0 14.8 19.4 -4.615.2 44.6 -29.4 33.0 62.5 -29.5 -0.9 3.2 -4.1 3.0 7.5 -4.5
18.4 39.5 -21.1 42.5 68.7 -26.2 1.1 4.6 -3.5 6.3 10.9 -4.613.0 35.1 -22.1 30.7 54.9 -24.3 -1.0 3.7 -4.7 3.0 6.9 -3.9
14 1512 13=14+1510=11+12 11
Import Balance Export ImportExport Import Balance ExportBalance Export Import Balance
Services
Transport Travel Construction services Merchanting
16=17+18 17 18 19=20+21 20 21
69.8 7.6 62.2 … -159.6 -1.4 -158.2 … 46.0 13.3 79.7 -43.9 -3.0106.7 2.8 103.9 … -150.3 -3.4 -146.9 … 22.2 62.0 93.1 -120.8 -12.1117.2 7.9 109.2 0.0 -148.6 -6.4 -142.2 0.0 96.6 11.3 226.0 -120.1 -20.5194.7 3.4 177.4 13.8 -205.9 -22.8 -175.3 -7.7 96.2 18.7 229.0 -101.2 -50.3179.0 4.9 154.3 19.8 -256.4 -33.9 -195.3 -27.2 90.6 16.4 234.5 -96.7 -63.6191.1 15.7 144.6 30.9 -330.9 -90.7 -209.5 -30.7 118.1 29.5 230.1 -95.7 -45.7211.3 -8.2 136.7 82.8 -362.1 -105.7 -205.8 -50.5 121.8 21.6 278.2 -105.9 -72.1210.8 -2.1 89.7 123.2 -409.8 -154.4 -177.5 -77.9 123.0 24.0 310.3 -108.6 -102.6235.2 19.6 97.2 118.4 -419.3 -128.8 -197.0 -93.5 115.5 41.1 299.9 -101.7 -123.7297.9 21.5 125.5 150.9 -528.8 -133.8 -259.1 -135.9 128.2 55.0 334.0 -122.1 -138.8
33.9 12.7 11.2 9.9 -128.5 -92.6 -32.8 -3.0 17.2 4.5 34.5 -9.8 -12.0
25.5 0.1 11.2 14.1 -20.2 -0.3 -18.0 -1.9 14.6 4.8 26.0 -8.4 -7.836.4 4.1 10.2 22.1 -24.6 -0.5 -11.3 -12.8 2.9 0.5 25.4 -12.7 -10.326.9 0.1 10.7 16.0 -75.7 -1.0 -29.7 -45.0 23.1 9.2 34.8 -7.9 -13.022.7 0.8 11.2 10.8 -29.0 -3.1 -15.9 -9.9 13.0 5.4 29.5 -8.3 -13.624.0 0.3 12.4 11.3 -57.5 -10.0 -22.3 -25.2 6.7 1.9 23.6 -8.5 -10.322.3 2.1 10.1 10.2 -51.7 -8.4 -29.1 -14.3 -3.0 1.6 27.2 -18.2 -13.721.2 0.3 10.9 10.0 -28.4 -4.7 -21.2 -2.5 24.1 16.2 28.1 -8.5 -11.724.7 0.1 10.8 13.9 -25.9 -1.2 -10.9 -13.8 7.2 0.9 25.8 -6.7 -12.918.2 0.5 8.7 9.1 -32.3 -4.7 -25.8 -1.8 2.6 2.0 24.0 -13.0 -10.523.0 0.1 10.6 12.3 -26.4 -0.9 -22.2 -3.4 7.2 5.3 27.6 -10.8 -14.924.1 0.4 9.1 14.6 -23.4 -1.5 -19.0 -2.8 10.0 1.7 28.6 -10.1 -10.228.9 12.6 9.7 6.7 -133.6 -97.4 -33.7 -2.6 19.7 5.3 33.4 -9.0 -10.0
27.0 2.5 9.8 14.7 -19.9 -0.3 -16.9 -2.7 7.6 1.9 28.9 -11.4 -11.820.6 0.0 8.9 11.7 -12.8 -0.4 -10.0 -2.4 7.3 1.9 26.4 -9.7 -11.3
Other sectors
General govern.
Other sectors
BalanceDirect investment
income8
On debtFrom
securities
ExpendituresReceiptsDirect
investment
income8
On debtFrom
securities
Investment income
Total
2422 2320
Income
12=13+.+15 13 15 1914 16=17+.+19 17 21
Current transfers
Abroad
Total
In Slovenia
General govern.
18
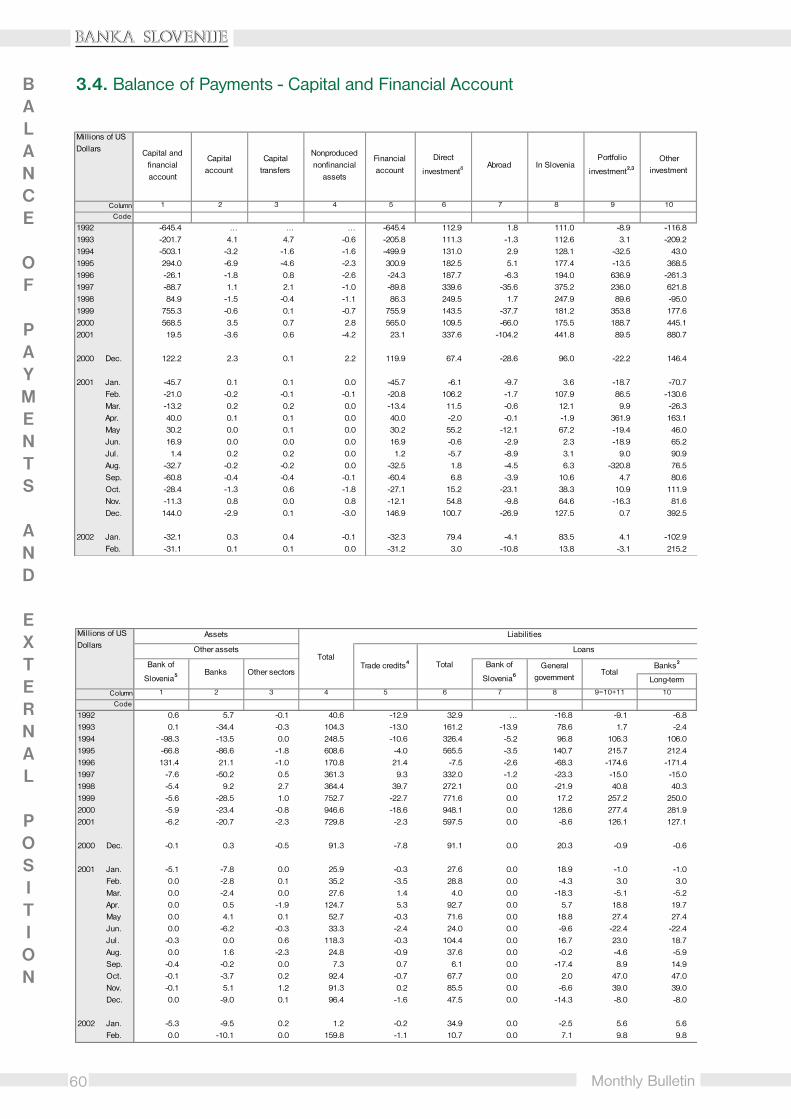
60
�������������
Monthly Bulletin
3.4. Balance of Payments - Capital and Financial AccountBALANCE
OF
PAYMENTS
AND
EXTERNAL
POSITION
Column
Code
1992 -645.4 … … … -645.4 112.9 1.8 111.0 -8.9 -116.81993 -201.7 4.1 4.7 -0.6 -205.8 111.3 -1.3 112.6 3.1 -209.21994 -503.1 -3.2 -1.6 -1.6 -499.9 131.0 2.9 128.1 -32.5 43.01995 294.0 -6.9 -4.6 -2.3 300.9 182.5 5.1 177.4 -13.5 368.51996 -26.1 -1.8 0.8 -2.6 -24.3 187.7 -6.3 194.0 636.9 -261.31997 -88.7 1.1 2.1 -1.0 -89.8 339.6 -35.6 375.2 236.0 621.81998 84.9 -1.5 -0.4 -1.1 86.3 249.5 1.7 247.9 89.6 -95.01999 755.3 -0.6 0.1 -0.7 755.9 143.5 -37.7 181.2 353.8 177.62000 568.5 3.5 0.7 2.8 565.0 109.5 -66.0 175.5 188.7 445.12001 19.5 -3.6 0.6 -4.2 23.1 337.6 -104.2 441.8 89.5 880.7 2000 Dec. 122.2 2.3 0.1 2.2 119.9 67.4 -28.6 96.0 -22.2 146.4 2001 Jan. -45.7 0.1 0.1 0.0 -45.7 -6.1 -9.7 3.6 -18.7 -70.7 Feb. -21.0 -0.2 -0.1 -0.1 -20.8 106.2 -1.7 107.9 86.5 -130.6 Mar. -13.2 0.2 0.2 0.0 -13.4 11.5 -0.6 12.1 9.9 -26.3 Apr. 40.0 0.1 0.1 0.0 40.0 -2.0 -0.1 -1.9 361.9 163.1 May 30.2 0.0 0.1 0.0 30.2 55.2 -12.1 67.2 -19.4 46.0 Jun. 16.9 0.0 0.0 0.0 16.9 -0.6 -2.9 2.3 -18.9 65.2 Jul. 1.4 0.2 0.2 0.0 1.2 -5.7 -8.9 3.1 9.0 90.9 Aug. -32.7 -0.2 -0.2 0.0 -32.5 1.8 -4.5 6.3 -320.8 76.5 Sep. -60.8 -0.4 -0.4 -0.1 -60.4 6.8 -3.9 10.6 4.7 80.6 Oct. -28.4 -1.3 0.6 -1.8 -27.1 15.2 -23.1 38.3 10.9 111.9 Nov. -11.3 0.8 0.0 0.8 -12.1 54.8 -9.8 64.6 -16.3 81.6 Dec. 144.0 -2.9 0.1 -3.0 146.9 100.7 -26.9 127.5 0.7 392.5 2002 Jan. -32.1 0.3 0.4 -0.1 -32.3 79.4 -4.1 83.5 4.1 -102.9 Feb. -31.1 0.1 0.1 0.0 -31.2 3.0 -10.8 13.8 -3.1 215.2
Capital transfers
Nonproduced nonfinancial
assets
Other investment
Portfolio
investment2,3Abroad In SloveniaFinancial account
2
Capital account
Capital and financial account
1 6
Direct
investment8
3 4
Millions of US Dollars
9 107 85
Column
Code
1992 0.6 5.7 -0.1 40.6 -12.9 32.9 … -16.8 -9.1 -6.81993 0.1 -34.4 -0.3 104.3 -13.0 161.2 -13.9 78.6 1.7 -2.41994 -98.3 -13.5 0.0 248.5 -10.6 326.4 -5.2 96.8 106.3 106.01995 -66.8 -86.6 -1.8 608.6 -4.0 565.5 -3.5 140.7 215.7 212.41996 131.4 21.1 -1.0 170.8 21.4 -7.5 -2.6 -68.3 -174.6 -171.41997 -7.6 -50.2 0.5 361.3 9.3 332.0 -1.2 -23.3 -15.0 -15.01998 -5.4 9.2 2.7 364.4 39.7 272.1 0.0 -21.9 40.8 40.31999 -5.6 -28.5 1.0 752.7 -22.7 771.6 0.0 17.2 257.2 250.02000 -5.9 -23.4 -0.8 946.6 -18.6 948.1 0.0 128.6 277.4 281.92001 -6.2 -20.7 -2.3 729.8 -2.3 597.5 0.0 -8.6 126.1 127.1 2000 Dec. -0.1 0.3 -0.5 91.3 -7.8 91.1 0.0 20.3 -0.9 -0.6 2001 Jan. -5.1 -7.8 0.0 25.9 -0.3 27.6 0.0 18.9 -1.0 -1.0 Feb. 0.0 -2.8 0.1 35.2 -3.5 28.8 0.0 -4.3 3.0 3.0 Mar. 0.0 -2.4 0.0 27.6 1.4 4.0 0.0 -18.3 -5.1 -5.2 Apr. 0.0 0.5 -1.9 124.7 5.3 92.7 0.0 5.7 18.8 19.7 May 0.0 4.1 0.1 52.7 -0.3 71.6 0.0 18.8 27.4 27.4 Jun. 0.0 -6.2 -0.3 33.3 -2.4 24.0 0.0 -9.6 -22.4 -22.4 Jul. -0.3 0.0 0.6 118.3 -0.3 104.4 0.0 16.7 23.0 18.7 Aug. 0.0 1.6 -2.3 24.8 -0.9 37.6 0.0 -0.2 -4.6 -5.9 Sep. -0.4 -0.2 0.0 7.3 0.7 6.1 0.0 -17.4 8.9 14.9 Oct. -0.1 -3.7 0.2 92.4 -0.7 67.7 0.0 2.0 47.0 47.0 Nov. -0.1 5.1 1.2 91.3 0.2 85.5 0.0 -6.6 39.0 39.0 Dec. 0.0 -9.0 0.1 96.4 -1.6 47.5 0.0 -14.3 -8.0 -8.0 2002 Jan. -5.3 -9.5 0.2 1.2 -0.2 34.9 0.0 -2.5 5.6 5.6 Feb. 0.0 -10.1 0.0 159.8 -1.1 10.7 0.0 7.1 9.8 9.8
Total
Assets
3
Other assets
Bank of
Slovenia5 Banks Other sectors
1 2 4 5 10
Millions of US Dollars
8 9=10+116 7
Liabilities
Total
Loans
General government
TotalLong-term
Trade credits4 Bank of
Slovenia6
Banks2

61
�������������
Monthly Bulletin
BALANCE
OF
PAYMENTS
AND
EXTERNAL
POSITION
-157.5 6.6 6.6 … -30.8 -36.7 6.0 … -139.5 -148.7 9.2 …-313.5 93.3 5.3 88.0 11.5 21.7 -10.2 … -383.7 -450.8 86.7 -19.6-205.6 -8.7 -0.5 -8.2 -10.7 -10.3 -1.0 0.6 -74.6 -328.4 232.0 21.8-240.2 -5.4 13.4 -18.7 -17.0 -8.8 -5.4 -2.7 -62.5 -201.4 142.0 -3.1-432.0 -316.8 9.1 -325.9 -5.0 -3.6 0.1 -1.4 -261.7 -339.3 36.7 40.9260.6 -351.6 9.0 -360.6 -64.5 -37.0 -32.2 4.7 733.9 598.6 151.4 -16.0-459.4 -468.5 -19.3 -449.3 -55.2 -38.3 6.5 -23.3 57.8 -29.6 89.0 -1.6-575.1 -313.2 -25.4 -287.7 -42.2 6.8 -14.4 -34.6 -186.7 29.4 -223.0 6.9-501.5 -160.4 2.7 -163.1 -60.8 -5.1 16.5 -72.1 -250.1 -240.8 0.6 -9.9150.9 -207.9 32.5 -240.4 -30.8 -5.3 -2.2 -23.2 418.8 -276.2 690.9 4.2
55.2 -30.8 2.4 -33.2 -4.9 1.4 2.1 -8.5 91.2 112.9 -9.7 -12.0
-96.5 -50.3 2.9 -53.3 -5.3 -1.0 2.4 -6.7 -27.9 -47.5 0.6 18.9-165.8 -9.4 2.1 -11.4 -7.1 2.5 -1.0 -8.6 -146.6 -128.8 -9.1 -8.7
-53.9 -51.1 2.5 -53.6 -2.0 -1.7 0.8 -1.1 1.6 2.5 -4.0 3.138.4 8.2 1.5 6.6 4.5 1.2 1.2 2.0 27.3 39.0 -12.5 0.7-6.6 13.5 0.8 12.7 -6.1 0.9 0.5 -7.5 -18.2 -10.7 -6.2 -1.431.9 -31.2 9.7 -40.9 0.9 0.6 -5.4 5.7 68.6 86.9 -18.3 0.0-27.4 -46.8 -0.3 -46.5 0.6 -0.9 -0.7 2.1 18.5 16.5 6.1 -4.151.8 -2.5 3.0 -5.6 -7.6 2.0 -2.8 -6.8 62.6 28.8 33.3 0.573.2 -41.8 7.9 -49.7 -14.6 0.8 -1.2 -14.2 130.2 95.0 38.1 -2.919.5 -65.8 1.7 -67.5 20.0 -3.6 -2.2 25.8 68.9 -23.4 90.9 1.4-9.6 37.9 0.8 37.2 -3.6 -0.3 0.0 -3.4 -50.1 -229.0 181.0 -2.1
296.1 31.4 -0.2 31.7 -10.4 -5.9 6.0 -10.5 284.0 -105.6 390.8 -1.2
-104.1 -43.4 1.9 -45.3 -43.7 -9.1 -2.1 -32.5 -2.4 33.8 -41.7 5.455.4 -53.1 3.7 -56.9 1.3 -11.1 -7.1 19.5 117.4 150.5 -35.9 2.9
11 12=13+14 13 14 15=16+..+18 16
Households Acc.'s abroad
TotalBanks
Currency and deposits
Other sectors
Long-term Short-term
Total
Loans
BanksOther sectors
Total
Trade credits4
Long-term Short-term4
Total
Assets
17 18 19=20+..+22 20 21 22
-2.4 58.8 52.1 6.7 13.8 7.4 -632.6 - -627.0 -5.6 -280.84.1 94.7 27.3 67.5 -40.3 -3.7 -111.1 -17.8 -48.0 -45.3 9.70.2 128.5 134.8 -6.3 -0.1 -67.2 -641.4 0.0 -604.7 -36.6 -69.93.3 212.6 262.0 -49.5 39.3 7.9 -236.6 0.0 -121.1 -115.5 -194.6-3.2 238.0 233.0 4.9 161.4 -4.5 -587.5 -0.1 -392.6 -194.8 -5.30.0 371.6 302.8 68.8 19.4 0.5 -1,287.2 0.1 -508.0 -779.2 77.20.4 253.2 273.0 -19.8 47.1 5.5 -157.8 -46.0 721.2 -833.1 62.37.2 497.1 482.9 14.2 -2.4 6.2 81.1 -45.4 526.6 -400.1 27.3-4.5 542.1 558.1 -16.0 30.1 -13.1 -178.3 17.6 -178.1 -17.8 43.0-1.1 480.1 438.8 41.2 136.2 -1.6 -1,284.6 -3.0 -983.8 -297.9 47.4
-0.2 71.7 44.1 27.6 7.1 0.8 -71.7 0.0 -29.0 -42.7 14.8
0.0 9.7 9.5 0.3 0.8 -2.2 49.7 0.0 92.2 -42.4 -5.70.0 30.1 28.5 1.6 11.3 -1.4 -82.8 3.4 -160.6 74.4 16.00.1 27.5 26.0 1.5 22.6 -0.5 -8.5 -3.9 -0.9 -3.7 21.9-0.9 68.1 45.2 22.9 27.1 -0.4 -483.0 0.0 -377.7 -105.3 -14.30.0 25.4 22.7 2.7 -21.0 2.4 -51.6 -2.8 124.4 -173.2 21.30.0 55.9 27.3 28.6 14.3 -2.7 -28.8 0.0 -69.2 40.4 -2.64.4 64.6 55.2 9.4 15.6 -1.4 -93.0 4.0 -0.3 -96.7 -14.71.3 42.3 33.1 9.2 -11.4 -0.5 210.0 0.2 175.2 34.6 12.1-6.0 14.6 13.1 1.5 0.5 0.0 -152.4 -4.4 -140.2 -7.8 15.70.0 18.7 13.2 5.5 22.6 2.7 -164.9 2.5 -110.0 -57.5 -22.20.0 53.1 51.1 2.1 5.4 0.1 -132.3 -0.9 -168.5 37.1 -4.90.0 69.8 113.9 -44.1 48.3 2.3 -347.0 -1.0 -348.2 2.2 25.0
0.0 31.7 30.5 1.2 -33.7 0.3 -12.9 -3.1 91.5 -101.3 -23.40.0 -6.3 -5.3 -0.9 150.7 -0.5 -246.2 -24.0 -107.5 -114.7 2.0
Short-term20 21
Long-term Short-term18 19
Other sectorsTotal
1715 1613
Net errors and omissions
SecuritiesCurrency and
deposits2,5Deposits
Gold, SDR's and Reserve
position in IMF
Reserve
assets7
Liabilities
Other liabilities
Loans
Banks2
1411 12=13+14

62
�������������
Monthly Bulletin
3.5. Merchandise Trade; The Effective Exchange Rate
3.6. Merchandise Trade by sections of SITC and by end use
Code
1992 6,681 6,141 540 144.5 86.4 92.9 80.01993 6,083 6,501 -418 113.8 87.0 89.4 89.41994 6,828 7,304 -476 99.9 90.2 91.4 90.81995 8,316 9,492 -1,176 100.0 100.0 100.0 100.01996 8,310 9,421 -1,112 89.9 96.7 95.6 98.51997 8,369 9,366 -998 84.7 97.0 95.1 99.01998 9,051 10,111 -1,060 82.5 100.7 98.6 102.01999 8,546 10,083 -1,537 77.9 100.0 95.2 102.42000 8,732 10,116 -1,384 71.5 97.5 90.8 95.62001 9,252 10,145 -893 67.2 97.1 91.8 94.9 2000 Mar. 813 981 -168 73.4 98.5 91.8 96.2 Apr. 677 820 -143 72.8 98.3 91.6 95.4 May 741 886 -145 71.7 97.2 90.0 94.7 Jun. 823 872 -48 71.9 97.5 90.1 93.5 Jul. 769 887 -117 71.3 97.3 90.2 93.8 Aug. 553 694 -141 70.6 96.6 90.2 93.2 Sep. 774 835 -61 69.8 96.6 89.0 92.8 Oct. 769 871 -102 69.3 96.4 89.7 93.6 Nov. 762 875 -113 68.9 96.7 89.6 95.8 Dec. 688 808 -120 69.1 97.0 90.6 97.8 2001 Jan. 757 816 -58 69.3 97.3 92.1 99.0 Feb. 761 834 -72 68.6 96.9 92.3 96.3 Mar. 880 942 -62 68.2 97.4 91.4 94.8 Apr. 736 841 -104 67.7 96.9 91.3 93.2 May 793 913 -121 67.3 96.9 90.8 93.4 Jun. 781 835 -55 66.7 96.4 90.2 92.9 Jul. 802 853 -51 66.5 96.3 90.7 92.2 Aug. 638 698 -60 66.8 96.8 91.4 93.4 Sep. 805 837 -33 66.9 97.6 91.7 94.0 Oct. 866 918 -52 66.7 97.9 92.8 94.4 Nov. 786 872 -86 66.2 97.8 92.9 96.5 Dec. 646 785 -139 66.1 97.7 94.0 99.0 2002 Jan. 729 772 -43 65.7 98.1 93.4 98.6 Feb. 741 793 -52 65.3 98.3 93.3 94.7Source: Statistical Office of RS and computations in BS
1 2 3=1-2 4Column
Millions of USD Dollars 1995=100
Real effective exchange rate; deflator
Consumer PricesIndustrial producers
pricesUnit labour costs
Export Imports BalanceNominal effective
exchange rate
6 75
Total 8,732 9,252 1,519 1,470 10,116 10,145 1,649 1,565
Food and live animals 205 222 30 29 514 540 80 87 Beverages and tobacco 110 109 15 16 58 52 6 7 Crude materials except fuels 169 168 31 26 547 508 88 75 Mineral fuels and lubricants 57 88 16 15 917 819 151 118 Animal and vegetable oils and fats 6 6 1 1 30 31 4 6 Chemical products 976 1,069 167 161 1,255 1,290 217 211 Manufactured goods classified by mat. 2,383 2,477 415 396 2,214 2,324 387 354 Machinery and transport equipment 3,140 3,342 547 561 3,457 3,411 541 531 Miscellaneoous articles 1,685 1,770 296 264 1,112 1,156 174 174 Other commodities and transactions 1 1 0 1 13 13 2 2
Intermediate goods 4,273 4,508 761 705 6,033 5,995 1,030 948 Capital goods 1,120 1,266 200 186 1,823 1,795 254 245
Consumption goods 3,339 3,478 558 579 2,259 2,355 366 372
Source: Statistical Office of RS.
Millions of US Dollars
January - February
2001 2002
Exports Imports
2000 20012000 2001January - February
2001 2002
BALANCE
OF
PAYMENTS
AND
EXTERNAL
POSITION
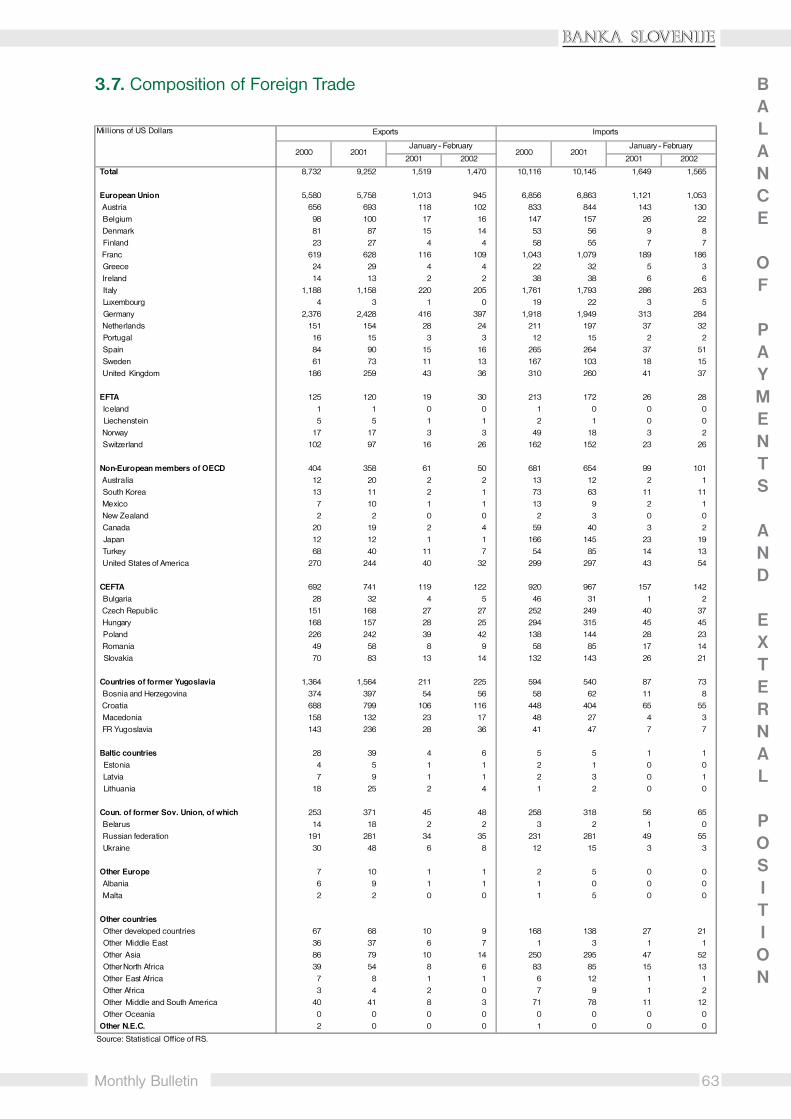
63
�������������
Monthly Bulletin
3.7. Composition of Foreign Trade
Total 8,732 9,252 1,519 1,470 10,116 10,145 1,649 1,565
European Union 5,580 5,758 1,013 945 6,856 6,863 1,121 1,053 Austria 656 693 118 102 833 844 143 130 Belgium 98 100 17 16 147 157 26 22 Denmark 81 87 15 14 53 56 9 8 Finland 23 27 4 4 58 55 7 7 Franc 619 628 116 109 1,043 1,079 189 186 Greece 24 29 4 4 22 32 5 3 Ireland 14 13 2 2 38 38 6 6 Italy 1,188 1,158 220 205 1,761 1,793 286 263 Luxembourg 4 3 1 0 19 22 3 5 Germany 2,376 2,428 416 397 1,918 1,949 313 284 Netherlands 151 154 28 24 211 197 37 32 Portugal 16 15 3 3 12 15 2 2 Spain 84 90 15 16 265 264 37 51 Sweden 61 73 11 13 167 103 18 15 United Kingdom 186 259 43 36 310 260 41 37
EFTA 125 120 19 30 213 172 26 28 Iceland 1 1 0 0 1 0 0 0 Liechenstein 5 5 1 1 2 1 0 0 Norway 17 17 3 3 49 18 3 2 Switzerland 102 97 16 26 162 152 23 26
Non-European members of OECD 404 358 61 50 681 654 99 101 Australia 12 20 2 2 13 12 2 1 South Korea 13 11 2 1 73 63 11 11 Mexico 7 10 1 1 13 9 2 1 New Zealand 2 2 0 0 2 3 0 0 Canada 20 19 2 4 59 40 3 2 Japan 12 12 1 1 166 145 23 19 Turkey 68 40 11 7 54 85 14 13 United States of America 270 244 40 32 299 297 43 54
CEFTA 692 741 119 122 920 967 157 142 Bulgaria 28 32 4 5 46 31 1 2 Czech Republic 151 168 27 27 252 249 40 37 Hungary 168 157 28 25 294 315 45 45 Poland 226 242 39 42 138 144 28 23 Romania 49 58 8 9 58 85 17 14 Slovakia 70 83 13 14 132 143 26 21
Countries of former Yugoslavia 1,364 1,564 211 225 594 540 87 73 Bosnia and Herzegovina 374 397 54 56 58 62 11 8 Croatia 688 799 106 116 448 404 65 55 Macedonia 158 132 23 17 48 27 4 3 FR Yugoslavia 143 236 28 36 41 47 7 7
Baltic countries 28 39 4 6 5 5 1 1 Estonia 4 5 1 1 2 1 0 0 Latvia 7 9 1 1 2 3 0 1 Lithuania 18 25 2 4 1 2 0 0
Coun. of former Sov. Union, of which 253 371 45 48 258 318 56 65 Belarus 14 18 2 2 3 2 1 0 Russian federation 191 281 34 35 231 281 49 55 Ukraine 30 48 6 8 12 15 3 3
Other Europe 7 10 1 1 2 5 0 0 Albania 6 9 1 1 1 0 0 0 Malta 2 2 0 0 1 5 0 0
Other countries Other developed countries 67 68 10 9 168 138 27 21 Other Middle East 36 37 6 7 1 3 1 1 Other Asia 86 79 10 14 250 295 47 52 Other North Africa 39 54 8 6 83 85 15 13 Other East Africa 7 8 1 1 6 12 1 1 Other Africa 3 4 2 0 7 9 1 2 Other Middle and South America 40 41 8 3 71 78 11 12 Other Oceania 0 0 0 0 0 0 0 0 Other N.E.C. 2 0 0 0 1 0 0 0
January - February
2001 2002
Source: Statistical Office of RS.
Millions of US Dollars Exports Imports
2000 20012000 2001January - February
2001 2002
BALANCE
OF
PAYMENTS
AND
EXTERNAL
POSITION
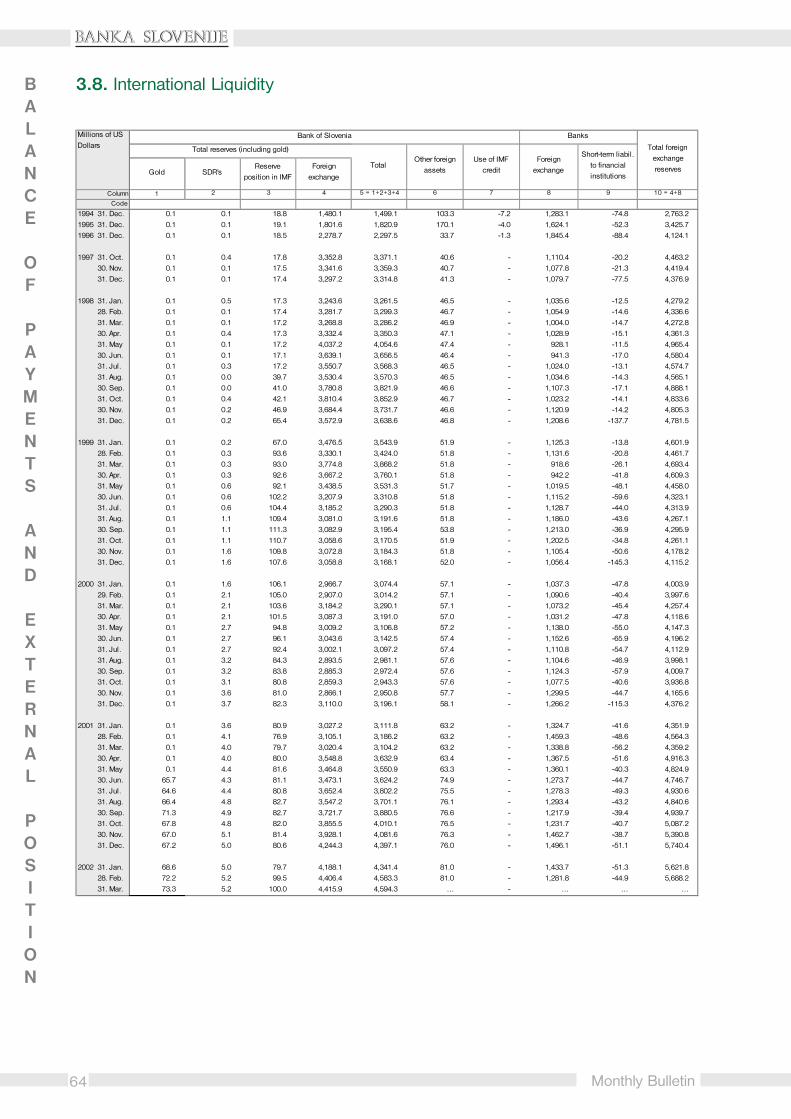
64
�������������
Monthly Bulletin
3.8. International LiquidityBALANCE
OF
PAYMENTS
AND
EXTERNAL
POSITION
ColumnCode
1994 31. Dec. 0.1 0.1 18.8 1,480.1 1,499.1 103.3 -7.2 1,283.1 -74.8 2,763.21995 31. Dec. 0.1 0.1 19.1 1,801.6 1,820.9 170.1 -4.0 1,624.1 -52.3 3,425.71996 31. Dec. 0.1 0.1 18.5 2,278.7 2,297.5 33.7 -1.3 1,845.4 -88.4 4,124.1 1997 31. Oct. 0.1 0.4 17.8 3,352.8 3,371.1 40.6 - 1,110.4 -20.2 4,463.2 30. Nov. 0.1 0.1 17.5 3,341.6 3,359.3 40.7 - 1,077.8 -21.3 4,419.4 31. Dec. 0.1 0.1 17.4 3,297.2 3,314.8 41.3 - 1,079.7 -77.5 4,376.9 1998 31. Jan. 0.1 0.5 17.3 3,243.6 3,261.5 46.5 - 1,035.6 -12.5 4,279.2 28. Feb. 0.1 0.1 17.4 3,281.7 3,299.3 46.7 - 1,054.9 -14.6 4,336.6 31. Mar. 0.1 0.1 17.2 3,268.8 3,286.2 46.9 - 1,004.0 -14.7 4,272.8 30. Apr. 0.1 0.4 17.3 3,332.4 3,350.3 47.1 - 1,028.9 -15.1 4,361.3 31. May 0.1 0.1 17.2 4,037.2 4,054.6 47.4 - 928.1 -11.5 4,965.4 30. Jun. 0.1 0.1 17.1 3,639.1 3,656.5 46.4 - 941.3 -17.0 4,580.4 31. Jul. 0.1 0.3 17.2 3,550.7 3,568.3 46.5 - 1,024.0 -13.1 4,574.7 31. Aug. 0.1 0.0 39.7 3,530.4 3,570.3 46.5 - 1,034.6 -14.3 4,565.1 30. Sep. 0.1 0.0 41.0 3,780.8 3,821.9 46.6 - 1,107.3 -17.1 4,888.1 31. Oct. 0.1 0.4 42.1 3,810.4 3,852.9 46.7 - 1,023.2 -14.1 4,833.6 30. Nov. 0.1 0.2 46.9 3,684.4 3,731.7 46.6 - 1,120.9 -14.2 4,805.3 31. Dec. 0.1 0.2 65.4 3,572.9 3,638.6 46.8 - 1,208.6 -137.7 4,781.5 1999 31. Jan. 0.1 0.2 67.0 3,476.5 3,543.9 51.9 - 1,125.3 -13.8 4,601.9 28. Feb. 0.1 0.3 93.6 3,330.1 3,424.0 51.8 - 1,131.6 -20.8 4,461.7 31. Mar. 0.1 0.3 93.0 3,774.8 3,868.2 51.8 - 918.6 -26.1 4,693.4 30. Apr. 0.1 0.3 92.6 3,667.2 3,760.1 51.8 - 942.2 -41.8 4,609.3 31. May 0.1 0.6 92.1 3,438.5 3,531.3 51.7 - 1,019.5 -48.1 4,458.0 30. Jun. 0.1 0.6 102.2 3,207.9 3,310.8 51.8 - 1,115.2 -59.6 4,323.1 31. Jul. 0.1 0.6 104.4 3,185.2 3,290.3 51.8 - 1,128.7 -44.0 4,313.9 31. Aug. 0.1 1.1 109.4 3,081.0 3,191.6 51.8 - 1,186.0 -43.6 4,267.1 30. Sep. 0.1 1.1 111.3 3,082.9 3,195.4 53.8 - 1,213.0 -36.9 4,295.9 31. Oct. 0.1 1.1 110.7 3,058.6 3,170.5 51.9 - 1,202.5 -34.8 4,261.1 30. Nov. 0.1 1.6 109.8 3,072.8 3,184.3 51.8 - 1,105.4 -50.6 4,178.2 31. Dec. 0.1 1.6 107.6 3,058.8 3,168.1 52.0 - 1,056.4 -145.3 4,115.2 2000 31. Jan. 0.1 1.6 106.1 2,966.7 3,074.4 57.1 - 1,037.3 -47.8 4,003.9 29. Feb. 0.1 2.1 105.0 2,907.0 3,014.2 57.1 - 1,090.6 -40.4 3,997.6 31. Mar. 0.1 2.1 103.6 3,184.2 3,290.1 57.1 - 1,073.2 -45.4 4,257.4 30. Apr. 0.1 2.1 101.5 3,087.3 3,191.0 57.0 - 1,031.2 -47.8 4,118.6 31. May 0.1 2.7 94.8 3,009.2 3,106.8 57.2 - 1,138.0 -55.0 4,147.3 30. Jun. 0.1 2.7 96.1 3,043.6 3,142.5 57.4 - 1,152.6 -65.9 4,196.2 31. Jul. 0.1 2.7 92.4 3,002.1 3,097.2 57.4 - 1,110.8 -54.7 4,112.9 31. Aug. 0.1 3.2 84.3 2,893.5 2,981.1 57.6 - 1,104.6 -46.9 3,998.1 30. Sep. 0.1 3.2 83.8 2,885.3 2,972.4 57.6 - 1,124.3 -57.9 4,009.7 31. Oct. 0.1 3.1 80.8 2,859.3 2,943.3 57.6 - 1,077.5 -40.6 3,936.8 30. Nov. 0.1 3.6 81.0 2,866.1 2,950.8 57.7 - 1,299.5 -44.7 4,165.6 31. Dec. 0.1 3.7 82.3 3,110.0 3,196.1 58.1 - 1,266.2 -115.3 4,376.2 2001 31. Jan. 0.1 3.6 80.9 3,027.2 3,111.8 63.2 - 1,324.7 -41.6 4,351.9 28. Feb. 0.1 4.1 76.9 3,105.1 3,186.2 63.2 - 1,459.3 -48.6 4,564.3 31. Mar. 0.1 4.0 79.7 3,020.4 3,104.2 63.2 - 1,338.8 -56.2 4,359.2 30. Apr. 0.1 4.0 80.0 3,548.8 3,632.9 63.4 - 1,367.5 -51.6 4,916.3 31. May 0.1 4.4 81.6 3,464.8 3,550.9 63.3 - 1,360.1 -40.3 4,824.9 30. Jun. 65.7 4.3 81.1 3,473.1 3,624.2 74.9 - 1,273.7 -44.7 4,746.7 31. Jul. 64.6 4.4 80.8 3,652.4 3,802.2 75.5 - 1,278.3 -49.3 4,930.6 31. Aug. 66.4 4.8 82.7 3,547.2 3,701.1 76.1 - 1,293.4 -43.2 4,840.6 30. Sep. 71.3 4.9 82.7 3,721.7 3,880.5 76.6 - 1,217.9 -39.4 4,939.7 31. Oct. 67.8 4.8 82.0 3,855.5 4,010.1 76.5 - 1,231.7 -40.7 5,087.2 30. Nov. 67.0 5.1 81.4 3,928.1 4,081.6 76.3 - 1,462.7 -38.7 5,390.8 31. Dec. 67.2 5.0 80.6 4,244.3 4,397.1 76.0 - 1,496.1 -51.1 5,740.4 2002 31. Jan. 68.6 5.0 79.7 4,188.1 4,341.4 81.0 - 1,433.7 -51.3 5,621.8 28. Feb. 72.2 5.2 99.5 4,406.4 4,583.3 81.0 - 1,281.8 -44.9 5,688.2 31. Mar. 73.3 5.2 100.0 4,415.9 4,594.3 … - … … …
10 = 4+88 96 73 4
Millions of US Dollars Total foreign
exchange reserves
Short-term liabil. to financial institutions
Banks
Foreign exchange
Use of IMF credit
Other foreign assets
TotalSDR's
Reserve position in IMF
Bank of Slovenia
Total reserves (including gold)
Gold
1
Foreign exchange
2 5 = 1+2+3+4

65
�������������
Monthly Bulletin
3.9. External Debt BALANCE
OF
PAYMENTS
AND
EXTERNAL
POSITION
TOTAL DEBT STOCKS (EDT) 1 3,981 4,123 4,915 5,400 6,217 6,717 6,633Long-term debt (LDOD) 3,931 3,988 4,805 5,283 6,118 6,591 6,515 Public and publicly guaranteed 1,996 2,014 2,326 2,451 2,665 2,710 2,669 Private nonguaranteed 1,935 1,974 2,479 2,832 3,453 3,881 3,846
Use of IMF credit 2 1Short-term debt 49 135 110 117 99 126 118 Interest arrears on LDOD 13 14 16 19 20 20 16
TOTAL DEBT FLOWSDisbursements 1,364 1,192 1,699 1,753 1,998 2,036 148 Long-term deb 1,364 1,106 1,699 1,746 1,998 2,009 148 IMF purchasePrincipal repayments 739 692 1,299 599 733 1,296 112 Long-term deb 735 691 1,274 599 715 1,296 104 IMF repurchase 3 1 Net flows 625 500 400 1,154 1,265 740 36Interest payments (INT) 197 229 237 247 301 360 26 Long-term debt (LINT) 193 224 231 241 297 356 26 IMF charge 2 1 1 1 1 0 0 Short-term deb 2 4 5 5 3 4 0Net transfers 428 271 163 907 964 380 10Total debt service (TDS) 936 921 1,536 846 1,034 1,656 130 Long-term debt (LTDS 928 915 1,505 840 1,012 1,652 130 IM 5 2 1 1 1 0 0 Short-term deb 3 4 30 5 21 4 0
TOTAL EXTERNAL DEBT (%)ETD/Exports of goods & services 36.4 37.9 42.5 49.3 55.9 57.0 …
TDS/Exports of goods & services 8.6 8.5 13.3 7.7 9.3 14.1 …
INT/Exports of goods & services 1.8 2.1 2.1 2.3 2.7 3.1 …
International reserves/EDT 57.7 80.4 74.0 58.7 51.4 65.5 69.1
Foreign ex. reserves/EDT 103.6 106.2 97.3 76.2 70.4 86.4 85.8International reserves/Imports of goods & services (months) 2.5 3.6 3.7 3.2 3.2 4.4 …
Foreign ex. reserves/Imports of goods & services (months) 4.5 4.8 4.9 4.2 4.4 5.8 …LONG-TERM DEBT (%)
LDOD/Exports of goods & services 35.9 36.6 41.6 48.3 57.0 55.9 …
LTDS/Exports of goods & services 8.5 8.4 13.0 7.7 9.1 14.0 …
LINT/Exports of goods & services 1.8 2.1 2.0 2.2 2.7 3.0 …
International reserves/LDOD 58.4 83.1 75.7 60.0 52.2 66.1 70.4
Foreign exchange reserves/LDOD 104.9 109.8 99.5 77.9 71.5 88.1 87.3
DEBT OUTSTANDING (LDOD) 3,931 3,988 4,805 5,283 6,118 6,591 6,515
Public and publicly guaranteed 3,4,5 1,996 2,014 2,326 2,451 2,665 2,710 2,669 Official creditors 770 711 740 650 743 736 716 Multilatera 541 569 579 503 486 483 467 Concessiona 6 6 4 18 18 16 16 Nonconcessiona 535 563 575 485 468 467 451 -IBR 153 151 135 122 101 85 81 Bilateral 229 142 161 147 257 253 249 Concessiona 78 57 52 40 32 26 26Private creditors 1,226 1,303 1,586 1,801 1,922 1,974 1,953 Bonds 945 1,063 1,218 1,435 1,568 1,661 1,631 Commercial banks 275 238 368 366 354 312 319 Other private 6 2 0 - - 1 3Private nonguaranteed 1,935 1,974 2,479 2,832 3,453 3,881 3,846Commercial banks 1,432 1,447 1,705 2,112 2,574 2,804 2,766
UNDISBURSED DEBT 562 440 494 982 901 915 864Public and publicly guaranteed 236 115 180 713 610 489 452Official creditors 220 115 120 648 493 377 358 Multilateral 198 98 60 485 452 357 352 -IBRD 31 12 6 0 20 15 14 -EBRD 108 75 44 17 3 - - Bilateral 22 17 60 163 41 20 6Private creditors 16 60 65 117 112 94Private nonguaranteed 326 325 314 269 291 426 412
Millions of US Dollars, unless otherwise indicated
Principal ratios
20011996 1997 1999 20001998
Long-term debt
28.02.2002
Summary debt data

66
�������������
Monthly Bulletin
3.9. External Debt (continued)BALANCE
OF
PAYMENTS
AND
EXTERNAL
POSITION
Millions of US Dollars, unless otherwise indicated
COMMITMENTS 1,545 1,028 1,824 2,261 2,002 1,819 358Public and publicly guaranteed 427 267 908 1,138 550 474 8Official creditors 63 34 109 622 91 0 0 Multilateral 63 34 6 487 70 - - -IBRD 23 1 - - 23 - - -EBRD Bilateral 103 135 21 - -Private creditors 364 233 799 516 459 474 8Private nonguaranteed 1,118 761 916 1,123 1,452 1,345 350
DISBURSEMENTS 1,364 1,106 1,699 1,746 1,998 2,009 148Public and publicly guaranteed 469 373 907 555 656 636 17Official creditors 121 119 106 56 181 89 0 Multilateral 117 117 37 35 60 70 0 Nonconcessiona 116 117 37 31 59 70 0 -IBR 10 17 9 3 3 4 0 Bilateral 4 2 69 21 121 19 - Concessional 4 1Private creditors 348 254 801 498 475 547 17 Commercial banks 23 23 244 60 90 50 15 Other private 325 231 557 438 385 497 2Private nonguaranteed 895 733 792 1,191 1,342 1,373 131Commercial banks 717 556 545 914 1,024 998 92
PRINCIPAL REPAYMENTS 735 691 1,274 599 715 1,296 104Public and publicly guaranteed 384 232 835 115 160 482 12Official creditors 167 117 211 73 65 63 9 Multilateral 42 50 52 53 56 53 9 Nonconcessional 38 49 50 53 56 52 9 -IBRD 20 19 17 20 20 17 4 Bilateral 125 67 159 20 9 10 - Concessiona 51 13 8 5 5 4 -Private creditors 217 115 624 42 95 419 3 Commercial banks 52 52 162 29 83 82 3 Other private 165 63 462 13 12 337 -Private nonguaranteed 351 459 439 484 555 814 92Commercial banks 240 356 316 340 431 661 78
NET FLOWS 629 415 425 1,147 1,283 713 44Public and publicly guaranteed 85 141 72 440 496 154 5Official creditors -46 2 -105 -17 116 26 -9 Multilateral 75 67 -15 -18 4 17 -9 Nonconcessiona 78 68 -13 -22 3 18 -9 -IBR -10 -2 -8 -17 -17 -13 -4 Bilateral -121 -65 -90 1 112 9 0 Concessiona -47 -12 -8 -5 -5 -4 0Private creditors 131 139 177 456 380 128 14 Commercial banks -29 -29 82 31 7 -32 12 Other private 160 168 95 425 373 160 2Private nonguaranteed 544 274 353 707 787 559 39Commercial banks 477 200 229 574 593 337 14
INTEREST PAYMENTS (LINT) 193 224 231 241 297 356 26Public and publicly guaranteed 92 124 118 125 148 162 6Official creditors 48 45 47 37 44 40 5 Multilateral 40 37 38 33 30 29 5 Nonconcessiona 39 36 37 33 29 28 5 -IBR 13 10 9 6 5 4 1 Bilateral 8 8 9 4 14 11 - Concessiona 2 1 1 1 1 1 -Private crediors 44 79 71 88 104 122 1 Commercial banks 19 16 14 15 21 18 1 Other private 25 63 57 73 83 104 -Private nonguaranteed 101 100 113 116 149 194 20Commercial banks 75 76 79 83 109 149 15
28.02.200220011996 1998 1999 20001997

67
�������������
Monthly Bulletin
3.9. External Debt (continued)
3.9. External Debt (continued)
BALANCE
OF
PAYMENTS
AND
EXTERNAL
POSITION
NET TRANSFERS 436 191 194 906 986 357 18Public and publicly guaranteed -7 17 -46 315 348 -8 -1Official creditors -94 -43 -152 -54 72 -14 -14 Multilateral 35 30 -53 -51 -26 -12 -14 Nonconcessiona 39 32 -50 -55 -26 -10 -14 -IBR -23 -12 -17 -23 -22 -17 -5 Bilateral -129 -73 -99 -3 98 -2 0 Concessiona -45 -11 -7 -4 -4 -3 0Private creditors 87 60 106 368 276 6 13 Commercial banks -48 -45 68 16 -14 -50 11 Other private 185 231 152 498 456 264 2Private nonguaranteed 443 174 240 591 638 365 19Commercial banks 402 124 150 491 484 188 -1
DEBT SERVICE (LTDS) 928 915 1,505 840 1,012 1,652 130Public and publicly guaranteed 476 356 953 240 308 644 18Official creditors 215 162 258 110 109 103 14 Multilateral 82 87 90 86 86 82 14 Nonconcessiona 77 85 87 86 85 80 14 -IBR 33 29 26 26 25 21 5 Bilateral 133 75 168 24 23 21 0 Concessiona 53 14 9 6 6 5 0Private creditors 261 194 695 130 199 541 4 Commercial banks 71 68 176 44 104 100 4 Other private 190 126 519 86 95 441 0Private nonguaranteed 452 559 552 600 704 1,008 112Commercial banks 315 432 395 423 540 810 93
ALL CREDITORS Interest (%) 6.0 5.5 5.4 4.2 5,5 5,3 4,7 Maturity (%) 6.5 7.1 7.5 10,5 7,6 7,3 7,9 Grace period (years) 2.3 2.6 3.6 3,6 4,2 3,4 3,9OFFICIAL CREDITORS Interest (%) 5.1 5.0 6.2 3.6 3,9 3,5 4,8 Maturity (years) 12.3 11.8 12.9 17,7 11,2 10,2 8,7 Grace priod (years) 4.0 2.8 4.7 3,2 3,0 2,6 3,4PRIVATE CREDITORS Interest (%) 6.1 5.5 5.4 4,4 5,6 5,4 4,6 Maturity (years) 6.1 6.7 7.4 7,1 7,2 7,2 7,2 Grace period (years) 2.2 2.6 3.3 3,8 4,3 3,4 4,3MEMORANDUM ITEMS Concessional LDOD 158 129 139 113 146 131 130 Variable rate LDOD 2,895 2,879 2,905 3,226 3,897 4,285 4,260
Average terms of new commitments
Millions of US Dollars, unless otherwise indicated2000 2001 28.02.20021996 1997 1998 1999
TOTAL LONG-TERM 1,223 1,141 1,248 1,445 957 3,437 Principal 889 818 955 1,197 751 2,768 Interest 334 323 293 248 206 669
Millions of US DollarsSubsequent years
Debt service projections on existing pipeline
20062004 20052002 2003
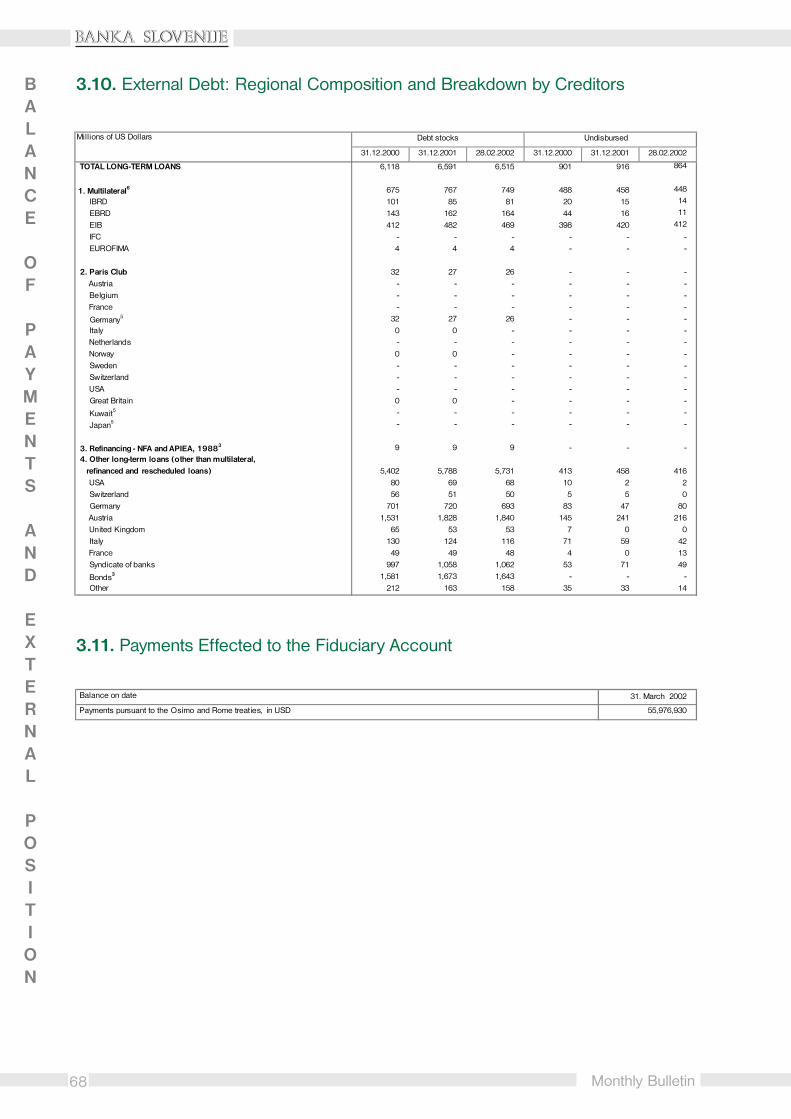
68
�������������
Monthly Bulletin
3.10. External Debt: Regional Composition and Breakdown by Creditors
3.11. Payments Effected to the Fiduciary Account
BALANCE
OF
PAYMENTS
AND
EXTERNAL
POSITION
TOTAL LONG-TERM LOANS 6,118 6,591 6,515 901 916 864
1. Multilateral6 675 767 749 488 458 448
IBRD 101 85 81 20 15 14
EBRD 143 162 164 44 16 11
EIB 412 482 469 398 420 412
IFC - - - - - - EUROFIMA 4 4 4 - - -
2. Paris Club 32 27 26 - - - Austria - - - - - - Belgium - - - - - - France - - - - - -
Germany5 32 27 26 - - - Italy 0 0 - - - - Netherlands - - - - - - Norway 0 0 - - - - Sweden - - - - - - Switzerland - - - - - - USA - - - - - - Great Britain 0 0 - - - -
Kuwait5 - - - - - -
Japan5 - - - - - -
3. Refinancing - NFA and APIEA, 19883 9 9 9 - - - 4. Other long-term loans (other than multilateral, refinanced and rescheduled loans) 5,402 5,788 5,731 413 458 416 USA 80 69 68 10 2 2 Switzerland 56 51 50 5 5 0 Germany 701 720 693 83 47 80 Austria 1,531 1,828 1,840 145 241 216 United Kingdom 65 53 53 7 0 0 Italy 130 124 116 71 59 42 France 49 49 48 4 0 13 Syndicate of banks 997 1,058 1,062 53 71 49
Bonds3 1,581 1,673 1,643 - - - Other 212 163 158 35 33 14
Millions of US Dollars
31.12.2001 28.02.2002
Debt stocks
31.12.2000 31.12.2001 28.02.2002 31.12.2000
Undisbursed
Balance on date 31. March 2002
Payments pursuant to the Osimo and Rome treaties, in USD 55,976,930

69
�������������
Monthly Bulletin
3.12.1. International Investment Position of Slovenia - Assets BALANCE
OF
PAYMENTS
AND
EXTERNAL
POSITION
Summary
Net 777.1 497.3 -499.9 -297.3 -975.6 -2,002.6 -2,339.2
Assets 5,899.1 6,798.0 7,125.4 7,719.7 8,458.2 7,787.5 8,213.7Direct Investment Abroad 354.0 489.9 459.5 459.4 608.3 605.0 794.0Portfolio Investment 62.1 106.4 93.9 56.0 49.1 62.8 70.7Other Investment 3,983.9 4,380.8 4,274.6 3,889.6 4,162.2 3,951.6 4,152.9Reserve Assets 1,499.1 1,820.9 2,297.5 3,314.8 3,638.6 3,168.1 3,196.1
Liabilities 5,121.9 6,300.7 7,625.3 8,017.0 9,433.8 9,790.0 10,552.9 Direct Investment in Slovenia 1,325.9 1,763.4 1,998.1 2,207.3 2,765.8 2,656.5 2,808.5
Portfolio Investment 88.9 104.1 1,138.2 1,276.6 1,420.5 1,643.9 1,769.6Other Investment 3,707.1 4,433.2 4,489.0 4,533.0 5,247.5 5,489.6 5,974.9
Breakdown Items
Assets 5,899.1 6,798.0 7,125.4 7,719.7 8,458.2 7,787.5 8,213.7
Direct Investment Abroad 354.0 489.9 459.5 459.4 608.3 605.0 794.0Equity Capital and Reinvested Earnings 342.4 366.2 342.9 324.7 367.8 359.6 466.2Other Capital 11.7 123.7 116.5 134.7 240.5 245.4 327.8
Claims on Affiliated Enterprises 265.4 351.6 346.7 402.6 415.5 402.4 489.4Liabilities to Affiliated Enterprises -253.7 -227.8 -230.1 -267.9 -175.0 -156.9 -161.6
Portfolio Investment 62.1 106.4 93.9 56.0 49.1 62.8 70.7Equity Securities 15.0 17.1 15.8 15.6 26.2 32.4 36.3
Banks 4.0 6.2 6.4 6.0 7.2 6.4 5.4Other Sectors 11.0 10.9 9.4 9.6 18.9 26.0 30.8
Debt Securities 47.0 89.3 78.1 40.4 22.9 30.3 34.5Bonds and Notes 47.0 89.3 78.1 40.4 22.9 30.3 34.5
Banks 47.0 89.3 78.1 40.4 22.9 30.3 34.5
Other Investment 3,983.9 4,380.8 4,274.6 3,889.6 4,162.2 3,951.6 4,152.9Trade Credits 1,686.3 1,809.7 1,737.9 1,933.0 2,133.3 2,024.6 2,043.6
Other Sectors 1,686.3 1,809.7 1,737.9 1,933.0 2,133.3 2,024.6 2,043.6Long-term 183.3 179.5 168.7 155.4 180.1 201.4 192.6Short-term 1,503.0 1,630.2 1,569.2 1,777.6 1,953.1 1,823.2 1,851.0
Loans 28.2 43.4 45.8 104.8 138.3 144.8 165.6Banks 22.9 37.4 39.1 100.0 124.9 117.4 96.4
Long-term 14.9 23.7 26.5 57.1 87.0 71.9 68.7Short-term 8.0 13.7 12.6 42.9 37.9 45.5 27.8
Other Sectors 5.4 6.0 6.7 4.8 13.4 27.5 69.2Long-term 4.0 4.6 3.5 3.4 5.5 20.2 59.7Short-term 1.4 1.5 3.2 1.4 7.9 7.2 9.6
Currency and Deposits 1,756.7 2,047.0 2,217.1 1,536.0 1,561.6 1,464.3 1,624.3Banks 1,276.9 1,561.4 1,786.7 1,022.5 1,103.1 957.2 1,155.5Other Sectors 479.8 485.6 430.5 513.5 458.5 507.0 468.8
Other Assets 512.6 480.6 273.8 315.8 329.1 317.9 319.4Bank of Slovenia 103.3 170.1 33.3 40.7 46.3 51.8 57.9
Long-term 0.0 0.0 0.0 0.0 0.0 0.0 0.1Short-term 103.3 170.1 33.3 40.7 46.3 51.8 57.8
General Government ... ... ... ... ... ... …Banks 409.3 310.5 240.5 275.1 282.8 266.1 261.4
Long-term 0.0 0.0 1.2 2.0 1.0 0.0 0.0Short-term 409.3 310.5 239.3 273.2 281.7 266.1 261.4
Reserve Assets 1,499.1 1,820.9 2,297.5 3,314.8 3,638.6 3,168.1 3,196.1
Monetary Gold 0.1 0.1 0.1 0.1 0.1 0.1 0.1 Special Drawing Rights 0.1 0.1 0.1 0.1 0.2 1.6 3.7 Reserve Position in the Fund 18.8 19.1 18.5 17.4 65.4 107.6 82.3 Foreign Exchange 1,480.1 1,801.6 2,278.7 3,297.2 3,572.9 3,058.8 3,110.0
Currency and Deposits 1,388.7 1,593.0 1,891.8 2,191.1 1,576.2 869.4 986.4 Securities 91.4 208.5 386.9 1,106.1 1,996.6 2,189.4 2,123.5
Bonds and Notes 91.4 208.5 386.9 1,106.1 1,996.6 2,189.4 2,123.5
1999* 2000Millions of US Dollars
1994 1995 1996 1997* 1998*

70
�������������
Monthly Bulletin
3.12.2. International Investment Position of Slovenia - LiabilitiesBALANCE
OF
PAYMENTS
AND
EXTERNAL
POSITION
Liabilities 5,121.9 6,300.7 7,625.3 8,017.0 9,433.8 9,790.0 10,552.9
Direct Investment in Slovenia 1,325.9 1,763.4 1,998.1 2,207.3 2,765.8 2,656.5 2,808.5Equity Capital and Reinvested Earnings 966.5 1,203.5 1,274.9 1,559.4 2,011.6 1,893.9 1,883.2Other Capital 359.4 559.8 723.1 647.9 754.2 762.6 925.3
Claims on Direct Investors -116.2 -137.6 -174.7 -186.9 -110.5 -111.1 -121.4Liabilities to Direct Investors 475.7 697.4 897.9 834.9 864.7 873.7 1,046.7
Portfolio Investment 88.9 104.1 1,138.2 1,276.6 1,420.5 1,643.9 1,769.6Equity Securities 45.9 62.7 133.8 156.7 138.5 145.8 147.6
Banks 17.9 27.5 30.2 15.6 18.0 14.0 24.5Other Sectors 28.0 35.2 103.6 141.1 120.5 131.8 123.1
Debt Securities 43.0 41.4 1,004.4 1,119.9 1,282.1 1,498.1 1,622.0Bonds and Notes 43.0 41.4 1,004.4 1,119.9 1,282.1 1,498.1 1,622.0
General Government 0.0 0.0 944.2 1,062.8 1,218.4 1,434.6 1,566.4Banks 0.0 17.0 25.3 22.0 23.5 20.2 18.7Other Sectors 43.0 24.4 35.0 35.1 40.2 43.3 36.9
Other Investment 3,707.1 4,433.2 4,489.0 4,533.0 5,247.5 5,489.6 5,974.9Trade Credits 1,490.6 1,675.4 1,538.4 1,635.0 1,831.6 1,772.4 1,804.3
General Government 7.3 6.9 5.4 1.8 0.9 0.4 0.1Long-term 7.3 6.9 5.4 1.8 0.9 0.4 0.1
Other sectors 1,483.3 1,668.5 1,532.9 1,633.2 1,830.7 1,772.0 1,804.2Long-term 78.4 78.1 95.7 95.7 135.2 102.6 80.3Short-term 1,404.9 1,590.4 1,437.2 1,537.5 1,695.4 1,669.4 1,723.9
Loans 1,873.3 2,366.3 2,439.8 2,448.9 2,910.3 3,215.4 3,721.8Bank of Slovenia 7.2 4.0 1.3 0.0 0.0 0.0 0.0
Use of Fund Credit and Loans from Fund 7.2 4.0 1.3 0.0 0.0 0.0 0.0General Government 411.0 572.4 618.1 501.3 572.6 480.4 432.0
Long-term 411.0 572.4 618.1 501.3 572.6 480.4 432.0Short-term 0.0 0.0 0.0 0.0 0.0 0.0 0.0
Banks 469.1 582.5 719.9 747.1 779.0 958.3 1,102.5Long-term 467.6 579.2 719.9 747.1 778.5 951.2 1,100.7Short-term 1.5 3.4 0.0 0.0 0.5 7.0 1.7
Other Sectors 986.0 1,207.4 1,100.5 1,200.5 1,558.7 1,776.8 2,187.3Long-term 936.4 1,199.6 1,085.6 1,122.6 1,491.5 1,702.0 2,131.6Short-term 49.6 7.8 14.9 78.0 67.2 74.7 55.7
Currency and Deposits 171.7 219.1 363.7 345.0 407.7 364.9 373.3Bank of Slovenia 0.1 0.1 0.3 0.2 0.4 0.3 0.0Banks 171.6 218.9 363.5 344.8 407.3 364.6 373.3
Other Liabilities 171.6 172.4 147.1 104.1 98.0 136.8 75.6Banks 65.6 78.7 70.9 69.3 73.3 122.9 66.7
Long-term 65.5 78.1 70.4 69.0 72.7 68.8 66.3 Short-term 0.1 0.6 0.4 0.4 0.6 54.1 0.4
Other Sectors 106.0 93.7 76.3 34.8 24.7 13.9 8.9 Long-term 106.0 93.7 76.3 34.8 24.7 13.9 8.9
1999* 2000Millions of US Dollars
1994 1995 1996 1997* 1998*
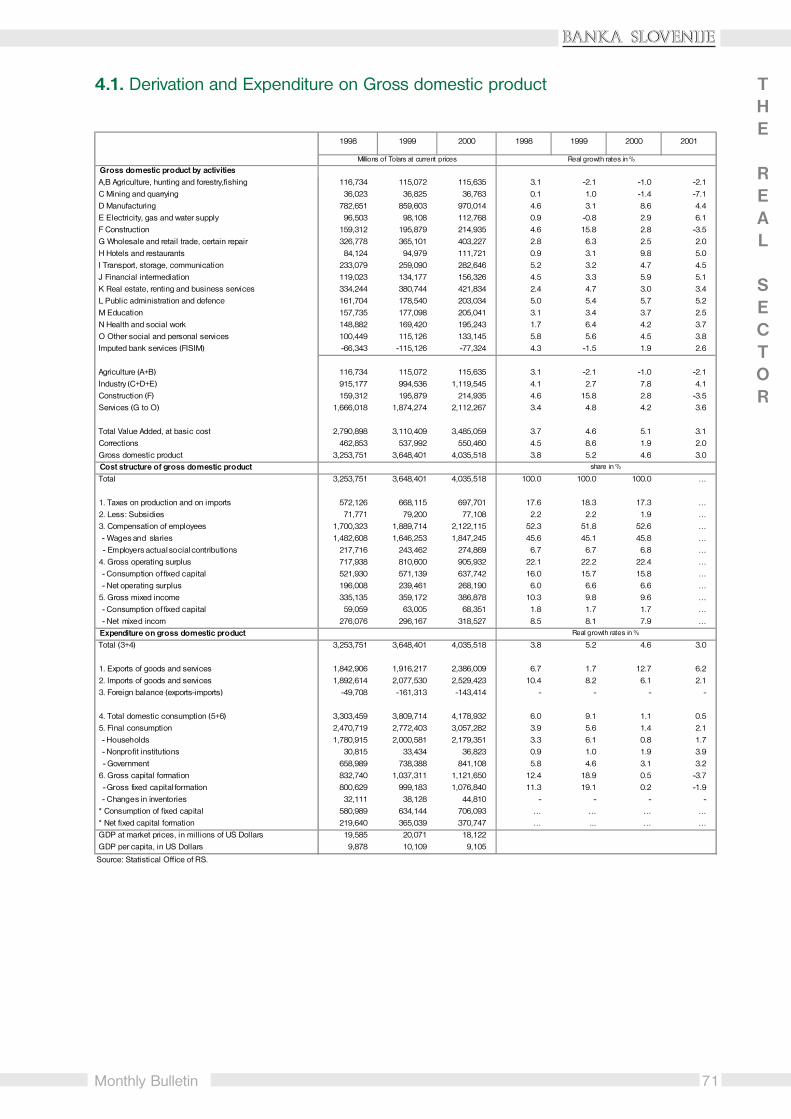
71
�������������
Monthly Bulletin
4.1. Derivation and Expenditure on Gross domestic product THE
REAL
SECTOR
Gross domestic product by activities A,B Agriculture, hunting and forestry,fishing 116,734 115,072 115,635 3.1 -2.1 -1.0 -2.1
C Mining and quarrying 36,023 36,825 36,763 0.1 1.0 -1.4 -7.1
D Manufacturing 782,651 859,603 970,014 4.6 3.1 8.6 4.4
E Electricity, gas and water supply 96,503 98,108 112,768 0.9 -0.8 2.9 6.1
F Construction 159,312 195,879 214,935 4.6 15.8 2.8 -3.5
G Wholesale and retail trade, certain repair 326,778 365,101 403,227 2.8 6.3 2.5 2.0
H Hotels and restaurants 84,124 94,979 111,721 0.9 3.1 9.8 5.0
I Transport, storage, communication 233,079 259,090 282,646 5.2 3.2 4.7 4.5
J Financial intermediation 119,023 134,177 156,326 4.5 3.3 5.9 5.1
K Real estate, renting and business services 334,244 380,744 421,834 2.4 4.7 3.0 3.4
L Public administration and defence 161,704 178,540 203,034 5.0 5.4 5.7 5.2
M Education 157,735 177,098 205,041 3.1 3.4 3.7 2.5
N Health and social work 148,882 169,420 195,243 1.7 6.4 4.2 3.7
O Other social and personal services 100,449 115,126 133,145 5.8 5.6 4.5 3.8
Imputed bank services (FISIM) -66,343 -115,126 -77,324 4.3 -1.5 1.9 2.6
Agriculture (A+B) 116,734 115,072 115,635 3.1 -2.1 -1.0 -2.1 Industry (C+D+E) 915,177 994,536 1,119,545 4.1 2.7 7.8 4.1 Construction (F) 159,312 195,879 214,935 4.6 15.8 2.8 -3.5 Services (G to O) 1,666,018 1,874,274 2,112,267 3.4 4.8 4.2 3.6
Total Value Added, at basic cost 2,790,898 3,110,409 3,485,059 3.7 4.6 5.1 3.1
Corrections 462,853 537,992 550,460 4.5 8.6 1.9 2.0
Gross domestic product 3,253,751 3,648,401 4,035,518 3.8 5.2 4.6 3.0
Cost structure of gross domestic product Total 3,253,751 3,648,401 4,035,518 100.0 100.0 100.0 …
1. Taxes on production and on imports 572,126 668,115 697,701 17.6 18.3 17.3 … 2. Less: Subsidies 71,771 79,200 77,108 2.2 2.2 1.9 … 3. Compensation of employees 1,700,323 1,889,714 2,122,115 52.3 51.8 52.6 … - Wages and slaries 1,482,608 1,646,253 1,847,245 45.6 45.1 45.8 …
- Employers actual social contributions 217,716 243,462 274,869 6.7 6.7 6.8 …
4. Gross operating surplus 717,938 810,600 905,932 22.1 22.2 22.4 …
- Consumption of fixed capital 521,930 571,139 637,742 16.0 15.7 15.8 …
- Net operating surplus 196,008 239,461 268,190 6.0 6.6 6.6 …
5. Gross mixed income 335,135 359,172 386,878 10.3 9.8 9.6 …
- Consumption of fixed capital 59,059 63,005 68,351 1.8 1.7 1.7 …
- Net mixed incom 276,076 296,167 318,527 8.5 8.1 7.9 … Expenditure on gross domestic product Total (3+4) 3,253,751 3,648,401 4,035,518 3.8 5.2 4.6 3.0
1. Exports of goods and services 1,842,906 1,916,217 2,386,009 6.7 1.7 12.7 6.2 2. Imports of goods and services 1,892,614 2,077,530 2,529,423 10.4 8.2 6.1 2.1 3. Foreign balance (exports-imports) -49,708 -161,313 -143,414 - - - -
4. Total domestic consumption (5+6) 3,303,459 3,809,714 4,178,932 6.0 9.1 1.1 0.5
5. Final consumption 2,470,719 2,772,403 3,057,282 3.9 5.6 1.4 2.1
- Households 1,780,915 2,000,581 2,179,351 3.3 6.1 0.8 1.7
- Nonprofit institutions 30,815 33,434 36,823 0.9 1.0 1.9 3.9
- Government 658,989 738,388 841,108 5.8 4.6 3.1 3.2
6. Gross capital formation 832,740 1,037,311 1,121,650 12.4 18.9 0.5 -3.7
- Gross fixed capital formation 800,629 999,183 1,076,840 11.3 19.1 0.2 -1.9
- Changes in inventories 32,111 38,128 44,810 - - - - * Consumption of fixed capital 580,989 634,144 706,093 … … … … * Net fixed capital formation 219,640 365,039 370,747 … ... … … GDP at market prices, in millions of US Dollars 19,585 20,071 18,122
GDP per capita, in US Dollars 9,878 10,109 9,105
2001
share in %
Real growth rates in %
Source: Statistical Office of RS.
2000
Millions of Tolars at current prices Real growth rates in %
1998 1999 2000 1998 1999
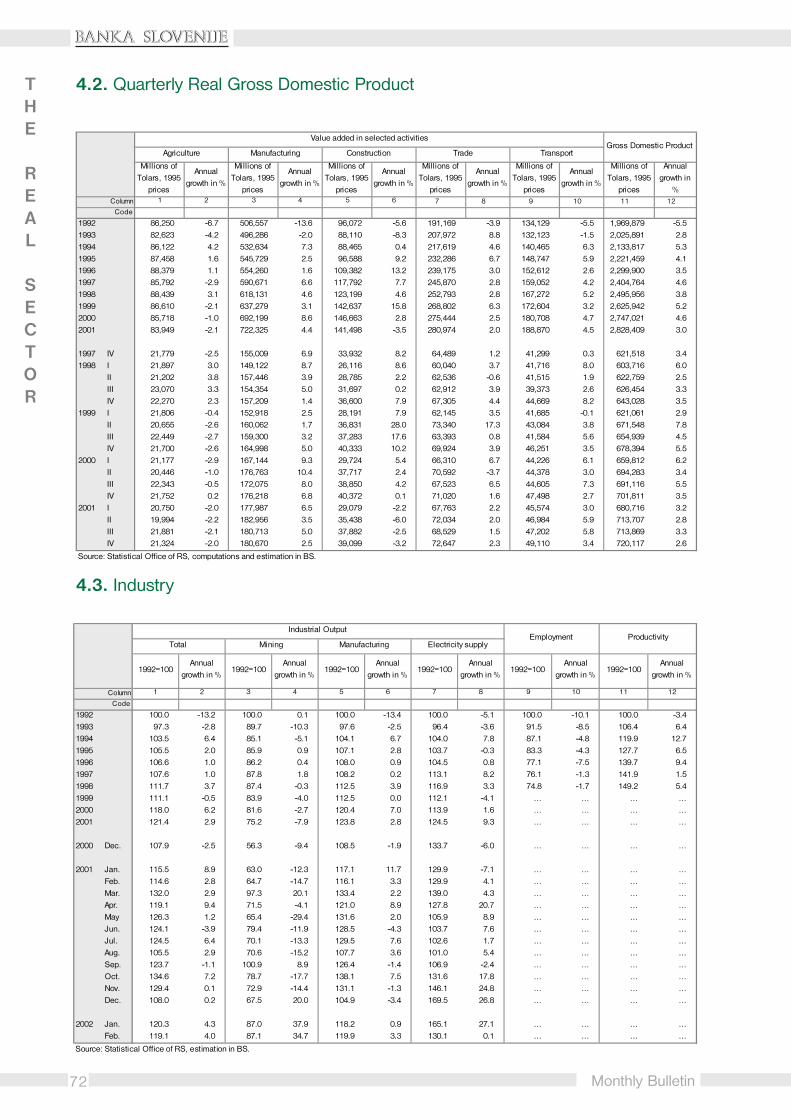
72
�������������
Monthly Bulletin
4.2. Quarterly Real Gross Domestic Product
4.3. Industry
Column 7 8 9 10 11 12
Code
1992 86,250 -6.7 506,557 -13.6 96,072 -5.6 191,169 -3.9 134,129 -5.5 1,969,879 -5.51993 82,623 -4.2 496,286 -2.0 88,110 -8.3 207,972 8.8 132,123 -1.5 2,025,891 2.81994 86,122 4.2 532,634 7.3 88,465 0.4 217,619 4.6 140,465 6.3 2,133,817 5.31995 87,458 1.6 545,729 2.5 96,588 9.2 232,286 6.7 148,747 5.9 2,221,459 4.11996 88,379 1.1 554,260 1.6 109,382 13.2 239,175 3.0 152,612 2.6 2,299,900 3.51997 85,792 -2.9 590,671 6.6 117,792 7.7 245,870 2.8 159,052 4.2 2,404,764 4.61998 88,439 3.1 618,131 4.6 123,199 4.6 252,793 2.8 167,272 5.2 2,495,956 3.81999 86,610 -2.1 637,279 3.1 142,637 15.8 268,802 6.3 172,604 3.2 2,625,942 5.22000 85,718 -1.0 692,199 8.6 146,663 2.8 275,444 2.5 180,708 4.7 2,747,021 4.62001 83,949 -2.1 722,325 4.4 141,498 -3.5 280,974 2.0 188,870 4.5 2,828,409 3.0 1997 IV 21,779 -2.5 155,009 6.9 33,932 8.2 64,489 1.2 41,299 0.3 621,518 3.41998 I 21,897 3.0 149,122 8.7 26,116 8.6 60,040 3.7 41,716 8.0 603,716 6.0 II 21,202 3.8 157,446 3.9 28,785 2.2 62,536 -0.6 41,515 1.9 622,759 2.5 III 23,070 3.3 154,354 5.0 31,697 0.2 62,912 3.9 39,373 2.6 626,454 3.3 IV 22,270 2.3 157,209 1.4 36,600 7.9 67,305 4.4 44,669 8.2 643,028 3.51999 I 21,806 -0.4 152,918 2.5 28,191 7.9 62,145 3.5 41,685 -0.1 621,061 2.9 II 20,655 -2.6 160,062 1.7 36,831 28.0 73,340 17.3 43,084 3.8 671,548 7.8 III 22,449 -2.7 159,300 3.2 37,283 17.6 63,393 0.8 41,584 5.6 654,939 4.5 IV 21,700 -2.6 164,998 5.0 40,333 10.2 69,924 3.9 46,251 3.5 678,394 5.52000 I 21,177 -2.9 167,144 9.3 29,724 5.4 66,310 6.7 44,226 6.1 659,812 6.2 II 20,446 -1.0 176,763 10.4 37,717 2.4 70,592 -3.7 44,378 3.0 694,283 3.4 III 22,343 -0.5 172,075 8.0 38,850 4.2 67,523 6.5 44,605 7.3 691,116 5.5 IV 21,752 0.2 176,218 6.8 40,372 0.1 71,020 1.6 47,498 2.7 701,811 3.52001 I 20,750 -2.0 177,987 6.5 29,079 -2.2 67,763 2.2 45,574 3.0 680,716 3.2 II 19,994 -2.2 182,956 3.5 35,438 -6.0 72,034 2.0 46,984 5.9 713,707 2.8 III 21,881 -2.1 180,713 5.0 37,882 -2.5 68,529 1.5 47,202 5.8 713,869 3.3 IV 21,324 -2.0 180,670 2.5 39,099 -3.2 72,647 2.3 49,110 3.4 720,117 2.6
1
Source: Statistical Office of RS, computations and estimation in BS.
Millions of Tolars, 1995
prices
Annual growth in %
Millions of Tolars, 1995
prices
Agriculture Manufacturing
Millions of Tolars, 1995
prices
Annual growth in %
Annual growth in
%
Construction Trade TransportGross Domestic Product
2
Annual growth in %
5
Millions of Tolars, 1995
prices3
Millions of Tolars, 1995
prices
Annual growth in %
Millions of Tolars, 1995
prices
Annual growth in %
Value added in selected activities
4 6
Column
Code
1992 100.0 -13.2 100.0 0.1 100.0 -13.4 100.0 -5.1 100.0 -10.1 100.0 -3.41993 97.3 -2.8 89.7 -10.3 97.6 -2.5 96.4 -3.6 91.5 -8.5 106.4 6.41994 103.5 6.4 85.1 -5.1 104.1 6.7 104.0 7.8 87.1 -4.8 119.9 12.71995 105.5 2.0 85.9 0.9 107.1 2.8 103.7 -0.3 83.3 -4.3 127.7 6.51996 106.6 1.0 86.2 0.4 108.0 0.9 104.5 0.8 77.1 -7.5 139.7 9.41997 107.6 1.0 87.8 1.8 108.2 0.2 113.1 8.2 76.1 -1.3 141.9 1.51998 111.7 3.7 87.4 -0.3 112.5 3.9 116.9 3.3 74.8 -1.7 149.2 5.41999 111.1 -0.5 83.9 -4.0 112.5 0.0 112.1 -4.1 … … … …2000 118.0 6.2 81.6 -2.7 120.4 7.0 113.9 1.6 … … … …2001 121.4 2.9 75.2 -7.9 123.8 2.8 124.5 9.3 … … … … 2000 Dec. 107.9 -2.5 56.3 -9.4 108.5 -1.9 133.7 -6.0 … … … … 2001 Jan. 115.5 8.9 63.0 -12.3 117.1 11.7 129.9 -7.1 … … … … Feb. 114.6 2.8 64.7 -14.7 116.1 3.3 129.9 4.1 … … … … Mar. 132.0 2.9 97.3 20.1 133.4 2.2 139.0 4.3 … … … … Apr. 119.1 9.4 71.5 -4.1 121.0 8.9 127.8 20.7 … … … … May 126.3 1.2 65.4 -29.4 131.6 2.0 105.9 8.9 … … … … Jun. 124.1 -3.9 79.4 -11.9 128.5 -4.3 103.7 7.6 … … … … Jul. 124.5 6.4 70.1 -13.3 129.5 7.6 102.6 1.7 … … … … Aug. 105.5 2.9 70.6 -15.2 107.7 3.6 101.0 5.4 … … … … Sep. 123.7 -1.1 100.9 8.9 126.4 -1.4 106.9 -2.4 … … … … Oct. 134.6 7.2 78.7 -17.7 138.1 7.5 131.6 17.8 … … … … Nov. 129.4 0.1 72.9 -14.4 131.1 -1.3 146.1 24.8 … … … … Dec. 108.0 0.2 67.5 20.0 104.9 -3.4 169.5 26.8 … … … … 2002 Jan. 120.3 4.3 87.0 37.9 118.2 0.9 165.1 27.1 … … … … Feb. 119.1 4.0 87.1 34.7 119.9 3.3 130.1 0.1 … … … …
Source: Statistical Office of RS, estimation in BS.
Industrial Output
Total Mining Manufacturing Electricity supplyEmployment Productivity
1992=100Annual
growth in %1992=100
Annual growth in %
1992=100Annual
growth in %1992=100
Annual growth in %
1 4 7
Annual growth in %
1992=100Annual
growth in %1992=100
2 3 5 6 8 129 10 11
THE
REAL
SECTOR

73
�������������
Monthly Bulletin
4.4. Travel
4.5. Employment and Unemployment
Column
Code
1992 5,098 3,083 2,015 71,968 26,706 45,274 46,320 17,565 28,755 2,0881993 5,385 3,372 2,013 82,642 28,293 54,346 51,988 18,585 33,402 1,4951994 5,866 3,385 2,481 * 93,522 28,440 65,080 59,916 20,480 39,433 2,0651995 5,883 3,448 2,435 90,751 28,720 62,031 65,166 22,446 42,721 2,0601996 5,832 3,282 2,551 98,712 28,841 69,871 71,169 22,214 48,955 2,7951997 6,385 3,306 3,079 101,571 27,372 74,199 71,406 20,916 50,490 3,7361998 6,279 3,221 3,058 89,867 25,438 64,429 59,058 18,454 40,603 4,0361999 6,057 3,315 2,741 84,279 25,364 58,916 54,308 18,101 36,207 4,2352000 6,716 3,313 3,403 89,503 26,954 62,549 55,660 18,464 37,196 4,9692001 7,130 3,317 3,813 87,374 26,637 60,376 53,482 17,873 35,609 5,119 2000 Dec. 344 191 154 6,518 2,074 4,445 4,389 1,567 2,822 16 2001 Jan. 382 176 206 5,765 1,844 3,560 3,607 1,307 2,300 8 Feb. 431 262 169 5,232 1,673 3,560 3,423 1,213 2,211 13 Mar. 426 227 199 6,332 2,061 4,271 4,166 1,517 2,649 15 Apr. 469 195 274 7,283 2,236 5,046 4,642 1,586 3,056 175 May 540 236 304 7,289 2,230 5,058 4,570 1,517 3,054 154 Jun. 706 321 385 8,298 2,447 5,852 5,008 1,577 3,431 505 Jul. 1,054 494 560 10,035 2,799 7,236 5,813 1,694 4,119 2,009 Aug. 1,240 563 677 10,666 3,019 7,646 5,761 1,699 4,062 1,835 Sep. 659 253 406 7,895 2,388 5,507 4,615 1,540 3,076 338 Oct. 485 206 279 6,927 2,104 4,822 4,427 1,473 2,954 39 Nov. 365 183 182 5,852 1,923 3,929 3,644 1,352 2,293 11 Dec. 373 201 172 5,800 1,912 3,888 3,805 1,400 2,405 17 2002 Jan. 397 188 209 5,211 1,747 3,464 3,285 1,236 2,049 7
Source: Statistical Office of RS, Central Bureau of Statistics of R Croatia.
108 96 7=8+94=5+6 52 3
Thousands
From abroad
1=2+3
From Slovenia
Overnight staysSlovenian
overnight stays in Croatia
Total Total
From Slovenia From abroad
Excluding border with Croatia
TotalFrom abroadFrom Slovenia
Road border crossing
Column
Code
1992 669,466 32,615 702,080 42,569 39,408 81,977 784,057 102,596 886,654 11.6 8.31993 634,522 36,328 670,850 45,613 39,408 85,021 755,871 129,087 884,958 14.6 9.11994 615,767 42,721 658,488 48,340 39,408 87,748 746,236 127,056 873,292 14.5 9.01995 607,289 48,039 655,328 50,502 39,408 89,910 745,237 121,483 866,721 14.0 7.41996 597,328 53,100 650,428 52,375 39,408 91,783 742,211 119,799 862,009 13.9 7.31997 593,086 58,140 651,226 52,505 39,700 92,205 743,431 125,189 868,619 14.4 7.41998 591,653 60,827 652,481 51,674 41,012 92,688 745,169 126,079 871,249 14.5 7.91999 606,927 64,043 670,970 50,816 36,685 87,502 758,473 111,950 877,424 13.6 7.62000 615,493 67,549 683,042 50,704 34,426 85,130 768,172 106,601 874,773 12.2 7.02001 626,444 68,372 694,816 50,628 33,596 84,224 779,041 101,856 880,897 11.6 6.4 2001 Jan. 616,375 67,141 683,516 50,519 32,049 82,568 766,084 106,153 872,237 12.2 - Feb. 617,470 67,383 684,853 50,519 32,049 82,568 767,421 104,946 872,367 12.0 6.7 Mar. 621,608 67,886 689,494 50,499 32,049 82,548 772,042 103,614 875,656 11.8 - Apr. 624,073 68,178 692,251 50,558 33,517 84,075 776,326 102,734 879,050 11.7 - May 627,105 68,654 695,759 50,552 33,517 84,069 779,828 100,066 879,894 11.4 5.9 Jun. 628,721 69,048 697,769 50,614 33,517 84,131 781,900 97,824 879,724 11.1 - Jul. 628,282 68,973 697,255 50,623 34,378 85,001 782,256 99,212 881,468 11.3 - Aug. 628,205 68,858 697,063 50,680 34,378 85,058 782,121 98,148 880,269 11.1 5.9 Sep. 632,215 68,829 701,044 50,791 34,378 85,169 786,213 99,834 886,047 11.3 - Oct. 632,512 68,920 701,432 50,776 34,440 85,216 786,648 102,212 888,860 11.5 - Nov. 631,584 68,832 700,416 50,738 34,440 85,178 785,594 103,219 888,813 11.6 7.1 Dec. 629,180 67,770 696,950 50,672 34,440 85,112 782,062 104,316 886,378 11.8 - 2002 Jan. 627,277 66,425 693,702 50,506 35,333 85,839 779,541 106,164 885,705 12.0 -
Source: Statistical Office of RS, estimation in BS.
11
Persons
9=7+8 107=3+6 85 6=4+53=1+2 41 2
By self-employed persons
Total labour force
Total employed persons
Self-employed persons
Outside agriculture
In agricultureIn enterprises
and institutions
Persons in paid employment
TotalRegistered
Total
TotalTotal
Registered unemployed
persons
Unemployment rate in %
Surveys
THE
REAL
SECTOR
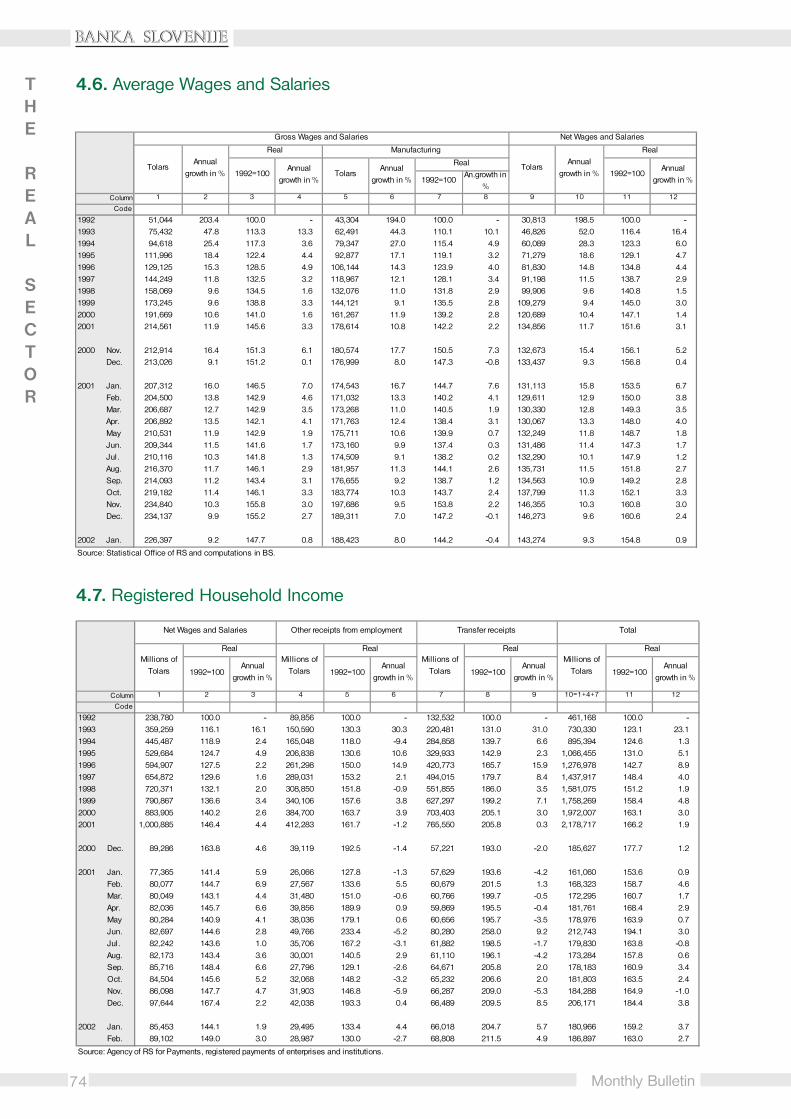
74
�������������
Monthly Bulletin
4.7. Registered Household Income
4.6. Average Wages and Salaries
Column
Code
1992 51,044 203.4 100.0 - 43,304 194.0 100.0 - 30,813 198.5 100.0 -1993 75,432 47.8 113.3 13.3 62,491 44.3 110.1 10.1 46,826 52.0 116.4 16.41994 94,618 25.4 117.3 3.6 79,347 27.0 115.4 4.9 60,089 28.3 123.3 6.01995 111,996 18.4 122.4 4.4 92,877 17.1 119.1 3.2 71,279 18.6 129.1 4.71996 129,125 15.3 128.5 4.9 106,144 14.3 123.9 4.0 81,830 14.8 134.8 4.41997 144,249 11.8 132.5 3.2 118,967 12.1 128.1 3.4 91,198 11.5 138.7 2.91998 158,069 9.6 134.5 1.6 132,076 11.0 131.8 2.9 99,906 9.6 140.8 1.51999 173,245 9.6 138.8 3.3 144,121 9.1 135.5 2.8 109,279 9.4 145.0 3.02000 191,669 10.6 141.0 1.6 161,267 11.9 139.2 2.8 120,689 10.4 147.1 1.42001 214,561 11.9 145.6 3.3 178,614 10.8 142.2 2.2 134,856 11.7 151.6 3.1 2000 Nov. 212,914 16.4 151.3 6.1 180,574 17.7 150.5 7.3 132,673 15.4 156.1 5.2 Dec. 213,026 9.1 151.2 0.1 176,999 8.0 147.3 -0.8 133,437 9.3 156.8 0.4 2001 Jan. 207,312 16.0 146.5 7.0 174,543 16.7 144.7 7.6 131,113 15.8 153.5 6.7 Feb. 204,500 13.8 142.9 4.6 171,032 13.3 140.2 4.1 129,611 12.9 150.0 3.8 Mar. 206,687 12.7 142.9 3.5 173,268 11.0 140.5 1.9 130,330 12.8 149.3 3.5 Apr. 206,892 13.5 142.1 4.1 171,763 12.4 138.4 3.1 130,067 13.3 148.0 4.0 May 210,531 11.9 142.9 1.9 175,711 10.6 139.9 0.7 132,249 11.8 148.7 1.8 Jun. 209,344 11.5 141.6 1.7 173,160 9.9 137.4 0.3 131,486 11.4 147.3 1.7 Jul. 210,116 10.3 141.8 1.3 174,509 9.1 138.2 0.2 132,290 10.1 147.9 1.2 Aug. 216,370 11.7 146.1 2.9 181,957 11.3 144.1 2.6 135,731 11.5 151.8 2.7 Sep. 214,093 11.2 143.4 3.1 176,655 9.2 138.7 1.2 134,563 10.9 149.2 2.8 Oct. 219,182 11.4 146.1 3.3 183,774 10.3 143.7 2.4 137,799 11.3 152.1 3.3 Nov. 234,840 10.3 155.8 3.0 197,686 9.5 153.8 2.2 146,355 10.3 160.8 3.0 Dec. 234,137 9.9 155.2 2.7 189,311 7.0 147.2 -0.1 146,273 9.6 160.6 2.4 2002 Jan. 226,397 9.2 147.7 0.8 188,423 8.0 144.2 -0.4 143,274 9.3 154.8 0.9
Source: Statistical Office of RS and computations in BS.
9 10 112 853
Net Wages and Salaries
Manufacturing
4 76 12
Gross Wages and Salaries
1
TolarsAnnual
growth in % 1992=100Annual
growth in %
Real
TolarsAnnual
growth in %
Real
1992=100An.growth in
%
TolarsAnnual
growth in %
Real
1992=100Annual
growth in %
Column
Code
1992 238,780 100.0 - 89,856 100.0 - 132,532 100.0 - 461,168 100.0 -1993 359,259 116.1 16.1 150,590 130.3 30.3 220,481 131.0 31.0 730,330 123.1 23.11994 445,487 118.9 2.4 165,048 118.0 -9.4 284,858 139.7 6.6 895,394 124.6 1.31995 529,684 124.7 4.9 206,838 130.6 10.6 329,933 142.9 2.3 1,066,455 131.0 5.11996 594,907 127.5 2.2 261,298 150.0 14.9 420,773 165.7 15.9 1,276,978 142.7 8.91997 654,872 129.6 1.6 289,031 153.2 2.1 494,015 179.7 8.4 1,437,917 148.4 4.01998 720,371 132.1 2.0 308,850 151.8 -0.9 551,855 186.0 3.5 1,581,075 151.2 1.91999 790,867 136.6 3.4 340,106 157.6 3.8 627,297 199.2 7.1 1,758,269 158.4 4.82000 883,905 140.2 2.6 384,700 163.7 3.9 703,403 205.1 3.0 1,972,007 163.1 3.02001 1,000,885 146.4 4.4 412,283 161.7 -1.2 765,550 205.8 0.3 2,178,717 166.2 1.9 2000 Dec. 89,286 163.8 4.6 39,119 192.5 -1.4 57,221 193.0 -2.0 185,627 177.7 1.2 2001 Jan. 77,365 141.4 5.9 26,066 127.8 -1.3 57,629 193.6 -4.2 161,060 153.6 0.9 Feb. 80,077 144.7 6.9 27,567 133.6 5.5 60,679 201.5 1.3 168,323 158.7 4.6 Mar. 80,049 143.1 4.4 31,480 151.0 -0.6 60,766 199.7 -0.5 172,295 160.7 1.7 Apr. 82,036 145.7 6.6 39,856 189.9 0.9 59,869 195.5 -0.4 181,761 168.4 2.9 May 80,284 140.9 4.1 38,036 179.1 0.6 60,656 195.7 -3.5 178,976 163.9 0.7 Jun. 82,697 144.6 2.8 49,766 233.4 -5.2 80,280 258.0 9.2 212,743 194.1 3.0 Jul. 82,242 143.6 1.0 35,706 167.2 -3.1 61,882 198.5 -1.7 179,830 163.8 -0.8 Aug. 82,173 143.4 3.6 30,001 140.5 2.9 61,110 196.1 -4.2 173,284 157.8 0.6 Sep. 85,716 148.4 6.6 27,796 129.1 -2.6 64,671 205.8 2.0 178,183 160.9 3.4 Oct. 84,504 145.6 5.2 32,068 148.2 -3.2 65,232 206.6 2.0 181,803 163.5 2.4 Nov. 86,098 147.7 4.7 31,903 146.8 -5.9 66,287 209.0 -5.3 184,288 164.9 -1.0 Dec. 97,644 167.4 2.2 42,038 193.3 0.4 66,489 209.5 8.5 206,171 184.4 3.8 2002 Jan. 85,453 144.1 1.9 29,495 133.4 4.4 66,018 204.7 5.7 180,966 159.2 3.7 Feb. 89,102 149.0 3.0 28,987 130.0 -2.7 68,808 211.5 4.9 186,897 163.0 2.7
115 8
Source: Agency of RS for Payments, registered payments of enterprises and institutions.
129 10=1+4+71 2
Annual growth in %
3 4 76
Transfer receipts Total
Real
1992=100Annual
growth in %
Millions of Tolars
Real
1992=100Annual
growth in %
Millions of Tolars
Net Wages and Salaries Other receipts from employment
Real
1992=100Annual
growth in %
Millions of Tolars
Real
1992=100
Millions of Tolars
THE
REAL
SECTOR
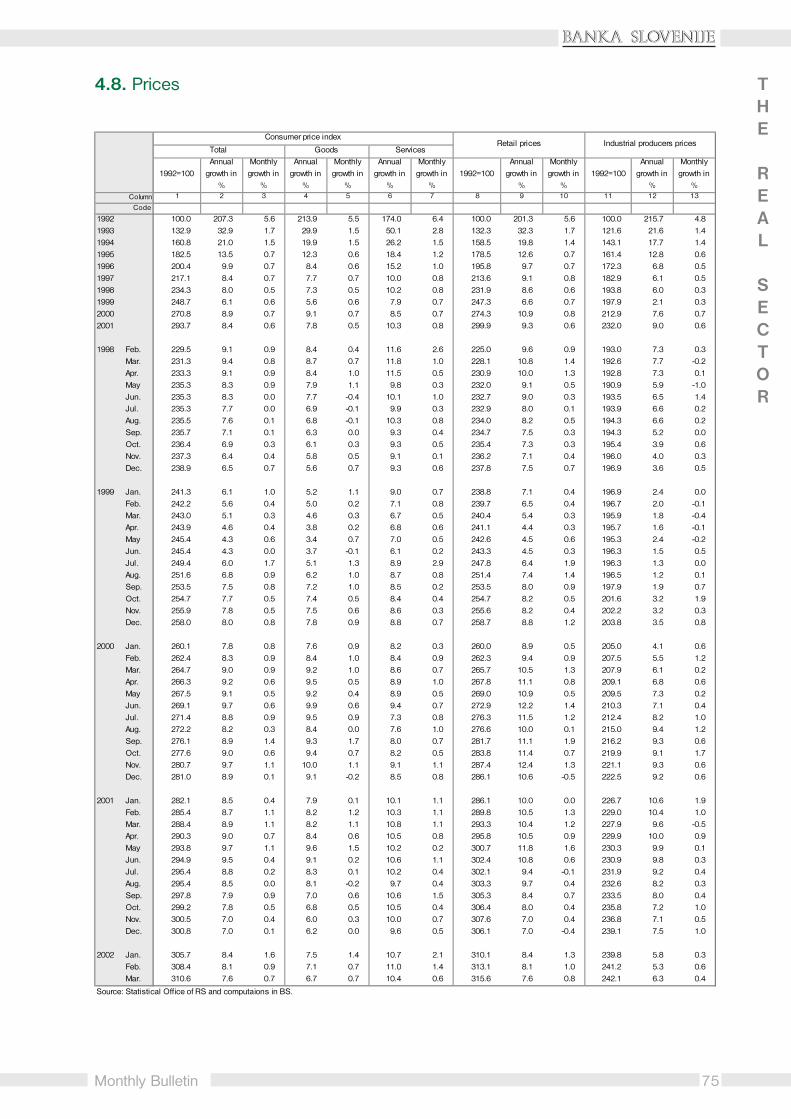
75
�������������
Monthly Bulletin
4.8. Prices
ColumnCode
1992 100.0 207.3 5.6 213.9 5.5 174.0 6.4 100.0 201.3 5.6 100.0 215.7 4.81993 132.9 32.9 1.7 29.9 1.5 50.1 2.8 132.3 32.3 1.7 121.6 21.6 1.41994 160.8 21.0 1.5 19.9 1.5 26.2 1.5 158.5 19.8 1.4 143.1 17.7 1.41995 182.5 13.5 0.7 12.3 0.6 18.4 1.2 178.5 12.6 0.7 161.4 12.8 0.61996 200.4 9.9 0.7 8.4 0.6 15.2 1.0 195.8 9.7 0.7 172.3 6.8 0.51997 217.1 8.4 0.7 7.7 0.7 10.0 0.8 213.6 9.1 0.8 182.9 6.1 0.51998 234.3 8.0 0.5 7.3 0.5 10.2 0.8 231.9 8.6 0.6 193.8 6.0 0.31999 248.7 6.1 0.6 5.6 0.6 7.9 0.7 247.3 6.6 0.7 197.9 2.1 0.32000 270.8 8.9 0.7 9.1 0.7 8.5 0.7 274.3 10.9 0.8 212.9 7.6 0.72001 293.7 8.4 0.6 7.8 0.5 10.3 0.8 299.9 9.3 0.6 232.0 9.0 0.6 1998 Feb. 229.5 9.1 0.9 8.4 0.4 11.6 2.6 225.0 9.6 0.9 193.0 7.3 0.3 Mar. 231.3 9.4 0.8 8.7 0.7 11.8 1.0 228.1 10.8 1.4 192.6 7.7 -0.2 Apr. 233.3 9.1 0.9 8.4 1.0 11.5 0.5 230.9 10.0 1.3 192.8 7.3 0.1 May 235.3 8.3 0.9 7.9 1.1 9.8 0.3 232.0 9.1 0.5 190.9 5.9 -1.0 Jun. 235.3 8.3 0.0 7.7 -0.4 10.1 1.0 232.7 9.0 0.3 193.5 6.5 1.4 Jul. 235.3 7.7 0.0 6.9 -0.1 9.9 0.3 232.9 8.0 0.1 193.9 6.6 0.2 Aug. 235.5 7.6 0.1 6.8 -0.1 10.3 0.8 234.0 8.2 0.5 194.3 6.6 0.2 Sep. 235.7 7.1 0.1 6.3 0.0 9.3 0.4 234.7 7.5 0.3 194.3 5.2 0.0 Oct. 236.4 6.9 0.3 6.1 0.3 9.3 0.5 235.4 7.3 0.3 195.4 3.9 0.6 Nov. 237.3 6.4 0.4 5.8 0.5 9.1 0.1 236.2 7.1 0.4 196.0 4.0 0.3 Dec. 238.9 6.5 0.7 5.6 0.7 9.3 0.6 237.8 7.5 0.7 196.9 3.6 0.5 1999 Jan. 241.3 6.1 1.0 5.2 1.1 9.0 0.7 238.8 7.1 0.4 196.9 2.4 0.0 Feb. 242.2 5.6 0.4 5.0 0.2 7.1 0.8 239.7 6.5 0.4 196.7 2.0 -0.1 Mar. 243.0 5.1 0.3 4.6 0.3 6.7 0.5 240.4 5.4 0.3 195.9 1.8 -0.4 Apr. 243.9 4.6 0.4 3.8 0.2 6.8 0.6 241.1 4.4 0.3 195.7 1.6 -0.1 May 245.4 4.3 0.6 3.4 0.7 7.0 0.5 242.6 4.5 0.6 195.3 2.4 -0.2 Jun. 245.4 4.3 0.0 3.7 -0.1 6.1 0.2 243.3 4.5 0.3 196.3 1.5 0.5 Jul. 249.4 6.0 1.7 5.1 1.3 8.9 2.9 247.8 6.4 1.9 196.3 1.3 0.0 Aug. 251.6 6.8 0.9 6.2 1.0 8.7 0.8 251.4 7.4 1.4 196.5 1.2 0.1 Sep. 253.5 7.5 0.8 7.2 1.0 8.5 0.2 253.5 8.0 0.9 197.9 1.9 0.7 Oct. 254.7 7.7 0.5 7.4 0.5 8.4 0.4 254.7 8.2 0.5 201.6 3.2 1.9 Nov. 255.9 7.8 0.5 7.5 0.6 8.6 0.3 255.6 8.2 0.4 202.2 3.2 0.3 Dec. 258.0 8.0 0.8 7.8 0.9 8.8 0.7 258.7 8.8 1.2 203.8 3.5 0.8 2000 Jan. 260.1 7.8 0.8 7.6 0.9 8.2 0.3 260.0 8.9 0.5 205.0 4.1 0.6 Feb. 262.4 8.3 0.9 8.4 1.0 8.4 0.9 262.3 9.4 0.9 207.5 5.5 1.2 Mar. 264.7 9.0 0.9 9.2 1.0 8.6 0.7 265.7 10.5 1.3 207.9 6.1 0.2 Apr. 266.3 9.2 0.6 9.5 0.5 8.9 1.0 267.8 11.1 0.8 209.1 6.8 0.6 May 267.5 9.1 0.5 9.2 0.4 8.9 0.5 269.0 10.9 0.5 209.5 7.3 0.2 Jun. 269.1 9.7 0.6 9.9 0.6 9.4 0.7 272.9 12.2 1.4 210.3 7.1 0.4 Jul. 271.4 8.8 0.9 9.5 0.9 7.3 0.8 276.3 11.5 1.2 212.4 8.2 1.0 Aug. 272.2 8.2 0.3 8.4 0.0 7.6 1.0 276.6 10.0 0.1 215.0 9.4 1.2 Sep. 276.1 8.9 1.4 9.3 1.7 8.0 0.7 281.7 11.1 1.9 216.2 9.3 0.6 Oct. 277.6 9.0 0.6 9.4 0.7 8.2 0.5 283.8 11.4 0.7 219.9 9.1 1.7 Nov. 280.7 9.7 1.1 10.0 1.1 9.1 1.1 287.4 12.4 1.3 221.1 9.3 0.6 Dec. 281.0 8.9 0.1 9.1 -0.2 8.5 0.8 286.1 10.6 -0.5 222.5 9.2 0.6 2001 Jan. 282.1 8.5 0.4 7.9 0.1 10.1 1.1 286.1 10.0 0.0 226.7 10.6 1.9 Feb. 285.4 8.7 1.1 8.2 1.2 10.3 1.1 289.8 10.5 1.3 229.0 10.4 1.0 Mar. 288.4 8.9 1.1 8.2 1.1 10.8 1.1 293.3 10.4 1.2 227.9 9.6 -0.5 Apr. 290.3 9.0 0.7 8.4 0.6 10.5 0.8 295.8 10.5 0.9 229.9 10.0 0.9 May 293.8 9.7 1.1 9.6 1.5 10.2 0.2 300.7 11.8 1.6 230.3 9.9 0.1 Jun. 294.9 9.5 0.4 9.1 0.2 10.6 1.1 302.4 10.8 0.6 230.9 9.8 0.3 Jul. 295.4 8.8 0.2 8.3 0.1 10.2 0.4 302.1 9.4 -0.1 231.9 9.2 0.4 Aug. 295.4 8.5 0.0 8.1 -0.2 9.7 0.4 303.3 9.7 0.4 232.6 8.2 0.3 Sep. 297.8 7.9 0.9 7.0 0.6 10.6 1.5 305.3 8.4 0.7 233.5 8.0 0.4 Oct. 299.2 7.8 0.5 6.8 0.5 10.5 0.4 306.4 8.0 0.4 235.8 7.2 1.0 Nov. 300.5 7.0 0.4 6.0 0.3 10.0 0.7 307.6 7.0 0.4 236.8 7.1 0.5 Dec. 300.8 7.0 0.1 6.2 0.0 9.6 0.5 306.1 7.0 -0.4 239.1 7.5 1.0 2002 Jan. 305.7 8.4 1.6 7.5 1.4 10.7 2.1 310.1 8.4 1.3 239.8 5.8 0.3 Feb. 308.4 8.1 0.9 7.1 0.7 11.0 1.4 313.1 8.1 1.0 241.2 5.3 0.6 Mar. 310.6 7.6 0.7 6.7 0.7 10.4 0.6 315.6 7.6 0.8 242.1 6.3 0.4
Monthly growth in
%
Monthly growth in
%1 2 3 9 13
Annual growth in
%1992=1001992=100
Annual growth in
%
Monthly growth in
%
Annual growth in
%
Monthly growth in
%
Annual growth in
%
Monthly growth in
%5 6
Annual growth in
%10 114 7 8
Source: Statistical Office of RS and computaions in BS.
12
Consumer price index
Total Goods ServicesRetail prices Industrial producers prices
1992=100
THE
REAL
SECTOR

76
�������������
Monthly Bulletin
5.1. General Government Revenues and ExpenditurePUBLIC
FINANCE
A. REVENUE AND EXPENDITURE
I. TOTAL REVENUE 1,397,903 1,590,017 1,726,724 1,967,783 * 43.1 1. Current revenue 1,390,982 1,579,255 1,695,040 1,937,388 * 42.4 1.1. Tax revenues 1,302,752 1,499,430 1,599,594 1,798,310 * 39.4 1.1.1. Taxes on income, profits and capital gains 252,936 273,818 311,429 357,877 7.8
- Personal income tax 213,342 231,641 259,634 289,102 6.3 - Corporate income tax 39,593 42,177 51,795 68,775 1.5 - Other taxes on income, profits and services 0 0 0 0 0.0
1.1.2. Taxes on payroll and work force 45,905 55,416 68,071 83,369 1.8 1.1.3. Social security contributions 448,398 496,371 552,574 620,920 * 13.6
- Employees 276,805 305,649 342,129 377,817 8.3 - Employers 142,649 157,206 172,980 188,937 * 4.1 - Other unallocable social security contributions 28,944 33,515 37,465 54,165 1.2
1.1.4. Taxes on property 27,722 26,597 26,513 32,964 0.7 1.1.5. Domestic taxes on goods and services 479,713 601,470 602,895 673,335 * 14.7 1.1.6. Taxes on international trade and transactions 47,291 45,657 38,089 29,607 0.6 1.1.7. Other taxes 787 100 23 238 0.0 1.2. Nontax revenues 88,230 79,825 95,447 139,078 * 3.0 1.2.1. Enterpreneurial and property income 24,186 23,522 27,619 65,222 * 1.4 1.2.2. Administrative fees and charges, nonindustrial and incidental sales 20,512 19,454 29,039 30,230 * 0.7 1.2.3. Fines and forfeits 5,576 6,793 7,696 7,913 0.2 1.2.4. Other nontax revenues 37,956 30,055 31,093 35,713 * 0.8 2. Capital revenue 4,471 6,430 9,674 10,203 * 0.2 3. Grants 2,449 4,332 7,421 10,788 * 0.2 4. Transfers 0 0 14,588 9,404 * 0.2 II. TOTAL EXPENDITURE 1,423,494 1,613,314 1,781,444 2,030,903 * 44.5 1. Current expenditure 1,283,131 1,445,545 1,610,500 1,831,945 * 40.1 1.1. Expenditure on goods and services 589,544 646,428 723,456 842,182 * 18.4 1.1.1. - Wages and salaries 312,605 350,639 387,501 456,351 * 10.0 1.1.2. - Other purchases of goods and services 276,939 295,789 335,955 385,831 * 8.4 1.2. Interest payments 41,721 50,946 60,956 72,809 * 1.6 1.2.1. - Domestic interest payments 28,237 31,506 34,938 37,939 * 0.8 1.2.2. - Interest payments abroad 13,484 19,440 26,018 34,870 0.8 1.3. Subsidies and other current transfers 641,153 737,619 813,491 907,943 * 19.9 1.3.1. Subsidies 49,239 63,088 58,951 63,146 * 1.4 1.3.2. Transfers to households 573,820 648,071 731,077 821,356 * 18.0 1.3.3. Transfers to nonprofit institutions 8,489 14,598 16,883 18,863 * 0.4 1.3.4. Other domestic transfers 4,569 6,648 2,757 -844 * 0.0 1.3.5. Transfers abroad 5,035 5,214 3,822 5,421 0.1 1.4. Current reserves 10,713 10,552 12,597 9,011 * 0.2 2. Capital expenditure 140,364 167,770 170,945 198,958 * 4.4
NONFINANCIAL BALANCE (A: I.-II.) -25,591 -23,297 -54,720 -63,120 * -1.4
B. LENDING MINUS REPAYMENTS
I. REPAYMENT OF GIVEN LOANS AND EQUITY SOLD 26635 16,607 19,714 27,019 * 0.6 1. Repayment of given loans 1,695 6,603 15,738 21,091 * 0.5 2. Equity sold 11,340 616 698 2,622 0.1 3. Privatization receipts 13,600 9,388 3,279 3,306 0.1 II. LENDING AND ACQUISITION OF EQUITY 22,726 17,814 14,672 13,524 * 0.3 1. Loans given 3,494 5,902 7,236 7,754 * 0.2 2. Acquisition of equity 5,585 4,283 2,427 4,020 * 0.1 3. Privatization receipts spending 13,646 7,629 5,009 1,734 0.0
LENDING MINUS REPAYMENTS BALANCE (B) 3,909 -1,207 5,042 13,495 * 0.3
OVERALL BALANCE (A + B) -21,682 -24,504 -49,678 -49,625 * -1.1
C. TOTAL FINANCING
I. Domestic financing 24,341 -18,276 -19,001 53,365 * 1.2 1. Domestic drawings 72,036 47,688 98,225 298,462 * 6.5 2. Domestic amortization 47,695 65,964 117,226 245,097 * 5.4 II. Financing abroad 11,318 61,370 69,866 19,817 0.4 1. Drawings abroad 44,487 75,953 84,327 128,219 2.8 2. Amortization abroad 33,169 14,583 14,461 108,402 2.4
TOTAL FINANCING BALANCE (C) 35,659 43,094 50,865 73,181 * 1.6
Change in cash, deposits and statistical error -13,976 18,591 1,186 23,556 * 0.5
source: Ministry of Finance
Millions of Tolars at current prices
Outturn Share in GDP
2001
In %
20011998 1999 2000

77
�������������
Monthly Bulletin
5.2. General Government Revenues
5.3. General Government Expenditure
PUBLIC
FINANCE
Column
Code
1992 69,278 5,943 0 189,611 2,834 111,136 32,460 29,699 440,9621993 98,110 6,660 0 274,822 4,304 167,253 51,463 38,283 640,8951994 125,832 14,994 5,919 317,417 4,254 240,014 64,267 30,863 803,5601995 147,429 12,941 3,829 363,000 12,343 298,159 78,176 42,310 958,1861996 174,639 22,291 18,259 376,184 14,628 349,451 76,593 59,771 1,091,8151997 194,062 33,562 37,491 400,630 19,589 412,094 58,463 66,697 1,222,5871998 213,342 39,593 45,905 448,398 27,722 479,713 47,291 95,937 1,397,9031999 231,641 42,177 55,416 496,371 26,597 601,470 45,657 90,688 1,590,0172000 259,634 51,795 68,071 552,574 26,513 602,895 38,089 127,153 1,726,7242001 289,102 68,775 83,369 620,920 * 32,964 673,335 * 29,607 169,711 * 1,967,783 *
2000 Nov. 23,455 4,096 6,097 47,742 3,578 65,278 3,451 9,585 163,281 Dec. 29,201 4,133 8,162 56,284 2,032 103,445 3,562 22,270 229,088 Jan. 22,379 3,885 6,150 47,618 1,438 4,479 3,355 7,691 96,9942001 Feb. 21,823 3,889 6,552 49,153 1,979 35,673 2,079 8,382 129,531 Mar. 23,647 6,973 6,442 49,807 1,689 49,594 2,127 17,139 157,418 Apr. 25,315 14,862 6,672 49,859 2,137 60,284 2,308 11,770 173,209 May 26,782 6,292 6,752 50,902 3,593 52,280 2,380 8,719 157,701 Jun. 24,170 4,792 6,902 51,636 3,474 38,551 2,507 9,935 141,966 Jul. 22,303 4,399 6,791 50,839 2,406 70,561 2,536 17,267 177,102 Avg. 21,269 4,417 6,555 50,587 4,085 55,970 2,772 8,277 153,932 Sep. 22,442 4,509 6,906 51,288 2,000 33,721 1,838 9,706 132,411 Oct. 22,030 4,906 6,977 52,664 3,343 67,823 2,344 13,861 173,948 Nov. 25,318 4,829 7,218 53,639 4,350 62,512 2,729 11,436 * 172,032 *
Dec. 31,623 5,022 9,450 62,926 * 2,471 141,889 * 2,629 45,529 * 301,540 *
2002 Jan. 23,686 4,951 7,414 52,510 1,432 -15,404 2,472 9,931 86,992
Millions of Tolars Personal
income taxCorporate
income taxTaxes on wage
bills etc.
Social insurance
contributions
4
Property taxesDomestic taxes on goods and
services
Taxes on international
trade and transactions
9 = 1 + … + 85 6 7 8
Other revenues Total revenue
Source: Ministry of finance.
1 2 3
Column
Code
1992 187,033 5,029 29,784 167,836 2,077 2,068 34,698 428,524 12,4381993 268,676 18,057 37,575 246,811 5,241 2,057 49,946 628,363 12,5321994 324,973 26,908 36,154 327,363 6,710 1,015 80,232 803,355 2061995 394,525 25,598 41,747 391,785 9,090 1,225 93,304 957,273 9131996 454,044 31,121 34,547 444,184 10,528 1,783 107,379 1,083,586 8,2301997 527,919 34,686 39,961 519,109 12,077 1,736 121,181 1,256,668 -34,0811998 589,544 41,721 49,239 573,820 18,093 10,713 140,364 1,423,494 -25,5911999 646,429 50,946 63,088 648,071 26,458 10,552 167,770 1,613,314 -23,2972000 723,456 60,956 58,951 731,077 23,463 12,597 170,945 1,781,444 -54,7202001 842,182 * 72,809 * 63,146 * 821,356 * 23,441 * 9,011 * 198,958 * 2,030,903 * -63,120 *
2000 Nov. 63,228 1,894 7,931 66,592 2,006 897 18,531 161,079 2,201 Dec. 79,111 3,656 16,321 61,952 2,580 2,650 38,557 204,828 24,260 2001 Jan. 54,543 4,566 195 62,223 208 95 7,118 128,949 -31,955 Feb. 63,337 4,479 4,162 65,576 2,446 -20 9,295 149,274 -19,743 Mar. 65,980 6,848 3,008 65,740 952 64 14,039 156,631 787 Apr. 67,875 7,804 6,723 64,498 2,833 1,677 12,711 164,121 9,088 May 70,626 20,490 4,227 65,928 1,915 623 10,432 174,241 -16,540 *
Jun. 80,274 5,911 5,332 84,959 647 649 13,362 191,135 -49,169 Jul. 72,440 4,651 3,486 66,133 3,091 616 17,450 167,867 9,236 *
Avg. 66,898 4,926 4,285 65,480 2,078 697 15,674 160,038 -6,107 Sep. 67,745 1,914 3,016 68,503 1,815 647 14,361 158,001 -25,590 Oct. 73,087 5,250 3,882 70,374 1,786 646 16,580 171,604 2,344 *
Nov. 72,775 2,438 9,134 70,881 2,247 2,401 19,956 179,832 -7,800 *
Dec. 86,603 * 3,533 * 15,696 * 71,059 * 3,423 * 917 * 47,981 * 229,211 * 72,329 *
2002 Jan. 66,360 6,270 1,500 70,924 -1,749 810 13,095 933 -71,152
Transfers to households
5 6 7 81 2 3 4
Source: Ministry of Finance.
Millions of Tolars
9 = 9 (tab. 5.2) - 8
Final consumption expenditures
Interst payments Subsidies Other transfersCurrent
reservesCapital
expenditureNonfinancial
balanceTotal
expenditure

78
�������������
Monthly Bulletin
5.4. General Government Financing
5.5. Debt of Republic of Slovenia
Column
Code
1992 53 9,352 9,298 2,741 5,749 -3,009 2,885 2,042 844 -11,463 9741993 477 4,521 4,044 4,231 6,803 -2,572 12,965 4,489 8,475 1,859 14,3911994 347 4,514 4,167 1,479 9,008 -7,529 14,102 8,540 5,562 -6,134 -5,9281995 9,318 7,050 -2,268 762 12,517 -11,755 18,844 12,569 6,275 -3,211 -2,3041996 11,297 14,148 2,851 1,432 13,365 -11,933 44,163 21,063 23,100 8,316 16,5441997 16,310 16,614 304 26,387 14,532 11,856 39,208 19,109 20,099 31,650 -2,4311998 26,635 22,726 -3,909 72,036 47,695 24,341 44,487 33,169 11,318 39,568 13,9761999 16,607 17,814 1,207 47,689 65,964 -18,275 75,954 14,584 61,370 41,887 18,5892000 19,714 14,672 -5,042 98,225 117,226 -19,001 84,327 14,461 69,866 55,907 1,1862001 27,019 * 13,524 * -13,495 * 298,462 * 245,097 * 53,365 * 128,219 108,402 19,817 86,677 * 23,556 *
2000 Nov. 211 1,432 1,221 12,951 804 12,147 73 327 -254 10,672 12,873 Dec. 10,819 1,878 -8,940 -474 27,833 -28,307 575 4,710 -4,135 -23,501 759 2001 Jan. 1,802 1,620 -182 29,166 15,880 13,287 4,547 1,954 2,593 16,063 -15,892
Feb. 262 817 555 20,163 12,161 8,002 21,344 836 20,508 27,955 8,212 Mar. 421 355 -65 24,231 18,504 5,726 2,072 4,848 -2,775 3,016 3,804 Apr. 905 2,066 1,161 20,485 21,209 -724 97,172 395 96,777 94,892 103,980 *
May 2,402 816 -1,586 10,968 22,681 -11,713 0 337 -337 -10,464 -27,004 *
Jun. 2,411 216 -2,195 34,990 11,644 23,346 587 5,385 -4,798 20,743 -28,426 Jul. 585 1,693 1,109 21,309 15,470 5,840 37 2,049 -2,012 2,718 11,954 *
Avg. 421 302 -118 23,529 14,950 8,579 -506 81,791 -82,297 -73,600 -79,706 *
Sep. 621 357 -263 15,961 18,345 -2,384 2,331 4,767 -2,436 -4,557 -30,147 Oct. 1,074 1,401 328 58,722 37,354 21,368 0 411 -411 20,629 22,973 *
Nov. 362 743 380 20,811 21,254 -443 214 345 -130 -953 -8,754 *
Dec. 15,755 * 3,137 * -12,618 * 18,128 * 35,646 * -17,518 * 419 5,284 -4,865 -9,765 * 62,563 *
2002 Jan. 781 766 -15 59,166 38,516 20,650 0 2,179 -2,179 18,486 -52,666
9 = 7 - 8 10 = 6 + 9 - 3 11
Net
Total financing balance
Change in cash,
deposits and statistical
error
81 2 3 = 1 - 2 4
Drawings Net Drawings
5 6 = 4 - 5 7
Source: Ministry of Finance.
Amortisation Amortisation
Lending minus repayments Domestic financing Financing abroadMillions of Tolars Repayment of
given loans and equity
sold
Given loans and
acquisition of equity
Net
Column
Code
1993 31.Dec 31,784 3,680 183,338 1,659 43,304 263,765 39,255 - 39,255 303,0201994 31.Dec 35,268 929 211,825 1,361 41,583 290,966 52,016 - 52,016 342,9821995 31.Dec 20,456 677 98,340 0 226,537 346,010 72,112 - 72,112 418,1221996 31.Dec 5,123 869 106,690 0 242,817 355,499 87,448 137,751 225,199 580,6981997 31.Dec 6,059 442 43,353 0 349,766 399,620 84,805 188,852 273,657 673,2771998 31.Dec 1,818 625 81,273 0 391,817 475,533 92,304 203,460 295,764 771,2971999 31.Dec 5,680 238 82,473 0 410,084 498,475 94,536 300,281 394,817 893,2922000 31.Dec 13,040 322 75,824 0 415,887 505,073 98,222 410,057 508,279 * 1,013,352 *
2001 31.Dec 768 7,935 96,187 0 530,252 635,142 122,373 471,360 531,020 1,228,875
1998 31.Dec 1,818 625 81,273 0 391,817 475,533 92,304 203,460 295,764 771,297 1999 31.mar. 1,518 766 94,987 0 401,209 498,480 95,878 287,366 383,244 881,724
30.jun. 14,289 856 82,333 0 407,050 504,528 93,492 294,948 388,440 892,96830.sep. 9,518 930 90,818 0 402,387 503,653 92,308 296,696 389,004 892,65731.Dec 5,680 238 82,473 0 410,084 498,475 94,536 300,281 394,817 893,292
2000 31.mar. 4,600 310 84,378 0 422,648 511,937 110,073 391,514 501,587 1,013,524
30.jun. 400 146 79,346 0 439,281 519,173 100,268 397,654 497,922 1,017,09530.sep. 11,600 240 84,060 0 431,813 527,713 104,671 410,387 515,058 1,042,77131.Dec 13,040 322 75,824 0 415,887 505,073 98,222 410,057 508,280 1,013,353
2001 31.mar. 4,373 413 95,080 0 449,068 548,934 108,360 443,523 551,883 1,100,818 30.jun. 6,035 526 80,260 0 478,114 564,935 110,433 547,994 658,427 1,223,362 30.sep. 5,478 169 83,340 0 488,442 577,429 102,394 468,592 570,986 1,148,415
31.Dec 768 7,935 96,187 0 530,252 635,142 122,373 471,360 531,020 1,228,875
10 = 6 + 9
Total debt
1 2 3 4 5 6 = 1 … 5 7 8
Total Loans Bonds Total
Source: Ministry of Finance.
Debt incurred in domestic market Debt incurred abroadMillions of Tolars
Public sectorBank of Slovenia
BanksOther
domestic creditors
Negotiable securities
9 = 7 + 8

79
BANKA SLOVENIJE
Monthly Bulletin
BANKS AND SAVINGS BANKSAND REPRESENTATIVE OFFICESOF FOREIGN BANKS IN THEREPUBLIC OF SLOVENIA
BANKS
AND
SAVING
BANKS
IN
SLOVENIA
as at March 31, 2002
I. Banks
ABANKA d.d. LJUBLJANA1517 LJUBLJANATel.: +386 (1) 471 81 00
The bank has obtained an authorisation for the following other financial services:- factoring- issuing of guarantees and other commitments- lending, including consumer credits, mortgage credits, and financing of commercial transactions- trading in foreign means of payment, including foreign exchange transactions- trading in financial derivatives- collection, analysis and provision of information on the credit-worthiness of legal persons- issuing and administering of other means of payment (e.g., debit and credit cards, travellers’
cheques, bankers‘ drafts)- safe custody services- services in connection with securities, in accordance with the law governing the securities market- administering pension funds in accordance with the law governing pension funds- performance of payment services.
BANK AUSTRIA CREDITANSTALT d.d. LJUBLJANAŠmartinska cesta 1401000 LJUBLJANATel.: +386 (1) 587 66 00
The bank has obtained an authorisation for the following other financial services:- factoring- issuing of guarantees and other commitments- lending, including consumer credits, mortgage credits, and financing of commercial transactions- trading in foreign means of payment, including foreign exchange transactions- trading in financial derivatives- issuing and administering of other means of payment (e.g., debit and credit cards, travellers’
cheques, bankers‘ drafts)- services in connection with securities, in accordance with the law governing the securities market- performance of payment services.

80
BANKA SLOVENIJE
Monthly Bulletin
BANKS
AND
SAVING
BANKS
IN
SLOVENIA
BANKA CELJE d.d.bančna skupina Nove Ljubljanske bankeVodnikova 23000 CELJETel.: +386 (3) 543 10 00
The bank has obtained an authorisation for the following other financial services:- factoring- issuing of guarantees and other commitments- lending, including consumer credits, mortgage credits, and financing of commercial transactions- trading in foreign means of payment, including foreign exchange transactions- trading in financial derivatives- issuing and administering of other means of payment (e.g., debit and credit cards, travellers’
cheques, bankers‘ drafts)- safe custody services- performance of payment services.
BANKA KOPER d.d.6502 KOPERTel.: +386 (5) 665 11 00
The bank has obtained an authoriation for the following other financial services:- factoring- issuing of guarantees and other commitments- lending, including consumer credits, mortgage credits, and financing of commercial transactions- trading in foreign means of payment, including foreign exchange transactions- trading in financial derivatives- issuing and administering of other means of payment (e.g., debit and credit cards, travellers’
cheques, bankers‘ drafts)- safe custody services- services in connection with securities, in accordance with the law governing the securities market- administering pension funds in accordance with the law governing pension funds- performance of payment services.
BANKA VIPA d.d.Erjavčeva 25000 NOVA GORICATel.: +386 (5) 338 50 00
The bank has obtained an authorisation for the following other financial services:- factoring- issuing of guarantees and other commitments- lending, including consumer credits, mortgage credits, and financing of commercial transactions;- trading in foreign means of payment, including foreign exchange transactions- trading in financial derivatives- collection, analysis and provision of information on the credit-worthiness of legal persons- issuing and administering of other means of payment (e.g., debit and credit cards, travellers’
cheques, bankers‘ drafts)- safe custody services- mediation in the conclusion of loan and credit transactions- services in connection with securities, in accordance with the law governing the securities market;- performance of payment services.
FACTOR BANKA d.d.Železna c.161000 LJUBLJANATel.: +386 (1) 431 11 36
The bank has obtained an authorisation for the following other financial services:- factoring- issuing of guarantees and other commitments- lending, including consumer credits, mortgage credits, and financing of commercial transactions- trading in foreign means of payment, including foreign exchange transactions- trading in financial derivatives- collection, analysis and provision of information on the credit-worthiness of legal persons- issuing and administering of other means of payment (e.g., debit and credit cards, travellers’
cheques, bankers‘ drafts)- services in connection with securities, in accordance with the law governing the securities market- administering pension funds in accordance with the law governing pension funds- performance of payment services.

81
BANKA SLOVENIJE
Monthly Bulletin
BANKS
AND
SAVING
BANKS
IN
SLOVENIA
GORENJSKA BANKA, d.d., KRANJBleiweisova ul. 14000 KRANJTel.: +386 (4) 208 40 00
The bank has obtained an authorisation for the following other financial services:- factoring- issuing of guarantees and other commitments- lending, including consumer credits, mortgage credits, and financing of commercial transactions- trading in foreign means of payment, including foreign exchange transactions- issuing and administering of other means of payment (e.g., debit and credit cards, travellers’
cheques, bankers‘ drafts)- safe custody services- services in connection with securities, in accordance with the law governing the securities market- administering pension funds in accordance with the law governing pension funds- performance of payment services.
HYPO ALPE - ADRIA - BANK d.d.Trg Osvobodilne fronte 121000 LJUBLJANATel.: +386 (1) 300 44 00
The bank has obtained an authorisation for the following other financial services:- factoring- issuing of guarantees and other commitments- lending, including consumer credits, mortgage credits, and financing of commercial transactions- trading in foreign means of payment, including foreign exchange transactions- issuing and administering of other means of payment (e.g., debit and credit cards, travellers’
cheques, bankers‘ drafts)- safe custody services- performance of payment services.
KOROŠKA BANKA d.d., SLOVENJ GRADEC,bančna skupina Nove Ljubljanske bankeGlavni trg 302380 SLOVENJ GRADECTel.: +386 (2) 884 91 11
The bank has obtained an authorisation for the following other financial services:- factoring- issuing of guarantees and other commitments- lending, including consumer credits, mortgage credits, and financing of commercial transactions- trading in foreign means of payment, including foreign exchange transactions- issuing and administering of other means of payment (e.g., debit and credit cards, travellers’
cheques, bankers‘ drafts)- safe custody services- performance of payment services.
KREKOVA BANKA d.d. MARIBORSlomškov trg 182000 MARIBORTel.: +386 (2) 229 31 00
The bank has obtained an authorisation for the following other financial services:- factoring- issuing of guarantees and other commitments- lending, including consumer credits, mortgage credits, and financing of commercial transactions- trading in foreign means of payment, including foreign exchange transactions- issuing and administering of other means of payment (e.g., debit and credit cards, travellers’
cheques, bankers‘ drafts)- safe custody services- services in connection with securities, in accordance with the law governing the securities market- performance of payment services.
NOVA KREDITNA BANKA MARIBOR d.d.2505 MARIBORTel.: +386 (2) 229 22 90
The bank has obtained an authorisation for the following other financial services:- factoring- issuing of guarantees and other commitments- lending, including consumer credits, mortgage credits, and financing of commercial transactions
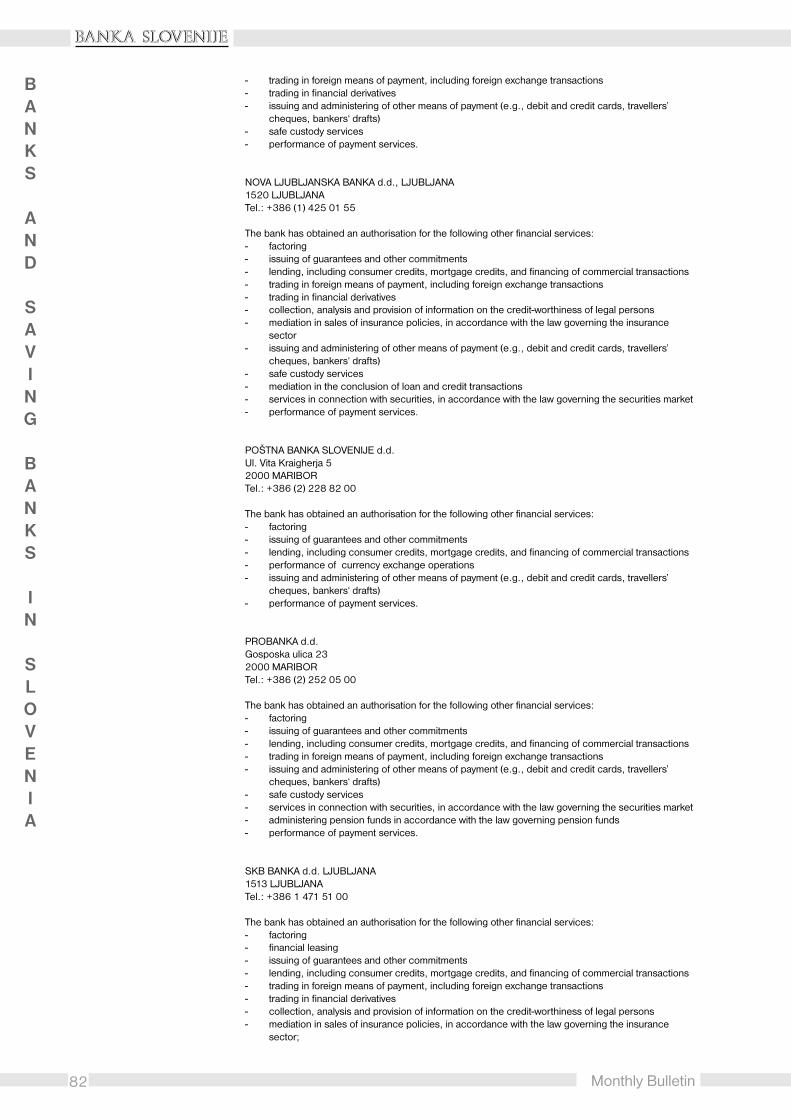
82
BANKA SLOVENIJE
Monthly Bulletin
BANKS
AND
SAVING
BANKS
IN
SLOVENIA
- trading in foreign means of payment, including foreign exchange transactions- trading in financial derivatives- issuing and administering of other means of payment (e.g., debit and credit cards, travellers’
cheques, bankers‘ drafts)- safe custody services- performance of payment services.
NOVA LJUBLJANSKA BANKA d.d., LJUBLJANA1520 LJUBLJANATel.: +386 (1) 425 01 55
The bank has obtained an authorisation for the following other financial services:- factoring- issuing of guarantees and other commitments- lending, including consumer credits, mortgage credits, and financing of commercial transactions- trading in foreign means of payment, including foreign exchange transactions- trading in financial derivatives- collection, analysis and provision of information on the credit-worthiness of legal persons- mediation in sales of insurance policies, in accordance with the law governing the insurance
sector- issuing and administering of other means of payment (e.g., debit and credit cards, travellers’
cheques, bankers‘ drafts)- safe custody services- mediation in the conclusion of loan and credit transactions- services in connection with securities, in accordance with the law governing the securities market- performance of payment services.
POŠTNA BANKA SLOVENIJE d.d.Ul. Vita Kraigherja 52000 MARIBORTel.: +386 (2) 228 82 00
The bank has obtained an authorisation for the following other financial services:- factoring- issuing of guarantees and other commitments- lending, including consumer credits, mortgage credits, and financing of commercial transactions- performance of currency exchange operations- issuing and administering of other means of payment (e.g., debit and credit cards, travellers’
cheques, bankers‘ drafts)- performance of payment services.
PROBANKA d.d.Gosposka ulica 232000 MARIBORTel.: +386 (2) 252 05 00
The bank has obtained an authorisation for the following other financial services:- factoring- issuing of guarantees and other commitments- lending, including consumer credits, mortgage credits, and financing of commercial transactions- trading in foreign means of payment, including foreign exchange transactions- issuing and administering of other means of payment (e.g., debit and credit cards, travellers’
cheques, bankers‘ drafts)- safe custody services- services in connection with securities, in accordance with the law governing the securities market- administering pension funds in accordance with the law governing pension funds- performance of payment services.
SKB BANKA d.d. LJUBLJANA1513 LJUBLJANATel.: +386 1 471 51 00
The bank has obtained an authorisation for the following other financial services:- factoring- financial leasing- issuing of guarantees and other commitments- lending, including consumer credits, mortgage credits, and financing of commercial transactions- trading in foreign means of payment, including foreign exchange transactions- trading in financial derivatives- collection, analysis and provision of information on the credit-worthiness of legal persons- mediation in sales of insurance policies, in accordance with the law governing the insurance
sector;

83
BANKA SLOVENIJE
Monthly Bulletin
BANKS
AND
SAVING
BANKS
IN
SLOVENIA
- issuing and administering of other means of payment (e.g., debit and credit cards, travellers’cheques, bankers‘ drafts)
- safe custody services- mediation in the conclusion of loan and credit transactions- services in connection with securities, in accordance with the law governing the securities market- performance of payment services.
SLOVENSKA INVESTICIJSKA BANKA d.d.Čopova 381101 LJUBLJANATel.: +386 (1) 242 03 00
The bank has obtained an authorisation for the following other financial services:- factoring- financial leasing- issuing of guarantees and other commitments- lending, including consumer credits, mortgage credits, and financing of commercial transactions- trading in foreign means of payment, including foreign exchange transactions- issuing and administering of other means of payment (e.g., debit and credit cards, travellers’
cheques, bankers‘ drafts)- safe custody services- performance of payment services.
SLOVENSKA ZADRUŽNA KMETIJSKA BANKA d.d., LJUBLJANAKolodvorska 91000 LJUBLJANATel.: +386 (1) 472 71 00
The bank has obtained an authorisation for the following other financial services:- factoring- issuing of guarantees and other commitments- lending, including consumer credits, mortgage credits, and financing of commercial transactions- trading in foreign means of payment, including foreign exchange transactions- collection, analysis and provision of information on the credit-worthiness of legal persons- issuing and administering of other means of payment (e.g., debit and credit cards, travellers’
cheques, bankers‘ drafts)- services in connection with securities, in accordance with the law governing the securities market- performance of payment services.
VOLKSBANK - LJUDSKA BANKA d.d.Dunajska 128 a1000 LJUBLJANATel.: +386 (1) 530 74 00
The bank has obtained an authoriation for the following other financial services:- factoring- issuing of guarantees and other commitments- lending, including consumer credits, mortgage credits, and financing of commercial transactions- trading in foreign means of payment, including foreign exchange transactions- trading in financial derivatives- issuing and administering of other means of payment (e.g., debit and credit cards, travellers’
cheques, bankers‘ drafts)- performance of payment services.
BANKA DOMŽALE d.d., DOMŽALE,bančna skupina Nove Ljubljanske bankeLjubljanska cesta 621230 DOMŽALETel.: +386 (1) 724 53 00
The bank has obtained an authorisation for the following other financial services:- factoring- issuing of guarantees and other commitments- lending, including consumer credits, mortgage credits, and financing of commercial transactions- trading in foreign means of payment, including foreign exchange transactions- issuing and administering of other means of payment (e.g., debit and credit cards, travellers’
cheques, bankers‘ drafts)- safe custody services- performance of payment services.

84
BANKA SLOVENIJE
Monthly Bulletin
BANKS
AND
SAVING
BANKS
IN
SLOVENIA
BANKA ZASAVJE d.d., TRBOVLJE,bančna skupina Nove Ljubljanske bankeTrg revolucije 25c1420 TRBOVLJETel.: +386 (3) 562 12 33
The bank has obtained an authorisation for the following other financial services:- factoring- issuing of guarantees and other commitments- lending, including consumer credits, mortgage credits, and financing of commercial transactions- trading in foreign means of payment, including foreign exchange transactions- issuing and administering of other means of payment (e.g., debit and credit cards, travellers’
cheques, bankers‘ drafts)- safe custody services- performance of payment services.
Branch office:
KÄRNTNER SPARKASSE AG, CELOVEC,PODRUŽNICA V SLOVENIJIDunajska 631000 LJUBLJANATel.: +386 (1) 309 23 99
The branch office has obtained an authorisation for the following other financial services:- issuing of guarantees and other commitments- collection, analysis and provision of information on the credit-worthiness of legal persons- mediation in the conclusion of loan and credit transactions,- performance of payment services.
II. Savings banks
DELAVSKA HRANILNICA d.d. LJUBLJANADalmatinova 41000 LJUBLJANATel.: +386 (1) 300 02 00
The savings bank has obtained an authorisation for the following other financial services:- issuing of guarantees and other commitments- lending, including consumer credits, mortgage credits, and financing of commercial transactions- trading in foreign means of payment, including foreign exchange transactions- issuing and administering of other means of payment (e.g., debit and credit cards, travellers’
cheques, bankers‘ drafts)- performance of payment services.
LLT HRANILNICA IN POSOJILNICA MURSKA SOBOTA d.d.Staneta Rozmana 11/a9000 MURSKA SOBOTATel.: +386 (2) 527 18 00
The savings bank has obtained an authorisation for the following other financial services:- issuing of guarantees and other commitments- lending, including consumer credits, mortgage credits, and financing of commercial transactions- trading in foreign means of payment, including foreign exchange transactions- issuing and administering of other means of payment (e.g., debit and credit cards, travellers’
cheques, bankers‘ drafts).
HRANILNICA LON d.d., KRANJBleiweisova ul. 24000 KRANJTel.: +386 (4) 280 07 77
The savings bank has obtained an authorisation for the following other financial services:- factoring- issuing of guarantees and other commitments- lending, including consumer credits, mortgage credits, and financing of commercial transactions- trading in foreign means of payment, including foreign exchange transactions- issuing and administering of other means of payment (e.g., debit and credit cards, travellers’
cheques, bankers‘ drafts)
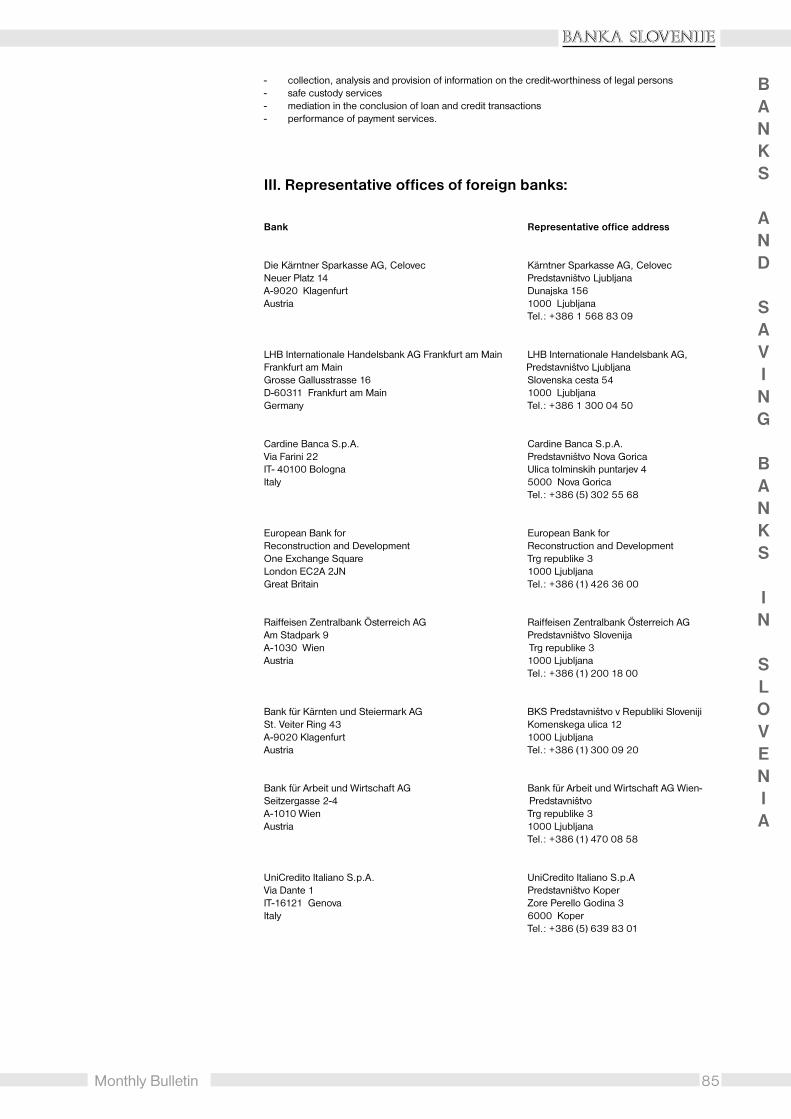
85
BANKA SLOVENIJE
Monthly Bulletin
BANKS
AND
SAVING
BANKS
IN
SLOVENIA
- collection, analysis and provision of information on the credit-worthiness of legal persons- safe custody services- mediation in the conclusion of loan and credit transactions- performance of payment services.
III. Representative offices of foreign banks:
Bank Representative office address
Die Kärntner Sparkasse AG, Celovec Kärntner Sparkasse AG, CelovecNeuer Platz 14 Predstavništvo LjubljanaA-9020 Klagenfurt Dunajska 156Austria 1000 Ljubljana
Tel.: +386 1 568 83 09
LHB Internationale Handelsbank AG Frankfurt am Main LHB Internationale Handelsbank AG,Frankfurt am Main Predstavništvo LjubljanaGrosse Gallusstrasse 16 Slovenska cesta 54D-60311 Frankfurt am Main 1000 LjubljanaGermany Tel.: +386 1 300 04 50
Cardine Banca S.p.A. Cardine Banca S.p.A.Via Farini 22 Predstavništvo Nova GoricaIT- 40100 Bologna Ulica tolminskih puntarjev 4Italy 5000 Nova Gorica
Tel.: +386 (5) 302 55 68
European Bank for European Bank forReconstruction and Development Reconstruction and DevelopmentOne Exchange Square Trg republike 3London EC2A 2JN 1000 LjubljanaGreat Britain Tel.: +386 (1) 426 36 00
Raiffeisen Zentralbank Österreich AG Raiffeisen Zentralbank Österreich AGAm Stadpark 9 Predstavništvo SlovenijaA-1030 Wien Trg republike 3Austria 1000 Ljubljana
Tel.: +386 (1) 200 18 00
Bank für Kärnten und Steiermark AG BKS Predstavništvo v Republiki SlovenijiSt. Veiter Ring 43 Komenskega ulica 12A-9020 Klagenfurt 1000 LjubljanaAustria Tel.: +386 (1) 300 09 20
Bank für Arbeit und Wirtschaft AG Bank für Arbeit und Wirtschaft AG Wien-Seitzergasse 2-4 PredstavništvoA-1010 Wien Trg republike 3Austria 1000 Ljubljana
Tel.: +386 (1) 470 08 58
UniCredito Italiano S.p.A. UniCredito Italiano S.p.AVia Dante 1 Predstavništvo KoperIT-16121 Genova Zore Perello Godina 3Italy 6000 Koper
Tel.: +386 (5) 639 83 01

86
BANKA SLOVENIJE
Monthly Bulletin
BANKS
AND
SAVING
BANKS
IN
SLOVENIA
��
�������������
Monthly Bulletin
������������������
NOTES
ON
METHODOLOGY
General Notes
Sectors
External sector consists of non-residents.Non-residents of the Republic of Slovenia are defined as:· natural persons without a permanent address in Slovenia, except those who have the official permit to
work in Slovenia for 6 months or more;· natural persons with a permanent address in Slovenia which have an official permit to work or live
abroad;· legal persons with registered seat abroad, except diplomatic, consular and other entities financed by
Slovenian government, Slovenian citizens employed there and members of their families;· diplomatic, consular and other representative bodies of foreign governments and international
organizations together with citizens of other countries employed there, and members of their families;· representative offices and branches of foreign enterprises located in Slovenia except for their permanent
production activity in Slovenia;· representative offices and branches of Slovenian enterprises located abroad for their permanent
production activities abroad.Residents of the Republic of Slovenia are all others not listed above.
Domestic sector is broken down to monetary and non-monetary sector.Monetary sector consists of the Bank of Slovenia and commercial banks. Commercial banks (hereinafter“banks”) are deposit money banks that accept sight deposits and have banking licenses granted by theBank of Slovenia. Only domestic banks, owned by residents or non-residents, are included.Non-monetary Sector is further divided into following sub-sectors: Non-monetary financial institutions,General Government, Individuals, Enterprises and Non-profit institutions.Non-monetary financial institutions include Savings banks, Co-operatives and other financial institutions.General Government comprises Central Government and Other General Government. Central Governmentmainly consists of the Budget. Other General Government contains local communities and entitiesestablished by General Government - institutions, funds, companies, clubs and other societies engagedin education, health, culture, social insurance, trade unions and other organizations.Households (Individuals) include resident individuals.Enterprises comprise firms in private or public ownership or control, except for those included in theGeneral Government.Non-profit institutions consist of all entities, not included in any other sector.
Characteristics of the data
Data present stocks on assets and liabilities at the end of the period.
Data on stocks nominated in foreign currencies are converted into Tolars using Bank of Slovenia end ofperiod middle exchange rate.
Data in tables are not seasonally adjusted.
Table: Republic of Slovenia: general information
Table shows basic general data on Slovenia and its economy. In the »latest actual« column the latestavailable data for the current year are published. Data sources for the table are Bank of Slovenia,Ministry of Finance and The Statistical Office of the Republic of Slovenia.

��
�������������
Monthly Bulletin
NOTES
ON
METHODOLOGY
1. MONEY AND BANKS
Sectorization of banks’ data as from April 30, 1999
For data from April 30, 1999 on a new sectorization has been implemented according to Regulation onIntroduction and Implementation of Standard Classification of Institutional Sectors, (hereinafter“SKIS“) - Official Gazette 56/98. SKIS which implemented a new national standard for economicsectorization is based on European System of Accounts 95 and is in accordance with System of NationalAccounts 93.According to SKIS the sectors of the economy are: 1.) Non-financial corporations, 2.) Financial corporations(central bank, commercial banks, other financial institutions), 3.) General government, 4.) Households,5.) Non-profit institutions serving households and 6.) External Sector (non-residents)There has been no change regarding definition of Non-resident.
Domestic sector is broken down to monetary sector and non-monetary sectors.Monetary sector consists of the Bank of Slovenia and commercial banks. Commercial banks (hereinafter“banks”) are deposit money banks that accept sight deposits and have banking licenses granted by theBank of Slovenia. Domestic banks, owned by residents or non-residents, are included.Non-monetary Sectors are: Non-financial corporations, Non-monetary financial institutions, Generalgovernment, Households, Non-profit institutions serving households.Non-financial corporations are legal persons - market producers of goods and non-financial services.Non-monetary financial institutions consist: of Savings banks, Co-operatives and Other financialinstitutions. Other financial institutions are: 1. Other financial intermediaries, except insurancecorporations and pension funds (mutual funds, investment funds and financial leasing comp.), 2. Financialauxiliaries (securities brokers, stock exchanges) and 3. Insurance corporations and pension funds.General government consists of: 1. Central government (administrative departments of state and centralgovernment agencies), 2. Local government (local administration, local agencies) and 3. Social securityfunds.Households: resident individuals as consumers and resident individuals as sole proprietorships andpartnerships being market producers and having no independent legal status. The data of the latter havebeen prior to April 30, 1999 included in the sector Enterprises.Non-profit institutions serving households are clubs, political parties, trade unions, churches orreligious societies, humanitarian and charity organizations, professional societies.
Table 1.1.: Main Monetary Aggregates (Statistical Definitions)
Base money is the sum of currency in circulation, banks’ reserves with the Bank of Slovenia and Tolardemand deposits of central government, non-monetary financial institutions and other enterprises with theBank of Slovenia.M1 is currency in circulation, Tolar demand deposits of central government, enterprises and non-monetaryfinancial institutions with the Bank of Slovenia, and Tolar demand deposits with banks.M2 is M1, Tolar time deposits of central government with the Bank of Slovenia, Tolar savings and timedeposits with banks and deposits of the banks in liquidation at banks.M3 is M2 and foreign currency deposits of individuals with domestic banks and from September 1999also foreign currency deposits of legal entities with domestic banks.
Monetary aggregates are calculated as monthly averages of the Bank of Slovenia’s and banks’ daily datafor all calendar days in month.
All aggregates in Table 1.1. are also shown in Table 1.2. Data in Table 1.1. differ from those in Table 1.2. asthe first are monthly averages and the latter end of period data. The calculation of monetary aggregates isalso not exactly the same due to different data sources. The differences are as follows:M1:M1 in the table 1.1. does not include general government, non-monetary financial institutions (includingsavings banks and co-operatives) and non-profit institutions serving households sight deposits at banks,what is all included into M1 in the table 1.2..M2:Between M1 included in M2 in the tables 1.1. and 1.2. there are no differences mentioned, but someother inconsistencies. M2 in the table 1.1. includes Tolar sight and time nonresident deposits, Tolarrestricted deposits, securities issued by banks denominated in Tolars and banks subordinated debt (exceptinterbank subordinated debt and subordinated debt to savings banks). These items are not included in M2in the table 1.2. Beside that the item Tolar savings banks time deposits at banks is part of the M2 in thetable 1.1., but not in the table 1.2..M3:Until 31.08.1999 monetary aggregate M3 in the table 1.1. includes only foreign currency deposits madeby individuals, but M3 in the table 1.2. consists also of foreign currency deposits by other non- monetarysectors. As from 01.09.1999 monetary aggregate M3 in table 1.1. besides foreign currency depositsmade by individuals includes also deposits made by other non-monetary sectors.
Table 1.2.: Monetary Survey - Consolidated Balance Sheet of the MonetarySystem
The Table shows consolidated balance sheet of all banks’ and Bank of Slovenia on the end of month.

��
�������������
Monthly Bulletin
NOTES
ON
METHODOLOGY
Data for banks are aggregated but not consolidated.Domestic assets consist of banks’ and Bank of Slovenia’s claims on General Government arising fromsuccession to former SFR Yugoslavia and bank rehabilitation program, and claims from loans and securitieson other non-monetary sectors. Claims from succession and bank rehabilitation program represent claimsof the Bank of Slovenia on Succession Fund of the Republic of Slovenia (for the former National Bank ofYugoslavia Dinar cash), counterpart claims for Bank of Slovenia liabilities to International Monetary Fund,government guaranteed bank rehabilitation bonds, government bonds for unpaid foreign currency depositsand claims on former National Bank of Yugoslavia for foreign currency deposits.Other assets include fixed assets of banks and of the Bank of Slovenia and some other items (doubtfulclaims, etc.).M3 consists of M2 and all foreign currency deposits, and not only foreign currency deposits of individualsas in Table 1.1.Other foreign currency liabilities to Central Government include Central Government foreign currencydeposits with the Bank of Slovenia and other foreign currency liabilities of banks with the GeneralGovernment.Other liabilities consist of capital and reserves of banks and of the Bank of Slovenia and also includesome other items.
It the table as from April 30, 1999 in conformity with SKIS items of assets and liabilities to Other generalgovernment mean assets and liabilities to both Local Government and Social Security Funds. By analogyEnterprises means Non – financial corporations and Non – profit institutions serving households, andIndividuals means Households.
As from July 31, 1996, data for Komercialna banka Triglav are no longer included in banks’ data due to itsbankruptcy.
Table 1.3.: Balance Sheet of the Bank of Slovenia
The Table shows the Bank of Slovenia’s assets and liabilities at the end of month.
The International reserves of the Bank of Slovenia consist of: foreign currency, sight and time depositsabroad, first class securities of foreign issuers, monetary gold, reserve position with the InternationalMonetary Fund and SDR holdings at the International Monetary Fund. Foreign exchange deposits held byBank of Slovenia on the basis of repurchase agreements are not included.Other foreign assets mainly include balances on fiduciary accounts and with international financialorganizations.Claims on General Government consist mainly of net claims on the National Bank of Yugoslavia takenover by the Succession Fund of the Republic of Slovenia. Claims on the state budget, which are thecounterpart of the succeeded liabilities to the International Monetary Fund, are also included.Repurchase agreements represent loans extended to banks based on securities or foreign currency.Other claims include some Bank of Slovenia’s small deposits with banks and advance payments to thebanks for repayments of Bank of Slovenia bills sold to other buyers through banks as agents.General Government Deposits comprise deposits of Central Government budget.Restricted deposits mainly result from deposits earmarked for import payments and deposits coveringletters of credit, guarantees and credits taken abroad.Money transfers in transit comprise money in transit.
Table 1.4.: Balance Sheet of Deposit Money Banks
The Table summarizes data on assets and liabilities of banks at the end of the month.
Demand deposits comprise giro accounts of enterprises and non-profit institutions, General Government,non-monetary financial institutions and giro and current accounts of households (see Table 1.6.).Savings deposits include short and long-term tolar savings deposits of households (see Table 1.6.).Time deposits consist of short and long-term time deposits of households, General Government, non-monetary financial institutions, enterprises and non-profit institutions (see Table 1.6.).Restricted deposits represent deposits of enterprises and non-profit institutions, General Governmentand individuals to be used for money transfers to foreign countries or in cover of letters of credit, loanstaken abroad or euro-checks, and can also be used for foreign currency exchange office transactions.
Note 1: In June 1996 foreign liabilities of banks for the undue foreign debt of former SFR Yugoslavia in theamount of SIT 49,027 million were taken over by the Government. Liabilities of banks to the Governmentwere increased for the same amount. The banks decreased their foreign liabilities and claims on theGovernment for the part of matured allocated debt which they had been repaying to the governmentfiduciary account since January 1994 totalling SIT 18,078 million.
Bank of Slovenia’s claims on and liabilities to banks are equal to the corresponding items in the banks’aggregated balance sheet with few exceptions: Item ’Reserves’ (Giro and reserves accounts) on the assetsside of banks’ balance sheet is almost the same as item ’Deposits of banks’ (Giro and reserves accounts,foreign currency deposits) on the liabilities’ side of the Bank of Slovenia’s balance sheet (Table 1.3.).Similar applies to items ’Liabilities to the banking system’ arising from the Bank of Slovenia loans and’Claims on domestic banks’ based on loans in the Bank of Slovenia balance sheet (Table 1.3.). Discrepanciesresult from differences in accounting accuracy.

��
�������������
Monthly Bulletin
NOTES
ON
METHODOLOGY
Claims on and liabilities to domestic non-monetary sectors are shown in detail in Tables 1.5. and 1.6.Foreign assets and foreign liabilities are shown in detail in Tables 1.7. and 1.8.
Table 1.5.: Deposit Money Banks’ Claims on Domestic Non-monetary Sector
The Table shows banks’ claims resulting from loans and securities classified by domestic non-monetarysectors, which are also represented in Table 1.4. in item ’Claims on non-monetary sectors - Total’.As from April 30, 1999 SKIS has been implemented in the sectorial distribution of the economy andtherefore:· the sector Enterprises and non-profit institutions comprises the data on SKIS Sectors Non
financial corporations and Non-profit institutions serving households;· the sector Central government comprises the data on SKIS subsector Central government;· the sector Other general government comprises the data on SKIS subsectors Local
government and Social security funds;· the sector Individuals comprises the data on SKIS sector Households;· the sector Non-monetary financial institutions comprises the data on Savings banks and
Savings cooperatives as well as the data on SKIS sector Other financial institutions.
Marketable securities are long or short-term securities acquired and held by a bank with the intention ofreselling them in the short term.Investment securities are long or short-term securities acquired and held for yield or capital growth purposesand are usually held to maturity.
Table 1.6.: Deposit Money Banks’ Liabilities to Domestic Non-monetary Sector
The Table shows banks’ liabilities from deposits of domestic non-monetary sectors which correspond tothe ’Liabilities to non-monetary sectors - Total’ in Table 1.4.As from April 30, 1999 SKIS has been implemented in the sectorial distribution of the economy andtherefore:· the sector Enterprises and non-profit institutions comprises the data on SKIS Sectors Non
financial corporations and Non-profit institutions serving households;· the sector Total General government comprises the data on SKIS sector General government;· the sector Individuals comprises the data on SKIS sector Households;· the sector Non-monetary financial institutions comprises the data on Savings banks and
Savings cooperatives as well as the data on SKIS sector Other financial institutions.
Table 1.7.: Deposit Money Banks’ Claims to Non-residents
The Table shows banks’ claims to non-residents by currency- Tolars and foreign currencies. Deposit MoneyBanks’ Claims to non-residents are shown in Table 1.4. in item ’Total – Foreign assets’.
Table 1.8.: Deposit Money Banks’ Liabilities to Non-residents
The Table shows banks’ liabilities to non-residents broken by currency- Tolars and foreign currencies.Deposit Money Banks’ Liabilities to non-residents are shown in Table 1.4. in item ’Total – Foreign liabilities’.
Table 1.9.: Bank of Slovenia 10-day balance sheet
Data for the last published decade are preliminary.
Temporary Purchase of Foreign Currency with Repurchase Agreement is up to 20.03.2001 includedin balance sheet item Repurchase Agreement. Since then the data are classified among the off-balanceitems.
2. FINANCIAL MARKETS
Interest rates (Table 2.1. - 2.6.)
Annual interest rates.
r = real rate over Tolar indexation clauser(D) = real rate over foreign exchange indexation clausen = overall nominal rateTOM = Tolar indexation clauseEUR = foreign exchange clause

��
�������������
Monthly Bulletin
NOTES
ON
METHODOLOGY
Table 2.1.: Bank of Slovenia Interest Rates
Discount rate (End of period): Indicative rate posted by the Bank of Slovenia.
Lombard loan: Within the framework of standing lombard facility Bank of Slovenia provides one-day lombardloans to banks in amounts not higher than 5 percent of foreign currency denominated short-term Bank ofSlovenia bills or Treasury bills used as collateral. Interest rate for lombard loans is determined with theDecree on lombard loan interest rate and interest rate for overnight deposit.
Interest rate on banks’ obligatory reserves: 1 percent per year since October 1991.
Penalty rate is an official penalty rate set by Bank of Slovenia. Penalty rate is generally used in cases ofoverdue payments. The calculation of the penalty rate is since 01.01.2002 derived from TOM increasedfor 13.5 percentage points.
Repo interest rate for loans granted on the basis of temporary purchase of Bank of Slovenia’s Bills inforeign currency with obligatory repurchase in 7, 28 or 60 days is the weighted arithmetic average of dailyrepo interest rates. The repo interest rate is given as the effective interest rate.
The overnight-deposit interest rate is an interest rate applying to the deposits placed by banks and savingsbanks on an overnight term deposit with the Bank of Slovenia.
Bank of Slovenia uses liquidity loans to regulate liquidity of the banking system, and occasionally forregulation of base money.Liquidity facilities of last resort are permanently available to banks and savingbanks (till March 2001 only to banks) in case of unexpected liquidity constraints. The interest rate appliedis the penalty rate.
The annual averages of interest rates are computed as simple arithmetic averages of monthly data, ifsuch data are available.
Table 2.2.: Interbank Money Market Rates and Indexation Clause
Interbank market
The figures are annual interest rates for loans agreed between commercial banks with maturity up to 30days.
The annual averages of interbank interest rates are computed as simple arithmetic averages of monthlydata.
Tolar indexation clause
Tolar indexation clause (TOM) is annual interest rate, determined by Bank of Slovenia and used forpreserving the value of financial liabilities and assets in domestic currency.
TOM (monthly): since 5th August 1995: average of previous 3 months’ inflation (until June 1995 indexationwas based on so called R that was equal to the previous months’ inflation rate, from 1st June till 4st August1995 indexation was based on the average of previous 3 months’ inflation); since February 1996: 4months; since December 1996: 6 months; since May 1997: 12 months.
Financial liabilities in domestic currency, with maturity exceeding 30 days, are revalued with TOM.
Financial liabilities in domestic currency, with maturity less than 30 days, are not revalued from September1995.
Foreign exchange indexation clause
Monthly rate is growth rate of Bank of Slovenia’s end of month exchange rate for EUR ( DEM ) or USD.
Annual rate is computed from monthly rate on the conform basis, taking into account the actual number ofdays in the month and in the year.
Figures for 1993 to 1998 in columns 5, 7 and 9 represent growth of the category in the period Decemberto December.
Table 2.3.: Interest Rates for Bank of Slovenia Bills
Tolar bills are registered securities subscribed by banks with maturity of 12, 60 or 270 days and bysavings banks with maturity of 60 and 270 days (Tolar bills with maturity of 7, 14 and 30 days were

��
�������������
Monthly Bulletin
NOTES
ON
METHODOLOGY
abolished on 3th of April 2000, bills with 2-day maturity were abolished as of 1st July 2001 and 12-day tolarbills on 21st of December 2001). All bills are offered on a permanent basis except for 270 - day bills, whichare sold by auction. Interest rates for tolar bills are nominal given. 60 and 270 - day bills are issued inseries.
Bills with warrants were short-term securities, issued in series of nominal value of half a million Tolars.They were purchased in Tolar at a discount and beard the p.a. nominal interest. The warrant attached tothe security represented a hedge against inflation and exchange rate depreciation higher than officiallyprojected. Interest rate for the last edition of the bills was indicated. Bills with warrants were abolished on25th May 2000.
Twin bills were short-term bearer securities, issued in series in paper form. Through banks they are availableto other legal persons and households. They were composed of a Tolar and a foreign currency part andwere sold in Tolars at a discount, with redemption in Tolars and in German Mark. The Tolar part wasrevalued by Tolar indexation clause (TOM). Twin bills were abolished on 16th March 2000.
Foreign currency bills are transferable registered securities not issued in series. They are offered onpermanent basis and can be purchased by banks and by other legal persons through banks. They are soldfor Euros (till 16.02.1999 for German Marks) or US Dollars at a discount with maturities of two to twelvemonths (foreign currency bills with maturities of 180, 270 and 360 days were abolished by March 2001).Interest rates for a certain type of bill in the table are those last valid in a period.
Table 2.4.1.: Average Commercial Banks’ Interest Rates
Average interest rates (r and r(D)) are weighted arithmetic averages of the minimum and maximum interestrates.Spread is the difference between the weighted minimum and maximum interest rate: rmin=r - spread,rmax=r+spread.
The figures for the latest month are always provisional; updated figures in the following Monthly Bulletin arenot marked with sign *.
Table 2.5.: Average Effective Commercial Banks’ Interest Rates
Average effective interest rates are calculated on the basis of the interest accounted in the period.
Table: Breakdown of banks’ assets and liabilities by type of Indexation Clause
Network of Commercial Banks (Table 2.7.)
Table 2.7.: Network of Commercial Banks
TOM D TOM D TOM D
Jan.-Mar. 92.15 7.85 96.42 3.58 94.48 5.52
Apr.-Jun. 92.87 7.13 95.82 4.18 94.46 5.54
Jul.-Sep. 93.46 6.54 95.84 4.16 94.74 5.26
Oct.-Dec. 93.90 6.10 96.56 3.44 95.30 4.70
Jan.-Mar. 93.96 6.04 97.13 2.87 95.59 4.41
Apr.-Jun. 93.85 6.15 97.13 2.87 95.51 4.49
Jul.-Sep. 93.49 6.51 97.26 2.74 95.4 4.6
Oct.-Dec. 93.25 6.75 97.39 2.61 95.34 4.66
Jan.-Mar. 93.13 6.87 97.44 2.56 95.31 4.69
Apr.-Jun. 92.69 7.31 97.27 2.73 95.03 4.97
Jul.-Sep. 92.24 7.76 97.31 2.69 94.85 5.15
Oct.-Dec. 91.90 8.10 97.24 2.76 94.68 5.32
Total
1999
2000
2001
Loans Deposits
Note 1: In the number of head offices two banks with the license for operation pursuant to the ConstitutionalLaw only are included (Kreditna banka Maribor d.d. and Ljubljanska banka d.d. Ljubljana).
Note 2: Statistical Regions, Source: Statistical Office of the Republic of Slovenia.
Note 3: Data referring to the Postal bank of Slovenia do not include units of the Post of Slovenia thatoperate for the Postal bank of Slovenia on the contractual basis.
Note 4: Source: Statistical Office of the Republic of Slovenia: Rapid Reports, Population, No.337/2001.
ATM: Automated teller machine that permits the withdrawal of cash from accounts using plastic (cheque)
��
�������������
Monthly Bulletin
NOTES
ON
METHODOLOGY
cards and the use of other services (balance inquiries, transfer of funds, etc.).EFTPOS: Electronic funds transfer at the point of sale: the term refers to the use of payment cards at theretail location where the information is captured and transmitted by electronic terminals.
Modern Payment Instruments (Table 2.8.)
2.8.1. Payment cards
Note 1: Credit cards: Cards where a line of credit is granted to the holder. Important: payment cards withthe delayed settlement included.Note 2: Debit cards: payment cards that enable the direct charge of holder’s account.
Note 3: Cards, issued abroad: payment cards that are issued abroad and used for payments in Slovenia,mostly by non-residents.
Note 4: Number and value of payments abroad: the use of cards issued under licence in Slovenia forpayments abroad.Number of payment cards in circulation: number of valid payment cards held by residents and non-residents, issued in Slovenia. Data refer to the end of each quarter/year.Number and value of payments refer to the use of payment cards in each quarter/year.
Domestic payment cards: issued by banks and enterprises, can be used for payments in Slovenia only.Payment cards under license: issued under license by resident banks and enterprises, they can also beused for payments abroad.Personal payment cards: issued to natural persons (family payment cards included).Business payment cards: issued to legal persons.
2.8.2. Other Modern Payment Instruments
Note 1: Data in columns 1, 4 and 7 refer to the end of each quarter.
Note 2: Data refer to transactions with credit and debit cards in Slovenia. Relevant data for previousperiods are not available.
Ljubljana Stock Exchange (Tables 2.9. to 2.11.)
Table 2.9.: The Ljubljana Stock Exchange: Turnover by Market Segment andby Type of Securities
Shares – Privatization Investment Funds shares are not included.PIF - Privatization Investment Funds shares.
Turnover is measured by a single counting.
Table 2.10.: The Ljubljana Stock Exchange: Market Capitalization and TurnoverRatio
Market capitalization by market segment and by type of securities is calculated as the sum of marketcapitalization of individual securities. Market capitalization of an individual security is calculated as theproduct of the number of listed securities and the market price at the end of period.
Turnover ratio is calculated as turnover in a period divided by market capitalization at the end of period.
Short-term securities are not included in calculations of market capitalization and turnover ratio.
Table 2.11.: The Ljubljana Stock Exchange: Slovenian Stock Exchange Indexand Bond Index
SBI - Slovenian Stock Exchange Index (index value: January 1994=1000)BIO - Bond Index.SBI, BIO - value of SBI and BIO at the end of period.dT - change of index value by points.d% - change of index value in percentage.Min, Max - minimum and maximum value of index in a period.

��
�������������
Monthly Bulletin
NOTES
ON
METHODOLOGY
Exchange rates (Tables 2.12.1. to 2.13.2.)
Due to the introduction of Euro in January 2002 the exchange rates of members of EMU currencies(ATS, FRF, DEM, ITL) are replaced by the exchange rates of some EU accession countries (CZK, HUF,PLN, SKK).
Tables 2.12.: Selected Bank of Slovenia Exchange Rates- Average rates
Middle rates. Annual rates are computed as arithmetical averages of monthly rates. Monthly averages arecomputed as arithmetical averages of daily rates (Sundays and holidays are not included).As of January 1st, 1999, with introduction of European Monetary Union, the European Currency Unit (XEU)was replaced by the EURO (EUR) in rate one versus one.Fixed exchange rates between the Euro and the national currencies of the EMU Member States (validfrom 1st January 2001).
1EUR= 40.33990 BEF
= 1.95583 DEM
= 340.75000 GRD
= 166.38600 ESP
= 6.55957 FRF
= 0.78756 IEP
= 1936.27000 ITL
= 40.33990 LUF
= 2.20371 NLG
= 13.76030 ATS
= 200.48200 PTE
= 5.94573 FIM
Introduction of a new currency, the Kuna (=1,000 previous Croatian Dinars) on May 30th 1994.
Tables 2.13.: Turnover and Foreign Exchange Market
Annual rates are computed as arithmetical averages of monthly rates. Monthly rates are averages computedfrom daily rates on working days, weighed with turnover. Foreign Currency Exchange Offices also reporttransactions on Saturdays, not shown in the table, but included in the monthly and annual totals.
Totals also include transactions between banks and enterprises and between banks solely. In addition tothat the transactions between enterprises are included until 30th September 1999 and the transactions ofbanks with nonresidents and households from 1st October 1999 on.
The nominal and real effective exchange rate index is shown in the Table 3.5.
3. BALANCE OF PAYMENTS AND EXTERNAL POSITION
Balance of Payments (Tables 3.1. to 3.4.)
General notes
In most respects the Slovenian Balance of Payments (BOP) conforms to the methodology of the IMF’sBalance of Payments Manual, fifth edition (1993).
Characteristics of the Data
Minus sign (-) indicates imports or surplus of imports over exports in the current account, increase inassets or decrease in liabilities in the capital and financial accounts, and growth of reserve assets.Data for transactions are converted from original currencies to USD using the daily Bank of Sloveniaexchange rates, or average exchange rates of the period if the exact date of transaction is not known.

�
�������������
Monthly Bulletin
NOTES
ON
METHODOLOGY
Data sources
BOP is compiled on the basis of monthly available data on transactions (ITRS), stock positionsand estimates.· Reports on transactions
· accounts of domestic banks held with correspondent banks abroad (including thecentral bank),
· nonresident accounts held with domestic banks,· non-bank resident accounts abroad,· other accounts between residents and nonresidents,· payments between residents and nonresidents in Slovenian Tolars.
Classification of transactions is using the descriptions of transactions provided by the banks’ clients;· Customs declarations;· Reports to the Bank of Slovenia on registered credits granted to and disbursed abroad; For
the period from 1997 also data on nature of direct payments from foreign creditors, which settleliabilities of domestic debtors to other nonresidents, are available from these reports.
· Yearly surveys on balance and transactions with affiliated enterprises (SN) is a source forreinvested earnings of direct investments.
· Accounting data of the Bank of Slovenia;· Commercial banks balance sheet data;· Estimates.· Monthly survey of duty free shops.
There are several estimation models used in the BOP for the valuation of data on imports, incoming travel,labor income, Italian pensions (till the end of 1998), short-term commercial credits, foreign currency anddeposits of resident households.
Current account
GoodsData for the General merchandise are based on customs declarations. Data on imports c.i.f. and exportsf.o.b. are compiled by the Statistical Office. Adjustments for valuation of data on imports and coverageof data on imports and exports are made by the Bank of Slovenia. The imports data are adjusted from c.i.f.basis to f.o.b. basis by the coefficient which is equal to the weighted average of coefficients between thec.i.f. and f.o.b. values of imported goods (for the available sample), separately calculated for each type ofmerchandise, transport means and country of the exporter. The coverage adjustments are made forgoods imported without customs declaration and for which data are available from ITRS or reports of dutyfree shops and consignment warehouses.
Services
TransportThe source for recording of transportation services is the ITRS.TravelThe ITRS sources used in the compilation of the incoming travel item include: a.) health and educationrelated services, b.) payments made by nonresidents to Slovenian tourist agencies, c.) net withdrawals intolars from nonresident accounts, d.) money spent in casinos by nonresidents, e.) data on sales of goodsto nonresidents in duty free shops and consignment warehouses, f.) payments with credit cards and g.)sales of Tolars to nonresidents abroad.The data on sales of Tolars to nonresidents in Slovenia are estimated on the number of border crossings offoreign travellers and on the number of nights spent by foreign tourists.Data source for the item expenditure on travel are ITRS and estimations.
Construction servicesThe source of data is ITRS. All construction works are recorded under construction services.
Insurance servicesPremiums on life and non-life insurance are split into two components: (i) the service charge included ininsurance services and (ii) the premium in a narrow sense recorded as current transfer. The calculation ofservice charge is based on a fixed percentage of the premium payments.
Government servicesAll transactions settled through accounts of Slovenian embassies abroad as well as transactions coded asgovernment services settled through accounts of Slovenian banks with foreign correspondents are includedin this item.
IncomeThe ITRS is used as a main source for recording of compensation of employees. As many wages arenot paid through domestic banks, supplementary estimations of such receipts from the neighboring countriesare made. Data on reinvested earnings and income on equity are available in an annual survey ofSlovenian direct investors abroad and of foreign direct investment enterprises in Slovenia. The presentrecording of other investment income (interest income) is based on the actual payments.

�
�������������
Monthly Bulletin
NOTES
ON
METHODOLOGY
Current transfersIn this item workers’ remittances, insurance and other transfers of other sectors are included. The insuranceitem is calculated as a difference between the insurance premiums received and the claims paid on thecredit side and vice versa on the debit side. The main source for other transfers are the ITRS and thecustoms documents.
Capital and financial account
Capital account
Capital transfersMigrants’ transfers covers not only payments recorded by domestic banks but also the changes in residencyof accounts held with these banks.
Financial account
Direct investmentDirect investment is recorded on the basis of reporting of payments through domestic banks and of datafrom customs declarations. Data on reinvested earnings is based on yearly surveys on balance andtransactions with affiliated enterprises (SN) and is included each year in balance of payments for December.Until 1997 purchase and sale of all shares and equity have been included in this item.From the beginning of 1997, purchase and sale of shares that assure more than 50 percent of company’sequity, a control package of shares, shares issued by domestic companies on the primary markets withthe purpose to increase the nominal capital of the company are included in this item, due to capital controlmeasures. With the new Foreign Exchange Act in 1999 direct investment 10% rule is applied.
Portfolio investmentUntil 1997 only data on sales and purchases of debt securities through banks were included in this item.Since February 1997 equity securities, not having the characteristics described in the note on Directinvestment are included in this item too. With the new Foreign Exchange Act in 1999 portfolio investmenttransactions include all transactions below the 10% rule.
Other investmentOther investments except equity between affiliated enterprises are included here and not under Directinvestment. Short-term trade credits are estimated and recorded on net basis as change of assets. Estimationis based on comparison of data on imports and exports from customs declarations with correspondingsettlements. Item currency and deposits of households is estimated by using data on net purchases offoreign currency in foreign exchange offices, net deposits to households’ foreign exchange accounts atdomestic banks, estimated expenditure of resident households abroad (see Travel).
Tables 3.1., 3.3. and 3.4.: Balance of Payments
The data for 2001 are revised every month for all previous months.
In June 2001 Slovenia acquired 16.39% share in holdings of former Yugoslavia with BIS (Bank forInternational Settlements), consisting of gold (USD 66.0 million), foreign currencies (USD 4.5 million) andshares (USD 11.7 million). This transaction is not considered to be a balance of payments´ flow, but a partof ´other changes´ item, which reconciles the international investment position in consecutive periods.
Note 1: CD: customs declarations - foreign trade definitions (Statistical Office of Republic of Slovenia).
Note 2: June 1996: includes issue of government bonds in exchange for a part of allocated foreign debtin the amount of USD 465.4 million. Banks’ liabilities under foreign loans are decreased for the sameamount and transferred to liabilities to Government.
Note 3: Issues of government bonds:· August 1996 (USD 320.6 million);· June 1997 (USD 228.2 million);· May 1998 (USD 556.6 million);· March 1999 (USD 438.2 million);· March 2000 (USD 384.8 million) and in February 2001 (USD 92.7 million);· April 2001 (USD 402.9 million).
Note 4: For 1993 and following, short-term claims include net changes in commercial credits (receivedand granted).
Note 5: Includes mostly BS fiduciary accounts. In June 1996 the amount of USD 154.8 was transferred toregular BS reserve accounts.
Note 6: Use of IMF credit (assumed upon membership in January 1993).
Note 7: Reserve assets of the Bank of Slovenia.

��
�������������
Monthly Bulletin
NOTES
ON
METHODOLOGY
Note 8: The data for reinvested earnings for the year 2001 is not available yet, therefore the data forreinvested earnings from year 2000 was repeated in December 2001 data as an estimation. In the year2002 this estimation will be replaced with the acual data for reinvested earnings.
Tables 3.2.: Balance of Payments 1988 - 1992
Excluding transactions with former Yugoslav Republics; processing is included in services, excluded inmerchandise.
Note 1: For 1988 and 1989, Official sector data is included in Other sectors.
Note 2: For 1988 through 1990, Statistical errors include sales of claims from bilateral agreements to theformer National Bank of Yugoslavia and its purchases of foreign currency through Slovenian foreign currencyexchange offices.
Note 3: Reserve assets of the Bank of Slovenia.
Merchandise trade (Table 3.5 to 3.7.)
Tables 3.5 to 3.7.: Merchandise trade
Exports f.o.b. and imports c.i.f. Year 2001: provisional data (Source: Statistical Office of RS).
The effective exchange rate: Growth of index denotes growth of value of Tolar, and vice versa.Note 1: Romania became a member of CEFTA on July 1, 1997. According to SORS its data are includedin CEFTA figures also for previous periods.
Note 2: Bulgaria became a member of CEFTA on January 1, 1999. According to SORS its data areincluded in CEFTA figures also for previous periods.
International Liquidity (Table 3.8.)
Table 3.8.: International Liquidity
Foreign exchange reserves of the Bank of Slovenia and banks include foreign cash in convertiblecurrencies, deposits abroad and first class securities of foreign issuers. Balances on fiduciary accountsare included in ’Other foreign assets’.
Total reserves of the Bank of Slovenia equals the item ’International monetary reserves’ in balance sheetof the Bank of Slovenia (Table 1.3.) except that foreign exchange deposits acquired on the basis ofrepurchase agreements with domestic banks which are excluded from the data on international monetaryreserves in Table 1.3. These assets are included in Table 1.3. under item ’Claims on domestic banks -Loans - Repurchase agreements’.Foreign exchange reserves of banks are only part of item ’Foreign Assets’ in Table 1.4. Foreign assets alsoinclude other foreign currencies, deposits abroad, foreign securities and other foreign assets, which donot have the nature of high liquid international funds.
External debt (Tables 3.9. to 3.11.)
General Notes
The tables are based on World Bank concepts (World Debt Tables, External Debt of Developing Countries,The World Bank, Washington D.C.).
External DebtLong-term external debt is defined as debt with original or extended maturity of more than one year owedto nonresidents and repayable in foreign currencies, goods, or services. Long-term external debt hasthree components:· public debt, which is an external obligation of a public debtor, including the national government, a
political subdivision (or an agency of either) and autonomous public bodies;· publicly guaranteed debt, which is an external obligation of a private debtor that is guaranteed for
repayment by a public entity;· private non-guaranteed external debt, which is an external obligation of a private debtor that is not
guaranteed by a public entity.Short-term external debt is defined as debt with an original maturity of one year or less.Interest arrears on long-term debt are interest payments due but not paid during the year (period) specified.Total debt stocks or total external debt is defined as the sum of (1) public and publicly guaranteed long-term debt, (2) private non-guaranteed long-term debt, (3) use of IMF credit, and (4) short-term debt.The data do not include Eurobonds of the Republic of Slovenia owned by Residents.Debt service: Total debt service is defined as the sum of (1) principal repayments and interest paymentsmade on long-term debt (public and publicly guaranteed and private non-guaranteed), (2) repurchasesand charges paid on use of IMF resources; and (3) reductions in stock and interest payments made onshort-term debt.
��
�������������
Monthly Bulletin
NOTES
ON
METHODOLOGY
Debt FlowsDisbursements are drawings on loan commitments during the year (period) specified.Principal repayments are actual amounts of principal (amortization) paid in foreign currency, goods, orservices in the year (period) specified.Interest payments are actual amounts of interest paid in foreign currency, goods, or services in the year(period) specified.Net flows (or net lending or net disbursements) are disbursements minus principal repayments. In the“Total debt flows” chapter only, net flows also include short-term debt. It is assumed that a disbursementhas taken place if the change in stock of short-term debt outstanding is positive; if negative, a repaymentis assumed to have been made.Net transfers are net flows minus interest payments (or disbursements minus total service payments).
Principal RatiosExports of goods and services are the total value of exported goods, services, income received (Table3.3.) and worker remittances received.Imports of goods and services are the total value of imported goods, services and income paid (Table3.3.).International reserves are the sum of the Bank of Slovenia’s holdings of special drawing rights (SDRs), itsreserve position in the IMF, its holdings of foreign exchange (Table 3.8.) and its holdings of gold.Foreign exchange reserves are equal to the sum of foreign exchange reserves of the Bank of Slovenia andcommercial banks (Table 3.8.).
Categories of CreditorsDebt from official creditors includes:· loans from international organizations (multilateral loans): loans and credits from the World Bank,
regional development banks, and other multilateral and intergovernmental agencies. Excluded areloans from funds administered by an international organization on behalf of a single donor government;these are classified as loans from governments.
· loans from governments (bilateral loans): loans from governments and their agencies (including centralbank), loans from autonomous bodies, and direct loans from official export credit agencies.
Debt from private creditors includes:· bonds either publicly issued or privately placed;· commercial banks: loans from private banks and other private financial institutions;· other private: credits from manufacturers, exporters, and other suppliers of goods, and bank credits
covered by a guarantee of an export credit agency.
Borrowing TermsThe average terms of borrowing are given for all new loans contracted during the year (period) and separatelyfor loans from official and private creditors. To obtain averages, the interest rates, maturities, and graceperiods in each category have been weighted by the amount of the loans.Loans with an original grant element of 25 percent and above are defined as concessional.Two characteristics are given for long-term debt outstanding and disbursed:· concessional LDOD. This item conveys information about the borrowers dependence on aid from
official lenders;· variable interest rates LDOD (that is, interest rates that float with movements on a key market rate; for
example, the London Interbank Offered Rate (LIBOR) or the U.S. prime rate). This item conveysinformation about the borrower’s exposure to changes in international interest rates.
Debt Service Projections on Existing PipelineProjected service payments are estimates of payments due on existing debt outstanding, includingundisbursed. They do not include service payments that may become due as a result of new loans contractedin subsequent years. Nor do they allow for effects on service payments of changes in repayment patternsowing to prepayment of loans or to rescheduling or refinancing, including repayment of outstanding arrearsthat occurred after the latest year of reported debt data. Projection in current year refers only repaymentsdue in the following period of the year.
Exchange RatesDebt outstanding and disbursed at the end of the year (period) specified is converted to U.S. dollars at therate in effect at the end of the year (period). Service payments, commitments, and disbursements (flows)are converted to U.S. dollars at the rates valid in the moments of transaction.
Table 3.9.: External DebtTable 3.10.: Regional Composition and Breakdown by Creditors
Note 1: Debt data apply to loans used directly by Slovenian beneficiaries, and to obligations from creditsof the former SFR Yugoslavia taken over by the Republic of Slovenia in separate bilateral agreements withforeign creditors. The Republic of Slovenia is engaged in process of ratification, i.e., negotiations for theassumption of the remaining obligations of former SFR Yugoslavia with government of one country andwith creditors from the Alternative Participation Instruments Exchange Agreement (APIEA).

��
�������������
Monthly Bulletin
NOTES
ON
METHODOLOGY
Note 2: The Republic of Slovenia became member of the IMF in January 1993; by decision of the ExecutiveBoard of the IMF in December 1992 Slovenia was declared successor state to a percentage share of theassets and liabilities of former SFR Yugoslavia.
Note 3: Data include a portion of obligations assumed in June 1996 in the amount of USD 812 million bythe Republic of Slovenia and related 1988 New Financing Agreement. Together with the 1988 Trade andDeposit Facility Agreement and 1988 Alternative Participation Instruments Exchange Agreement, thisagreement regulated restructuring of the debt of former SFR Yugoslavia owed to foreign commercialbanks.Negotiations are not yet concluded with creditors under the 1988 Yugoslavia Alternative ParticipationInstruments Exchange Agreement. Table 3.10., item 3: ‘Refinancing –Commercial Banks’ shows obligationsof Slovenian final beneficiaries under the two Agreements.
Note 4: Excluding IFC credits from 1995, included in private non-guaranteed debt.
Note 5: Including debt assumed with agreements: a.) between the governments of the Republic of Sloveniaand FR Germany on the take-over of foreign debt of former SFR Yugoslavia, pertaining to previousrestructuring and to liabilities from original bilateral arrangements; b.) between the governments of theRepublic of Slovenia and the state Kuwait on the consolidation and rescheduling of certain debts of theRepublic of Slovenia owed to the state of Kuwait. c.) between the Government of the Republic of Sloveniaand the Government of Japan on the consolidation unallocated obligation of former SFR Yugoslavia owedto Japan; d.) between the government of the Republic of Slovenia and the government of the Italian Republicon the repayment of certain debts; e.) between the government of the Republic of Slovenia and thegovernment of the Kingdom of Norway on the consolidation of the debt of the Republic of Slovenia. Thedata are not shown in disbursements and in average terms of new commitments, however, it effects theincrease of external debt for the amount assumed.
Table 3.11.: Payments of Obligations Effected to the Fiduciary Account
Starting from September 30, 1994 payments have been effected to the fiduciary account of the Bank ofSlovenia with the Dresdner Bank Luxembourg Sa, Luxembourg (agreement dated 27.9.1994) of annualinstallments of the Republic of Slovenia under the Osimo Treaty (10.11.1975) and the Rome Treaty(18.2.1993) between the Republic of Italy and the former SFR Yugoslavia.Overdue liabilities in the amount of USD 50.8 million were effected by March 31, 2002 on the fiduciaryaccount.
International Investment Position of Slovenia (Table 3.12)
General notes
Methodology of the international investment position (IIP) of Slovenia is based on the fifth edition of theBalance of Payments Manual, IMF, 1993.
Data sourcesData sources for the international investment position of Slovenia are mainly the same as those for thebalance of payments financial account. However, there are differences with some items as follows:
Direct investmentData on direct investment are collected from surveys of enterprises on stock and transactions withaffiliated enterprises - form SN. (Source for the balance of payments is international transactions’ reportingsystem - ITRS). In accordance with the recommendations of IMF, this item comprises investment wheredirect investor owns 10 percent or more of ordinary shares or voting power, while in ITRS the distinctioncould not be made. In the IIP all claims on and liabilities to affiliated enterprises are included, except short-term claims and liabilities of banks.Data on claims and liabilities of Slovene enterprises in indirectly affiliated enterprises from 1996 onwardsare included in the item ‘Direct investment abroad’ (in case when enterprise abroad having Slovene directinvestment holds 10% or more of equity in other foreign enterprise). In the item ‘Direct investment inSlovenia’ data on investment of foreign enterprises in indirectly affiliated enterprises in Slovenia are included(in case that Slovene enterprise with foreign direct investment holds 10% or more of equity in other Sloveneenterprise).Reinvested earnings are included in IIP.
Portfolio investmentData on equity securities and other equity shares are also available from enterprises’ surveys (form SN),but only data from surveys where direct investor owns less than 10 percent of ordinary shares or votingpower, are included. (In the balance of payments, transactions with equity securities and other shares arecollected from ITRS (see note to Tables 3.1. to 3.4. /Capital and financial account/Portofolio investment).
Data on debt securities are available from credit registration forms and forms SN. (For the balance ofpayments these data are collected from ITRS).
Trade credits and loansSource for short-term trade credits are reports of enterprises on stock of external claims and liabilities(form SKV) and surveys on transactions with their accounts abroad (form C). (In the balance of paymentsthe item short-term commercial credits is estimated.)
���
�������������
Monthly Bulletin
Sources for long-term trade credits and loans are credit registration forms and are the same for theinternational investment position and the balance of payments. In the IIP claims and liabilities betweenaffiliated enterprises are recorded under direct investment and are excluded from items trade credits andloans.
Currency & deposits, other assets, other liabilities and reserve assetsSources of data for these items are banks’ reports and Bank of Slovenia accounting data and are consistentwith those for the balance of payments.
The item “Assets / Currency and deposits of other sectors” in international investment position also includesdata from the Bank for International Settlements (BIS) on deposits of Slovenian households in the banksin member states of BIS.
The item “Other liabilities of other sectors” in the IIP consists of the data on contractual joint ventures,which are not available for the balance of payments.
Table 3.12.: International Investment Position of Slovenia
IIP data do not include:· data on real estate owned by Slovenian households abroad (mainly real estate in Croatia),· claims on other countries on the territory of former SFR Yugoslavia, subject of negotiations on
succession, expropriated assets in these territories and other assets transferred to the Sloveniangovernment during the process of privatization.
Additional data on Direct Investment are available in a special publication of the Bank of Slovenia:‘Neposredne naložbe – Direct Investment, 1996 - 2000’ and on Bank of Slovenia Web site: http://www.bsi.si/html/eng/publications/index.html.
4. GENERAL ECONOMIC INDICATORS
Table 4.1.: Derivation and Expenditure on Gross domestic product
Table 4.2.: Quarterly real gross domestic product
Data in million SIT (last periods are estimated).
Table 4.3.: Industry
Data for production with breakdown by industries for years 1992 to 1993 and employment for years 1992to 1995 are estimations based on methodologies used in those years.
Table 4.4.: Employment and unemployment
The majority of data for the period before 1997 are estimations based on methodologies used in thoseyears.
Table 4.6.: Average wages
Real wages are deflated with consumer price index.
Table 4.7.: Registered households’ income
Real aggregates are deflated with consumer prices index.
5. PUBLIC FINANCE
Table 5.1.: General Government
General Government Operations (Consolidated state budget, local governments, pension fund andhealth insurance fund).
Tables 5.2, 5.3, 5.4 and 5.5
The data from tables 5.2, 5.3, 5.4 and 5.5 originate in the Bulletin on Government Finance, publishedby the Ministry of Finance. Republic of Slovenia in table 5.5 is defined as a legal person.
NOTES
ON
METHODOLOGY

���
�������������
Monthly Bulletin
Data Category Release* DisseminationApril May June formats
2002 2002 2002REAL SECTORNational accounts ** "Prva statistična objava - First release"
(Statistical Office of the Republic of Slovenia)Production index NLT 30 NLT 31 NLT 28 "Prva statistična objava - First release"
(for Mar 2002) (for Apr 2002) (for May 2002) (Statistical Office of the Republic of Slovenia)Forward-looking indicators 19 NLT 24 NLT 21 "Prva statistična objava - First release"
(for Apr 2002) (for May 2002) (for Jun 2002) (Statistical Office of the Republic of Slovenia)Labor market: Employment 31 "Prva statistična objava - First release"
(Q1 2002) (Statistical Office of the Republic of Slovenia)Labor market: Unemployment 31 "Prva statistična objava - First release"
(Q1 2002) (Statistical Office of the Republic of Slovenia)Labor market: Wages 15 15 17 "Prva statistična objava - First release"
(for Feb 2002) (for Mar 2002) (for Apr 2002) (Statistical Office of the Republic of Slovenia)Price indices: Consumer Price Index 29 31 28 "Prva statistična objava - First release"
(for Apr 2002) (for May 2002) (for Jun 2002) (Statistical Office of the Republic of Slovenia)Price indices: Producer Price Index 5 NLT 8 NLT 7 "Prva statistična objava - First release"
(for Mar 2002) (for Apr 2002) (for May 2002) (Statistical Office of the Republic of Slovenia)FISCAL SECTORGeneral government or public sector operations http://www.sigov.si/mf/angl/tekgib/atek_gib.html
Central government operations NLT 30 NLT 31 NLT 28 http://www.sigov.si/mf/angl/tekgib/atek_gib.html(for Mar 2002) (for Apr 2002) (for May 2002)
Central government debt NLT 28 http://www.sigov.si/mf/angl/tekgib/atek_gib.html(Quarter 1 2002)
FINANCIAL SECTORAnalytical accounts of the banking sector 30 31 28 http://www.bsi.si/html/eng/financial_data/hit/mon_survey.html(Consolidated Balance Sheet of the Monetary System) (for Mar 2002) (for Apr 2002) (for May 2002)Analytical accounts of the central bank 15 16 14 http://www.bsi.si/html/eng/financial_data/hit/bilanca_bs.html(Balance Sheet of the Bank of Slovenia) (for Mar 2002) (for Apr 2002) (for May 2002)
Interest rates1 - Representative interest rate of the BoS 5 NLT 10 NLT 7 http://www.bsi.si/html/eng/financial_data/hit/repo.html and Interbank money market rates (for Mar 2002) (for Apr 2002) (for May 2002)
Interest rates1 - Government securities interest rates 24 NLT 31 NLT 28 http://www.sigov.si/mf/angl/tekgib/atek_gib.html (for Apr 2002) (for May 2002) (for Jun 2002)Stock market: Share price index 10 NLT 13 NLT 11 http://www.bsi.si/html/eng/financial_data/hit/sbi.html
(for Mar 2002) (for Apr 2002) (for May 2002)EXTERNAL SECTORBalance of payments 12 NLT 20 NLT 18 http://www.bsi.si/html/eng/financial_data/hit/placilna_bilanca.html
(for Feb 2002) (for Mar 2002) (for Apr 2002)Official reserve assets 8 9 7 http://www.bsi.si/html/eng/financial_data/hit/rezerve_bs.html
(for Mar 2002) (for Apr 2002) (for May 2002)International reserves and foreign currency liquidity NLT 30 NLT 31 NLT 28 http://www.bsi.si/html/eng/financial_data/hit/int_liquid_curr.html
(for Mar 2002) (for Apr 2002) (for May 2002)Merchandise trade 5 NLT 13 NLT 10 "Prva statistična objava - First release"
(for Feb 2002) (for Mar 2002) (for Apr 2002) (Statistical Office of the Republic of Slovenia)International investment position NLT 28 http://www.bsi.si/html/eng/financial_data/hit/int_inv_pos.html
(2001)
Exchange rates2 http://www.bsi.si/html/eng/publications/index.html
Addendum:Population NLT 30 "Prva statistična objava - First release"
(Quarter 4 2001) (Statistical Office of the Republic of Slovenia)
* The period to which data to be released relate is shown in parentheses. NLT stands for no-later-than.** The neccesary adjustments of quarterly GDP data with the revised time series for yearly GDP may cause the delay in publishing (NLT 30 September for Q1 2002).
Financial and external sector data (except Merchandise trade) are first disseminated on the Bank of Slovenia Internet website, and later in the Bank of Sloveni Monthly Bulletin. At the end of business week, the precise dates of release during the following week are published on the Bank of Slovenia Internet websit (http://www.bsi.si/html/eng/financial_data/hit/adv_rel_cal.html)
1 The data on interest rates are published by the Bank of Slovenia and Ministry of Finance separately.2 Data are disseminated daily on Bank of Slovenia's page Currency Exchange rates - for display (http://www.bsi.si/html/eng/financial_data/daily/tecajna_lista.asp) and on Archive of financial data (http://www.bsi.si/html/eng/financial_data/arhiv/index.html).
����������������������������������������������������������������������������������������������������������������������������������������������������������������������������������������������������������������������������������������������������
� ������� ���� �� �ADVANCE
RELEASE
CALENDAR
PGP key:PGP version: 2.6.3iType: RSALength: 1024Key ID: 0x84CB62D1Key name: Banka Slovenije – http://www.bsi.si/Date: 13.11.1997Key fingerprint: 1689 EC52 DA15 102D 60B2 9462 99F1 3FF5


![]da[ - bsi.si · Title : A ssessment of systemic risks and the resilience of the financial sector during the covid -19 epidemic Issue: May 2020 Published by : BANKA SLOVENIJE](https://img.pdfslide.us/doc/110x75/5f101ecf7e708231d4478bed/da-bsisi-title-a-ssessment-of-systemic-risks-and-the-resilience-of-the-financial.jpg)