Embed Size (px)
Citation preview

BANK SUPERVISION DIVISION
BANKING SECTOR REPORT
FOR
QUARTER ENDED 31 MARCH 2015
2
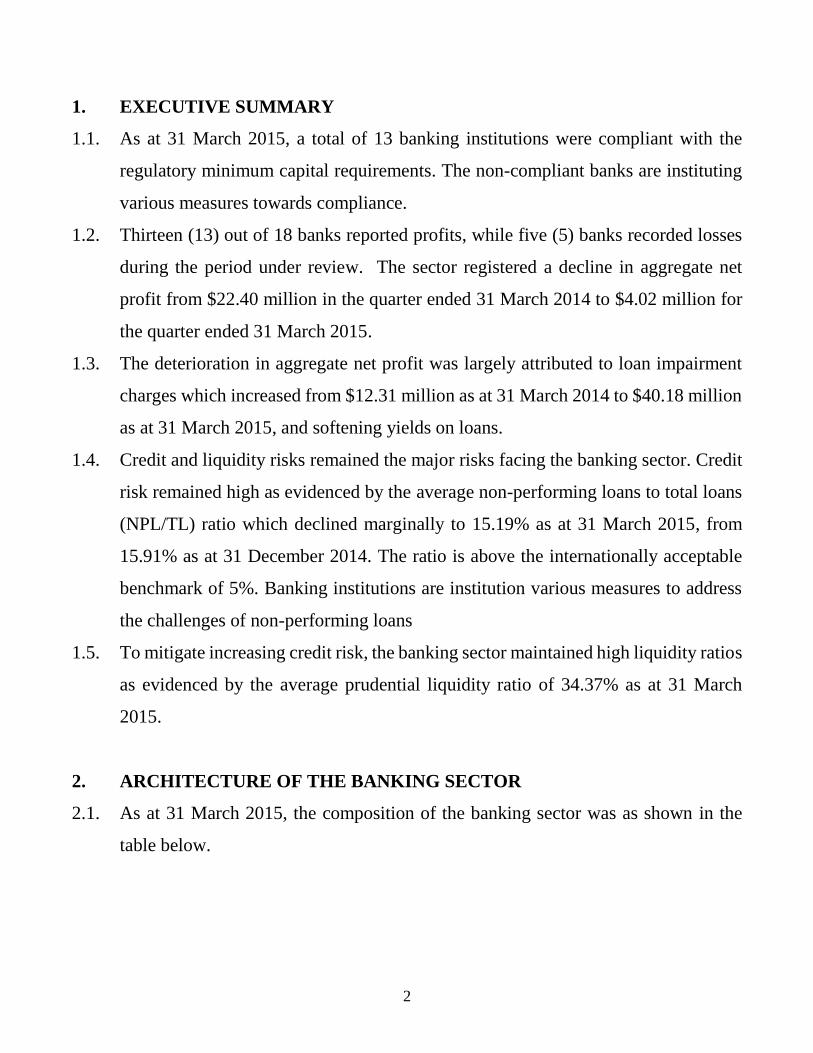
1. EXECUTIVE SUMMARY
1.1. As at 31 March 2015, a total of 13 banking institutions were compliant with the
regulatory minimum capital requirements. The non-compliant banks are instituting
various measures towards compliance.
1.2. Thirteen (13) out of 18 banks reported profits, while five (5) banks recorded losses
during the period under review. The sector registered a decline in aggregate net
profit from $22.40 million in the quarter ended 31 March 2014 to $4.02 million for
the quarter ended 31 March 2015.
1.3. The deterioration in aggregate net profit was largely attributed to loan impairment
charges which increased from $12.31 million as at 31 March 2014 to $40.18 million
as at 31 March 2015, and softening yields on loans.
1.4. Credit and liquidity risks remained the major risks facing the banking sector. Credit
risk remained high as evidenced by the average non-performing loans to total loans
(NPL/TL) ratio which declined marginally to 15.19% as at 31 March 2015, from
15.91% as at 31 December 2014. The ratio is above the internationally acceptable
benchmark of 5%. Banking institutions are institution various measures to address
the challenges of non-performing loans
1.5. To mitigate increasing credit risk, the banking sector maintained high liquidity ratios
as evidenced by the average prudential liquidity ratio of 34.37% as at 31 March
2015.
2. ARCHITECTURE OF THE BANKING SECTOR
2.1. As at 31 March 2015, the composition of the banking sector was as shown in the
table below.

3
Architecture of the Banking Sector
Type of Institution Number
Commercial Banks 13
Merchant Banks 1
Building Societies 3
Savings Bank 1
Total Banking Institutions 18
Credit-only-MFIs 142
Deposit taking MFIs 1
Development Institutions 2
2.2. During the quarter under review, Allied Bank Limited and AfrAsia Bank Zimbabwe
Limited’s operating licences were cancelled and the institutions were placed under
liquidation.
3. CONDITION AND PERFORMANCE OF THE BANKING SECTOR
3.1. The financial condition of the banking sector was considered satisfactory as at 31
March 2015.
3.2. The following table summarises the financial soundness indicators of the banking
sector as at 31 March 2015:

Financial Soundness Indicators
Key Indicators Dec -09 Dec-10 Dec -11 Dec - 12 Dec – 13 Mar – 14 Dec -14 Mar-15
Total Assets $2.19bn $3.69bn $4.74bn $6.12bn $6.74bn $6.81bn $7.12bn $7.19bn
Total Loans $693m $1.56bn $2.76bn $3.56bn $3.08bn $3.82bn $4.01bn $4.06bn
Net Capital Base $382m $458m $512m $644m $706m $689m $926.6m $926.3m
Total Deposits $ 1.36bn $ 2.31bn $ 3.04bn $4.41bn $ 4.73bn $4.89bn $5.08bn $5.29bn
Net Profit $9.50m $37.95m $86.00m $69.20m $4.46m $22.40m $50.84m $4.02m
Return on Assets 0.60% -2.02% 2.43% 1.64% 0.06% 0.26% 0.92% 0.08%
Return on Equity 2.47% 0.57% 15.13% 9.17% 0.51% 2.12% 5.37% 0.40%
Capital Adequacy Ratio 27.26% 27.34% 13.51% 13.07% 14.01% 14.10% 17.33% 17.97%
Loans to Deposits 50.99% 86.25% 90.59% 93.27% 102.36% 78.03% 78.94% 76.75%
Non-Performing Loans Ratio 1.80% 10.95% 7.55% 13.46% 15.92% 16.96% 15.91% 15.19%
Provisions to Adversely Classified Loans 112.81% 175.42% 57.53% 207.45% 70.88% 46.73% 54.72% 61.35%
Net Interest Margin 3.29% 5.75% 8.21% 14.81% 15.26% (0.15%) 4.24% 0.45%
Liquidity Ratio 97.44% 70.88% 56.80% 55.70% 40.57% 39.75% 39.34% 34.37%
Cost to Income Ratio 94.38% 86.93% 82.17% 86.41% 96.60% 94.84% 93.72% 97.55%

Capital Adequacy…
3.3. The banking sector’s net capital base increased to $957.02 million as at 31 March
2015 from $926.57 million as at 31 December 2014. However, the sector’s aggregate
core capital base deteriorated from $811.20 million reported as at 31 December 2014
to $801.58 million as at 31 March 2015. The decrease in the aggregate core capital
position was largely attributed to losses recorded by a few banking institutions as
well as regulatory adjustments following on-site examinations conducted at some
banking institutions during the quarter.
3.4. The graph below shows banking sector core capital trends from 2009 to March 2015:
3.5. The banking sector remained adequately capitalised during the period ended 31
March 2015, with the average capital adequacy ratio of 18.56%, against the
minimum regulatory capital adequacy ratio of 12%.
3.6. The trend in the banking industry’s average capital adequacy ratios (CARs) from
March 2014 to March 2015 is indicated in the figure below.
365.83 394.43
479.37
674.07
790.35 811.2 801.58
0
100
200
300
400
500
600
700
800
900
Dec-09 Dec-10 Dec-11 Dec-12 Dec-13 Dec-14 Mar-15
Core Capital ($millions)

6
3.7. As at 31 March 2015, a total of 13 out of 17 operating banking institutions (excluding
POSB), were in compliance with the prescribed minimum capital requirements.
There were two (2) banking institutions that were capitalized post 31 March 2015
and are now in compliance with the minimum capital requirements.
3.8. The sector’s capitalization, however, remains under threat from losses being
recorded by a few banking institutions and the high levels of non-performing loans
in the sector.
3.9. The Reserve Bank is monitoring implementation of capitalisation plans presented
by banking institutions to comply with the 2020 minimum capital requirements.
Asset Quality...
3.10. Total banking sector loans & advances amounted to $4.06 billion as at 31 March
2015, up from $4.01 billion as at 31 December 2014. The graph below depicts the
upward growth trajectory in total loans and advances since June 2009.
19.16%
18.27%
18.08%
18.49%
18.56%
17.50%
18.00%
18.50%
19.00%
19.50%
Mar-14 Jun-14 Sep-14 Dec-14 Mar-15
Capital Adequacy Ratio Trend

7
3.11. As at 31 March 2015, commercial banks accounted for 79.02% of total banking
sector loans and advances.
3.12. The top five banks had loans & advances amounting to $2.48 billion, which
accounted for 61.15% of total banking sector loans & advances as at 31 March 2015.
3.13. The distribution of the banking sector lending to the various sectors as at 31 March
2015 is indicated below:
$0.26
$0.67
$1.13
$1.67
$2.25
$2.76
$3.27$3.47
$3.75
$3.70 $3.81$4.01
$4.06
0.00
0.50
1.00
1.50
2.00
2.50
3.00
3.50
4.00
4.50
Total Loans and Advances($bns)
Trade and Services
1.4%
Energy and Minerals5.5%
Agriculture16.3%
Construction and Property
0.9%
Light and Heavy Industry26.5%
Physical Persons22.1%
Transport & Distribution16.0%
Financial Services1.2%
State1.9% Other
8.1%
Sectoral Distribution of Credit as at 31 March 2015

8
3.14. The distribution of credit remained largely unchanged from the previous quarter with
three largest credit proportions in light & heavy industry, physical persons and
agriculture, at 26.5%, 22.1% and 16.3% respectively.
3.15. Exposure to credit risk remained a key challenge to the banking sector, as evidenced
by the average non-performing loans to total loans (NPL/TL) ratio of 15.19% as at
31 March 2015 compared to 15.91% as at 31 December 2014.
3.16. High credit risk in the sector is attributed to a combination of exogenous factors
impacting on the performance of borrowers and endogenous factors relating to credit
risk management practices at some banking institutions.
3.17. The trend in the banking sector’s NPL ratio since March 2009 is shown in the figure
below.
3.18. Against a background of high levels of NPLs, the Reserve Bank has instituted some
holistic measures to resolve non-performing loans in the banking sector. The
initiatives include establishment of Zimbabwe Asset Management Corporation
(ZAMCO) and creation of a Credit Reference System. ZAMCO will acquire eligible
non-performing loans thereby cleansing banks’ balance sheets of toxic assets while
the Credit Reference System will address information asymmetry and credit culture.
1.80%
4.24%
7.35%
13.47%
15.92%15.91%
15.19%
0.00%
2.00%
4.00%
6.00%
8.00%
10.00%
12.00%
14.00%
16.00%
18.00%
NP
Ls/
Tota
l Lo
ans
Trend of NPLs from 2009 to March 2015

9
3.19. On their part, banking institutions have instituted various measures to resolve the
NPLs including the formation of dedicated loan recoveries units, refining of credit
underwriting standards as well as restructuring of some facilities.
3.20. It is envisaged that the above complementary initiatives will reduce NPLs and enable
banks to underwrite more business and contribute to economic growth.
Earnings Performance...
3.21. Reflecting the challenges in the operating environment, banking sector earnings
performance deteriorated as shown by a decrease in aggregate net profit from $22.40
million as at 31 March 2014 to $4.02 million for the quarter ended 31 March 2015.
The subdued earnings performance is also reflective of the conservative lending
approach and a sub-optimal tradeoff between high liquidity and profitability.
3.22. Out of the 18 operating banking institutions, 13 institutions reported profits for the
quarter ended 31 March 2015. The losses recorded by the remaining institutions
were attributed to high loan impairments due to deterioration in asset quality, lack
of critical mass to cover operating expenses, refinancing costs of liquidity challenges
and adjustments to reasonable and responsible pricing.
3.23. Profitability indicators for the banking sector as measured by the average return on
assets (ROA) and return on equity (ROE) deteriorated from 0.26% and 2.12% as at
31 March 2014 to 0.08% and 0.40% as at 31 March 2015, respectively on the back
of subdued earnings in some banking institutions.
3.24. The major source of income for the banking sector in the quarter ended 31 March
2015 was interest income, which constituted 62.34% of total income, largely from
loans & advances and non-interest income accounting for 37.66%, largely comprised
of fees and commissions.
3.25. The graph below shows the sources of income of the banking sector as at 31 March
2015.

10
3.26. Operating expenses for the sector amounted to $136.78 million for the quarter ended
31 March 2015 and were largely composed of salaries and employment benefits
which accounted for 47.14% of total operating costs. Other non-interest expenses
which including depreciation, deposit protection premiums and administration costs,
constituted 47.3% of operating expenses
3.27. The composition of operating expenses for the banking sector is shown in the figure
below.
Salaries and Employee Benefits47.1%
Occupancy - Net of Rental…
Other Non Interest Expenses
47.3%
Total Operating Expenses for the Quarter Ended 31 March 2015
Interest Income 62.34%
Foreign Exchange 2.71%
Fees and Commision 32.60%
Other Income2.45%
Income Mix for the Quarter ended 31 March 2015

11
Liquidity and Funds Management...
3.28. Total banking sector deposits amounted to $5.29 billion as at 31 March 2015 and
the figure below shows a trend in deposits from 30 June 2009.
3.29. The sector deposits continued to be dominated by demand deposits which accounted
for 55.15% of total deposits as at 31 March 2015 as indicated below.
0.711.36
2.57
3.38
3.584.03
4.224.41
4.37 4.42 4.734.90
4.89 4.96 4.97 5.085.29
0
1
2
3
4
5
63
0-A
pr-
09
30-J
un-0
9
31-D
ec-0
9
31-D
ec-1
0
31-D
ec-1
1
31-M
ar-
12
30-J
un-1
2
30-S
ep
-12
31-D
ec-1
2
31-M
ar-
13
30-S
ep
-13
31-D
ec-1
3
31-M
ar-
14
30-J
un-1
4
30-S
ep
-14
30-D
ec-1
4
31-M
ar-
15
$b
illi
on
Banking Sector Deposits (USD Billions)
Demand Deposits55.2%
Savings Deposits7.4%
Time Deposits33.9%
Foreign Deposits0.5%
NCDs, 3.1%
Composition of Deposits as at 31 March 2015

12
3.30. Commercial banking sub-sector held 78.75% of total banking sector deposits as at
31 March 2015.
3.31. The top five (5) banks, in terms of deposits, had deposits amounting to $2.61 billion
as at 31 March 2015, representing 62.88% of total banking sector deposits.
3.32. The banking sector average prudential liquidity ratio of 34.37% as at 31 March 2015
was in compliance with the regulatory minimum of 30%, notwithstanding the
general liquidity challenges in the economy.
3.33. The diagram shows average prudential liquidity ratios since December 2013.
Commercial Banks
78.75%
Building Societies
17.53%
Merchant Banks
1.48%POSB 2.24%
Banking Sector Deposits as at 31 March 2015
38.56 38.08
40.8639.99
37.1836.61
25
27
29
31
33
35
37
39
41
43
Prudential Liquidity Ratio Trend (%)

13
3.34. As at 31 March 2015, five (5) banking institutions were not compliant with the
minimum regulatory requirement and a few of these institutions faced liquidity
challenges.
Sensitivity to Market Risk…
3.35. Generally, the sector’s exposure to market risk remained low. Under the current
operating environment, the sector’s exposure to interest rate risk was mainly in the
banking book.
3.36. Aggregate stress test results reflect strong resilience to market risk shocks for the
banking system as a whole.
3.37. Inherent foreign exchange rate risk remained low given banks’ current balance sheet
structures. The banking sector had an overall positive net Foreign Exchange open
position of $462.51 million as at 31 March 2015.
3.38. Stress tests conducted to assess the vulnerability of banking institutions’ to foreign
exchange rate movements showed that all banking institutions are resilient to a major
level foreign exchange rate risk shock of a 15% appreciation of the US dollar against
major currencies.
31 March 2015