Embed Size (px)
Citation preview

Economics & Management Series EMS-2012-03
Bank Risk and Non-Interest Income Activities in theIndonesian Banking Industry
Wahyu Yuwana HidayatBank Indonesia
Makoto KakinakaInternational University of Japan
Hiroaki MiyamotoInternational University of Japan
April 2012
IUJ Research InstituteInternational University of Japan
These working papers are preliminary research documents published by the IUJ research institute. To facilitate prompt distribution, they havenot been formally reviewed and edited. They are circulated in order to stimulate discussion and critical comment and may be revised. The viewsand interpretations expressed in these papers are those of the author(s). It is expected that the working papers will be published in some otherform.
1
Bank Risk and Non-Interest Income Activities in the Indonesian Banking Industry
Wahyu Yuwana Hidayat*
Makoto Kakinaka† Hiroaki Miyamoto‡
Abstract The recent trend of product diversification in the Indonesian banking industry underscores the importance of non-interest income activities. This study examines the relationship between product diversification and bank risk over the period of 2002-2008. Our analysis shows clear evidence that the effect of product diversification on bank risk depends highly on the bank’s asset size. Specifically, the degree of product diversification is negatively associated with bank risk for small-sized banks. Conversely, the degree of product diversification is positively related to bank risk for large-sized banks. This finding suggests that deregulation encouraging banks to become more involved in non-traditional activities may have an adverse effect on the overall banking system where large-sized banks are playing a significant role in Indonesia. Keywords: Bank risk; Product diversification; Non-interest income activities
* Balance of Payment Bureau, Directorate of Economic and Monetary Statistics, Bank Indonesia, Jl. M.H. Thamrin No.2, Jakarta 10350, Indonesia (tel: 62-21-3818325, fax: 62-21-3800134, e-mail: [email protected]). † Corresponding Author, Graduate School of International Relations, International University of Japan, 777 Kokusai-cho, Minami-Uonuma, Niigata 949-7277, Japan (tel: 81-25-779-1421, fax: 81-25-779-1421, e-mail: [email protected]). ‡ Graduate School of International Relations, International University of Japan, 777 Kokusai-cho, Minami-Uonuma, Niigata 949-7277, Japan (tel: 81-25-779-1464, fax: 81-25-779-1464, e-mail: [email protected]).

2
1. Introduction
Recent trends in the integrated world economy with intensified competition spurred on by
financial deregulation in Indonesia have encouraged commercial banks to diversify the
range of financial services they offer clients. Product diversification under this new
environment tends to increase the share of non-interest income in profits. Non-interest
income profits stems from traditional services, like checking and cash management, as well
as from new financial services, like bank account management and investment banking. As
the supervisory authority, one concern for Bank Indonesia is whether or not the prevalence
of product diversification increases bank risk. This issue is crucial since high bank risk
gives rise to banking system instability. Given this context, this study discusses the
relationship between bank risk and product diversification by empirically examining a set
of risk and insolvency measures based on accounting data at the individual bank level in
Indonesia over the period of 2002-2008.
The diversification of income toward non-traditional activities has been crucial in
offsetting the decline in traditional income since the 1997 Asian financial crisis. At the
same time, Bank Indonesia has also adopted a banking policy to encourage commercial
banks to diversify their income toward non-traditional activities.1 Indeed, the fee-based
income ratio is now an important bank profitability indicator for Bank Indonesia.2 To
evaluate this banking policy, a more careful examination is required of the relationship
between non-traditional activities and bank risk. If the prevalence of product
diversification helps reduce bank risk, the banking policy will improve stability and the 1 Since the 1997 Asian crisis, Bank Indonesia has adopted various banking policies. These policies include the Basel II Accord, the Indonesian Banking Architecture (API), the Indonesian Financial System Architecture (ASKI), and the development of Sharia Banking (see Bank Indonesia, 2009, for the details). 2 The fee-based income ratio is one of the important indicators to determine bank’s profitability, as specified in Bank Indonesia regulation, Surat Edaran (SE) No.6/23/DPNP, May 31, 2004.
3
overall soundness of the banking system.
Many studies, most focusing on the US banking industry, examine the relationship
between product diversification and bank risk (see Saunders and Walter, 1994; Kwan and
Laderman, 1999, for a review). Kwast (1989), Santomero and Chung (1992), Templeton
and Severiens (1992), Saunders and Walter (1994), and Gallo, Apilado, and Kolari (1996)
show potential benefits of income diversification associated with the combination of US
banking and non-banking activities. In contrast, studies such as Boyd and Graham (1986,
1988), Sinkey and Nash (1993), Demsetz and Strahan (1997), Roland (1997), and Kwan
(1998), are inconclusive or present partial evidence supporting the notion that product
diversification with non-banking activities results in increasing US bank risk.
In particular, De Young and Roland (2001), Stiroh (2004), and Stiroh and Rumble
(2006) observe potential costs of product diversification by showing that non-income
activities are positively related with earnings volatility in the US. This finding is due in
part to a positive correlation between interest income and non-interest income. De Young
and Roland (2001) also emphasize that product diversification may not reduce risk because
of the relative instability of non-interest income, fixed costs associated with non-interest
income activities, and large earnings fluctuations with a high degree of financial leverage
associated with a lack of regulation. As for the relationship between product diversification
and bank risk outside of the US, a study by Lepetit, Nys, Rous, and Tarazi (2008) on
European banks for the period 1996-2002 finds that an expansion of their income into
non-interest activities increased bank risk, mainly due to commission and fee activities
rather than trading activities.
For the Indonesian banking industry, a risk supervision approach is attractive to
policymakers who desire a sound banking system and there are several studies related to

4
risk in the Indonesian banking system. For example, Santoso (1998) examines the
determinants of problem banks in Indonesia. Zulverdi, Gunadi, and Pramono (2007) study
banks’ behavior in portfolio selection and its impact on the effectiveness of monetary
policy. However, to the best of our knowledge, no extensive study has examined how
product diversification relates to bank risk in Indonesia. Thus, this study is a first attempt
to better understand this important issue in the Indonesian banking industry.
Following the methodology of Lepetit, Nys, Rous, and Tarazi (2008), this study
empirically investigates the relationship between non-interest income activities and bank
risk by utilizing alternative ways to measure bank risks based on income structure over the
period of 2002-2008. This analysis also examines how the relationship is associated with
bank size. Since fixed costs associated with fee-based financial services may enable
large-sized banks to take a more aggressive position on non-interest services than
small-sized banks, bank size might influence a banks’ behaviour in regards to non-interest
income activities. In this study, to better understand the role of non-interest income
activities, non-interest income is divided into two components: trading activities and
commission and fee activities. Indonesian commercial bank annual report data is used and
covers year-end balance sheets and income statements for 112 banks.
The analysis shows that bank size is a crucial factor determining how non-interest
income activities are associated with bank risk. More precisely, a higher reliance on
non-interest income activities entails a lower level of bank risk for relatively small-sized
banks but entails a higher level of bank risk for relatively large-sized banks. The
large-sized bank observation is consistent with the results of Kwan (1998), De Young and
Roland (2001), Stiroh (2004), and Lepetit, Nys, Rous, and Tarazi (2008) in that
non-banking activities increased bank risk. Furthermore, our results of size-dependent
5
responses of bank risk for small-sized banks are in contrast to those of Lepetit, Nys, Rous,
and Tarazi (2008) in that the positive link between non-interest income and bank risk is
more significant for small-sized banks.
The remainder of this paper is organized as follows. Section 2 introduces the
empirical methodology and data with several measures of bank risks, including insolvency
risk. Then the empirical results are presented and show the relationship between
non-interest income activities and bank risk. In particular, we focus on how the
relationship varies in response to the relative asset size of banks. Section 3 offers
concluding remarks with several implications related to banking policy.
2. Empirical Analysis
This subsection examines the relationship between product diversification and bank risk in
the Indonesian commercial banking industry.3 To capture the degree of product
diversification of each bank, the average ratio of net non-interest income to net operating
income (NNII) is used from each bank’s income statements of annual accounting data from
2002 to 2008. Net operating income is the sum of net interest income and net non-interest
income. Net non-interest income is computed as revenues from commissions and fees and
from foreign exchange plus gains on investment in securities minus losses on investment in
securities and foreign exchange transactions. Net interest income stems from traditional
banking activities, while net non-interest income stems from non-traditional activities. 3 According to the Indonesian banking law, banking institutions are classified into commercial and rural banks. Commercial banks differ from rural banks in that the latter do not involve directly in the payment system with some restrictions on operational areas. In terms of the operational definition, banks in Indonesia are classified into non-Sharia and Sharia-based principle commercial banks. The Sharia principle is the agreement, based on the Islamic principle, between banks and counterparts to deposit with and lend to each other (Indonesia Banking act No.7, 1992, as revised by Act No.10, 1998).

6
Stiroh (2004) and others regard non-interest income activities as a measure of the
degree of non-banking activities or product diversification. Furthermore, as a product
diversification measure for each bank, Stiroh (2004), De Young and Roland (2001), and
Lepetit, Nys, Rous, and Tarazi (2008) divide net non-interest income into two components:
the average ratio of net fee and commission income to net operating income (COM) and
the average ratio of net trading income to net operating income (TRAD). This
decomposition of non-interest income may be appropriate for the analysis of risk with
implications for different types of financial products.
Concerning bank risk, we follow the analysis in Lepetit, Nys, Rous, and Tarazi
(2008) and consider three standard measures of risk for each bank. The three standard
measures, which can be calculated from annual accounting data, are the standard deviation
of return on equity (SDROE), the standard deviation of return on assets (SDROA), and the
average ratio of loan loss provisions to net loans (LLP) over the sample period. To capture
insolvency risk for each bank, annual accounting data is used to calculate the Z-score
(ADZ) which indicates the probability of bank failure (see Boyd and Graham, 1986):
ADZ1 ROESDROE
,
where ROE is the average return on equity over the sample period.
Annual reports for Indonesian commercial banks are used to construct the
cross-sectional data for each bank on average and a standard deviation over the sample
period (2002-2008). The annual reports provided by Bank Indonesia cover year-end
balance sheets and income statements for 112 banks.4 We exclude banks that liquidated or
4 Due to the unavailability of quarterly data for all sample banks, the sample used for our analysis is annual data from the bank account information over the period of 2002-2008, so that there are only 7 observations available in calculating bank risk measures, SDROE, SDROA, and ADZ. Although we admit that the current analysis may suffer from substantial small sample biases, current analysis would

7
merged after 2002 from our sample.5
2.1. Some Preliminaries
As a preliminary investigation, this subsection first examines bank characteristics and bank
risk by dividing the whole sample into two groups: large- and small-sized banks based on
asset size. Then we check the relationship between bank risk and non-interest income by
dividing the sample into two groups: high and low levels of non-interest income activities.
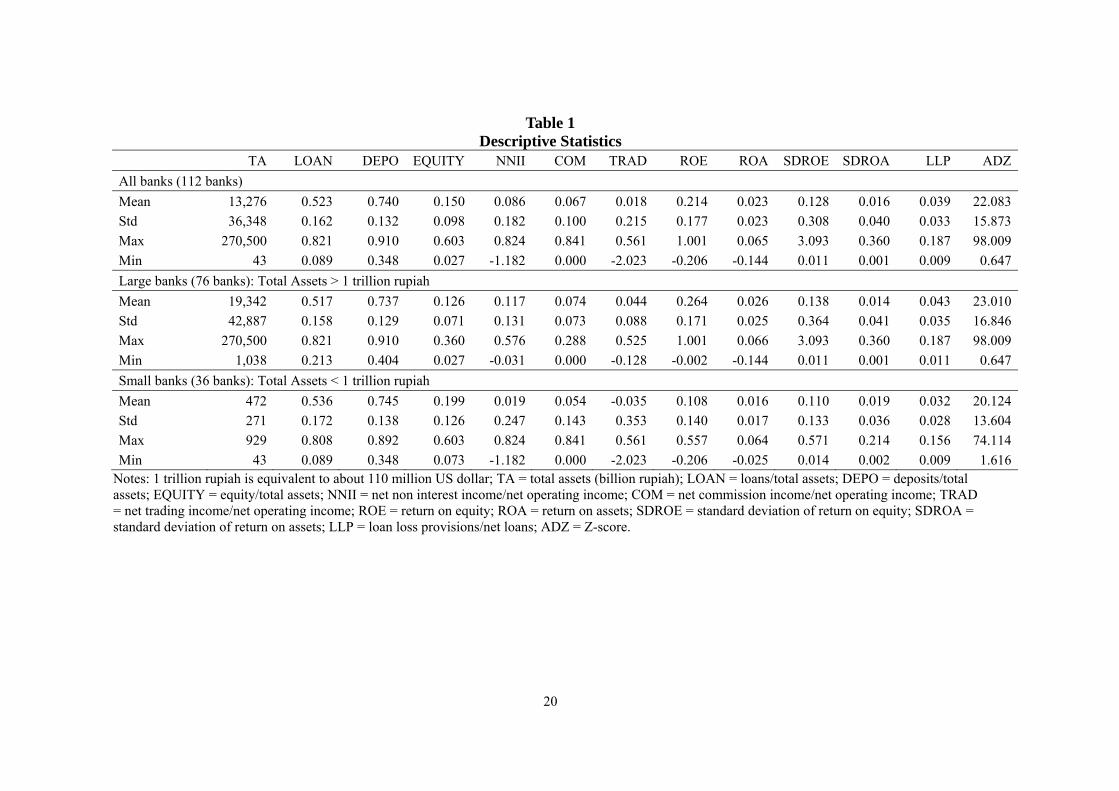
Table 1 presents descriptive statistics of all banks - large and small banks. Large
banks include those that have assets greater than 1 trillion rupiah. Small banks include
those that have assets smaller than 1 trillion rupiah.6 First, large banks exhibit a high
profitability with a high return on equity (ROE) and a high return on assets (ROA)
compared to small banks. Second, small banks show a high ratio of equity to total assets
(EQUITY) when compared to large banks. Third, most relevant to this study, net
non-interest income to operating income (NNII) is higher for large banks than small banks.
This implies that non-banking activities, including fee and commission income and trading
income, are relatively important for large banks compared to small banks. Fourth,
concerning the risk measures, large banks have higher bank risk (SDROE and LLP), while
small banks have higher insolvency risk (smaller ADZ).
provide some important implications about the relationship between non-interest income activity and bank risk. 5 As of 2009, there were 121 commercial (4 state owned banks and 117 private banks) and 2,296 rural banks in Indonesia. The banking industry dominates other financial industries with around 80% of total financial assets (Bank Indonesia Financial Stability Review No.14, March 2010, page 23-24). We exclude PT Bank Artamedia, PT Bank Universal, PT Bank Prima Express, and PT Bank Patriot merged and became PT Bank Permata, Tbk. The same treatment is also given to some banks due to incomplete data such as PT Bank Rabobank, Bank of China, PT Bank Capital Indonesia, and PT Bank Harta. 6 The cutoff asset size of 1 trillion rupiah may be considered somewhat arbitrary. However, this cutoff asset size, which divides all banks into the two groups, could be a publicly acceptable value as well as a simple value for our preliminary analysis in this study. In our sample, there are 76 large banks and 36 small banks.
8
Table 2 shows various bank characteristics and risk measures for each of the two
groups that are classified by the level of non-interest income activities. The group of banks
with a high level of non-interest income activities are those where the value of NNII is
higher than the median. Conversely, the group of banks with a low level of non-interest
income activities are those where the value of NNII is lower than the median. A similar
classification applies to the case of COM and TRAD to examine bank characteristics in
relation to fee-based and trading activities, respectively. The results are summarized as
follows.
First, banks with a high level of NNII are associated with low ratios of loans and
deposits to assets (LOAN, DEPO) and a high capital ratio (EQUITY). These banks are less
dependent on traditional intermediation activities with less capital leverage. Second, banks
with a high level of NNII are associated with large size total assets (TA). This implies that
large banks tend to intensify product diversification. De Young and Roland (2001) posit
that a possible reason may be that non-interest income activity requires significant fixed
costs. Third, most relevant to this study, the profitability measures, ROE and ROA, suggest
that banks with a low level of NNII appear to be more profitable than those with a high
level of NNII. Fourth, concerning the relationship between bank risks and non-interest
income activities, the banks with a higher NNII display higher bank risks (SDROE,
SDROA, and LLP) and higher insolvency risk (smaller ADZ). In sum, these findings seem
to be consistent with previous results from univariate mean tests by Lepetit, Nys, Rous,
and Tarazi (2008) in that non-interest income is positively associated with bank risk and
insolvency risk for European banks.
2.2. Model Specification

9
The previous subsection examined the relationship between bank risks and non-interest
income activities by simply comparing the average of key variables for different groups.
This subsection investigates more precisely the above relationship using multivariate
regression analysis. In particular, we discuss how bank risks are associated with product
diversification in relation to bank size. Modifying the model of Lepetit, Nys, Rous, and
Tarazi (2008), we estimate the model:
ln ln ∑ , (1)
where is the average value of risk measure for bank i over the sample period, and
is the average value of the measure of product diversification for bank i. The model
takes three bank risks (SDROE, SDROA, and LLP) and insolvency risk (ADZ) as bank
risk measures. The model also uses three measures of non-interest income activities for
each bank (NNII, COM, and TRAD) to capture the degree of product diversification. In
addition, ln is the natural logarithm of the average value of total asset for bank i,
which captures the size effect, and ’s are the average values of other control variables
that are expected to affect risk measure.
The other control variables in the model include return on equity (ROE), the
annual growth rate of total assets (∆LOG(TA)), the ratio of equity to total assets
(EQUITY), the ratio of loans to deposits (LDR), and the dummy variable which takes unity
for listed banks in the Indonesia Stock Exchange and zero for non-listed banks (Listed).7
ROE captures bank profitability. ∆LOG(TA) represents the effects of growth strategies
pursued by Indonesian banks after the 1997 Asian crisis and the implementation of a
Single Presence policy by Bank Indonesia.8 EQUITY, which approximates the capital
7 In our sample, there are 15 listed banks. 8 Single Presence is a condition where a party only becomes a Controlling Shareholder in 1 (one) Bank

10
ratio, in addition to LDR, captures the leverage effect. All variables except for the dummy
variable are the average value for each bank from 2002-2008.
One crucial aspect of the model is the inclusion of the interaction term with the
measure of product diversification and asset size, . The interaction term
captures bank risk in terms of the degree of product diversification in relation to asset size.
Lepetit, Nys, Rous, and Tarazi (2008) evaluate the role of asset size for European banks by
dividing the whole sample into two groups - large and small banks. Instead of this
classification, our study examines the role of asset size by including the interaction term in
the model. Differentiating equation (1) with yields:
ln ,
which captures how bank risk is associated with the degree of product diversification in
relation to asset size.
2.3. Results
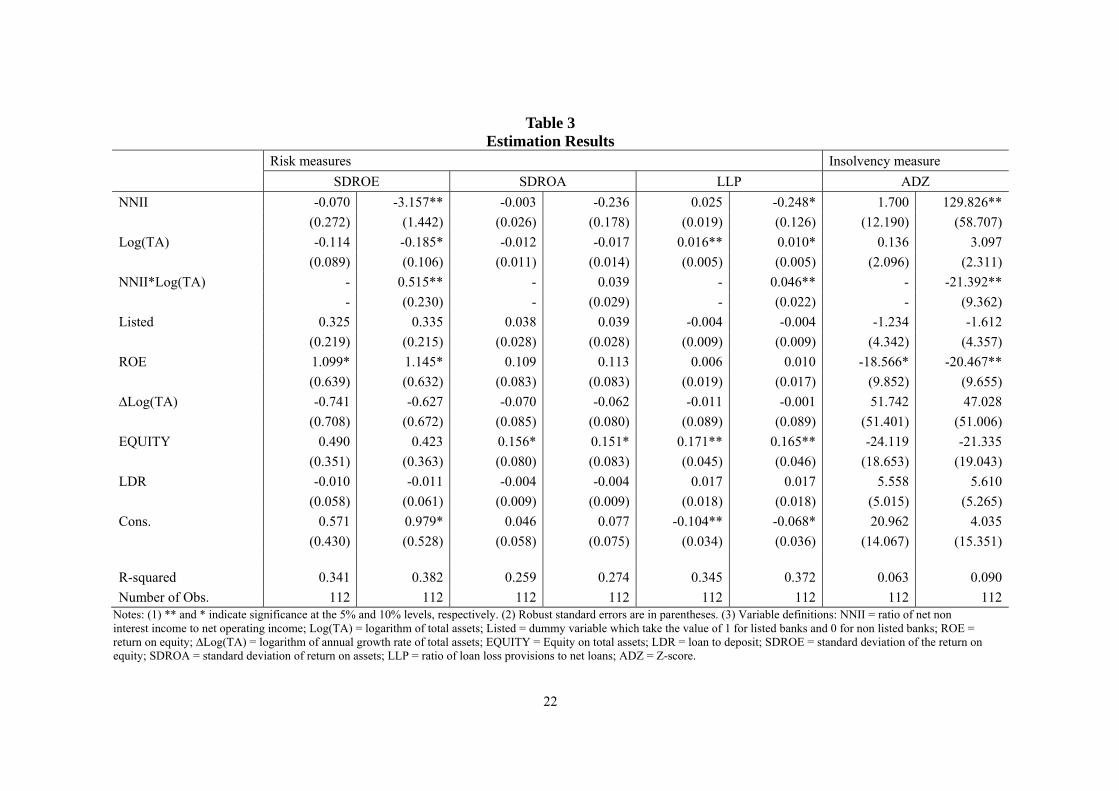
Table 3 shows the estimated results. Without the interaction term, , the
result shows that the coefficients on NNII are insignificant for all risk measures. That is,
non-interest income activities or product diversification appear to be independent of bank
and insolvency risks. However, with the interaction term in the model, non-interest income
activities have an effect on bank and insolvency risks, except for the regression with
SDROA as a dependent variable. For the regression with SDROE and LLP as a dependent
variable, the coefficients on NNII are significantly negative, and those on the interaction
term are significantly positive. For the regression with ADZ as a dependent variable, the
no later than the end of December 2010 (Bank Indonesia Regulation (PBI) Number 8/16/PBI/2006 concerning the Single Presence Policy in Indonesian Banks).
11
coefficient on NNII is significantly positive, and that on the interaction term is
significantly negative. These results suggest that the effect of product diversification on
bank and insolvency risks is highly dependent on the banks’ asset size. The degree of
product diversification is negatively associated with bank and insolvency risk for
small-sized banks, while the degree of product diversification is positively related to bank
and insolvency risks for large-sized banks.
The results of the size-dependent link between product diversification and bank
risk in Table 3 illustrates the critical role of asset size and the differential directional effect
of product diversification on bank risks. For the SDROE equation, the critical level of the
log of total assets is Log TA .
.6.13. Product diversification reduces bank risk for
banks with a TA less than 459 billion rupiah, while it increases bank risk for banks with a
TA larger than 459 billion rupiah.9 Similarly, for the LLP equation, the critical level of the
log of total assets is Log TA .
.5.39. Product diversification reduces bank risk for
banks with a TA less than 219 billion rupiah, while it increases bank risk for banks with a
TA larger than 219 billion rupiah. For the ADZ equation, the critical level of the log of
total assets is Log TA .
.6.07. Product diversification reduces insolvency risk
for banks with a TA less than 433 billion rupiah, while it increases insolvency risk for
banks with a TA larger than 433 billion rupiah.
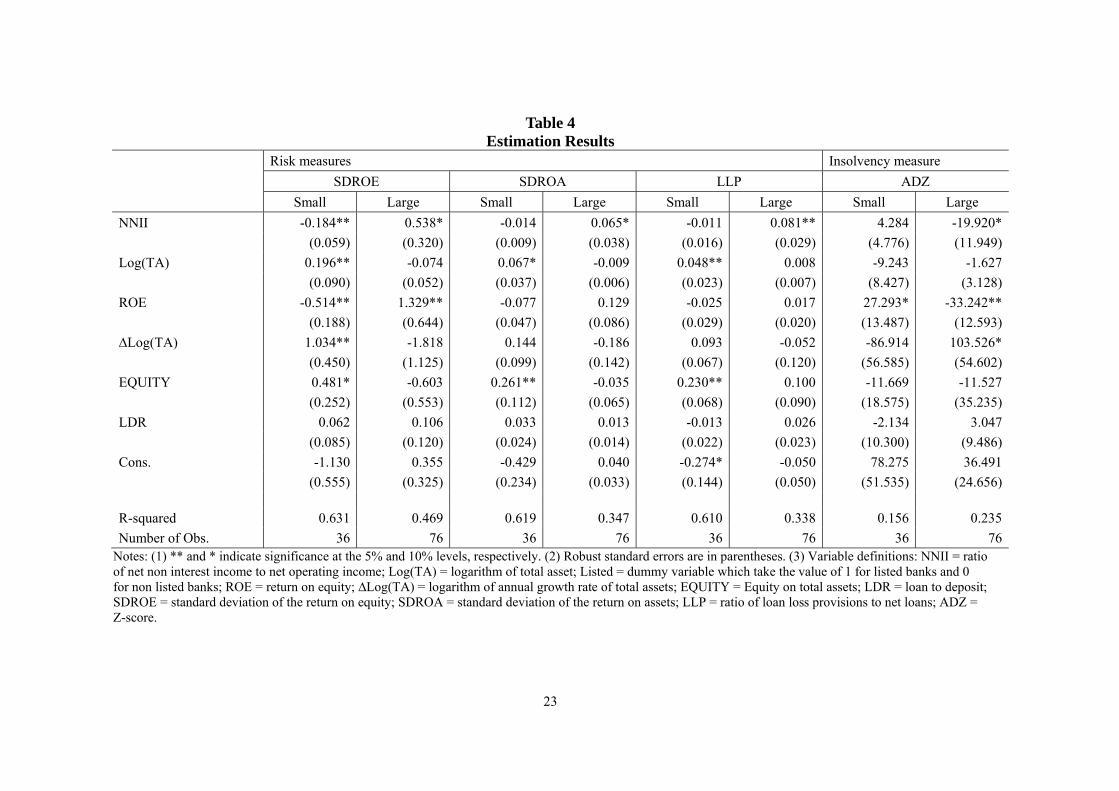
For the robustness check, Table 4 illustrates the estimation results without the
interaction term, , for each of the two subsamples (small-sized and
large-sized banks), which are classified in Table 1. Although some coefficients on NNII
are not significant, it appears that NNII is negatively related to risk measures for the
9 As of November 2011, 459 billion rupiah is equivalent to about 51 million US dollar.

12
subsample of small-sized banks, while NNII is positively related to risk measures for the
subsample of large-sized banks. Thus, these results in Table 4 provide some evidence of
the partial supports for the results in Table 3.
A possible explanation of why the relationship between product diversification
and bank risk depends on the asset size is as follows. Product diversification to non-interest
income activities entails benefits and costs in terms of bank risk. One important benefit is
to reduce risk through product diversification, similar to the logic of portfolio
diversification. On the other hand, as mentioned in De Young and Roland (2001), a cost
may be the relative instability of non-interest income compared to interest income. Given
the above argument, the balance of benefit and cost determines the positive or negative
relationship between product diversification and bank risk.
Our empirical results suggest that in terms of bank risk, the cost of instability of
non-interest income dominates the benefit associated with income diversification for
relatively large-sized banks. The opposite is true for relatively small-sized banks. Table 1
shows that large-sized banks are characterized by a large average ratio of net non-interest
income to net operating income (NNII). As asset size becomes larger, banks tend to engage
more aggressively in non-interest income activities, i.e., large-sized (small-sized) banks
tend to involve more (less) non-interest income activities. Thus, the negative impact of an
unstable NNII becomes more significant for large-sized banks than for small-sized banks,
so that it may dominate the positive impact of income diversification for large-sized banks.
Our observations for the Indonesian banking industry is different from the results of
Lepetit, Nys, Rous, and Tarazi (2008) in the European banking industry whereby the
positive link between product diversification and bank and insolvency risk is more
significant for small-sized banks.
13
Concerning the results of other control variables in Table 3, the coefficients on
Listed, ∆LOG(TA), and LDR are insignificant for all models. This finding implies that
bank risks appear not to be related to asset growth, the ratio of loans to deposits or whether
the bank is listed on the Indonesia Stock Exchange. On the other hand, the results show
partial support for the positive link between bank profitability and risk. The coefficients on
ROE in the SDROE and ADZ equations are all significant, although those in the SDROA
and LLP equations are insignificant. Moreover, the coefficients on EQUITY in the
SDROA and LLP equations are significantly positive. This finding implies that the capital
ratio is positively related to bank risk in terms of ROA fluctuation and loan loss provisions.
For a further investigation of the relationship between product diversification and
bank risk in relation to bank size, we divide non-interest income into trading activities and
commission and fee activities. These activities are considered alternative measures of
product diversification based on the work of Lepetit, Nys, Rous, and Tarazi (2008). Table
5 presents the results for the case where the average ratio of net commission and fee
income to net operating income (COM) and the average ratio of net trading income to net
operating income (TRAD) represent product diversification, instead of NNII in Table 3.
For the models without the interaction term, the coefficients on COM are significantly
positive in the SDROE and LLP equations and significantly negative in the ADZ equation.
On the other hand, the coefficient on TRAD is significantly positive only in the LLP
equation. Taken together, these results suggest that commission and fee activities could
intensify bank risk while the impact of trading activities on bank risk is less clear. The
intensified risk associated with commission and fee activities might support the finding
that earnings volatility of these activities is relatively high.
Furthermore, once the interaction terms, COM*Log(TA) and TRAD*Log(TA),

14
are introduced in the models, the results become somewhat complicated, as shown in Table
5. In the SDROA, LLP and ADZ equations, the coefficients on COM, TRAD, and the two
interaction terms, COM*Log(TA) and TRAD*Log(TA), are less significant, although the
coefficient on COM*Log(TA) in the SDROA equation is negative at the 10% significance
level. However, the SDROE equation shows the opposite signs for COM and TRAD (i.e.,
the coefficients on COM and COM*Log(TA) are respectively positive and negative while
those on TRAD and TRAD*Log(TA) are respectively negative and positive). The impact
of a rise in commission and fee activities on bank risk in terms of SDROE (earnings
volatility) is positive particularly for small-sized banks. Yet, its impact decreases and
becomes negative as the asset size increases. In contrast, the impact of a rise in trading
activities on bank risk is negative in terms of SDROE, but its impact diminishes and
becomes positive with a rise in the asset size.
Regarding other control variables in Table 5, the results are qualitatively similar to
those in Table 3. The coefficients on ∆LOG(TA) and LDR are insignificant so that bank
risks are not associated with asset growth or with the ratio of loans to deposits. On the
other hand, the coefficients on ROE in the SDROE and ADZ equations are significant.
Therefore, bank profitability is positively related to bank risk. Moreover, the significant
coefficients on EQUITY in the SDROA and LLP equations imply that the capital ratio is
positively related to bank risk in terms of the ROA fluctuation and loan loss provisions.
3. Conclusion
Financial stability, particularly after the Asian financial crisis, is a key issue for financial
regulators, including central banks and also all financial institutions. To achieve financial

15
stability, Bank Indonesia highly prioritizes the effectiveness and efficiency of bank
supervision by applying the twin approaches of compliance-based supervision (CBS) and
risk-based supervision (RBS). CBS stresses the monitoring of bank compliance and refers
to the past banking conditions. The primary objective is that each bank operates properly in
compliance with prudential banking principles. In contrast, RBS represents a
forward-looking approach to supervision which allows the supervisory authority to keep
greater room for proactive actions (see Bank Indonesia, 2009).
Given this environment, this study has examined risk implications of the recent
trends regarding diversified financial products that provide banks with additional sources
of income in the Indonesian banking industry. Our study provides clear evidence that
product diversification causes small-sized banks to reduce bank risk successfully but
magnifies bank risk for large-sized banks. The results in the Indonesian banking industry is
different from those of Lepetit, Nys, Rous, and Tarazi (2008) in the European banking
industry whereby the positive link between product diversification and bank and
insolvency risk is more significant for small-sized banks. Furthermore, the results from our
models demonstrate, to different extents, that greater reliance on commission and fee
activities is associated with higher bank risk in terms of earnings volatility particularly for
small-sized banks.
Our results have important policy implications related to bank supervision from
the perspective of bank risk in the Indonesian banking industry. The argument that product
diversification increases bank risk for large-sized banks suggests that deregulation
practices that encourage banks to pursue non-traditional activities may adversely affect the
banking system due to the sizeable market share of large-sized banks. Thus, the financial
authorities, including Bank Indonesia, must carefully monitor large banks’ behaviour

16
related to various bank and insolvency risks, such as credit risk, market risk, liquidity risk,
and operational risk, under the Basel II Accord framework. In particular, strict monitoring
policies to reduce bank risk might be needed for large-sized banks.
It should be noticed that our regression analysis has some limitations. For example,
we have focused on the discussion about how product diversification affects risk measures
in relation to banks’ asset size. However, when we examine the role of product
diversification, the analysis should take into account not only bank risk but also bank
profitability or efficiency due to their close interactions. More careful and extensive
examination about the relationship among product diversification, bank risk, and bank
profitability should be conducted to understand the in-depth feature of the Indonesian
banking industry. Next, our empirical analysis is based on averaged data over the small
sample period from 2002 to 2008. The small sample may cause substantial sample biases
in our estimation results. Moreover, the use of averaged data cannot enable us to capture
the dynamic aspects, including structural changes, although the Indonesian banking
industry has been developing rapidly with continuous changing environments.
Regarding future research directions, this initial study can also be extended in
several interesting directions. One possibility is to examine the relationship between
income structure and bank risk in the rural banking industry as rural banks have been
playing an increasingly important role in rural development. Generally, rural banks have
monopoly power due to the fact that people experience some difficulty in accessing funds
in their regions where there are few commercial banks. Appropriate regulatory policies for
rural banks might be different from those for urban commercial banks. Another direction is
to incorporate market-based risk measures into our discussion. The market-based risk
measures can supplement traditional analysis, which is based on financial accounting

17
statements, with forward-looking information from security prices. Most large banks are
now listed on the Indonesian Stock Exchange, and thus face regulatory monitoring and the
daily scrutiny of stock market participants. Finally, to date, there has been no empirical and
theoretical work performed on these important issues in the Indonesian banking industry.
Although we admit that it is challenging to verify empirically these important problems
due to a lack of data, we hope that the results derived in this paper can be a good starting
point and benchmark to test the relationship between product diversification and bank risk
in Indonesia.
References
Bank Indonesia (2009). Indonesian banking booklet 2009. Directorate of Bank Licensing
and Banking Information, Bank Indonesia.
Boyd, J.H., and Graham, S.L. (1986). Risk, regulation, and bank holding company
expansion into non-banking, Quarterly Review, Federal Reserve Bank of
Minneapolis.
Boyd, J.H., and Graham, S.L. (1988). "The profitability and risk effects of allowing bank
holding companies to merge with other financial firms: A simulation study,"
Quarterly Review, Federal Reserve Bank of Minneapolis.
Demsetz, R., and Strahan, P. (1997). Diversification, size, and risk at bank holding
companies. Journal of Money, Credit and Banking, 29, 300–313.
De Young, R., and Roland, K. (2001). Product mix and earnings volatility at commercial
banks: Evidence from a degree of total leverage model. Journal of Financial
Intermediation, 10, 54–84.

18
Gallo, J., Apilado, V., and Kolari, J. (1996). Commercial bank mutual fund activities:
Implications for bank risk and profitability. Journal of Banking and Finance, 20,
1775–1791.
Kwan, S.H. (1998). Securities activities by commercial banking firms’ Section 20
subsidiaries: Risk, return, and diversification benfits. In Proceeding from a
Conference on Bank Structure and Competition, Federal Reserve Bank of Chicago,
May, 531-552.
Kwan, S.H., and Laderman, E.S. (1999). On the portfolio effects of financial convergence:
A review of the literature. Economic Review, 1999-2, Federal Reserve Bank of San
Francisco, 18-31.
Kwast, M. (1989). The impact of underwriting and dealing on bank returns and risks.
Journal of Banking and Finance, 13, 101–125.
Lepetit, L., Nys, E., Rous, P., and Tarazi, A. (2008). Bank income structure and risk: An
empirical analysis of European banks, Journal of Banking and Finance, 32,
1452–1467.
Roland, K. (1997). Profit persistence in large U.S. bank holding companies: An empirical
investigation, Office of the Comptroller of the Currency, Economics Working Paper,
WP97-2.
Santomero, A.W., and Chung, E.-J. (1992). Evidence in support of broader banking powers.
Financial markets, institutions, and instruments, 1, 1–69.
Santoso, W. (1998). The determinants of problem banks in Indonesia: An empirical study,
Directorate of Banking Research and Regulations, Bank of Indonesia.
Saunders, A., and Walter, I. (1994). Universal banking in the United States: What could we
gain? What could we lose? Oxford University Press, New York.

19
Sinkey, J.F., Jr., and Nash, R.C. (1993). Assessing the riskiness and profitability of
credit-card banks, Journal of Financial Services Research, 7, 127–150.
Stiroh, K. (2004). Diversification in banking: Is non-interest income the answer? Journal
of Money, Credit and Banking, 36, 853–882.
Stiroh, K., and Rumble, A. (2006). The dark side of diversification: The case of US
financial holding companies. Journal of Banking and Finance, 30, 2131–2161.
Templeton, W.K., and Severiens, J.T. (1992). The effect of nonbank diversification on
bank holding company risk. Quarterly Journal of Business and Economics, 31, 3–16.
Zulverdi, D., Gunadi, I., and Pramono, B. (2007). Bank portfolio model and monetary
policy in Indonesia, Journal of Asian Economics, 18, 158-174.
20
Table 1 Descriptive Statistics
TA LOAN DEPO EQUITY NNII COM TRAD ROE ROA SDROE SDROA LLP ADZ
All banks (112 banks)
Mean 13,276 0.523 0.740 0.150 0.086 0.067 0.018 0.214 0.023 0.128 0.016 0.039 22.083
Std 36,348 0.162 0.132 0.098 0.182 0.100 0.215 0.177 0.023 0.308 0.040 0.033 15.873
Max 270,500 0.821 0.910 0.603 0.824 0.841 0.561 1.001 0.065 3.093 0.360 0.187 98.009
Min 43 0.089 0.348 0.027 -1.182 0.000 -2.023 -0.206 -0.144 0.011 0.001 0.009 0.647
Large banks (76 banks): Total Assets > 1 trillion rupiah
Mean 19,342 0.517 0.737 0.126 0.117 0.074 0.044 0.264 0.026 0.138 0.014 0.043 23.010
Std 42,887 0.158 0.129 0.071 0.131 0.073 0.088 0.171 0.025 0.364 0.041 0.035 16.846
Max 270,500 0.821 0.910 0.360 0.576 0.288 0.525 1.001 0.066 3.093 0.360 0.187 98.009
Min 1,038 0.213 0.404 0.027 -0.031 0.000 -0.128 -0.002 -0.144 0.011 0.001 0.011 0.647
Small banks (36 banks): Total Assets < 1 trillion rupiah
Mean 472 0.536 0.745 0.199 0.019 0.054 -0.035 0.108 0.016 0.110 0.019 0.032 20.124
Std 271 0.172 0.138 0.126 0.247 0.143 0.353 0.140 0.017 0.133 0.036 0.028 13.604
Max 929 0.808 0.892 0.603 0.824 0.841 0.561 0.557 0.064 0.571 0.214 0.156 74.114
Min 43 0.089 0.348 0.073 -1.182 0.000 -2.023 -0.206 -0.025 0.014 0.002 0.009 1.616 Notes: 1 trillion rupiah is equivalent to about 110 million US dollar; TA = total assets (billion rupiah); LOAN = loans/total assets; DEPO = deposits/total assets; EQUITY = equity/total assets; NNII = net non interest income/net operating income; COM = net commission income/net operating income; TRAD = net trading income/net operating income; ROE = return on equity; ROA = return on assets; SDROE = standard deviation of return on equity; SDROA = standard deviation of return on assets; LLP = loan loss provisions/net loans; ADZ = Z-score.

21
Table 2 Income Structure and Bank Characteristics
TA LOAN DEPO EQUITY NNII COM TRAD ROE ROA SDROE SDROA LLP ADZ
Banks with low NNII (56 banks)
Mean 6,763 0.537 0.787 0.130 -0.007 0.031 -0.039 0.228 0.024 0.084 0.009 0.026 23.349
Std 21,512 0.154 0.081 0.071 0.160 0.113 0.271 0.162 0.017 0.080 0.008 0.016 15.548
Banks with high NNII (56 banks):
Mean 19,789 0.509 0.693 0.169 0.178 0.103 0.075 0.200 0.021 0.173 0.022 0.053 20.816
Std 46,013 0.170 0.155 0.116 0.153 0.071 0.114 0.191 0.029 0.426 0.055 0.040 16.231
Banks with low COM (56 banks)
Mean 6,169 0.524 0.792 0.124 0.020 0.013 0.007 0.256 0.022 0.136 0.015 0.026 21.158
Std 19,791 0.161 0.081 0.072 0.032 0.010 0.029 0.184 0.028 0.407 0.047 0.016 13.130
Banks with high COM (56 banks)
Mean 20,383 0.521 0.688 0.175 0.151 0.122 0.029 0.172 0.023 0.122 0.016 0.053 23.008
Std 46,603 0.165 0.151 0.114 0.238 0.119 0.303 0.161 0.018 0.163 0.030 0.040 18.284
Banks with low TRAD (56 banks)
Mean 4,826 0.517 0.762 0.148 0.005 0.047 -0.041 0.215 0.024 0.105 0.011 0.030 21.492
Std 11,449 0.159 0.116 0.106 0.167 0.119 0.270 0.179 0.018 0.137 0.012 0.023 14.266
Banks with high TRAD (56 banks)
Mean 21,727 0.528 0.717 0.151 0.166 0.088 0.078 0.212 0.022 0.153 0.020 0.049 22.673
Std 48,886 0.166 0.143 0.090 0.160 0.074 0.112 0.177 0.028 0.415 0.054 0.039 17.441
Notes: TA = total assets (billion rupiah); LOAN = loans/total assets; DEPO = deposits/total assets; EQUITY = equity/total assets; NNII = net non interest income/net operating income; COM = net commission income/net operating income; TRAD = net trading income/net operating income; ROE = return on equity; ROA = return on assets; SDROE = standard deviation of return on equity; SDROA = standard deviation of return on assets; LLP = loan loss provisions/net loans; ADZ = Z-score.
22
Table 3 Estimation Results
Risk measures Insolvency measure
SDROE SDROA LLP ADZ
NNII -0.070 -3.157** -0.003 -0.236 0.025 -0.248* 1.700 129.826**
(0.272) (1.442) (0.026) (0.178) (0.019) (0.126) (12.190) (58.707)
Log(TA) -0.114 -0.185* -0.012 -0.017 0.016** 0.010* 0.136 3.097
(0.089) (0.106) (0.011) (0.014) (0.005) (0.005) (2.096) (2.311)
NNII*Log(TA) - 0.515** - 0.039 - 0.046** - -21.392**
- (0.230) - (0.029) - (0.022) - (9.362)
Listed 0.325 0.335 0.038 0.039 -0.004 -0.004 -1.234 -1.612
(0.219) (0.215) (0.028) (0.028) (0.009) (0.009) (4.342) (4.357)
ROE 1.099* 1.145* 0.109 0.113 0.006 0.010 -18.566* -20.467**
(0.639) (0.632) (0.083) (0.083) (0.019) (0.017) (9.852) (9.655)
∆Log(TA) -0.741 -0.627 -0.070 -0.062 -0.011 -0.001 51.742 47.028
(0.708) (0.672) (0.085) (0.080) (0.089) (0.089) (51.401) (51.006)
EQUITY 0.490 0.423 0.156* 0.151* 0.171** 0.165** -24.119 -21.335
(0.351) (0.363) (0.080) (0.083) (0.045) (0.046) (18.653) (19.043)
LDR -0.010 -0.011 -0.004 -0.004 0.017 0.017 5.558 5.610
(0.058) (0.061) (0.009) (0.009) (0.018) (0.018) (5.015) (5.265)
Cons. 0.571 0.979* 0.046 0.077 -0.104** -0.068* 20.962 4.035
(0.430) (0.528) (0.058) (0.075) (0.034) (0.036) (14.067) (15.351)
R-squared 0.341 0.382 0.259 0.274 0.345 0.372 0.063 0.090
Number of Obs. 112 112 112 112 112 112 112 112 Notes: (1) ** and * indicate significance at the 5% and 10% levels, respectively. (2) Robust standard errors are in parentheses. (3) Variable definitions: NNII = ratio of net non interest income to net operating income; Log(TA) = logarithm of total assets; Listed = dummy variable which take the value of 1 for listed banks and 0 for non listed banks; ROE = return on equity; ∆Log(TA) = logarithm of annual growth rate of total assets; EQUITY = Equity on total assets; LDR = loan to deposit; SDROE = standard deviation of the return on equity; SDROA = standard deviation of return on assets; LLP = ratio of loan loss provisions to net loans; ADZ = Z-score.
23
Table 4 Estimation Results
Risk measures Insolvency measure
SDROE SDROA LLP ADZ
Small Large Small Large Small Large Small Large
NNII -0.184** 0.538* -0.014 0.065* -0.011 0.081** 4.284 -19.920*
(0.059) (0.320) (0.009) (0.038) (0.016) (0.029) (4.776) (11.949)
Log(TA) 0.196** -0.074 0.067* -0.009 0.048** 0.008 -9.243 -1.627
(0.090) (0.052) (0.037) (0.006) (0.023) (0.007) (8.427) (3.128)
ROE -0.514** 1.329** -0.077 0.129 -0.025 0.017 27.293* -33.242**
(0.188) (0.644) (0.047) (0.086) (0.029) (0.020) (13.487) (12.593)
∆Log(TA) 1.034** -1.818 0.144 -0.186 0.093 -0.052 -86.914 103.526*
(0.450) (1.125) (0.099) (0.142) (0.067) (0.120) (56.585) (54.602)
EQUITY 0.481* -0.603 0.261** -0.035 0.230** 0.100 -11.669 -11.527
(0.252) (0.553) (0.112) (0.065) (0.068) (0.090) (18.575) (35.235)
LDR 0.062 0.106 0.033 0.013 -0.013 0.026 -2.134 3.047
(0.085) (0.120) (0.024) (0.014) (0.022) (0.023) (10.300) (9.486)
Cons. -1.130 0.355 -0.429 0.040 -0.274* -0.050 78.275 36.491
(0.555) (0.325) (0.234) (0.033) (0.144) (0.050) (51.535) (24.656)
R-squared 0.631 0.469 0.619 0.347 0.610 0.338 0.156 0.235
Number of Obs. 36 76 36 76 36 76 36 76 Notes: (1) ** and * indicate significance at the 5% and 10% levels, respectively. (2) Robust standard errors are in parentheses. (3) Variable definitions: NNII = ratio of net non interest income to net operating income; Log(TA) = logarithm of total asset; Listed = dummy variable which take the value of 1 for listed banks and 0 for non listed banks; ROE = return on equity; ∆Log(TA) = logarithm of annual growth rate of total assets; EQUITY = Equity on total assets; LDR = loan to deposit; SDROE = standard deviation of the return on equity; SDROA = standard deviation of the return on assets; LLP = ratio of loan loss provisions to net loans; ADZ = Z-score.

24
Table 5 Estimation Results
Risk measures Insolvency measure
SDROE SDROA LLP ADZ
COM 0.879** 5.823* 0.067 0.745 0.086* -0.142 -41.598** -99.484
(0.375) (3.377) (0.053) (0.460) (0.045) (0.310) (12.564) (97.758)
TRAD 0.025 -3.304* 0.004 -0.380 0.031* -0.171 -2.627 44.335
(0.108) (1.968) (0.016) (0.257) (0.018) (0.270) (5.309) (71.717)
Log(TA) -0.167* -0.106 -0.016 -0.007 0.013** 0.010* 2.569 1.849
(0.099) (0.065) (0.013) (0.010) (0.006) (0.006) (2.066) (2.360)
COM*Log(TA) - -0.855* - -0.116* - 0.032 - 10.172
- (0.508) - (0.069) - (0.045) - (15.726)
TRAD*Log(TA) - 0.607* - 0.071 - 0.033 - -8.484
- (0.353) - (0.045) - (0.045) - (12.695)
Listed 0.335 0.377* 0.039 0.044 -0.004 -0.003 -1.675 -2.215
(0.212) (0.215) (0.028) (0.028) (0.009) (0.009) (4.341) (4.629)
ROE 1.241* 1.145** 0.120 0.108 0.015 0.013 -25.027** -23.763**
(0.648) (0.555) (0.086) (0.074) (0.019) (0.020) (9.860) (10.412)
∆Log(TA) -1.072 -1.086 -0.095 -0.101 -0.032 -0.013 66.858 66.606
(0.755) (0.735) (0.094) (0.093) (0.091) (0.097) (51.262) (52.549)
EQUITY 0.329 0.392 0.144* 0.151* 0.160** 0.162** -16.753 -17.595
(0.350) (0.347) (0.084) (0.083) (0.047) (0.049) (18.810) (18.695)
LDR -0.002 -0.031 -0.003 -0.007 0.017 0.017 5.199 5.575
(0.058) (0.057) (0.009) (0.009) (0.018) (0.018) (4.802) (4.803)
Cons. 0.857* 0.515 0.067 0.020 -0.085** -0.070* 7.938 11.948
(0.488) (0.316) (0.069) (0.052) (0.037) (0.040) (13.635) (15.487)
R-squared 0.403 0.468 0.280 0.343 0.367 0.375 0.112 0.116
Number of Obs. 112 112 112 112 112 112 112 112 Notes: (1) ** and * indicate significance at the 5% and 10% levels, respectively. (2) Robust standard errors are in parentheses. (3) Variable definitions: COM = net commission income/net operating income; TRAD = net trading income/net operating income; Log(TA) = logarithm of total asset; Listed = dummy variable which take the value of 1 for listed banks and 0 for non listed banks; ROE = return on equity; ∆Log(TA) = logarithm of annual growth rate of total assets; EQUITY = Equity on total assets; LDR = loan to deposit; SDROE = standard deviation of the return on equity; SDROA = standard deviation of return on assets; LLP = ratio of loan loss provisions to net loans; ADZ = Z-score.


![A Study on The Site Scale and Arrangement Form of ...nirr.lib.niigata-u.ac.jp/bitstream/10623/37969/1/2012_1_niit1_31.pdf · ここ繋~ 3]l宗E]堤の施設柁品「絵図 国立公文書館蔵:超緒言古城絵図・未1の:)、およそS::l/-)00)](https://img.pdfslide.us/doc/110x75/5d66c2fa88c99356368b4c53/a-study-on-the-site-scale-and-arrangement-form-of-nirrlibniigata-uacjpbitstream1062337969120121niit131pdf.jpg)