Embed Size (px)
Citation preview

Bangladesh Institute of Bank ManagementS e c t i o n N o. - 2, M i r p u r, D h a k a -1216
B W2012ANK-REVIE

BANK-REVIEW 2012
Advisor & Editor
Dr. Toufic Ahmad Choudhury
Report PreparationTeam
Team LeaderDr. Shah Md. Ahsan Habib
MembersMd. Mohiuddin Siddique
Md. Nehal AhmedAtul Chandra Pandit
Editorial AssociatesDr. Bandana Saha
Abed Ali
Bangladesh Institute of Bank ManagementPlot # 4, Main Road # 1(South), Section # 2, Mirpur, Dhaka-1216
PABX: 9003031-5, 9003051-2, Fax: 88-02-9006756Email: [email protected], Web: www.bibm.org.bd
FOREWORDS
III
Preparation of 'Bank-Review 2012' is a collective endeavour of the team members that drews on
support of the faculty colleagues and other staffs of BIBM. This is the second annual issue of the
publication. This time 'the year' with the title of the publication is adjusted. The first issue of the
publication is titled as 'Bank Review 2010’, however this is named as 'Bank Review 2012' considering
the fact that the published data for 2011 can only be made available in mid-2012. In the process of
preparing this report, BIBM library, administration and publication wing have played a proactive role.
The preparation team received immense help and cooperation at the data collection stage from
a good number of executives working in the Bangladesh Bank and in the member banks of BIBM.
In this context, we would like to register our deep appreciation for the support received from the
officials of DOS, BRPD, SME and Statistics Departments of Bangladesh Bank. We are especially grateful
to Mr. Shahriar Siddiqui, Deputy Director, DOS, BB for his continuous support at the stage of data
gathering. We are also grateful to all the officials of relevant desks of commercial banks for their
cooperation. The preparation team is obliged to the faculty members for their suggestions and
support. Finally, we are indebted to the Advisor and Editor of the publication Dr. Toufic Ahmad Choudhury
for his continuous mentoring.
Dr. Shah Md. Ahsan Habib
Md. Mohiuddin Siddique
Md. Nehal Ahmed
Atul Chandra Pandit

V
MESSAGE FROM THE DIRECTOR GENERAL
Bangladesh Institute of Bank Management (BIBM) presents its second issue of the bank review titled
'Bank-Review 2012' - a publication started from the year 2011 that basically seeks to present a unique
way of assessing the strengths and weaknesses of the banking sector institutions of Bangladesh.
The study covers mainly the data of the banks for the calender year 2011.
In the Banking market of Bangladesh, the banks and financial institutions are operating in an intense
competitive environment where they need to locate their market niche so that they can craft and put
into use appropriate financial and marketing strategy. We hope the banks and financial institutions
would be benefited by the analysis contained in the Bank-Review. We, at the BIBM, envision the
Review to be our flagship publication and would welcome comments and suggestions from potential
users to improve upon our presentation.
(Dr. Toufic Ahmad Choudhury)
Director General

VII
CONTENTSAbbreviation IXChapter One: Background & Methodology 1 Background of the Report 3Methodology of the Report 5Limitations of the Report 11Organization of the Report 11
Chapter Two: Governance, Activities and Operations of Banks 13
Chapter Three: Health Report of the Banking Sector of Bangladesh 25 Performance Evaluation Criteria 27Strength and Soundness 28Size and Growth (S&G) 35Profitability and Efficiency (P&E) 48Asset Quality 54Inclusive and Online Banking 59
Chapter Four: Observations and Concluding Remarks 67Observations and Concluding Remarks 69Appendix One: A Short Review of the Specialized Banks of Bangladesh 74
List of TablesTable-1.1.1: Change in Capital Adequacy Ratio in between CY 2010 and CY 2011 30Table-1.1.2: Status of Top Performers in Terms of Capital Adequacy Ratio 30Table-1.2.1: NPL Net of Provision to Total Equity Ratio of Banks [Average] 31Table-1.2.2: Status of Top Performers in Terms of NPL to Equity Ratio 31Table-1.3.1: Liquid Assets to Short Term Liabilities of Banks [Average] 32Table-1.3.2: Status of Top Performers in Terms of Liquid Asset to Short Term Liability 32Table-1.4.1: Borrowing liability to Total Liability of Banks [Average] 33Table-1.4.2: Status of Top Performers in Terms of Liquid Asset to Short Term Liability 33Table-1.5.1: Advance Deposit (AD) Ratio of Banks [Average] 34Table-1.5.2: Status of Top Performers in Terms of Advance Deposit Ratio 34Table-2.1.1: Number of Deposit Account of Banks 36Table-2.1.2: Overall Performance of Banks in Terms of Number of Deposit Account (Average) 37Table-2.1.3: Status of Top Performers in Terms of Number of Deposit Account (Average) 37Table-2.2.1: Number of Branch of Banks 38Table-2.2.2: Overall Performance of Banks in Terms of Number of Branch (Average) 39Table-2.2.3: Status of Top Performers in Terms of Number of Branch (Average) 39Table-2.3.1: Total Revenue of Banks 40Table-2.3.2: Overall Performance of Banks in Terms of Number of Branch [Average] 40Table-2.3.3: Status of Top Performers in Terms of Total Revenue 41Table-2.4.1: Total Assets of Banks 41Table-2.4.2: Overall Performance of Banks in Terms of Total Asset [Average] 42Table-2.4.3: Status of Top Performers in Terms of Total Asset 42Table-2.5.1: Average Deposit Growth of Banks (%) 43Table-2.5.2: Status of Top Performers in Terms of Total Deposit Growth 43Table-2.6.1: Average Loan and Advance Growth of Banks(%) 44Table-2.6.2: Status of Top Performers in Terms of Total Loan and Advance Growth 45Table-2.7.1: Average Net Interest Income Growth of Banks (%) 45Table-2.7.2: Status of Top Performers in Terms of Net Interest Income Growth 46Table-2.8.1: Average Net Interest Income Growth of Banks (%) 46

List of TablesTable-2.8.2: Status of Top Performers in Terms of Net Interest Income Growth 47Table-3.1.1: Overall Performance of Banks in Terms of Return on Asset [Average] 49Table-3.1.2: Status of Top Performers in Terms of Return on Asset 50Table-3.2.1: Overall Performance of Banks in Terms of Return on Equity [Average] 51Table-3.2.2: Status of Top Performers in Terms of Return on Equity 51Table-3.3.1: Total Expense to Total Revenue of Banks 51Table-3.3.2: Status of Top Performers in Terms of Total Expense to Total Revenue 52Table-3.4.1: Profit Per Employee of Banks 53Table-3.4.2: Status of Top Performers in Terms of Profit per Employee of Banks 53Table-4.1.1: Growth in Gross NPL of Banks 55Table-4.1.2: Status of Top Performers in Terms of Growth in Gross NPL 55Table-4.2.1: Gross NPL to Total Loans & Advances 56Table-4.2.2: Status of Top Performers in Terms of Gross NPL to Total Loans & Advance 56Table-4.3.1: Credit Concentration 57Table-4.3.2: Status of Top Performers in Terms of Credit Concentration 58Table-4.4.1: Division Wise Share of Total Advances 58Table 5.1.1: Rural Branch (RB) to Total Branch (RB) 60Table-5.1.2: Status of Top Performers in Terms of Credit Concentration 61Table-5.2.1: Micro & Small Credit (MSC) to Total Credit (TC) (%) 61Table-5.2.2: Status of Top Performers in Terms of Micro & Small Credit to Total Credit 62Table 5.3.1: Agricultural Credit (AgC) to Total Credit (TC) 62Table-5.3.2: Status of Top Performers in Terms of Agricultural Credit to Total Credit 63Table-5.4.1: CSR Expenses to Total Asset 64Table-5.4.2: Status of Top Performers in Terms of CSR Expenses to Total Asset 64Table-5.5.1: Number of ATM Booth 56Table-5.5.2: Status of Top Performers in Terms of Number of ATM Booth 66Table-5.6.1: Number of Any Branch Banking Branch to Total Branch 66Appendix Table 1.1: Status of Deposits, Loans, Branches and Employees for the Year 2010 76Appendix Table 1.2: Status of Deposits, Loans, Branches and Employees for the Year 2011 77Appendix Table 1.3: Selected Growth Indicators of Specialized Banks 77
List of GraphsFigure-1.1.1 Capital to Risk Weighted Assets Ratio of Banks [Average] 29Figure-2.1.1: Share of Deposit Account of Banks in 2011 36Figure-2.2.1: Share of Number of Branch of Banks in 2011 38Figure-2.3.1: Share of Total Revenue in 2011 40Figure-2.4.1: Share of Total Assets of Banks in 2011 41Figure-2.5.1: Average Deposit Growth of Banks 43Figure-2.6.1: Average Loan and Advance Growth of Banks 44Figure-2.7.1: Average Net Profit/Net Income of Banks 45Figure-2.8.1: Average Net Profit/Net Income Growth of Banks 47Figure-3.1.1: Average Return on Asset of Banks 49Figure-3.2.1: Average Return on Equity of Banks 50Figure-4.3.1: Credit Concentration of Banks 57Figure-5.1.1: Share of Rural Branch in 2011 60Figure-5.2.1: Share of Micro & Small Credit in 2011 61Figure-5.3.1: Share of Agricultural Credit in 2011 63Figure-5.4.1: Share of CSR Expenses in 2011 64Figure-5.5.1: Share of ATM Booth 65Appendix Figure-1.1: Market Share of Specialized Banks in Advances, Deposits, Assets and Branches 75Appendix Figure-1.2: Average Growth Rates of Selected Expansion Indicators of the Specialized Banks 75Appendix Figure-1.3: Average Growth Rates of Selected Performance Indicators of the Specialized Banks 76
VIII
ABBREVIATION
IX
AAIBL Al-Arafah Islami Bank Limited
ABBL AB Bank Limited
ABL Agrani Bank Limited
ACH Automated Clearing House
AD Advance Deposit
AD Authorised Dealer
ALS Assured Liquidity Support
AQ Asset Quality
ATM Automated Teller Machine
BAL Bank Asia Limited
BASIC BASIC Bank Limited
BB Bangladesh Bank
BCBL Bangladesh Commerce Bank Limited
BCBS Basel Committee on Banking Supervision
BDBL Bangladesh Development Bank Limited
BDT Bangladesh Taka
BIBM Bangladesh Institute of Bank Management
BKB Bangladesh Krishi Bank
BRAC BRAC Bank Limited
BRPD Banking Regulation & Policy Department
BSB Bangladesh Shilpa Bank
BSEC Bangladesh Securities & Exchange Commission
BSRS Bangladesh Shilpa Rin Sangstha
BTRC Bangladesh Telecommunication Regulatory Commission
CAR Capital Adequacy Ratio
CBC Commercial Bank of Ceylon PLC
CDCS Certified Documentary Credit Specialist
CEO Chief Executive Officer
CIB Credit Information Bureau
Citi Citibank, N.A.
City The City Bank Limited
CL Classified Loan
CPD Centre for Policy Dialogue
CRM Credit Risk Management
CSR Corporate Social Responsibility
CY Calendar Year
DA Documents against Acceptance
DBBL Dutch-Bangla Bank Limited
DBL Dhaka Bank Limited
DOE Department of Environment
DOS Department of Off-site Supervision
DP Documents against Payment
ABBREVIATION
X
DSE Dhaka Stock Exchange
EBL Eastern Bank Limited
ECC Export Cash Credit
EDF Export Development Fund
EFT Electronic Fund Transfer
EIA Environmental Impact Assessment
EPZ Export Processing Zone
ERQ Exporters Retention Quota
ETP Effluent Treatment Plant
EXIM Export Import Bank of Bangladesh Limited
FCB Foreign Commercial Bank
FDBP Foreign Documentary Bills Purchased
FE Foreign Exchange
FSIBL First Security Islami Bank Limited
FY Fiscal Year
GDP Gross Domestic Product
GRI Global Reporting Initiative
HBL Habib Bank Limited
HHK Hybrid Hoffman Kiln
HRM Human Resource Management
HSBC The Hongkong and Shanghai Banking Corporation Limited
IBBL Islami Bank Bangladesh Limited
ICC Internal Control and Compliance
ICT Information and Communication Technology
IDRA Insurance Development and Regulatory Authority
IFIC IFIC Bank Limited
IPO Initial Public Offer
I & O Inclusive & Online Banking
JBL Janata Bank Limited
KSA Kingdom of Saudi Arabia
LC Letter of Credit
LIM Loan against Imported Merchandise
LTR Loan against Trust Receipt
MFI Micro Finance Institution
MICR Magnetic Ink Character Recognition
MTBL Mutual Trust Bank Limited
MTO Money Transfer Organization
MOF Ministry of Finance
MRA Micro-credit Regulatory Authority
NBL National Bank Limited
NBFI Non-bank Financial Institutions
NCCBL National Credit and Commerce Bank Limited
ABBREVIATION
XI
NPL Non Performing Loan
NRB Non-Resident Bangladeshi
ONE ONE Bank Limited
PBL Pubali Bank Limited
PC Packing Credit
PCB Private Commercial Bank
PD Primary Dealer
PEC Performance Evaluation Criteria
POST Point of Sale Terminal
PSTN Public Switched Telecommunication Network
P & E Profitability & Efficiency
RAKUB Rajshahi Krishi Unnayan Bank
RBL Rupali Bank Limited
RMU Risk Management Unit
ROA Return on Asset
ROE Return on Equity
SBL Sonali Bank Limited
SBI State Bank of India
SCB Standard Chartered Bank
SEBL Southeast Bank Limited
SEC Securities and Exchange Commission
SIBL Social Islami Bank Limited
SJIBL Shahjalal Islami Bank Limited
StBL Standard Bank Limited
SME Small & Medium Enterprise
SOCB State-owned Commercial Bank
SOD Secured Overdraft
SPCB Specialized Bank
SWIFT Society for Worldwide Interbank Financial Telecommunication
S & G Size & Growth
S & S Strength & Soundness
ST Short Term
TMSS Thengamara Samabay Samity
TT Telegraphic Transfer
UBL Uttara Bank Limited
UCBL United Commercial Bank Limited
UCP Uniform Customs and Practice
UCPDC Uniform Customs and Practice for Documentary Credits
URC Uniform Rules for Collection
URR Uniform Rules for Bank-to-Bank Reimbursements
URDG Uniform Rules For Demand Guarantees

Chapter One
Background & Methodology

Pag
e-03
Banks are the most significant of the financial intermediaries that play very useful roles in the
economic life of every modern state. In Bangladesh, banking sector is the core component of the
financial system engaged mainly in mobilizing funds and offering lending services. Banks lend to
businesses, consumers, and governments and thus contribute to production, innovation,
infrastructure development, job creation and overall prosperity. It is well recognised that sustainable
performance of banking sector and real sector development go hand in hand. To ensure sustainable
operation, banks are expected to contribute to both economic and social development of the country.
The financial system of Bangladesh mainly comprises of banks, NBFIs, MFIs and their regulatory
bodies. Most of the institutions in the financial sector are characterized by a mix of public and private
ownership. Of these broad sub-sectors, banks are dominant that hold significant market share of the
financial sector of Bangladesh. While the Bangladesh Bank has regulatory and supervisory jurisdiction
over the entire banking subsector as well as the NBFIs (excluding insurance companies), the
Bangladesh Securities and Exchange Commission (BSEC) exercises similar functions for the stock
exchanges and the merchant banks. Insurance companies and MFIs are regulated by IDRA and MRA
respectively.
The growth and evolution of the banking system of Bangladesh can be viewed in different broad
phases. Banking sector of Bangladesh performed poorly following independence, offering a narrow
range of products and inefficient delivery of financial instruments, and was largely non-competitive in
structure. To rectify weaknesses of the banking sector and to take forward the development, reforms
commenced in the early 1980s. The period from independence to the early 1980s was marked by the
expansion of bank branches by the government controlled banks. The period from early 1980s to early
1990s was the period of privatization of banks that allowed new banks in the private sector to
augment competition in the banking sector. The period from early 1990s is the period of financial
reforms and consolidation. Improving performances of the banking sector received priority mainly
since 1990 when government launched financial sector reform programs. The program pursued a
series of legal, policy, and institutional reforms to improve the process of financial intermediation to
ensure more efficient allocation of financial resources and to improve the competitiveness of the
private sector. Over the years, performance of the banking industry has improved by increasing their
scope of activities, improving service quality, engaging technology, and introducing social
connectivity through CSR practices. The changes have brought greater competition in the industry;
and the intensive and continuously increasing competition in the banking sector has created a need
for access to information for evaluating commercial banks operating in this market.
Background of the Report

Pag
e-04
Background & Methodology
Remarkable changes have taken place in the banking sector of Bangladesh in terms of size, market
structure, activities and performances over the years. The reforms injected more players in the
banking sector, with most banks increasing the range and diversity of their products and services.
Nevertheless, a few government controlled big banks still dominate the sector. In regard to the
change in governance, the enactment of the new banking laws and prudential regulations brought
discipline in the banking sector. As a whole, changes have taken place in terms of efficiency,
soundness, complexities and challenges. To cope with the growing changes and decision making,
reliable information is crucial.
In Bangladesh, different published sources1 capture comparative information on the performances of
broad groups of banks (SOCB, PCB, FCB, SPCB). This report is another effort to compare the different
broad groups of banks following different methodology. The main aim of the independent review is
to highlight performance and development in the banking sector and thus to contribut to the
country’s reliable business and economic information. In the report, a comparison of bank groups
would help identifying status of different bank groups as per selected performance indicators.
It would also have a comparison of the performances of the banking sector for the year 2010 and
2011. It is expected that this kind of publication would complement the existing disclosure system in
the banking sector of the country. This report might also help internal control team of a bank in
preparing annual report on the health of the bank that is required to be submitted to the MD and the
Audit Committee of the Board for onward submission to the Board of Directors – as suggested by the
Bangladesh Bank2.
1 Ministry of Finance, Bangladesh Bank etc.
2 In the guideline ‘Managing Core Risk in Banking: Internal Control and Compliance’ Bangladesh bank suggested a reporting structure for the internal control team of a bank according to which the
team would prepare an annual report on the health of the bank to be submitted to the MD and the Audit Committee of the Board for onward submission to the Board of Drectors.

Pag
e-05
Background & Methodology
Performance of 36 Banks are Evaluated
A total of 36 banks are considered for performance evaluation in this study. Banks with less than 1 per
cent market share (total volume of assets of a bank expressed as a percentage of total volume of
assets of the banking industry) are excluded3. For some of these banks, data were also not available.
Four specialized banks (BKB, RAKUB, BASIC and BDBL) have been excluded considering their different
nature of operations or non-availability of required/comparable data. Morever, reporting time line of
BKB and RAKUB is different from that of the other banks; and required consolidated data on BDBL
(formed by merging BSRS and BSB) are not available.
Bangladesh Bank and Annual Reports are Main Sources of Data
Annual Reports of the selected banks were collected to gather relevant information. Morever, data
from different departments of Bangladesh Bank like Banking Regulation and Policy Department
(BRPD), Department of Off-site Supervision (DOS), Statistics Department have been collected.
Published information sources of MOF are also used. A number of individual banks were contacted for
data validation.
Performances of the CY 2011 are considered
The data of mainly for the calender year 2011 of the selected banks are considered to evaluate the
performances of banks. A comparison has also been made between CY 2010 and CY 2011. Write-up on
‘Governance, Activities and Operation’ covers some additional recent information.
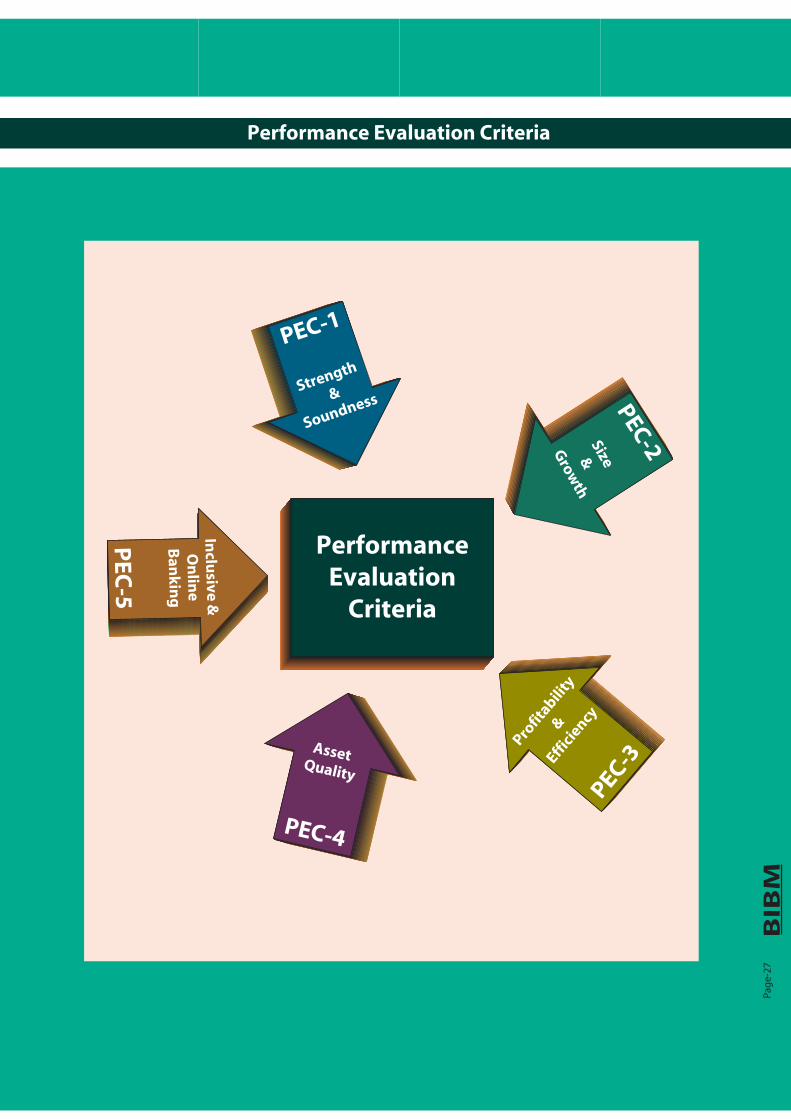
Bank groups are evaluated on Five Broad Performance Evaluation Criteria
Five broad Performance Evaluation Criteria (PEC) have been set up to evaluate banks’ performance:
Strength and Soundness; Size and Growth; Profitability and Efficiency; Asset Quality; and Inclusive and
Online Banking. Each broad criterion is allocated 20 percent weight and a few logically selected ratios
(indicators) have been complied . Five broad PECs are discussed along with their selected indicators as
follows.
3 Bank Alfalah, BCBL, Habib Bank, ICB Islamic Bank, National Bank of Pakistan, State Bank of India, Woori Bank.
Methodology of the Report
Pag
e-06
Background & Methodology
PEC 1: Strength and Soundness
The strength and soundness of a bank reflects the ability of a bank to absorb different shocks and
survive in an economic downturn. A financially sound bank can more easily achieve the confidence of
the customers than others. Financial Soundness and strength indicators are calculated and
disseminated to be used in macro prudential analysis, which comprises of assessment and control
over strengths and vulnerabilities of financial systems with a view to increasing financial soundness as
well as reducing probability of financial system bankruptcy. Five indicators have been used for
assessing the strength and soundness of banks:
PEC 1- Indicator 1: Capital Adequacy Ratio: Capital Adequacy Ratio (CAR) is a ratio of banks
Capital to Risk Weighted Assets. It is a ratio that regulators in the banking system use to watch bank's
health, specifically bank's capital to its risk. Higher ratio indicates better performance. The indicator is
computed as:
Capital to Risk Weighted Assets = [Total Eligible Capital ÷ Risk Weighted Assets] ×100
PEC 1- Indicator 2: NPL to Equity Ratio: Higher NPL is a recognized indicator of lack of
strength and soundness. The complete title of the ratio should be NPL net of provisions to total equity.
Like CAR, the ratio indicates a bank’s capacity to absorb credit risk. Lower ratio indicates better
performance. The indicator is computed as:
NPL to Equity Ratio = [(Classified Loan – Provision against Classified Loan) ÷Total Equity] ×100
PEC 1- Indicator 3: Liquid Assets to Short term Liabilities: To banks, liquidity is the
ability to meet obligations when they become due without incurring unacceptable losses. Here the
Liquid Assets are the sum of Cash, Balance with other banks and Financial Institutions, Money at call
and Short Notice and Investment. Short-term Liabilities are the sum of Borrowed Liabilities and Total
Deposits less Fixed Deposits. The ratio measures a bank’s ability to meet its short-term obligations
with its most liquid assets. Higher the ratio, better the performance. The indicator is computed as:
Liquid Assets to ST Liabilities = [Liquid Asset ÷ Short Term Liabilities] ×100
PEC 1- Indicator 4: Borrowing liability to Total Liability: Banks should mainly rely on
deposit liabilities as a source of fund to create their assets. Higher borrowing liabilities indicate greater
dependency on money market and lack of strength and soundness required to attract adequate
deposits. The indicator shows the proportion of borrowing liability of the total liabilities of a bank.
Lower ratio indicates better performance. The indicator is computed as:
Borrowing Liability to Total Liability = [Borrowed Liability ÷Total Liability] × 100
PEC 1- Indicator 5: Advance Deposit Ratio: Banks should maintain a balance between the
volume of advances and deposit. Advance deposit ratio is used to measure the degree of balance
between advance and deposit. High value of this ratio may increase bank income but may increase
liquidity risk and vice-versa.
Advance Deposit Ratio = [Total Advances ÷ Total Deposit] ×100

Pag
e-07
Background & Methodology
PEC 2: Size and Growth
Bank size affects profits of banks and ensures greater financial access. Relatively big banks have
greater opportunity to minimize risks and may enjoy economies of scale. Growth is recognized as one
of the prime indicators of the performance of any institution. Under this head, four indicators related
to size and four indicators related to growth are considered to assess the performances of banks.
PEC 2 - Indicator 1: Number of Deposit Account: Higher number of deposit account
indicates greater market share and bigger size of the bank. Absolute number of deposit accounts has
been used to assess the banks in terms of size. Larger the number of deposit accounts, better the
performance.
PEC 2 - Indicator 2: Number of Branch: Higher number of branches indicates greater market
share and bigger size of the bank. Absolute number of branches has been used to assess the banks in
terms of size. Larger the number of branches, better the performance.
PEC 2 - Indicator 3: Total Revenue: Higher volume of total revenue indicates greater volume
of activities and bigger size. Absolute volume of total revenue has been used to evaluate the banks in
terms of size. Higher the volume of total revenue, better the performance.
PEC 2 - Indicator 4: Total Asset: Higher volume of total assets indicates greater market share.
Absolute volume of total assets has been used to assess the banks in terms of size. Higher the volume
of total assets, better the performance.
PEC 2 - Indicator 5: Total Deposit Growth: Deposit growth indicates increase in sources of
funds by banks. Higher the growth rate of deposits, better the performance. The indicator is
computed as:
Deposit Growth = [(Current Year Deposit – Previous Year Deposit) ÷ Previous Year Deposit] ×100
PEC 2 - Indicator 6: Total Advance growth: Advance growth indicates increase in uses of
funds by banks. Higher the growth rate of advances, better the performance. The indicator is
computed as:
Advance Growth = [(Current Year Advance–Previous Year Advance)÷Previous Year Advance] ×100
PEC 2 - Indicator 7: Net Profit Growth: Growth in Net Profit is the most crucial indicator to
evaluate growth performance of any commercial institution. Higher the growth rate of net profits,
better the performance. The indicator is computed as:
Profit Growth = [(Current Year Profit – Previous Year Profit) ÷ Previous Year Profit] ×100
PEC 2 - Indicator 8: Net Interest Income Growth: Net Interest Income is generally the major
income of banks. Higher the growth rate of net interest income, better the performance. The indicator
is computed as:
Net Interest Income Growth = [(Current Year NII – Previous Year NII) ÷ Previous Year NII] ×100
Background & Methodology
PEC 3: Profitability and Efficiency
Profitability and Efficiency analyses are essential for the evaluation of performances of any
commercially run organization. Profitability is a concept associate with the objective of assessing a
bank's results from efficiency point of view for entire activities. It represents the modality to achieve
the major goal of bank's activity. The profitability and efficiency analyses are based on the following
four indicators to rank the banking performances.
PEC 3 - Indicator 1: Return on Assets (ROA): This indicator is also known as profit to assets
and measures the management capacity to use the financial and real resources of a bank in order to
generate profit. Higher the ratio, better the performance. The indicator is computed as:
Return on Assets: (Net Income after Tax ÷ Total Assets) × 100
PEC 3 - Indicator 2: Return on Equity (ROE): Return on Equity or profit to equity is a
recognized indicator of profitability which is used to measure the management efficiency in all its
dimensions. Higher the ratio, better the performance. The indicator is computed as:
Return on Equity: [Net Income after Tax ÷ Total Equity] × 100
PEC 3 - Indicator 3: Total Expense to Total Revenue: A measure of the total expenses
associated with earning of revenue by banks. It indicates efficient use of scarce resources by banks to
attain their goals. Lower the ratio, better the performance. The indicator is computed as:
Total Expense to Total Revenue = [Total Expenses ÷ Total Revenue] × 100
PEC 3 - Indicator 4: Profit per Employee: It is a ratio which indicates the productivity of the
employee of a bank. The higher the number, the more efficient the bank uses its employees to attain
its goal. Higher the ratio, better the performance. The indicator is computed as:
Profit per Employee = [Net Income after Tax ÷ Total Employees]
Pag
e-08
PEC 4: Asset Quality
Assets are the sources of earning for any organization. If the quality of assets deteriorates, it adversely
affects the earning potentials which eventually reduce the value of the firm. The largest category of
earning assets of a bank is loans and advances. So the consideration of the quality of loans is necessary
while performing the ranking. In evaluating asset quality, evaluators look at the existing and potential
loss exposure, primarily in the loan portfolio. Under this head, four indicators related to asset qualities
are considered to rank performances of banks.
PEC 4 - Indicator 1: Growth in Gross NPL: Growth in gross NPL indicates the change in the
performance of a bank in terms of asset quality. Lower the growth rate of Gross NPL, better the
performance. The indicator is computed as:
Gross NPL Growth = [(Current Year CL – Previous Year CL) ÷ Previous Year CL] ×100
PEC 4 - Indicator 2: Gross NPL to Total Advances: The ratio, Gross NPL to Total Loans and Advances,
indicates the portion of total advances that are non-performing. Lower the Gross NPL to Total
Advances, better the performance. The indicator is computed as:
Gross NPL to Total Advances = [Classified Loan ÷ Total Loan and Advances] ×100
PEC 4 - Indicator 3: Credit Concentration by Loan Size: Credit concentration has been measured in
terms of large loans. A loan has been considered as large loan if the outstanding loan amount is more
than 10% of its capital. Lower the Large Loan to Total Loans and Advances, better the performance.
The indicator is computed as:
Credit Concentration = [Total Large Loan ÷ Total Loan and Advances] ×100
PEC 4 - Indicator 4: Credit Concentration by Division: A good credit portfolio is one that is well
diversified in terms of allocation of advances or credit. High credit concentration increases credit
portfolio risk and vice versa. High concentration of bank advances to a particular division or region
may endanger a bank if that division or region is affected by natural calamity or other external event.
Credit Concentration = [Total Loans to a Division ÷ Total Loan and advances] ×100Pa
ge-
09
Background & Methodology
PEC-5: Inclusive and Online Banking
Inclusive banking is concerned with sustainable or ethical banking and is part of a larger societal
movement toward more social responsibility. This movement should include ethical investment and
distribution of resources and corporate social responsibility. In Bangladesh, inclusive operation of
banks should be connected with the distribution of banks resources to rural economy, the agricultural
sector, and micro and small enterprise sector. Online banking operation is another sustainable way of
offering quality banking services. It is said that online banking is the starting point of green or
environmental banking. Under this head, six indicators related to inclusive and online banking are
considered to rank performances of banks.
PEC 5 - Indicator 1: Rural Bank Branch to Total Branch: Higher number of Rural Bank Branch
indicates greater access to finance by the under privileged people. However, small banks have
limitation of setting up greater number of bank branches. Therefore, performance based on absolute
number of bank branches would be biased towards big banks. Thus two indicators have been used:
ranks based on absolute number of branches (higher the number of branches, better the
performance) and ranks based on the ratio of Rural Branch to Total Branch (higher the ratio, better the
performance).
PEC 5 - Indicator 2: Micro and Small Credit to Total Loans: Higher volume of Micro and Small Credit
to Total Credit indicates greater access to finance by the under served enterprises of Bangladesh.
Larger the volume of Micro and Small Credit to Total Loans and Advances, better the performance.
Micro and Small Credit to Total Loans = [Micro and small credit ÷ Total Loan and advances] ×100
PEC 5 - Indicator 3: Agricultural Credit to Total Loans: Higher volume of Agricultural Credit to Total
Loans and Advances indicates greater access to finance by the under privileged farmers or small rural
investors of Bangladesh. Larger the volume of Agricultural Credit to Total Loans, better the
performance.
Agricultural Credit to Total Loans = [Agricultural Credit ÷ Total Loan and advances] ×100
PEC 5 - Indicator 4: CSR Expense to Total Asset: Higher volume of CSR Expenditure to Total Assets
indicates greater contribution of a bank to community development and environmental activities.
Larger the ratio, better the performance.
PEC 5 - Indicator 5: Number of ATM Booth: Greater number of ATM booths indicates greater and
easier access of banking activities by the clients. Larger the number of ATM booth, better the
performance.
PEC 5 - Indicator 6: Number of Any Branch Bank to Total Bank: Greater number of branches under
Any Branch Banking indicates better status and networking of banks. Larger the number of branches
under Any Branch Banking, better the performance.
Pag
e-10
Background & Methodology

Limitations of the Report
The report is based on 36 banks. A few commercial banks and specialized banks have been excluded
from the study mainly because of non-availability of required data or different nature of operations.
Selection of right indicators could always be a matter of debate. For assessing the performances of
banks, a total number of 30 indicators have been identified under five broad Performance Evaluation
Indicators (PECs). This is not an exhaustive list.
Organization of the Report
The report is organized into four chapters. Chapter 1 discusses background and methodological
issues. Chapter 2 discusses the governance, activities, and operations of banks. Health of the banking
sector is examined based on some indicators in chapter 3. Chapter 4 summarizes the observations of
the report and offers concluding remarks. A general assessment of the specialized banks of the
country is attached as appendix to the report.
Pag
e-11
Background & Methodology

Chapter Two
Governance, Activities and Operations of Banks

Governance, Activities and Operations of Banks
Pag
e-15
The banking sector of Bangladesh comprises of 4 state-owned commercial banks (SOCBs)4,
4 specialized banks (SPB)5, 30 domestic private commercial banks (PCBs)6, and 9 foreign commercial
banks (FCBs)7. The FCBs are operating in Bangladesh as the branches of the banks which are in
operation abroad. PCBs can be categorized into conventional PCBs (28 conventional PCBs) that
perform the banking functions in conventional fashion i.e interest based operations; and Islamic
Shariah based PCBs (7 Islamic Shariah based PCBs) that execute banking activities according to Islamic
Shariah based principles. Other than these, there are nine newly licensed banks8. Of these, three have
already started operations and others are preparing to launch their operations. Other than these
scheduled banks9, there are 4 non-scheduled10 banks in the country. Over the years, the competitive
structure of the banks has changed; however, the operational and competitive environment of all
categories of banks is not the same. Full commercially motivated operational environment is mainly
enjoyed by the PCBs and FCBs. Government directed expansion of credit and some other relevant
services are performed by SOCBs and specialized banks of the country. In recent time though the
government has corporatized SOCBs and made them more autonomous to operate under better
commercial environment, no visible impact is observed.
As the regulatory and supervisory authority of the banking sector in Bangladesh, Bangladesh Bank
discharges its responsibility through a regulatory and supervisory framework. In regard to governance
framework, the ‘Prudential Regulations for Banks’11 published by the Bangladesh Bank is
a comprehensive and crucial document. It covers policies, rules, guidelines and requirements of the
governance of banks like capital adequacy, loan classification, core risk management; responsibilities
of chief executive officers, board of directors; disclosure requirements etc. In connection with
regulatory and supervisory changes, some recent initiatives of the Bangladesh Bank are remarkable.
Bangladesh Bank adopted financial sector regulatory and supervisory frameworks with sharper risk
and systemic stability focus in line with post-global crisis revisions of international best practice
standards. The more stringent loan classification norms formulated by the Bangladesh Bank are being
implemented in the country. Currently the central bank is implementing Basel II capital regime, and
preparations are on for phasing in Basel III capital and liquidity standards. Bangladesh Bank sharpened
its supervisory vigilance for improving corporate governance, risk management and disclosure
4 SBL, JBL, ABL, RBL
5 BASIC, BDBL, BKB, RAKUB
6 AAIBL, ABBL, BAL, BCBL, BRAC, City, DBBL, Dhaka, EBL, EXIM, FSIBL, IBBL, ICB Islamic Bank, IFIC, Jamuna, Mercantile, MTBL, NBL, NCCBL, ONE, PBL, Premier, Prime, SEBL, SIBL, SJIBL, StBL, Trust, UBL, UCBL.
7 Bank Alfalah, CBC, Citi, HBL, HSBC, National Bank of Pakistan, SBI, SCB, Woori Bank.
8 In April, 2012 Bangladesh Bank approved licensing of nine new commercial banks (three with NRB and six with indigenous sponsors).
9 The banks which get license to operate under Bank Company Act.
10 Ansar VDP Unnayan Bank, Karmashangosthan Bank, Probashi Kollyan Bank and Jubilee Bank that are established for special and definite objective and operate under the acts that are enacted
for meeting up those objectives, are termed as Non-Scheduled Banks. These banks cannot perform all functions of scheduled banks.11
Last published (updated version till September 2011).

Pag
e-16
Governance, Activities and Operations of Banks
practices in the financial sector. Bangladesh Bank started publishing Financial Stability Reports since
2011 to identify the risks that could affect individual bank, financial sector, and/or the economy.
Scheduled banks were instructed to establish a separate Risk Management Unit to develop risk
management capacity among them to manage the risks that can cause systemic threats and
jeopardize the stability of the entire financial system. Periodical stress testing has also been made
mandatory to bring out vulnerabilities of banks and financial institutions. Initiatives are also
undertaken to upgrade BB’s regulatory and supervisory capabilities continually to meet the emerging
new challenges. In addition to enacting and amending various prudential measures with the existing
acts, Bangladesh Bank examines the activities of the banks on a continuous basis with the ultimate
objective of establishing and maintaining a high level of professionalism in the banking sector.
The supervision by Bangladesh bank takes two forms- off site and on site. While off-site supervision is
carried through the report and statements submitted by the banks- on site goes the other way i.e.
examining or assessing the financial condition and compliance with the laid down rules and
regulations through directly visiting and observing the operations of the banks. These two
approaches are complementary to each other and if properly synchronized reduces the possibility of
large scale banking irregularities. To support the strengthening of prudential controls and increase
the effectiveness of supervision, BB adopted a new organizational structure in May 2012 aimed at
consolidating management of on-site and off-site supervision activities. In Bangladesh, Bangladesh
Bank is the true supervisor of the private sector and foreign banks only. Traditionally, Bangladesh
Bank does not have enough supervisory grips over the state owned commercial banks. That is a grey
area in our system and one of the major obstacles to ensure the proper functioning of the state
owned banks. The recently finalized draft of 'The Bank Company (Amendment) Act, 2013', with a view
to strengthening the country's banking system is a notable initiative. The amendment of the act is
aimed at bringing about 'discipline' in the management of banks. The previous act did not mention
the number of board of directors and the new version mentioned the number of bank directors not to
exceed 20. And out of them four directors will be independent. The tenure of the directors will be for
three years and none of them can be director for two consecutive terms. As per the new version, the
CEO can be removed by the Bangladesh Bank. The amendment is expected to bring positive changes
in improving regulatory and governance environment of banks.
Collection of deposits and offering credit are the core activities of banks. With the passage of time,
banks are facing growing competition in mobilising their expected volume of deposits and thus
effective marketing of deposit products is receiving increasing importance in banks as part of their
operational strategies. As of end February 2012, the total volume of deposits of all banks was close to
Pag
e-17
Governance, Activities and Operations of Banks
BDT 4500 billion of which 80 percent were time deposits (MOF, 2012)12 . Private sector is the prime
source of deposits and rural economy contributes around 13 percent of total deposits. Credit is the
main asset component of banks. According to a recent BIBM Review study (2012)13 , credit and
investment assets of scheduled banks amounted to a minuscule Taka 7.07 billion in December 1972
which stood 654 fold higher at over BDT4625 billion as of December 2011. And the total volume of
domestic credit of the country stood at around BDT 5548 billion as of February 2013 . According to BB
(2013)14 data on a year-on-year basis, the domestic credit recorded 13.37 percent growth at the end of
February 2013 of which 13.96 percent growth was in the private sector and 11.33 percent in the
private sector.
After running through a number of reform programs related to credit operation of banks, the banking
activities have reached a stage of reliability. Banks have been given almost full freedom for their own
credit operation. Selection of borrowers and appraisal of projects/economic activities are crucial
components of the credit operations of banks. In this connection, CRM is used by the banks for
handling credit risks in their lending operations. In addition, availability of different tools like online
Credit Information Bureau (CIB), legal support both for credit operation and loan recovery,
accessibility to tailored software and, most importantly, injection of a pool of talented bankers in the
banking sector truly upgraded the credit operation of commercial banks. Availability of these do not
only help a bank in the process of creating good quality loans but also help to maintain the quality of
the loans through proper monitoring, close supervision and frequent follow up. One indicator may be
the status of classified loan that came down to around 7 percent (of total outstanding loans) in June
2012 as compared to 27 percent in 1990. It is to be mentioned here that the improvement may even
be considered greater as over the years the loan-classification norms have been made more and more
stringent. The increase in the classified loans of the banking sector in 2013 is attributed mainly to the
implementation of the new classification norms (implemented from end December 2012) of the
central bank. Increase in risk taking activities is also evident in some instances. Different types of credit
concentration (such as urban concentration, trade concentration, etc.) are evident from the BIBM
review study (2012). Such inequitable distribution of advance by banks are not only creating
12 MOF (2012) Activities of Banks, Non-Bank Financial Instituations and Insurance Companies 2012, Ministry of Finance Government of Bangladesh.
13 BIBM (2012) Banking Review Series- an annual publication of BIBM, Dhaka, Bangladesh.
14 BB (2013) Bangaladesh Bank Quarterly, Vol-X, No-3, Bangladesh Bank.
Pag
e-18
Governance, Activities and Operations of Banks
economic disparity, but also adding credit concentration risk to the risk profile of the banks, requiring
additional capital under Basel-II. Slow recovery has been observed in the real estate, RMG and
commodity sector since mid 2011, compelling the entrepreneurs to reschedule their repayment. In
many instances, there are evidences of the compromise of loan quality in an atmosphere of ambitious
profit and intense competition. Moreover, some operational difficulty in connection with the effective
use of CRM is observed. As per the CRM guideline, a bank needs to have its own credit policy, risk
rating model, data base and checklists. Though CRM requires updating of the lending guidelines at
least annually, but a number of banks do not follow it meticulously. Banks use CRG scoring for all
types of lending other than consumer financing, small enterprise financing, short term agricultural
credit and micro credit. The banks are not maintaining any electronic database of the CRG score of the
borrowers although it is required by the CRM. Maintaining data base can help banks in developing
more rigorous internal risk rating model as required by Basel-II for switching over to advance
approach. Though required by the CRM, in some of the banks, effective segregation among
relationship management, credit administration and approval function has not been found (BIBM
Review 2012).
In regard to the sectoral distribution, the disbursement and recovery status of agricultural and rural
credit marked some improvement in recent period. According to the BB (2013) data, both
disbursement and recovery of the agricultural credit by the banking sector increased by over 15
percent during July 2012- February 2013 (relative to the same period of the previous year). In spite of
the improvement, the credit exposure of banks to the agricultural sector and rural economy remained
very limited. The contribution of agriculture sector to GDP is almost 20 percent but the flow of credit
to this sector in Bangladesh was only around 5.59 percent of total advance as of end 2011. To ensure
greater credit flows to the agricultural sector, Bangladesh Bank has made it mandatory for all banks to
disburse at least 2 percent of their total loans to the agricultural sector. About industrial credit, it is
well known that medium and large industrial units have been the main targets of the banks.
According to BB statistics (as of end 2011), of the industrial credit, over 85 percent goes to the large
and medium industries. Small enterprises get relatively less importance. However, though slowly, the
situation is improving over the years. According to BB (2003) update, outstanding position of SME
loans stood at BDT 1008 billion as of end December 2012. The specialized banks and private sector
banks have attained notable growth in the sector in recent period. Bangladesh Bank has undertaken
notable initiatives and introduced refinancing facilities to promote greater credit flows to the SME
sectors. The BB data show that small and cottage industries accounts for less than 5 percent and flows
of banks credits to the rural areas remained very limited.

Pag
e-19
Governance, Activities and Operations of Banks
In the area of international banking, banks offer trade payment, trade finance and foreign exchange
services. Trade payment is at the heart of international banking activities of banks in Bangladesh.
Letter of Credit (LC) is the most widely used method of payment both in import and export
transactions mainly because of the regulatory restrictions. According to BIBM Review Studies (2012
and 2013), in 2011 (January-December), 97 percent (number of cases) import payments from the
country were made through LC that has gone down to 86 percent in 2012. In case of export the figure
was 66 percent in 2011 that decreased to 60 percent in 2012. In spite of the change, documentary
credit remains the most widely used international trade payment methods in the country.
Documentary collection is the second most popular method. In contrast to most global economies,
the use of open account is very low. Cash in advance is used in a very limited number of cases both in
imports and exports. However, the use of documentary collection and open account is significantly
higher within EPZs of the country where the restrictions of the trade policies of the county are not
applicable. In regard to facilitation of trade payment, ‘delay in payment’ has been found as a common
practice by the trade service providing banks, which do not only harm institutional reputations of
banks but also the country’s image. As the LC is the most commonly used method of payment, UCPDC
is particularly relevant and important for the practitioners. Bangladesh Bank accepted UCP 600 as the
regulatory framework for LC operation for cross border trade in 2007. However, there has so far been
no such circular about URR725 or URC522. No guideline is there for ISP98 and URDG758. Sometimes it
creates confusion among practitioners. As mentioned earlier, banks offer financing facilities to the
exporters and importers. Though generally interest rate is not regulated by the Bangladesh Bank, in
export financing banks interest rates cannot exceed 7 percent. Back-to-back is a very popular trade
financing technique used by the banks to support garments exporters of the country. It is well known
that the regulatory provisions related to trade services in the EPZs are different. The trade payment
related restrictions of the trade policies are not applicable for EPZs of the country. Practically, there are
confusions among bankers about the provisions applicable for the EPZs. Instead of scattered and
piecemeal directives, a comprehensive master guideline on trade service practices of EPZ might help
bankers to act uniformly and correctly. Some other common procedural difficulties faced by the banks
are related to the timely receipt of bill of entry (from customs) and delay in the disbursement of EDF
fund. Several instances of non-repatriation of export proceeds, non-reporting, and malpractices in
trade services are concerns of the regulatory authority of the banking system. However, the cases of
non-payment of the accepted bills in local LCs became a grave concern for all quarters.
As observed by the BIBM Review (2012), remarkable changes may be observed in the operational
efficiency of the trade services departments of banks. Information technology is rapidly changing
the nature of international trade services in the country. ICT based activities like internet banking on
trade services, online reporting to BB, and new avenues for remittance can be identified as adaptation
of advanced ICT by the banking sector. Basically, it has enabled them to go for faster decision making,
prompt documentation and processing. Internally, quite a few banks are fully relying on software
based operations. It is a remarkable achievement that almost all executives working in the trade
services departments of different banks have training exposures. A considerable number of
employees of the concerned departments have received training from BIBM. A remarkable
improvement in connection with the development of professional bankers in the trade services area
reflects the growing number of Certified Documentary Credit Specialist (CDCS) in the banking sector
of the country. The number of CDCS holders in the country was only 1 till 2008, which increased to
over 100 by the end of 2011.
Treasury management function of banks received importance in the country only in recent years.
Liberalization of interest rates, exchange rates, and currency convertibility necessitate establishment
of treasury management unit in the commercial banks of the country. Considering the paramount
importance of the treasury operations, Bangladesh Bank has issued a guideline to establish a separate
treasury department in each bank. In Bangladesh money market is still very thin, because of lack of
diversified market participants and market instruments. Foreign exchange market is basically the spot
market. Very limited transactions take place in the market. Though, commodity swap has been
permitted to facilitate exporter to handle price risk, the product is hardly in use. Absence of secondary
market forces the bond market to stay at a budding stage. As a result, banks especially PD banks were
suffering from liquidity problem. To overcome the situation, the dealer banks were seeking immediate
operational and policy supports from the central bank. Bangladesh Bank was very active throughout
the year (2011) for managing the liquidity pressure of banks. BB has allowed PDs to enjoy assured
liquidity support (ALS) for a period of 75 days against their holdings of T-bills and T-bonds. The
illiquidity of financial markets may also be attributed to heavy government borrowing, huge L/C
payments of BPC by SOCBs and over lending by the banks, especially PCBs. Very recently (April 2013),
Bangladesh Bank has moved to introduce a new system to help commercial banks that face a liquidity
problem by adjusting the shortfall with another bank having surplus funds with the central bank.
Under the system, BB will be allowed to adjust a bank’s shortage in the cash reserve requirement
(CRR) and statutory liquidity ratio (SLR) with another bank with surplus funds with BB. Primary dealer
banks that have an obligation to invest in government securities and bonds may handle their CRR
shortfall using the provisions.
Pag
e-20
Governance, Activities and Operations of Banks

Pag
e-21
Banking sector in Bangladesh has started giving due emphasis on HR only in the recent years.
According to BIBM survey (2012), the banks have their individual HR policy but in many cases these
are not up to date and fully implemented. Two broad areas of HR, training and career development,
are getting growing importance in a good number of banks. The survey also shows that about
two-third of the banks have their separate training institute; others operate their training activity with
having a training cell along with other job. However, for training activities most banks heavily rely on
BIBM and external trainers. Major challenges for many banks are to develop the core competencies
and skills for different operational areas like credit appraisal, risk management and handling trade and
treasury activities. Even for most of the banks, there is no scientific method of selection of trainees.
Though performance appraisal is done jointly in many banks, yet in reality subordinates hardly
contradict bosses. Compensation discrepancies, and recruitment and retention of qualified
employees are other HRM challenges of the banks.
Notable improvement has taken place in the country in regard to e-banking services in Bangladesh.
Bangladesh Bank has been playing an active role to maintain and promote smooth and secured
e-banking operations. Banks have been allowed to make online money transactions, payment of
utility bills, transfer of funds, payments for trading goods and services through e-channels like
Internet, ATM, Mobile phone, etc. BB has issued Mobile Banking guidelines to facilitate and oversee
these initiatives in the financial sector. Considering the importance of information systems security in
banks BB has issued ICT security guidelines for banking and financial institutions. In regard to the use
of ICT in the banking operation, online access to Credit Information Bureau (CIB), installation of
Bangladesh Automated Clearing House (BACH), introducing MICR cheques and EFT are remarkable
events. As a part of stepping towards online banking, the FCBs have played the pioneer role with the
adoption of modern technology in retail banking since the early 1990s, whereas the SOCBs and PCBs
came forward with such services on a limited scale since the late 1990s. At present, several PCBs and
FCBs of the country offer limited Tele banking, Internet banking, and M-banking services.
Expansion of CSR and inclusive banking activities is a notable change in the banking sector in recent
years. Bangladesh Bank has been guiding banks and financial institutions into mainstreaming
Corporate Social Responsibility (CSR) in their institutional goals and objectives in line with inclusive
growth objectives of the country. The basic target is to engage the entire financial sector in
a sustained financial inclusion campaign to reach out to the unserved and underserved population. In
response to these, the expenditure of banks on CSR activities increased by over four times in the last
three years. As part of inclusion campaign, priority attention of the Bangladesh Bank has been
directed to adequacy of credit flows to agriculture, SMEs, renewable energy generation and women
Governance, Activities and Operations of Banks

Pag
e-22
entrepreneurship. Currently, banks may sanction loan of BDT 2.5 million to women entrepreneurs
without collateral but against personal guarantee under refinance facilities by BB if the borrower is
a women entrepreneur or if 51 percent shareholders of the borrowing enterprise are women. In order
to include large number of women micro entrepreneurs in the SME credit facilities, a policy of group
based lending of up to BDT 50,000 or above has been adopted. In response to the inclusion campaign
SOCBs have by now opened over ten million new bank accounts in favor of small farmers and other
low income groups with a nominal Taka ten initial deposits, enabling them to receive government
agricultural input subsidies/social safety net payments in these accounts, besides making other
transactions.
Banking sector of Bangladesh initiated green banking activities in recent period as part of their social
and environmental responsibilities. To foster green banking practices in the country, BB formulated
the ‘Green Banking Policy and Strategy framework’ and ‘Environmental Risk Management Guidelines’
in a consultative manner. Many banks are now financing environmental friendly projects. BB has also
introduced a refinance scheme worth BDT 2 billion refinance loans for effluent treatment plants
(ETPs), solar panels, bio-gas plants and HHK technology in brick making industry at a 5 percent
interest rate provided by banks. It is to be noted that banking sector of Bangladesh responded
remarkably by undertaking a number of initiatives in regard to in-house environment management,
environmental risk management and environmental reporting. Recently, honorable Governor of BB
has been adorned as ‘Green Governor’ in recognition of the green initiatives undertaken by the
central bank in the Doha Climate Change Conference.
The Internal Control & Compliance (ICC) department of banks is responsible for risk identification of
various activities of a bank. ICC is to recognize and assess all of the material risks that could adversely
affect the achievement of the bank’s goals. As narrated in the BIBM review study (2012), the head of
the internal control is responsible for the both compliance and control related tasks which include
compliance with laws and regulation, audits and inspection, monitoring activities and risk assessment.
The head of internal control unit should have a reporting line with the bank’s board. The audit
committee of the board can be the contact point for the internal control unit. This unit must also have
a reporting line with the Managing Director (MD) of the bank. Generally, the ICC of banks comprises
the following three units-Internal Audit & Inspection Unit, Monitoring Unit and Compliance Unit. The
audit team of the ICC assesses the effectiveness of the internal control system of the bank through
periodic internal audit. The monitoring unit is responsible to monitor the operational performance of
various branches. The compliance unit of ICC is to ensure that bank complies with all regulatory
requirements while conducting its business. BIBM review (2012) reveals that in spite of rapid changes
Governance, Activities and Operations of Banks

in banking operations due to technological developments, ICC manuals of individual banks are not
reviewed regularly. Even some of the banks have not yet introduced risk based audit plan. The
personnel of ICC department actually do not have the freedom to take corrective actions. The review
also finds that most of the banks have Risk Management Units (RMU) which is separate from ICC.
However, in reality, a close cooperation between ICC and RMU is supposed to improve risk
management capacity of a bank. Some of recent experiences and cases of unethical practices and
irregularities reassert the importance of the ICC in the context of the banking sector of the country.
The frequency and magnitude of such fraudulent activities inflicted huge burden on the banking
sector and has impacted the public confidence and reputation of the banking sector- a sector which
has shown significant growth, strength and discipline for a long period of time. The occurrence of
fund embezzlement also raised serious doubt in the minds of the depositors, regulators and other
stakeholders of the banking sectors about the financial discipline and operational standards. It is
generally recognized that such types of unscrupulous activity cannot take place without the active
collaboration or passive approval of the concerned bankers. Practically, the incidences reflect the
importance as well as failure of internal control mechanism of banks.
Success of the banking operation and performance of the banking sector heavily depend upon the
enabling and supportive environment to handle the growing complexity and challenges in the
banking sector. Enforcement of the prudential guidelines and effective risk based supervision is the
need of the time. Having a set of prudent regulatory measures, effective supervision depends upon
adequate power, sufficient resources and independence to foster good supervision. Central bank
needs strong support from the government to enforce its authority and supervisory power. Recent
evidences of irregularities demonstrate that Bangladesh Bank is not in a position to take corrective
measures on its own. Incidentally, Bangladesh Bank does not have enough supervisory grips over the
state controlled commercial banks. The way out of the fund misappropriation that is observed in
recent times in the banking sector rests upon a comprehensive and risk focused internal control and
internal audit in banks, sufficient autonomy of Bangladesh Bank, and zero tolerance by the
government and the central bank against any major violations of the banking norms. Only these can
offer an enabling environment where a risk based supervision approach by Bangladesh Bank with
a set of skilled central bankers can truly deliver. This is a necessity for improving the performance and
ensuring a sustainable banking sector of the country.
Pag
e-23
Governance, Activities and Operations of Banks
Chapter Three
Health Report of the Banking Sector of Bangladesh
Strength
&
Soundness
Size&
Grow
th
PerformanceEvaluation
Criteria
Profit
ability
&Effi
ciency
Asset Quality
Inclu
sive &O
nlin
eB
ankin
g
Performance Evaluation Criteria
Pag
e-27
PEC
-5
PEC-4
PEC-3
PEC-1
PEC-2
Strength&
Soundness
Performance Evaluation Criteria (PEC) -1: Strength & Soundness
Indicator-1:Capital Adequacy Ratio
Ind
icat
or-
2:
NP
L to
Equ
ity
Rat
io
Indicator-3:
Liquid Assets
to
Short - term
Liabilities
Indic
ator 5
:
Advance
Deposit (
AD)
Ratio (%
)
Pag
e-28
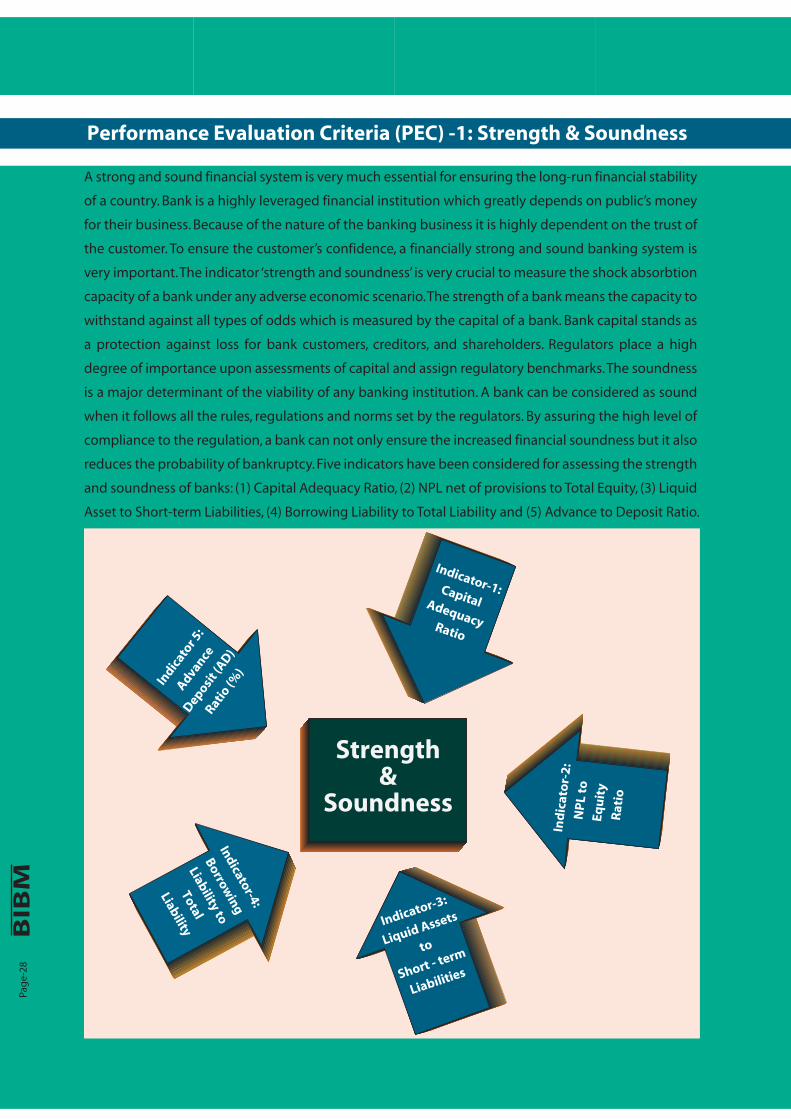
A strong and sound financial system is very much essential for ensuring the long-run financial stability
of a country. Bank is a highly leveraged financial institution which greatly depends on public’s money
for their business. Because of the nature of the banking business it is highly dependent on the trust of
the customer. To ensure the customer’s confidence, a financially strong and sound banking system is
very important. The indicator ‘strength and soundness’ is very crucial to measure the shock absorbtion
capacity of a bank under any adverse economic scenario. The strength of a bank means the capacity to
withstand against all types of odds which is measured by the capital of a bank. Bank capital stands as
a protection against loss for bank customers, creditors, and shareholders. Regulators place a high
degree of importance upon assessments of capital and assign regulatory benchmarks. The soundness
is a major determinant of the viability of any banking institution. A bank can be considered as sound
when it follows all the rules, regulations and norms set by the regulators. By assuring the high level of
compliance to the regulation, a bank can not only ensure the increased financial soundness but it also
reduces the probability of bankruptcy. Five indicators have been considered for assessing the strength
and soundness of banks: (1) Capital Adequacy Ratio, (2) NPL net of provisions to Total Equity, (3) Liquid
Asset to Short-term Liabilities, (4) Borrowing Liability to Total Liability and (5) Advance to Deposit Ratio.
Indicator-4:
Borrowing
Liability to
Total
Liability
Pag
e-29
S&S – Indicator 1: Capital Adequacy Ratio (%)
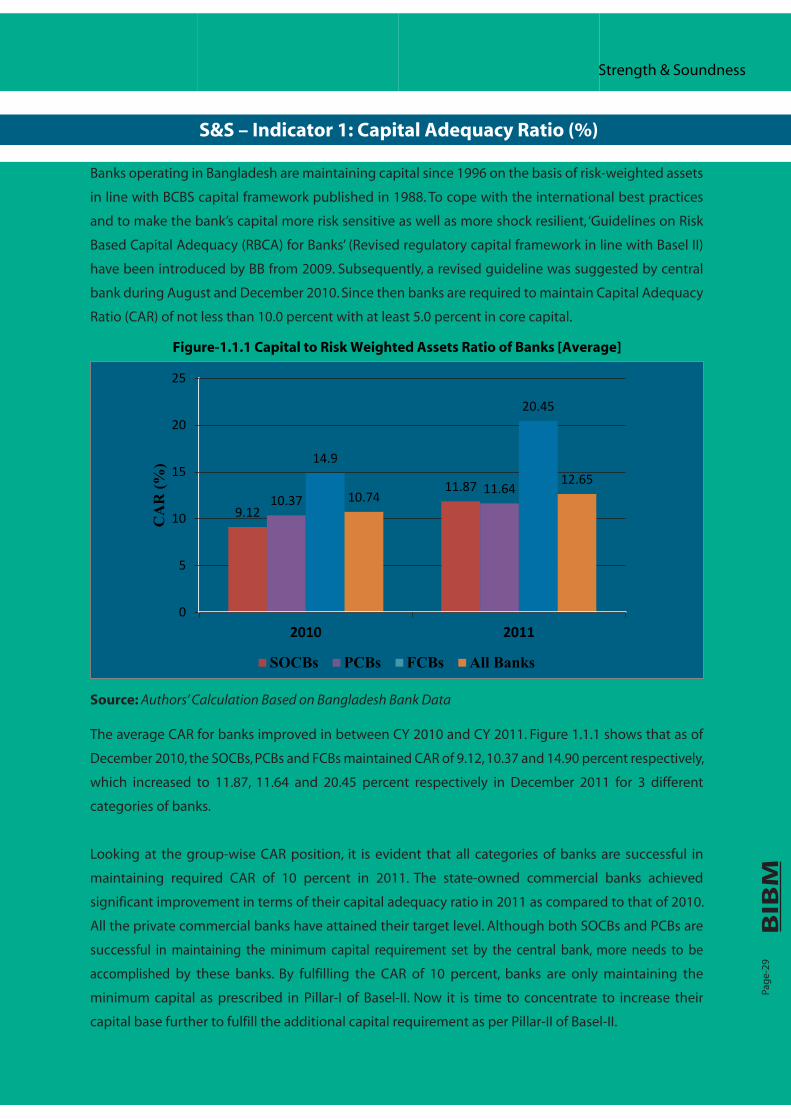
Figure-1.1.1 Capital to Risk Weighted Assets Ratio of Banks [Average]
Strength & Soundness
Banks operating in Bangladesh are maintaining capital since 1996 on the basis of risk-weighted assets
in line with BCBS capital framework published in 1988. To cope with the international best practices
and to make the bank’s capital more risk sensitive as well as more shock resilient, ‘Guidelines on Risk
Based Capital Adequacy (RBCA) for Banks’ (Revised regulatory capital framework in line with Basel II)
have been introduced by BB from 2009. Subsequently, a revised guideline was suggested by central
bank during August and December 2010. Since then banks are required to maintain Capital Adequacy
Ratio (CAR) of not less than 10.0 percent with at least 5.0 percent in core capital.
Source: Authors’ Calculation Based on Bangladesh Bank Data
The average CAR for banks improved in between CY 2010 and CY 2011. Figure 1.1.1 shows that as of
December 2010, the SOCBs, PCBs and FCBs maintained CAR of 9.12, 10.37 and 14.90 percent respectively,
which increased to 11.87, 11.64 and 20.45 percent respectively in December 2011 for 3 different
categories of banks.
Looking at the group-wise CAR position, it is evident that all categories of banks are successful in
maintaining required CAR of 10 percent in 2011. The state-owned commercial banks achieved
significant improvement in terms of their capital adequacy ratio in 2011 as compared to that of 2010.
All the private commercial banks have attained their target level. Although both SOCBs and PCBs are
successful in maintaining the minimum capital requirement set by the central bank, more needs to be
accomplished by these banks. By fulfilling the CAR of 10 percent, banks are only maintaining the
minimum capital as prescribed in Pillar-I of Basel-II. Now it is time to concentrate to increase their
capital base further to fulfill the additional capital requirement as per Pillar-II of Basel-II.
9.12
11.87 10.37
11.64
14.9
20.45
10.74 12.65
0
5
10
15
20
25
2010 2011
CA
R (%
)
SOCBs PCBs FCBs All Banks
Strength & Soundness
Pag
e-30
The average CAR of foreign commercial banks (FCB) was 20.45 percent as of end CY 2011, the way above
the requirement. As a whole, all the banks in the sector have crossed the target, which eventually helped
to reach the average CAR at 12.65 percent in 2011. The following table (1.1.1) shows the change in
capital adequacy ratio in between 2010 and 2011.
Table-1.1.1: Change in Capital Adequacy Ratio in between CY 2010 and CY 2011
(Figure in Percent)
Category of Banks 2010 2011 Cnange
SOCBs 09.12 11.87 2.75
PCBs 10.37 11.64 1.27
FCBs 14.89 20.45 5.56
All Banks 10.74 12.65 1.91
Source: Authors’ Calculation Based on Bangladesh Bank Data
The following table (1.1.2) represents the top performer bank, average of top two banks and average of
top three banks in terms of their capital adequacy ratio in 2010 and 2011 for all categories of banks. It is
already mentioned that FCB maintained a healthy capital adequacy ratio. The scenario is also reflected
in the table as FCB holds top three positions in terms of CAR.
Table-1.1.2: Status of Top Performers in Terms of Capital Adequacy Ratio
(Figure in Percent)
Top Performers: Top Performers: Top Performers: TopPerformers: All Banks SOCBs PCBs FCBs
2010 2011 2010 2011 2010 2011 2010 2011
Top Bank 19.08 28.06 09.83 12.84 14.80 14.87 19.08 28.06
Top Two Banks (Average) 17.63 26.20 09.57 12.70 13.60 14.25 17.63 26.20
Top Three Banks (Average) 16.69 22.76 09.40 12.41 13.18 14.02 16.05 22.76
Source: Authors’ Calculation Based on Bangladesh Bank Data
S&S – Indicator 2: NPL Net of Provisions to Total Equity (%)
A non-performing asset may be termed as an asset not contributing to the income of a bank. A loan is
nonperforming when payments of interest and principal are past due by certain amount of time
depending on the type of loan as decided by the central bank. High NPL ratio reduces the profitability
as the bank has to maintain the certain amount of provisioning against those nonperforming loans. So
the ratio NPL net of provisioning to total equity represents the bank’s capacity to absorb credit risk.
Strength & Soundness
Pag
e-31
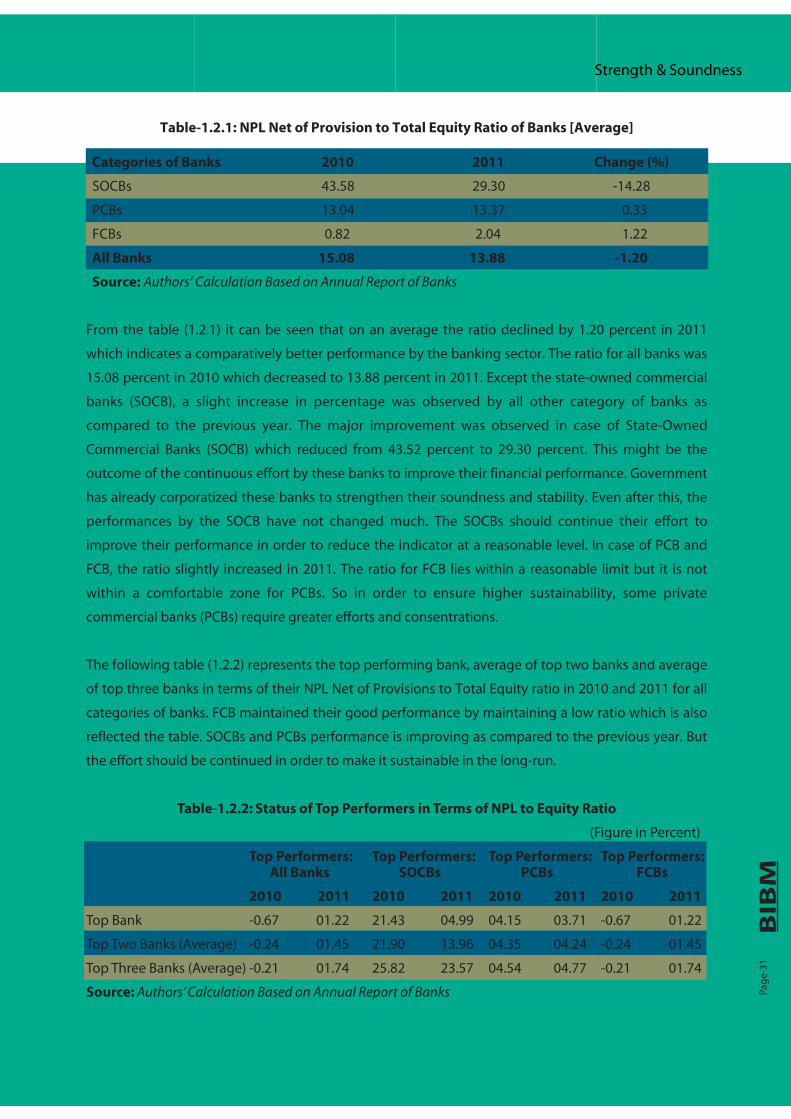
Table-1.2.1: NPL Net of Provision to Total Equity Ratio of Banks [Average]
Categories of Banks 2010 2011 Change (%)
SOCBs 43.58 29.30 -14.28
PCBs 13.04 13.37 0.33
FCBs 0.82 2.04 1.22
All Banks 15.08 13.88 -1.20
Source: Authors’ Calculation Based on Annual Report of Banks
From the table (1.2.1) it can be seen that on an average the ratio declined by 1.20 percent in 2011
which indicates a comparatively better performance by the banking sector. The ratio for all banks was
15.08 percent in 2010 which decreased to 13.88 percent in 2011. Except the state-owned commercial
banks (SOCB), a slight increase in percentage was observed by all other category of banks as
compared to the previous year. The major improvement was observed in case of State-Owned
Commercial Banks (SOCB) which reduced from 43.52 percent to 29.30 percent. This might be the
outcome of the continuous effort by these banks to improve their financial performance. Government
has already corporatized these banks to strengthen their soundness and stability. Even after this, the
performances by the SOCB have not changed much. The SOCBs should continue their effort to
improve their performance in order to reduce the indicator at a reasonable level. In case of PCB and
FCB, the ratio slightly increased in 2011. The ratio for FCB lies within a reasonable limit but it is not
within a comfortable zone for PCBs. So in order to ensure higher sustainability, some private
commercial banks (PCBs) require greater efforts and consentrations.
The following table (1.2.2) represents the top performing bank, average of top two banks and average
of top three banks in terms of their NPL Net of Provisions to Total Equity ratio in 2010 and 2011 for all
categories of banks. FCB maintained their good performance by maintaining a low ratio which is also
reflected the table. SOCBs and PCBs performance is improving as compared to the previous year. But
the effort should be continued in order to make it sustainable in the long-run.
Table-1.2.2: Status of Top Performers in Terms of NPL to Equity Ratio
(Figure in Percent)
Top Performers: Top Performers: Top Performers: Top Performers: All Banks SOCBs PCBs FCBs
2010 2011 2010 2011 2010 2011 2010 2011
Top Bank -0.67 01.22 21.43 04.99 04.15 03.71 -0.67 01.22
Top Two Banks (Average) -0.24 01.45 21.90 13.96 04.35 04.24 -0.24 01.45
Top Three Banks (Average) -0.21 01.74 25.82 23.57 04.54 04.77 -0.21 01.74
Source: Authors’ Calculation Based on Annual Report of Banks

Strength & Soundness
Pag
e-32
S&S – Indicator 3: Liquid Assets to Short Term Liabilities (%)
Bank usually mobilizes fund from the depositor and invest the amount in different business entity. They
always create a mismatch by doing this which sometimes put them in liquidity crisis. Liquidity is the
ability to meet obligations when they come due without incurring significant losses. For mitigating this
scenario, bank sometimes borrow from the call money market and other sources for a very short period
of time. The ratio measures a bank’s ability to meet its short-term obligations with its most liquid assets.
Higher ratio of liquid assets to short-term liabilities indicates the high ability of the bank to meet its
obligations which in turn indicates stability and soundness of the bank.
Table-1.3.1: Liquid Assets to Short Term Liabilities of Banks [Average]
Categories of Banks 2010 2011
SOCBs 58.99 73.67
PCBs 69.86 76.31
FCBs 69.19 89.66
All Banks 68.58 77.50
Source: Authors’ Calculation Based on Annual Report of Banks
From the table (1.3.1) it is evident that the ratio has improved significantly for all categories of banks.
As a result, the aggregate has also increased in 2011 from the previous year. The reason behind the
outcome is pretty simple. The banking sector has observed a severe liquidity crisis in 2010 in the history
of Bangladesh. The call money rate reached to highest ever in December 2010 (to 33.54 percent against
3.33 percent in July 2010) due to increase in demand for fresh fund in the inter-bank market following
the increase in CRR in mid-December 2010. Bangladesh Bank raised both CRR and SLR in mid-December
2010 to contain inflationary pressure. The weighted average call money rate declined after December,
2010 and the market remained stable at a tolerable level because of the timely intervention by the
Bangladesh Bank in the market. The liquidity pressure gradually eased in 2011 which helped all types of
banks to improve their ratio significantly.
Performance of top bank, average of top two banks and average of top three banks in terms of their
Liquid Asset to Short-term Liability ratio in 2010 and 2011 for all categories of banks is given in the
following table (1.3.2). In terms the ratio, performance of PCB is in top position among all types of banks
followed by FCBs and SOCBs.
Table-1.3.2: Status of Top Performers in Terms of Liquid Asset to Short Term Liability
(Figure in Percent)
Top Performers: Top Performers: Top Performers: Top Performers: All Banks SOCBs PCBs FCBs
2010 2011 2010 2011 2010 2011 2010 2011
Top Bank 163.69 198.52 132.51 95.60 163.49 198.52 106.37 32.99
Top Two Banks (Average) 148.00 169.04 100.14 83.19 147.23 169.04 92.27 28.04
Top Three Banks (Average) 142.32 154.16 87.34 78.15 134.74 154.16 78.83 04.05
Source: Authors’ Calculation Based on Annual Report of Banks

Strength & Soundness
Pag
e-33
S&S – Indicator 4: Borrowing liability to Total Liability (%)
The indicator shows the proportion of borrowing liability in the total liabilities of the bank. A bank is
supposed to rely more on deposit in order to create its assets. Higher borrowing liability to total liability
indicates greater dependency on money market for mobilizing fund. Usually, lower ratio is desirable
which specifies the soundness of the bank.
Table-1.4.1: Borrowing liability to Total Liability of Banks [Average]
Categories of Banks 2010 2011
SOCBs 0.69 2.39
PCBs 3.41 4.30
FCBs 1.89 0.97
All Banks 2.94 3.72
Source: Authors’ Calculation Based on Annual Report of Banks
The result of the above ratio is mixed for different categories of banks which is observes form the table
(1.4.1). As the ratio increased for majority of the banks, so the average for all banks reached to 3.72
percent in 2011. SOCBs and PCBs have observed an increase in the ratio in 2011 (2.39 and 4.30 percent
respectively) which indicates weakness in managing the liquidity although the change is not
significant. Alternatively this means their lack of strength and soundness to attract deposits to manage
their liquidity. The ratio declined for FCBs because of their low reliance on borrowed fund from call
market. This could be the outcome of their liquidity management efficiency by not depending on the
money market for mobilizing funds.
Top performances of all categories of banks in terms of Borrowed Liability to Total Liability in 2010 and
2011 are given in the following table (1.4.2). From the table, it is evident that top performer banks hardly
rely on borrowed liability. It is observed from the individual data that a number of banks do not have any
borrowing liability which is a good indication for the entire banking sector.
Table1.4.2: Status of Top Performers in Terms of Liquid Asset to Short Term Liability
(Figure in Percent)
Top Performers: Top Performers: Top Performers: Top Performers: All Banks SOCBs PCBs FCBs
2010 2011 2010 2011 2010 2011 2010 2011
Top Bank 0.00 0.00 0.01 0.02 0.00 0.00 0.00 0.00
Top Two Banks (Average) 0.00 0.00 0.04 0.17 0.00 0.00 0.00 0.00
Top Three Banks (Average) 0.00 0.00 0.09 0.53 0.00 0.00 0.89 0.57
Source: Authors’ Calculation Based on Annual Report of Banks
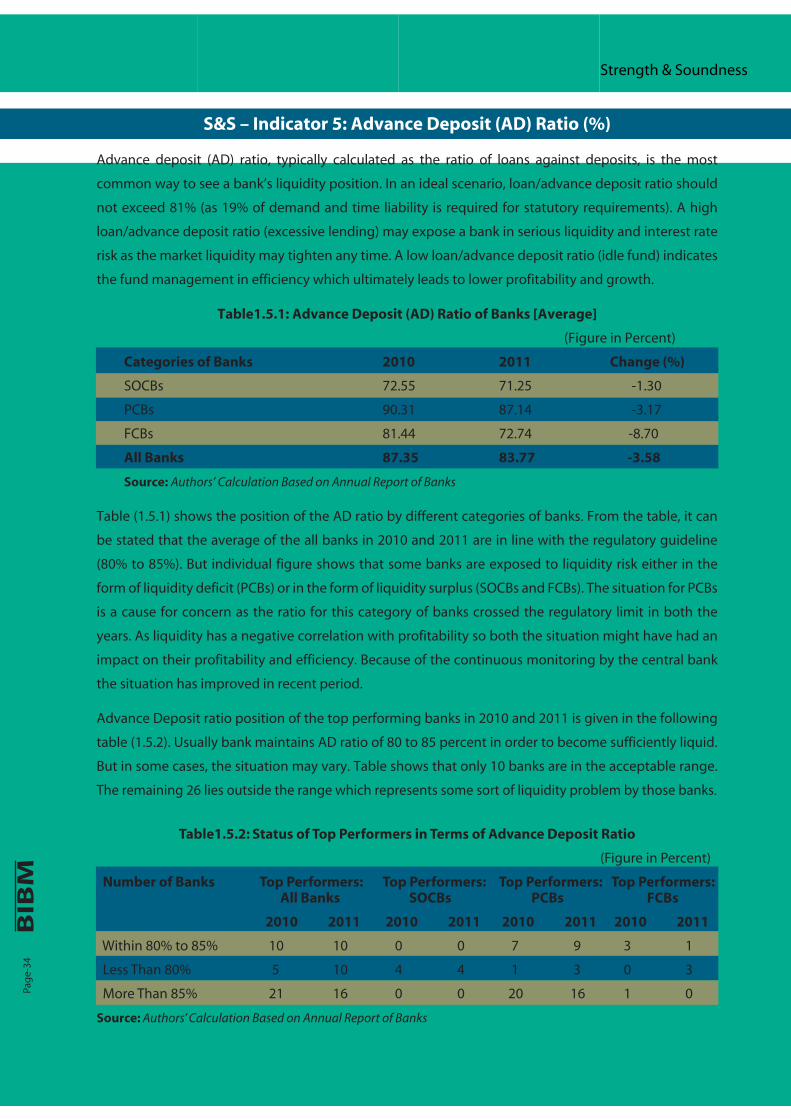
Strength & Soundness
Pag
e-34
S&S – Indicator 5: Advance Deposit (AD) Ratio (%)
Advance deposit (AD) ratio, typically calculated as the ratio of loans against deposits, is the most
common way to see a bank’s liquidity position. In an ideal scenario, loan/advance deposit ratio should
not exceed 81% (as 19% of demand and time liability is required for statutory requirements). A high
loan/advance deposit ratio (excessive lending) may expose a bank in serious liquidity and interest rate
risk as the market liquidity may tighten any time. A low loan/advance deposit ratio (idle fund) indicates
the fund management in efficiency which ultimately leads to lower profitability and growth.
Table1.5.1: Advance Deposit (AD) Ratio of Banks [Average]
(Figure in Percent)
Categories of Banks 2010 2011 Change (%)
SOCBs 72.55 71.25 -1.30
PCBs 90.31 87.14 -3.17
FCBs 81.44 72.74 -8.70
All Banks 87.35 83.77 -3.58
Source: Authors’ Calculation Based on Annual Report of Banks
Table (1.5.1) shows the position of the AD ratio by different categories of banks. From the table, it can
be stated that the average of the all banks in 2010 and 2011 are in line with the regulatory guideline
(80% to 85%). But individual figure shows that some banks are exposed to liquidity risk either in the
form of liquidity deficit (PCBs) or in the form of liquidity surplus (SOCBs and FCBs). The situation for PCBs
is a cause for concern as the ratio for this category of banks crossed the regulatory limit in both the
years. As liquidity has a negative correlation with profitability so both the situation might have had an
impact on their profitability and efficiency. Because of the continuous monitoring by the central bank
the situation has improved in recent period.
Advance Deposit ratio position of the top performing banks in 2010 and 2011 is given in the following
table (1.5.2). Usually bank maintains AD ratio of 80 to 85 percent in order to become sufficiently liquid.
But in some cases, the situation may vary. Table shows that only 10 banks are in the acceptable range.
The remaining 26 lies outside the range which represents some sort of liquidity problem by those banks.
Table1.5.2: Status of Top Performers in Terms of Advance Deposit Ratio
(Figure in Percent)
Number of Banks Top Performers: Top Performers: Top Performers: Top Performers: All Banks SOCBs PCBs FCBs
2010 2011 2010 2011 2010 2011 2010 2011
Within 80% to 85% 10 10 0 0 7 9 3 1
Less Than 80% 5 10 4 4 1 3 0 3
More Than 85% 21 16 0 0 20 16 1 0
Source: Authors’ Calculation Based on Annual Report of Banks
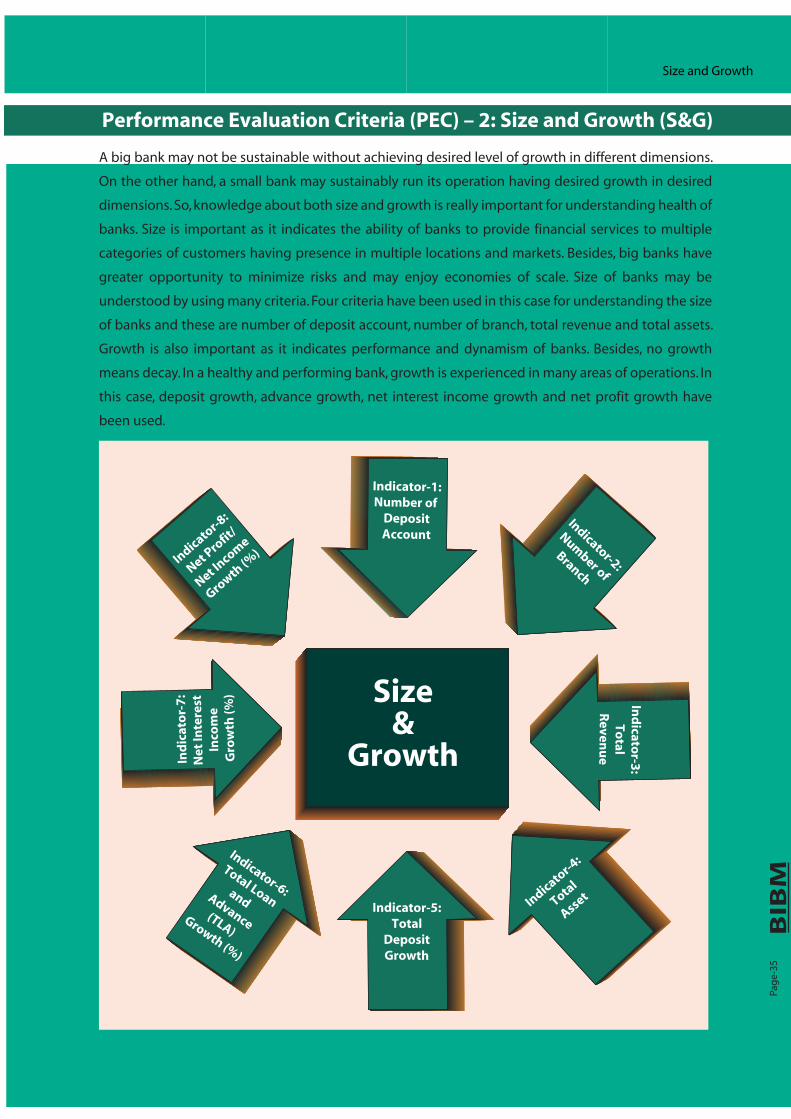
Pag
e-35
A big bank may not be sustainable without achieving desired level of growth in different dimensions.
On the other hand, a small bank may sustainably run its operation having desired growth in desired
dimensions. So, knowledge about both size and growth is really important for understanding health of
banks. Size is important as it indicates the ability of banks to provide financial services to multiple
categories of customers having presence in multiple locations and markets. Besides, big banks have
greater opportunity to minimize risks and may enjoy economies of scale. Size of banks may be
understood by using many criteria. Four criteria have been used in this case for understanding the size
of banks and these are number of deposit account, number of branch, total revenue and total assets.
Growth is also important as it indicates performance and dynamism of banks. Besides, no growth
means decay. In a healthy and performing bank, growth is experienced in many areas of operations. In
this case, deposit growth, advance growth, net interest income growth and net profit growth have
been used.
Size and Growth
Size&
Growth
Indicator-1:Number of
DepositAccount
Indicator-2:
Number of
Branch
Ind
icator-3
:To
talR
evenu
e
Indicato
r-4:
Total
AssetIndicator-5:
TotalDepositGrowth
Indicator-6:
Total Loanand
Advance (TLA)
Growth (%)
Ind
icat
or-
7:
Net
Inte
rest
In
com
e G
row
th (%
)
Indicato
r-8:
Net Pro
fit/
Net Incom
e
Growth
(%)
Performance Evaluation Criteria (PEC) – 2: Size and Growth (S&G)

Pag
e-36
Size and Growth
S&G - Indicator 1: Number of Deposit Account
Number of deposit account indicates the size of a bank and is used to understand relative market share.
Bank uses deposit accounts to accumulate small scattered savings of the people and converts savings
into investment by giving loans to borrowers. Volume of loans of a bank is tied up with deposit
mobilization through deposit accounts in two ways: one, deposit is the largest source of funds; and two,
banks are not allowed to cross loan-deposit ratio ceiling. So, number of deposit account is a very useful
indicator of bank size, market share, and also regulator of volume of revenue generating activities.
Table-2.1.1 shows that the number of deposit account of the banks has increased by 12.95 percent in
the year 2011 over the year 2010. This growth is mostly contributed by the PCBs that experienced 24.84
percent growth on a large base of 16119 thousand deposit accounts. FCBs, on the other hand, achieved
lowest growth in deposit accounts in the year 2011. Similar picture is also evident from the average
growth rates of the banks. SOCBs, as shown is Figure-2.1.1, hold the leading position in terms of market
share of deposit accounts in 2011 with 53.09 percent of total deposit accounts of all banks. It is also
evident that the market share of SOCBs and FCBs has decreased and the same of the PCBs has increased
in 2011 compared to 2010. Such increase in the number deposit account of the banks will allow more
people to have access to the banking network of the country. This is also expected to mobilize more
funds for creating new loans.
Table-2.1.1: Number of Deposit Account of Banks
(Figure in Thousands)
Categories of Banks 2010 2010 (%) 2011 2011(%) Growth(%) Average
Growth Rate (%)
SOCBs 22230 57.37 23237 53.09 4.53 5.08
PCBs 16119 41.60 20123 45.98 24.84 26.78
FCBs 398 1.03 406 0.93 2.01 0.94
All Banks 38747 100 43766 100 12.95 21.50
Source: Authors’ Calculation Based on Bangladesh Bank Data
Figure-2.1.1: Share of Deposit Account of Banks in 2011
Source: Based on Bangladesh Bank Data
SOCBs, 53.09%
PCBs, 45.98%
FCBs, 0.93%

Pag
e-37
Size and Growth
Average number of deposit accounts of different bank groups during the year 2010 and 2011 are
depicted in the table (2.1.2) given below. SOCBs hold highest number of average deposit accounts in
both the years where as FCBs hold lowest number of average deposit accounts.
Table-2.1.2: Overall Performance of Banks in Terms of Number of Deposit Account (Average)
(Figure in Thousands)
Category of Banks 2010 2011
SOCBs 5558 5809
PCBs 576 719
FCBs 99 101
All Banks 1076 1216
Source: Authors’ Calculation Based on Bangladesh Bank Data
Following table (2.1.3) presents the position of top performing bank in terms of number of deposit
account in different bank groups. From the table, it is evident that all bank top performer belongs to
SOCBs. It is also observed that there is a huge performance gap between the number of deposit
accounts of all banks, top performer and performing banks of FCBs.
Table-2.1.3: Status of Top Performers in Terms of Number of Deposit Account (Average)
(Figure in Thousands)
Top Performers: Top Performers: Top Performers: Top Performers: All Banks SOCBs PCBs FCBs
2010 2011 2010 2011 2010 2011 2010 2011
Top Bank 9176 9580 9176 9580 4940 6005 207 191
Top Two Banks (Average) 7450 7797 7450 7797 3115 4015 182 183
Top Three Banks (Average) 6671 7199 6671 6944 2413 3098 132 135
Source: Authors’ Own Calculation Based on Bangladesh Bank Data

Size and Growth
Pag
e-38
SOCBs, 52.72%
PCBs, 46.50%
FCBs, 0.78%
S&G - Indicator 2: Number of Branch
Number of branch indicates the presence of a bank in different places. Higher number of branches
indicates greater market share and bigger size. Bank uses branch network for accelerating financial
intermediation process. Table-2.2.1 confirms that the bank branches have increased by 4.52 percent in
the year 2011 over the year 2010. This growth is mostly contributed by the PCBs that experienced 10
percent growth on a large base of 2770 branches. However, FCBs shows a slightly negative growth.
Similar picture is also evident from the average growth rates of the banks. SOCBs, as portrayed in
Figure-2.2.1, hold the leading position in terms of market share of branches in 2011 with 52.72 percent
of total branches of all banks. It is also evident that the market share SOCBs is decreasing and the same
of PCBs is increasing. Better profitability, lower NPL might have motivated the PCBs to increase their
branch network. Increase in the number branch may help to include more people in the banking
network and it will increase bank revenue and accelerate financial intermediation process.
Table-2.2.1: Number of Branch of Banks
(Figure in Thousands)
Categories of Banks 2010 2010 (%) 2011 2011(%) Growth(%) Average
Growth Rate (%)
SOCBs 3447 54.98 3454 52.72 0.20 1.66
PCBs 2770 44.19 3047 46.50 10.00 14.47
FCBs 52 0.83 51 0.78 -1.92 -0.93
All Banks 6269 100 6552 100 4.52 11.34
Source: Authors’ Calculation Based on Bangladesh Bank Data
Figure-2.2.1: Share of Number of Branch of Banks in 2011
Source: Based on Bangladesh Bank Data
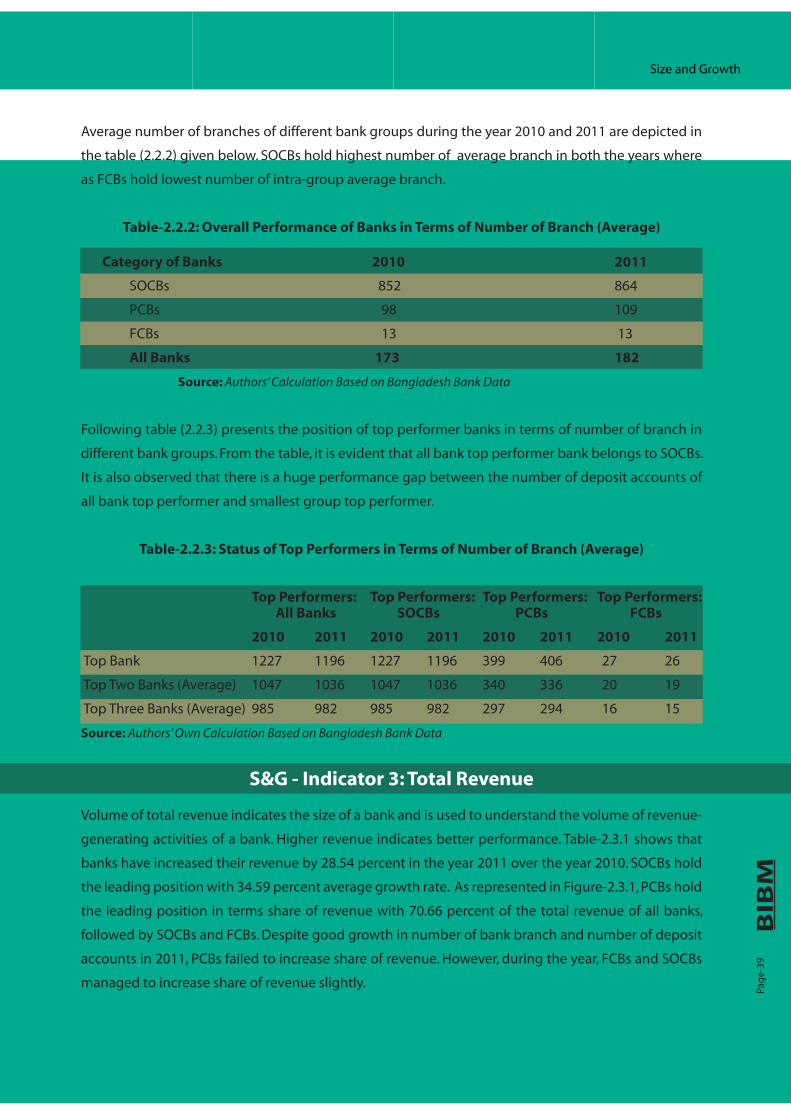
Size and Growth
Pag
e-39
Average number of branches of different bank groups during the year 2010 and 2011 are depicted in
the table (2.2.2) given below. SOCBs hold highest number of average branch in both the years where
as FCBs hold lowest number of intra-group average branch.
Table-2.2.2: Overall Performance of Banks in Terms of Number of Branch (Average)
Category of Banks 2010 2011
SOCBs 852 864
PCBs 98 109
FCBs 13 13
All Banks 173 182
Source: Authors’ Calculation Based on Bangladesh Bank Data
Following table (2.2.3) presents the position of top performer banks in terms of number of branch in
different bank groups. From the table, it is evident that all bank top performer bank belongs to SOCBs.
It is also observed that there is a huge performance gap between the number of deposit accounts of
all bank top performer and smallest group top performer.
Table-2.2.3: Status of Top Performers in Terms of Number of Branch (Average)
Top Performers: Top Performers: Top Performers: Top Performers: All Banks SOCBs PCBs FCBs
2010 2011 2010 2011 2010 2011 2010 2011
Top Bank 1227 1196 1227 1196 399 406 27 26
Top Two Banks (Average) 1047 1036 1047 1036 340 336 20 19
Top Three Banks (Average) 985 982 985 982 297 294 16 15
Source: Authors’ Own Calculation Based on Bangladesh Bank Data
S&G - Indicator 3: Total Revenue
Volume of total revenue indicates the size of a bank and is used to understand the volume of revenue-
generating activities of a bank. Higher revenue indicates better performance. Table-2.3.1 shows that
banks have increased their revenue by 28.54 percent in the year 2011 over the year 2010. SOCBs hold
the leading position with 34.59 percent average growth rate. As represented in Figure-2.3.1, PCBs hold
the leading position in terms share of revenue with 70.66 percent of the total revenue of all banks,
followed by SOCBs and FCBs. Despite good growth in number of bank branch and number of deposit
accounts in 2011, PCBs failed to increase share of revenue. However, during the year, FCBs and SOCBs
managed to increase share of revenue slightly.

Size and Growth
Pag
e-40
SOCBs, 22.53%
SPBs, 70.66%
PCBs, 6.81%
Table-2.3.1: Total Revenue of Banks
(in Million Taka)
Categories of Banks 2010 2010 (%) 2011 2011(%) Growth(%) Average Growth Rate (%)
SOCBs 102605 22.42 132558 22.53 29.19 34.59
PCBs 324465 70.90 415665 70.66 28.11 30.63
FCBs 30588 6.68 40069 6.81 31.00 27.23
All Banks 457658 100.00 588292 100 28.54 30.69
Source: Authors’ Calculation Based on Bangladesh Bank Data
Figure-2.3.1: Share of Total Revenue in 2011
Source: Based on Bangladesh Bank Data
Average total revenue of the three bank groups during the year 2010 and 2011 are depicted in the table
(2.3.2) given below. SOCBs hold highest amount of average revenue in both the years where as FCBs
hold lowest amount of intra-group average revenue.
Table-2.3.2: Overall Performance of Banks in Terms of Number of Branch [Average]
Category of Banks 2010 2011
SOCBs 25651 33140
PCBs 11588 14845
FCBs 7647 10017
All Banks 12713 16341
Source: Annual Report of Banks, Various Issues
The following table (2.3.3) presents the position of top performer banks in terms of total revenue of
different bank groups. From the table, it is evident that all top performing banks belong to SOCBs. It is
also observed that smallest group top performer earns less than 50 percent of the total revenue of all
bank top performers.
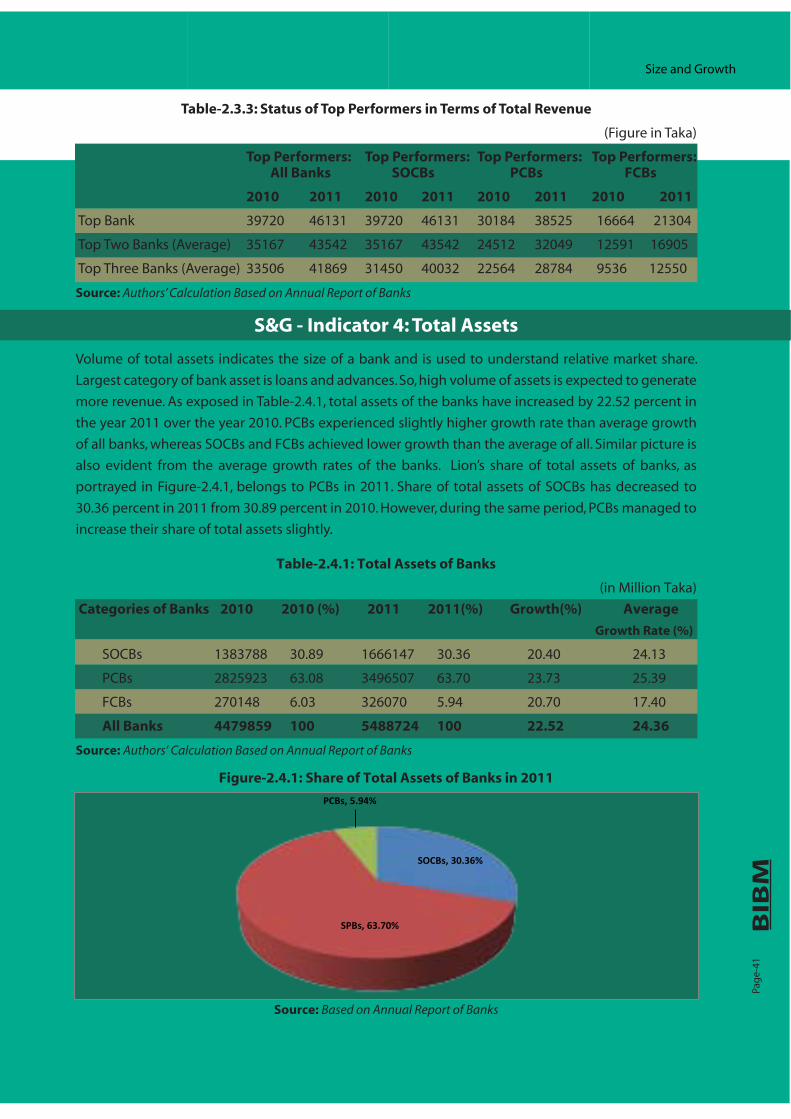
Size and Growth
Pag
e-41
SOCBs, 30.36%
SPBs, 63.70%
PCBs, 5.94%
Table-2.3.3: Status of Top Performers in Terms of Total Revenue
(Figure in Taka)
Top Performers: Top Performers: Top Performers: Top Performers: All Banks SOCBs PCBs FCBs
2010 2011 2010 2011 2010 2011 2010 2011
Top Bank 39720 46131 39720 46131 30184 38525 16664 21304
Top Two Banks (Average) 35167 43542 35167 43542 24512 32049 12591 16905
Top Three Banks (Average) 33506 41869 31450 40032 22564 28784 9536 12550
Source: Authors’ Calculation Based on Annual Report of Banks
S&G - Indicator 4: Total Assets
Volume of total assets indicates the size of a bank and is used to understand relative market share.
Largest category of bank asset is loans and advances. So, high volume of assets is expected to generate
more revenue. As exposed in Table-2.4.1, total assets of the banks have increased by 22.52 percent in
the year 2011 over the year 2010. PCBs experienced slightly higher growth rate than average growth
of all banks, whereas SOCBs and FCBs achieved lower growth than the average of all. Similar picture is
also evident from the average growth rates of the banks. Lion’s share of total assets of banks, as
portrayed in Figure-2.4.1, belongs to PCBs in 2011. Share of total assets of SOCBs has decreased to
30.36 percent in 2011 from 30.89 percent in 2010. However, during the same period, PCBs managed to
increase their share of total assets slightly.
Table-2.4.1: Total Assets of Banks
(in Million Taka)
Categories of Banks 2010 2010 (%) 2011 2011(%) Growth(%) Average
Growth Rate (%)
SOCBs 1383788 30.89 1666147 30.36 20.40 24.13
PCBs 2825923 63.08 3496507 63.70 23.73 25.39
FCBs 270148 6.03 326070 5.94 20.70 17.40
All Banks 4479859 100 5488724 100 22.52 24.36
Source: Authors’ Calculation Based on Annual Report of Banks
Figure-2.4.1: Share of Total Assets of Banks in 2011
Source: Based on Annual Report of Banks
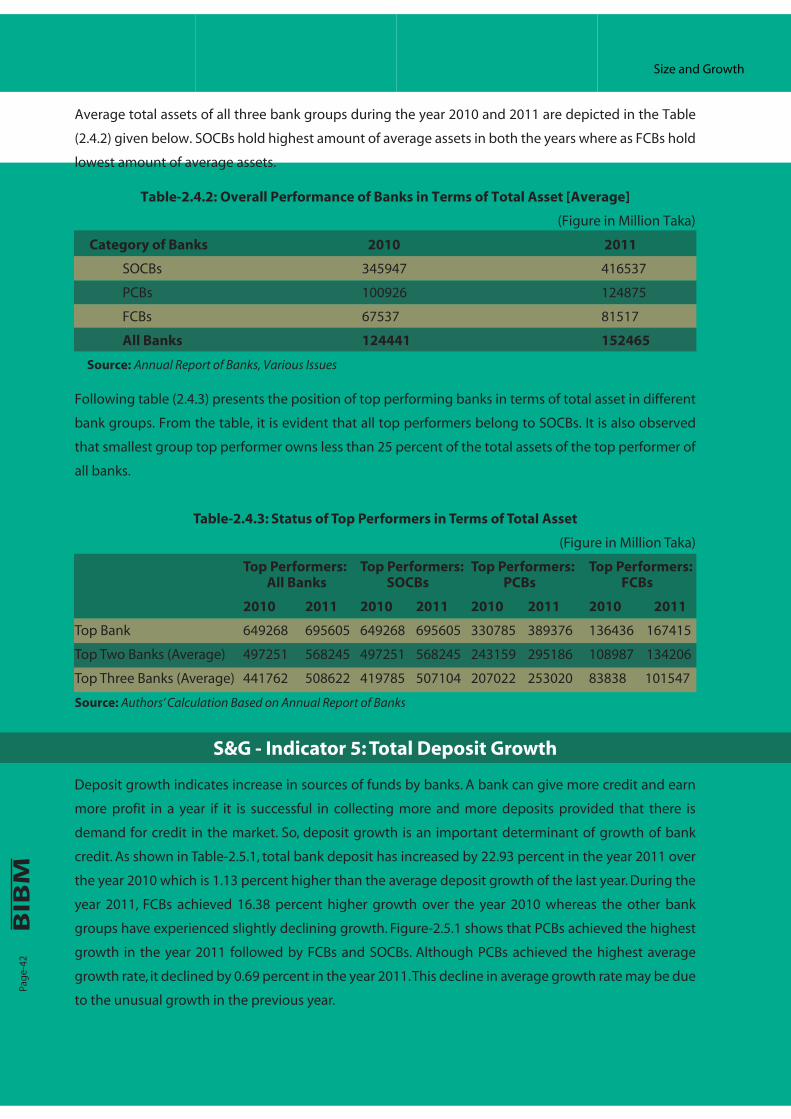
Size and Growth
Pag
e-42
Average total assets of all three bank groups during the year 2010 and 2011 are depicted in the Table
(2.4.2) given below. SOCBs hold highest amount of average assets in both the years where as FCBs hold
lowest amount of average assets.
Table-2.4.2: Overall Performance of Banks in Terms of Total Asset [Average]
(Figure in Million Taka)
Category of Banks 2010 2011
SOCBs 345947 416537
PCBs 100926 124875
FCBs 67537 81517
All Banks 124441 152465
Source: Annual Report of Banks, Various Issues
Following table (2.4.3) presents the position of top performing banks in terms of total asset in different
bank groups. From the table, it is evident that all top performers belong to SOCBs. It is also observed
that smallest group top performer owns less than 25 percent of the total assets of the top performer of
all banks.
Table-2.4.3: Status of Top Performers in Terms of Total Asset
(Figure in Million Taka)
Top Performers: Top Performers: Top Performers: Top Performers: All Banks SOCBs PCBs FCBs
2010 2011 2010 2011 2010 2011 2010 2011
Top Bank 649268 695605 649268 695605 330785 389376 136436 167415
Top Two Banks (Average) 497251 568245 497251 568245 243159 295186 108987 134206
Top Three Banks (Average) 441762 508622 419785 507104 207022 253020 83838 101547
Source: Authors’ Calculation Based on Annual Report of Banks
S&G - Indicator 5: Total Deposit Growth
Deposit growth indicates increase in sources of funds by banks. A bank can give more credit and earn
more profit in a year if it is successful in collecting more and more deposits provided that there is
demand for credit in the market. So, deposit growth is an important determinant of growth of bank
credit. As shown in Table-2.5.1, total bank deposit has increased by 22.93 percent in the year 2011 over
the year 2010 which is 1.13 percent higher than the average deposit growth of the last year. During the
year 2011, FCBs achieved 16.38 percent higher growth over the year 2010 whereas the other bank
groups have experienced slightly declining growth. Figure-2.5.1 shows that PCBs achieved the highest
growth in the year 2011 followed by FCBs and SOCBs. Although PCBs achieved the highest average
growth rate, it declined by 0.69 percent in the year 2011. This decline in average growth rate may be due
to the unusual growth in the previous year.

Size and Growth
Pag
e-43
0
5
10
15
20
25
SOCBs PCBs FCBs All Banks
Gro
wth
Rat
e (%
)
2010 2011
Table-2.5.1: Average Deposit Growth of Banks (%)
Categories of Banks Average Growth (%) Average Growth (%) Change (%)
2010 2011
SOCBs 20.76 19.41 -1.35
PCBs 24.99 24.30 -0.69
FCBs 0.45 16.83 16.38
All Banks 21.80 22.93 1.13
Source: Authors’ Calculation Based on Annual Report of Banks
Figure-2.5.1: Average Deposit Growth of Banks
Source: Annual Report of Banks, Various Issues
The following table (2.5.2) presents the position of top performer banks in terms of total deposit
growth in different bank groups. From the table, it is evident that all top performers belong to PCBs.
During the period, PCBs and FCBs experienced increase in total deposit growth rate where as SOCBs
experienced decrease in total deposit growth rate. It is also observed that average deposit growth rate
of SOCBs is less than 50 percent of the deposit growth rate of the top performing bank.
Table-2.5.2: Status of Top Performers in Terms of Total Deposit Growth
(Figure in Percent)
Top Performers: Top Performers: Top Performers: Top Performers: All Banks SOCBs PCBs FCBs
2010 2011 2010 2011 2010 2011 2010 2011
Top Bank 52.47 55.64 42.47 26.22 52.47 55.64 15.04 27.62
Top Two Banks (Average) 49.39 52.75 33.81 24.23 49.85 52.75 13.23 24.99
Top Three Banks (Average) 48.04 48.06 30.60 22.05 48.67 48.06 08.87 20.03
Source: Authors’ Calculation Based on Annual Report of Banks

Pag
e-44
Size and Growth
S&G - Indicator 6: Total Loan and Advance (TLA) Growth (%)
Advance growth indicates increase in uses of funds by banks. Higher the growth rate of advances,
better the performance. Besides, profitability of banks depends greatly on the ability to increase good
quality loans and advances for productive purpose. Loans for productive economic activities also
increase domestic production and hence increase GDP growth. As noted in table 2.6.1, total loans and
advances of banks have increased by 18.19 percent in the year 2011 over the year 2010 which is 13.70
percent lower than the average growth rate of the previous year. During the year 2011 all bank groups
have experienced declining average growth in compared to average growth rate of the previous year.
Figure-2.6.1 shows that PCBs achieved highest average growth in the year 2011 followed by FCBs and
SOCBs. Although PCBs achieved highest average growth rate, it has decreased by 14.26 percent in the
year 2011.
Table-2.6.1: Average Loan and Advance Growth of Banks(%)
Categories of Banks Average Growth (%) Average Growth (%) Change (%)
2010 2011
SOCBs 27.01 17.70 -9.31
PCBs 34.32 20.06 -14.26
FCBs 19.72 5.59 -14.13
All Banks 31.89 18.19 -13.70
Source: Authors’ Calculation Based on Annual Report of Banks
Figure-2.6.1: Average Loan and Advance Growth of Banks
Source: Annual Report of Banks, Various Issues
Following table (2.6.2) presents the position of top performer banks in terms of total loan and advance
growth in different bank groups. From the table, it is evident that all top performers belong to PCBs.
During the period, all bank groups experienced decrease in total loan and advance growth rate. It is also
observed that total loan and advance growth rate of SOCBs is less than 50 percent of the total loan and
advance growth rate of all bank top performer.
0
5
10
15
20
25
30
35
SOCBs PCBs FCBs All Banks
Gro
wth
Rat
e (%
)
2010 2011

Size and Growth
Pag
e-45
Table-2.6.2: Status of Top Performers in Terms of Total Loan and Advance Growth
(Figure in Percent)
Top Performers: Top Performers: Top Performers: Top Performers: All Banks SOCBs PCBs FCBs
2010 2011 2010 2011 2010 2011 2010 2011
Top Bank 58.37 46.97 58.37 21.67 58.16 46.97 52.22 27.09
Top Two Banks (Average) 58.26 42.64 47.03 20.28 56.10 42.64 34.63 25.16
Top Three Banks (Average) 56.86 40.77 42.54 18.81 54.62 40.77 27.80 18.83
Source: Authors’ Calculation Based on Annual Report of Banks
S&G - Indicator 7: Net Interest Income Growth (%)Net interest income, also known as the spread, is the single largest determining factor for bank income.
Higher the growth rate of net interest income, better the performance. It is observed from table 2.7.1
that banks except FCBs experienced a declining average growth rate in net interest income. Net interest
income of all banks has increased by 28.13 percent in the year 2011 which is 21.88 percent lower than
the net interest income average growth rate of the previous year. As shown in figure 2.7.1, SOCBs
achieved highest average growth in the year 2011 followed by FCBs, and PCBs. Such decline in the net
interest income average growth rate in 2011 may be due to the unusual growth in the previous year.
Table-2.7.1: Average Net Interest Income Growth of Banks (%)
Categories of Banks Average Growth (%) Average Growth (%) Change (%)
2010 2011
SOCBs 61.38 56.85 -4.53
PCBs 52.57 23.78 -28.79
FCBs 20.71 29.89 9.18
All Banks 50.01 28.13 -21.88
Source: Authors’ Calculation Based on Annual Report of Banks
Figure-2.7.1: Average Net Profit/Net Income of Banks
Source: Annual Report of Banks, Various Issues
0
10
20
30
40
50
60
70
SOCBs PCBs FCBs All Banks
Gro
wth
Rat
e (%
)
2010 2011

Size and Growth
Pag
e-46
Following table (2.7.2) presents the position of top performer banks in terms of net interest income
growth in different bank groups. From the table, it is evident that all top performers belong to PCBs.
During the period, all bank groups experienced increase in net interest income growth rate. It is also
observed that net interest income growth rate of SOCBs is less than 50 percent of the net interest
income growth rate of all bank top performer.
Table-2.7.2: Status of Top Performers in Terms of Net Interest Income Growth
(Figure in Percent)
Top Performers: Top Performers: Top Performers: Top Performers: All Banks SOCBs PCBs FCBs
2010 2011 2010 2011 2010 2011 2010 2011
Top Bank 139.65 297.67 97.00 101.95 139.65 297.67 24.67 68.62
Top Two Banks (Average) 118.32 199.81 84.05 77.49 114.76 180.87 24.37 45.38
Top Three Banks (Average) 108.84 156.08 75.16 68.82 103.28 139.01 22.95 35.95
Source: Authors’ Calculation Based on Annual Report of Banks
S&G - Indicator 8: Net Profit/Net Income Growth (%)
Net profit growth is the most recognized indicator to evaluate performance of any commercial institution.
Higher the growth rate of net profit, better the performance. As exposed in table 2.8.1 net income of the
banks has increased by 28.42 percent in the year 2011 which is 31.84 percent lower than average net
income growth of the year 2010. During the year 2011 SOCBs achieved 290.76 percent average growth
in net income which is the highest rate of growth of the year. It is interesting to note that in 2011 PCBs
experienced a negative growth in net income which is 84.79 percent lower than the net income growth
rate of the year 2010. Figure 2.8.1 clearly depicts the volatile nature of net income growth of banks
during the period. It is mentionable here that the banks made unusually high profit in the year 2010
from their exposures in capital market. Subsequently in 2011 such profits from capital market exposure
dried up. As a result, PCBs marked a negative growth in net profit in the year 2011.
Table-2.8.1: Average Net Interest Income Growth of Banks (%)
Categories of Banks Average Growth (%) Average Growth (%) Change (%)
2010 2011
SOCBs 13.61 290.76 277.15
PCBs 75.27 -9.52 -84.79
FCBs 1.85 31.65 29.80
All Banks 60.26 28.42 -31.84
Source: Authors’ Calculation Based on Annual Report of Banks

Size and Growth
Pag
e-47
Figure-2.8.1: Average Net Profit/Net Income Growth of Banks
Source: Annual Report of Banks, Various Issues
The following table (2.8.2) presents the position of top performing banks in terms of net profit growth
in different bank groups. From the table, it is evident that all top performers belong to SOCBs. During
the period, SOCBs and FCBs experienced increase in net profit growth rate where as PCBs experienced
a decline in net profit growth rate. Top three bank average growth rate of SOCBs is highest in the year
2011 which speaks about the good performance of the SOCBs in the year.
Table-2.8.2: Status of Top Performers in Terms of Net Interest Income Growth
(Figure in Percent)
Top Performers: Top Performers: Top Performers: Top Performers: All Banks SOCBs PCBs FCBs
2010 2011 2010 2011 2010 2011 2010 2011
Top Bank 230.04 1124.3 217.27 1124.3 230.04 61.29 24.18 63.71
Top Two Banks (Average) 223.66 603.04 147.71 603.04 194.89 48.21 13.95 50.25
Top Three Banks (Average) 202.35 423.27 120.00 397.32 174.48 43.33 06.90 44.05
Source: Authors’ Calculation Based on Annual Report of Banks
-50
0
50
100
150
200
250
300
350
SOCBs PCBs FCBs All Banks
Gro
wth
Rat
e (%
)
2010 2011

Bank profitability and efficiency is critical to building capital, establishing adequate loss reserves,
managing expenses and providing dividends to shareholders. Like any other profit generating
institutions, the bottom line objective of a bank manager is to implement financial decisions that
maximize shareholders value. Hence it can be expected that highly profitable banks should have higher
value. Financial ratio analysis is a very useful diagnostic tool that can be used to assess the profitability
and efficiency of a bank. Profit margin reflects the percentage of each taka of income remaining after all
costs and expenses are paid. The ratio is also used as a measure of expense control which ultimately
provides the efficiency of the banking sector. Both profitability and efficiency measurements are essential
for the evaluation of performances of any financial institution. To assess the profitability and efficiency
of banks, four indicators have been used: (1) Return on Asset, (2) Return on Equity, (3) Total Expense to
Total Revenue and (4) Profit Per Employee.
Pag
e-48
Profitability&
Efficiency
Performance Evaluation Criteria (PEC)– 3: Profitability and Efficiency (P&E)
Indicator-1:Return on
Asset
Ind
icator-2
:R
eturn
on
Equ
ity
Indicator-3:Total
Expense toTotal
Revenue
Ind
icator-4
:P
rofit P
erEm
plo
yee

Profitability and Efficiency
Pag
e-49
0.91
2.24 3.04 2.18
0.95 1.53
3.39
1.67
0
0.5
1
1.5
2
2.5
3
3.5
4
SOCBs PCBs FCBs All Banks
Retu
rn o
n As
set (
%)
2010 2011
P&E - Indicator 1: Return on Asset (ROA) (%)Return on Asset (ROA) indicates the amount of profit earned for each taka of assets invested in the
business. ROA is an indicator to measure how profitable a company is relative to its total assets. It gives
an idea as to how efficient management is using its financial and real resources to generate earnings.
Calculated by dividing a company's annual earnings by its total assets, ROA is displayed as a percentage.
Higher ROA indicates better performance of the company in terms of profitability and management
efficiency.
Figure-3.1.1: Average Return on Asset of Banks
Source: Annual Report of Banks, Various Issues
Figure (3.1.1) shows the ROA in different categories of banks for 2010 and 2011. From the figure, it can
be noted that except private commercial banks (PCB) ROA has increased in both the years for other type
of banks. But a decline in ROA of PCBs was observed mainly because of the government borrowing to
finance budget deficit from the primary dealer (PD) banks. It needs to be mentioned that a number of
PCBs are performing as a primary dealer whose major task is to support government borrowing. As a
result, those banks suffered a lot due to the lack of investable fund which might have been a reason for
such decline in ROA. Another important reason could be the implementation of risk based capital
adequacy (RBCA) guideline, which forces all the banks to increase their capital base. This increase in
capital was not properly supported by the assets which could have been the sources of income and
ultimately would increase the ROA. As the PCBs have a significant contribution in the overall banking
sector, a decline in ROA of this sector causes to decrease in aggregate. ROA of other type of banks
increased marginally in 2011.
Table-3.1.1: Overall Performance of Banks in Terms of Return on Asset [Average]
(Figure in Percent)
Category of Banks 2010 2011 Change
SOCBs 0.91 0.95 0.04
PCBs 2.24 1.53 -0.71
FCBs 3.04 3.39 0.35
All Banks 2.18 1.67 -0.51
Source: Authors’ Calculation Based on Annual Report of Banks
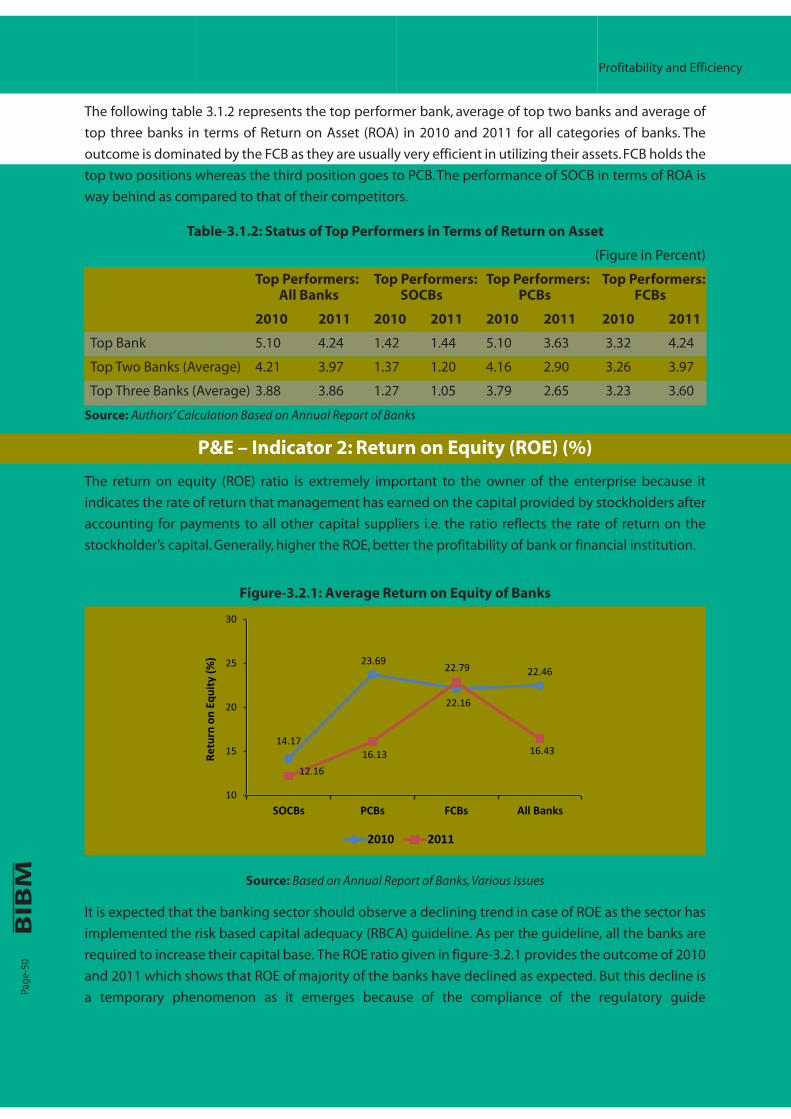
Profitability and Efficiency
Pag
e-50
The following table 3.1.2 represents the top performer bank, average of top two banks and average of
top three banks in terms of Return on Asset (ROA) in 2010 and 2011 for all categories of banks. The
outcome is dominated by the FCB as they are usually very efficient in utilizing their assets. FCB holds the
top two positions whereas the third position goes to PCB. The performance of SOCB in terms of ROA is
way behind as compared to that of their competitors.
Table-3.1.2: Status of Top Performers in Terms of Return on Asset
(Figure in Percent)
Top Performers: Top Performers: Top Performers: Top Performers: All Banks SOCBs PCBs FCBs
2010 2011 2010 2011 2010 2011 2010 2011
Top Bank 5.10 4.24 1.42 1.44 5.10 3.63 3.32 4.24
Top Two Banks (Average) 4.21 3.97 1.37 1.20 4.16 2.90 3.26 3.97
Top Three Banks (Average) 3.88 3.86 1.27 1.05 3.79 2.65 3.23 3.60
Source: Authors’ Calculation Based on Annual Report of Banks
P&E – Indicator 2: Return on Equity (ROE) (%)
The return on equity (ROE) ratio is extremely important to the owner of the enterprise because it
indicates the rate of return that management has earned on the capital provided by stockholders after
accounting for payments to all other capital suppliers i.e. the ratio reflects the rate of return on the
stockholder’s capital. Generally, higher the ROE, better the profitability of bank or financial institution.
Figure-3.2.1: Average Return on Equity of Banks
Source: Based on Annual Report of Banks, Various Issues
It is expected that the banking sector should observe a declining trend in case of ROE as the sector has
implemented the risk based capital adequacy (RBCA) guideline. As per the guideline, all the banks are
required to increase their capital base. The ROE ratio given in figure-3.2.1 provides the outcome of 2010
and 2011 which shows that ROE of majority of the banks have declined as expected. But this decline is
a temporary phenomenon as it emerges because of the compliance of the regulatory guide
14.17
23.69
22.16
22.46
12.16 16.13
22.79
16.43
10
15
20
25
30
SOCBs PCBs FCBs All Banks
Retu
rn o
n Eq
uity
(%)
2010 2011

Profitability and Efficiency
Pag
e-51
line by the banking sector which helps them to strengthen their capital base and ensures a sustainable
growth in the long run.
Table-3.2.1: Overall Performance of Banks in Terms of Return on Equity [Average]
(Figure in Percent)
Category of Banks 2010 2011 Change (%)
SOCBs 14.17 12.16 -2.01
PCBs 23.69 16.13 -7.56
FCBs 22.16 22.79 0.63
All Banks 22.46 16.43 -6.03
Source: Annual Report of Banks, Various Issues
Data on top performers of all categories of banks in terms of Return on Equity (ROE) in 2010 and 2011 is
given in table 3.2.2. The ROE of FCB is in very strong position and it holds the top two positions. The
overall position of PCBs is also compatible with FCBs. But the performance of SOCB in terms of ROE is
not upto the mark. The reason behind this decline is already explained. It is expected that the situation
of SOCB will improve in the coming year.
Table-3.2.2: Status of Top Performers in Terms of Return on Equity
(Figure in Percent)
Top Performers: Top Performers: Top Performers: Top Performers: All Banks SOCBs PCBs FCBs
2010 2011 2010 2011 2010 2011 2010 2011
Top Bank 38.80 34.27 24.07 17.79 38.80 28.35 31.33 34.27
Top Two Banks (Average) 37.37 32.94 23.22 15.93 37.37 26.24 30.48 32.94
Top Three Banks (Average) 35.36 31.41 2.41 13.83 35.15 25.52 25.27 26.58
Source: Authors’ Calculation Based on Annual Report of Banks
P&E – Indicator 3: Total Expense to Total Revenue (%)
The ratio, total expense to total revenue is an efficiency indicator which measures the proportion of
total revenue which is used to meet a bank’s overall expenses. It indicates efficient use of resources by
banks to attain their goals. Obviously, lower ratio expresses better performance as lower percentage use
of the revenues fulfills its costs.
Table-3.3.1: Total Expense to Total Revenue of Banks
Categories of Banks 2010 2011 Change (%)
SOCBs 67.91 65.16 -2.75
PCBs 63.16 71.38 8.22
FCBs 47.87 48.35 0.48
All Banks 61.99 68.13 6.14
Source: Annual Report of Banks, Various Issues
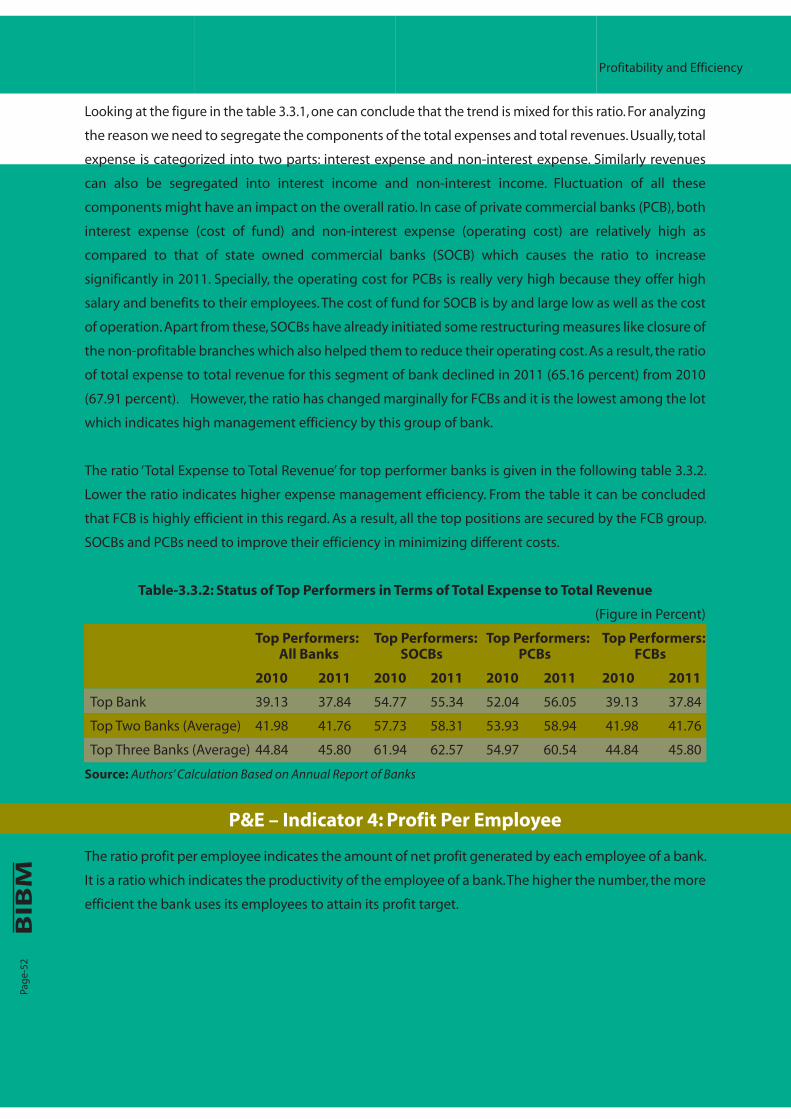
Profitability and Efficiency
Pag
e-52
Looking at the figure in the table 3.3.1, one can conclude that the trend is mixed for this ratio. For analyzing
the reason we need to segregate the components of the total expenses and total revenues. Usually, total
expense is categorized into two parts: interest expense and non-interest expense. Similarly revenues
can also be segregated into interest income and non-interest income. Fluctuation of all these
components might have an impact on the overall ratio. In case of private commercial banks (PCB), both
interest expense (cost of fund) and non-interest expense (operating cost) are relatively high as
compared to that of state owned commercial banks (SOCB) which causes the ratio to increase
significantly in 2011. Specially, the operating cost for PCBs is really very high because they offer high
salary and benefits to their employees. The cost of fund for SOCB is by and large low as well as the cost
of operation. Apart from these, SOCBs have already initiated some restructuring measures like closure of
the non-profitable branches which also helped them to reduce their operating cost. As a result, the ratio
of total expense to total revenue for this segment of bank declined in 2011 (65.16 percent) from 2010
(67.91 percent). However, the ratio has changed marginally for FCBs and it is the lowest among the lot
which indicates high management efficiency by this group of bank.
The ratio ‘Total Expense to Total Revenue’ for top performer banks is given in the following table 3.3.2.
Lower the ratio indicates higher expense management efficiency. From the table it can be concluded
that FCB is highly efficient in this regard. As a result, all the top positions are secured by the FCB group.
SOCBs and PCBs need to improve their efficiency in minimizing different costs.
Table-3.3.2: Status of Top Performers in Terms of Total Expense to Total Revenue
(Figure in Percent)
Top Performers: Top Performers: Top Performers: Top Performers: All Banks SOCBs PCBs FCBs
2010 2011 2010 2011 2010 2011 2010 2011
Top Bank 39.13 37.84 54.77 55.34 52.04 56.05 39.13 37.84
Top Two Banks (Average) 41.98 41.76 57.73 58.31 53.93 58.94 41.98 41.76
Top Three Banks (Average) 44.84 45.80 61.94 62.57 54.97 60.54 44.84 45.80
Source: Authors’ Calculation Based on Annual Report of Banks
P&E – Indicator 4: Profit Per Employee
The ratio profit per employee indicates the amount of net profit generated by each employee of a bank.
It is a ratio which indicates the productivity of the employee of a bank. The higher the number, the more
efficient the bank uses its employees to attain its profit target.
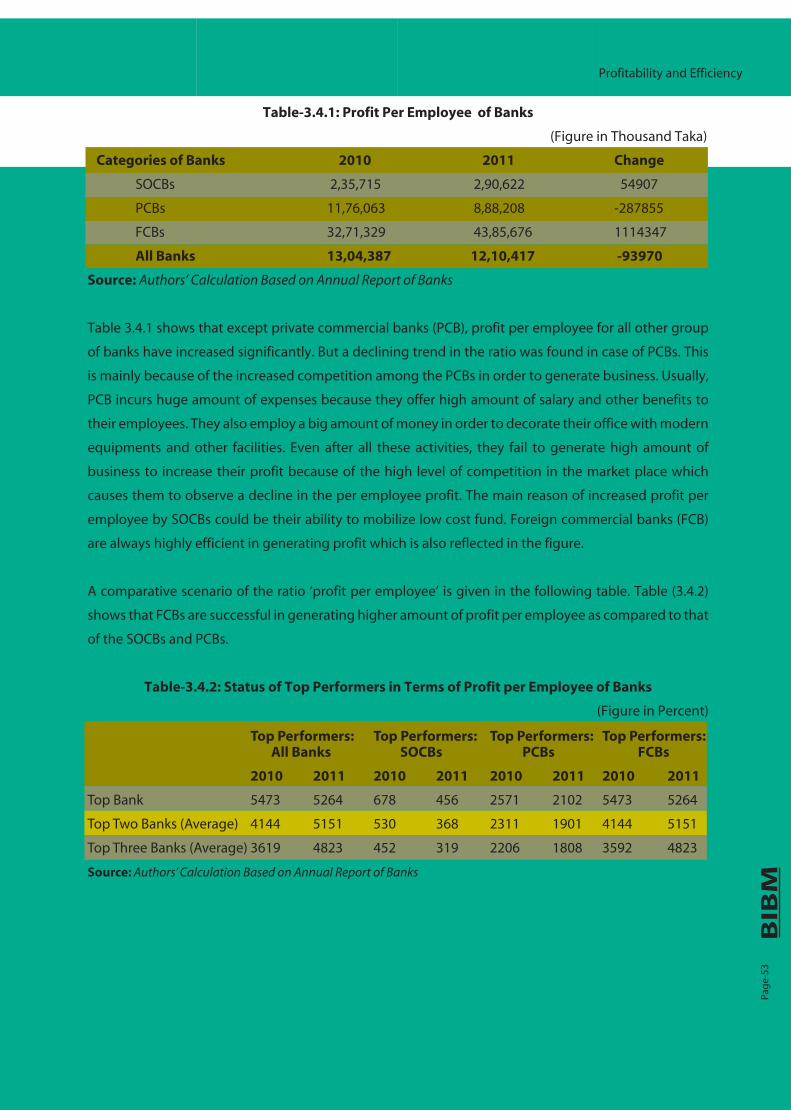
Pag
e-53
Profitability and Efficiency
Table-3.4.1: Profit Per Employee of Banks
(Figure in Thousand Taka)
Categories of Banks 2010 2011 Change
SOCBs 2,35,715 2,90,622 54907
PCBs 11,76,063 8,88,208 -287855
FCBs 32,71,329 43,85,676 1114347
All Banks 13,04,387 12,10,417 -93970
Source: Authors’ Calculation Based on Annual Report of Banks
Table 3.4.1 shows that except private commercial banks (PCB), profit per employee for all other group
of banks have increased significantly. But a declining trend in the ratio was found in case of PCBs. This
is mainly because of the increased competition among the PCBs in order to generate business. Usually,
PCB incurs huge amount of expenses because they offer high amount of salary and other benefits to
their employees. They also employ a big amount of money in order to decorate their office with modern
equipments and other facilities. Even after all these activities, they fail to generate high amount of
business to increase their profit because of the high level of competition in the market place which
causes them to observe a decline in the per employee profit. The main reason of increased profit per
employee by SOCBs could be their ability to mobilize low cost fund. Foreign commercial banks (FCB)
are always highly efficient in generating profit which is also reflected in the figure.
A comparative scenario of the ratio ‘profit per employee’ is given in the following table. Table (3.4.2)
shows that FCBs are successful in generating higher amount of profit per employee as compared to that
of the SOCBs and PCBs.
Table-3.4.2: Status of Top Performers in Terms of Profit per Employee of Banks
(Figure in Percent)
Top Performers: Top Performers: Top Performers: Top Performers: All Banks SOCBs PCBs FCBs
2010 2011 2010 2011 2010 2011 2010 2011
Top Bank 5473 5264 678 456 2571 2102 5473 5264
Top Two Banks (Average) 4144 5151 530 368 2311 1901 4144 5151
Top Three Banks (Average) 3619 4823 452 319 2206 1808 3592 4823
Source: Authors’ Calculation Based on Annual Report of Banks

Assets are the resources owned and controlled by a business. Assets are also the sources of revenue for
all businesses. Banks are not an exception to this. Moreover, assets in bank generate much needed cash
flow alongside revenue. The largest category of earning assets of a bank is loans and advances. If the
quality of loans and advances deteriorates, it adversely affects the earning potential, cash flow and the
value. A healthy bank must create good quality loans and advances and maintain the quality. In
evaluating asset quality of banks, evaluators need to look at the existing and potential loss exposure in
the loan portfolio. For understanding quality of loans and advances four indicators have been used
which are growth in gross NPL, gross NPL to total advances, credit concentration by size and credit
concentration by division.
Pag
e-54
PEC-4Asset Quality
Indicator-1:Growth inGross NPL
Ind
icat
or-
2:
Gro
ss N
PL
toTo
tal
Ad
van
ces
Indicator-3:Change in NPL to
Change inTotal
Advances
Ind
icator-4
:C
redit
Co
ncen
tration
Performance Evaluation Criteria (PEC) – 4: Asset Quality

Asset Quality
Pag
e-55
AQ– Indicator 1: Growth in Gross NPL
A non-performing loan is a loan that is in default or close to being in default. A loan is non-performing
when payments of interest and principal are past due by 90 days or more. Non-performing loan is the
best indicator for measuring the asset quality of bank as the lion’s share of a bank’s earning is generated
from the loans. An increase in the growth of the ratio indicates the deterioration of the asset quality.
Table-4.1.1 shows that NPL as a whole in our banking sector increased by 53.09 percent in 2011. Only
SOCBs experienced decline in NPL in 2011 by 10.58 percent. The growth rate of NPL was highest in case
of FCBs in 2011. The performance of FCBs in this regard deteriorated significantly as the NPL grew by
more than 268.08 percent from the previous year. This is mainly due to the huge increase in the NPL
ratio of one of the FCBs in 2011.
Table-4.1.1: Growth in Gross NPL of Banks
Categories of Banks 2010 2011 Change (%)
SOCBs -14.51 -3.93 10.58
PCBs 20.38 30.03 9.65
FCBs 3.54 271.62 268.08
All Banks 14.63 53.09 38.46
Source: Authors’ Calculation Based on Annual Report of Banks
The following table 4.1.2 represents the top performer bank, average of top two banks and average of
top three banks in terms of Growth in Gross NPL in 2010 and 2011 for all categories of banks. The
performance is mixed for different types of banks. FCBs performance is comparatively poor in terms of
the growth in gross NPL. SOCBs have done a tremendous job in this regard. The performance of PCB is
mixed
Table-4.1.2: Status of Top Performers in Terms of Growth in Gross NPL
(Figure in Percent)
Top Performers: Top Performers: Top Performers: Top Performers: All Banks SOCBs PCBs FCBs
2010 2011 2010 2011 2010 2011 2010 2011
Top Bank -50.01 -42.47 -27.23 -42.47 -30.91 -12.33 -50.01 28.52
Top Two Banks (Average) -40.46 -27.40 -21.93 -26.16 -0.24 -11.35 -36.43 38.77
Top Three Banks (Average) -36.24 -21.72 -18.44 -16.70 -0.20 -10.83 -17.92 62.08
Source: Authors’ Calculation Based on Annual Report of Banks
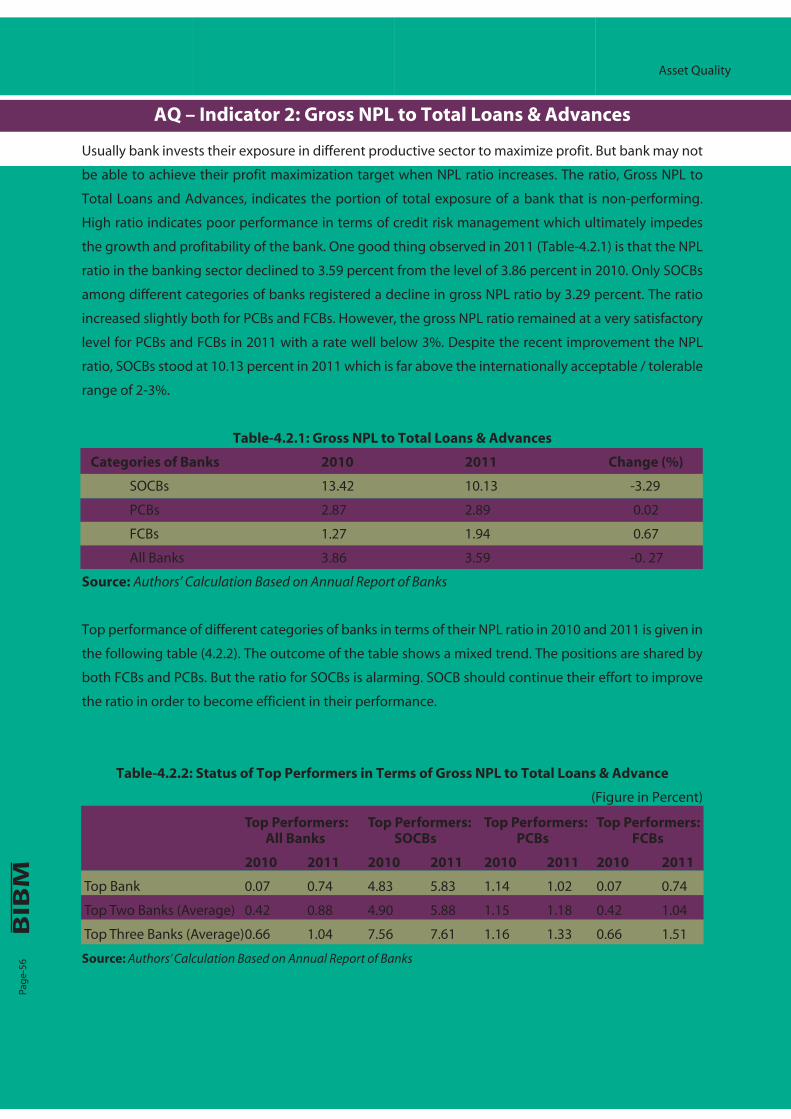
Asset Quality
Pag
e-56
AQ – Indicator 2: Gross NPL to Total Loans & Advances
Usually bank invests their exposure in different productive sector to maximize profit. But bank may not
be able to achieve their profit maximization target when NPL ratio increases. The ratio, Gross NPL to
Total Loans and Advances, indicates the portion of total exposure of a bank that is non-performing.
High ratio indicates poor performance in terms of credit risk management which ultimately impedes
the growth and profitability of the bank. One good thing observed in 2011 (Table-4.2.1) is that the NPL
ratio in the banking sector declined to 3.59 percent from the level of 3.86 percent in 2010. Only SOCBs
among different categories of banks registered a decline in gross NPL ratio by 3.29 percent. The ratio
increased slightly both for PCBs and FCBs. However, the gross NPL ratio remained at a very satisfactory
level for PCBs and FCBs in 2011 with a rate well below 3%. Despite the recent improvement the NPL
ratio, SOCBs stood at 10.13 percent in 2011 which is far above the internationally acceptable / tolerable
range of 2-3%.
Table-4.2.1: Gross NPL to Total Loans & Advances
Categories of Banks 2010 2011 Change (%)
SOCBs 13.42 10.13 -3.29
PCBs 2.87 2.89 0.02
FCBs 1.27 1.94 0.67
All Banks 3.86 3.59 -0. 27
Source: Authors’ Calculation Based on Annual Report of Banks
Top performance of different categories of banks in terms of their NPL ratio in 2010 and 2011 is given in
the following table (4.2.2). The outcome of the table shows a mixed trend. The positions are shared by
both FCBs and PCBs. But the ratio for SOCBs is alarming. SOCB should continue their effort to improve
the ratio in order to become efficient in their performance.
Table-4.2.2: Status of Top Performers in Terms of Gross NPL to Total Loans & Advance
(Figure in Percent)
Top Performers: Top Performers: Top Performers: Top Performers: All Banks SOCBs PCBs FCBs
2010 2011 2010 2011 2010 2011 2010 2011
Top Bank 0.07 0.74 4.83 5.83 1.14 1.02 0.07 0.74
Top Two Banks (Average) 0.42 0.88 4.90 5.88 1.15 1.18 0.42 1.04
Top Three Banks (Average) 0.66 1.04 7.56 7.61 1.16 1.33 0.66 1.51
Source: Authors’ Calculation Based on Annual Report of Banks

Asset Quality
Pag
e-57
AQ – Indicator 3: Credit Concentration
Concentration of exposures in credit portfolios is an important aspect of credit risk. Credit concentration
risk is calculated using a “concentration ratio” which explains what percentage of the outstanding
accounts each bank loan type represents. It may arise from two types of imperfect diversification. The
first type, ‘name concentration’, relates to imperfect diversification in the portfolio either because of its
small size or because of large exposures to specific individual obligors. The second type, ‘sector
concentration’, relates to imperfect diversification across systematic components of risk, namely
sectoral factors such as geographic regions, industries or products. In this case, concentration has been
measured in terms of large loans where the loan is defined as large when the outstanding amount is
more than 10 percent of its capital. Overall credit concentration risk in our banking sector decreased as
the percentage of large loan to total loans decreased in 2011 to 24.86 percent from 31.15 percent in
2010 (Table-4.3.1). All the categories of banks made improvement in reducing the concentration risk.
The largest decline is observed in case of SOCBs followed by FCBs.
Table-4.3.1: Credit Concentration
Categories of Banks 2010 2011 Change (%)
SOCBs 43.88 16.73 -27.15
PCBs 27.49 24.82 -2.67
FCBs 44.04 33.25 -10.79
All Banks 31.15 24.86 -6.29
Source: Authors’ Calculation Based on Annual Report of Banks
Figure-4.3.1: Credit Concentration of Banks
Source: Annual Report of Banks, Various Issues
A comparative scenario of the ratio ‘credit concentration’ is given in the following table (4.3.2). Table
shows that PCBs are more successful in diversifying their credit portfolio as compared to that of the
SOCBs and FCBs. SOCBs are also improving in this regard. But FCBs credit portfolio is usually less diversified
and the scenario is reflected in the table. To improve the condition, FCB should focus on diversifying their
portfolio.
43.88
27.49
44.04
31.15
16.73
24.82
33.25
24.86
0
5
10
15
20
25
30
35
40
45
50
SOCBs PCBs FCBs All Banks
Cred
it Co
ncen
trati
on (%
)
2010 2011
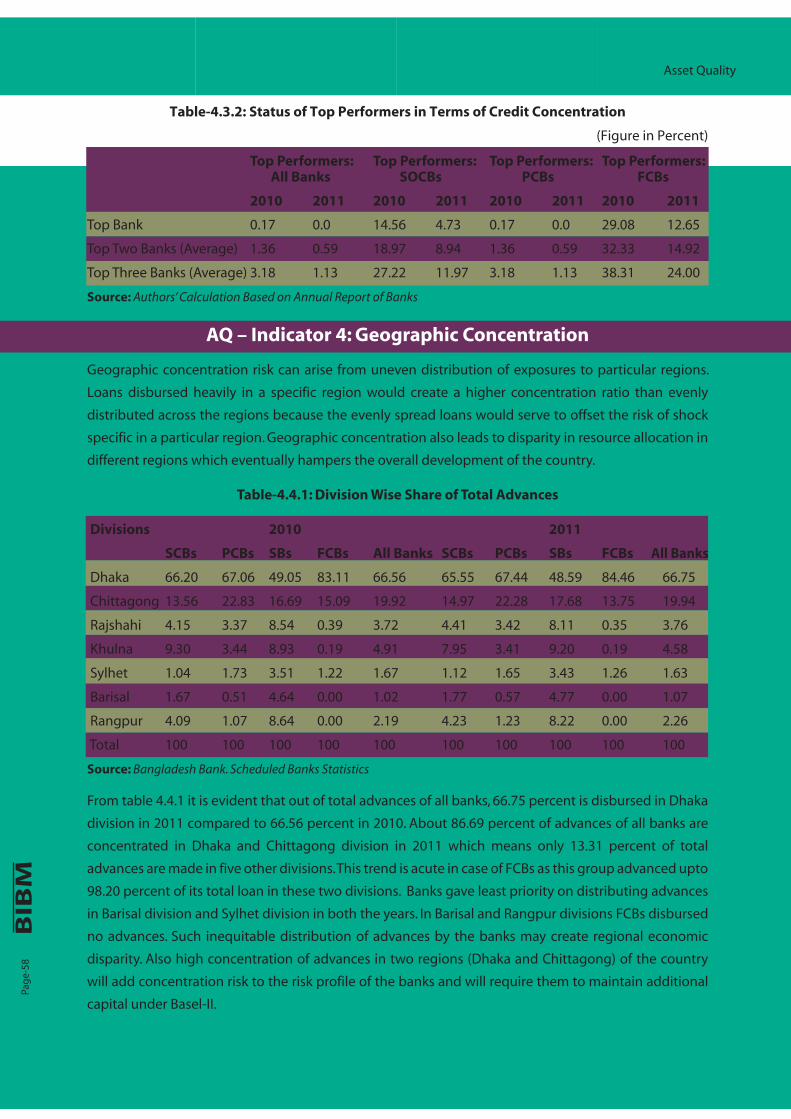
Asset Quality
Pag
e-58
Table-4.3.2: Status of Top Performers in Terms of Credit Concentration
(Figure in Percent)
Top Performers: Top Performers: Top Performers: Top Performers: All Banks SOCBs PCBs FCBs
2010 2011 2010 2011 2010 2011 2010 2011
Top Bank 0.17 0.0 14.56 4.73 0.17 0.0 29.08 12.65
Top Two Banks (Average) 1.36 0.59 18.97 8.94 1.36 0.59 32.33 14.92
Top Three Banks (Average) 3.18 1.13 27.22 11.97 3.18 1.13 38.31 24.00
Source: Authors’ Calculation Based on Annual Report of Banks
AQ – Indicator 4: Geographic Concentration
Geographic concentration risk can arise from uneven distribution of exposures to particular regions.
Loans disbursed heavily in a specific region would create a higher concentration ratio than evenly
distributed across the regions because the evenly spread loans would serve to offset the risk of shock
specific in a particular region. Geographic concentration also leads to disparity in resource allocation in
different regions which eventually hampers the overall development of the country.
Table-4.4.1: Division Wise Share of Total Advances
Divisions 2010 2011
SCBs PCBs SBs FCBs All Banks SCBs PCBs SBs FCBs All Banks
Dhaka 66.20 67.06 49.05 83.11 66.56 65.55 67.44 48.59 84.46 66.75
Chittagong 13.56 22.83 16.69 15.09 19.92 14.97 22.28 17.68 13.75 19.94
Rajshahi 4.15 3.37 8.54 0.39 3.72 4.41 3.42 8.11 0.35 3.76
Khulna 9.30 3.44 8.93 0.19 4.91 7.95 3.41 9.20 0.19 4.58
Sylhet 1.04 1.73 3.51 1.22 1.67 1.12 1.65 3.43 1.26 1.63
Barisal 1.67 0.51 4.64 0.00 1.02 1.77 0.57 4.77 0.00 1.07
Rangpur 4.09 1.07 8.64 0.00 2.19 4.23 1.23 8.22 0.00 2.26
Total 100 100 100 100 100 100 100 100 100 100
Source: Bangladesh Bank. Scheduled Banks Statistics
From table 4.4.1 it is evident that out of total advances of all banks, 66.75 percent is disbursed in Dhaka
division in 2011 compared to 66.56 percent in 2010. About 86.69 percent of advances of all banks are
concentrated in Dhaka and Chittagong division in 2011 which means only 13.31 percent of total
advances are made in five other divisions. This trend is acute in case of FCBs as this group advanced upto
98.20 percent of its total loan in these two divisions. Banks gave least priority on distributing advances
in Barisal division and Sylhet division in both the years. In Barisal and Rangpur divisions FCBs disbursed
no advances. Such inequitable distribution of advances by the banks may create regional economic
disparity. Also high concentration of advances in two regions (Dhaka and Chittagong) of the country
will add concentration risk to the risk profile of the banks and will require them to maintain additional
capital under Basel-II.
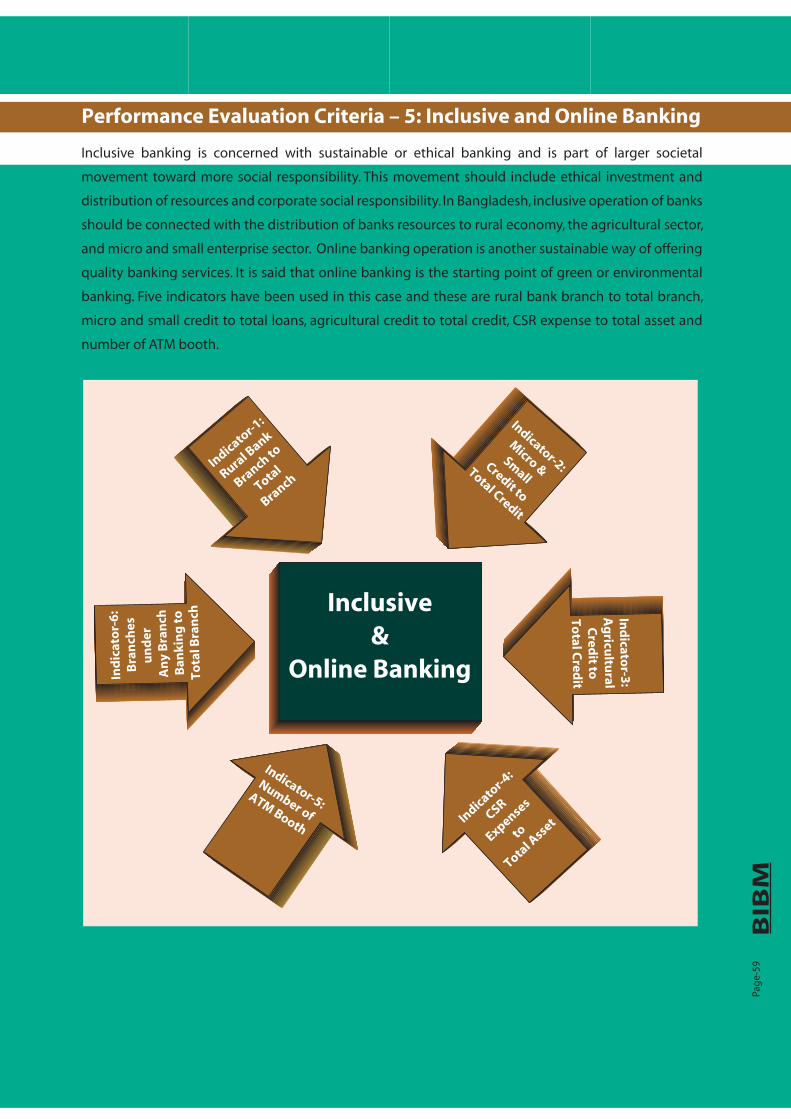
Inclusive banking is concerned with sustainable or ethical banking and is part of larger societal
movement toward more social responsibility. This movement should include ethical investment and
distribution of resources and corporate social responsibility. In Bangladesh, inclusive operation of banks
should be connected with the distribution of banks resources to rural economy, the agricultural sector,
and micro and small enterprise sector. Online banking operation is another sustainable way of offering
quality banking services. It is said that online banking is the starting point of green or environmental
banking. Five indicators have been used in this case and these are rural bank branch to total branch,
micro and small credit to total loans, agricultural credit to total credit, CSR expense to total asset and
number of ATM booth.
Pag
e-59
Inclusive&
Online Banking
Performance Evaluation Criteria – 5: Inclusive and Online Banking
Indicato
r-1:
Rural B
ank
Branch to
Total
Branch
Indicator-2:
Micro &
Small
Credit to
Total Credit
Ind
icator-3
:A
gricu
ltural
Cred
it toTo
tal Cred
it
Indicato
r-4:
CSR
Expenses
to
Total A
sset
Indicator-5:
Number of
ATM Booth
Ind
icat
or-
6:
Bra
nch
esu
nd
er
An
y B
ran
chB
anki
ng
to
Tota
l Bra
nch

Inclusive and Online Banking
Pag
e-60
I&O - Indicator 1: Rural Bank Branch to Total Branch
Higher number of Rural Bank Branch indicates greater access to finance by the under privileged people.
The ratio of Rural Bank Branch to Total Branch indicates the relative proportion of rural branch expansion.
Table-5.1.1 shows that rural bank branch in the year 2011 accounts for 28.10 percent of total branches
of all banks which is 2.37 percent lower than the year 2010. It is interesting to note that all bank groups
have experienced decline in the ratio of rural bank branch to total branch. Such decline in the proportion
of rural bank branch is an indication of the reluctance of the banks to increase rural branch in the same
proportion as the increase in urban branch. This may be due to the poor rural infrastructure, insufficient
rural security, lack of new banking product suitable for rural market, non-availability of skilled
manpower in rural branches and lower profitability. Surprisingly, FCBs don’t run any branch in the rural
areas. SOCBs, as shown is Figure-5.1.1, hold 68.24 percent of total rural bank branch in 2011. It is also
evident that PCBs hold 31.76 percent and FCBs hold no rural branches. But recent central bank initiative
to allow one urban branch for one rural branch may help to improve the situation.
Table-5.1.1: Rural Branch (RB) to Total Branch (RB)
Bank Categories RB to TB (%) Change (%)
2010 2011
SOCBs 55.35 53.23 -2.12
PCBs 31. 27 28.53 -2.74
FCBs 0.00 0.00 0.00
All Banks 30.47 28.10 -2.37
Source: Authors’ Calculation Based on Bangladesh Bank Data
Figure 5.1.1: Share of Rural Branch in 2011
Source: Based on Bangladesh Bank data
Following table 5.1.2 presents the position of top performing banks in terms of rural bank branch to
total branch of different bank groups. From the table, it is evident that all top performers belong to
SOCBs. It is also observed that there is a huge performance gap between all bank top performer and top
performer of other bank groups. It is interesting to note that foreign banks do not own any rural branch.
SOCBs 68.24%
PCBs 31.76%
FCBs 0%

Inclusive and Online Banking
Pag
e-61
Table-5.1.2: Status of Top Performers in Terms of Credit Concentration
(Figure in Percent)
Top Performers: Top Performers: Top Performers: Top Performers: All Banks SOCBs PCBs FCBs
2010 2011 2010 2011 2010 2011 2010 2011
Top Bank 72.05 71.32 72.05 71.32 46.98 47.83 0.0 0.0
Top Two Banks (Average) 60.01 60.06 62.14 60.06 46.93 44.59 0.0 0.0
Top Three Banks (Average) 57.42 55.98 57.42 55.56 45.97 43.22 0.0 0.0
Source: Authors’ Calculation Based on Bangladesh Bank Data
I&O - Indicator 2: Micro and Small Credit to Total Loans
Higher volume of Micro and Small Credit to Total Credit indicates greater access to finance by the under
privileged enterprises of Bangladesh. As shown in Table-5.2.1, Micro and Small Credit as a percentage of
Total Credit of the banks has increased by 5.58 percent in the year 2011 over the year 2010. This increase
is largely contributed by the PCBs that experienced 6.72 percent increase in Micro and Small Credit to
Total Credit ratio in 2011 over the year 2010. As depicted in Figure-5.2.1, PCBs hold the lion’s share of
total Micro and Small Credit of all banks in the year 2011 which is 87.70 percent. In this regard, share of
SOCBs and PCBs account for 10.09 percent and 2.21 percent respectively. Compelling regulatory
requirement might have helped to improve the scenario.
Table 5.2.1: Micro & Small Credit (MSC) to Total Credit (TC) (%)
Bank Categories RB to TB (%) Change (%)
2010 2011
SOCBs 1.26 2.95 1.69
PCBs 0.83 7.55 6.72
FCBs 0.07 1.51 1.44
All Banks 0.79 6.37 5.58
Source: Authors’ Calculation Based on Bangladesh Bank Data
Figure-5.2.1: Share of Micro & Small Credit in 2011
Source: Based on Bangladesh Bank data
SOCBs 10.09%
PCBs 87.7%
FCBs 2.21%
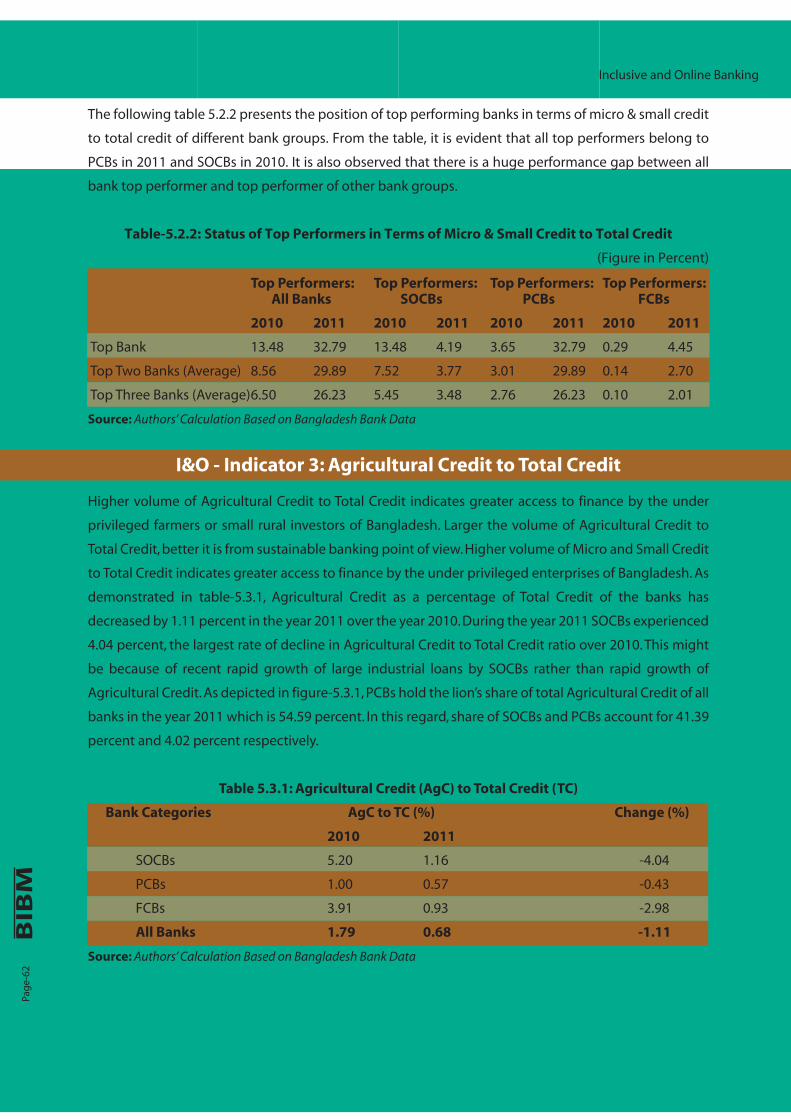
Pag
e-62
Inclusive and Online Banking
The following table 5.2.2 presents the position of top performing banks in terms of micro & small credit
to total credit of different bank groups. From the table, it is evident that all top performers belong to
PCBs in 2011 and SOCBs in 2010. It is also observed that there is a huge performance gap between all
bank top performer and top performer of other bank groups.
Table-5.2.2: Status of Top Performers in Terms of Micro & Small Credit to Total Credit
(Figure in Percent)
Top Performers: Top Performers: Top Performers: Top Performers: All Banks SOCBs PCBs FCBs
2010 2011 2010 2011 2010 2011 2010 2011
Top Bank 13.48 32.79 13.48 4.19 3.65 32.79 0.29 4.45
Top Two Banks (Average) 8.56 29.89 7.52 3.77 3.01 29.89 0.14 2.70
Top Three Banks (Average) 6.50 26.23 5.45 3.48 2.76 26.23 0.10 2.01
Source: Authors’ Calculation Based on Bangladesh Bank Data
I&O - Indicator 3: Agricultural Credit to Total Credit
Higher volume of Agricultural Credit to Total Credit indicates greater access to finance by the under
privileged farmers or small rural investors of Bangladesh. Larger the volume of Agricultural Credit to
Total Credit, better it is from sustainable banking point of view. Higher volume of Micro and Small Credit
to Total Credit indicates greater access to finance by the under privileged enterprises of Bangladesh. As
demonstrated in table-5.3.1, Agricultural Credit as a percentage of Total Credit of the banks has
decreased by 1.11 percent in the year 2011 over the year 2010. During the year 2011 SOCBs experienced
4.04 percent, the largest rate of decline in Agricultural Credit to Total Credit ratio over 2010. This might
be because of recent rapid growth of large industrial loans by SOCBs rather than rapid growth of
Agricultural Credit. As depicted in figure-5.3.1, PCBs hold the lion’s share of total Agricultural Credit of all
banks in the year 2011 which is 54.59 percent. In this regard, share of SOCBs and PCBs account for 41.39
percent and 4.02 percent respectively.
Table 5.3.1: Agricultural Credit (AgC) to Total Credit (TC)
Bank Categories AgC to TC (%) Change (%)
2010 2011
SOCBs 5.20 1.16 -4.04
PCBs 1.00 0.57 -0.43
FCBs 3.91 0.93 -2.98
All Banks 1.79 0.68 -1.11
Source: Authors’ Calculation Based on Bangladesh Bank Data

Pag
e-63
Inclusive and Online Banking
Figure-5.3.1: Share of Agricultural Credit in 2011
Source: Based on Bangladesh Bank data
The following table 5.3.2 presents the position of top performing banks in terms of agricultural credit to
total credit in different bank groups. It is evident from the table that all top performers belong to SOCBs
both in 2011 and 2010. All bank groups have disbursed agricultural credit almost at equal ratio in 2011.
Range of the ratio of agricultural credit to total credit of the bank groups is only 0.13 percent.
Table-5.3.2: Status of Top Performers in Terms of Agricultural Credit to Total Credit
(Figure in Percent)
Top Performers: Top Performers: Top Performers: Top Performers: All Banks SOCBs PCBs FCBs
2010 2011 2010 2011 2010 2011 2010 2011
Top Bank 8.13 1.88 8.13 1.88 3.02 1.75 0.77 1.83
Top Two Banks (Average) 7.29 1.86 7.29 1.62 2.66 1.70 0.77 1.31
Top Three Banks (Average) 6.55 1.82 6.55 1.49 2.52 1.53 0.51 1.07
Source: Authors’ Calculation Based on Bangladesh Bank Data
I&O - Indicator 4: CSR Expense to Total Asset
Higher volume of CSR Expenditure to Total Assets indicates greater contribution of a bank to community
development and environmental activities. Larger the ratio, better it is from corporate social responsibility
point of view. The ratio of CSR Expenses to Total Asset of all banks, as shown in Table-5.4.1, has declined
by 0.058 percent in the year 2011 from the year 2010. All bank groups have experienced a decline in the
ratio except FCBs that experienced 0.005 percent increase in 2011 over 2010. Largest decline is found in
case of PCBs which may be due to the decline in the profit figures of the individual banks of the group.
However, Figure-5.4.1 shows that PCBs contributed the lion’s share of the total CSR expenses of all banks
in the year 2011 with 85.01 percent. In this regard, share of SOCBs and PCBs account for 9.22 percent and
5.77 percent respectively.
SOCBs 44%
PCBs 21%
FCBs 35%
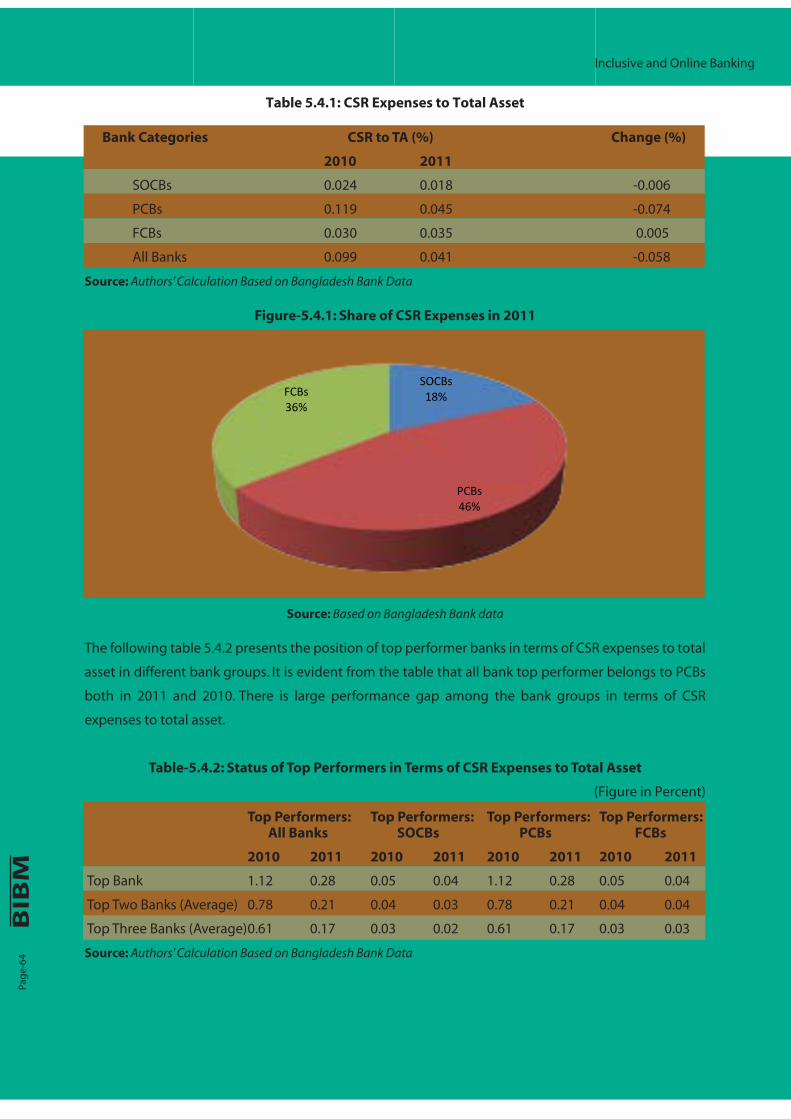
Pag
e-64
Inclusive and Online Banking
Table 5.4.1: CSR Expenses to Total Asset
Bank Categories CSR to TA (%) Change (%)
2010 2011
SOCBs 0.024 0.018 -0.006
PCBs 0.119 0.045 -0.074
FCBs 0.030 0.035 0.005
All Banks 0.099 0.041 -0.058
Source: Authors’ Calculation Based on Bangladesh Bank Data
Figure-5.4.1: Share of CSR Expenses in 2011
Source: Based on Bangladesh Bank data
The following table 5.4.2 presents the position of top performer banks in terms of CSR expenses to total
asset in different bank groups. It is evident from the table that all bank top performer belongs to PCBs
both in 2011 and 2010. There is large performance gap among the bank groups in terms of CSR
expenses to total asset.
Table-5.4.2: Status of Top Performers in Terms of CSR Expenses to Total Asset
(Figure in Percent)
Top Performers: Top Performers: Top Performers: Top Performers: All Banks SOCBs PCBs FCBs
2010 2011 2010 2011 2010 2011 2010 2011
Top Bank 1.12 0.28 0.05 0.04 1.12 0.28 0.05 0.04
Top Two Banks (Average) 0.78 0.21 0.04 0.03 0.78 0.21 0.04 0.04
Top Three Banks (Average) 0.61 0.17 0.03 0.02 0.61 0.17 0.03 0.03
Source: Authors’ Calculation Based on Bangladesh Bank Data
SOCBs 18%
PCBs 46%
FCBs 36%

Inclusive and Online Banking
Pag
e-65
I&O - Indicator 5: Number of ATM Booth
Greater number of ATM booths indicates greater and easy access of banking activities by the clients.
Larger the number of ATM booth, better the performance. As reported in table-5.5.1 total number of
ATM booths of the banks in the country is 3574 at the end of the year 2011 which 1457 more than total
ATM booths of the year 2010. ATM booths of the SOCBs have decreased to 52 from 65 whereas the ATM
booths of the PCBs have increased to 3375 from 1915. As depicted in figure-5.5.1, PCBs owns the lion’s
share of the total ATM booths of all banks in the year 2011 with 94.43 percent.
Table 5.5.1: Number of ATM Booth
Bank Categories Number of ATM Booth Change
2010 2011
SOCBs 65 52 -13
PCBs 1915 3375 1460
FCBs 137 147 10
All Banks 2117 3574 1457
Source: Based on Bangladesh Bank Data
Figure-5.5.1: Share of ATM Booth
Source: Based on Bangladesh Bank data
The following table 5.5.2 presents the position of top performing banks in terms of number of ATM
booth in different bank groups. It is evident from the table that all top performers belong to PCBs both
in 2011 and 2010. There is large performance gap among the bank groups in terms of number of ATM
booth. In this case, top performer of SOCBs owns only 41 ATM booths where as all bank top performer
owns 1940 ATM booths.
SOCBs 2%
PCBs 94%
FCBs 4%

Inclusive and Online Banking
Pag
e-66
Table-5.5.2: Status of Top Performers in Terms of Number of ATM Booth
Top Performers: Top Performers: Top Performers: Top Performers: All Banks SOCBs PCBs FCBs
2010 2011 2010 2011 2010 2011 2010 2011
Top Bank 1100 1940 40 41 1100 1940 82 87
Top Two Banks (Average) 651 1110 29 24 651 1110 61 64
Top Three Banks (Average) 464 804 21 17 464 804 46 49
Source: Authors’ Calculation Based on Bangladesh Bank Data
I&O - Indicator 6: Number of Any Branch Banking Branch to Total Branch
Greater number of branches under Any Branch Banking indicates better status and networking of
banks. Larger the number of branches under Any Branch Banking, better the performance. Table-5.6.1
.shows that 56 percent of the branches of all banks are under the any branch banking at the end of year
2011. This is largely contributed by the PCBs and FCBs. SOCBs have only 16 percent branch under any
branch banking. The situation of SOCBs calls for immediate action in this regard. Without improving the
situation of the SOCBs online payment system cannot be implemented in the banking sector successfully.
Table 5.6.1: Number of Any Branch Banking Branch to Total Branch
Bank Categories No. of ABBB to TB Change (%)
2010 (%) 2011(%)
SOCBs 3 16 13
PCBs 83 100 17
FCBs 100 100 00
All Banks 41 56 15
Source: Authors’ Calculation Based on Bangladesh Bank Data

Chapter Four
Observations and Concluding Remarks
Pag
e-69
Observations and Concluding Remarks
The study attempts to assess the commercial banking industry by reviewing quantitative information
related to strength and soundness, size and growth, profitibility and efficiency, asset quality, and
inclusive and online banking. The observations of the study based on the above mentioned evaluation
criteria are summarized below.
One, Strength and soundness of the commercial banking sector, judged in terms of holding of capital,
NPL net of provisions, liquid assets, borrowing liabilities and advance-deposit ratios, shows improving
trend in between CY 2010 and CY 2011. Status of the commercial banking sector as a whole improved
in terms of holding of capital CY2010 and CY 2011. It is a matter of comfort that excepting one, all banks
of the country were maintaining the minimum capital ratio of above 10 percent. FCBs were found to be
relatively strong in terms of holding of capital as per the available data for CY 2011. In CY2010, of the
commercial bank, around 57 percent banks had the ratio of above 10 percent, 35 percent had in
between 9 to 10 percent and 8 percent had below 9 percent; however 97 percent banks had the ratio
of above 10 percent and 75 percent banks had above 11 percent as of end CY 2011.
As a whole the commercial banking sector of the country registered improvement in terms of the
‘Strength & Soundness’ indicator ‘Average NPL net of Provisions to Total Equity’. The ratio decreased
marginally by 1.20 percent in between end CY2010 and CY2011. In regard to the status, FCBs were
better positioned as compared to other bank groups. However, as a whole performance of the FCBs in
terms of the indicator deteriorated. As of the end CY 2011, the Average NPL net of Provisions to Total
Equity for SOCBs, PCBs and FCBs were 29.30 percent, 13.37 percent, and 2.04 percent respectively.
The data indicate notable improvement in the SOCBs that registered over 14 percent decline; however
still the existing level of the ratio remained a matter of concerns. In CY2010, about 65 percent banks had
the ratio of above 10 percent, and 8 percent banks had above 30 percent; however in CY2011, 58
percent banks had the NPL ratio of above 10 percent, and 6 percent had above 30 percent. In terms of
liquidity position, statuses of bank groups were not significantly different. The average Liquid Assets to
Short Term liabilities of SOCBs, PCBs and FCBs were 58.99 percent, 69.86 percent and 69.19 percent
respectively in the CY 2010. The average ratios of all categories of banks improved in between CY2010
and CY2011 mainly because of the initiatives undertaken in response to the liquidity problems in
CY2010. In CY 2010, 19 percent banks had the ratio of above 100 percent whereas for 30 percent banks
it was below 50 percent; however, 14 percent banks had the ratio of above 100 percent and for 8
percent it was below 50 percent in CY 2011.
The commercial banks’ reliance on borrowed fund as a whole increased in between CY2010 and
CY2011. Borrowed Liability as percentage to Total Liability was significantly higher for PCBs as compared
to that of SOCBs and FCBs as of year-end CY2011. The ratio was 3.41 percent for PCBs in CY 2010
Pag
e-70
Observations and Concluding Remarks
that increased to 4.30 percent in CY2011. It is an indication of growing reliance on borrowed funds by
some PCBs. The data reveal that around 30 percent PCBs were maintaining the ratio at the range from
5 percent to as high as unusual 21 percent. It might also indicate to the inefficient liquidity
management on the part of a few PCBs. In terms of the ratio, SOCBs experienced remarkable change
(from 0.69 percent to 2.39 percent) in between end CY2010 and CY2011. The ratio for FCBs was 0.97
percent in CY2011 that declined from 1.89 percent in CY2010. Of the total banks, 19 percent did not
have any Borrowed Liability whereas another 19 percent had above 5 percent of their respective Total
Liabilities.
In terms of Advance-Deposit ratio, the overall status of the banks improved in CY2011 as compared to
CY2010. The average ratio of the commercial banks declined from over 87 percent to around 83
percent. Especially, the ratio for the PCBs was unusually high as of end CY2010. Even after declining, the
average ratio remained higher than the limit set by the regulatory authority. Over 20 percent PCBs had
AD ratio of over 90 percent as of end CY2011. As the data show, SOCBs were maintaining liquidity
surplus as of both the year end. These trends point to the inefficient liquidity management on the part
of a number of PCBs and SOCBs. The data reveal drastic fall of the AD ratio of FCBs in between CY2010
and CY2011 because of the fall of the ratio of a single FCB.
Two, Size and growth of the commercial banking sector were judged in terms of the number of deposit
accounts and branches; volume of assets and revenues; and growth of advances, income and deposits,
shows changing trend in between CY 2010 and CY 2011. As an indicator of size, in terms of number of
Deposit Accounts, SOCBs hold the leading position. Though the market share in terms of the indicator
declined, still SOCBs collectively were holding over 53 percent of the total deposit accounts maintained
in the commercial banks as of end CY2011. PCBs collectively attained notable growth of around 25
percent in between CY2010 and CY2011 and was maintaining market share of around 46 percent as of
end CY2011. In terms of number of deposit accounts, PCBs attained around 27 percent average growth
in contrast to around 5 percent and 1 percent average growth by SOCBs and FCBs respectively. Over 40
percent PCBs of the country attained over 30 percent growth; and only five PCBs collectively
maintained around 60 percent of the total deposits accounts of PCBs.
In terms of size, the operations of banks expanded. As of end CY2011, the country had 6552 Bank
Branches of which 52 percent belonged to SOCBs and 47 percent to PCBs. As a whole there was around
4.5 percent growth in the bank branches of the country. FCBs had less than 1 percent market share in
terms of Bank Branches in the country. As a whole 10 percent bank branches of the PCBs increased in
between CY2010 and CY2011. There was only marginal growth of bank branches of SOCBs, however,
PCBs attained notable average growth of around 15 percent. Only top five (4 SOCBs and 1 PCB) had
around 60 percent market share as of end CY2011.

Pag
e-71
Observations and Concluding Remarks
The size of the banking sector expanded in terms of the volume of Total Revenue and Total Assets. Total
Revenue and Total Expenditure reached BDT588 million and BDT5488 million respectively as of end
CY2011. Total Revenue and Total Assets increased by 31 percent and 22 percent respectively in
between CY2010 and CY2011. PCBs hold the maximum market share of 70 percent of Total Revenue
and 64 percent of Total Assets. As of end CY2011, the market shares of Total Revenue and Total Assets
were 23 percent and 30 percent for the SOCBs. Top seven banks collectively owned about 40 percent of
banking industry’s Total Revenue of which four were PCBs and three were SOCBs. Of the Total Assets,
seven big banks collectively owned about 45 percent of which three were SOCBs, three were PCBs and
one was FCB.
Banks attained average Deposit Growth of around 23 percent and average Advance Growth of about 18
percent in CY2011. Though the Deposit Growth improved marginal (mainly because of the FCBs), there
was notable decrease in the Advance Growth. This might be explained by the very high growth rate of
the previous year and the liquidity difficulties of the banking sector during 2010-2011. All the three
broad groups of banks experienced decline in Advance Growth. SOCBs and PCBs also had marginal
decline in Deposit Growth. Of the bank-groups, PCBs attained relatively higher Deposit and Advance
Growth over the period. During the period, five PCBs attained remarkably high growth rates of over 40
percent both in volume of Deposits and Advances.
Growth figures for CY2011 may offer a misleading picture. After attaining an unusually high profit
growth in CY2010, PCBs suffered decline in CY2011. FCBs attained reasonably high profit growth in CY
2011 in contrast to a marginal growth in CY2010. The data for SCOBs shows unusually high profit
growth in CY2011 which was because of the notable negative growth of five banks in CY2011. Thus the
calculated figure for average growth of profit for the banks for CY2011 does not indicate the true
picture. In terms of Interest Income, banking sector experienced negative growth; however, still SOCBs
were better positioned with about 57 percent growth in CY2011. The growth rates of Net Interest
Income were relatively less for PCBs and FCBs. Practically, Non-Interest Income constitutes reasonably
high proportions for both PCBs and FCBs.
Three, Profitability and Efficiency, judged in terms of Return on Assets, Return on Equity, Total Expenses
to Total Revenue, and Profit per employee, shows mixed outcome. As a whole, the ROA and ROE of the
banks declined. Alongside decrease in income of the banks the changes may be attributed to the
increase in assets and equity due to asset revaluation by several banks. There were also growing
tendency among banks to offer bonus in the form of equity to their employees as a drive to improve
their volume of capital. Of the different bank groups, average ROA and ROE of PCBs declined as of end
CY2011 as compared to that of the CY2010. Especially, average ROE of the PCBs declined by about
one-third during the period. Of the different bank groups, FCBs average Return on Assets and equity
were reasonably good with above 3 percent and 22 percent respectively. Of the total, 25 percent
Pag
e-72
Observations and Concluding Remarks
banks were having above 2 percent ROA and 16 percent banks were maintaining more than 20 percent
Return on Equity as of end CY2011.
In regard to the operational efficiency, the performance of banks deteriorated. The ratio of Total
Expenses to Total Revenue increased while Profit per Employee declined in between CY2010 and
CY2011. About the performance of banks, FCBs are found to be well ahead of the PCBs and SOCBs in
terms of both the indicators. Though the average ratio of Total Expenses to Total Revenue of FCBs
increased marginally still it was much lower than the other groups. Surprisingly, the ratio of PCBs
increased remarkably and was over 6 percent higher than that of the SOCBs as of CY2011. As the data
for CY2011 indicate, the ratio for about 40 percent PCBs were above 70 percent. In terms of average
Profit per Employee, situations improved for both SOCBs and FCBs. FCBs experienced around
35 percent growth of Profit per Employee in monetary terms, on the contrary PCBs came across decline
of about 24 percent.
Four, Asset Quality of banks, judged in terms of the status of Non-Performing Loans, shows marginal
improvement in between CY2010 and CY2011. The ratio of Gross NPL to Total Loans and Advances
decreased, however, average Growth of the gross NPL increased remarkably mainly due to increase in
the average Growth of the Gross NPL of FCBs. Of the different bank categories, SOCBs had considerably
high NPL as of end CY2010. Average Gross NPL to Total Loans and Advances for PCBs and FCBs were
around 3 percent and 1 percent respectively in CY2011. Of the SOCBs 50 percent and of the PCBs 40
percent banks had the ratio of above 10 percent and around 4 percent of their respective loans and
advances. Average Growth of NPL increased remarkably in CY2011 mainly because of the very high
growth experienced by a single FCB; however, still FCBs as a whole were better positioned in terms of
the NPL indicators.
Concentration of the exposure of credit of banks improved in CY2011. SOCBs attained remarkable
improvement and were better positioned in terms of Credit Concentration. On an average, the status of
credit risk, as indicated by the data on Credit Concentration, improved marginally for PCBs. Though the
FCBs attained remarkable improvement in terms of Credit Concentration, the big loans for FCBs
constitute over 33 percent of their total outstanding loans as of end CY2011. Of the total banks, around
30 percent were having big loans that were above 30 percent of their respective loans and advances.
Loans and advances of the banks have been concentrated in Dhaka division. Especially FCBs heavily
concentrate in Dhaka. Though SOCBs have relatively less geographic concentration as compared to
PCBs and FCBs, still about two-third of the SOCBs’ credit facilities have been concentrated in the Dhaka
divisions. Of the PCBs, 90 percent credit facilities were offered in Dhaka and Chittagong division.
Five, Some notable changes have taken place in the banking sector in terms of Inclusive and Online
Banking in response mainly to the remarkable initiatives on the part of the Bangladesh Bank. Micro and
Pag
e-73
Small Credit of the commercial banks increased remarkably from less than 1 percent to more than
6 percent in between CY2010 and CY2011. However, still MSCs constitute an insignificant portion of the
total credit disbursed in the Micro and Small enterprise sector. A few PCBs attained remarkable
improvement in this connection. In regard to agricultural credit, commercial banks’ contribution
deteriorated. As of end CY2011, average Agricultural Credit to the Total Credit of the banks was less
than 1 percent. Though SOCBs account for more than half of the total credit disbursed to the
agricultural sector by the commercial banks, there was significant decrease of the agricultural credit by
the SOCBs in between CY2010 and CY2011. As a whole rural branches of the commercial banks as
proportion of their total braches also declined. In Bangladesh, SOCBs and PCBs have rural bank
branches, but FCBs do not have any. Proportion of rural branches for both the broad categories of
banks declined. As another indicator of inclusive measures, CSR Expenses of banks as percentage of the
Total Assets remained insignificant as of CY 2011. The CSR expenditure of the commercial banks
increased in terms of absolute figure, however, the figure declined as proportion to the total assets.
PCBs were the major contributors of the total CSR expenditures by banks. The status of online banking
in the countries improved remarkably over the years. In between CY 2010 and CY2011, the number of
ATM booths maintained by the banks increased by around 70 percent. And of these a single PCB holds
significantly high market share. The status of online banking in terms of Any Branch Banking also
improved mainly because of the remarkable initiatives by some FCBs and PCBs of the country.
The review of the banks comes up with mixed results. The banking sector expanded and activities
increased. Considering the global economic situation, profitability situation of banks is not at all
disheartening. There is no reason to be pessimistic in regard to the improving efficiency and strength,
however, proactive initiatives on the part of commercial banks especially SOCBs and some PCBs are the
need of the time for ensuring quality assets for the sustainability of the sector. Online banking activities
are also receiving due attention of the banking communities. However, a lot needs to be done to attain
the expected level of financial inclusion in the country. In spite of the remarkable initiatives by the
central bank of Bangladesh, collective responses remained inadequate. Expenditure on quality CSR
activities also requires more attention. There is no doubt that performance of the banking sector would
heavily depend upon the corporate governance practices and supportive regulatory environment in a
growing complex and challenging environment. Irrational expectation of profits and compromising
tendency with the quality of assets on the part of some banks could prove to be dangerous that are
clearly connected with the corporate governance practices of the banking sector of the country. And it
is more or less recognised that as a measure to handle some recently observed malpractices,
Bangladesh Bank needs strong support from the government to enforce its authority and supervisory
power.
Observations and Concluding Remarks
Pag
e-74
Appendix One: A Short Review of the Specialized Banks of Bangladesh
Currently, there are four specialized banks in Bangladesh. Following liberation, two specialized banks
were nationalized and renamed as Bangladesh Krishi Bank and Bangladesh Shilpa Bank. But Bangladesh
Krishi bank was divided in 1987 and Rajshahi Krishi Unnayan Bank (RAKUB) was created for Rajshahi
Division to promote agricultural development in that region and Bangladesh Krishi bank for the rest of
part of the country. In 1988, another specialized bank named Bank of Small Industries and Commerce
Bangladesh Ltd. (BASIC) was established as a joint venture bank to promote small and medium
entrepreneurship. In 1993, the then Government of Bangladesh took the control of BASIC and was
declared it as a specialized bank. Bangladesh Shilpa Bank was merged with Bangladesh Shilpa Rin
Sangsta(BSRS) in 2010 and renamed as Bangladesh Development Bank Limited(BDBL). Thus, currently
there are four specialized banks which are also termed as Development Financial Institutions (DFIs).
Since its inception, BKB has been offering financial services in the agricultural sector of the country.
Though, agricultural and rural finance programs are being participated by the PCBs and FCBs through
their branch network or in collaboration with NGOs and specialized banks, however, still BKB alone
disbursed most of the total agriculture credit offered by the banking sector. Following the regional
approach, RAKUB is engaged in offering intensive financing services to agriculture of Rajshahi and
Rangpur administrative divisions providing livelihood to over 35 million people of the area considering
the fact that the region is less developed compared to other parts, yet full of potentials in agriculture.
BKB and RAKUB perform functions like financing agri-business and agro-based industries and poverty
alleviation programs. These banks also perform limited commercial banking activities.
BASIC Bank was established as the policy makers of the country felt the urgency for a bank in the private
sector for financing small scale Industries. The bank is unique in its objectives. It is a blend of development
and commercial banks. The bank offers term loans to industries especially to small-scale enterprises,
full-fledged commercial banking service including collection of deposit, short term trade finance,
working capital finance in processing and manufacturing units and financing and facilitating
international trade. It also offers technical support to small scale industries in order to enable them to
run their enterprises successfully. In addition to that Basic Bank serves urban poor through linkage with
NGOs with a view to facilitating their access to the formal financial market for the mobilization of
resources. BDBL offers commercial banking services and provides financial and technical assistance to
broaden the private as well as public sector industrial base of the country. In regard to offering financing
services, BDBL prioritizes export oriented industrial units, efficient import substitution, commercialization
of local technology and promotion of agro-based industry. These banks are engaged in offering
reasonably good amount in SME sector of the country.

Pag
e-75
Appendix Figure 1.1: Market Share of Specialized Banks in Advances, Deposits, Assets and Branches [in percentage]
Deposit Loans
Assets BranchesSource: Based on MOF and Annual Reports of Banks
Of the specialized banks, BKB is the market leader having significant market shares in terms of total
deposits, advances, assists and branch networks [appendix figure 1.1]. BKB was holding more than half
of the total market share in all categories. Specialized banks attained notable growth in terms of total
deposits and number of branches mainly because of the very high deposit growth attained by the BDBL
and notable increase in the number of branches of the BASIC bank in between 2010 and 2011. Growth
rates of the loans and advances remained far behind the growth of deposits, a situation matches with
that of the commercial banking sector mainly in response to the liquidity difficulty faced by the banking
industry [appendix figure 1.2]. Average operating profits of the specialized banks decreased and
classified loans remained a matter of concern mainly because of the very high classified loans of BKB
and RAKUB [appendix figure 1.3].
Appendix Figure 1.2: Average Growth Rates of Selected Expansion Indicators of the Specialized Banks [Average in %]
Source: Based on MOF and Annual Reports of Banks%]
29.20
2.21 59.55
9.05
BASIC
BDBL
BKB
RAKUB
24.54
4.33
56.83
14.30
BASIC
BDBL
BKB
RAKUB
23.73
8.78
53.32
14.18 BASIC
BDBL
BKB
RAKUB
2.42 1.50
69.28
26.02 BASIC
BDBL
BKB
RAKUB
20.62
13.49
10.43
1.97
14.44
0.00
5.00
10.00
15.00
20.00
25.00
Deposit Total Loansand Advance
Total Assets TotalEmployees
Number ofBranch

Pag
e-76
Appendix Figure 1.3: Average Growth Rates of Selected Performance Indicators of the Specialized Banks [Average in %]
Source: Based on MOF and Annual Reports of Banks
Tables 1.1 and 1.1 show the indicators related to the expansion and performance of the specialized
banks of the country in 2010 and 2011. Rural economy of the country has been receiving benefits
mainly from the BKB and RAKUB. The tables show that BKB and RAKUB had notable outstanding
volumes of agricultural credit both in 2010 and 2011. Three specialized banks, BKB, RAKUB, and BASIC
disbursed considerable amount targeting poverty eradication. According to the available information
for 2011, other than BASIC, the classified loans of the specialized banking sector was at very high level.
Practically, BKB and RAKUB have mainly been engaged in implementing government’s policy initiative
to ensure greater access of the rural and agricultural economy to the formal sector banks, and thus
asset quality received less priority in disbursing credit. These banks have also been distributing credit at
relatively lower interest rates.
Appendix Table 1.1: Status of Deposits, Loans, Branches and Employees for the Year 2010
[in million BDT]
BASIC BDBL BKB RAKUB
Deposit 49259 3254 110225 20672
Total Loans and Advance 46341 9906 106289 31328
Total Assets 61500 27519 159847 46431
Total Employees 964 757 9718 3387
Number of Branch 34 17 954 365
Agricultural Loans 0 0 65858 20722
Poverty Eradication Loans 989 0 4134 1000
Classified Loans 2237 3101 28082 13131
Classified Loan to Total Loans 4.83 38.5 26 42
Operating Profit 1717 823 144 -247
Source: Based on MOF and Annual Reports of Banks
4.69 -4.81
-235.97
-250
-200
-150
-100
-50
0
50
Classified Loans Classified Loan Ratio Operating Profit

Pag
e-77
Appendix Table 1.2: Status of Deposits, Loans, Branches and Employees for the Year 2011 [in million BDT]
BASIC BDBL BKB RAKUB
Deposit 62651 4733 127777 19417
Total Loans and Advance 56886 10045 131754 33156
Total Assets 78023 28850 175276 46604
Total Employees 1132 741 9166 3328
Number of Branch 45 21 972 365
Agricultural Loans 338 0 71883 22537
Poverty Eradication Loans 4471 0 3178 1137
Classified Loans 2489 3100 30283 13089
Classified Loans to Total Loans 4.83 38.28 23 39
Operating Profit 2336 867 -1543 -707
Source: Based on MOF and Annual Reports of Banks
Appendix Table 1.3: Selected Growth Indicators of Specialized Banks
[Growth Rates in % between 2010 and 2012]
BASIC BDBL BKB RAKUB
Deposit 27.19 45.45 15.92 -6.07
Total Loans and Advance 22.76 1.40 23.96 5.84
Total Assets 26.87 4.84 9.65 0.37
Total Employees 17.43 -2.11 -5.68 -1.74
Number of Branch 32.35 23.53 1.89 0.00
Classified Loans 11.27 -0.03 7.84 -0.32
Source: Based on MOF and Annual Reports of Banks

Published by Bangladesh Institute of Bank ManagementPlot # 4, Main Road # 1(South), Section # 2, Mirpur, Dhaka-1216
PABX: 9003031-5, 9003051-2, Fax: 88-02-9006756
Email: [email protected], Web: www.bibm.org.bd
June 2013
Printed by: Agami Printing & Publishing Co., Dhaka, Bangladesh
Administrative Support Team
Sufia Khatun
Sharmina Nargish
Papon Tabassum
Md. Habibur Rahman
Sarder Aktaruzzaman
Tarannum Purween
Md. Faysal Alam
Shirina Khatun
Graphics & DesignMd. Nasir Uddin

Plot No.- 4, Main Road No.-1(South), Section No.-2, Mirpur, Dhaka-1216Tel: 9003031-5; 9003051-2, Fax: 880-2-9006756, E-mail: [email protected]; Website: www.bibm.org.bd
Bangladesh Institute of Bank Management
Price Tk. 300.00


![Shahjalal Islami Bank Ltd. - Jobs Test bd · Exam Aid Bank Written Math Jafar Iqbal Ansary Page 1 Shahjalal Islami Bank Ltd. Managemen t Trainee Officer 2016 [Exam Taker: BIBM] 1](https://img.pdfslide.us/doc/110x75/5e720ed38948c230d92cfd66/shahjalal-islami-bank-ltd-jobs-test-bd-exam-aid-bank-written-math-jafar-iqbal.jpg)