Embed Size (px)
Citation preview
1
Bank regulation, the quality of institutions and banking risk in emerg-
ing and developing countries: An empirical analysis
Jeroen Klompa 1
and Jakob de Haanb,c,d
a Wageningen University, The Netherlands
b University of Groningen, The Netherlands
c De Nederlandsche Bank, The Netherlands
d CESifo, Munich, Germany
This version, November 2013
Abstract
Using data for more than 400 banks from about 70 non-industrial countries from 2002
to 2008, we examine the impact of bank regulation and supervision on banking risk.
Our main findings suggest that stricter regulation and supervision reduces banking risk.
Notably, capital regulations and supervisory control reduce bank riskiness. Liquidity
regulation and activities restrictions also restrain banking risk but only in case of a high
level of institutional quality. Finally, we find that the effect of regulation and supervi-
sion also depends on the structure of a bank (such as ownership, size, being listed, and
riskiness) and the level of development.
Keywords: Banking risk; Bank regulation and supervision; Institutional quality;
Bank structure
JEL Codes: E44; G2; O16
1 Corresponding author: Jeroen Klomp, Wageningen University, Social Sciences Group, P.O. Box 8130,
6700 EW, Wageningen, The Netherlands; E-mail: [email protected]. The views expressed are those
of the authors and they do not necessarily reflect the position of De Nederlandsche Bank.
2
1. Introduction
During the past two decades, many developing and emerging countries have liberalized
their financial systems by ceasing credit controls, privatizing state banks, removing in-
terest rate ceilings, and allowing free entry. Several authors claim that this financial
reform increases the financial system’s efficiency, thereby enhancing economic growth
(King and Levine, 1993; Rajan and Zingales, 1998; Levine et al., 2000).2 A ca et al.
(2013) report that banking sector reforms are associated with lower corporate debt in
emerging countries. This finding is consistent with the notion that these reforms im-
prove banks’ risk management and result in tighter lending standards, leading firms to
use less bank debt in their capital structure. However, financial liberalization may also
lead to financial crises as financial institutions have more opportunities for excessive
risk-taking in a liberalized financial system (Kaminsky and Reinhart, 1999). Strong
bank regulation and supervision may reduce the risks of financial fragility due to finan-
cial liberalization (Barth et al., 2004a; Podpiera, 2004; Das et al., 2005; Demirgüç-Kunt
et al. 2008; Delis and Staikouras, 2011; Klomp and de Haan, 2012).
Most previous research on the relationship between bank regulation and supervi-
sion and banking risk employed samples that include industrial, emerging and develop-
ing countries.3 In this paper we use a sample of developing and emerging economies as
these countries differ in a number of respects from industrial countries (Claessens and
Yurtoglu, 2013) which may affect the extent to which bank regulation and supervision
affect banking risk.
First, developing and emerging countries generally have a lower level of institu-
tional development than industrial countries. Notably with respect to law and order,
contract enforcement and corruption the countries in our sample lack behind advanced
countries. Demirgüç-Kunt and Detragiache (1998) find that the probability of financial
fragility is positively associated with weaker institutions. Similarly, Delis (2012) reports
2 See Bumann et al. (2013) for an extensive survey of the literature on the relationship between financial
liberalization and economic growth. Since the Asian crises of 1997-98, the conventional wisdom has
changed. The new consensus holds that, while capital account and domestic financial liberalization are
the best policies in the long run, financial reforms should be accompanied by efforts to improve the incen-
tives of financial agents, including adequate financial regulation (Pesenti and Tille, 2000). 3 See section 2 for a discussion of previous research.
3
that financial liberalization policies reduce the market power of banks in countries with
advanced institutions, while banking competition does not improve at the same pace in
countries with weaker institutions. Likewise, institutional development may affect the
effectiveness of bank regulation and supervision. Therefore, we examine whether the
impact of regulation and supervision on banking risk is conditioned by the quality of
institutions.
Second, the countries in our sample are (far) behind advanced countries with re-
spect to their level of economic development. Even though our analysis does not in-
clude advanced countries, the level of economic development of the countries in our
sample differs considerably. Therefore, we examine whether the level of development
affects the impact of regulation and supervision on banking risk. Earlier studies
(Demirgüç-Kunt et al., 2008 and Barth et al., 2004a) report that the impact of regulation
and supervision increases with the level of development. Likewise, we analyze whether
the extent of financial liberalization matters. Even though most countries in our sample
liberalized their financial system, there is much variability in our sample with respect to
the level of financial liberalization. Kaminsky and Reinhart (1999) argue that the impact
of regulation and supervision may be stronger in more liberalized countries.
Finally, we analyze whether the structure of the supervised bank affects the im-
pact of regulation and supervision on banking risk. For instance: do ownership (private
vs. government ownership; domestic vs. foreign ownership), riskiness and size of the
bank matter? Likewise, are listed and unlisted banks affected in the same way by bank
regulation and supervision? As will be explained in more detail in section 6, previous
literature suggests that these dimensions of bank structure may influence the effective-
ness of bank regulation and supervision in reducing banking risk.
Our analysis is based on a five-stage approach. In the first stage of our analysis,
we use the survey data of Barth et al. (2004a,b; 2008) to compute our proxies for bank
regulation and supervision. Following Pasiouras et al. (2006), we construct seven
measures: 1) capital regulations; 2) regulations on private monitoring; 3) regulations on
activities restrictions; 4) supervisory control; 5) deposit insurer’s power; 6) liquidity
regulations, and 7) market entry regulations, respectively.
4
In the second stage of our analysis, we apply factor analysis on 14 indicators of
banking risk. We use data provided by Bankscope for more than 400 banks located in
about 70 developing and emerging countries for the 2002-2008 period to construct
measures of banking risk. For this period sufficient data are available, while relation-
ships are not affected by the recent financial crisis. The results of the factor analysis
suggest that a one-factor model captures most of the variance of the various indicators
of banking risk.
In the third stage of our analysis, we use a dynamic panel model to estimate the
relationship between banking risk and bank regulation and supervision, taking institu-
tional quality into account. We address the potential endogeneity problems of bank reg-
ulation and supervision by presenting system-GMM and instrumental variable models.
In the fourth stage of our analysis, we split our sample in different subsamples
according to particular bank structure characteristics, such as ownership, size and riski-
ness. This allows us to draw inferences about the importance of these bank characteris-
tics. In the final stage of our analysis, we split the sample according to levels of eco-
nomic development, and financial liberalization.
Our main finding suggests that some measures of bank regulation and supervi-
sion have a significant negative impact on banking risk in developing and emerging
countries. In particular, we find that stricter capital regulation and supervisory control
reduce the level of banking risk. In addition, restrictions on liquidity and activities are
effective in restraining banking risk but only when the institutional environment is suf-
ficiently strong. Finally, we find that the impact of most regulation and supervision
measures in a country depends on the structure of a bank. The impact of regulation and
supervision on banking risk, for instance, is higher for high-risk banks than for low-risk
banks, while capital and liquidity regulations have a larger impact on small banks than
on large banks. Also the country’s level of development matters: the impact of regula-
tion and supervision on banking risk is stronger in emerging countries than in develop-
ing countries.
The remainder of the paper is structured as follows. The next section gives a
short overview of the existing studies on banking risk and regulation. Section 3 intro-
5
duces our proxies for bank regulation and supervision and banking risk, while section 4
describes the methodology and other data used. Section 5 presents the estimation results
for the effect of bank regulation and supervision on banking risk and the role of institu-
tional quality therein, while section 6 examines the impact of bank structure. Section 7
zooms in on sample splits according to the levels of development and financial liberali-
zation. The final section concludes.
2 Literature review
There is a small but growing literature on the impact of bank regulation and supervision
on bank behavior. A major issue in this line of research is how to construct proxies for
bank regulation and supervision. A few studies use an index measuring the extent to
which countries adhere to the Core Principles for Effective Bank Supervision as issued
by the Basel Committee on Banking Supervision (BCPs). A good example is the study
by Demirgüç-Kunt et al. (2008) who find a positive relationship between financial
soundness and the overall index of BCP compliance, but this result is sensitive to con-
trolling for the institutional quality of the country and to the exclusion of outliers. More
recently, Demirgüç-Kunt and Detragiache (2011) have explored whether BCP compli-
ance affects bank soundness (proxied by the Z-score, defined as the number of standard
deviations by which bank returns have to fall to exhaust bank equity). Using data for
3,000 banks from 86 countries, they do not find support for the hypothesis that better
compliance with BCPs results in sounder banks.
Three earlier papers have also used information on BCP compliance to study
bank performance. Sundararajan et al. (2001) use a sample of 25 countries to examine
the relationship between an overall index of BCP compliance and non-performing loans
(NPLs) and loan spreads. They found BCP compliance not to be a significant determi-
nant of financial soundness. Podpiera (2004) extends the set of countries and finds that
better BCP compliance lowers NPLs. Das et al. (2005) relate bank soundness to a
broader concept of regulatory governance, which encompasses both compliance with
the BCPs and with standards and codes for monetary and financial policies. Better regu-
6
latory governance is found to be associated with sounder banks, particularly in countries
with better institutions.
Compliance with the BCPs is mostly classified information. Most studies there-
fore employ the World Bank survey on supervision to construct measures of bank regu-
lation and supervision. In several surveys, Barth et al. (2004; 2008) collected detailed
and comprehensive information on bank regulation and supervision for more than 107
countries between 1999 and 2008. Barth et al. (2004) report that policies that induce
accurate information disclosure and (incentives for) private sector corporate control of
banks work best to promote banking sector stability. Also Pasiouras et al. (2006) use
this survey to construct indicators of bank regulation and supervision. Employing bank
level data from 71 countries and 857 banks, they find that various dimensions of bank
regulation and supervision have a significant impact on bank credit ratings.
Fonseca and González (2010) examine capital buffers. Using panel data of 1337
banks in 70 countries between 1992 and 2002, they find that the net effect of regulation
and supervision on capital buffers is positive. Delis et al. (2011) examine the relation-
ship between capital regulation and banking risk (proxied by NPLs, the Z-score and
volatility of ROA). Using data for OECD countries for the 1998-2008 period they find
that that capital regulation can have a positive or negative effect on banking risk de-
pending on certain bank characteristics, other regulations and the state of the macroeco-
nomic environment. Agoraki et al. (2011) consider the impact of capital requirements,
restrictions on bank activities and official supervisory power, using data from the Cen-
tral and Eastern European banking sectors over the 1998–2005 period. Their results
suggest that these regulations reduce banking risk (proxied by NPLs and the Z-score),
but the effect of capital regulations and of regulations on activities restrictions depends
on banks’ market power.
Also Klomp and de Haan (2012) employ the World Bank data to construct prox-
ies for bank regulation and supervision. In addition, they use factor analysis on
Bankscope data for more than 200 banks in 21 OECD countries for the period 2002 to
2008 to construct measures of banking risk. Using quantile regressions, Klomp and de
7
Haan find that bank regulation and supervision do not have much effect on low-risk
banks, but they have a highly significant effect on high-risk banks.
Barth et al. (2013) employ panel analysis of 4050 banks observations in 72
countries over the period 1999–2007 and find that tighter restrictions on bank activities
are negatively associated with bank efficiency, while greater capital regulation stringen-
cy is marginally and positively associated with bank efficiency. They also find that offi-
cial supervisory power is positively increases bank efficiency, but only in countries with
independent supervisory authorities.
Some papers use an alternative to the BCP compliance indicators or the World
Bank survey data. For instance, González (2005) uses a panel of 251 banks in 36 coun-
tries from 1995 to 1999 to analyze the impact of bank regulation on bank charter value
and risk-taking. To measure the level of regulatory restrictions on bank activities, Gon-
záles (2005) employs the banking and finance index published annually for each coun-
try by the Heritage Foundation, which measures the relative openness of a country’s
banking and financial system. Gonzáles concludes that banks in countries with stricter
regulation have a lower charter value, which increases their incentives to follow risky
policies.
Another example is the study by Ben Naceur and Omran (2011) who use a sam-
ple of 173 banks from ten countries (Tunisia, Bahrain, Egypt, Jordan, Kuwait, Lebanon,
Morocco, Oman, Saudi Arabia, and United Arab Emirates) over the period 1989–2005
to assess the impact of bank regulations and institutional factors on bank performance.
Their proxy for reserve requirements is the ratio of non-interest earning assets divided
by total assets, while they include the coverage-to-deposit per capita ratio to control for
the protection provided by authorities for depositors. These authors find that both prox-
ies increase bank cost efficiency.
8
3. Measuring bank regulation and supervision and banking risk4
3.1 Bank regulation and supervision
Barth et al. (2004a,b; 2008) collected detailed and comprehensive information on bank
regulation and supervision for more than 107 countries between 1999 and 2008. We use
this survey data to compute proxies for bank regulation and supervision. The survey
consists of 175 questions on regulation and supervision of commercial banks. Following
Pasiouras et al. (2006), we classify the survey questions used into seven groups: 1) capi-
tal regulations; 2) regulations on private monitoring; 3) regulations on activities re-
strictions; 4) supervisory control; 5) deposit insurer’s power; 6) liquidity regulations,
and 7) market entry regulations. An appendix, which is available on request, shows the
(classification of the) questions of the survey included in our analysis, as well as their
variation. In constructing our regulation and supervision variables, we use principle
components analysis (PCA) to the questions used to construct the measures of bank
regulation and supervision. PCA produces a factor score with mean zero and standard
deviation one. An advantage of this method is that individual questions used in con-
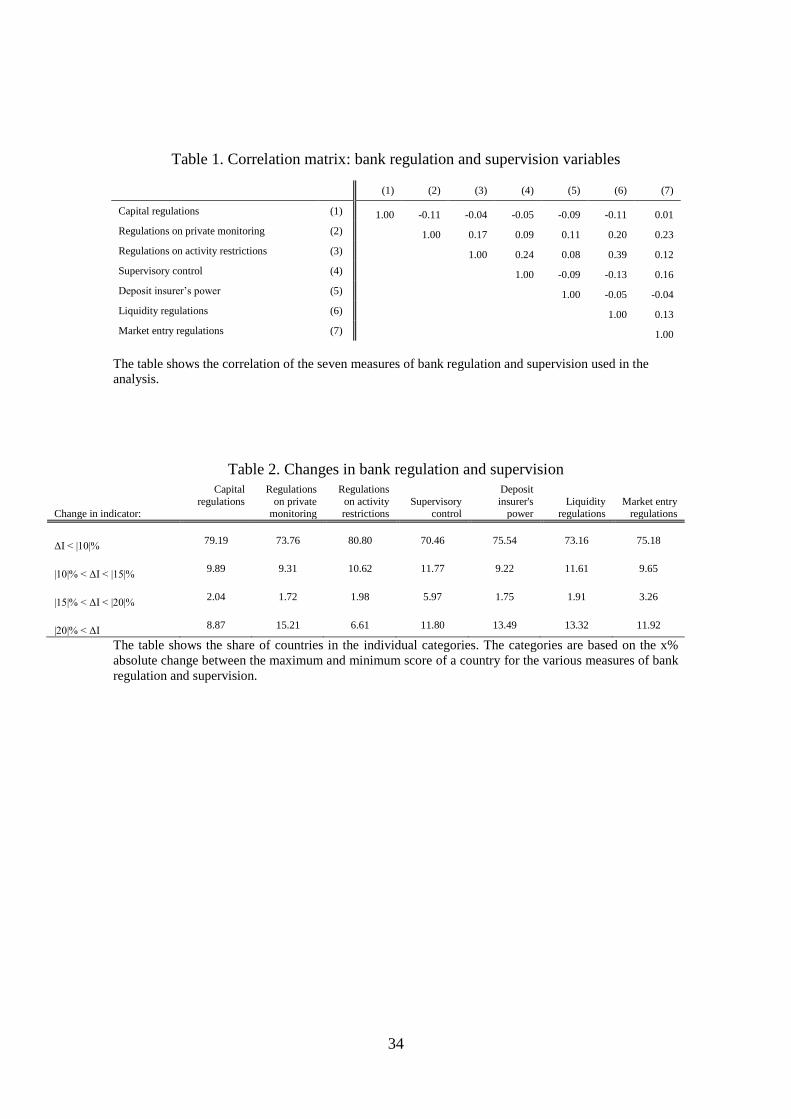
structing each measure are not equally weighted. The correlation matrix in Table 1
shows that the correlation between the seven measures of bank regulation and supervi-
sion ranges between -0.12 and 0.37 indicating that the various measures capture differ-
ent dimensions of the regulatory framework.
Table 2 categorizes the countries according to the difference between the maxi-
mum and minimum factor scores. Table 2 suggests that our measures for bank regula-
tion and supervision are very persistent. In most cases more than 75 percent of the coun-
tries have a difference between the maximum and minimum score of less than 10 per-
cent.5 Due to the limited fluctuations over time of our measures for bank regulation and
supervision, the probability that reverse causality (i.e. banking risk affects bank regula-
tion and supervision) drives our findings seems limited.
4 This section draws on Klomp and de Haan (2012).
5 Likewise, there is a high correlation of the medians of our measures for bank regulation and supervision
and their maximum and minimum scores.
9
[Insert Tables 1 and 2 here]
3.2 Banking risk
Studies on banking risk usually employ a one-dimensional risk indicator, like the share
of non-performing loans, return on equity, the Z-factor, capital ratios, or credit ratings
(see section 2 for details). However, it is questionable whether these indicators fully
capture banking risk. According to Gaganis et al. (2006) and Agoraki et al. (2011), indi-
cators of asset quality, capitalization and market structure are more informative as an
indicator of banking risk compared to indicators of profitability, efficiency and man-
agement qualities. This suggests that banking risk is multidimensional. Furthermore,
most indicators based on balance sheet data contain some measurement error due to, for
example, different calculation methods or on- and off balance issues (Zhao et al., 2009).
We use proxies for the International Monetary Fund (IMF)’s core set of Finan-
cial Soundness Indicators or CAMEL indicators—i.e., capital adequacy, asset quality,
management, earnings and profitability, and liquidity (IMF, 2000).6 There is a broad
agreement in the empirical literature that the CAMEL indicators are useful in assessing
the financial vulnerability of banks. Supervisors often use (combinations of) these indi-
cators to assess banks’ soundness. However, there is no clear agreement in the literature
on how exactly to combine the various CAMEL indicators. For this reason, we follow
Klomp and de Haan (2012) and employ factor analysis on 14 CAMEL indicators for
about 400 banks in about 70 developing and emerging market countries for the period
2002 to 2008.7 Factor analysis is a statistical data reduction technique used to explain
variability among observed random variables in terms of fewer unobserved random var-
iables called factors.8 The observed variables are modeled as linear combinations of the
factors plus an error term. The eigenvalue for a given factor measures the variance in all
the variables that is accounted for by that particular factor. If a factor has a low eigen-
6 In addition, we also include a set of indicators related to market risk management. According to the IMF
(2000), banks are increasingly involved in diversified operations, all of which involve one or more as-
pects of market risk. 7 In comparison to Klomp and de Haan (2012) our set of indicators is limited to 14 indicators due to data
availability in developing countries and emerging markets. Table A1 in the Appendix lists the countries. 8 Cf. Lattin et al. (2003), Wansbeek and Meijer (2000) and Stock and Watson (2002).
10
value it may be ignored, as other factors are more important in explaining variance (an
appendix which is available on request provides a more detailed description of the use
of factor analysis).
The commercial banks included in our sample are chosen on the basis of data
availability: we only include banks for which Bankscope of Bureau van Dijk provides
more than 70 percent of the data on the risk indicators used.9 For some banks in our
sample, some indicators are not available for all years. Overall, we have about 20 per-
cent missing observations. In order not to lose valuable information, we applied the EM
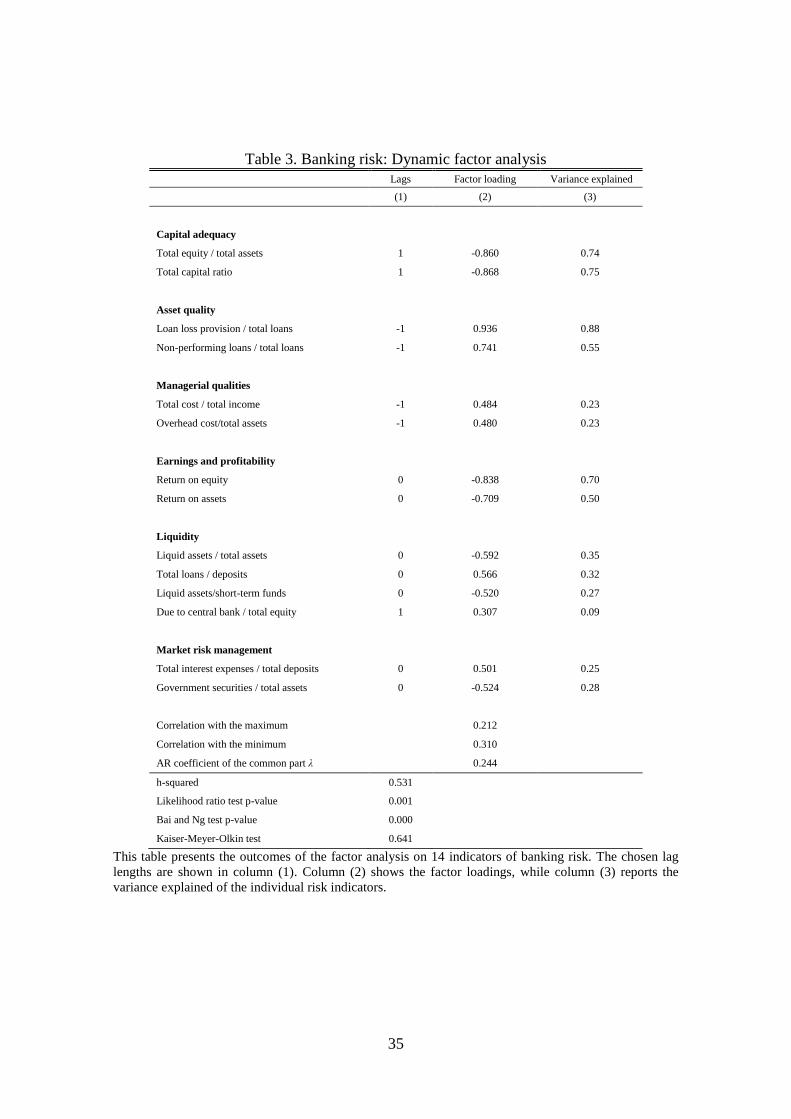
algorithm of Dempster et al. (1977) to compute missing observations. Table 3 shows the
indicators used, while Table A2 in the Appendix presents their correlations. The corre-
lations range between -0.6 and 0.7 illustrating that the indicators measure different
forms of banking risk.10
As pointed out by Klomp and de Haan (2009; 2012), one problem is that some
indicators of banking risk are of an ex ante nature (e.g., loan ratios) while others are ex
post variables (e.g., capital and equity ratios). Whereas ex ante variables indicate a pos-
sible future risk, ex post variables indicate the presence of a risk. As a solution, we have
estimated various factor models with changing lags and leads (with a maximum of two
years) and compare the models on the basis of different information criteria and the
likelihood ratio statistics. The various factor models are highly correlated with a correla-
tion coefficient ranging between 0.79 and 0.91.11
The chosen lag lengths are shown in
column (1) of Table 3.
[Insert Table 3 here]
9 There is a trade-off between including as many risk indicators and banks on the one hand and the avail-
ability of data on the other. We choose to use the 70 percent cut-off point as a reasonable compromise. If
we increased the cut-off point to 80 percent our dataset would be reduced by more than 40 percent. On
the other hand, increasing the number of observations by 10 percent would imply a cut-off point of 60
percent in which case about 40 percent of the data used in the analysis would be based on imputed data. 10 We also estimated our models presented in this paper using only the banks for which we have complete
data. The main results do not differ, but our dataset is reduced by more than 60 percent (results are avail-
able upon request). 11
The estimation results of the various models are available upon request. When we re-estimate the em-
pirical models shown in section 4 using different lag structures, the main conclusions do not change alt-
hough the coefficients of the regulation and supervision variable differ somewhat across models.
11
The next step is to decide on the number of factors to represent banking risk.
There is no ‘optimal’ criterion for deciding on the appropriate number of factors. Ac-
cording to the so-called Kaiser criterion, all factors with eigenvalues below one should
be dropped. Alternatively, the Cattell scree test, which is a graphical method in which
the eigenvalues are plotted on the vertical axis and the factors on the horizontal axis,
can be used. This test suggests selecting the number of factors that corresponds to the
point after which the remaining factors decline in approximately a linear fashion, and to
retain only the factors above the elbow. Finally, information criteria, such as the infor-
mation criterion proposed by Bai and Ng (2002), can be used.
According to the Kaiser rule, banking risk can be represented as a four-
dimensional construct. However, this is a so-called Heywood case where some solutions
of the unique variances of the indicators are smaller than zero.12
In general, a Heywood
case is an indication of a poorly specified model. If instead the elbow criterion is used,
banking risk can be represented as a one-dimensional construct. The Likelihood Ratio
test statistic of the one-factor model is highly significant at the five percent level. The
test rejects the null hypothesis that the estimate of a satured model is equal in favor of
the restricted one-factor model. This is confirmed by the Bai and Ng information test.
We therefore decided that the one-factor model is appropriate to represent banking risk.
Column (2) of Table 3 shows that capital and asset risk indicators have high fac-
tor loadings. This partly confirms the conclusion of the IMF (2000) study according to
which banking systems in OECD countries mainly exhibit liquidity risk, while in less
advanced countries asset quality risk is more pronounced. Column (3) of Table 3 reports
the variance explained of each banking risk indicator. About 50 percent of the variance
is explained by the one-factor model, while the remaining variance is unique, i.e., unex-
12
See Heywood (1931).
12
plained.13
That is, about half of the total banking risk is common for all banks included,
while the remaining part is bank-specific.14
The risk factor is not very persistent as shown by the low correlation of the me-
dian score with the maximum or minimum score of the factor (available on request).
This is confirmed by the autoregressive coefficient of the common part, which is signif-
icant but lower than 0.5.
Figure 1 presents a comparative analysis of banking risk in developing and
emerging countries.15
We find that in both country samples banking risk is accumulat-
ing over time. On average, our banking risk indicator is about 1.5 times higher for de-
veloping countries than for emerging countries. However, there are large differences
between individual banks as illustrated by the standard deviation of the two samples
(3.45 for developing countries and 2.92 for emerging countries).
[Insert Figure 1 here]
4. Data and methodology
4.1 Empirical model16
In this section we develop the model to estimate the relationship between bank regula-
tion and supervision and banking risk. There may be an endogeneity problem, which we
address by using use system-GMM and instrumental variables.
We estimate a dynamic model based on an unbalanced panel including about
400 banks from 70 developing and emerging countries between 2002 and 2008:
13
As a robustness check, we re-estimated the factor analysis differentiating between banks for which we
have data for the full sample period and banks that disappear over time due to a failure, a merger or ac-
quisition. We find that the factor loadings on the risk indicators are somewhat higher in the latter sample,
but our general findings are not sensitive to this (results available on request). 14
Compared to Klomp and de Haan (2012) our one-factor model explains less of the total variance. One
reason is that common risk is lower in developing and emerging market economies due to, for instance,
lower connectivity. However, idiosyncratic risk may be higher due to, for example, inefficient risk man-
agement of individual banks. In addition, banks in developing and emerging countries are more heteroge-
neous, which reduces the common factor. 15
See Table A1 in the Appendix for the classification of the countries in our sample. 16
This section draws on Klomp and de Haan (2012).
13
1 1
m m
ijt ij i ijt l k kijt l qi qit l ijt
j j
risk risk X regulation
(1)
where riskijt is the risk indicator based on the factor scores for bank i in country j at time
t. We include the lagged dependent variable to control for autoregressive tendencies.
Xkijt-1 is a vector of (lagged) control variables containing k elements (discussed in sec-
tion 4.2), while regulation is a vector containing q dimensions of (lagged) bank regula-
tion and supervision outlined above. Our hypothesis is that banking risk decreases due
to stricter bank regulation and supervision (γq < 0). The parameter αij is a bank-specific
intercept. The final term is the error term, whereas l indicates the number of lags.
Equation (1) poses a dynamic error-components model. Substantial complica-
tions may arise if this model is estimated by OLS. In both the fixed and random effects
settings, the lagged dependent variable is correlated with the error term, even if the dis-
turbances are not autocorrelated. Arellano and Bond (1991) develop a generalized
method of moments (GMM) estimator that solves the problems using the first difference
of the equation.
1
1 1
( )m m
ijt i ijt l k kijt l qi qit l ijt ijt
j j
risk risk X regulation
(2)
Estimation of (2) requires an instrumental variable procedure to correct for the endoge-
neity as well as the correlation between the lagged difference of the dependent variable
and εit-1. We can use the second and higher-order lags of the endogenous and dependent
variable and the first difference of the exogenous variables as instruments in the estima-
tion of (2) if εit is serially uncorrelated.
This approach, however, has drawbacks. First, differencing the equation re-
moves the long-run cross-country information present in the levels of the variables. Se-
cond, if the independent variables display persistence over time, their lagged levels will
14
be poor instruments for their differences. Under additional assumptions, it is possible to
construct an alternative GMM estimator that overcomes these problems. Specifically,
more moment conditions are available if we assume that the explanatory variables are
uncorrelated with the individual effects (see Arellano and Bover, 1995). In this case,
lagged differences of these variables and of the dependent variable may also be valid
instruments for the levels equation. The estimation then combines the set of moment
conditions available for the first-differenced equations with the additional moment con-
ditions implied for the levels equation. Blundell and Bond (1998) show that this system
GMM estimator is preferable to that of Arellano and Bond (1991) when the independent
variables are persistent, like our proxies for bank regulation and supervision. Finally, as
long as the model is over-identified, validity of the assumptions underlying both the
difference and the system estimators can be tested through Sargan tests of orthogonality
between the instruments and the residuals and through tests of second- or higher order
residual autocorrelation.
To assess the robustness and validity of the system-GMM estimation results we
also use an instrumental variable technique suggested by Newey (1987), including a
number of instrumental variables. Barth et al. (2004a) argue that cross-country differ-
ences in bank regulation and supervision reflect national differences in legal and politi-
cal systems (see also Demirgüç-Kunt and Detragiache, 2011). We therefore use the fol-
lowing instruments: First the length of time a country has been independent. Second, its
legal tradition based on whether the country has a British, French German, or Scandina-
vian legal origin (cf. La Porta et al., 1998; Beck et al., 2003). La Porta et al. (1998) ar-
gue that civil law and socialist law countries tend to support stronger governments to a
greater degree than common law countries. Thus, legal origin may also influence a
country’s approach to bank regulation and supervision. Third, we include the shares of
Catholics, Protestants and Muslims in each country. Stulz and Williamson (2003) argue
that Protestant countries have stronger creditor right protection and stricter regulation,
while Landes (1998) points out that Catholic and Muslim religions tend to generate hi-
erarchical bonds of authority that shape the structure of government institutions. Fourth,
as discussed in Beck et al. (2003) and Easterly and Levine (2003), countries in tropical
15
climates tend to have exploitative political regimes that gear governmental institutions
toward protecting a small elite. Thus, endowments may influence the type of institutions
in place, including bank regulatory and supervisory institutions. To take this latter issue
into account, we use distance from the equator as an instrument. Finally, we include
ethnic fractionalization, since Easterly and Levine (1997) show that ethnic diversity
tends to reduce the provision of public goods, including supervisory institutions.
The idea behind these instruments is that these historical country characteristics
affect a country’s institutions and thus have a bearing on bank regulation and supervi-
sion. Clearly, these variables do not directly impact risk-taking by banks. This is also
reflected in the correlation between these variables and our measures of banking risk,
which is about zero.
4.2 Control variables
We include control variables suggested by previous studies on banking risk (cf.
Demirgüç-Kunt and Detragiache, 1998; Kaminsky and Reinhart, 1999; Klomp and de
Haan, 2012; Delis and Staikouras, 2011). First, we control for macroeconomic factors:
inflation, economic growth, depreciation of the exchange rate, external debt, current
account balance, and shocks to the terms of trade (see also Beck et al., 2006). Adverse
macroeconomic shocks affecting the economy will increase the instability of the finan-
cial system, for example, by affecting the solvency of borrowers, by increasing uncer-
tainty, or by unexpected and excessive exposure to foreign exchange risk. In addition,
we include GDP per capita to control for differences in economic development. Fur-
thermore, we include two dummy variables taking the value one in case of a debt crisis
or currency crisis in a particular country-year as banking risk arguably increases during
financial crises (source: Laeven and Valencia, 2008).
According to Demirgüç-Kunt and Detragiache (1998), high real short-term in-
terest rates affect bank balance sheets adversely if banks cannot increase their lending
rates quickly enough and hence increase banking risk. In addition, large capital inflows
and capital flight may affect the stability of the financial sector. We therefore control for
16
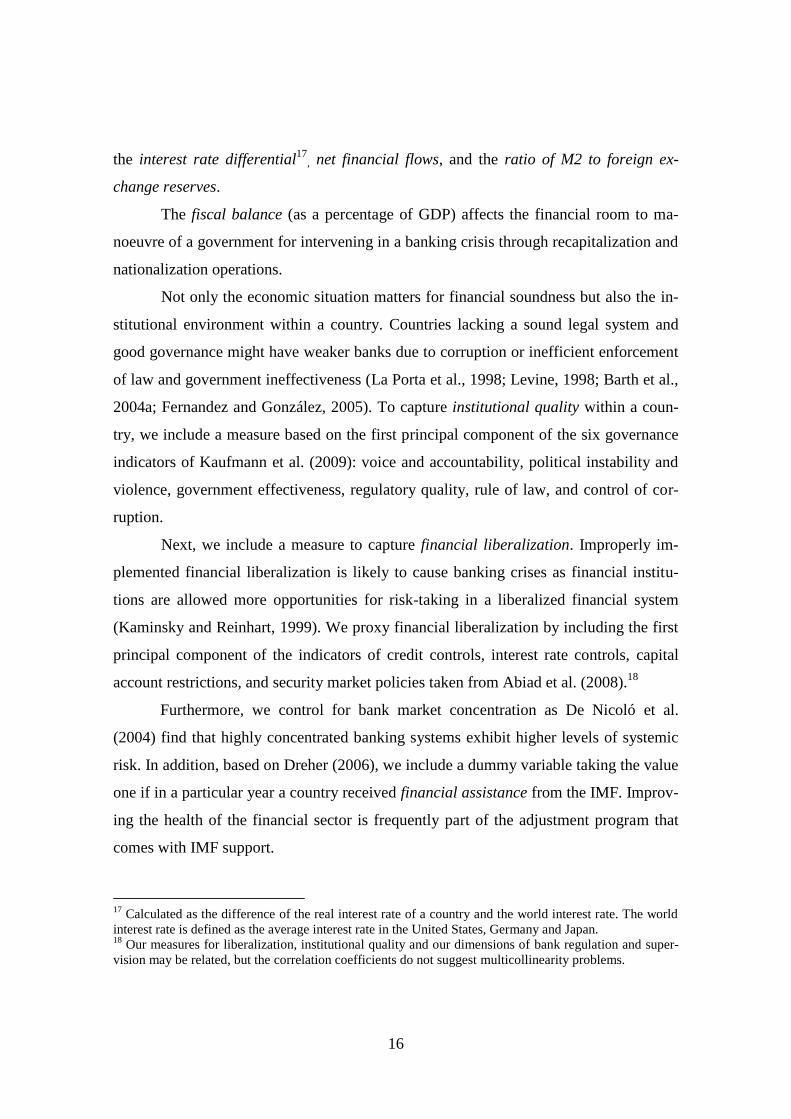
the interest rate differential17
, net financial flows, and the ratio of M2 to foreign ex-
change reserves.
The fiscal balance (as a percentage of GDP) affects the financial room to ma-
noeuvre of a government for intervening in a banking crisis through recapitalization and
nationalization operations.
Not only the economic situation matters for financial soundness but also the in-
stitutional environment within a country. Countries lacking a sound legal system and
good governance might have weaker banks due to corruption or inefficient enforcement
of law and government ineffectiveness (La Porta et al., 1998; Levine, 1998; Barth et al.,
2004a; Fernandez and González, 2005). To capture institutional quality within a coun-
try, we include a measure based on the first principal component of the six governance
indicators of Kaufmann et al. (2009): voice and accountability, political instability and
violence, government effectiveness, regulatory quality, rule of law, and control of cor-
ruption.
Next, we include a measure to capture financial liberalization. Improperly im-
plemented financial liberalization is likely to cause banking crises as financial institu-
tions are allowed more opportunities for risk-taking in a liberalized financial system
(Kaminsky and Reinhart, 1999). We proxy financial liberalization by including the first
principal component of the indicators of credit controls, interest rate controls, capital
account restrictions, and security market policies taken from Abiad et al. (2008).18
Furthermore, we control for bank market concentration as De Nicoló et al.
(2004) find that highly concentrated banking systems exhibit higher levels of systemic
risk. In addition, based on Dreher (2006), we include a dummy variable taking the value
one if in a particular year a country received financial assistance from the IMF. Improv-
ing the health of the financial sector is frequently part of the adjustment program that
comes with IMF support.
17
Calculated as the difference of the real interest rate of a country and the world interest rate. The world
interest rate is defined as the average interest rate in the United States, Germany and Japan. 18
Our measures for liberalization, institutional quality and our dimensions of bank regulation and super-
vision may be related, but the correlation coefficients do not suggest multicollinearity problems.
17
Moreover, we include a number of bank-level control variables. First, Shezhad
et al. (2010) find that ownership concentration significantly affects loan quality and
bank capitalization. We therefore include a dummy variable taking the value one if a
bank has a shareholder who owns more than 25 percent of the bank concerned. We also
include dummies reflecting government or foreign ownership. Moreover, we use the
natural logarithm of real total assets to control for the size of a bank. Next, we add the
number of subsidiaries as a proxy for diversification and business franchise power. Fi-
nally, we include two dummy variables to capture whether a bank failed or merged in a
specific year. Table A3 in the appendix provides an overview of all variables, their def-
initions as well as their sources.
5. Empirical results
This section presents the estimation results for the effect of bank regulation and supervi-
sion on banking risk, starting with the outcomes of the system-GMM estimator. The
optimal number of lags for each variable is selected using the Schwarz Bayesian Infor-
mation Criterion (SBC).
Unlike most previous studies, we consider a very long list of potential control
variables. All these variables make sense from a theoretical perspective. However, due
to data availability, using all control variables in one specification would reduce our
dataset dramatically. To overcome this problem we apply the general-to-specific meth-
od to decide which of these variables should be included in the base model (see Hendry,
1993). We first estimate a model including all control variables as outlined in the previ-
ous section, but without including our proxies for bank regulation and supervision.
Next, we drop the least significant variable and estimate the model again. We repeat this
procedure until only variables that are significant at the 10 percent level remain. In view
of the unequal distribution of the number of banks within a country (see Table A1), we
cluster the standard errors at the bank level to obtain consistent standard errors. For ex-
ample, our sample contains 25 banks from Russia, while it only contains 1 bank from
Gabon or Cameroon. We use bootstrapping with 1,000 replications to obtain consistent
standard errors.
18
The consistency of the GMM estimator depends on the validity of the instru-
ments. To address this issue we consider two specification tests. The first is a Sargan
test of over-identifying restrictions, which tests the overall validity of the instruments by
analyzing the sample analog of the moment conditions used in the estimation process.
The second test examines the hypothesis that the error term εit is not serially correlated.
The Sargan test provides no evidence of misspecification, while the serial correlation
tests point to first- but no second-order autocorrelation of the residuals, which is in ac-
cordance with the assumptions underlying the selection of instruments.
The general-to-specific procedure (excluding our measures of bank regulation
and supervision) yields a number of significant variables that we select for our Xkij vec-
tor. Our sample is reduced to a total of 371 banks in about 50 countries due to data
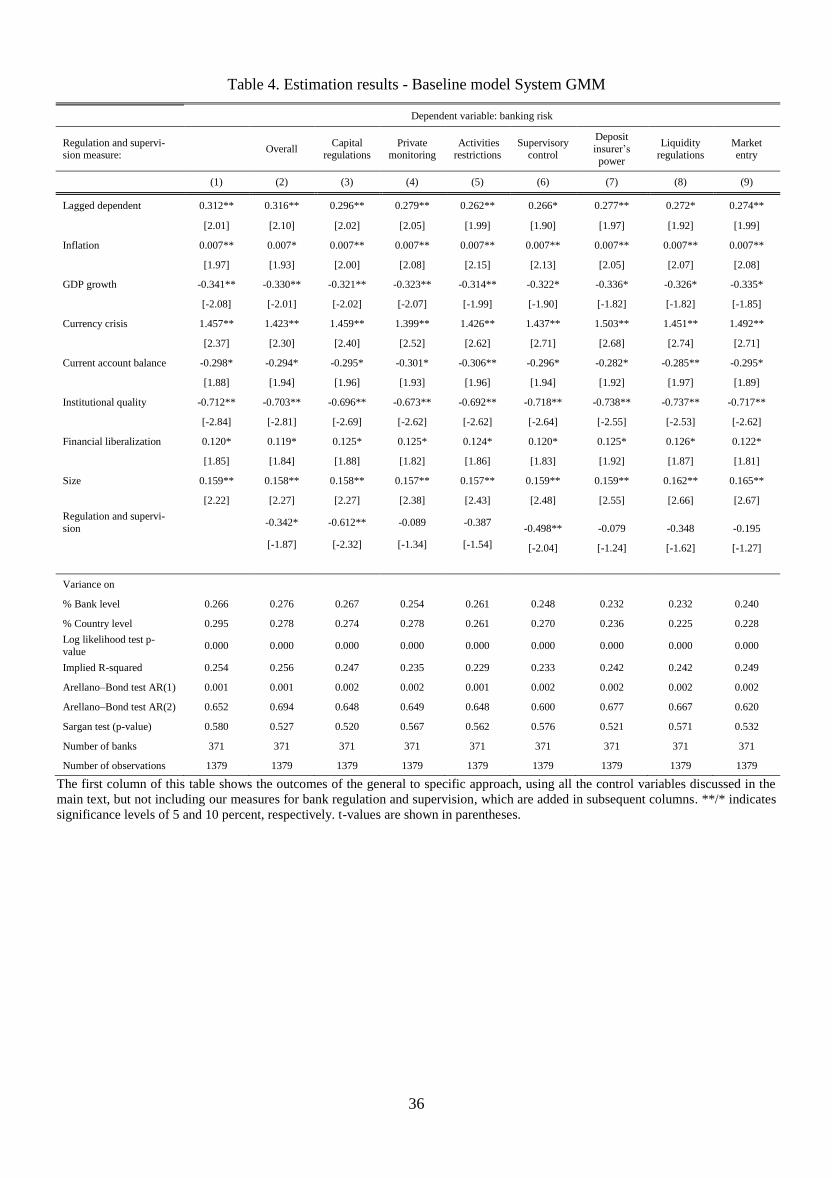
availability of the control variables. Column (1) in Table 4 reports the estimated mar-
ginal effects evaluated at the mean of the determinants of banking risk. The coefficients
of the control variables have the expected sign in the baseline regression. The results
suggest that economic growth decreases banking risk, while inflation has a significant
positive impact on the riskiness of banks. Moreover, a currency crisis and a current ac-
count deficit increase banking risk, although the coefficients of these variables are only
significant at the ten percent level. Furthermore, we find that countries with better insti-
tutions have lower banking risk. This is in line with the results of Demirgüç-Kunt and
Detragiache (1998) and Fernandez and González (2005). These studies report that the
probability of a banking crisis is positively associated with weaker institutions, especial-
ly those related to the rule of law, the level of corruption and contract enforcement. We
also find that financial liberalization increases risk-taking of banks. Finally, our results
suggest that bigger banks are more risky.
[Insert Table 4 here]
19
Next, we add our proxies for bank regulation and supervision to the baseline model.19
Column (2) in Table 4 includes our aggregate measure of regulation and supervision,
which is the average of the (standardized) seven measures of bank regulation and super-
vision as described in section 3.1.20
The results show that stricter regulation and super-
vision significantly decreases banking risk. An increase of one percent of our aggregate
measure of bank regulation and supervision decreases banking risk by 0.3 percent.
However, the effect of each of the seven dimensions of bank regulation and su-
pervision may be different. In columns (3) to (9) we therefore add these measures sub-
sequently to the baseline specification. We first add the measure on capital regulation.
The results suggest that this type of regulation significantly decreases banking risk. A
one percent increase in the level of capital regulation decreases banking risk by 0.6 per-
cent at the five percent significance level. This result is in line with the results reported
by Agoraki et al. (2011) and Barth et al. (2004a) who find a significant negative impact
of capital regulation on the share of non-performing loans and the onset of a banking
crisis. Likewise, Leaven and Levine (2009) conclude that stricter capital requirements
increase the distance-to-default, while Klomp and de Haan (2012) demonstrate that ad-
equate capital regulation is one of the most effective ways to restrain banking risk. In
contrast, Beck et al. (2006) and Delis and Staikouras (2011) do not find evidence that
capital regulations reduce the fragility of the banking system, measured by the occur-
rence of a banking crisis or the distance-to default.
Next, we include our proxy for regulations on private monitoring. The results
indicate that this type of regulation has no significant effect on banking risk. This result
is in line with the findings of Klomp and de Haan (2012), but Barth et al. (2004a; 2001)
and Agoraki et al. (2011) find that the share of non-performing loans decreases when
there is more private monitoring present. One explanation for our result is that asym-
metric information may be more pronounced in our sample of non-industrialized econ-
omies. This information problem makes private monitoring less effective.
19
If we take up the regulation and supervision variables directly into the general-to-specific approach, the
results (available on request) are very similar. 20
Using the first principal component of the seven indicators of bank regulation and supervision instead
of the average gives similar results (available on request).
20
Also regulations on restricting bank activities do not reduce banking risk. This
result confirms the view that restrictions on bank activities do not necessarily reduce
financial fragility (cf. Barth et al., 2004a; Agoraki et al., 2011). Beck et al. (2006) even
report that activity restrictions increase the likelihood of a banking crisis due to limiting
the opportunities to diversify risk. In contrast, Delis and Staikouras (2011) find that the
distance-to-default is reduced by regulation limiting bank activities. One potential ex-
planation for our result is that banks in emerging and developing countries may be less
involved in more complex banking activities.
Our results suggest that supervisory control significantly reduces banking risk. If
the level of supervisory control increases by one percent, banking risk decreases by 0.4
percent. In contrast, Barth et al. (2001) find a significant positive impact on financial
fragility of supervisory power using a panel including industrialized and transition
countries. However, when transition countries are excluded, Barth et al. (2001) do no
longer find a significant effect of supervisory power.
We do not find a significant effect of regulations on deposit insurance on the
level of banking risk. One explanation is that a deposit insurance system influences
bank soundness in two opposite ways (Demirgüç-Kunt and Detragiache, 2002). On the
one hand, bank runs are less likely to occur when deposits are insured. On the other
hand, a deposit insurance system provides banks incentives to engage in more risk-
taking.21
Apparently, the opposing effects of a deposit insurance scheme on banking
risk cancel out.
Finally, we do not find a significant effect of liquidity restrictions or market en-
try regulations on banking risk. The latter result contradicts the conclusion of Barth et
al. (2004a) who argue that a higher score on the ‘entry into bank requirements index‘
increases the likelihood of a banking crisis.
21
Anginer et al. (2013) examine the relation between deposit insurance and banking risk in the years
leading up to and during the recent financial crisis. They find that generous financial safety nets increase
banking risk in the years leading up to the global financial crisis, but during the crisis banking risk is
lower.
21
To sum up, we find that stricter regulation and supervision has a significant im-
pact on banking risk. In particular, we find that capital regulation and supervisory con-
trol have a negative effect on banking risk.
To assess the robustness and validity of the system-GMM results, we use an in-
strumental variable approach (using the specifications of Table 4). We first check the
validity of our instruments by the Sargan test under the null hypothesis that the used
group of instruments is valid, i.e., they are uncorrelated with the error term in the equa-
tion. We cannot reject the null hypothesis, indicating that our set of instruments is valid.
Next, we apply the Wald test of exogeneity under the null hypothesis that the instru-
mented variables are exogenous. The results suggest that our bank regulation and super-
vision measures are not endogenous. The results as shown in Table 5 are similar to the
GMM outcomes. Again, we find a significant effect of bank regulation and supervision
on banking risk, which is mainly driven by the impact of capital regulation and supervi-
sory control.
[Insert Table 5 here]
An important question to which we turn now is whether the impact of regulation
and supervision on banking risk depends on institutional quality. There is evidence that
institutional quality affect banking risk. For instance, Demirgüç-Kunt and Detragiache
(1998) report that financial fragility is positively associated with weaker institutions,
especially those related to the rule of law, the level of corruption and contract enforce-
ment. In contrast to previous studies, we examine whether institutional quality has a
direct as well as an indirect effect, i.e. we test whether the impact of regulation and su-
pervision is conditional on our proxy for institutional quality by including an interaction
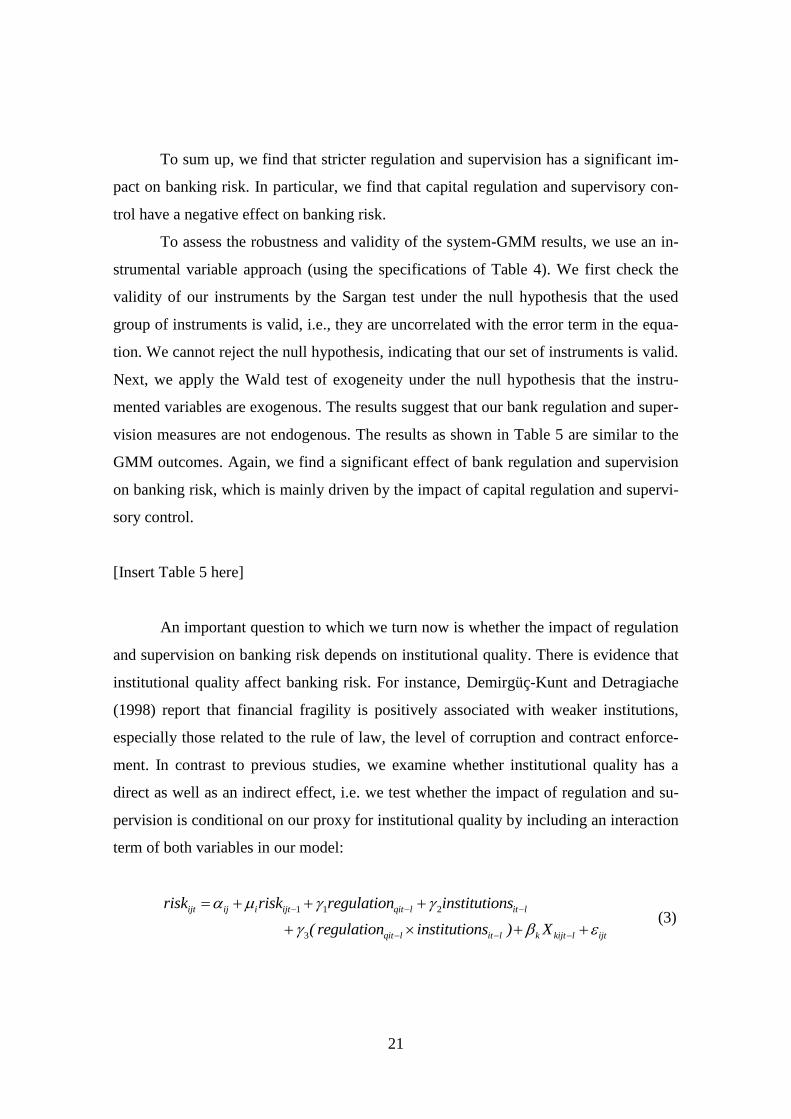
term of both variables in our model:
1 1 2
3
ijt ij i ijt qit l it l
qit l it l k kijt l ijt
risk risk regulation institutions
( regulation institutions ) X
(3)
22
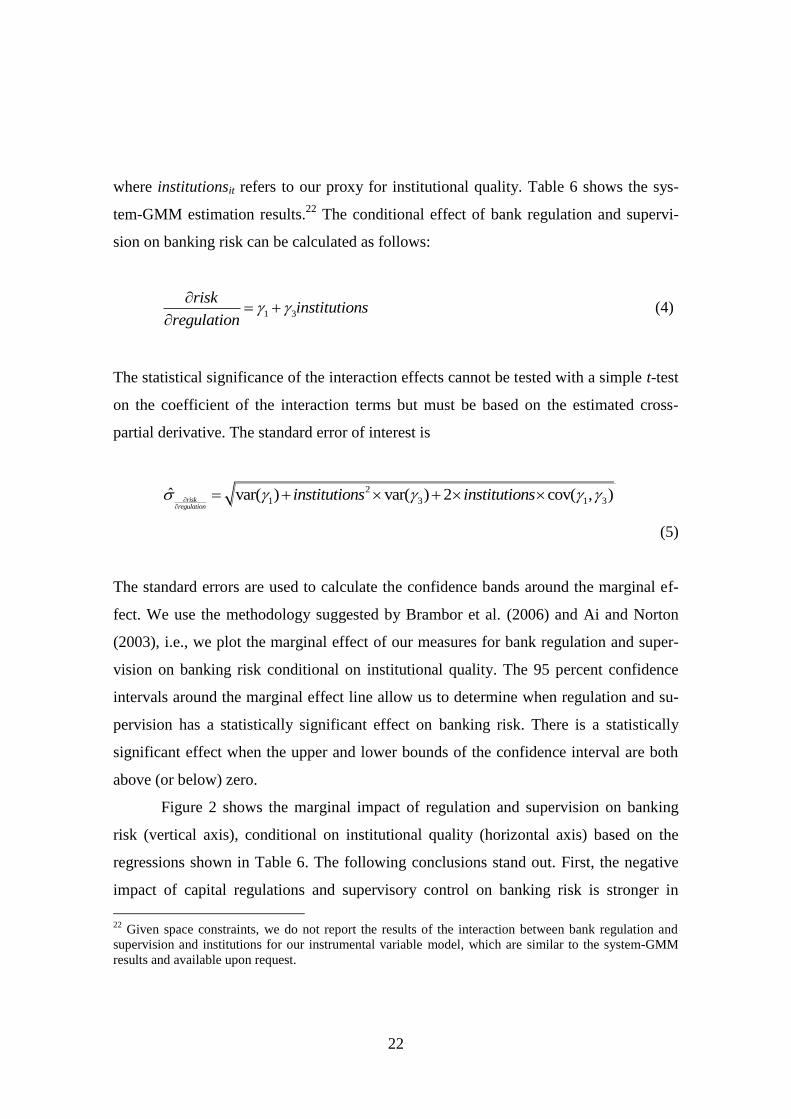
where institutionsit refers to our proxy for institutional quality. Table 6 shows the sys-
tem-GMM estimation results.22
The conditional effect of bank regulation and supervi-
sion on banking risk can be calculated as follows:
1 3
riskinstitutions
regulation
(4)
The statistical significance of the interaction effects cannot be tested with a simple t-test
on the coefficient of the interaction terms but must be based on the estimated cross-
partial derivative. The standard error of interest is
2
1 3 1 3ˆ var( ) var( ) 2 cov( , )risk
regulation
institutions institutions
(5)
The standard errors are used to calculate the confidence bands around the marginal ef-
fect. We use the methodology suggested by Brambor et al. (2006) and Ai and Norton
(2003), i.e., we plot the marginal effect of our measures for bank regulation and super-
vision on banking risk conditional on institutional quality. The 95 percent confidence
intervals around the marginal effect line allow us to determine when regulation and su-
pervision has a statistically significant effect on banking risk. There is a statistically
significant effect when the upper and lower bounds of the confidence interval are both
above (or below) zero.
Figure 2 shows the marginal impact of regulation and supervision on banking
risk (vertical axis), conditional on institutional quality (horizontal axis) based on the
regressions shown in Table 6. The following conclusions stand out. First, the negative
impact of capital regulations and supervisory control on banking risk is stronger in
22
Given space constraints, we do not report the results of the interaction between bank regulation and
supervision and institutions for our instrumental variable model, which are similar to the system-GMM
results and available upon request.
23
countries with strong institutions. Second, regulations on bank activities and liquidity
also reduce banking risk but only if our measure for institutional quality is above a
threshold of about 5 (which is the case for about sixty percent of the observations). Fi-
nally, the impact of the remaining measures of bank regulation and supervision (i.e.
deposit insurance power, private monitoring and market entry) does not depend on the
level of institutional quality.
[Insert Table 6 here]
[Insert Figure 2 here]
6. Bank structure
In this section we examine whether bank structure characteristics affect the impact of
bank regulation and supervision on banking risk. Our approach is to split the total sam-
ple into subsamples based on relevant bank system characteristics.
First, Klomp and de Haan (2012) argue that the impact of financial regulation
and supervision on banking risk is conditional on the level of banking risk. That is, the
impact of stricter regulation and supervision is larger for banks with a high level of risk
than for banks with a low level of risk. In columns (1) and (2) in Table 7 we therefore
divide the sample into two subsamples based on the median level of banking risk in the
period 2002 to 2008. The estimation results confirm the findings of Klomp and de Haan
(2012). The impact of regulation and supervision on banking risk is on average about
1.5 times higher for high-risk banks than for low-risk banks.
In addition, the effect of bank regulation and supervision on banking risk may
differ across various types of banks. For instance, Shezhad et al. (2010) and Laeven and
Levine (2009) argue that bank risk-taking behavior depends on the ownership structure
of a bank. We therefore split our sample as follows: listed vs. non-listed banks, banks
with public ownership vs. banks with private ownership, and banks with foreign vs.
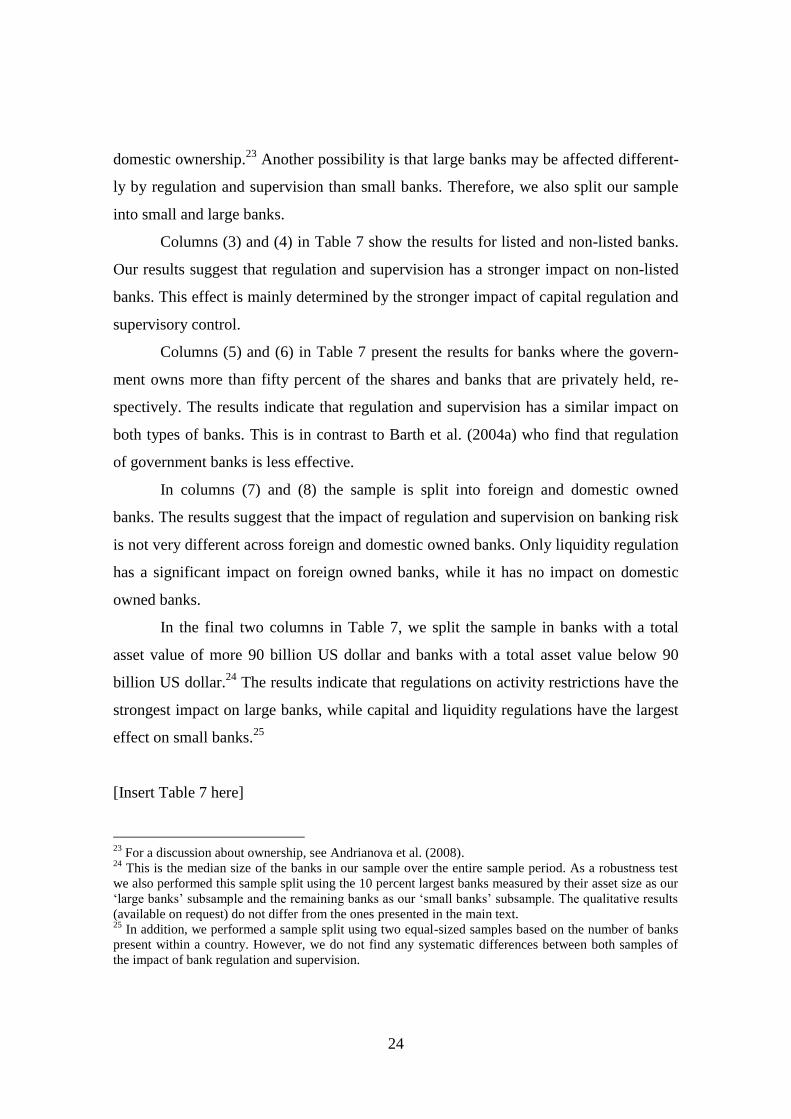
24
domestic ownership.23
Another possibility is that large banks may be affected different-
ly by regulation and supervision than small banks. Therefore, we also split our sample
into small and large banks.
Columns (3) and (4) in Table 7 show the results for listed and non-listed banks.
Our results suggest that regulation and supervision has a stronger impact on non-listed
banks. This effect is mainly determined by the stronger impact of capital regulation and
supervisory control.
Columns (5) and (6) in Table 7 present the results for banks where the govern-
ment owns more than fifty percent of the shares and banks that are privately held, re-
spectively. The results indicate that regulation and supervision has a similar impact on
both types of banks. This is in contrast to Barth et al. (2004a) who find that regulation
of government banks is less effective.
In columns (7) and (8) the sample is split into foreign and domestic owned
banks. The results suggest that the impact of regulation and supervision on banking risk
is not very different across foreign and domestic owned banks. Only liquidity regulation
has a significant impact on foreign owned banks, while it has no impact on domestic
owned banks.
In the final two columns in Table 7, we split the sample in banks with a total
asset value of more 90 billion US dollar and banks with a total asset value below 90
billion US dollar.24
The results indicate that regulations on activity restrictions have the
strongest impact on large banks, while capital and liquidity regulations have the largest
effect on small banks.25
[Insert Table 7 here]
23
For a discussion about ownership, see Andrianova et al. (2008). 24
This is the median size of the banks in our sample over the entire sample period. As a robustness test
we also performed this sample split using the 10 percent largest banks measured by their asset size as our
‘large banks’ subsample and the remaining banks as our ‘small banks’ subsample. The qualitative results
(available on request) do not differ from the ones presented in the main text. 25
In addition, we performed a sample split using two equal-sized samples based on the number of banks
present within a country. However, we do not find any systematic differences between both samples of
the impact of bank regulation and supervision.
25
7. Levels of development and liberalization
This section presents the outcomes of several sensitivity tests in which we divide our
sample according to level of development, geographical position, and level of financial
liberalization. We also use an alternative indicator of banking risk and finally discuss
the issue of reverse causality.
Even though we focus on emerging and developing countries, there is still quite
some variation in our sample in terms of the countries’ economic and institutional de-
velopment. To examine whether our results also hold for subsamples, we estimate the
system-GMM model for different groups of countries.26
First, we split our sample in
developing countries and emerging countries.27
The results show that, on average, regu-
lation and supervision have a stronger impact on banking risk in emerging countries.
Our proxies for liquidity regulation and activities regulation are significant in emerging
economies although only at the ten percent level. This confirms the conclusion of
Demirgüç-Kunt et al. (2008) and Barth et al. (2004a) that the impact of regulation and
supervision increases with the level of development.
The next three columns in Table 8 show the estimates for subsamples based on
geographical location of the bank: Asia, Africa and Latin America. The results indicate
that our measure for overall regulation and supervision is insignificant in Africa, while
it has a significant impact in Asia and Latin America. The results confirm our previous
finding that regulation is most effective in emerging economies, which are mostly locat-
ed in Asia and Latin America.
In columns (6) and (7) in Table 8 we split the sample on the basis of the median
level of financial liberalization. Arguably, the impact of regulation and supervision may
be stronger in more liberalized countries (Kaminsky and Reinhart, 1999). Our results
lend support to this hypothesis. In general, we find that the impact of supervision and
regulation is strongest in countries which are more liberalized.
26
The results using the instrument variable approach are similar to the system-GMM results (available
upon request). 27
We classify countries in accordance with the criteria suggested by the World Bank. A country as devel-
oping when it has an annual GDP per capita lower than $2.000 and as an emerging market country when
its GDP per capita ranges between $2.000 and $10.0000.
26
[Insert Table 8 here]
In the results reported so far we used our indicator of banking risk, which is de-
rived from factor analysis on several risk indicators. To assess whether our results de-
pend on this choice, we instead employ a commonly used indicator of risk, the so-called
Z-score, which is computed as follows:
2
ROA
EROA
Azscore
where ROA is the return on assets, E is the total equity, A are the total assets and 2
ROA is
the standard deviation of ROA over the last 5 years. The Z-score can be interpreted as
the number of standard deviations by which returns would have to fall from the mean to
wipe out all equity in the bank. Unfortunately, using this risk indicator causes a reduc-
tion of our dataset by more than 60 percent due to the calculation of the standard devia-
tion over the last 5 years.28
The correlation between our aggregate banking risk indica-
tor and the Z-score is about 0.54, so they are not perfect substitutes. Column (8) in Ta-
ble 8 shows the estimates using the Z-score as dependent variable. Following
Demirgüç-Kunt et al. (2008) we use the logarithm of 1 + Zscore to smooth out higher
values of the Z-score and avoid losing observations with a dependent variable of zero.
Again, the results suggest that capital regulation and supervisory control significantly
reduce banking risk. So our main results are not driven by the choice of our banking risk
variable.
Finally, we check whether our results are driven by reverse causality. Arguably,
after a period of financial instability governments implement stricter regulation and su-
pervision. This implies that our banking risk indicators are a potential determinant of
28
We also used a 3-year standard deviation but this gives similar results.
27
our bank regulation and supervision variables. The most straightforward way to test for
this is to estimate models for our regulation and supervision variables and test for the
impact of our banking risk proxies. We estimated the following dynamic models:
1 1qit it p pit i it itregulation X risk (6)
Where regulationqit is a measure for bank regulation and supervision of type q in coun-
try i at time t, while riskit is our measure of banking risk in country i at time t. We calcu-
late riskit by using the country average of our banking risk measure riskijt. We weighted
the risk within a country by the total asset size of an individual bank. The vector of con-
trol variables Xpit includes the lagged dependent variable, inflation, depreciation, current
account balance, institutional quality, financial liberalization and the number of bank
failures and the number of bank mergers. The results as reported in Table 9 indicate that
our banking risk variable is not a significant determinant of our measures of bank regu-
lation and supervision, suggesting that our results are not driven by reverse causality.
[Insert Table 9 here]
8. Conclusions
The aim of this paper is to examine the relationship between regulation and supervision
and banking risk in developing and emerging market economies. We examine whether
the impact of bank regulation and supervision on banking risk is conditioned by institu-
tional quality. In addition, we analyze whether the impact of bank regulation and super-
vision is affected by bank characteristics and by the countries’ levels of economic de-
velopment and financial liberalization.
We use the data provided by Barth et al. (2004a,b; 2008) to construct seven
measures of bank regulation and supervision. In addition, we use factor analysis on
Bankscope data for more than 400 banks in about 70 countries in the 2002-2008 period
28
to construct measures of banking risk. The factor analysis suggests that one factor cap-
tures most of the variance of the various indicators of banking risk.
Our findings suggest that bank regulation and supervision reduce banking risk.
In particular, we find that stricter capital regulation and supervisory control decrease
banking risk. Liquidity regulation and activities restrictions also restrain banking risk
but only in case of a high level of institutional quality.
In addition, we find that the impact of most regulation and supervision measures
on banking risk depend on the level of development of a country and on the structure of
a bank. In emerging economies, bank regulation and supervision has a stronger effect on
banking risk than in developing countries. The impact of regulation and supervision on
banking risk is bigger for high-risk banks than for low-risk banks. Our results also sug-
gest that regulation and supervision have a stronger impact on non-listed than on non-
listed banks. In addition, we find that regulations on activity restrictions have the
strongest impact on large banks, while capital and liquidity regulations have the largest
effect on small banks.
29
References
Abiad, A., Detragiache, E., Tressel, T., 2008. A new database of financial reforms. IMF
Working Paper 08/266.
A ca, S., De Nicolò, G., Detragiache, E. 2013. Banking sector reforms and corporate
leverage in emerging markets. Emerging Markets Review 17, 125–149.
Agoraki, M., Delis, M., and Pasiouras, F., 2011. Regulations, competition and bank
risk-taking in transition countries. Journal of Financial Stability 7, 38-48.
Anginer, D., Demirguc-Kunt, A., Zhu, M., 2013. How does deposit insurance affect
bank risk? Evidence from the recent crisis. Journal of Banking & Finance forth-
coming, doi: http://dx.doi.org/10.1016/ j.jbankfin.2013.09.013.
Ai, C., Norton, E., 2003. Interaction terms in logit and probit models. Economic Letters
80, 123–129.
Andrianova, S., Demetriades, P., Shortland, A., 2008. Government ownership of banks,
institutions, and financial development. Journal of Development Economics 85,
218-252.
Arellano, M., Bond, S., 1991. Some tests of specification for panel data: Monte Carlo
evidence and an application to employment equations. Review of Economic Stud-
ies 58, 277–297.
Arellano, M., Bover, O., 1995. Another look at the instrumental variable estimation of
error-components models. Journal of Econometrics 68, 29–51.
Bai, J., Ng, S., 2002. Determining the number of factors in approximate factor models.
Econometrica 70, 191–221.
Bankscope, 2009. Bureau van Dijk. Amsterdam.
Barth, J.R., Caprio, G., Levine, R., 2004a. Bank regulation and supervision: what works
best? Journal of Financial intermediation 13, 205-248.
Barth, J.R., Nolle, D., Phumiwasana, T., and Yago, G., 2004b. A cross-country analysis
of the bank supervisory framework and bank performance. Financial Markets, In-
stitutions and Instruments 12, 67-120.
30
Barth, J.R., Caprio, G., Levine, R., 2008. Bank regulations are changing: for better or
worse? World Bank Policy Research Working Paper 4646.
Barth, J.R., Lin, C., Ma, Y, Seade, J., Song, F.M., 2013. Do bank regulation, supervi-
sion and monitoring enhance or impede bank efficiency? Journal of Banking &
Finance 37, 2879–2892.
Beck, T., Demirgüç-Kunt, A., Levine, R., 2003. Law, endowments, and finance. Journal
of Financial Economics 70, 137–181.
Beck, T., Demirgüç-Kunt, A., Levine, R., 2006. Bank concentration, competition, and
crises: First results. Journal of Banking and Finance 30, 1581-1603.
Ben Naceur, S., Omran, M., 2011. The effects of bank regulations, competition, and
financial reforms on banks’ performance. Emerging Markets Review 12, 1–20.
Blundell, R., Bond, S., 1998. Initial conditions and moment restrictions in dynamic pan-
el models. Journal of Econometrics 87, 115–143.
Brambor, T., Clark, W., Golder, M., 2006. Understanding interaction models: improv-
ing empirical analysis. Political Analysis 14, 63–82.
Bumann, S., Lensink, R., Hermes, N., 2013. Financial liberalization and economic
growth: a meta analysis. Journal of International Money and Finance 33, 255-281.
Claessens, S., Yurtoglu, B.B., 2013. Corporate governance in emerging markets: A sur-
vey. Emerging Markets Review 15, 1–33.
Das, U.S., Iossifov, P., Podpiera, R., Rozkhov, D., 2005. Quality of financial policies
and financial system stress. IMF Working Paper 05/173.
Delis, M., 2012. Bank competition, financial reform, and institutions: The importance of
being developed. Journal of Development Economics 97, 450-465.
Delis, M., Staikouras, P., 2011. Supervisory effectiveness and bank risk. Review of Fi-
nance 15, 511-543.
Demirgüç-Kunt, A., Detragiache, E., 1998. The determinants of banking crises in de-
veloping and developed countries. IMF Staff Papers 45, 81-109.
Demirgüç-Kunt, A., Detragiache, E., 2002. Does deposit insurance increase banking
system stability? An empirical investigation. Journal of Monetary Economics 49,
1373–1406.
31
Demirgüç-Kunt, A., Detragiache, E., 2011. Basel Core Principles and bank soundness:
Does compliance matter? Journal of Financial Stability 7, 179-190.
Demirgüç-Kunt, A. Detragiache, E., Tressel, T., 2008. Banking on the principles: Com-
pliance with Basel Core Principles and bank soundness. Journal of Financial In-
termediation 17, 511-542.
Dempster, A, Laird, N., Rubin, D., 1977. Maximum likelihood from incomplete data via
the EM algorithm. Journal of the Royal Statistical Society: Series B 39, 1-38.
De Nicoló, G., Bartholomew, P., Zaman, J., Zephirin, M., 2004. Bank consolidation,
internationalization, and conglomeration: Trends and implications for financial
risk. Financial Markets, Institutions, and Instruments 13, 173–217.
Dreher, A., 2006. IMF and economic growth: The effects of programs, loans, and com-
pliance with conditionality. World Development 34, 769-788.
Easterly, W., Levine, R., 1997. Africa's growth tragedy: Policies and ethnic divisions.
Quarterly Journal of Economics, 112, 1203-50.
Easterly, W., Levine, R., 2003. Tropics, germs, and crops: How endowments influence
economic development. Journal Monetary Economics 50, 3–39.
Fernandez, A., González, F., 2005. How accounting and auditing systems can counter-
act risk-shifting of safety nets in banking: Some international evidence. Journal of
Financial Stability 1, 466–500.
Fonseca, A.R., González, F., 2010. How bank capital buffers vary across countries: The
influence of cost of deposits, market power and bank regulation. Journal of Bank-
ing and Finance 34, 892–902.
González, F., 2005. Bank regulation and risk-taking incentives: An international com-
parison of banking risk. Journal of Banking and Finance 29, 1153-1184.
Gaganis, C., Pasiouras, F., Zopounidis, C. 2006. A multicriteria decision framework for
measuring banks’ soundness around the world. Journal of Multi-Criteria Decision
Analysis 14, 103-111.
Hendry, D.F., 1993. Econometrics, alchemy or science? Essays in econometric method-
ology. Blackwell Publishers, Oxford, UK.
32
Heywood, H. 1931. On finite sequences of real numbers. Proceedings of the Royal So-
ciety of London, Containing Papers of a Mathematical and Physical Character Se-
ries A 134, 486–501.
International Country Risk Guide, 2008. International Country Risk Guide, PRS Group,
New York.
IMF, 2000. Macroprudential indicators of financial system soundness. IMF Occasional
Paper 192.
Kaminsky, G., Reinhart, C., 1999. The twin crises: The causes of banking and balance-
of-payment problems. American Economic Review 89, 473-500.
Kaufmann, D., Kraay, A., Mastruzzi, M., 2009. Governance matters III: The world gov-
ernance indicators for 1996–2009. www.govindicators.org.
King, R., Levine, R., 1993. Finance and growth: Schumpeter might be right. Quarterly
Journal of Economics 108, 717-737.
Klomp, J., de Haan, J. 2009. Central bank independence and financial stability. Journal
of Financial Stability 5, 321-338.
Klomp, J., de Haan, J., 2012. Banking risk and regulation: Does one size fit all? Journal
of Banking and Finance 36, 3197–3212.
Laeven, L., Levine, R., 2009. Bank governance, regulation and risk taking. Journal of
Financial Economics 93, 259-275.
Laeven, L., Valencia, F. (2008). Systemic banking crises: A new database. IMF Work-
ing Paper 224.
Landes, D., 1998. The wealth and poverty of nations. Norton, New York.
La Porta, R., López-de-Silanes, F., Shleifer, A.,Vishny, R., 1998. Law and finance.
Journal of Political Economy 106, 1113–1155.
Lattin, J., Carroll, D., Green P., 2003. Analyzing multivariate data. Duxbury Press. Pa-
cific Grove, CA.
Levine, R., 1998. The legal environment, banks and long-run economic growth. Journal
of Money, Credit and Banking 30, 596–613.
Levine, R., Loayza, N., Beck, T., 2000. Financial intermediation and growth: Causality
and causes. Journal of Monetary Economics 46, 31-77.
33
Newey, W.K., 1987. Efficient estimation of limited dependent variable models with
endogenous explanatory variables. Journal of Econometrics 36, 231-250.
Pasiouras, F., Gaganis, C., Zopounidis, C., 2006. The impact of bank regulations, su-
pervision, market structure, and bank characteristics on individual bank ratings: A
cross-country analysis. Review of Quantitative Finance and Accounting 27, 403-
438.
Pesenti, P., Tille, C., 2000. The economics of currency crisis and contagion: An intro-
duction. Federal Reserve Bank of New York. Economic Policy Review. Septem-
ber, 3-16.
Podpiera, R., 2004. Does compliance with Basel Core Principles bring any measurable
benefits? IMF Working Paper 04/204.
Rajan, R., Zingales, L., 1998. Financial dependence and growth. American Economic
Review 88, 559-586.
Shehzad, C.T., de Haan, J., Scholtens, L.J.R., 2010. The impact of bank ownership con-
centration on impaired loans and capital adequacy. Journal of Banking and Fi-
nance 34, 399-408.
Stock, J., Watson, M., 2002. Forecasting using principal components from a large num-
ber of predictors. Journal of the American Statistical Association 97, 1167-1179.
Stulz, R., Williamson, R., 2003. Culture, openness, and finance. Journal of Financial
Economics 70, 313–349.
Sundararajan, V., Marston, D., Basu, R., 2001. Financial system standards and financial
stability—The case of Basel Core Principles. IMF Working paper 01/62.
Wansbeek, T.J., Meijer, E., 2000. Measurement error and latent variables in economet-
rics. North Holland, Amsterdam.
Zhao, H., Sinha, A., Ge, W., 2009. Effects of feature construction on classification per-
formance: An empirical study in bank failure prediction. Expert Systems with
Applications 36, 2633-2644.
World Bank, 2010. World Bank Development Indicators 2010, CD-Rom.
34
Table 1. Correlation matrix: bank regulation and supervision variables
(1) (2) (3) (4) (5) (6) (7)
Capital regulations (1) 1.00 -0.11 -0.04 -0.05 -0.09 -0.11 0.01
Regulations on private monitoring (2) 1.00 0.17 0.09 0.11 0.20 0.23
Regulations on activity restrictions (3) 1.00 0.24 0.08 0.39 0.12
Supervisory control (4) 1.00 -0.09 -0.13 0.16
Deposit insurer’s power (5) 1.00 -0.05 -0.04
Liquidity regulations (6) 1.00 0.13
Market entry regulations (7) 1.00
The table shows the correlation of the seven measures of bank regulation and supervision used in the
analysis.
Table 2. Changes in bank regulation and supervision
Change in indicator:
Capital
regulations
Regulations
on private monitoring
Regulations
on activity restrictions
Supervisory control
Deposit
insurer's power
Liquidity regulations
Market entry regulations
ΔI < |10|% 79.19 73.76 80.80 70.46 75.54 73.16 75.18
|10|% < ΔI < |15|% 9.89 9.31 10.62 11.77 9.22 11.61 9.65
|15|% < ΔI < |20|% 2.04 1.72 1.98 5.97 1.75 1.91 3.26
|20|% < ΔI 8.87 15.21 6.61 11.80 13.49 13.32 11.92
The table shows the share of countries in the individual categories. The categories are based on the x%
absolute change between the maximum and minimum score of a country for the various measures of bank
regulation and supervision.
35
Table 3. Banking risk: Dynamic factor analysis
Lags Factor loading Variance explained
(1) (2) (3)
Capital adequacy
Total equity / total assets 1 -0.860 0.74
Total capital ratio 1 -0.868 0.75
Asset quality
Loan loss provision / total loans -1 0.936 0.88
Non-performing loans / total loans -1 0.741 0.55
Managerial qualities
Total cost / total income -1 0.484 0.23
Overhead cost/total assets -1 0.480 0.23
Earnings and profitability
Return on equity 0 -0.838 0.70
Return on assets 0 -0.709 0.50
Liquidity
Liquid assets / total assets 0 -0.592 0.35
Total loans / deposits 0 0.566 0.32
Liquid assets/short-term funds 0 -0.520 0.27
Due to central bank / total equity 1 0.307 0.09
Market risk management
Total interest expenses / total deposits 0 0.501 0.25
Government securities / total assets 0 -0.524 0.28
Correlation with the maximum 0.212
Correlation with the minimum 0.310
AR coefficient of the common part λ 0.244
h-squared 0.531
Likelihood ratio test p-value 0.001
Bai and Ng test p-value 0.000
Kaiser-Meyer-Olkin test 0.641
This table presents the outcomes of the factor analysis on 14 indicators of banking risk. The chosen lag
lengths are shown in column (1). Column (2) shows the factor loadings, while column (3) reports the
variance explained of the individual risk indicators.
36
Table 4. Estimation results - Baseline model System GMM
Dependent variable: banking risk
Regulation and supervi-sion measure:
Overall Capital
regulations Private
monitoring Activities restrictions
Supervisory control
Deposit
insurer’s
power
Liquidity regulations
Market entry
(1) (2) (3) (4) (5) (6) (7) (8) (9)
Lagged dependent 0.312** 0.316** 0.296** 0.279** 0.262** 0.266* 0.277** 0.272* 0.274**
[2.01] [2.10] [2.02] [2.05] [1.99] [1.90] [1.97] [1.92] [1.99]
Inflation 0.007** 0.007* 0.007** 0.007** 0.007** 0.007** 0.007** 0.007** 0.007**
[1.97] [1.93] [2.00] [2.08] [2.15] [2.13] [2.05] [2.07] [2.08]
GDP growth -0.341** -0.330** -0.321** -0.323** -0.314** -0.322* -0.336* -0.326* -0.335*
[-2.08] [-2.01] [-2.02] [-2.07] [-1.99] [-1.90] [-1.82] [-1.82] [-1.85]
Currency crisis 1.457** 1.423** 1.459** 1.399** 1.426** 1.437** 1.503** 1.451** 1.492**
[2.37] [2.30] [2.40] [2.52] [2.62] [2.71] [2.68] [2.74] [2.71]
Current account balance -0.298* -0.294* -0.295* -0.301* -0.306** -0.296* -0.282* -0.285** -0.295*
[1.88] [1.94] [1.96] [1.93] [1.96] [1.94] [1.92] [1.97] [1.89]
Institutional quality -0.712** -0.703** -0.696** -0.673** -0.692** -0.718** -0.738** -0.737** -0.717**
[-2.84] [-2.81] [-2.69] [-2.62] [-2.62] [-2.64] [-2.55] [-2.53] [-2.62]
Financial liberalization 0.120* 0.119* 0.125* 0.125* 0.124* 0.120* 0.125* 0.126* 0.122*
[1.85] [1.84] [1.88] [1.82] [1.86] [1.83] [1.92] [1.87] [1.81]
Size 0.159** 0.158** 0.158** 0.157** 0.157** 0.159** 0.159** 0.162** 0.165**
[2.22] [2.27] [2.27] [2.38] [2.43] [2.48] [2.55] [2.66] [2.67]
Regulation and supervi-
sion -0.342* -0.612** -0.089 -0.387
-0.498** -0.079 -0.348 -0.195
[-1.87] [-2.32] [-1.34] [-1.54] [-2.04] [-1.24] [-1.62] [-1.27]
Variance on
% Bank level 0.266 0.276 0.267 0.254 0.261 0.248 0.232 0.232 0.240
% Country level 0.295 0.278 0.274 0.278 0.261 0.270 0.236 0.225 0.228
Log likelihood test p-
value 0.000 0.000 0.000 0.000 0.000 0.000 0.000 0.000 0.000
Implied R-squared 0.254 0.256 0.247 0.235 0.229 0.233 0.242 0.242 0.249
Arellano–Bond test AR(1) 0.001 0.001 0.002 0.002 0.001 0.002 0.002 0.002 0.002
Arellano–Bond test AR(2) 0.652 0.694 0.648 0.649 0.648 0.600 0.677 0.667 0.620
Sargan test (p-value) 0.580 0.527 0.520 0.567 0.562 0.576 0.521 0.571 0.532
Number of banks 371 371 371 371 371 371 371 371 371
Number of observations 1379 1379 1379 1379 1379 1379 1379 1379 1379
The first column of this table shows the outcomes of the general to specific approach, using all the control variables discussed in the
main text, but not including our measures for bank regulation and supervision, which are added in subsequent columns. **/* indicates
significance levels of 5 and 10 percent, respectively. t-values are shown in parentheses.
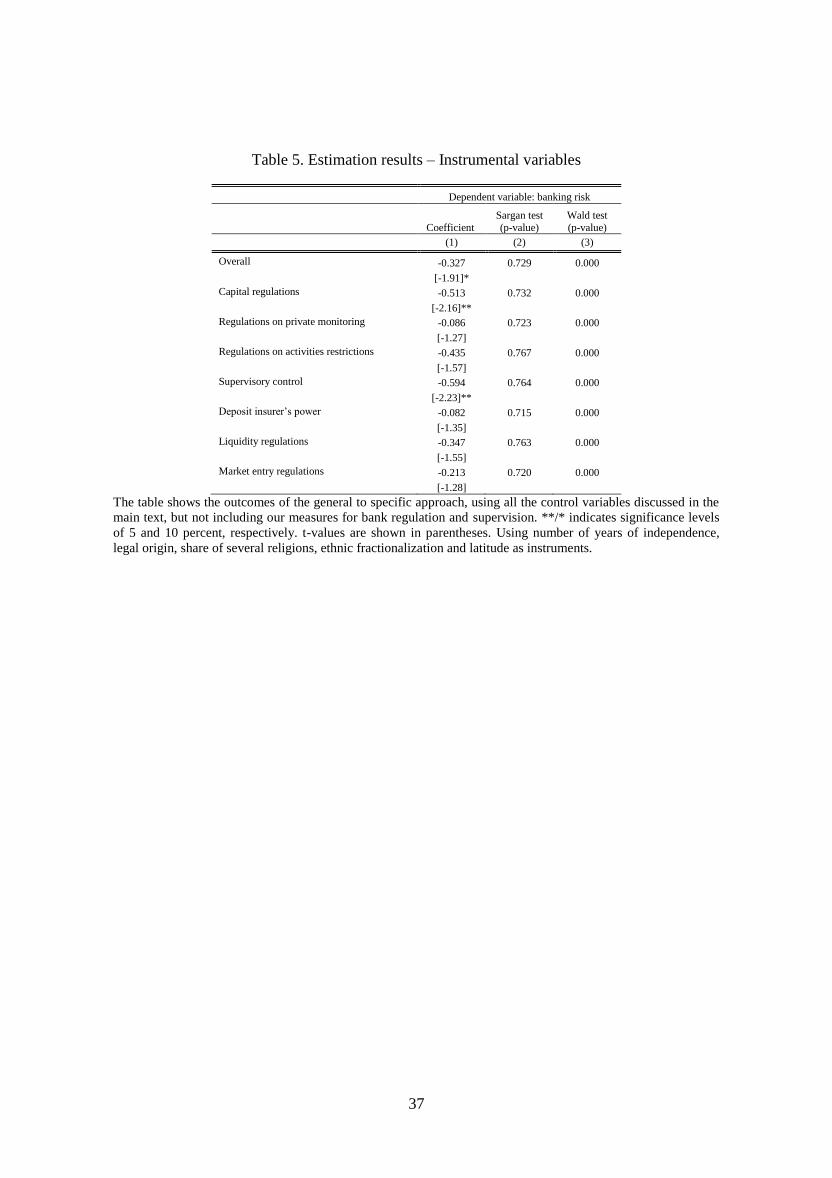
37
Table 5. Estimation results – Instrumental variables
Dependent variable: banking risk
Coefficient
Sargan test
(p-value)
Wald test
(p-value)
(1) (2) (3)
Overall -0.327 0.729 0.000
[-1.91]*
Capital regulations -0.513 0.732 0.000
[-2.16]**
Regulations on private monitoring -0.086 0.723 0.000
[-1.27]
Regulations on activities restrictions -0.435 0.767 0.000
[-1.57]
Supervisory control -0.594 0.764 0.000
[-2.23]**
Deposit insurer’s power -0.082 0.715 0.000
[-1.35]
Liquidity regulations -0.347 0.763 0.000
[-1.55]
Market entry regulations -0.213 0.720 0.000
[-1.28]
The table shows the outcomes of the general to specific approach, using all the control variables discussed in the
main text, but not including our measures for bank regulation and supervision. **/* indicates significance levels
of 5 and 10 percent, respectively. t-values are shown in parentheses. Using number of years of independence,
legal origin, share of several religions, ethnic fractionalization and latitude as instruments.
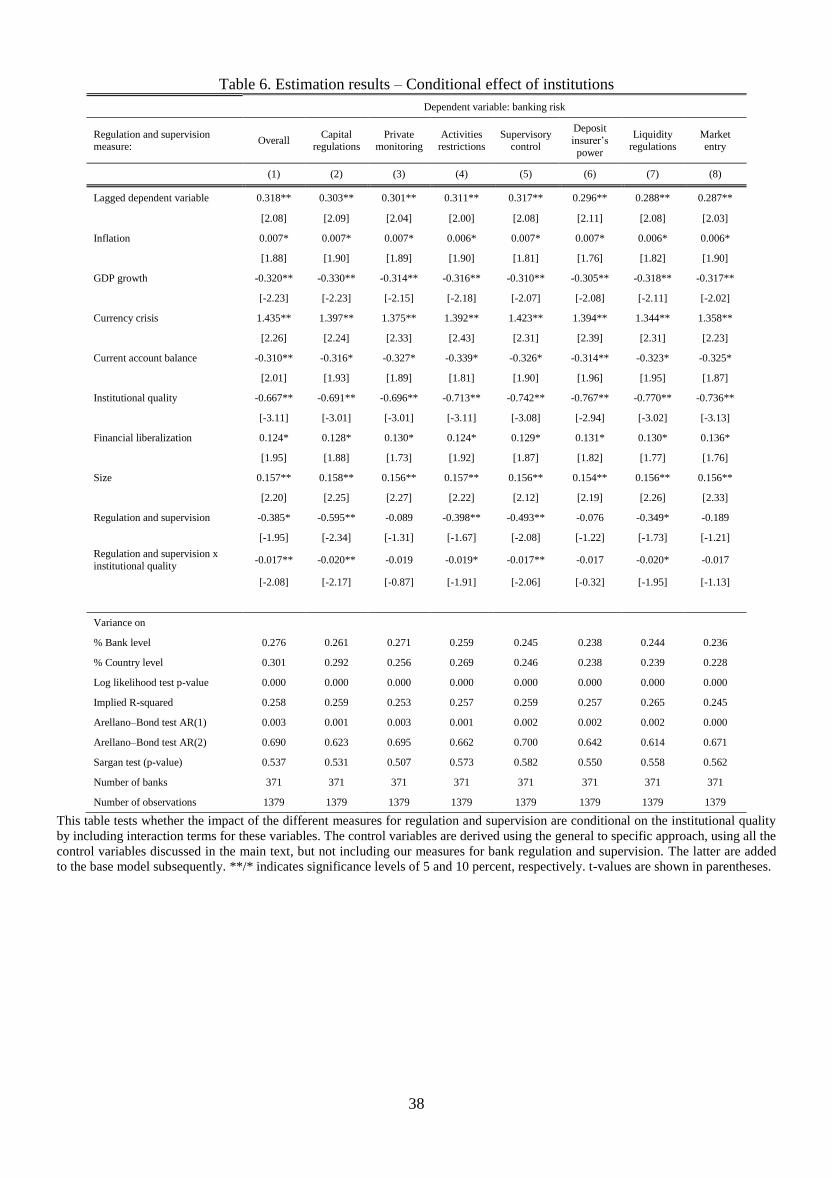
38
Table 6. Estimation results – Conditional effect of institutions
Dependent variable: banking risk
Regulation and supervision measure:
Overall Capital
regulations Private
monitoring Activities
restrictions Supervisory
control
Deposit
insurer’s
power
Liquidity regulations
Market entry
(1) (2) (3) (4) (5) (6) (7) (8)
Lagged dependent variable 0.318** 0.303** 0.301** 0.311** 0.317** 0.296** 0.288** 0.287**
[2.08] [2.09] [2.04] [2.00] [2.08] [2.11] [2.08] [2.03]
Inflation 0.007* 0.007* 0.007* 0.006* 0.007* 0.007* 0.006* 0.006*
[1.88] [1.90] [1.89] [1.90] [1.81] [1.76] [1.82] [1.90]
GDP growth -0.320** -0.330** -0.314** -0.316** -0.310** -0.305** -0.318** -0.317**
[-2.23] [-2.23] [-2.15] [-2.18] [-2.07] [-2.08] [-2.11] [-2.02]
Currency crisis 1.435** 1.397** 1.375** 1.392** 1.423** 1.394** 1.344** 1.358**
[2.26] [2.24] [2.33] [2.43] [2.31] [2.39] [2.31] [2.23]
Current account balance -0.310** -0.316* -0.327* -0.339* -0.326* -0.314** -0.323* -0.325*
[2.01] [1.93] [1.89] [1.81] [1.90] [1.96] [1.95] [1.87]
Institutional quality -0.667** -0.691** -0.696** -0.713** -0.742** -0.767** -0.770** -0.736**
[-3.11] [-3.01] [-3.01] [-3.11] [-3.08] [-2.94] [-3.02] [-3.13]
Financial liberalization 0.124* 0.128* 0.130* 0.124* 0.129* 0.131* 0.130* 0.136*
[1.95] [1.88] [1.73] [1.92] [1.87] [1.82] [1.77] [1.76]
Size 0.157** 0.158** 0.156** 0.157** 0.156** 0.154** 0.156** 0.156**
[2.20] [2.25] [2.27] [2.22] [2.12] [2.19] [2.26] [2.33]
Regulation and supervision -0.385* -0.595** -0.089 -0.398** -0.493** -0.076 -0.349* -0.189
[-1.95] [-2.34] [-1.31] [-1.67] [-2.08] [-1.22] [-1.73] [-1.21]
Regulation and supervision x
institutional quality -0.017** -0.020** -0.019 -0.019* -0.017** -0.017 -0.020* -0.017
[-2.08] [-2.17] [-0.87] [-1.91] [-2.06] [-0.32] [-1.95] [-1.13]
Variance on
% Bank level 0.276 0.261 0.271 0.259 0.245 0.238 0.244 0.236
% Country level 0.301 0.292 0.256 0.269 0.246 0.238 0.239 0.228
Log likelihood test p-value 0.000 0.000 0.000 0.000 0.000 0.000 0.000 0.000
Implied R-squared 0.258 0.259 0.253 0.257 0.259 0.257 0.265 0.245
Arellano–Bond test AR(1) 0.003 0.001 0.003 0.001 0.002 0.002 0.002 0.000
Arellano–Bond test AR(2) 0.690 0.623 0.695 0.662 0.700 0.642 0.614 0.671
Sargan test (p-value) 0.537 0.531 0.507 0.573 0.582 0.550 0.558 0.562
Number of banks 371 371 371 371 371 371 371 371
Number of observations 1379 1379 1379 1379 1379 1379 1379 1379
This table tests whether the impact of the different measures for regulation and supervision are conditional on the institutional quality
by including interaction terms for these variables. The control variables are derived using the general to specific approach, using all the
control variables discussed in the main text, but not including our measures for bank regulation and supervision. The latter are added
to the base model subsequently. **/* indicates significance levels of 5 and 10 percent, respectively. t-values are shown in parentheses.
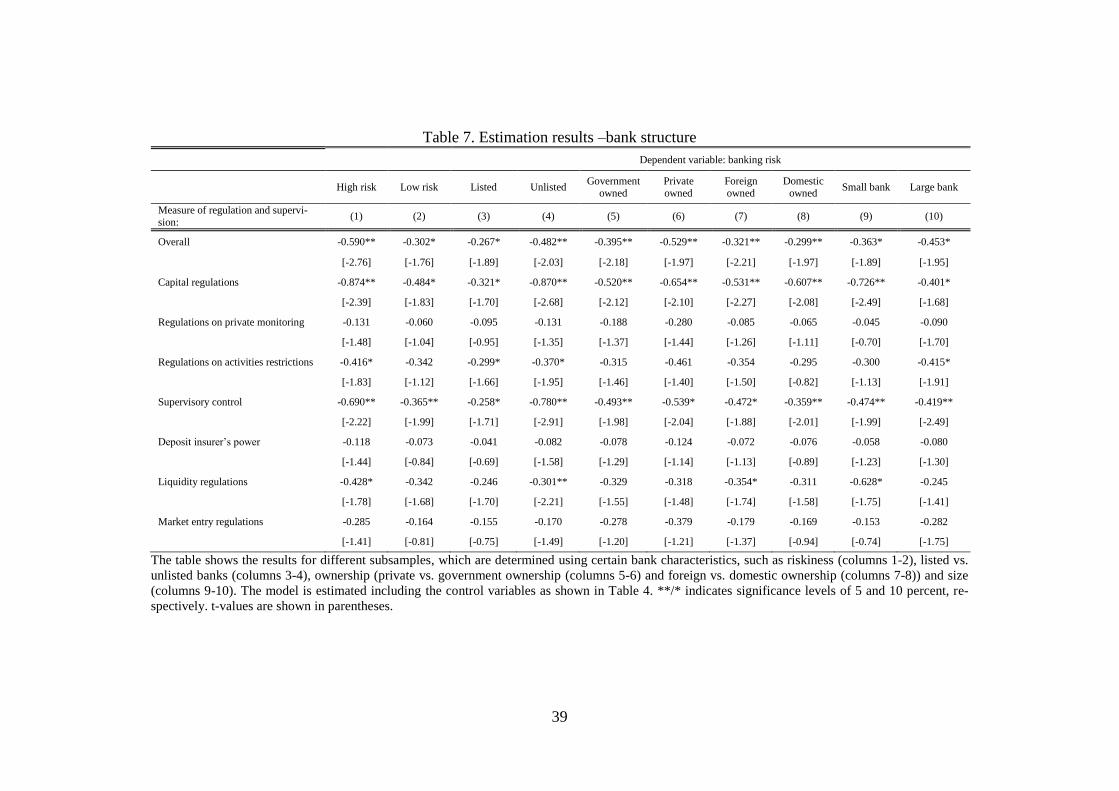
39
Table 7. Estimation results –bank structure
Dependent variable: banking risk
High risk Low risk Listed Unlisted
Government owned
Private owned
Foreign owned
Domestic owned
Small bank Large bank
Measure of regulation and supervi-sion:
(1) (2) (3) (4) (5) (6) (7) (8) (9) (10)
Overall -0.590** -0.302* -0.267* -0.482** -0.395** -0.529** -0.321** -0.299** -0.363* -0.453*
[-2.76] [-1.76] [-1.89] [-2.03] [-2.18] [-1.97] [-2.21] [-1.97] [-1.89] [-1.95]
Capital regulations -0.874** -0.484* -0.321* -0.870** -0.520** -0.654** -0.531** -0.607** -0.726** -0.401*
[-2.39] [-1.83] [-1.70] [-2.68] [-2.12] [-2.10] [-2.27] [-2.08] [-2.49] [-1.68]
Regulations on private monitoring -0.131 -0.060 -0.095 -0.131 -0.188 -0.280 -0.085 -0.065 -0.045 -0.090
[-1.48] [-1.04] [-0.95] [-1.35] [-1.37] [-1.44] [-1.26] [-1.11] [-0.70] [-1.70]
Regulations on activities restrictions -0.416* -0.342 -0.299* -0.370* -0.315 -0.461 -0.354 -0.295 -0.300 -0.415*
[-1.83] [-1.12] [-1.66] [-1.95] [-1.46] [-1.40] [-1.50] [-0.82] [-1.13] [-1.91]
Supervisory control -0.690** -0.365** -0.258* -0.780** -0.493** -0.539* -0.472* -0.359** -0.474** -0.419**
[-2.22] [-1.99] [-1.71] [-2.91] [-1.98] [-2.04] [-1.88] [-2.01] [-1.99] [-2.49]
Deposit insurer’s power -0.118 -0.073 -0.041 -0.082 -0.078 -0.124 -0.072 -0.076 -0.058 -0.080
[-1.44] [-0.84] [-0.69] [-1.58] [-1.29] [-1.14] [-1.13] [-0.89] [-1.23] [-1.30]
Liquidity regulations -0.428* -0.342 -0.246 -0.301** -0.329 -0.318 -0.354* -0.311 -0.628* -0.245
[-1.78] [-1.68] [-1.70] [-2.21] [-1.55] [-1.48] [-1.74] [-1.58] [-1.75] [-1.41]
Market entry regulations -0.285 -0.164 -0.155 -0.170 -0.278 -0.379 -0.179 -0.169 -0.153 -0.282
[-1.41] [-0.81] [-0.75] [-1.49] [-1.20] [-1.21] [-1.37] [-0.94] [-0.74] [-1.75]
The table shows the results for different subsamples, which are determined using certain bank characteristics, such as riskiness (columns 1-2), listed vs.
unlisted banks (columns 3-4), ownership (private vs. government ownership (columns 5-6) and foreign vs. domestic ownership (columns 7-8)) and size
(columns 9-10). The model is estimated including the control variables as shown in Table 4. **/* indicates significance levels of 5 and 10 percent, re-
spectively. t-values are shown in parentheses.
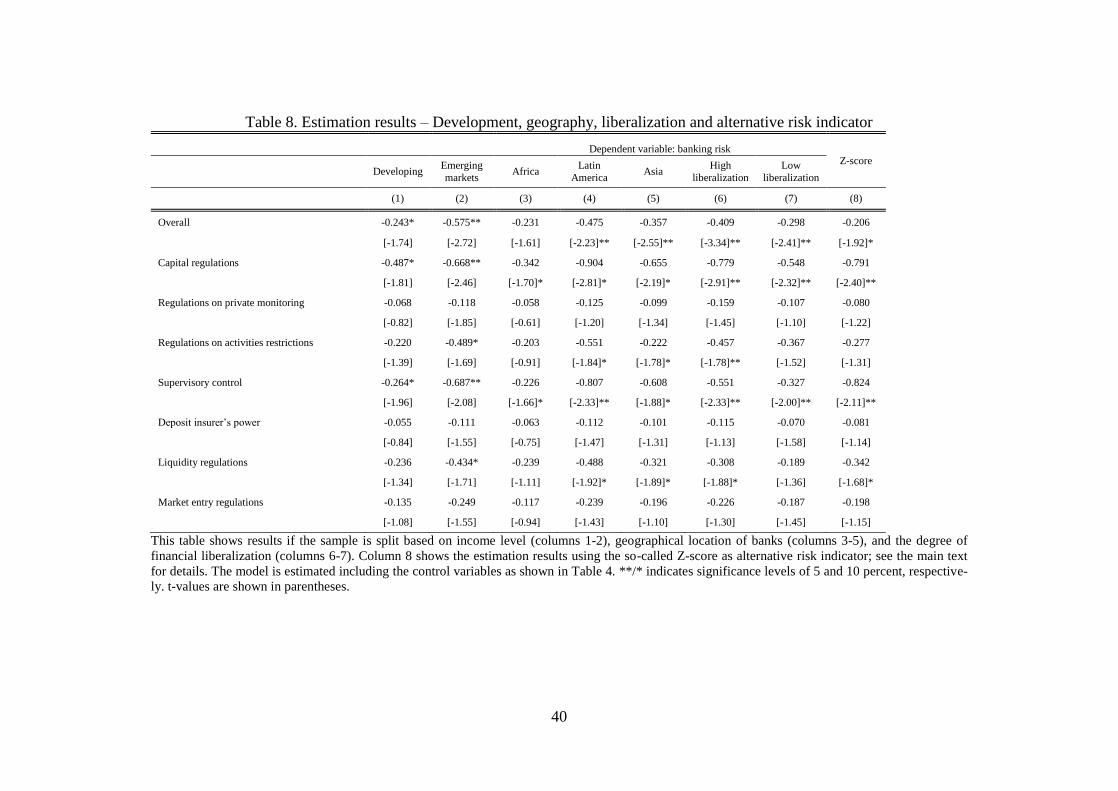
40
Table 8. Estimation results – Development, geography, liberalization and alternative risk indicator
Dependent variable: banking risk
Z-score
Developing
Emerging
markets Africa
Latin
America Asia
High
liberalization
Low
liberalization
(1) (2) (3) (4) (5) (6) (7) (8)
Overall -0.243* -0.575** -0.231 -0.475 -0.357 -0.409 -0.298 -0.206
[-1.74] [-2.72] [-1.61] [-2.23]** [-2.55]** [-3.34]** [-2.41]** [-1.92]*
Capital regulations -0.487* -0.668** -0.342 -0.904 -0.655 -0.779 -0.548 -0.791
[-1.81] [-2.46] [-1.70]* [-2.81]* [-2.19]* [-2.91]** [-2.32]** [-2.40]**
Regulations on private monitoring -0.068 -0.118 -0.058 -0.125 -0.099 -0.159 -0.107 -0.080
[-0.82] [-1.85] [-0.61] [-1.20] [-1.34] [-1.45] [-1.10] [-1.22]
Regulations on activities restrictions -0.220 -0.489* -0.203 -0.551 -0.222 -0.457 -0.367 -0.277
[-1.39] [-1.69] [-0.91] [-1.84]* [-1.78]* [-1.78]** [-1.52] [-1.31]
Supervisory control -0.264* -0.687** -0.226 -0.807 -0.608 -0.551 -0.327 -0.824
[-1.96] [-2.08] [-1.66]* [-2.33]** [-1.88]* [-2.33]** [-2.00]** [-2.11]**
Deposit insurer’s power -0.055 -0.111 -0.063 -0.112 -0.101 -0.115 -0.070 -0.081
[-0.84] [-1.55] [-0.75] [-1.47] [-1.31] [-1.13] [-1.58] [-1.14]
Liquidity regulations -0.236 -0.434* -0.239 -0.488 -0.321 -0.308 -0.189 -0.342
[-1.34] [-1.71] [-1.11] [-1.92]* [-1.89]* [-1.88]* [-1.36] [-1.68]*
Market entry regulations -0.135 -0.249 -0.117 -0.239 -0.196 -0.226 -0.187 -0.198
[-1.08] [-1.55] [-0.94] [-1.43] [-1.10] [-1.30] [-1.45] [-1.15]
This table shows results if the sample is split based on income level (columns 1-2), geographical location of banks (columns 3-5), and the degree of
financial liberalization (columns 6-7). Column 8 shows the estimation results using the so-called Z-score as alternative risk indicator; see the main text
for details. The model is estimated including the control variables as shown in Table 4. **/* indicates significance levels of 5 and 10 percent, respective-
ly. t-values are shown in parentheses.
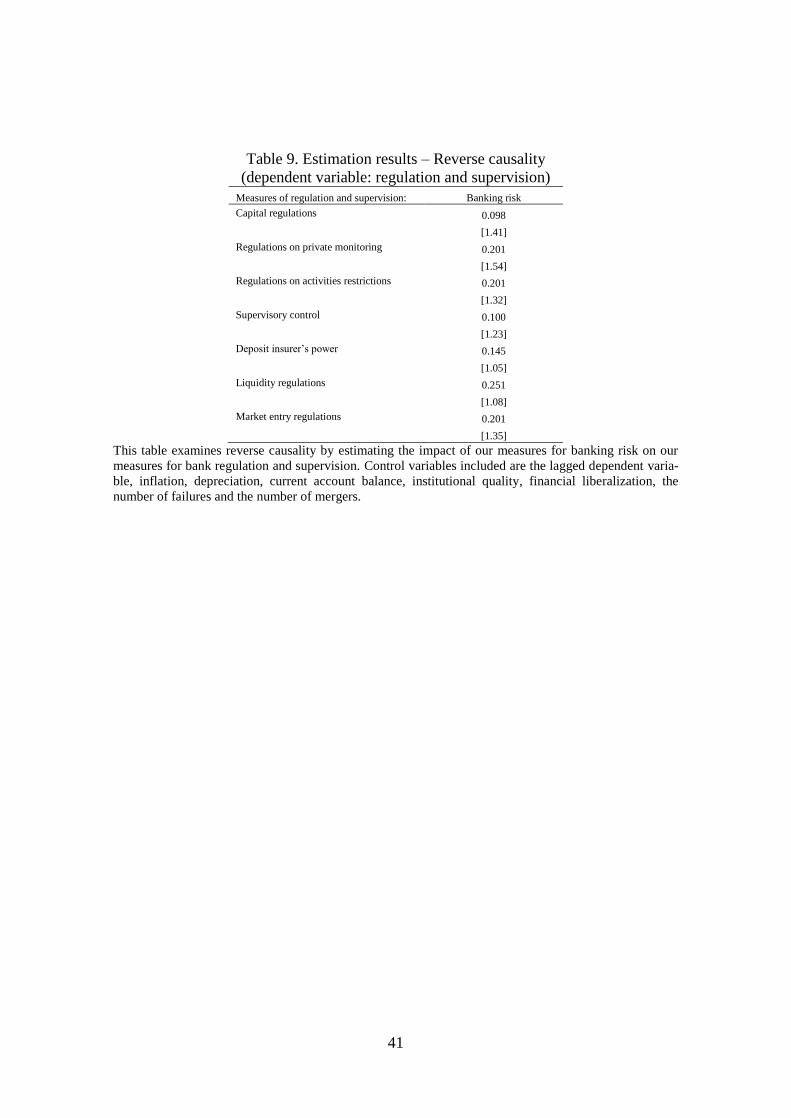
41
Table 9. Estimation results – Reverse causality
(dependent variable: regulation and supervision)
Measures of regulation and supervision: Banking risk
Capital regulations 0.098
[1.41]
Regulations on private monitoring 0.201
[1.54]
Regulations on activities restrictions 0.201
[1.32]
Supervisory control 0.100
[1.23]
Deposit insurer’s power 0.145
[1.05]
Liquidity regulations 0.251
[1.08]
Market entry regulations 0.201
[1.35]
This table examines reverse causality by estimating the impact of our measures for banking risk on our
measures for bank regulation and supervision. Control variables included are the lagged dependent varia-
ble, inflation, depreciation, current account balance, institutional quality, financial liberalization, the
number of failures and the number of mergers.
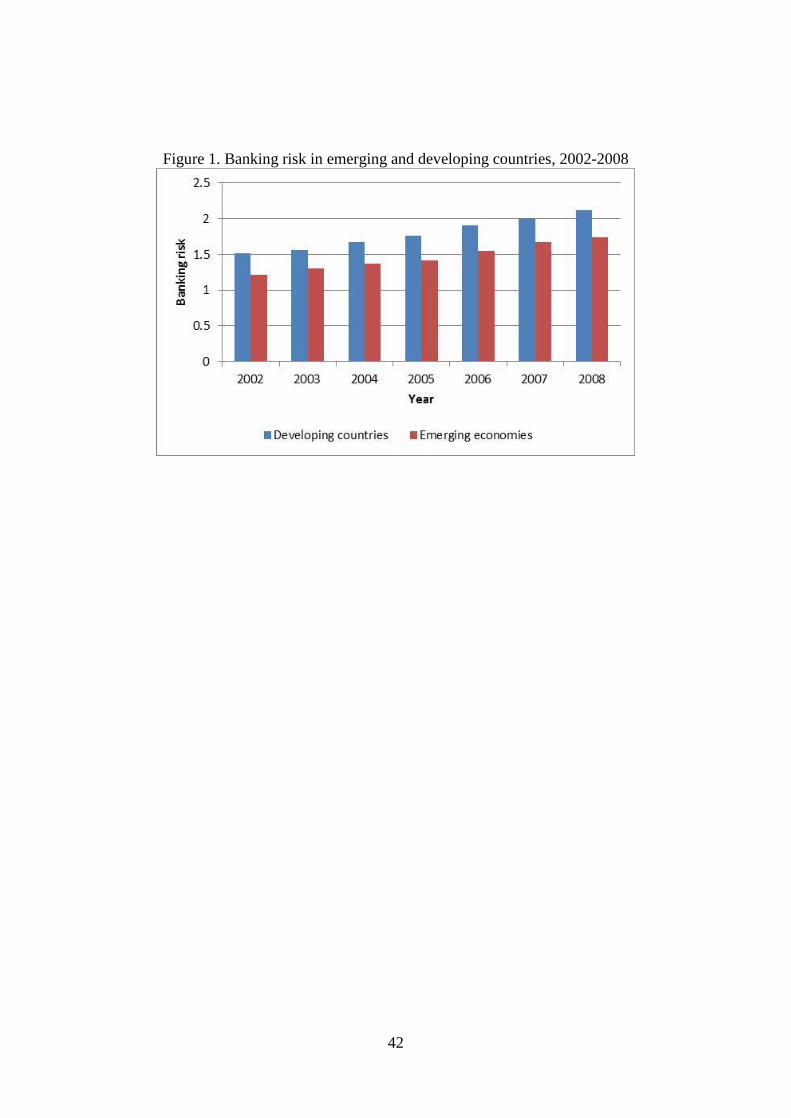
42
Figure 1. Banking risk in emerging and developing countries, 2002-2008
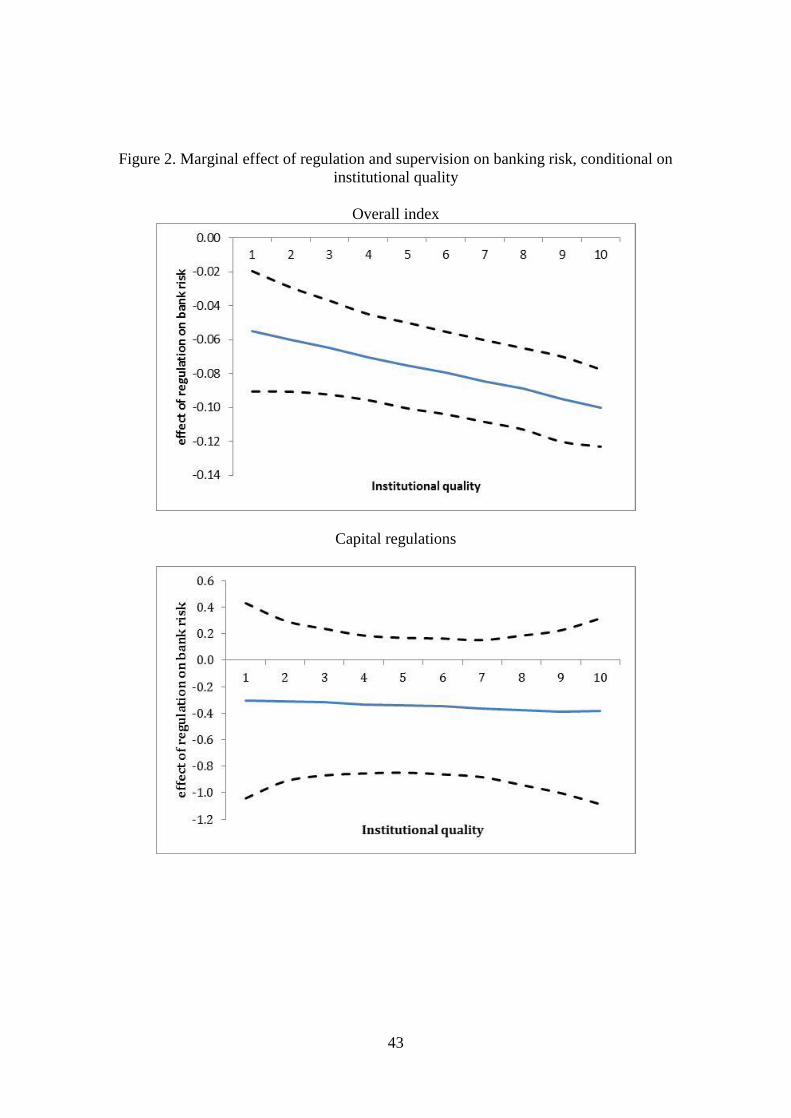
43
Figure 2. Marginal effect of regulation and supervision on banking risk, conditional on
institutional quality
Overall index
Capital regulations
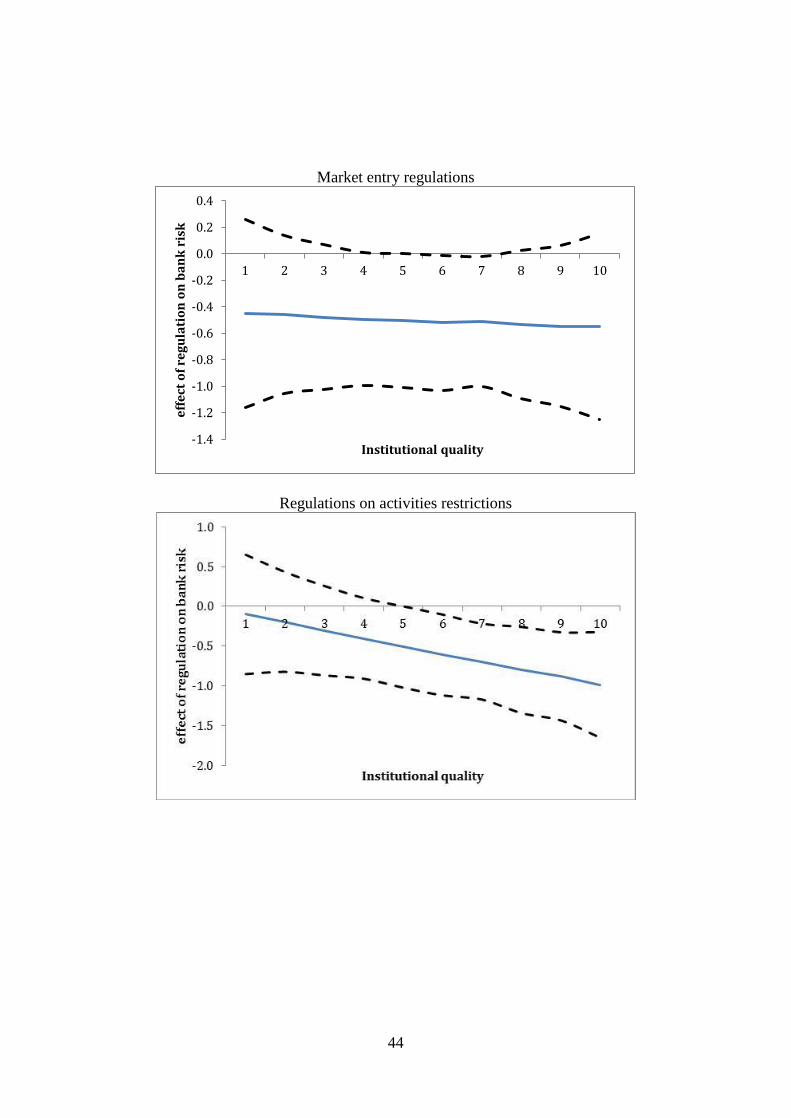
44
Market entry regulations
Regulations on activities restrictions
-1.4
-1.2
-1.0
-0.8
-0.6
-0.4
-0.2
0.0
0.2
0.4
1 2 3 4 5 6 7 8 9 10
eff
ect
of
reg
ula
tio
n o
n b
an
k r
isk
Institutional quality
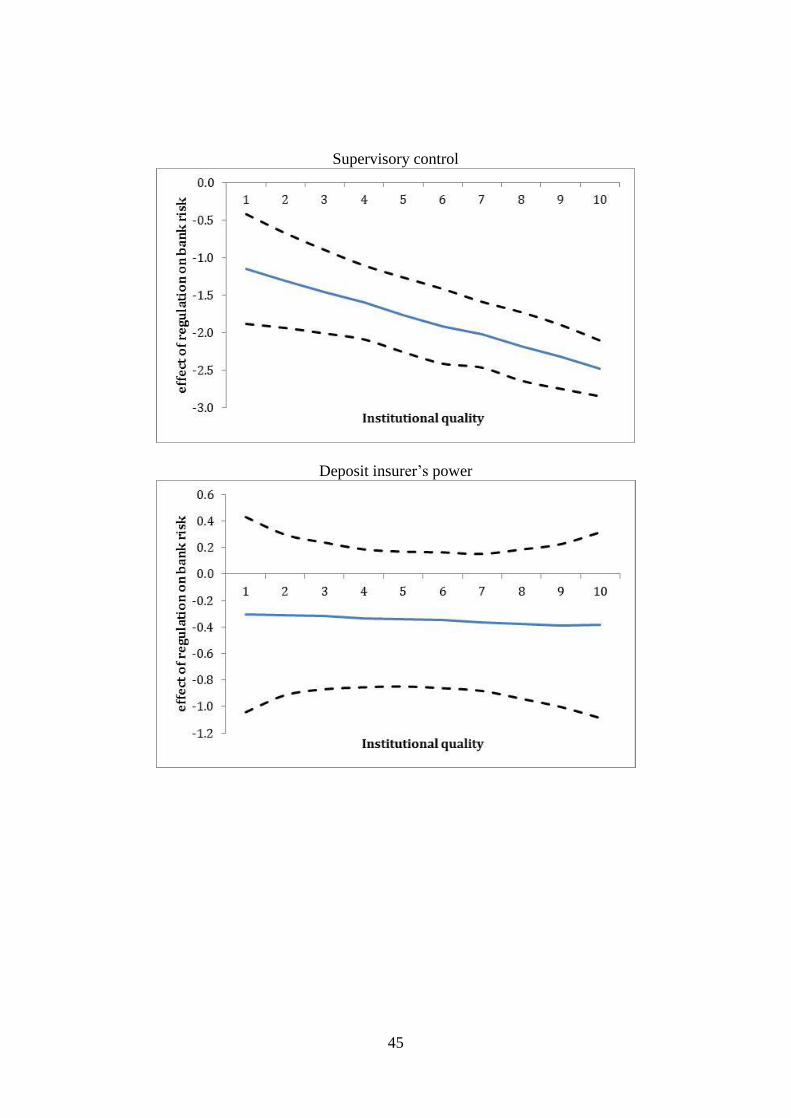
45
Supervisory control
Deposit insurer’s power
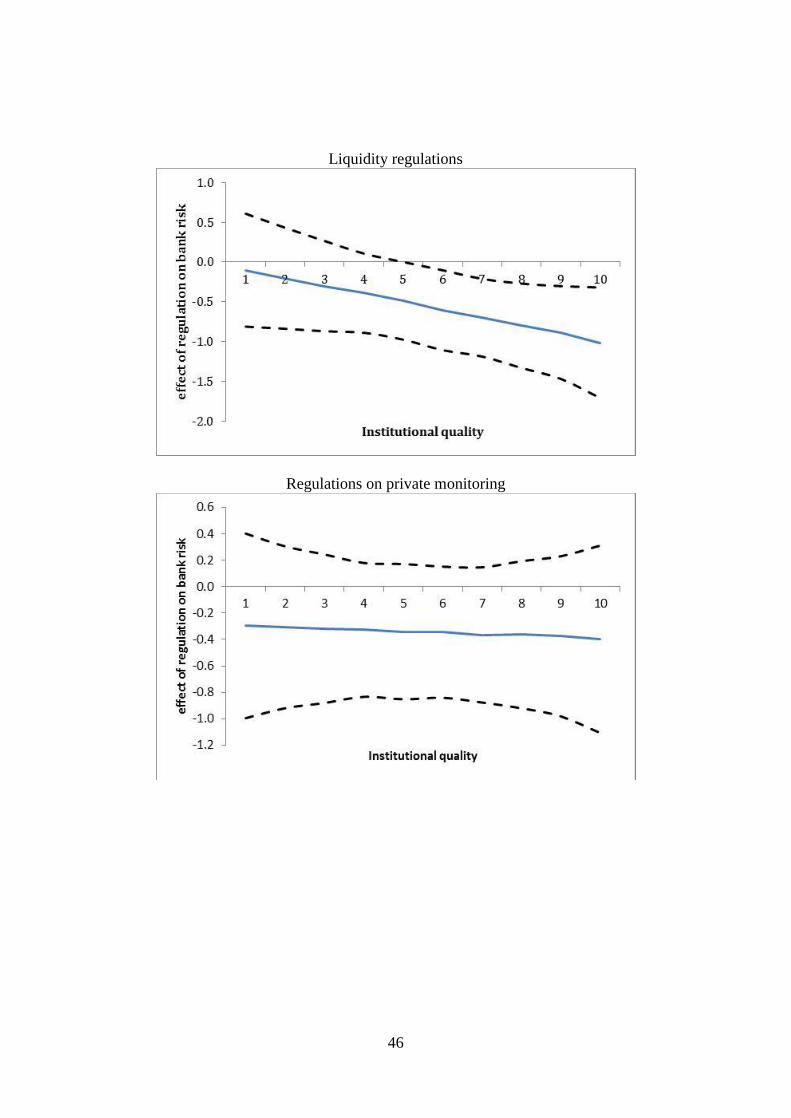
46
Liquidity regulations
Regulations on private monitoring

47
Appendix Table A1. Distribution of banks across countries Country Number of banks Country Number of banks
ALBANIA# 3 LITHUANIA# 2
ALGERIA 5 MACEDONIA# 2
ARGENTINA# 12 MADAGASCAR 1
ARMENIA* 2 MALAYSIA# 5
AZERBAIJAN 6 MAURITIUS* 7
BAHRAIN* 2 MEXICO# 4
BELARUS# 6 MOLDOVA REP. OF 3
BELIZE* 1 MONTENEGRO# 5
BENIN* 2 NAMIBIA* 2
BOSNIA-HERZEGOVINA# 6 NIGER* 2
BOTSWANA* 1 NIGERIA 4
BRAZIL# 21 PAKISTAN 8
BULGARIA# 6 PANAMA* 15
CAMBODIA* 7 PERU 2
CAMEROON 1 PHILIPPINES 11
CHILE# 3 POLAND# 13
COLOMBIA# 3 QATAR* 1
CONGO, DR* 1 ROMANIA# 9
COSTA RICA 8 RUSSIAN FEDERATION# 85
CROATIA# 6 RWANDA* 2
ECUADOR 13 SENEGAL 2
EL SALVADOR 4 SERBIA# 16
ESTONIA# 1 SLOVAKIA# 5
GABON* 1 SOUTH AFRICA 3
GAMBIA* 1 SRI LANKA 2
GHANA 4 SUDAN* 4
GUATEMALA 1 SWAZILAND* 2
GUINEA* 1 THAILAND 3
HONDURAS* 5 TONGA* 1
INDIA# 18 TRINIDAD AND TOBAGO* 2
KAZAKHSTAN 6 TUNISIA* 9
KENYA 4 TURKEY# 9
KYRGYZSTAN 4 UKRAINE# 16
LATVIA# 7 VENEZUELA 10
LEBANON* 3 ZIMBABWE 3
LESOTHO* 1 Total 446 Average number of banks per
country 6.28
* Countries excluded from the estimation in Tables 4 and 5 due to missing data on control variables.
# Emerging market country.
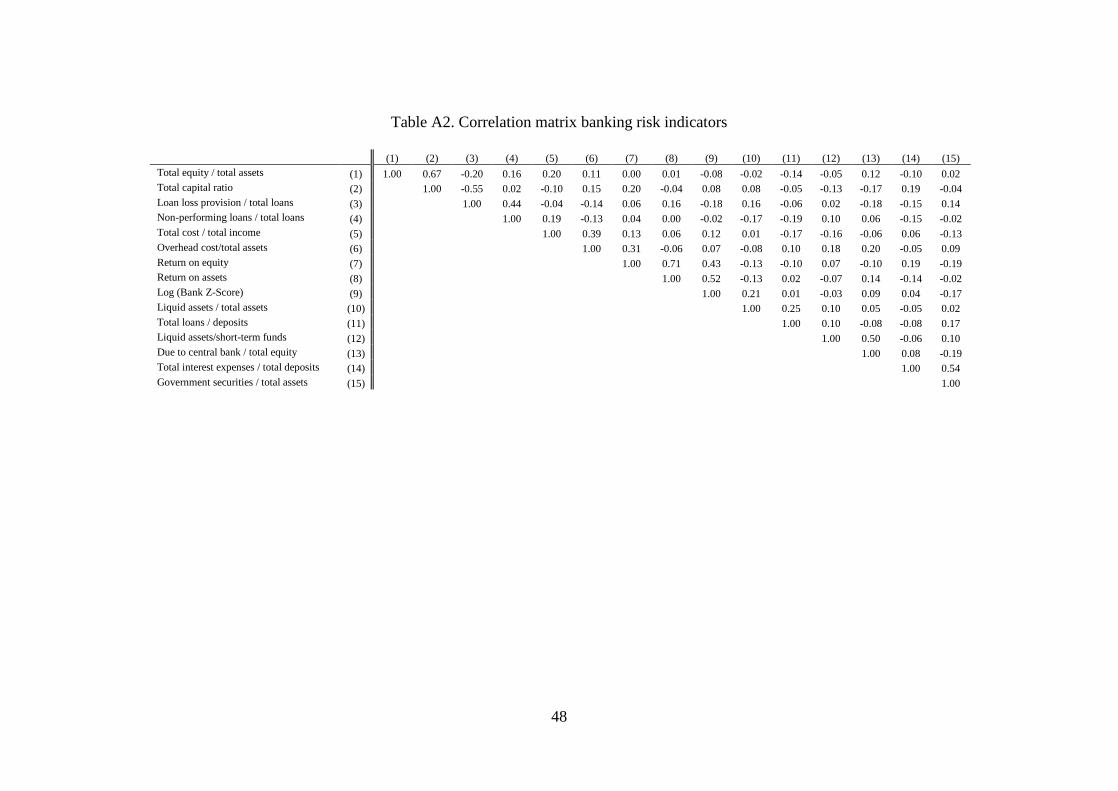
48
Table A2. Correlation matrix banking risk indicators
(1) (2) (3) (4) (5) (6) (7) (8) (9) (10) (11) (12) (13) (14) (15)
Total equity / total assets (1) 1.00 0.67 -0.20 0.16 0.20 0.11 0.00 0.01 -0.08 -0.02 -0.14 -0.05 0.12 -0.10 0.02
Total capital ratio (2) 1.00 -0.55 0.02 -0.10 0.15 0.20 -0.04 0.08 0.08 -0.05 -0.13 -0.17 0.19 -0.04
Loan loss provision / total loans (3) 1.00 0.44 -0.04 -0.14 0.06 0.16 -0.18 0.16 -0.06 0.02 -0.18 -0.15 0.14
Non-performing loans / total loans (4) 1.00 0.19 -0.13 0.04 0.00 -0.02 -0.17 -0.19 0.10 0.06 -0.15 -0.02
Total cost / total income (5) 1.00 0.39 0.13 0.06 0.12 0.01 -0.17 -0.16 -0.06 0.06 -0.13
Overhead cost/total assets (6) 1.00 0.31 -0.06 0.07 -0.08 0.10 0.18 0.20 -0.05 0.09
Return on equity (7) 1.00 0.71 0.43 -0.13 -0.10 0.07 -0.10 0.19 -0.19
Return on assets (8) 1.00 0.52 -0.13 0.02 -0.07 0.14 -0.14 -0.02
Log (Bank Z-Score) (9) 1.00 0.21 0.01 -0.03 0.09 0.04 -0.17
Liquid assets / total assets (10) 1.00 0.25 0.10 0.05 -0.05 0.02
Total loans / deposits (11) 1.00 0.10 -0.08 -0.08 0.17
Liquid assets/short-term funds (12) 1.00 0.50 -0.06 0.10
Due to central bank / total equity (13) 1.00 0.08 -0.19
Total interest expenses / total deposits (14) 1.00 0.54
Government securities / total assets (15) 1.00
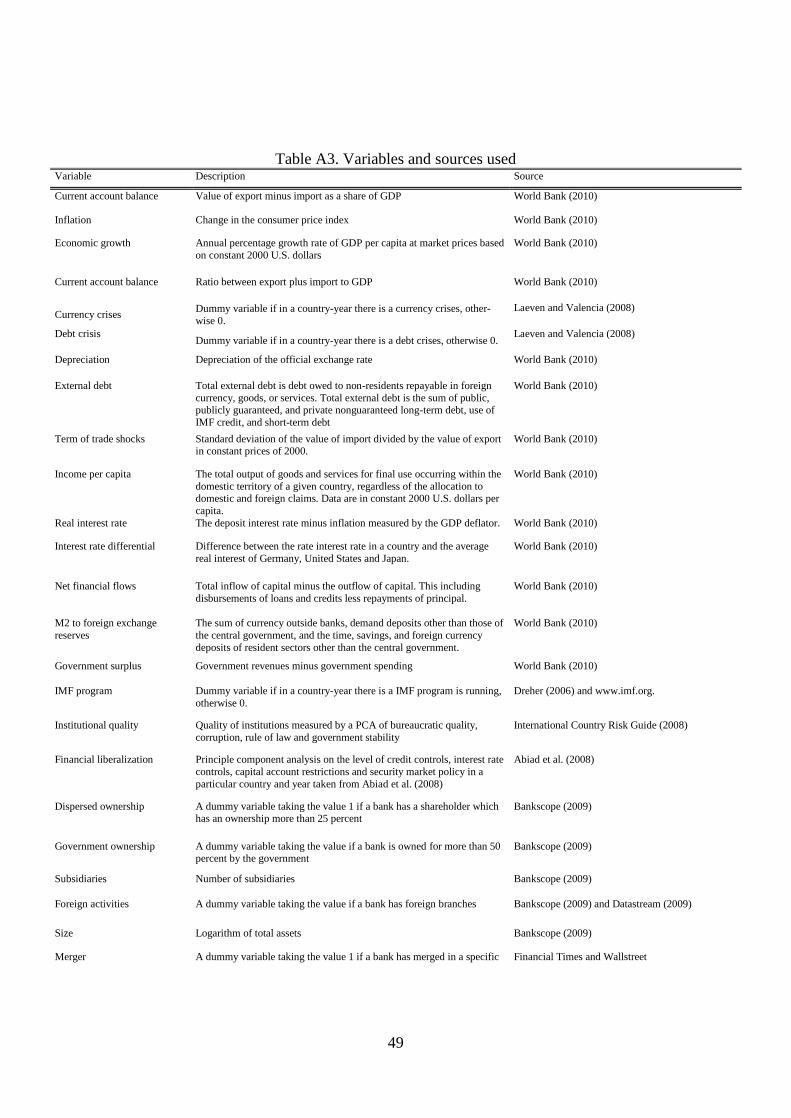
49
Table A3. Variables and sources used Variable Description Source
Current account balance Value of export minus import as a share of GDP World Bank (2010)
Inflation Change in the consumer price index World Bank (2010)
Economic growth Annual percentage growth rate of GDP per capita at market prices based
on constant 2000 U.S. dollars
World Bank (2010)
Current account balance Ratio between export plus import to GDP World Bank (2010)
Currency crises Dummy variable if in a country-year there is a currency crises, other-
wise 0.
Laeven and Valencia (2008)
Debt crisis Dummy variable if in a country-year there is a debt crises, otherwise 0.
Laeven and Valencia (2008)
Depreciation Depreciation of the official exchange rate World Bank (2010)
External debt Total external debt is debt owed to non-residents repayable in foreign
currency, goods, or services. Total external debt is the sum of public, publicly guaranteed, and private nonguaranteed long-term debt, use of
IMF credit, and short-term debt
World Bank (2010)
Term of trade shocks Standard deviation of the value of import divided by the value of export in constant prices of 2000.
World Bank (2010)
Income per capita The total output of goods and services for final use occurring within the
domestic territory of a given country, regardless of the allocation to domestic and foreign claims. Data are in constant 2000 U.S. dollars per
capita.
World Bank (2010)
Real interest rate The deposit interest rate minus inflation measured by the GDP deflator. World Bank (2010)
Interest rate differential Difference between the rate interest rate in a country and the average
real interest of Germany, United States and Japan.
World Bank (2010)
Net financial flows Total inflow of capital minus the outflow of capital. This including
disbursements of loans and credits less repayments of principal.
World Bank (2010)
M2 to foreign exchange
reserves
The sum of currency outside banks, demand deposits other than those of
the central government, and the time, savings, and foreign currency
deposits of resident sectors other than the central government.
World Bank (2010)
Government surplus Government revenues minus government spending World Bank (2010)
IMF program Dummy variable if in a country-year there is a IMF program is running,
otherwise 0.
Dreher (2006) and www.imf.org.
Institutional quality Quality of institutions measured by a PCA of bureaucratic quality,
corruption, rule of law and government stability
International Country Risk Guide (2008)
Financial liberalization Principle component analysis on the level of credit controls, interest rate
controls, capital account restrictions and security market policy in a
particular country and year taken from Abiad et al. (2008)
Abiad et al. (2008)
Dispersed ownership A dummy variable taking the value 1 if a bank has a shareholder which has an ownership more than 25 percent
Bankscope (2009)
Government ownership A dummy variable taking the value if a bank is owned for more than 50 percent by the government
Bankscope (2009)
Subsidiaries Number of subsidiaries Bankscope (2009)
Foreign activities A dummy variable taking the value if a bank has foreign branches Bankscope (2009) and Datastream (2009)
Size Logarithm of total assets Bankscope (2009)
Merger A dummy variable taking the value 1 if a bank has merged in a specific Financial Times and Wallstreet

50
year, otherwise zero. Journal
Failure A dummy variable taking the value 1 if a bank has failed in a specific year, otherwise zero.
LexusNexus and various bank statements and country reports
Concentration Herfindahl-Hirschmann index of bank assets within a country Bankscope and Beck et al. (2006)
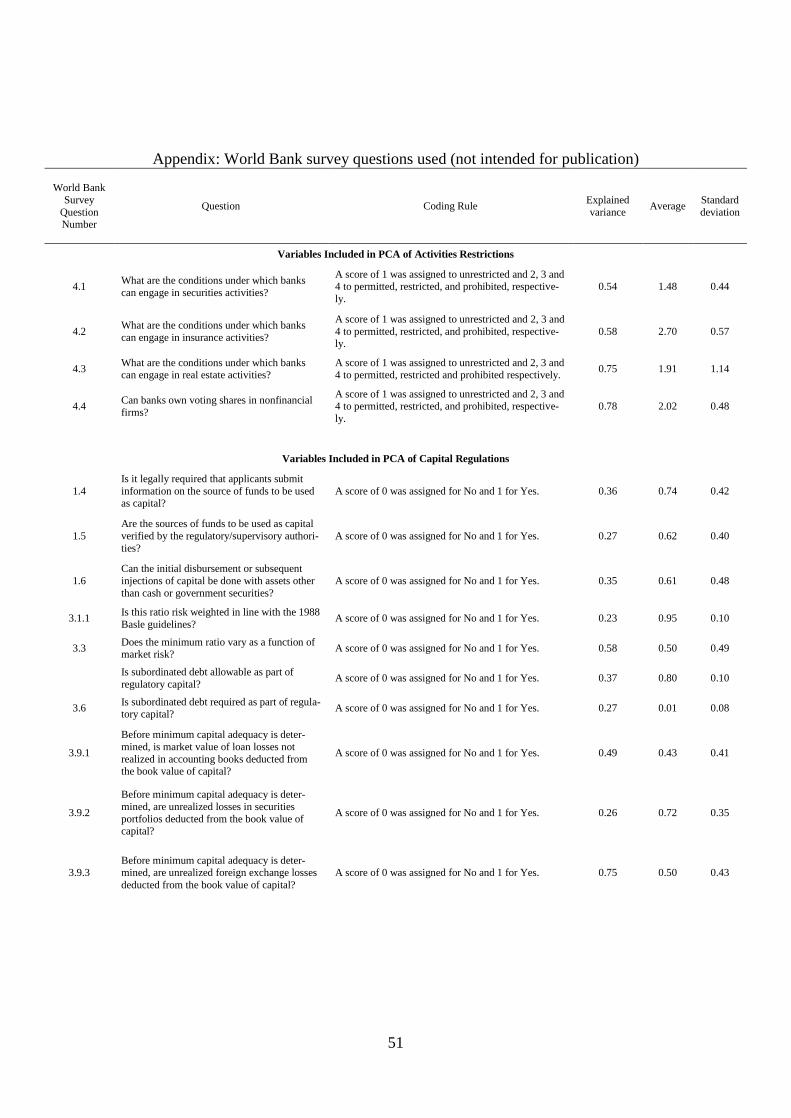
51
Appendix: World Bank survey questions used (not intended for publication)
World Bank
Survey
Question Number
Question Coding Rule Explained
variance Average
Standard
deviation
Variables Included in PCA of Activities Restrictions
4.1 What are the conditions under which banks
can engage in securities activities?
A score of 1 was assigned to unrestricted and 2, 3 and 4 to permitted, restricted, and prohibited, respective-
ly.
0.54 1.48 0.44
4.2 What are the conditions under which banks
can engage in insurance activities?
A score of 1 was assigned to unrestricted and 2, 3 and
4 to permitted, restricted, and prohibited, respective-ly.
0.58 2.70 0.57
4.3 What are the conditions under which banks can engage in real estate activities?
A score of 1 was assigned to unrestricted and 2, 3 and 4 to permitted, restricted and prohibited respectively.
0.75 1.91 1.14
4.4 Can banks own voting shares in nonfinancial
firms?
A score of 1 was assigned to unrestricted and 2, 3 and 4 to permitted, restricted, and prohibited, respective-
ly.
0.78 2.02 0.48
Variables Included in PCA of Capital Regulations
1.4
Is it legally required that applicants submit
information on the source of funds to be used as capital?
A score of 0 was assigned for No and 1 for Yes. 0.36 0.74 0.42
1.5
Are the sources of funds to be used as capital
verified by the regulatory/supervisory authori-
ties?
A score of 0 was assigned for No and 1 for Yes. 0.27 0.62 0.40
1.6
Can the initial disbursement or subsequent
injections of capital be done with assets other
than cash or government securities?
A score of 0 was assigned for No and 1 for Yes. 0.35 0.61 0.48
3.1.1 Is this ratio risk weighted in line with the 1988
Basle guidelines? A score of 0 was assigned for No and 1 for Yes. 0.23 0.95 0.10
3.3 Does the minimum ratio vary as a function of market risk?
A score of 0 was assigned for No and 1 for Yes. 0.58 0.50 0.49
Is subordinated debt allowable as part of
regulatory capital? A score of 0 was assigned for No and 1 for Yes. 0.37 0.80 0.10
3.6 Is subordinated debt required as part of regula-tory capital?
A score of 0 was assigned for No and 1 for Yes. 0.27 0.01 0.08
3.9.1
Before minimum capital adequacy is deter-
mined, is market value of loan losses not
realized in accounting books deducted from the book value of capital?
A score of 0 was assigned for No and 1 for Yes. 0.49 0.43 0.41
3.9.2
Before minimum capital adequacy is deter-
mined, are unrealized losses in securities
portfolios deducted from the book value of capital?
A score of 0 was assigned for No and 1 for Yes. 0.26 0.72 0.35
3.9.3 Before minimum capital adequacy is deter-mined, are unrealized foreign exchange losses
deducted from the book value of capital?
A score of 0 was assigned for No and 1 for Yes. 0.75 0.50 0.43
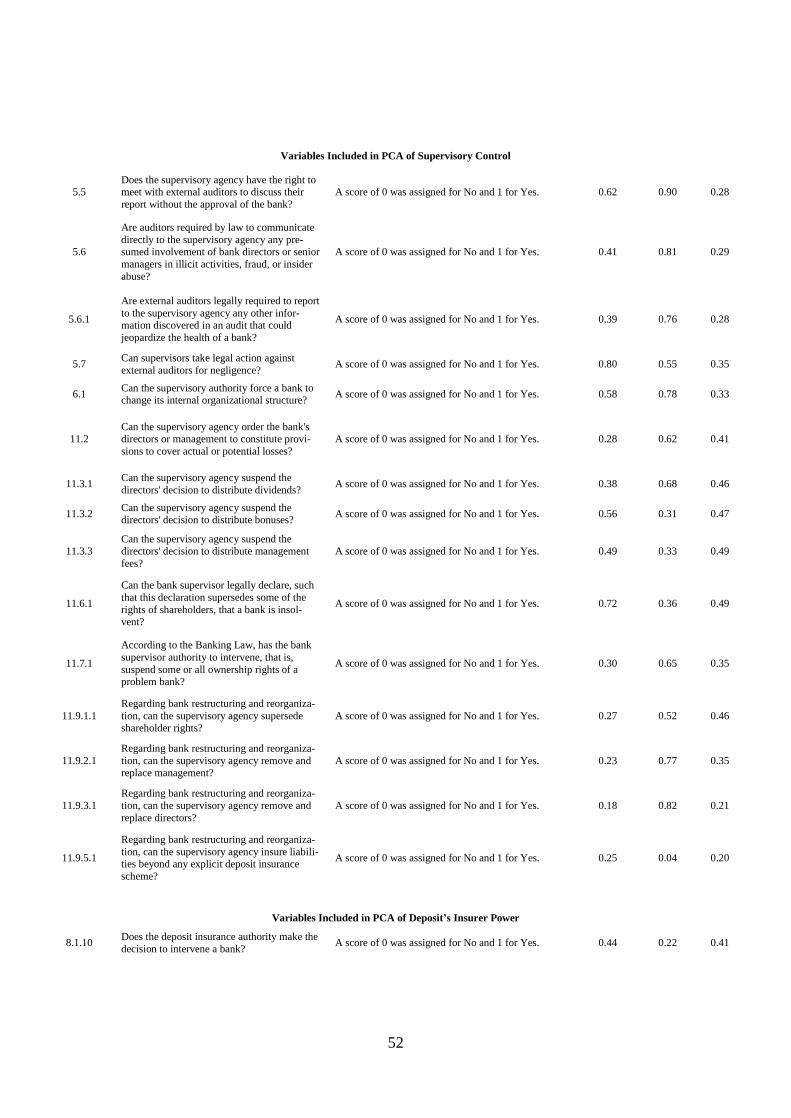
52
Variables Included in PCA of Supervisory Control
5.5 Does the supervisory agency have the right to meet with external auditors to discuss their
report without the approval of the bank?
A score of 0 was assigned for No and 1 for Yes. 0.62 0.90 0.28
5.6
Are auditors required by law to communicate
directly to the supervisory agency any pre-sumed involvement of bank directors or senior
managers in illicit activities, fraud, or insider
abuse?
A score of 0 was assigned for No and 1 for Yes. 0.41 0.81 0.29
5.6.1
Are external auditors legally required to report
to the supervisory agency any other infor-mation discovered in an audit that could
jeopardize the health of a bank?
A score of 0 was assigned for No and 1 for Yes. 0.39 0.76 0.28
5.7 Can supervisors take legal action against
external auditors for negligence? A score of 0 was assigned for No and 1 for Yes. 0.80 0.55 0.35
6.1 Can the supervisory authority force a bank to change its internal organizational structure?
A score of 0 was assigned for No and 1 for Yes. 0.58 0.78 0.33
11.2 Can the supervisory agency order the bank's directors or management to constitute provi-
sions to cover actual or potential losses?
A score of 0 was assigned for No and 1 for Yes. 0.28 0.62 0.41
11.3.1 Can the supervisory agency suspend the
directors' decision to distribute dividends? A score of 0 was assigned for No and 1 for Yes. 0.38 0.68 0.46
11.3.2 Can the supervisory agency suspend the directors' decision to distribute bonuses?
A score of 0 was assigned for No and 1 for Yes. 0.56 0.31 0.47
11.3.3 Can the supervisory agency suspend the directors' decision to distribute management
fees?
A score of 0 was assigned for No and 1 for Yes. 0.49 0.33 0.49
11.6.1
Can the bank supervisor legally declare, such
that this declaration supersedes some of the
rights of shareholders, that a bank is insol-vent?
A score of 0 was assigned for No and 1 for Yes. 0.72 0.36 0.49
11.7.1
According to the Banking Law, has the bank
supervisor authority to intervene, that is,
suspend some or all ownership rights of a problem bank?
A score of 0 was assigned for No and 1 for Yes. 0.30 0.65 0.35
11.9.1.1
Regarding bank restructuring and reorganiza-
tion, can the supervisory agency supersede shareholder rights?
A score of 0 was assigned for No and 1 for Yes. 0.27 0.52 0.46
11.9.2.1
Regarding bank restructuring and reorganiza-
tion, can the supervisory agency remove and replace management?
A score of 0 was assigned for No and 1 for Yes. 0.23 0.77 0.35
11.9.3.1
Regarding bank restructuring and reorganiza-
tion, can the supervisory agency remove and
replace directors?
A score of 0 was assigned for No and 1 for Yes. 0.18 0.82 0.21
11.9.5.1
Regarding bank restructuring and reorganiza-
tion, can the supervisory agency insure liabili-ties beyond any explicit deposit insurance
scheme?
A score of 0 was assigned for No and 1 for Yes. 0.25 0.04 0.20
Variables Included in PCA of Deposit’s Insurer Power
8.1.10 Does the deposit insurance authority make the
decision to intervene a bank? A score of 0 was assigned for No and 1 for Yes. 0.44 0.22 0.41
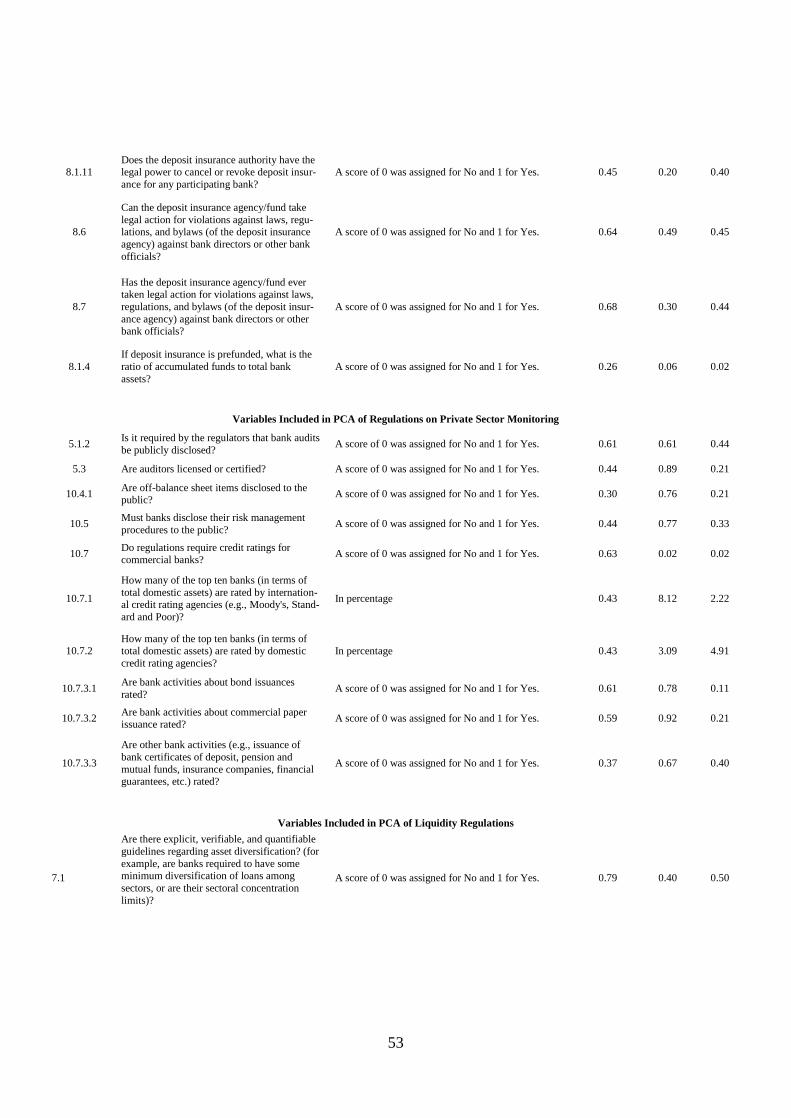
53
8.1.11 Does the deposit insurance authority have the legal power to cancel or revoke deposit insur-
ance for any participating bank?
A score of 0 was assigned for No and 1 for Yes. 0.45 0.20 0.40
8.6
Can the deposit insurance agency/fund take
legal action for violations against laws, regu-lations, and bylaws (of the deposit insurance
agency) against bank directors or other bank
officials?
A score of 0 was assigned for No and 1 for Yes. 0.64 0.49 0.45
8.7
Has the deposit insurance agency/fund ever taken legal action for violations against laws,
regulations, and bylaws (of the deposit insur-
ance agency) against bank directors or other bank officials?
A score of 0 was assigned for No and 1 for Yes. 0.68 0.30 0.44
8.1.4
If deposit insurance is prefunded, what is the
ratio of accumulated funds to total bank
assets?
A score of 0 was assigned for No and 1 for Yes. 0.26 0.06 0.02
Variables Included in PCA of Regulations on Private Sector Monitoring
5.1.2 Is it required by the regulators that bank audits
be publicly disclosed? A score of 0 was assigned for No and 1 for Yes. 0.61 0.61 0.44
5.3 Are auditors licensed or certified? A score of 0 was assigned for No and 1 for Yes. 0.44 0.89 0.21
10.4.1 Are off-balance sheet items disclosed to the public?
A score of 0 was assigned for No and 1 for Yes. 0.30 0.76 0.21
10.5 Must banks disclose their risk management
procedures to the public? A score of 0 was assigned for No and 1 for Yes. 0.44 0.77 0.33
10.7 Do regulations require credit ratings for commercial banks?
A score of 0 was assigned for No and 1 for Yes. 0.63 0.02 0.02
10.7.1
How many of the top ten banks (in terms of
total domestic assets) are rated by internation-al credit rating agencies (e.g., Moody's, Stand-
ard and Poor)?
In percentage 0.43 8.12 2.22
10.7.2 How many of the top ten banks (in terms of total domestic assets) are rated by domestic
credit rating agencies?
In percentage 0.43 3.09 4.91
10.7.3.1 Are bank activities about bond issuances
rated? A score of 0 was assigned for No and 1 for Yes. 0.61 0.78 0.11
10.7.3.2 Are bank activities about commercial paper issuance rated?
A score of 0 was assigned for No and 1 for Yes. 0.59 0.92 0.21
10.7.3.3
Are other bank activities (e.g., issuance of
bank certificates of deposit, pension and
mutual funds, insurance companies, financial guarantees, etc.) rated?
A score of 0 was assigned for No and 1 for Yes. 0.37 0.67 0.40
Variables Included in PCA of Liquidity Regulations
7.1
Are there explicit, verifiable, and quantifiable
guidelines regarding asset diversification? (for
example, are banks required to have some minimum diversification of loans among
sectors, or are their sectoral concentration
limits)?
A score of 0 was assigned for No and 1 for Yes. 0.79 0.40 0.50
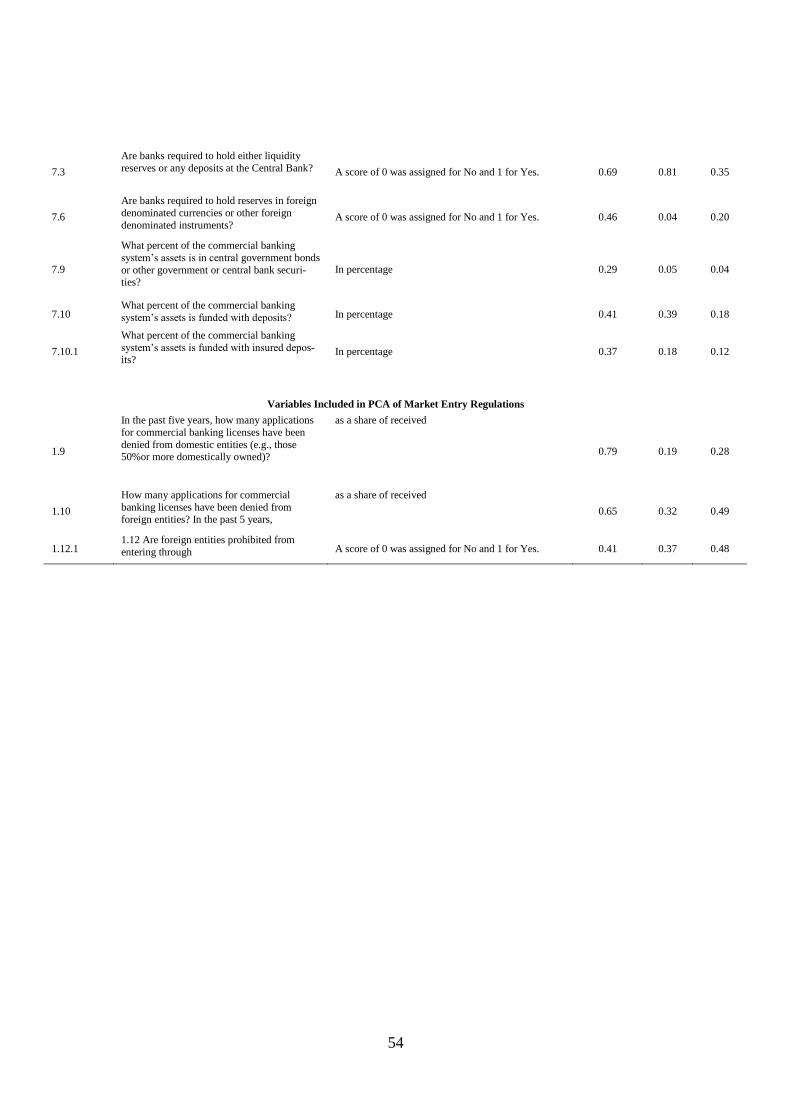
54
7.3
Are banks required to hold either liquidity
reserves or any deposits at the Central Bank? A score of 0 was assigned for No and 1 for Yes. 0.69 0.81 0.35
7.6
Are banks required to hold reserves in foreign
denominated currencies or other foreign
denominated instruments? A score of 0 was assigned for No and 1 for Yes. 0.46 0.04 0.20
7.9
What percent of the commercial banking
system’s assets is in central government bonds
or other government or central bank securi-ties?
In percentage 0.29 0.05 0.04
7.10 What percent of the commercial banking
system’s assets is funded with deposits? In percentage 0.41 0.39 0.18
7.10.1
What percent of the commercial banking
system’s assets is funded with insured depos-its?
In percentage 0.37 0.18 0.12
Variables Included in PCA of Market Entry Regulations
1.9
In the past five years, how many applications
for commercial banking licenses have been
denied from domestic entities (e.g., those 50%or more domestically owned)?
as a share of received
0.79 0.19 0.28
1.10
How many applications for commercial
banking licenses have been denied from foreign entities? In the past 5 years,
as a share of received
0.65 0.32 0.49
1.12.1 1.12 Are foreign entities prohibited from
entering through A score of 0 was assigned for No and 1 for Yes. 0.41 0.37 0.48
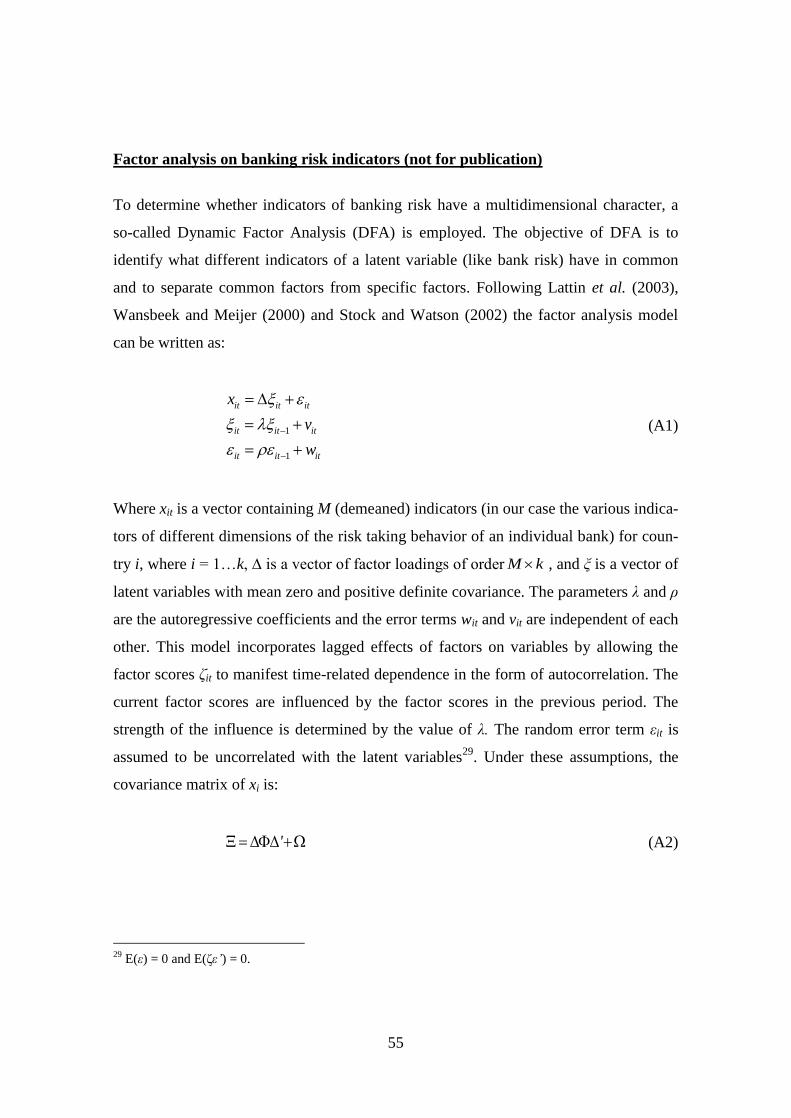
55
Factor analysis on banking risk indicators (not for publication)
To determine whether indicators of banking risk have a multidimensional character, a
so-called Dynamic Factor Analysis (DFA) is employed. The objective of DFA is to
identify what different indicators of a latent variable (like bank risk) have in common
and to separate common factors from specific factors. Following Lattin et al. (2003),
Wansbeek and Meijer (2000) and Stock and Watson (2002) the factor analysis model
can be written as:
1
1
it it it
it it it
it it it
x
v
w
(A1)
Where xit is a vector containing M (demeaned) indicators (in our case the various indica-
tors of different dimensions of the risk taking behavior of an individual bank) for coun-
try i, where i = 1…k, ∆ is a vector of factor loadings of orderM k , and ξ is a vector of
latent variables with mean zero and positive definite covariance. The parameters λ and ρ
are the autoregressive coefficients and the error terms wit and vit are independent of each
other. This model incorporates lagged effects of factors on variables by allowing the
factor scores ζit to manifest time-related dependence in the form of autocorrelation. The
current factor scores are influenced by the factor scores in the previous period. The
strength of the influence is determined by the value of λ. The random error term εit is
assumed to be uncorrelated with the latent variables29
. Under these assumptions, the
covariance matrix of xi is:
' (A2)
29
E(ε) = 0 and E(ζε’) = 0.

56
Where Ξ is the parameterized covariance matrix that can be decomposed in the covari-
ance matrix of the factors Φ and the diagonal covariance matrix of error terms Ω. The
model is estimated by the Maximum Likelihood (ML). The log-likelihood function can
be written as:
(A3)
Where S represents the sample covariance matrix. Minimizing this fit function means
choosing the values for the unknown parameters that lead to the implied covariance
matrix as close as possible to the sample covariance matrix.
The next step is to decide on the number of factors to represent banking risk. In
general, there are three ways of interpreting this graph. First, one can use information
criteria such as the Bai and Ng (2002) information criteria. An alternative is to look for
an ‘elbow’ in the scree plot, i.e., the point after which the remaining factors decline in
approximately a linear fashion, and to retain only the factors above the elbow. The scree
plot graphs the number of factors against the eigenvalues of the covariance matrix of the
indicators. Finally, the Kaiser criterion can be used according to which all factors with
eigenvalues below one should be dropped.
Having optimized the likelihood function, it is possible that the factors of the
(standardized) solution of the model are difficult to interpret. In that case, we can make
use of the fact that the distribution of the indicators depends on the factor loadings Δ,
only through ΔΦΔ’ and hence the matrix of factor loadings is not identified. That is, it
can be multiplied with any orthonormal matrix without affecting the distribution of the
indicators. Meaning, the factor loadings can be rotated so that a solution results that
may be easier to interpret because the matrix has a simpler structure. We use the Obli-
min rotation, which allows for correlation among the factors and minimizes the correla-
tion of the columns of the factor loadings matrix. We used oblique rotation (instead of
e.g. varimax rotation), because it does not arbitrarily constrain the factor rotation to an
orthogonal solution. The oblimin rotation identifies the extent to which each of the fac-
1StrlnLln

57
tors is correlated to each other. As a result, a typical indicator will have high factor
loadings on one factor, while it has low loadings on the other factors.
All indicators receive factor scores for the various dimensions (factors) identi-
fied. These factor scores are used to come up with the so-called Bartlett predictor, i.e.,
the best linear unbiased predictor of the factor scores:
1 1 1ˆ ( ' ) 'i ix (A4)
These factor scores can then be used as our indicator of bank risk.