Embed Size (px)
Citation preview
GLOBAL JOURNAL OF BUSINESS RESEARCH ♦ VOLUME 7 ♦ NUMBER 3 ♦ 2013
31
BANK RECAPITALIZATION AND MARKET CONCENTRATION IN GHANA’S BANKING
INDUSTRY: A HERFINDAHL-HIRSCHMAN INDEX ANALYSIS
Samuel Yaw Akomea, Kwame Nkrumah University of Science and Technology, Ghana Michael Adusei, Kwame Nkrumah University of Science and Technology, Ghana
ABSTRACT
Using Concentration Ratio and Herfindahl-Hirschman Index techniques, the paper investigates the concentration levels of the banking industry in Ghana and forecasts the future concentration levels of the industry should consolidations triggered by the new bank recapitalization policy occur in the industry. The study finds that the HHI indices provide evidence for the contention that for the past eight years the banking industry in Ghana has been highly competitive with no signs of concentration. Evidence also exists to underpin the conclusion that any consolidation of four banks or less stimulated by the new bank recapitalization policy will not upset the existing market concentration. However, consolidation of five or more banks will culminate in high concentration which will be inimical to the interest of customers. The paper, therefore, recommends that, all things being equal, policy makers should permit consolidation of four or less banks if that is the only way the banks will meet the new bank recapitalization requirement. JEL: D40, D41, E02, G21 KEYWORDS: Banking, Market Concentration, Herfindahl-Hirschman Index, Ghana INTRODUCTION
riven, ostensibly, by the desire to promote prudent management of banks in Ghana, the Bank of Ghana introduced a bank recapitalization policy in 2007. In this policy, universal banks operating in Ghana were required to recapitalize from GH¢ 7 million to GH¢ 60 million (approximately
US$ 60 million at the time) by the end of 2012. Two roadmaps were set for the implementation of this new policy. All majority locally-owned banks were given up to December, 31, 2010 to achieve minimum capitalization of GH¢ 25 million, and December, 31, 2012 to recapitalize fully. Foreign banks that pre-dated the policy were given up to 31st December, 2009 to recapitalize whilst banks that were licensed after the announcement of the policy had to start with the new capitalization. All foreign banks that existed before the policy have since met their obligations at the completion point in 2009. However, indications are that their indigenous counterparts are still struggling to meet the target. What seems plausible to conjecture is that some of these may have to consolidate to keep themselves in the industry. This conjecture is premised on the precedents obtainable from similar exercises that took place in other jurisdictions. After the Asian crises, Malaysia undertook recapitalization in its banking sector whereby about 80 banks shrunk to about 12 within two years. South African experience is also available for reference. A similar policy stimulated bank consolidations in South Africa in 2003 which led to a reduction in the number of banks in South Africa (Akomea, 2009). Nigerian experience obviously lends more credence to prediction of bank consolidations in Ghana. In the Nigerian situation, out of 89 banks that were in existence before the recapitalization exercise in 2004, 14 lost their licenses and the rest consolidated through mergers and acquisitions into 25 banks by the end of 2005 (Ezeoha, 2011).
D

S. Y. Akomea & M. Adusei | GJBR ♦ Vol. 7 ♦ No. 3 ♦ 2013
32
Bank consolidations bring in their wake some structural changes with concomitant advantages and disadvantages. Between 1975 and 1997, the U.S banking industry experienced significant structural changes as a result of intense process of consolidation (mergers).The number of commercial banks decreased about 35% from 14,318 to 9, 215 (Cetorelli, 2000). Consolidation leads to larger banks and that could change the relationship between banks and their retail customers (Akomea, 2009). Evidence from the United States suggests that larger banks charge higher fees and pay less interest on deposits. They also make fewer loans available to small businesses than the smaller banks they take over from (Dymski, 1999). Studies on bank consolidation and consequences abound in many countries. In Nigeria, for instance, many studies have been undertaken on bank consolidation and consequences (Somoye, 2008; Ezeoha, 2011). However, in Ghana whereas many studies have been undertaken on banking in Ghana (Aboagye-Debrah, 2007; Abor, and Biekpe, 2007; Aryeetey, 1996; Gockel, 1998; Hinson et al., 2009; Korsah et al., 2001; Adusei, 2011; Adusei, 2012) to the best knowledge of the authors, none of these copious studies addresses the competitive environment of banks and the possible effect of bank consolidations on the competitive environment of banks in Ghana. Filling this knowledge gap constitutes the focus of this study. The paper seeks to answer two questions: (1) Is the banking industry in Ghana competitive? (2) Should bank consolidations occur as a result of the new bank recapitalization policy to what extent will they impact the competitive environment of Ghana’s banking industry? An important question of measuring competition is the definition of the relevant market of competitors (Lijesen, et al, 2002). For instance, banks, non-bank financial institutions, rural banks, pension funds and insurance firms belong to the large sector called financial institutions; yet, it will be an exercise in futility to measure the competition among them. The economic concept of a market is stated in terms of the behavior of buyers and sellers. Two products belong to the same market if a small change in price (or product) causes a significant diversion in a relatively short time of the buyers” purchases or the sellers’ production from one product to another” (Kaysen and Turner, 1959). In order to measure competition, this paper narrows its reference of banks to mean universal banks in Ghana. The rest of the paper is structured as follows. The next section reviews the relevant literature on bank consolidation, concentration and market power. This is followed by the historical background of banking in Ghana. The third section presents data and methodology of the study. The results section follows. The final section presents the concluding comments of the study highlighting on implications of the findings for banks, shareholders, investors, and consumers as well as the limitations of the study. LITERATURE REVIEW Industry Competition Firms buy resources necessary to implement their strategies (Hirshleifer, 1980; Porter, 1980). Mergers and acquisitions provide an opportunity to trade otherwise non-marketable resources and to buy or sell resources in bundles. Through this vehicle, one can for example buy an image or a set of technological capabilities and contacts in a given set of market (Wernerfelt, 1997). Horizontal merger among a subset of firms in the same market may reduce competition by reducing the number of firms and increasing concentration. One possible advantage of bank mergers is the exploitation of potential economies of scale or scope. For instance a bank interested in pursuing low cost will acquire another bank with a higher market share; likewise a bank pursuing differentiation will acquire a bank with sound reputation or one that has differentiated products. There are varieties of stakeholders in merging companies who have interests in the success of mergers. Shareholders and managers are two most important stakeholders but others include; employees, consumers, local communities and the economy at large (Sudarsanam, 2004). The possible improvements in efficiency may translate into welfare gains for the economy to the extent that customers pay lower prices for bank’s services or are able to obtain higher quality services or services that could not have been offered before. If the merged firm can lower costs by re-allocating

GLOBAL JOURNAL OF BUSINESS RESEARCH ♦ VOLUME 7 ♦ NUMBER 3 ♦ 2013
33
production, the incentive to merge is reinforced. The concern is that such a change in structure increases market power and adversely affects market performance (Levin, 1990). Market power is commonly defined as the ability to profitably charge prices above the competitive level for a significant period of time. This economic definition is equivalent to the European concept of significant market power (SMP), which a firm is deemed to possess “if, either individually or jointly with others, it enjoys a position equivalent to dominance, that is to say a position of economic strength affording it the power to behave to an appreciable extent independently of competitors, customers and ultimately consumers (Hausman and Sidak, 2007). In higher number of cases, mergers are triggered by market forces and strategic initiatives. In a regulatory regime, banks that do not meet the minimum recapitalization are considered as failing banks (Shih, 2003). Whereas studies on the outcomes of market-induced consolidation are very common for both developed and developing economies, regulation-induced mergers are still very scanty (Ezeoha, 2011). In the instance situation of the Ghana’s banking industry, banks may not be willing to merge with others, they have no strategic factor demands, they want to remain small and serve their niche markets; but regulators insists they grow or face uncertain future (Akomea, 2009). In reviewing the Nigerian consolidation failures, Ezeoha (2011), laments that a high degree of process interference normally results from the fusion of very dichotomous entities. It is therefore possible that reform-induced consolidation might be incapable of resolving the prevalence of bank distress and failure in developing economies. Market Concentration Indices Market concentration refers to the number of firms that account for the total production within a given industry; sometimes referred to as industrial concentration (Tirole, 1988). The idea is to identify how many firms account for the majority of the product that is produced within a given market, and whether there is room for new firms to compete within that market. Market concentration measures are also referred to as competition measures. A basic feature associated with the definition of concentration indices is that they incorporate two relevant aspects of industry structure, namely, size inequalities and the number of firms. Essentially, a finding of collective dominance must be based on a number of criteria, such as the existence of a mature market, stagnant or moderate growth on the demand side, low elasticity of demand, homogeneous products, similar cost structures, similar market shares, lack of technological innovation, mature technology, absence of excess capacity, high barriers to entry, lack of countervailing buying power, lack of potential competition, various kinds of informal or other links between the undertakings concerned, and retaliatory mechanisms (Hausman and Sidak, 2007). Industrial concentration is necessary for investors, consumers and regulators. To the investor, the level of concentration means quite a lot since it determines the entry barrier, turbulence, or price mechanism of the market. In simplistic approach, industrial concentration can be achieved by practically counting competitors in the industry. However the drawback of this approach is that it does not take into account the individual strengths of the firms (Lijesen, et al, 2002). Concentration indices are traditional instruments within the industrial organization literature employed to provide a synthetic measure of market structure, as well as to evaluate the existing degree of competition in particular industries (Tirole, 1988). Three major measures that are internationally recognized in measuring absolute industrial concentration indices are the Herfindahl-Hirschman Index, Concentration Ratio, and the Hannah-Kay Index. However, ever since the U.S. Department of Justice adopted the Herfindahl-Hirschman Index as part of its merger guidelines, the use of Hannah-Kay has been rare. Also in few situations, some researchers have used Lerner Index (for market power), Gini coefficient, alongside Lorenz curve to measure market concentration (Korsah et al, 2001). This study, however, limits itself to concentration ratio and Herfindahl-Hirschman Index.

S. Y. Akomea & M. Adusei | GJBR ♦ Vol. 7 ♦ No. 3 ♦ 2013
34
One of the early indicators taking market concentration into account is the Concentration Ratio which is defined as the sum of market shares of the largest markets in the industry (Lijesen, et al, 2002). With that broad definition come CR4, CR8, and CR10 etc of which CR4 is widely in use. Concentration ratio is mathematically stated as: 𝐶𝑅𝑚 = ∑ 𝑆𝑖𝑚
1=1 (1) In simplistic terms, CRm = S1 + S2 + .... + sm where Si is the market share and m defines the ith firm. Total concentration is usually set at 100%. This measure has been in use for major industrial policies until 1982. In general, if the CR4 measure is less than 50 (indicating that the four largest firms own less than 50% of the market), then the industry is considered to be very competitive, with a number of other firms competing, but none owning a very large chunk of the market. On the other extreme, if the CR1 measure is 90, then one firm controls about 90% of the market and that is effectively, a monopoly. The main problem with this indicator is the arbitrary character of its cut-off point (Lijesen, et al, 2002). Whereas in some industries the players are so many that the largest four may not make any relevant impact unless you take largest six or eight, in other industries the largest two firms may be more relevant than four or more. Other shortfalls occur in situations where the other market shares beyond the largest four may be too significant to be left out in decision making. Herfindahl-Hirschman Index (HHI) The Herfindahl-Hirschman Index (HHI) has gained prominence in the industrial organization discipline ever since it was adopted by the U.S. Department of Justice in 1982 as the primary market concentration guide (Levin, 1990). The index was developed independently by A. O. Hirschman (in 1945) and O. C. Herfindahl (in 1950). The HHI which sums the squared market shares of firms in the relevant market is based on the Cournot model (Lijesen, et al, 2002). The HHI takes into account the relative size and distribution of the firms in a market and approaches zero when a market consists of a large number of firms of relatively equal size. The HHI increases both as the number of firms in the market decreases and as the disparity in size between those firms increases. The major advantage of HHI over the Concentration Ratio is the inclusion of all actors in the market for analysis. The study will use the formula for HHI, denoted by the equation: 𝐻𝐻𝐼 = ∑ (𝑀𝑆𝑖)2𝑛
𝑖=1 (2) where MSi represents the market share of firm i and there are n firms in the market. The U.S Department of Justice: In the U.S., the Department of Justice (DoJ) officially adopted this measure of concentration in 1982. This practise has since been followed by several regulatory bodies such as Federal Trade Commission (FTC), Federal Reserve Board (banking), federal Energy Regulatory Commission (electricity), and the Department of Transport (aviation) (Lijesen, et al, 2002). In 1992, guidelines as applied to banking specified that if a bank merger would result (1) in a post-merger HHI in a market of less than 1800, or (2) in a change in HHI of less than 200, it is likely that the market structure would not reach a concentration level. However, any index beyond 1800 will be questioned (White, 1987). In 2010, new guidelines with increased thresholds have been published by the DoJ and FTC in respect of banking. In the new threshold, The U.S. DoJ considers a market with an index of less than 1,500 to be a relatively unconcentrated market or a competitive marketplace, and will not challenge any merger that will eventually fall within that range. A market with HHI between 1,500 and 2,500 is seen to be moderately concentrated whilst a market with HHI which is greater than 2500 is seen to be a concentrated market. However, if the market already has an index between 1500 and 2500, the change in post-merger HHI should not exceed 100 and 200 respectively. Antitrust actions are likely to be brought against firms that perpetuate such mergers. In such situations, DoJ authorities sometimes require that

GLOBAL JOURNAL OF BUSINESS RESEARCH ♦ VOLUME 7 ♦ NUMBER 3 ♦ 2013
35
firms to divest some of their assets to rivals through auction or tackle the merger on regional basis in order to allow the residual firm to have a lower index. The U.S. DoJ closely evaluates the competitive impact of each merger within the moderately concentrated and highly concentrated markets and will challenge those they see as anti-competitive. The fundamental objective is to avoid or reduce the creation of market powers. BANKING IN GHANA Ghana, as an independent country in 1957 inherited two imperial banks and a local bank, namely; Bank of British West Africa (1896), (now Standard Chartered Bank), Colonial Bank (1917) (now Barclays Bank), and the Bank of Gold Coast (1953) which also doubled as the Central Bank. The latter was primarily established to serve as a commercial bank for indigenous traders and farmers. At independence, the Bank of Gold Coast was split into two: Bank of Ghana and Ghana Commercial Bank. Reflections on Ghana’s banking sector in this paper will be organized into three broad eras, Pre-FINSAP Era (1957-1987), Financial Sector Adjustment Programme (FINSAP) Era (1985-1999), and Post-FINSAP Era (2000-date) Pre Financial Sector Adjustment Programme (FINSAP) Ghana’s economic development after attaining independence followed the centrally planned approach (Mensah, 1997) Government’s industrialization efforts came with the import substitution policy that led to the establishment of many state-owned enterprises (SOEs) between 1957 and 1965. The Ghana Industrial Holding Corporation (GIHOC) was a dominant brand in government economic activities. Production orientation was the order of the day. In order to support the numerous developments that sprang up after independence, specialized banks were established with specific mandates. The objectives of these banks were tailored to meet the financial needs of specific sectors of the economy (Aryeetey, 1996). For instance, to strengthen industrialization, agriculture, commerce, and construction, banks such as National Investment Bank, Agricultural Development Bank, Merchant Bank and Bank for Housing and Construction (liquidated in 2000), respectively, were created in 1960s and 1970s. In 1972, the state also acquired (40%) shares in the expatriate banks: Barclays and Standard Banks. Prior to 1988, each of the 10 banks operating in Ghana had some level of state shareholding, mainly wholly-owned: except the expatriate banks where the state had minority shareholding. Aryeetey (1996) describes the situation ‘as absence of a relatively high level of competition’. During the period, the banks remained conservative and innovations were non-existent as a result of lack of due diligence in loan approvals, unbridled political interference, corruption, and weak legal and regulatory framework, the banks piled up huge debts with their balance sheets showing high levels of non-performing assets (Aboagye-Debrah, 2007). Bank opening hours to the public was a maximum of 6 hours a day and average waiting time for banking service was about 45 minutes (Akomea, 2009). By mid 1980s, as part of the Economic Recovery Programme, the IMF recommended that the financial sector in Ghana be revamped. Financial Sector Adjustment Programme became the antidote prescribed. Financial Sector Adjustment Programme (FINSAP) The banking industry has undergone much transformation since the Financial Sector Reforms in the late 1980s. The banking system before the reforms was characterized by state-owned banks that had been set up with narrow objectives: development, investment and commercial. The reform package initially focused on issues of credit allocation, the efficiency of banking operations, the Bank of Ghana's supervision of the commercial banks and the development of capital markets (Aryeetey, 1996). As a result of the defined compartmentalization of bank markets, competition was not existent; each bank had to focus on the reason why it was set up and could not take advantage of other opportunities in the marketplace since they were monopolistic in nature. Three major factors impacted the state of banking. First, as part of the FINSAP, the Central Bank through various enactments strengthened its supervisory

S. Y. Akomea & M. Adusei | GJBR ♦ Vol. 7 ♦ No. 3 ♦ 2013
36
and regulatory responsibilities. What was important was the realization that the Central Bank applied the regulations objectively on both state-owned and private banks. Second, the deregulation of the sector saw the licensing of local and foreign banks (private sector participation) that brought about new life into banking in Ghana. Third, the liberalization of the economy and growth of FDIs as a result of political stability saw major private sector participation in the economy leading to vibrant banking activities of all types. Post-FINSAP By the year 2000, Ghana had only 17 banks and the banking environment was somewhat relaxed for the larger banks whilst the smaller banks licensed in the 1990s gradually captured progressive market shares though insignificantly. In February 2003, the Central Bank formally introduced the Universal Banking Business License (UBBL) which brought more competition within the industry. Under the universal banking license, existing banks were to have minimum net worth of ¢70 billion (GH¢ 7 million). Banks were required to hold 9% of the cedi and forex deposit base with Bank of Ghana on daily basis as primary reserves and 35% (later reduced to 51%) of their deposit base in cedi denominated assets as secondary reserves. In 2005, the Banking Act, 2004 (Act 673) was promulgated and brought with it major managerial and accountability clauses in line with the Basel Accords. Also in 2005, Zenith Bank and Standard Trust Bank (now United Bank for Africa), both Nigerian Banks were granted universal licenses by Bank of Ghana. Again in August, 2005, the Central bank abolished the secondary reserves requirement of banks. In 2006, three more Banks (two Nigerian and one Ghanaian) were licensed by the Central Bank, namely; Guaranty Trust Bank, Intercontinental Bank, and Fidelity Bank; a total of five new banks in two years. Major gains for customers included the move towards technology in the mid-1990s. For instance, the use of computers in banking was pioneered by the expatriate banks. ATM services started slowly and later became the order of the day. Bank working hours were extended as a result of competition. Loan approval waiting time was reduced to a record time of 48 hours from average of four months. By 2006, the risk of transferring bulk money to the banks had become a major issue with banks acquiring or engaging the services of bullion vans for that sole purpose. The problem was however solved with the successful denomination of the local currency the “Cedi” to “Ghana Cedi” in July 2007. Four other banks have been licensed since 2006; Sahel-Sahara Bank, and Bank of Baroda, both in 2008; Access Bank (2009) and Energy Bank (2011). Table 1 traces the evolution of banking activities in Ghana since 1896. The table also gives a summary of existing and defunct banks in the history of banking in Ghana. DATA AND METHODOLOGY The paper uses secondary data sources from the Ghana Banking Survey Reports covering 2003-2010. The annual surveys are conducted by PricewaterhouseCoopers in collaboration with Ghana Association of Bankers. According to the Consultants who undertook the survey, they analyzed the annual reports and audited financial statements of the banks in calculating the respective market shares. Therefore, to the extent of the correctness of these audited accounts and no claim to the contrary as the unreliability of the published report, the statistics can be deemed credible. The market shares of banks in this paper are based on share of industry deposits and share of industry net advances. These are common parameters used by many financial marketing studies. The survey covered 25 out of the 26 banks that existed at the time of the survey. However, NIB did not take part in recent years making it possible for some market shares to be adjusted by few decimal points. The study therefore approximates its accuracy to be about 98%.

GLOBAL JOURNAL OF BUSINESS RESEARCH ♦ VOLUME 7 ♦ NUMBER 3 ♦ 2013
37
Table 1: Evolution of Banks in Ghana
Bank Acronym Year Origin Historical Remarks
1 Standard Chartered Bank SCB 1896 U.K. British Bank of West Africa, Later Standard Bank, in 1972, Government acquired 40% shares till 2003.
2 Barclays Bank BBG 1917 U.K. Colonial Bank, in 1972, Government acquired 40%
shares till 2003 3 Ghana Commercial Bank GCB 1953 Ghana Bank of Gold Coast, (Commercial and Central Bank
functions until 1957 4 National Investment Bank NIB 1963 Ghana 5 Agricultural Development Bank ADB 1965 Ghana 6 Merchant Bank MBG 1972 Ghana 7 Bank for Housing and
Construction** BHC 1972 Ghana Officially liquidated in 2000
8 National Savings and Credit Bank**
NSCB 1977 Ghana Originally Post Office Savings Bank, Absorbed by SSB in 1994
9 SG-SSB Bank SSB 1977 France Originally Social Security Bank, acquired by SG from France in 1995.
10 Co-operative Bank** CO-OP 1977 Ghana Officially liquidated in 2000 11 ECOBANK EBG 1990 Togo Transnational Bank with shareholding across West
Africa. Major shareholders in Nigeria. 12 CALBANK CAL 1990 Ghana Originally Continental Acceptances 13 Bank for Credit and
Commerce** BCCI 1991 Pakistan Officially liquidated in 2000
14 Prudential Bank PBL 1996 Ghana 15 UT Bank UTB 1995 Ghana Metropolitan and Allied Bank and later acquired by
BPI Malaysia. 16 First Atlantic Merchant Bank FAMB 1995 Ghana 17 The Trust Bank TTB 1994 Ghana Meridian BIAO 18 Amalgamated Bank ABL 1996 Mali 19 International Commercial Bank ICB 1996 Malaysi
a
20 Unibank UGL 1997 Ghana 21 Stanbic Bank SBG 1999 S. Africa An investment wing of Standard Bank in South
Africa, the original parent bank of Standard Chartered Bank.
22 HFC Bank HFC 2003 Ghana Offshoot of Home Finance Company, (Mortgage Financing ) established in 1994
23 United Bank for Africa UBA 2005 Nigeria Entered Ghana as Standard Trust Bank, later parent bank was acquired. Introduced the first cashless account.
24 Zenith Bank ZBL 2005 Nigeria 25 Guaranty Trust Bank GTB 2006 Nigeria 26 Intercontinental Bank IBG 2006 Nigeria 27 Fidelity Bank FBL 2006 Ghana Offshoot of the Fidelity Group, (Investment and
Securities) established in 1998. 28 Bank of Baroda BBL 2008 India 29 Sahel Sahara Bank BSIC 2008 Libya 30 Access Bank ABG 2009 Nigeria 31 Energy Bank EBL 2011 Nigeria
** No longer operational (see historical remarks) This table chronicles when each of the universal banks entered the market as well as each bank’s country-of-origin. There is a remarks column for important landmarks along the developmental path of some banks. In order to establish the current competition in the banking industry, the 2010 market shares (latest available) serve as inputs to calculate the market concentration of universal banks in Ghana. The HHI is calculated of each year is calculated according to the number of banks. Since Ghana has no specific guidelines and regulations regarding mergers and acquisitions, conclusions in this paper are drawn using international acceptable standards (the 1992 guidelines established by the United States DoJ). The HHI is calculated from 2003 to 2010. It would have been ideal to calculate a ten- year period but the reliable data obtained from the survey started in 2003. In order to forecast the concentration levels in the industry after possible mergers, various scenarios of consolidations have been created.

S. Y. Akomea & M. Adusei | GJBR ♦ Vol. 7 ♦ No. 3 ♦ 2013
38
RESULTS Even though the Security Exchange Commission (SEC) has the mandate of regulating mergers and acquisitions in public listed companies in Ghana, not much legal framework has been developed to guide businesses in terms of consolidations matters outside the domain of SEC. Securities Industry Law, 1993, (P.N.D.C. Law 333) and Security Exchange Act, 2000, (Act 590), do not provide enough guidelines in mergers and acquisitions in Ghana. Past consolidation of Guinness Ghana Limited and Ghana Breweries Company which culminated in a duopoly, points to the fact that every consolidation is acceptable in Ghana. It is commonplace knowledge that market economies frown on monopolies and blatant oligopolies in certain sectors of the economy. However, the legal system in Ghana seems ambivalent on these. Table 2 depicts raw percentage market shares of industry deposits and net advances from 2003 to 2010 (Ghana Banking Survey, 2011); the basis for calculation of the HH indices. Table 2: Share of Industry Deposits and Net Advances of Universal Banks (2003 -2010)
2010 2009 2008 2007 2006 2005 2004 2003 BAN
K D L D
L D L D
L D L
D D L
D L D L
1 GCB
13.1 15.0 13.3 21.7 14.8 20.1
15.9 19.1 17.5 15.9 18.4
16.2 20.1 18.6
19.4 19.7
2 BBG
10.6 6.5 12.1 8.8 15.7 13.3
18.2 16.5 15.1 15.8 16.3
17.3 16.5 18.3
17.7 18.0
3 EBG 9.9 7.4 10.5 7.7 8.8 7.3 8.3 7.4 8.7 7.0 9.3 7.3 8.5 6.1 7.7 7.0 4
SCB 9.1 7.0
8.9 7.0 9.9 8.5 10.
3 7.4 12.9 10.4 14.5 13.
7 16.2 14.5 17.
6 15.9 5 SBG 6.0 5.1 6.2 4.5 4.9 4.5 4.7 5.0 2.9 3.1 2.5 1.6 3.0 2.3 1.8 1.2 6 MBG 5.4 3.4 5.4 5.8 4.2 5.7 5.7 7.6 6.1 9.5 5.5 7.2 5.1 5.7 4.9 4.1 7 ZBL 4.6 4.0 4.9 3.2 4.4 2.5 2.5 1.7 1.5 0.6 0.2 0.2 0 0 0 0 8 ADB 4.4 8.6 4.5 6.4 4.2 6.8 4.8 5.7 6.5 6.6 7.1 8.0 7.5 7.5 9.2 9.7 9 SSB 4.1 4.5 4.1 5.1 3.9 5.3 4.9 5.5 6.5 6.2 7.0 7.8 7.4 6.6 7.7 8.4 10 IBG 3.4 4.1 3.5 3.6 3.5 3.2 1.5 0.9 0.3 0.3 0 0 0 0 0 0 11 ABL 3.1 2.8 3.2 2.8 3.4 2.2 2.2 1.9 1.5 0.8 1.1 0.7 1.2 0.7 0.9 0.5 12 FBL 4.5 3.2 3.1 3.0 2.1 1.6 2.3 0.9 1.8 0.1 0 0 0 0 0 0 13 CBL 2.4 3.8 2.9 3.7 2.3 3.5 2.2 2.9 2.4 3.7 2.4 2.5 2.6 2.7 2.3 2.5 14 PBL 2.8 3.4 2.7 3.2 2.6 2.9 3.2 3.0 2.9 3.9 2.8 3.0 2.4 2.6 1.9 1.5 15 FAM 1.2 1.5 2.7 1.5 4.4 3.2 1.8 1.8 1.6 2.4 1.7 2.5 1.2 1.9 1.3 1.8 16 TTB 2.3 3.9 2.4 3.0 2.3 3.0 2.7 2.9 2.6 3.0 2.9 2.8 3.1 2.0 2.7 2.0 17 UBA 2.6 1.3 2.1 0.8 2.5 0.7 0 0 0.1 0.1 0 0 0 0 0 0 18 UGL 2.7 3.3 2.0 1.9 1.2 1.2 1.0 1.0 0.7 0.7 0.6 0.6 0.5 0.4 0.5 0.3 19 GTB 2.4 2.1 1.9 1.8 2.1 0.8 0.6 0.3 0.3 0 0 0 0 0 0 0 20 HFC 1.5 2.7 1.5 2.7 1.4 2.6 1.5 2.6 1.5 2.9 1.1 1.9 0.8 2.0 0.6 2.4 21 ICB 0.9 0.7 0.9 0.6 1.0 0.6 1.1 0.6 1.4 0.7 1.4 0.6 1.2 0.7 1.0 0.4 22 UTB 1.5 4.7 0.9 0.8 0.3 0.5 0.3 0.3 0.5 0.3 0.5 0.4 0.6 0.4 0.7 0.4 23 ABG 0.8 0.3 0.1 0.2 0 0 0 0 0 0 0 0 0 0 0 0 24 BSIC 0.4 0.4 0.1 0.1 0.1 0 0 0 0 0 0 0 0 0 0 0 25 BBL 0.3 0.1 0.1 0.1 0 0 0 0 0 0.0 0.0 0.0 0.0 0.0 0.0 0.0 26 NIB 0 0 0 0 0 0 4.3 5.0 4.7 6.0 4.7 5.7 2.1 7.0 2.1 4.2 Total
% 100 100 100
10 100
00%1 100 100 100
100 100 100 100 100 100 100 100
100 100
D: Deposits, L: Net Advances (Loans) Source: Ghana Banking Survey, 2004-2011 This table displays the raw percentage market shares of existing universal banks in Ghana in terms of deposits and net advances from 2003-2010. The data have been compiled from year by year releases of the Ghana Banking Survey. From Table 2, the share of industry deposits reveals that the smaller banks are capturing market share from the market leaders. For instance, in 2007 and 2008, BBG, the then market leader had market share of 18.2% and 15.7% respectively but in 2009, it placed second to GCB with a market share of 12.1% and further decline to 10.6% in 2010; signifying significant reduction in four years. GCB, between 2003 and 2010 consistently lost an average of 1.5 points of its market share for deposits annually. Much as it is normal in industrial organizations for market shares to shrink as more firms enter the industry, with the resources at the disposal of GCB, BBG and SCB, the worst expected of these banks was status quo. The

GLOBAL JOURNAL OF BUSINESS RESEARCH ♦ VOLUME 7 ♦ NUMBER 3 ♦ 2013
39
fact that the leading banks are losing market shares consistently suggest that competition in the banking environment can be aggressive in the near future. Some existing smaller banks are also losing grounds and in some instances others have managed undulating performances. At the time top banks have been losing market shares, new entrants like ZBL, SBG, IBG, FBL, GTB and UBA have been making inroads to gain higher market shares. ZBL, however, is more aggressive in its pursuit than the other Nigerian cohorts. Ghana’s banking environment has changed drastically such that the current situation runs contrary to the findings of Korsah et al. (2001) who observe that the market shares of the rest of the banks have moved within a rather narrow band implying that they have not made significant inroads by way of wrestling market share from the Top 4 banks or ‘growing’ their own markets. Figure 1 depicts the trend-lines of the top ten banks and their respective market shares (deposits) since 2003. Figure 1: Trends of Deposits Market Share of Top 10 Banks 2003-2010
This figure shows the trend of market shares of industry deposit of the top 10 banks from 2003-2010. The tapering end depicts the competition in the industry in recent years. From Figure 1, it is evident that in 2003, the three leading banks had a commanding lead in terms of market share of industry deposits when each bank held more than 15 percent market share. As the years go by and competition intensifies, EBG, SBG, ZBL and other are making significant inroads such that the highest market share (deposits) in 2009 was 13.3%. The figure above shows at a glance, the spread at 2003 which strikes a chord with Korsah et al’s (2001) conclusion of a wide gap of market share between leading banks and others; and the convergence at 2009. The findings also supports the assertion of Aboagye-Debrah (2007) that the reduction in market concentration for the six large banks from 86% to 71% from 2000 and 2005 was marginal and the industry could do with further competition. However the story differs in the net advances criterion. GCB managed to maintain its lead and increased its market share in the midst of the global financial crisis. Other leading banks have not been able to catch up. where MSi represents the market share of firm i and there are n firms in the market. Hence, the summation of squares of (bank 1) + (bank 2) + (bank 3)......(bank 25). We proceed by calculating market shares from 2003 to 2010. In practice, market shares in banking are calculated based on three major criteria: industry deposits, industry net advances, and industry total assets. However, this study limits itself to deposits and net advances since they are seen as more market-driven activities than assets which are mainly strategic in nature. The HHI indices reported in Table 3 below support the assertion that for the past eight years the entire banking industry in Ghana has been highly competitive market with no signs of concentration. However, currently, the net advances market is more competitive than deposit market, recording 644.3 and 675 points respectively. Also observable from Table 3 is that using the U.S. 1992 guidelines it is abundantly
0
5
10
15
20
25
2004 2005 2006 2007 2008 2009 2010
GCB
BBG
EBG
SCB
SBG
MBG
ZBL
ADB
SSB

S. Y. Akomea & M. Adusei | GJBR ♦ Vol. 7 ♦ No. 3 ♦ 2013
40
clear that Ghana’s banking environment has consistently reduced its HHI since 2003, suggesting that no bank commands market power. Figure 2: Trends of Net Advances Market Share of Top 10 Banks 2003-2010
This figure shows the industry market share in net advances for the period under review. It shows clearly the commanding lead of Ghana Commercial Bank in net advances. The calculation of Herfindahl-Hirschman Index is easily done when all market shares are known; the formula is: 𝐻𝐻𝐼 = ∑ (𝑀𝑆𝑖)2𝑛
𝑖=1 (3) Table 3: HHI (Deposits) and (Net Advances) 2003-2010
Year No. of Banks
HHI (Deposits)
HHI (Net Advances) Commencement of Operations
2010 25 675.0 644.3 2009 25 718.2 868.5 ABG 2008 23 814.9 907.2 BSIC, BBL 2007 23 928.3 962.6 2006 23 964.9 931.7 GTB, FBL, IBG 2005 20 1088.9 1048.8 UBA, ZBL 2004 18 1188.9 1141.9 2003 17 1255.1 1236.6 HFC
This table shows HHI in terms of deposits and net advances for the years under review. It depicts the number of banks that were surveyed in a particular year and new banks that joined the industry in the course of the period. The summary points clearly to the fact that the HHI decreases as more banks enter the industry. The comparison between the figures for deposit and that of net advances suggest that there is a dominant market leader in net advances; accounting for the higher HHI from 2007. In most cases, the behaviour of the industrial player with commanding market share dictates the pattern of HHI. For instance, before 2006 with the exception of BBG, all market leaders had higher market shares in deposits than net advances; which gives credence to the maxim that “one cannot give what one doesn’t have”. However, with the abolition of the secondary reserve in 2005, it was possible for banks to be aggressive in lending; hence, from 2007 when BBG was looking inwards to correct the over-exposure of the previous years, GCB took a commanding lead with its might and captured net advances market shares; a position it still maintains. This could be attributed to the scramble for market shares around 2007 as a result the entry of about five banks on the market. The Nigerian banks were very aggressive in the pursuit of market shares. Their marketing innovations brought down the regime of high initial deposits and minimum balances. For instance, before 2005, some
0
5
10
15
20
25
2003 2004 2005 2006 2007 2008 2009 2010
GCB
BBG
EBG
SCB
SBG
MBG
ZBL
ADB
SSB

GLOBAL JOURNAL OF BUSINESS RESEARCH ♦ VOLUME 7 ♦ NUMBER 3 ♦ 2013
41
banks demanded the equivalent of $75 for customers to open accounts. Other local banks had similar arrangements even though thresholds were comparatively lower. In 2006, UBA (then STB) introduced the cashless account which was unknown in Ghana’s banking sector. Customers could, therefore, open empty accounts and build up later. Other Nigerian banks followed, eventually. The existing banks had to yield to pressure, accepting initial deposits as low as GH¢ 5 ($5) in 2007. Figure 3 is a bar graph that shows the comparison between HHI in deposits and net advances. Carbo et al, (2003) posit that a competitive financial sector confers benefits on users of financial services. Figure 3: HHI (Deposits) and Net Advances (2003-2010)
This figure compares the HHI for both Industry deposits and advances which are the main measures of market shares in banking. The trend shows competitiveness in deposit mobilization from 2007 to 2009. Forecast of Future Concentration Levels in Event of Consolidations Two objectives are in the contemplation of this study: (1) to ascertain the concentration level of the banking industry in Ghana and (2) to forecast the future concentration levels should consolidations take place before the deadline for recapitalization at the end of 2012. The analyses done so far have focused on objective (1). We now turn our attention to objective (2). Using 2010 share of industry deposits, we would like to forecast concentration levels in event of (1) two-bank merger and (2) concentration levels in event of mega-mergers involving more than two Top Ten banks. Table 4 shows HHI (deposits) for 45 scenarios of two-bank mergers. The table depicts permutation of the likelihood of any two of the Top Ten banks merging. Two-bank merger between any other banks outside these scenarios will have no significant consequences on the Herfindahl index of the industry. Table 4: Scenarios of Consolidation within Top 10 Banks (Post Merger HHI)
BANKS GCB BBG EBG SCB SGL MBG ZBL ADB SSB BBG 952.76 EBG 934.42 884.92 SCB 913.46 867.96 855.22 SBG 832.24 802.24 793.84 784.24 MBG 816.52 789.52 781.96 773.32 739.84 ZBL 795.56 772.56 766.12 758.76 730.24 724.72 ADB 790.32 768.32 762.16 755.12 727.84 722.56 715.52 SSB 782.46 761.96 756.22 749.66 724.24 719.32 712.76 711.12 IBG 764.12 747.12 742.36 736.92 715.84 711.76 706.32 704.96 702.92
This table shows the scenarios of consolidations within top 10 banks. That is, post merger HHI It points to the situation that will exist should any two of the top 10 banks merge. It is obvious that GCB-BBG merger will trigger the highest HHI of 952.76 since the two banks have the highest market share. However, this will have inconsequential effect on the exiting market concentration. Evidently, all the permutations will keep the concentration below 1000, suggesting that even if there
0
200
400
600
800
1000
1200
1400
2003 2004 2005 2006 2007 2008 2009 2010
HHI DEPOSITS
NET ADVANCES
S. Y. Akomea & M. Adusei | GJBR ♦ Vol. 7 ♦ No. 3 ♦ 2013
42
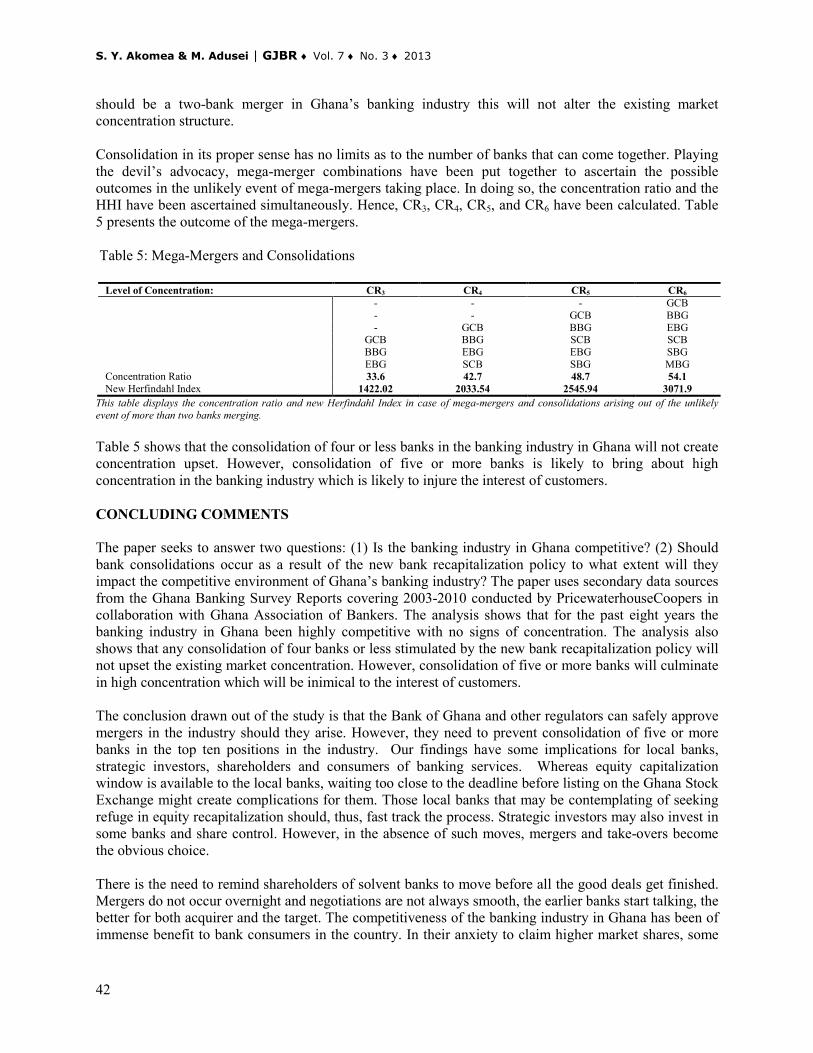
should be a two-bank merger in Ghana’s banking industry this will not alter the existing market concentration structure. Consolidation in its proper sense has no limits as to the number of banks that can come together. Playing the devil’s advocacy, mega-merger combinations have been put together to ascertain the possible outcomes in the unlikely event of mega-mergers taking place. In doing so, the concentration ratio and the HHI have been ascertained simultaneously. Hence, CR3, CR4, CR5, and CR6 have been calculated. Table 5 presents the outcome of the mega-mergers. Table 5: Mega-Mergers and Consolidations
Level of Concentration: CR3 CR4 CR5 CR6 - - - GCB - - GCB BBG - GCB BBG EBG GCB BBG SCB SCB BBG EBG EBG SBG EBG SCB SBG MBG Concentration Ratio 33.6 42.7 48.7 54.1 New Herfindahl Index 1422.02 2033.54 2545.94 3071.9
This table displays the concentration ratio and new Herfindahl Index in case of mega-mergers and consolidations arising out of the unlikely event of more than two banks merging. Table 5 shows that the consolidation of four or less banks in the banking industry in Ghana will not create concentration upset. However, consolidation of five or more banks is likely to bring about high concentration in the banking industry which is likely to injure the interest of customers. CONCLUDING COMMENTS The paper seeks to answer two questions: (1) Is the banking industry in Ghana competitive? (2) Should bank consolidations occur as a result of the new bank recapitalization policy to what extent will they impact the competitive environment of Ghana’s banking industry? The paper uses secondary data sources from the Ghana Banking Survey Reports covering 2003-2010 conducted by PricewaterhouseCoopers in collaboration with Ghana Association of Bankers. The analysis shows that for the past eight years the banking industry in Ghana been highly competitive with no signs of concentration. The analysis also shows that any consolidation of four banks or less stimulated by the new bank recapitalization policy will not upset the existing market concentration. However, consolidation of five or more banks will culminate in high concentration which will be inimical to the interest of customers. The conclusion drawn out of the study is that the Bank of Ghana and other regulators can safely approve mergers in the industry should they arise. However, they need to prevent consolidation of five or more banks in the top ten positions in the industry. Our findings have some implications for local banks, strategic investors, shareholders and consumers of banking services. Whereas equity capitalization window is available to the local banks, waiting too close to the deadline before listing on the Ghana Stock Exchange might create complications for them. Those local banks that may be contemplating of seeking refuge in equity recapitalization should, thus, fast track the process. Strategic investors may also invest in some banks and share control. However, in the absence of such moves, mergers and take-overs become the obvious choice. There is the need to remind shareholders of solvent banks to move before all the good deals get finished. Mergers do not occur overnight and negotiations are not always smooth, the earlier banks start talking, the better for both acquirer and the target. The competitiveness of the banking industry in Ghana has been of immense benefit to bank consumers in the country. In their anxiety to claim higher market shares, some

GLOBAL JOURNAL OF BUSINESS RESEARCH ♦ VOLUME 7 ♦ NUMBER 3 ♦ 2013
43
banks more than ever, have been closer to their customers. Customer value in banking has increased to unprecedented levels since 2006. Major value propositions to consumers include customized banking, new product development, expedite loans processing, extended banking hours including weekend banking in selected banks, access to bank management, relationship marketing, improve banking environment, provision of electronic products, improved customer service among others. Consumers are, therefore, not willing to go back to the monopolistic era of banking, hence, the concern about consolidation outcomes. The competitive nature of the banking industry in Ghana implies that efficiency resulting in low bank charges is predictable. It is trite that when markets are operationally efficient the direct beneficiaries are the customers. This presupposes that bank customers in Ghana should expect low prices for the services rendered by banks in Ghana even in the face of bank consolidations. Limitations of the Study One obvious weakness of this paper is that it has relied on the data from survey reports gathered by PricewaterhouseCoopers. Thus, the validity of our conclusions is limited to the extent to which these data are credible. We would, therefore, recommend a follow-up study using a new dataset. Besides, our study has focused on the competiveness of the universal banking industry. Rural and community banks have been omitted. It will, therefore, be advisable for future researchers to consider using our methodology to study these institutions. REFERENCES Aboagye-Debrah, K., (2007), Competition, growth and performance in the banking industry in Ghana, PhD Thesis, St Clement University. Abor, J. and Biekpe, N. (2007), Small business reliance on bank financing in Ghana, Emerging Markets Finance and Trade, 43(4), 93-102. Adusei, M. (2012) Determinants of Bank Board Structure in Ghana, The International Journal of Business and Finance Research, 6(1), 15-23 Adusei, M. (2011) Board Structure and Bank Performance in Ghana, Journal of Money, Investment and Banking, 19, 72-84 Akomea, S.Y., (2009), Consequences of host country threshold regimes on small businesses, Conference Proceedings, 10th International Academy of African Business and Development Annual Conference, Makerere University, Uganda, 267-272. Aryeetey, E. (1996), The formal financial sector in Ghana after the reforms, Overseas Development Institute Working Paper Series, No. 86, Chameleon Press Ltd, London Barney, J.B. (1992) Strategic Factor Markets: Expectations, luck and business strategy in Foss, N.J. (1998), Resources, firms, and strategies: a reader in the resource-based perspective, by Oxford University Press. Carbo, V.S., Humphrey, D.B. and Rodriguez F.F., (2003) Deregulation, bank competition and regional growth, Regional Studies, 37( 3), 227–237. Cetorelli, N. (2000), Competitive analysis in banking: appraisal of the methodologies, Federal Reserve of Chicago, Economic Perspectives, 1, 2-15.
S. Y. Akomea & M. Adusei | GJBR ♦ Vol. 7 ♦ No. 3 ♦ 2013
44
Cetorelli, N. & Peretto, P. F., (2000), Oligopoly Banking and Capital Accumulation," Working Papers 00-19, Duke University, Department of Economics. Ezeoha, A.E., (2011), Banking consolidation, credit crisis and asset quality in a fragile banking system: Some evidence from Nigerian data, Journal of Financial Regulation and Compliance, 19(1), 33-44 Ghana Banking Survey, (2010) Risk Management in well capitalized banks, PricewaterhouseCoopers and Ghana Association of Bankers, 2010. Gockel, A. F. (1998), in Banking in Africa: the impact of financial sector reforms since independence, by Brownbridge M. and Harvey C., James Currey Publishers, Oxford, London. Hausman J. and Sidak J.G., (2007), Evaluating market power using competitive benchmark prices rather than the Hirschman-Herfindahl Index, Antitrust Law Journal, 74(2), 387-407. Hinson R, Owusu Frimpong, and Dassah, J. (2009) Key motivations for bank patronage in Ghana”, International Journal of Bank Marketing, 27(5), 381-399 Kaysen, C. and Turner D.F. (1959) Antitrust Policy. Cambridge, Mass.: Harvard University Press. Korsah, K.B, Nyarko, E.K, and Tagoe, N.A, (2001), Impact of financial sector liberalization on competition and efficiency in the Ghanaian banking industry, International Labour Organization Research Paper 01. Lijesin, M. G. Nijkamp, P. and Rietveld P. (2002), Measuring competition in civil aviation, Journal of Air Transport Management, 8, 189-197. Levin, D. (1990) Horizontal Mergers: The 50 Percent Benchmark, The American Economic Review, 80(5), 1238-1245 Mensah, (1997), Financial Markets and Institutions: Ghana’s Experience”, paper presented at the International Programme on Capital Markets and Portfolio Management, Indian Institute of Management, 8(20), 1-22. Shih, M.S.H. (2003), An investigation into the use of mergers as a solution for the Asian banking sector crisis, The Quarterly Review of Economics and Finance, 43, 31–49. Somoye, R.O.C. (2008), The performances of commercial banks in post-consolidation period in Nigeria: an empirical review”, European Journal of Economics, Finance and Administrative Sciences, 14, 62-73. Tirole, J. (1988), The Theory of Industrial Organization. The MIT Press, Cambridge, Massachusetts White, L. J. (1987), Antitrust and merger policy: review and critique Journal of Economic Perspectives, Fall, 1987, 1, 13-22. Wernerfelt, B. (1984), A resource- based view of the firm, Strategic Management Journal, 5(2), 171–180 ACKNOWLEDGEMENT The authors will like to express their sincere gratitude to the reviewers of this document. Their suggestions directions and encouragement have improved this paper to a large extent.

GLOBAL JOURNAL OF BUSINESS RESEARCH ♦ VOLUME 7 ♦ NUMBER 3 ♦ 2013
45
BIOGRAPHY Samuel Yaw Akomea is a lecturer in Marketing and International Business in the Department of Marketing and Corporate Strategy, KNUST School of Business, Kwame Nkrumah University of Science and Technology, Kumasi. He is also a legal practitioner and shows interests in international business, banking and SME-related research. He is currently pursuing PhD in International Business at the Aalborg University, Denmark and has been a member of Academy of International Business (AIB) since 2006. You can contact him via samak [email protected]. Michael Adusei is a lecturer in banking and finance in the Department of Accounting and Finance, KNUST School of Business, Kwame Nkrumah University of Science and Technology, Kumasi. Though a young lecturer, he has published extensively on banking and other aspects of finance in international journals. You can contact him via [email protected].