Embed Size (px)
DESCRIPTION
Here you can get an overview of effects on politics on bank ownership and performance
Citation preview
Journal of Banking & Finance 31 (2007) 219–241
www.elsevier.com/locate/jbf
Bank ownership and performance. Doespolitics matter? q
Alejandro Micco a, Ugo Panizza b,*, Monica Yanez c
a Central Bank of Chile, Chileb Research Department, Inter-American Development Bank, 1300 New York Avenue,
Stop B900, NW, Washington, DC 20577, United Statesc Department of Agricultural and Consumer Economics, University of Illinois, Urbana-Champaign,
Mumford Hall, 1301 West Gregory Dr., Urbana, IL 61801-3605, United States
Received 29 October 2004; accepted 13 February 2006Available online 24 July 2006
Abstract
This paper uses a new dataset to reassess the relationship between bank ownership and bank per-formance, providing separate estimations for developing and industrial countries. It finds that state-owned banks located in developing countries tend to have lower profitability and higher costs thantheir private counterparts, and that the opposite is true for foreign-owned banks. The paper finds nostrong correlation between ownership and performance for banks located in industrial countries.Next, in order to test whether the differential in performance between public and private banks isdriven by political considerations, the paper checks whether this differential widens during electionyears; it finds strong support for this hypothesis.� 2006 Elsevier B.V. All rights reserved.
JEL classification: G21; D21
Keywords: Banking; Privatization; Ownership; Performance
0378-4266/$ - see front matter � 2006 Elsevier B.V. All rights reserved.
doi:10.1016/j.jbankfin.2006.02.007
q This paper is a greatly revised version of a paper that was previously circulated under the title ‘‘BankOwnership and Performance’’. The project was initiated when all authors were at the Research Department of theInter-American Development Bank.
* Corresponding author. Tel.: +1 202 623 1427; fax: +1 202 623 2841.E-mail address: [email protected] (U. Panizza).
220 A. Micco et al. / Journal of Banking & Finance 31 (2007) 219–241
1. Introduction
The purpose of this paper is to use a new dataset to reassess the relationship betweenbank ownership and bank performance and to test whether politics plays a role in thisrelationship. We find that state-owned banks operating in developing countries tend tohave lower profitability, lower margins, and higher overhead costs than comparable pri-vate banks. When we focus on industrial countries, we find a much weaker relationshipbetween performance and ownership. Three papers that are closely related to ours areDemirguc-Kunt and Huizinga (2000), Mian (2003), and Caprio et al. (2004). There are,however, important differences between each of these papers and ours. Demirguc-Kuntand Huizinga (2000) use data for an earlier period and focus on foreign ownership. Mian(2003) compares performance across ownership groups without controlling for bank char-acteristics. Caprio et al. (2004) look at the correlation between ownership structure andperformance but, rather than focusing on profitability, interest margin and costs, focuson bank valuation.1
After establishing that state-owned banks located in developing countries are less prof-itable and have lower margins than their private counterparts, we test whether these dif-ferences are due to the fact that state-owned banks have a development mandate orwhether politics plays a role. To do so, we check whether the differential between the per-formance of public and private banks tends to increase during election years and, as pre-dicted by the political view of public banks, find strong evidence in this direction. This isthe most interesting and novel result of our paper, and it is a useful addition to the liter-ature on the relationship between politics and banking activities. In fact, while previouswork focused on type and quantity of bank lending (Khwaja and Mian, 2005; Dinc,2005; Sapienza, 2004), this is the first paper that focuses on the relationship between pol-itics and bank performance.
Dinc (2005), who finds that bank lending increases substantially during election years, isthe paper most closely related to ours. A useful way to compare our paper with Dinc’s(2005) is to consider that he focuses on quantities, while we examine both prices and quan-tities.2 Focusing on prices allows us to separate supply shocks from demand shocks. Thisis important because, if the increase in the quantity of loans observed during election yearsis accompanied by an increase in the price of loans, then we should conclude that Dinc’s(2005) results are driven by demand shocks and not political lending. If we instead findthat the election year effect is accompanied by a decrease in prices, we can conclude thatthe increase in lending is indeed driven by a supply shock, a fact consistent with politicallending. Our results support the latter interpretation.
1 See Berger et al. (2005) for a survey. There are several other papers that study the relationship betweenownership and performance, but they tend to focus on a smaller subset of countries. Studies of the relativeperformance of foreign versus domestic banks in industrial countries include DeYoung and Nolle (1996), Bergeret al. (2000), and Vander Vennet (1996). Studies focusing on developing countries include Bonin et al. (2005) andClarke et al. (2000). There is also a large literature on the performance effects of bank privatization (Megginson,2003; Clarke et al., 2003, provide excellent surveys of this literature).
2 Unfortunately, we do not have data on the interest rate charged on bank loans but, as return on assets andinterest margins are good proxies of mark-up, if one assumes that the cost of funding does not increase duringelections, our measures of bank performance are positively correlated with the interest rate (i.e., the price)charged by banks.

A. Micco et al. / Journal of Banking & Finance 31 (2007) 219–241 221
A third strand of literature related to our work focuses on insider/related lending (Lae-ven, 2001; La Porta et al., 2003). While this literature has mostly focused on the behaviorof private banks, it is possible that during election years state-owned banks increase theirlending to state-owned enterprises that share directors or that have managers and directorsbelonging to the same political groups as the banks’ managers and directors. Khwaja andMian (2005), for instance, show that Pakistani state-owned banks lend more to firms withpolitically connected directors.
2. The data
Our main source of data is the Fitch-IBCA Bankscope (BSC) dataset that providesbank-level annual financial information for 179 countries around the world (the versionof the dataset used in this paper covers the period 1995–2002). While BSC includes awealth of information on bank characteristics and bank performance, BSC’s target audi-ence consists of financial analysts interested in looking at a small sub-sample of banksand/or countries, not researchers interested in conducting statistical analyses coveringall the countries and banks included in the dataset. Hence, we had to carefully edit the databefore being able to use them for our statistical analysis, and we believe that this is animportant contribution of our paper.
As our paper focuses on commercial banks, we start by dropping central banks, invest-ment banks, securities houses, multilateral government banks, non-banking credit institu-tions, and specialized government financial institutions, which reduces our sample from143,564 observations to 120,809 observations. Next, we eliminate duplicated information,mostly consolidated and aggregated statements (this is not an easy task; see Appendix Afor details) and reduce our sample to 71,951 observations. Finally, we use different sourcesto code ownership and track ownership history for banks that changed ownership status(Appendix A provides a list of sources). As coding ownership was a particularly time-con-suming and difficult endeavor that required looking at one bank at a time (in some cases itwas necessary to consult several sources in order to code and track the ownership historyof a single bank), the cost of coding all banks included in the dataset would have beenextremely high. Hence, we decided to adopt some cut-off points (described in AppendixA) under which a bank would not be coded. After eliminating from the dataset all thebanks that we were not able to code, as well as banks with missing information for totalassets, we are left with a total of 49,804 observations, corresponding to a number of banksthat ranges between 5464 (in 1995) and 6677 (in 2002).
In the dataset, we classify as public those banks in which public sector ownership isabove 50% and classify as foreign those banks in which foreigners own more than 50%of shares.3 However, in computing country-level foreign and public ownership, we followLa Porta et al. (2002) and use the actual fraction of shares owned by each shareholder.While confidentiality agreements prevent us from making the bank-level dataset public,we are making public a dataset in which we report characteristics and performance of pub-lic, private, and foreign banks aggregated by country and year.4
3 Throughout the paper, we will refer to private banks as banks that are owned by the private sector (they canbe either privately owned or publicly listed) and to public banks as banks that are owned by the public sector.Hence, the adjectives public and private do not refer to whether banks are publicly listed.
4 The dataset is available at http://www.iadb.org/res/files/data_app_mpy.xls.
222 A. Micco et al. / Journal of Banking & Finance 31 (2007) 219–241
It is important to recognize that there are at least two possible problems with our data.The first pertains to the nature of BSC. As BSC is maintained for commercial reasons, oneof its main limitations is the almost total omission of rural and very small banks. Further-more, Fitch-IBCA only collects data from banks that publish independent financialreports. Hence, it may omit some branches and subsidiaries of foreign banks (Bhattach-arya, 2003). The second problem relates to the reliability of our coding strategy. Althoughwe were extremely careful in coding ownership, we had to code several thousand banksand, therefore, we cannot be absolutely certain that there are no mistakes in the dataset.We address these issues by checking whether our data are consistent with other datasetsthat were assembled using different sources and methodologies. The correlations betweenour measure of public ownership and those assembled by La Porta et al. (2002) and Barthet al. (2001) are large and statistically significant and the correlations between our mea-sures of foreign ownership and bank concentration and those of Barth et al. (2001) are alsolarge and statistically significant.5 These results are reassuring and indicate that our dataare highly correlated with the findings of previous studies.
Table 1 reports the number of observations and median values for our main variables ofinterest (the table includes all banks for which we have information on ownership andtotal assets) divided by country groups (we use the classification of the World Bank’sWorld Development Indicators) and ownership type. The industrial countries have thelargest number of banks in the sample (6550 banks and 35,800 observations, correspond-ing to 72% of the total). In this group of countries, domestic private banks control 70% ofbank assets, public banks control 10% of bank assets, and foreign banks control theremaining 20%. Our data also indicate that in industrial countries domestic private bankshave the highest level of profitability (measured as return on assets) and the highest inter-est margin. When we focus on developing countries, we find that domestic private bankscontrol 48% of bank assets, and public and foreign banks 26% each. In this sub-sample ofcountries, we find that foreign banks have the highest level of profitability and interestmargin. There are, however, important differences within the group of developing coun-tries. Latin America is the developing region with the largest number of banks, followedby Eastern Europe, East Asia, Sub-Saharan Africa, the Middle East, South Asia, and theCaribbean. Public ownership of banks is prevalent in Asian countries and Eastern Europeand much lower in Sub-Saharan Africa and the Caribbean. Foreign ownership of banks isparticularly important in Sub-Saharan Africa, but also prevalent in the Caribbean, East-ern Europe, Central Asia, and Latin America. Foreign banks are particularly profitable(compared to domestic banks in the same region) in the Caribbean and Sub-SaharanAfrica, and public banks have very low profitability (compared to private banks in thesame region) in South Asia, East Asia, and Latin America. When we focus on differentyears, we find that the share of public banks goes from approximately 30% in 1995 to18% in 2002 and the share of foreign banks goes from 20% in 1995 to 32% in 2002.
5 The cross-country correlation between our measure of public ownership and that of La Porta et al. (2002) is0.86 and the cross-country correlation between our measure of public ownership and that of Barth et al. (2001) is0.81. The cross-country correlation between our measure of foreign ownership and that of Barth et al. (2001) is0.71, and the cross-country correlation between our measure of bank concentration and that of Barth et al. (2001)is 0.94. All these correlations are statistically significant at the 1% confidence level.
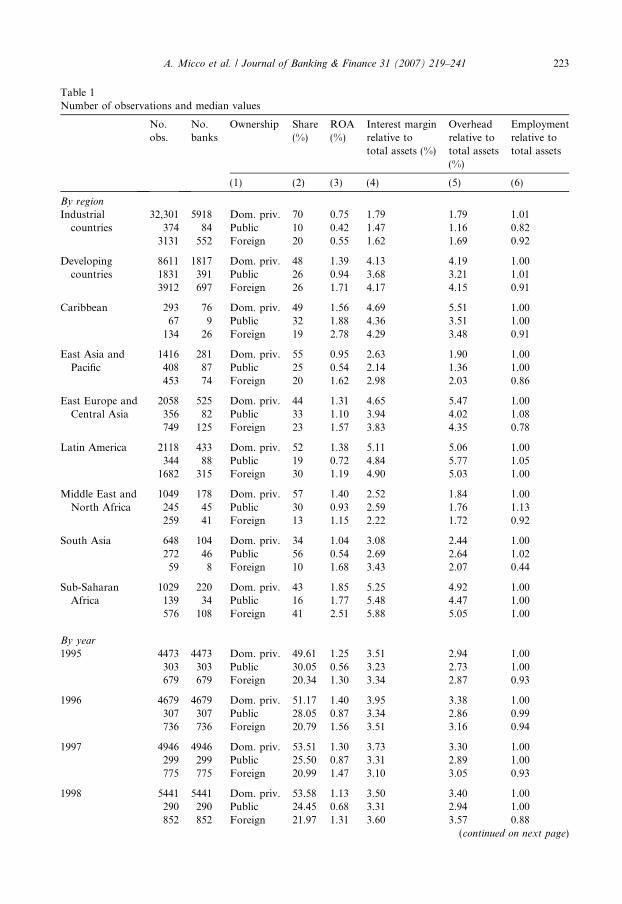
Table 1Number of observations and median values
No.obs.
No.banks
Ownership Share(%)
ROA(%)
Interest marginrelative tototal assets (%)
Overheadrelative tototal assets(%)
Employmentrelative tototal assets
(1) (2) (3) (4) (5) (6)
By region
Industrialcountries
32,301 5918 Dom. priv. 70 0.75 1.79 1.79 1.01374 84 Public 10 0.42 1.47 1.16 0.82
3131 552 Foreign 20 0.55 1.62 1.69 0.92
Developingcountries
8611 1817 Dom. priv. 48 1.39 4.13 4.19 1.001831 391 Public 26 0.94 3.68 3.21 1.013912 697 Foreign 26 1.71 4.17 4.15 0.91
Caribbean 293 76 Dom. priv. 49 1.56 4.69 5.51 1.0067 9 Public 32 1.88 4.36 3.51 1.00
134 26 Foreign 19 2.78 4.29 3.48 0.91
East Asia andPacific
1416 281 Dom. priv. 55 0.95 2.63 1.90 1.00408 87 Public 25 0.54 2.14 1.36 1.00453 74 Foreign 20 1.62 2.98 2.03 0.86
East Europe andCentral Asia
2058 525 Dom. priv. 44 1.31 4.65 5.47 1.00356 82 Public 33 1.10 3.94 4.02 1.08749 125 Foreign 23 1.57 3.83 4.35 0.78
Latin America 2118 433 Dom. priv. 52 1.38 5.11 5.06 1.00344 88 Public 19 0.72 4.84 5.77 1.05
1682 315 Foreign 30 1.19 4.90 5.03 1.00
Middle East andNorth Africa
1049 178 Dom. priv. 57 1.40 2.52 1.84 1.00245 45 Public 30 0.93 2.59 1.76 1.13259 41 Foreign 13 1.15 2.22 1.72 0.92
South Asia 648 104 Dom. priv. 34 1.04 3.08 2.44 1.00272 46 Public 56 0.54 2.69 2.64 1.0259 8 Foreign 10 1.68 3.43 2.07 0.44
Sub-SaharanAfrica
1029 220 Dom. priv. 43 1.85 5.25 4.92 1.00139 34 Public 16 1.77 5.48 4.47 1.00576 108 Foreign 41 2.51 5.88 5.05 1.00
By year
1995 4473 4473 Dom. priv. 49.61 1.25 3.51 2.94 1.00303 303 Public 30.05 0.56 3.23 2.73 1.00679 679 Foreign 20.34 1.30 3.34 2.87 0.93
1996 4679 4679 Dom. priv. 51.17 1.40 3.95 3.38 1.00307 307 Public 28.05 0.87 3.34 2.86 0.99736 736 Foreign 20.79 1.56 3.51 3.16 0.94
1997 4946 4946 Dom. priv. 53.51 1.30 3.73 3.30 1.00299 299 Public 25.50 0.87 3.31 2.89 1.00775 775 Foreign 20.99 1.47 3.10 3.05 0.93
1998 5441 5441 Dom. priv. 53.58 1.13 3.50 3.40 1.00290 290 Public 24.45 0.68 3.31 2.94 1.00852 852 Foreign 21.97 1.31 3.60 3.57 0.88
(continued on next page)
A. Micco et al. / Journal of Banking & Finance 31 (2007) 219–241 223

Table 1 (continued)
No.obs.
No.banks
Ownership Share(%)
ROA(%)
Interest marginrelative tototal assets (%)
Overheadrelative tototal assets(%)
Employmentrelative tototal assets
(1) (2) (3) (4) (5) (6)
1999 5502 5502 Dom. priv. 54.33 1.07 3.45 3.53 1.00266 266 Public 21.92 0.73 3.26 2.90 1.00901 901 Foreign 23.75 1.54 3.42 3.49 0.84
2000 5099 5099 Dom. priv. 49.80 1.24 3.48 3.44 1.01253 253 Public 20.41 1.04 3.12 2.86 1.00980 980 Foreign 29.79 1.47 3.37 3.81 0.91
2001 5418 5418 Dom. priv. 51.02 1.06 3.54 3.46 1.00247 247 Public 18.23 0.87 3.20 2.87 1.01
1051 1051 Foreign 30.75 1.19 3.23 3.66 0.93
2002 5354 5354 Dom. priv. 50.83 1.05 3.35 3.13 1.00240 240 Public 17.60 0.79 3.20 2.61 1.07
1069 1069 Foreign 31.56 1.25 3.17 3.49 0.95
Allcountry-years
40,912 7735 Dom. priv. 51.73 1.18 3.53 3.37 1.002205 475 Public 23.16 0.83 3.25 2.85 1.007824 1394 Foreign 25.11 1.34 3.34 3.10 0.92
All variables are weighted by bank size.
224 A. Micco et al. / Journal of Banking & Finance 31 (2007) 219–241
3. Regression results
To describe the correlation between bank ownership and bank performance and testwhether politics plays a role in driving this correlation, we proceed as follows: we startby estimating a simple model where we compare how ownership affects bank performance.Next, we test whether politics affects the relationship between ownership and performanceby interacting an election dummy with the public ownership dummy. Finally, we checkwhether our results are robust to changes in the econometric specification, weighting strat-egy, and sample of banks included in the statistical analysis.
3.1. Ownership and performance
To study the correlation between ownership and performance, we use bank-level dataand standard indicators of bank profitability and efficiency such as return on assets(ROA), interest margins, overhead costs, and employment to estimate the followingequation:
PERFi;j;t ¼ gj;t þ aPUBi;j;t þ bFORi;j;t þ X i;j;tc0 þ ei;j;t; ð1Þ
where PERFi,j,t is a measure of performance for bank i in country j at time t, gj,t is acountry-year fixed effect that controls for all factors that are country-specific (level ofdevelopment, geography, institutions, etc.) and country-year specific (macroeconomicshocks, political instability, changes in regulations, etc.), PUBi,j,t is a dummy variable thattakes value one if in year t bank i is state owned (we define ownership using the 50%

A. Micco et al. / Journal of Banking & Finance 31 (2007) 219–241 225
threshold), FORi,j,t is a dummy variable that takes value one if in year t bank i is foreign-owned (private domestically owned is the excluded dummy), and Xi,j,t is a matrix ofbank-specific controls which includes two variables aimed at capturing the effect of themain sector of activity of the bank and two variables aimed at capturing the effect ofbank size.6
Although our specification is similar to the one adopted by Demirguc-Kunt and Huiz-inga (2000), there is a fundamental difference between our empirical strategy and theirs. Aswe are not interested in how regulatory and macroeconomic shocks affect bank perfor-mance, we control for all these shocks by including country-year fixed effects. The mainadvantage of our strategy is that we fully control for aggregate shocks that affect all typeof banks in the same way, thereby eliminating most problems related to omitted macro-economic variables and errors in the measurement of these variables.
As some countries have more observations than others, if we do not use weights, ourresults would be driven by the countries for which we have a large number of observations.Claessens et al. (2001) address this issue by weighting each observation by 1/Nj,t (whereNj,t is the number of observations in country j, year t). We follow a similar strategy butweight each observation by the bank’s share of total assets in the country. This weightingscheme has the same properties as 1/Nj,t (it gives each country-year the same weight in theregression), but it better reflects the behavior of the banking industry and, if measurementerrors decrease with bank size, produces more precise estimates (Levy-Yeyati and Micco,2003).
While we started with approximately 50,000 observations (Table 1), our regressionsinclude a smaller number of observations (about 19,000). There are several reasons for thisdifference. First, while Table 1 uses all observations for which we have information onownership and total assets, the regressions also require information on four other controls(interest and non-interest income, demand and total deposits) and BSC has several missingobservations for these controls. Furthermore, in order to work with similar samples, wedrop all observations for which we do not have data for ROA, interest margins, and over-head costs (we do not restrict the sample to banks that have information on total employ-ment because we would lose too many observations). Second, we eliminate countries witha small number of banks by dropping all country-years for which we do not have at leastfive banks and, to make sure that our results are not driven by the transition from oneownership structure to another, we drop all the bank-year observations in which thereis a change in ownership. Third, we exclude outliers by dropping the top and bottom2% of observations for each dependent variable. Finally, as we use lags, we lose one yearof observations.
Table 2 reports our baseline results. As industrial and developing countries tend to havedifferent coefficients (Micco et al., 2005, run a pooled regression interacting all variables
6 To control for the sector of activity, we use non-interest income as a share of total assets (NONINT) anddemand deposits as a share of total deposits (DDEP). The rationale for using these two variables is thatNONINT tends to be higher for banks that derive most of their income from commissions, and DDEP tends tobe higher in retail commercial banks. These variables are thus likely to differentiate retail commercial banks frominstitutions that operate in the wholesale market or derive most of their income from investment bankingactivities. To control for size, we follow Berger et al. (2005) and use both total size measured as the lag of totalassets (measured in logs, LTA) and relative size measured as lag of the share of bank i’s total assets over totalbanking assets in country j, year t (SHTA). The first variable controls for economy of scale and the secondcontrols for market power.

Table 2Bank ownership and performance
Return on assets (ROA) Interest margin over totalassets
Overhead cost over totalassets
Number of employees overtotal assets
(1) (2) (3) (4) (5) (6) (7) (8)
PUB �0.910 �0.048 �0.323 �0.054 0.383 0.177 0.197 �0.034(0.114)*** (0.050) (0.099)*** (0.053) (0.090)*** (0.060)*** (0.052)*** (0.053)
FOR 0.365 0.016 0.010 �0.207 �0.686 �0.174 �0.365 �0.082(0.098)*** (0.035) (0.085) (0.049)*** (0.095)*** (0.059)*** (0.052)*** (0.052)
NONINT �0.003 0.124 �0.041 0.053 0.478 0.738 0.018 0.089(0.034) (0.010)*** (0.023)* (0.018)*** (0.063)*** (0.047)*** (0.008)** (0.014)***
DDEP 0.012 0.000 0.017 0.013 0.011 0.013 0.004 0.012(0.003)*** (0.001) (0.003)*** (0.001)*** (0.003)*** (0.001)*** (0.002)** (0.001)***
LTA �0.038 �0.029 �0.236 �0.178 �0.150 �0.094 �0.001 �0.116(0.052) (0.008)*** (0.043)*** (0.014)*** (0.044)*** (0.015)*** (0.023) (0.012)***
SHTA 0.266 0.085 1.402 0.491 �1.022 0.067 �0.452 0.598(0.457) (0.173) (0.392)*** (0.189)*** (0.324)*** (0.201) (0.261)* (0.187)***
No. obs. 5489 13,329 5489 13,329 5489 13,329 1893 9757R2 0.5211 0.5222 0.7346 0.6253 0.7684 0.7896 0.8761 0.7196Sample Developing Industrial Developing Industrial Developing Industrial Developing Industrial
Results for the baseline regressions for ROA, interest margin, overhead cost, and number of employees. PUB and FOR are dummy variables taking a value of one forstate-owned banks and foreign-owned banks, respectively. NONINT measures non-interest income as a share of total assets and DDEP measures demand deposits asa share of total deposits. LTA is the logarithm of lagged total assets, and SHTA is the lagged share of bank’s total assets over total banking assets in the country. Allregressions are weighted by asset share and include country-year fixed effects.Robust standard errors in parentheses.
* Significant at 10%.** Significant at 5%.
*** Significant at 1%.
226A
.M
iccoet
al.
/J
ou
rna
lo
fB
an
kin
g&
Fin
an
ce3
1(
20
07
)2
19
–2
41

A. Micco et al. / Journal of Banking & Finance 31 (2007) 219–241 227
with an industrial country dummy and show that these interactions are individually andjointly significant), we split the sample and report separate results for these two groupsof countries. The first two columns focus on profitability. We start by briefly describingthe set of control variables. Non-interest income is not correlated with ROA in the sub-sample of developing countries but is positively correlated with this variable in the sub-sample of industrial countries; the opposite is true for the ratio of demand deposits to totaldeposits. These findings suggest that retail banks tend to be more profitable in developingcountries and that banks that have high non-interest income (possibly wholesale/invest-ment banks) tend to be more profitable in industrial countries. We find no correlationbetween absolute bank size (LTA) and ROA for banks located in developing countries,but a negative and statistically significant correlation for banks located in industrial coun-tries; these results are robust to dropping the asset share variable. The coefficients of rel-ative size (SHTA) are always positive but never statistically significant.
Focusing on the ownership variables, the first column shows that state-owned bankslocated in developing countries tend to have returns on assets that are much lower thancomparable domestic privately owned banks. The effect is quantitatively important, indi-cating that the average state-owned bank has a return on assets that is 0.9% points lowerthan that of the average private domestic bank. Considering that the average value ofROA in developing countries is 1.7%, this is a sizable difference. When we look atindustrial countries, we find no statistically significant difference between the ROA of pub-lic banks and that of similar private banks (at �0.048 the coefficient is also extremelysmall). Hence, the difference between profitability of public and private banks, whichseemed very large in Table 1, becomes much smaller when we recognize that public andprivate banks are of very different sizes and tend to operate in different segments of thebanking market.
These results show that it is not necessarily true that state-owned banks are less prof-itable than private banks and are in line with Altunbas et al. (2001) who find that, in thecase of Germany, there is no evidence that privately owned banks are more efficient thanpublic and mutual banks. At the same time, our results do support the idea that in devel-oping countries public banks are less profitable than private banks. La Porta et al. (2002)find that in developing countries the presence of public banks has a detrimental effect ongrowth, but that in industrial countries there is no correlation between state ownershipand growth. They argue that this result may be due to the fact that high-income countriesare better equipped to deal with the distortions that arise from government ownership ofbanks. It would be possible to apply the same line of reasoning and claim that our resultsare driven by the fact that governance issues are less serious in industrial countries. Analternative interpretation is that in industrial countries public banks have ceased to playa development role and merely mimic the behavior of private banks, whereas in developingcountries public banks still play a development role and their low profitability is due to thefact that, rather than maximizing profits, they respond to a social mandate.
Our second result is that foreign banks located in developing countries tend to be moreprofitable than private domestic banks. Again, the difference is both statistically and eco-nomically important. The average foreign bank located in a developing country has aROA that is 0.37% points higher than that of a comparable private domestic bank (aboutone quarter of the average ROA in developing countries). In industrial countries, we findno significant difference between domestic and foreign banks. These results confirm theprevious findings that foreign banks tend to be more profitable than domestic banks in

228 A. Micco et al. / Journal of Banking & Finance 31 (2007) 219–241
developing countries (Demirguc-Kunt and Huizinga, 2000; Bonin et al., 2005) but that thisis not the case in industrial countries (Vander Vennet, 1996).7
Columns 3 and 4 of Table 2 focus on net interest margin (to increase the readability ofthe coefficients, we are expressing the dependent variable as a percent). In developingcountries there is a negative and significant correlation between net interest marginand non-interest income, but in industrial countries the opposite is true; the correlationis positive and significant. The share of demand deposits is always positively correlatedwith net interest margin, absolute size is negatively correlated with net interest margin,and relative size is positively correlated with net interest margin. These results may reflectincreasing returns and the presence of some market power. With respect to ownership, wefind that public banks in developing countries have slightly lower margins (the coefficientis statistically significant but not very large) and that there is no significant differencebetween the margins of public and private banks located in industrial countries. Whenwe focus on foreign banks located in developing countries, we find that their net marginsare never significantly different from those of domestic private banks. In industrial coun-tries, instead, we find that margins of foreign banks are lower than those of domestic pri-vate banks. However, while the coefficient is statistically significant, the difference is fairlysmall.
In columns 5 and 6 we focus on bank efficiency, measured as overhead costs over totalassets. Non-interest income and the share of demand deposits (a proxy for retail bankactivity) are associated with higher overhead costs. Absolute size is negatively correlatedwith overhead costs in both developing and industrial countries. In developing countriesrelative size is negatively correlated with overhead costs but, in industrial countries, wefind no significant correlation between these two variables. Focusing on ownership, wefind that state-owned banks tend to have higher overhead costs than similar domestic pri-vate banks. The coefficients imply that public banks have overhead costs that are nearly10% higher than the group average (which is about 2% in industrial countries and 4%in developing countries). The second row shows that foreign banks have much lower over-head costs than domestic private banks (about 15% less than the group average in devel-oping countries and 10% less than the group average in industrial countries).
The last two columns focus on another measure of efficiency: total employment mea-sured as a share of total assets (the dependent variable is the log of the ratio betweenemployment and total assets, employment is measured in units and assets in million dol-lars). In developing countries public banks tend to have a higher employment ratio thandomestic private banks (the difference is about 20% of the average employment ratiofor developing countries) and foreign banks tend to have lower employment (the differenceis about 35% of the group average).8 In industrial countries, we find no significant corre-lation between bank ownership and employment.
7 Berger et al. (2000) and DeYoung and Nolle (1996) find evidence that foreign banks operating in industrialcountries are less efficient than domestically owned banks.
8 Higher employment seems to be the main explanation for the higher overhead costs of public banks located indeveloping countries. If we re-run the equation of column 5 and control for employment, we find that this lattervariable is statistically significant and, once we control for employment, the dummies for public and foreignownership drop in both magnitude and level of statistical significance (PUB is no longer significant and FORremains marginally significant at the 10% confidence level).
A. Micco et al. / Journal of Banking & Finance 31 (2007) 219–241 229
3.2. The role of politics
The previous section showed that state-owned banks located in developing countriestend to be less profitable and have lower margins and higher overhead costs than domes-tic privately-owned banks with similar characteristics. There are two possible explana-tions for this finding. Those who claim that state-owned banks have a social ordevelopment role argue that these public banks are less profitable because they addressmarket imperfections that would leave socially profitable but financially unprofitableinvestments underfinanced (Gerschenkron, 1962; Stiglitz, 1994). Those who are criticalof the role of state-owned banks instead claim that state-owned banks are inefficientbecause they are captured by politicians who are only interested in maximizing their per-sonal objectives (La Porta et al., 2002). Levy-Yeyati et al. (2004) survey the existing lit-erature and point out that it is extremely hard to use cross-country data to testwhether the behavior of state-owned banks is better reflected by the political or by thesocial/development view (see also Rodrik, 2005). Studies that use bank-level data findthat politics plays a role in the lending decisions of state-owned banks. Sapienza (2004)studies the lending behavior of Italian banks and finds that state-owned banks areaffected by the electoral results of the party affiliated with the bank. Khwaja and Mian(2005) focus on Pakistan and find that state-owned banks tend to favor firms with polit-ically connected directors by lending more and allowing for higher default rates. Dinc(2005) uses bank-level data for 36 countries (19 emerging markets and 17 industrial coun-tries) and shows that elections affect the lending behavior of state-owned banks located inemerging market countries. In particular, he finds that during election years, state-ownedbanks located in emerging market countries significantly increase lending, but that this isnot true for private banks. He also finds that elections do not affect lending of private andpublic banks located in industrial countries. Dinc’s (2005) specification, however, doesnot make it possible to determine whether the increase in lending is due to a shock inthe demand or supply of loans.
In this section, we check whether elections affect the relationship between bank owner-ship and performance by estimating the following equation:
PERFi;j;t ¼ gj;t þ PUBi;j;tða1 þ a2GROWTHj;t þ a3ELECTj;tÞþ FORi;j;tðb1 þ b2GROWTHj;tÞ þ X i;j;tc
0 þ ei;j;t: ð2Þ
In the set-up of Eq. (2), GROWTHj,t is a variable that measures real GDP growth in coun-try j and year t, and ELECTj,t is a dummy variable that takes value one when country j isin an election year and zero otherwise (we use presidential elections in countries with apresidential system and legislative elections in countries with parliamentary systems).9
All other variables are defined as in Eq. (1), and we also impose the same sample restric-tions and weighting scheme used in the estimation of Eq. (1).
Our coefficient of interest is a3. This coefficient measures whether the presence of elec-tions affects the performance of state-owned banks (the main effect of elections is con-trolled by the country-year fixed effect) and can be used to test some predictions of the
9 We have data on elections for 135 countries. Over the 1996–2002 period (since we use lags we cannot useelections for 1995), 50% of these countries had one election, 45% had two elections, and the remaining 5% hadthree elections (the total number of elections in the sample is 208).
230 A. Micco et al. / Journal of Banking & Finance 31 (2007) 219–241
political view of public banks.10 In particular, the political view would be consistent with anegative value of a3 in the profitability and margin regressions, and a positive value of a3
in the overhead regression (if political pressures increase the number of employees duringelection years). We control for the interaction between ownership and GDP growth (again,the main effect of GDP growth is controlled for by the country-year fixed effect) becausestate-owned and foreign banks may have a differential reaction to the business cycle withrespect to private domestic banks (Micco and Panizza, 2004). This would not be a problemif the business cycles were uncorrelated with the electoral cycles, but political businesscycle theory suggests that such a correlation may exist (see Drazen, 2000, for a survey).11
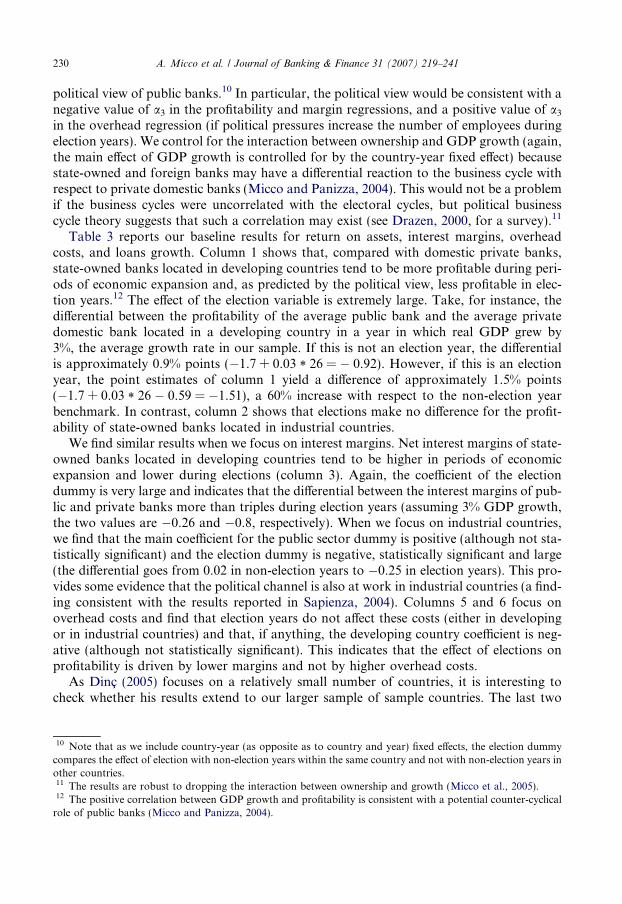
Table 3 reports our baseline results for return on assets, interest margins, overheadcosts, and loans growth. Column 1 shows that, compared with domestic private banks,state-owned banks located in developing countries tend to be more profitable during peri-ods of economic expansion and, as predicted by the political view, less profitable in elec-tion years.12 The effect of the election variable is extremely large. Take, for instance, thedifferential between the profitability of the average public bank and the average privatedomestic bank located in a developing country in a year in which real GDP grew by3%, the average growth rate in our sample. If this is not an election year, the differentialis approximately 0.9% points (�1.7 + 0.03 * 26 = � 0.92). However, if this is an electionyear, the point estimates of column 1 yield a difference of approximately 1.5% points(�1.7 + 0.03 * 26 � 0.59 = �1.51), a 60% increase with respect to the non-election yearbenchmark. In contrast, column 2 shows that elections make no difference for the profit-ability of state-owned banks located in industrial countries.
We find similar results when we focus on interest margins. Net interest margins of state-owned banks located in developing countries tend to be higher in periods of economicexpansion and lower during elections (column 3). Again, the coefficient of the electiondummy is very large and indicates that the differential between the interest margins of pub-lic and private banks more than triples during election years (assuming 3% GDP growth,the two values are �0.26 and �0.8, respectively). When we focus on industrial countries,we find that the main coefficient for the public sector dummy is positive (although not sta-tistically significant) and the election dummy is negative, statistically significant and large(the differential goes from 0.02 in non-election years to �0.25 in election years). This pro-vides some evidence that the political channel is also at work in industrial countries (a find-ing consistent with the results reported in Sapienza, 2004). Columns 5 and 6 focus onoverhead costs and find that election years do not affect these costs (either in developingor in industrial countries) and that, if anything, the developing country coefficient is neg-ative (although not statistically significant). This indicates that the effect of elections onprofitability is driven by lower margins and not by higher overhead costs.
As Dinc (2005) focuses on a relatively small number of countries, it is interesting tocheck whether his results extend to our larger sample of sample countries. The last two
10 Note that as we include country-year (as opposite as to country and year) fixed effects, the election dummycompares the effect of election with non-election years within the same country and not with non-election years inother countries.11 The results are robust to dropping the interaction between ownership and growth (Micco et al., 2005).12 The positive correlation between GDP growth and profitability is consistent with a potential counter-cyclical
role of public banks (Micco and Panizza, 2004).

Table 3Test of the political channel: do elections matter?
Return on assets (ROA) Interest margin over totalassets
Overhead cost over totalassets
Loans growth
(1) (2) (3) (4) (5) (6) (7) (8)
PUB �1.740 �0.117 �0.644 0.066 0.412 0.408 0.244 0.208(0.406)*** (0.087) (0.238)*** (0.096) (0.157)*** (0.135)*** (0.187) (0.162)
FOR 0.165 0.023 0.060 �0.132 �0.859 �0.022 0.212 �0.388(0.171) (0.072) (0.127) (0.080)* (0.150)*** (0.087) (0.201) (0.252)
PUB * ELECT �0.591 �0.043 �0.565 �0.270 �0.142 0.058 0.339 0.099(0.265)** (0.101) (0.189)*** (0.110)** (0.251) (0.147) (0.129)*** (0.121)
PUB * GROWTH 26.185 2.631 12.696 �1.422 0.381 �7.762 �3.054 �6.051(9.486)*** (2.300) (5.022)** (2.858) (2.891) (3.814)** (1.906) (4.019)
FOR * GROWTH 5.256 �1.163 �2.244 �4.150 6.256 �5.863 �3.449 2.933(3.964) (1.673) (2.955) (2.528) (3.428)* (3.262)* (1.811)* (3.400)
No. obs. 5256 13,092 5244 13,246 5269 13,232 5196 13,116R2 0.5329 0.4759 0.7345 0.6172 0.7633 0.7918 0.7712 0.7911Sample Developing Industrial Developing Industrial Developing Industrial Developing Industrial
P value of F test on the joint significance of PUB * GROWTH and FOR * GROWTH
0.007 0.262 0.031 0.253 0.166 0.069 0.059 0.091
Results for ROA, interest margin, overhead cost, and loans growth. PUB and FOR are dummy variables taking a value of one for state-owned banks and foreign-owned banks, respectively. ELECT is a dummy variable taking a value of one when a country is in an election year and GROWTH is a variable that measures realGDP growth. All regressions are weighted by asset share, include country-year fixed effects, and control for the variables included in Table 2 (NONINT, DDEP,LTA, and SHTA).Robust standard errors in parentheses.
* Significant at 10%.** Significant at 5%.
*** Significant at 1%.
A.
Micco
eta
l./
Jo
urn
al
of
Ba
nk
ing
&F
ina
nce
31
(2
00
7)
21
9–
24
1231
232 A. Micco et al. / Journal of Banking & Finance 31 (2007) 219–241
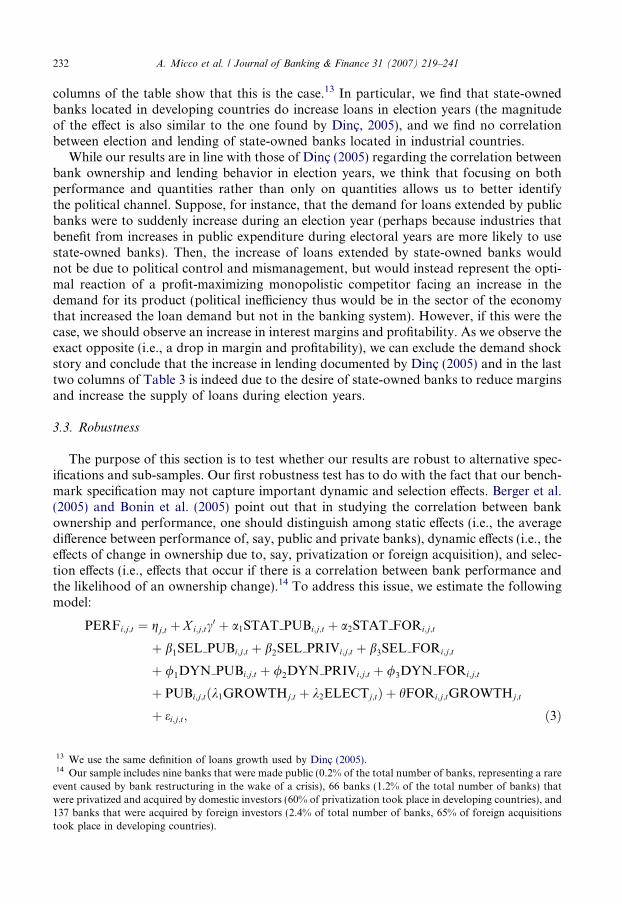
columns of the table show that this is the case.13 In particular, we find that state-ownedbanks located in developing countries do increase loans in election years (the magnitudeof the effect is also similar to the one found by Dinc, 2005), and we find no correlationbetween election and lending of state-owned banks located in industrial countries.
While our results are in line with those of Dinc (2005) regarding the correlation betweenbank ownership and lending behavior in election years, we think that focusing on bothperformance and quantities rather than only on quantities allows us to better identifythe political channel. Suppose, for instance, that the demand for loans extended by publicbanks were to suddenly increase during an election year (perhaps because industries thatbenefit from increases in public expenditure during electoral years are more likely to usestate-owned banks). Then, the increase of loans extended by state-owned banks wouldnot be due to political control and mismanagement, but would instead represent the opti-mal reaction of a profit-maximizing monopolistic competitor facing an increase in thedemand for its product (political inefficiency thus would be in the sector of the economythat increased the loan demand but not in the banking system). However, if this were thecase, we should observe an increase in interest margins and profitability. As we observe theexact opposite (i.e., a drop in margin and profitability), we can exclude the demand shockstory and conclude that the increase in lending documented by Dinc (2005) and in the lasttwo columns of Table 3 is indeed due to the desire of state-owned banks to reduce marginsand increase the supply of loans during election years.
3.3. Robustness
The purpose of this section is to test whether our results are robust to alternative spec-ifications and sub-samples. Our first robustness test has to do with the fact that our bench-mark specification may not capture important dynamic and selection effects. Berger et al.(2005) and Bonin et al. (2005) point out that in studying the correlation between bankownership and performance, one should distinguish among static effects (i.e., the averagedifference between performance of, say, public and private banks), dynamic effects (i.e., theeffects of change in ownership due to, say, privatization or foreign acquisition), and selec-tion effects (i.e., effects that occur if there is a correlation between bank performance andthe likelihood of an ownership change).14 To address this issue, we estimate the followingmodel:
PERFi;j;t ¼ gj;t þ X i;j;tc0 þ a1STAT PUBi;j;t þ a2STAT FORi;j;t
þ b1SEL PUBi;j;t þ b2SEL PRIVi;j;t þ b3SEL FORi;j;t
þ /1DYN PUBi;j;t þ /2DYN PRIVi;j;t þ /3DYN FORi;j;t
þ PUBi;j;tðk1GROWTHj;t þ k2ELECTj;tÞ þ hFORi;j;tGROWTHj;t
þ ei;j;t; ð3Þ
13 We use the same definition of loans growth used by Dinc (2005).14 Our sample includes nine banks that were made public (0.2% of the total number of banks, representing a rare
event caused by bank restructuring in the wake of a crisis), 66 banks (1.2% of the total number of banks) thatwere privatized and acquired by domestic investors (60% of privatization took place in developing countries), and137 banks that were acquired by foreign investors (2.4% of total number of banks, 65% of foreign acquisitionstook place in developing countries).

A. Micco et al. / Journal of Banking & Finance 31 (2007) 219–241 233
where STAT_PUBi,j,t (STAT_FORi,j,t) is a dummy variable that takes value one if bank i
is public (foreign) and did not change ownership in the period under observation (the ex-cluded dummy is STAT_PRIVi,j,t). Therefore, a1 and a2 measure the static effects of publicand foreign ownership expressed as a difference from the performance of private domes-tically owned banks that never changed ownership. SEL_PUBi,j,t is a dummy variable thattakes value one for banks that used to have a different form of ownership but became pub-lic during the period under observation (SEL_PRIVi,j,t, and SEL_FORi,j,t are defined insimilar ways ).15 Therefore, b1, b2, and b3 measure the selection effects of public, private,and foreign ownership. Finally, DYN_PUBi,j,t is a dummy variable that takes value oneafter a bank changes ownership and becomes public and zero before this change in own-ership occurs (DYN_PRIVi,j,t and DYN_FORi,j,t are defined similarly). Therefore, /1, /2,and /3 measure the dynamic effect of ownership change. gj,t and Xi,j,t are defined as in Eq.(1).
Table 4 reports the results for return on assets, interest margins, and overhead costs. Inmost cases, the static coefficients for public and foreign ownership are similar (both in theirmagnitude and level of statistical significance) to the ownership coefficients described inTable 3. The only exception is the coefficient for public ownership in the ROA regressionfor industrial countries. In this case, Table 4 finds a statistically significant coefficient(however, this effect is still rather small when compared with that of developing countries).When we look at selection effects, we find only two significant results. The first indicatesthat banks located in industrial countries that are selected for privatization and acquiredby a domestic investor tend to have higher overhead costs than private banks that neverchanged ownership type. The second indicates that banks located in developing countriesthat were acquired by foreign entities have lower ROA than comparable private banksthat never changed ownership. The dynamic effect of privatization by domestic banks isnegative and statistically significant for overhead costs in the sample of industrial coun-tries and not statistically significant in the other regressions. This indicates that acquisitionof public banks by domestic investors has no significant effect on profitability and marginsbut a positive effect on the efficiency (measured by cost reduction) of banks located inindustrial countries.16 In developing countries the dynamic effect of foreign ownershipon profitability is positive but not statistically significant, the effect on margin negativeand not significant, and the effect on cost is negative and statistically significant. In indus-trial countries, on the other hand, we find a negative and statistically significant dynamiceffect of foreign acquisition on profitability but no significant effect on margins and cost.More interesting for our purposes is that controlling for selection and dynamic effects doesnot affect our basic result that public banks profitability and interest margin tend to beparticularly low during election years.
15 If a bank has more than one change in ownership, we use the last change (this is the strategy followed byBerger et al., 2005). If a bank was public, then sold to a domestic investor, and subsequently acquired by a foreigncompany, we assign value one to SEL_FORi,j,t and zero to SEL_PUBi,j,t and SEL_PRIVi,j,t. Public banks thatwere acquired by foreign entities are classified as being selected to become foreign. In this sense, we are notdifferentiating foreign acquisitions of domestic private banks and foreign acquisition of domestic public banks.Including this differentiation does not affect our results.16 At least this is the case for the post-privatization average. Berger et al. (2005) find some difference between
short-run and long-run effects. Unfortunately, our panel is not long enough to distinguish between the two typesof effects.

Table 4Selection and dynamic effects
Return on assets (ROA) Interest margin over totalassets
Overhead cost over totalassets
(1) (2) (3) (4) (5) (6)
ST_PUB �1.604 �0.263 �0.787 �0.106 0.361 0.266(0.377)*** (0.075)*** (0.227)*** (0.082) (0.139)*** (0.118)**
ST_FOR 0.279 0.017 0.180 �0.157 �0.875 �0.041(0.181) (0.073) (0.132) (0.079)** (0.163)*** (0.086)
SE_PUB �0.053 1.084 �0.475 �0.201 �0.186 �0.580(0.179) (0.471)** (0.162)*** (0.270) (0.099)* (0.247)**
SE_PRI �0.161 �0.099 �0.069 0.149 0.270 0.391(0.489) (0.074) (0.376) (0.094) (0.535) (0.104)***
SE_FOR �0.494 0.098 �0.066 0.104 �0.111 0.100(0.190)*** (0.070) (0.146) (0.099) (0.126) (0.081)
DY_PUB �3.593 0.000 �0.610 0.000 �0.211 0.000(1.833)* (0.000) (0.514) (0.000) (0.399) (0.000)
DY_PRI 0.066 0.013 0.130 �0.191 �0.414 �0.393(0.528) (0.107) (0.450) (0.149) (0.584) (0.126)***
DY_FOR 0.337 �0.314 �0.176 �0.128 �0.566 0.090(0.248) (0.112)*** (0.229) (0.125) (0.207)*** (0.122)
PUB * ELECT �0.743 �0.007 �0.546 �0.213 �0.103 0.117(0.261)*** (0.096) (0.186)*** (0.104)** (0.247) (0.152)
PUB * GROWTH 21.785 4.829 12.952 1.364 1.615 �4.536(8.601)** (1.889)** (4.620)*** (2.322) (2.672) (3.028)
FOR * GROWTH 3.978 �0.413 �3.102 �3.882 5.613 �5.895(3.895) (1.613) (2.938) (2.396) (3.483) (3.050)*
No. obs. 5256 13,092 5244 13,246 5269 13,232R2 0.5338 0.4858 0.7366 0.6194 0.7628 0.7923Sample Developing Industrial Developing Industrial Developing Industrial
Results for ROA, interest margin, and overhead cost. PUB and FOR are dummy variables taking a value of onefor state-owned banks and foreign-owned banks, respectively. STAT_PUB is a dummy variable that takes a valueof one for state-owned banks that never changed ownership during the period under observation (STAT_FOR isdefined in the same way for foreign-owned banks). SEL_PUB is a dummy variable that takes a value of one forbanks that became public during the period under observation (SEL_PRIV, and SEL_FOR are defined in similarways). DYN_PUB is a dummy variable that takes a value of one after a bank changes ownership and becomespublic and zero before the change in ownership takes place and it is always equal to zero for banks that did notchange ownership during the period under consideration (DYM_PRIV and DYM_FOR are defined similarly).ELECT is a dummy variable taking value one when a country is in an election year, and GROWTH is a variablethat measures real GDP growth. All regressions are weighted by asset share, include country-year fixed effects,and control for the variables included in Table 2 (NONINT, DDEP, LTA, and SHTA).Robust standard errors in parentheses.
* Significant at 10%.** Significant at 5%.
*** Significant at 1%.
234 A. Micco et al. / Journal of Banking & Finance 31 (2007) 219–241
After having established that our results are robust to controlling for selection anddynamic effects, we briefly describe a further series of robustness tests. The first battery
A. Micco et al. / Journal of Banking & Finance 31 (2007) 219–241 235
of robustness tests focuses on the econometric specification. The second focuses on alter-native weighting schemes. The third focuses on the sample of banks included in theanalysis.
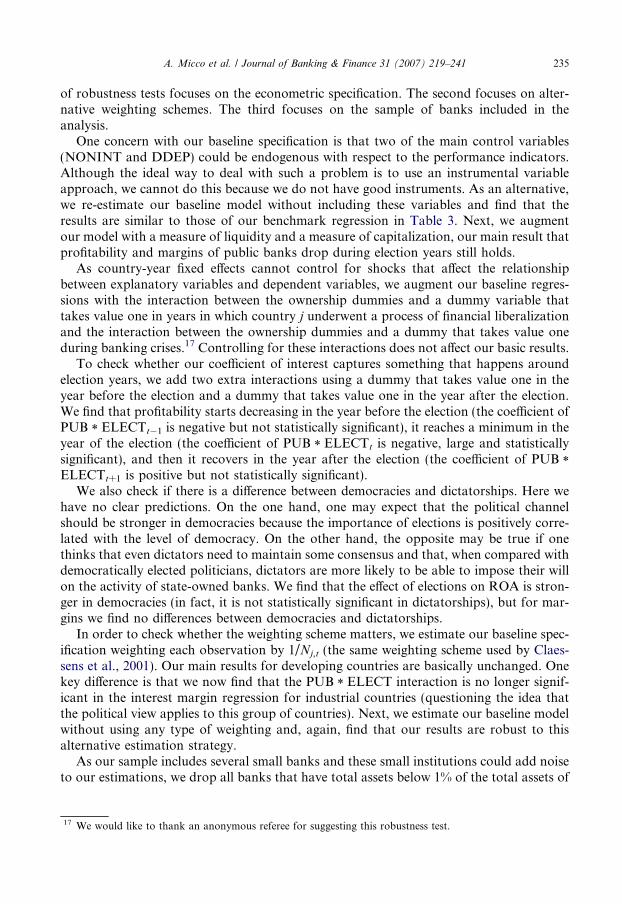
One concern with our baseline specification is that two of the main control variables(NONINT and DDEP) could be endogenous with respect to the performance indicators.Although the ideal way to deal with such a problem is to use an instrumental variableapproach, we cannot do this because we do not have good instruments. As an alternative,we re-estimate our baseline model without including these variables and find that theresults are similar to those of our benchmark regression in Table 3. Next, we augmentour model with a measure of liquidity and a measure of capitalization, our main result thatprofitability and margins of public banks drop during election years still holds.
As country-year fixed effects cannot control for shocks that affect the relationshipbetween explanatory variables and dependent variables, we augment our baseline regres-sions with the interaction between the ownership dummies and a dummy variable thattakes value one in years in which country j underwent a process of financial liberalizationand the interaction between the ownership dummies and a dummy that takes value oneduring banking crises.17 Controlling for these interactions does not affect our basic results.
To check whether our coefficient of interest captures something that happens aroundelection years, we add two extra interactions using a dummy that takes value one in theyear before the election and a dummy that takes value one in the year after the election.We find that profitability starts decreasing in the year before the election (the coefficient ofPUB * ELECTt�1 is negative but not statistically significant), it reaches a minimum in theyear of the election (the coefficient of PUB * ELECTt is negative, large and statisticallysignificant), and then it recovers in the year after the election (the coefficient of PUB *ELECTt+1 is positive but not statistically significant).
We also check if there is a difference between democracies and dictatorships. Here wehave no clear predictions. On the one hand, one may expect that the political channelshould be stronger in democracies because the importance of elections is positively corre-lated with the level of democracy. On the other hand, the opposite may be true if onethinks that even dictators need to maintain some consensus and that, when compared withdemocratically elected politicians, dictators are more likely to be able to impose their willon the activity of state-owned banks. We find that the effect of elections on ROA is stron-ger in democracies (in fact, it is not statistically significant in dictatorships), but for mar-gins we find no differences between democracies and dictatorships.
In order to check whether the weighting scheme matters, we estimate our baseline spec-ification weighting each observation by 1/Nj,t (the same weighting scheme used by Claes-sens et al., 2001). Our main results for developing countries are basically unchanged. Onekey difference is that we now find that the PUB * ELECT interaction is no longer signif-icant in the interest margin regression for industrial countries (questioning the idea thatthe political view applies to this group of countries). Next, we estimate our baseline modelwithout using any type of weighting and, again, find that our results are robust to thisalternative estimation strategy.
As our sample includes several small banks and these small institutions could add noiseto our estimations, we drop all banks that have total assets below 1% of the total assets of
17 We would like to thank an anonymous referee for suggesting this robustness test.
236 A. Micco et al. / Journal of Banking & Finance 31 (2007) 219–241
the domestic banking system. This drastically reduces our sample but does not affect ourbasic results. We also see what happens when we restrict the sample to 10 banks per coun-try and, again, find that the results do not change. We also check what happens when werelax the restriction of only including country-years with at least five banks. The results areunchanged.
Finally, we run separate regressions for each group of developing countries and checkwhether the results are driven by any particular region. We find that in five out of sevenregions the PUB coefficient is negative (statistically significant in four regions) and in oneregion (the Middle East) positive but close to zero and not statistically significant. TheCaribbean is the only developing region in which public banks seem to be significantlymore profitable than private domestic banks. When we focus on foreign banks, we findthat the coefficient is positive in six regions and negative and statistically significant inLatin America (a result that is consistent with what was found by Levy-Yeyati and Micco,2003). We also find that the PUB * ELECT interaction is negative in six regions and posi-tive (but not significant and close to zero) in South Asia. While this experiment shows thatthere is some cross-regional heterogeneity and that the results are sometimes not signifi-cant when we focus on one region at a time, it also shows that the results are never drivenby one particular region and that this is especially the case for our main variable of interest(i.e., the PUB * ELECT interaction).
4. Conclusions
This paper finds that state-owned banks located in developing countries are less prof-itable than their private counterparts and that the difference between the performanceof public and private banks increases during elections years. The main advantage of ourestimation strategy is that it allows us to separate price from quantity effects and allowsus to show that the previously documented increase in bank lending during election yearsis indeed due to an increase in the supply of loans by state-owned banks. Hence, our find-ings provide further support for the political view of public banks and corroborate previ-ous findings by Dinc (2005), Sapienza (2004), and Khwaja and Mian (2005).
As a note of caution, it is important to mention that our results do not necessarily implythat state-owned banks play no role in development. In fact, the development and politicalviews should not be seen as corner solutions without any intermediate possibility; it is pos-sible that a development mandate co-exists with some political lending. The key challengefor future research is to understand if, and under what conditions, the potential benefits ofthe development mandate can outweigh the inefficiencies and the potential for corruptiongenerated by political lending.
Acknowledgements
We would like to thank two anonymous referees for very detailed reports that greatlyhelped us in revising and refocusing the paper, Arturo Galindo and Eduardo Levy-Yeyatifor useful comments and suggestions, Cecilia Calderon, Erwin Hansen, Hermes Martınez,Danielken Molina, and Cristobal Ruiz-Tagle for help in coding the data, and John Smithfor editing the paper. The views expressed in this paper are the authors’ and do not nec-essarily reflect those of the Inter-American Development Bank or the Central Bank ofChile. The usual caveats apply.
A. Micco et al. / Journal of Banking & Finance 31 (2007) 219–241 237
Appendix A. The construction of the dataset
We obtained data for the 1995–1999 period from the June 2001 update of BSC and datafor the 2000–2002 period from the February 2004 update of BSC. In order to use BSC datafor our statistical analysis we had to avoid duplications and code bank ownership andtrack ownership changes.
A.1. Avoiding duplications
Our starting dataset (after dropping central banks, investment banks, securities houses,multilateral government banks, non-banking credit institutions, and specialized govern-ment financial institutions) consisted of 120,809 observations. Our first problem relatesto choosing whether to work with consolidated or unconsolidated statements. We decidedto work with unconsolidated statements because consolidated statements might end upduplicating the data (if Bank A owns Bank B, using the consolidated statement of BankA would lead us to double count the assets of Bank B). Therefore, in our empirical anal-ysis we mostly use unconsolidated statements. If BSC reported both types of statements forall banks, we could simply drop all consolidated statements and end up with a sample thatincludes one observation for each bank-year. However, some banks only have a consoli-dated statement, while others only have an unconsolidated statement. Hence, droppingjust one category would lead to loss of information. Therefore, whenever a bank doesnot have an unconsolidated statement (which occurs in about 10% of cases), we use theconsolidated statement.
Dealing with different levels of consolidation is not straightforward. As BSC often usesa different identification number for each level of consolidation, it is impossible to use thisidentification number to keep the consolidated statements of banks that lack an unconsol-idated statement. Fortunately, BSC has a variable called CTRYRANK (this is the rankingof the bank by total assets) that uniquely identifies a large number of banks and allows usto avoid duplication and retain one statement per bank. One problem with CTRYRANKis that this variable uses data for the last available balance sheet reported in each BSC disc.As we use discs that have data up to 1999 and 2002, we do not have this variable for banksthat ceased to operate before 1999. This is a serious issue for banks that went through amerger or were closed because they had become insolvent. We address this problem byindividually looking at all banks that have missing values for CTRYRANK and by assign-ing a code that uniquely identifies each bank in this subgroup.18 This new code, togetherwith CTRYRANK, uniquely identifies all the banks included in the sample.
Another problem we faced in working with this large sample of bank-level data is thatBSC reports balance sheet data at the aggregated levels. BSC builds aggregated statementsby combining the statements of banks that have merged or are about to merge. Aggre-gated statements may then report the data of groups of affiliated banks that neither havefinancial links nor form a legal entity. Take for instance two banks (banks A and B) thatmerged in 1999. For the period 1995–1999, BSC would report balance sheets for threebanks: one for Bank A, one for Bank B, and an aggregated statement that would add
18 In recoding non-ranked banks we looked at all observations but paid particular attention to all the non-ranked banks with assets greater than the country average.
238 A. Micco et al. / Journal of Banking & Finance 31 (2007) 219–241
up the statements of Banks A and B. Starting from 2000, BSC would no longer report datafor Banks A and B but only for the new unit that resulted from the mergers (sometimesthis new unit will have the name of one of the two old banks and sometimes it will havea completely new name). This example shows that a given bank might be reported in BSCup to four times: as an independent unit by its consolidated and unconsolidated statementsand as part of aggregated consolidated and unconsolidated statements. There are two pos-sible ways to deal with banks that have aggregated statements. The first is to always workwith the aggregated statement and drop the observations for the individual banks. Thesecond is to drop the aggregated statement and work with the individual banks up tothe time of the merger and then, starting from the year of the merger, with the new bank.We adopt the latter strategy.
An example may clarify our procedure. Consider the case of INTESA, the largest Ital-ian banking group. INTESA was created in 1998 with the merger of CARIPLO andAMBROVENETO. In 1999, Banca Commerciale Italiana (COMIT) joined the INTESAgroup, and in 2001 COMIT completely merged with INTESA, which took the name ofINTESABCI. As of 2000, BSC reports data for (i) COMIT; (ii) AMBROVENETO; (iii)CARIPLO; and (iv) INTESABCI. Clearly, considering all these four banks would leadto a large overestimation of Italian banking assets. In this case, CTRYRANK variablecan help avoid duplications, but we also need to use additional information. In fact,CTRYRANK takes value one for INTESABCI (recognizing that this is the largest bankin the country), five for CARIPLO and 12 for AMBROVENETO. COMIT is not ranked(CTRYRANK takes the value NR). Clearly, dropping the banks that are coded as non-ranked (COMIT) can help in preventing duplication but this does not solve all of ourproblems. First, the dataset would still include INTESABCI and two of its components(AMBROVENETO and CARIPLO). Second, the ranking variable refers to the last year,and hence if we were to drop all the banks that are not ranked, we would also dropCOMIT for the 1995–1999 period. To address this issue, we looked at one bank at a time,checked whether the bank was part of a merger event and, if this was the case, recoded theCTRYRANK variables in order to keep the individual banks up to the merger and thenthe new bank starting from the date of the merger. In the case of the example describedabove, we re-ranked (and hence included in the dataset) COMIT from 1995 to 1999and de-ranked (and hence excluded from the dataset) Ambroveneto and CARIPLO for2000–2002 and Intesa BCI for 1995–1999. After dropping the non-ranked bank we endup with three banks (COMIT, Ambroveneto and CARIPLO) operating for the 1995–1999 period and one bank (IntesaBCI) operating for the 2000–2002 period. This strategyrequired a considerable amount of effort and led to a massive amount of recoding butmade us confident that our dataset does a good job of tracking the main bank mergers.
A.2. Coding ownership
Although BSC includes an ownership variable, this variable has limited coverage anddoes not track ownership history. To code ownership, we started with the BSC dataand then used different sources to code banks and to track ownership history for banksthat were coded by BSC. To track ownership changes, we started with the informationavailable in BSC (there is a field with a brief history of each institution) and the privati-zation databases assembled by the World Bank, Privatization Barometer, Verbruggeet al. (1999), Megginson (2003), Andrews (2005), Bonin et al. (2005), Beck et al. (2004),

A. Micco et al. / Journal of Banking & Finance 31 (2007) 219–241 239
and Clarke and Cull (2002). Next, we gathered information on ownership status and own-ership history from individual bank websites (several bank websites include a section thatnarrates the history of the bank). When the bank website did not provide enough informa-tion, we consulted various publications (including Euromoney, Bankers Almanac, Amer-ican Banker, Bank Director, Pensions and Investments, ABA Banking Journal),performed several Internet searches, and consulted country experts.
Coding ownership was an extremely time-consuming but fairly straightforward exercisebecause we had to make only two decisions. The first concerned whether to establish a cut-off point under which banks would not be coded, and the second had to do with the factthat banks are sometimes owned by other companies.
Concerning the cut-off point, we started by coding the 10 largest banks in each country(the same strategy followed by La Porta et al., 2002). Then, if these banks represented lessthan 75% of total assets of the banking system, we coded all banks up to 75% of totalassets of the banking system.19
One thing that we did not do was to code private banks into family-owned (or privatelyheld) and widely-held (Caprio et al., 2004, do this for a sample of 244 banks located in 44countries). While having this additional breakdown of the ownership variable would allowus to conduct a series of additional interesting tests and focus on possible differencesbetween the performance of family-owned and widely-held banks, obtaining this type ofdata for all banks in our sample would require an enormous amount of work and go wellbeyond the scope of this paper.
The second issue had to do with banks owned by other companies. There are two waysto deal with this problem. The first approach is to look at the nationality of the parentcompany and code the bank as domestically-owned if the parent company is headquar-tered in the same country as the bank, and foreign-owned if the parent company is head-quartered in another country. The second approach is to look at who owns the parentcompany and then code bank ownership based on the ownership of the parent company.Following La Porta et al. (2002), we adopted the latter strategy. Whenever X percent of agiven bank (Bank A) was owned by another company (Company B) and Y percent ofCompany B was owned by a foreign company (alternately state-owned), we coded BankA as being X * Y percent foreign (state) owned (we always went back at least two stepsin the ownership structure). When coding ownership of banks owned by foreign govern-ments (for instance, an Argentinean bank owned by Banco do Brazil which, in turn, isowned by the Brazilian government), we also adopted the strategy used by La Portaet al. (2002), which classifies as state-owned only those banks that are owned by thedomestic government and as foreign those banks owned by foreign governments.
19 Even with this cut-off, a lot of time was spent on constructing the dataset. Coding ownership required twomonths of work of a full-time research assistant, plus the help of several other research assistants for a shorterperiod of time. In Latin America, East Asia, Eastern Europe and industrial countries (these are the regions withthe largest number of banks), we coded the largest 20 banks and, again, if these 20 banks represented less than75% of total assets of the banking system, we coded up to 75% of assets of the banking system. We also coded allbanks that were not among the top 20 or in the 75th percentile but had an obvious coding (for instance, a banklocated in Lebanon called HSBC was automatically coded as foreign), were included in one of the privatizationdatasets mentioned above or were originally coded by BSC (therefore, we tracked ownership history for all bankscoded by BSC, independently of their size).
240 A. Micco et al. / Journal of Banking & Finance 31 (2007) 219–241
References
Altunbas, Y., Evans, L., Molyneux, P., 2001. Bank ownership and efficiency. Journal of Money, Credit andBanking 33 (4), 926–954.
Andrews, M., 2005. State-owned banks, stability, privatization, and growth: practical policy decisions in a worldwithout empirical proof. Working Paper # 05/10. International Monetary Fund.
Barth, J., Caprio, G., Levine, R., 2001. Banking systems around the globe: do regulation and ownership affectperformance and stability? In: Mishkin, F. (Ed.), Prudential Supervision: What Works and What Doesn’t?National Bureau of Economic Research and University of Chicago Press, Chicago.
Beck, T., Crivelli, J.M., Summerhill, W., 2004. State Bank Transformation in Brazil: Choices and Consequences.Mimeo, The World Bank.
Berger, A., DeYoung, R., Genay, H., Udell, G., 2000. Globalization of financial institutions: evidence from cross-border banking performance. Brookings Papers on Economic Activity 2, 23–158.
Berger, A., Clarke, G., Cull, R., Klapper, L., Udell, G., 2005. Corporate governance and bank performance: ajoint analysis of the static, selection, and dynamic effects of domestic, foreign, and state ownership. PolicyResearch Working Paper # 3632. The World Bank.
Bhattacharya, K., 2003. How good is the BankScope database? A cross-validation exercise with correction factorsfor market concentration measures. Working Paper # 133. Bank for International Settlements.
Bonin, J., Hasan, I., Wachtel, P., 2005. Bank performance, efficiency and ownership in transition countries.Journal of Banking and Finance 29 (1), 31–53.
Caprio, G., Laeven, L., Levine, R., 2004. Governance and bank valuation. Policy Research Working Paper #3202. The World Bank.
Claessens, S., Demirguc-Kunt, A., Huizinga, H., 2001. How does foreign entry affect the domestic bankingmarket? Journal of Banking and Finance 25 (5), 891–911.
Clarke, G., Cull, R., 2002. Political and economic determinants of the likelihood of privatizing argentine publicbanks. Journal of Law and Economics 45, 165–197.
Clarke, G., Cull, R., D’Amato, L., Molinari, A., 2000. The effect of foreign entry on Argentina’s domesticbanking sector. In: Claessens, S., Jansen, M. (Eds.), Internationalization of Financial Services: Issues andLessons for Developing Countries. Kluwer Academic, Boston.
Clarke, G., Cull, R., Shirley, M., 2003. Empirical studies of bank privatization. Working Paper Presented atWorld Bank Conference on Bank Privatization. Washington, DC, November 20–21.
Demirguc-Kunt, A., Huizinga, H., 2000. Determinants of commercial bank interest margins and profitability:some international evidence. World Bank Economic Review 13 (2), 379–408.
DeYoung, R., Nolle, D., 1996. Foreign owned banks in the US: earning market share or buying it? Journal ofMoney, Credit and Banking 28 (4), 622–636.
Dinc, S., 2005. Politicians and banks: political influences on government-owned banks in emerging countries.Journal of Financial Economics 77, 453–459.
Drazen, A., 2000. The political business cycle after 25 yearsNBER Macroeconomics Annual 2000. MIT Press,Cambridge, MA.
Gerschenkron, A., 1962. Economic Backwardness in Historical Perspective. Harvard University Press,Cambridge, MA.
Khwaja, A., Mian, A., 2005. Do lenders favor politically connected firms? Rent provision in an emerging financialmarket. Quarterly Journal of Economics 120 (4), 1371–1411.
Laeven, L., 2001. Insider lending and bank ownership. The Case of Russia. Journal of Comparative Economics29, 207–229.
La Porta, R., Lopez-de-Silanes, F., Shleifer, A., 2002. Government ownership of banks. Journal of Finance 57(2), 265–301.
La Porta, R., Lopez-de-Silanes, F., Zamarripa, G., 2003. Related lending. Quarterly Journal of Economics 118,231–268.
Levy-Yeyati, E., Micco, A., 2003. Banking competition in Latin America. Paper Presented at the First LatinAmerican Competition Forum of the Organization for Economic Co-operation and Development and theInter-American Development Bank, Paris, France.
Levy-Yeyati, E., Micco, A., Panizza, U., 2004. Should the government be in the banking business? The role ofstate-owned and development banks. Research Working Paper # 517. Inter-American Development Bank.
Megginson, W., 2003. The economics of bank privatization. Paper Prepared for the World Bank Conference onBank Privatization in Low and Middle Income Countries, Washington, DC, November 20–21, 2003.
A. Micco et al. / Journal of Banking & Finance 31 (2007) 219–241 241
Mian, A., 2003. Foreign, private domestic, and government banks: new evidence from emerging markets. Mimeo,University of Chicago.
Micco, A., Panizza, U., 2004. Bank ownership and lending behavior. Research Working Paper # 520. Inter-American Development Bank. Forthcoming in Economics Letters.
Micco, A., Panizza, U., Yanez, M., 2005. Appendix for Bank Ownership and Performance, Does Politics Matter?Available from: <http://www.geocities.com/upanizza/APPENDIX_MPY.pdf>.
Rodrik, D., 2005. Why we learn nothing from regressing economic growth on policies? Mimeo, HarvardUniversity.
Sapienza, P., 2004. The effects of government ownership on bank lending. Journal of Financial Economics 72 (2),357–384.
Stiglitz, J., 1994. The role of the state in financial markets. In: Proceedings of the World Bank Annual Conferenceon Economic Development 1993. The World Bank, Washington, DC.
Vander Vennet, R., 1996. The effect of mergers and acquisitions on the efficiency and profitability of EC creditinstitutions. Journal of Banking and Finance 20 (9), 1531–1558.
Verbrugge, J., Megginson, W., Owens, W., 1999. State ownership and the financial performance of privatizedbanks: an empirical analysis. Working Paper Presented at the World Bank/Federal Reserve Bank of DallasConference on Bank Privatization, Washington, DC, March 15 and 16.