Embed Size (px)
Citation preview

Financial Stability Paper No. 41 – January 2017
Gauging market dynamics using traderepository data: the case of theSwiss franc de-peggingOlga Cielinska, Andreas Joseph, Ujwal Shreyas, John Tanner and Michalis Vasios
[email protected] of England, Threadneedle Street, London, EC2R 8AH
[email protected] of England, Threadneedle Street, London, EC2R 8AH
[email protected] of England, Threadneedle Street, London, EC2R 8AH
[email protected] of England, Threadneedle Street, London, EC2R 8AH
[email protected] of England, Threadneedle Street, London, EC2R 8AH
The views expressed in this paper are those of the authors, and are not necessarily those ofthe Bank of England. This paper was finalised on 3 January 2017.
© Bank of England 2017
ISSN 1754–4262
We are grateful to seminar participants at the Bank of England, the US Office of FinancialResearch, the European Systemic Risk Board, the Cambridge-INET Institute conference on themicrostructure of FX markets, and the 8th IFC Conference at BIS for helpful comments andsuggestions.
Financial Stability Paper No. 41 – January 2017
Gauging market dynamics usingtrade repository data: the case ofthe Swiss franc de-peggingOlga Cielinska, Andreas Joseph, Ujwal Shreyas,John Tanner and Michalis Vasios
Financial Stability Paper January 2017 2
Contents
Summary 3
1 Introduction 4 1.1 Background 4
1.2 Analytical results 5
2 Trade repository data 7 2.1 Reporting framework 7
2.2 The structure of the data and cleaning process 9
3 The Swiss franc market 13 3.1 Summary statistics 13
3.2 Market structure 16
4 Market impact from de-pegging the Swiss franc 21 4.1 The SNB announcement and its impact on the spot FX market 21
4.2 Reconstructing the SNB event trade-by-trade using EMIR TR data
22
4.3 Long-term impact on liquidity, volatility, and collateralisation 27
4.4 Impact on the trading network and market fragmentation 30
4.5 Impact on market activity by counterparty type 34
4.6 Spillovers to the EURUSD market 34
5 Conclusions 35
References 37
Appendix : Lessons learned from working with the TR data 38
Financial Stability Paper January 2017 3
Gauging market dynamics using trade repository data: The case of the Swiss franc de-pegging
Olga Cielinska, Andreas Joseph, Ujwal Shreyas, John Tanner and Michalis Vasios
The Bank of England (“the Bank”) has access to some of the granular transaction level data resulting from EMIR trade reports. The velocity, granularity and richness of this dataset puts it in the realm of Big Data in the derivatives market, which brings with it its own set of challenges. These data have a number of potential uses in monitoring the market and helping to set policy. But these uses are only possible if the data are both accurate and complete on the one hand and we are able to analyse them effectively on the other. To help determine the status of these factors, we carry out a study of an external event to see how it was represented in the data. A suitable event was identified in the decision of the Swiss National Bank to discontinue the Swiss franc’s floor of 1.20 Swiss francs per euro on the morning of 15 January 2015. This was expected to show a number of effects in the Swiss franc foreign exchange over-the-counter (FX OTC) derivatives market. The removal of the floor led to extreme price moves in the forwards market, similar to those observed in the spot market, while trading in the Swiss franc options market was practically halted. We find evidence that the rapid intraday price fluctuation was associated with poor underlying market liquidity conditions, in particular the limited provision of liquidity by dealer banks in the first hour after the event. Looking at longer-term effects, we observe a reduced level of liquidity, associated with an increased level of market fragmentation, higher market volatility and an increase in the degree of collateralisation in the weeks following the event. It is worth noting that whilst we analyse the impact of the event on the market and its visibility in the data, we are not commenting on the SNB’s policy decision itself.
Financial Stability Paper January 2017 4
1. Introduction
1.1. Background
The OTC derivatives market has historically been decentralised and opaque. There has been no central source for trade information, for example on prices and trade sizes, either pre- or post-trade, let alone any information about counterparty identities and the network of exposures. This has been true not only for investors, but also for regulators. But this is changing.
In response to the 2008 global financial crisis, a number of reforms have been implemented to improve the functioning of OTC derivatives markets, including increasing transparency. Most notably, in September 2009 G20 leaders agreed to make it mandatory for counterparties to derivatives transactions to report details of such contracts to trade repositories (TRs). 1 This initiative, known as the reporting obligation, aimed to open the black box of OTC derivatives by making it possible for regulators to access, for the first time, granular transactional data.
The reporting obligation is being implemented across different jurisdictions: for example, in the U.S., trade reporting is part of the Dodd-Frank Act and was implemented by the U.S. Commodity Futures Trading Commission (CFTC) in December 2012 2 . CFTC required all U.S. market participants to submit OTC derivatives trade reports within their scope to swap data repositories (i.e. the U.S. equivalent of the TRs), which in turn make these data available to regulators and (for only a subset of these data) the public. In the European Union (EU), the reporting obligation has largely been implemented by the European Market Infrastructure Regulation (EMIR).3 Under EMIR, all OTC and exchange-traded derivatives transactions undertaken by EU counterparties since August 2012 (or open at that point) have had to be reported by the following business day to a TR. The definition of counterparties covers primarily the activity of clearing houses, financial counterparties and non-financial counterparties that are EU legal entities.
The post-trade disclosure of derivatives transactions opens up a whole new range of possibilities for policy analysis, supervision and research. For example, the ability to observe trading activity and the network of exposures not long after the trades are executed could allow policy makers to identify the build-up of systemic risk within the financial system, as well as idiosyncratic risk to individual institutions for micro-prudential supervision purposes. It could also improve understanding about how these markets operate in practice, both during calmer times and periods of stress. This could be particularly useful for policy makers who use derivatives prices to extract information about fundamentals and market expectations, e.g. short term interest rate expectations. The data could also be used to look at the effects of the implementation of the G20 financial reforms and help to assess their efficacy, which is one of the priorities of the Financial Stability Board (FSB).
But these uses require that the data are accurate and complete on the one hand and that we can analyse them effectively on the other. The evidence on these aspects is, however, limited so far, a gap we aim to help to fill. This is the first in-depth event study in Europe to utilise the EMIR TR
1 The 2009 G20 reform agenda also included the increase in pre-trade transparency by the introduction of multilateral trading venues for certain derivative markets as well as reducing risk in the market through measures including the push towards central clearing and the exchange of collateral more generally. 2 The U.S. Securities and Exchange Commission is also implementing a reporting requirement. 3 Regulation (EU) No 648/2012 of the European Parliament and of the Council, of 4 July 2012 on OTC derivatives, central counterparties and trade repositories; commonly known as “EMIR”.

Financial Stability Paper January 2017 5
data relating to the FX market in an attempt to determine their strengths and limitations, as well as to showcase examples of policy analysis and research that can be conducted with them4.
We do so in two ways. First, we provide a first detailed look at the second largest OTC derivatives market, the FX derivative market. By analysing its structure we gain some novel insights into a previously unexplored market. We then look at the market dynamics around a recent policy event that was not anticipated by FX market participants: the decision by the Swiss National Bank (SNB) to remove the Swiss franc-euro exchange rate floor at 10:30 AM CET (9:30 AM UK Time) on 15 January 2015.5 This minimum exchange rate against the euro had been in place since September 2011 to counter further appreciation of the CHF and the risk of a deflationary development6. The SNB in its press release stated that the divergence between the monetary policies of major economies and the continued depreciation of the euro against the US dollar had weakened the Swiss franc against the US dollar making the enforcement of the floor, which was accompanied by a marked increase in foreign exchange resources, no longer justifiable. The exogenous nature of this event and the speed and scale of subsequent intraday currency movements makes it well-suited for an event-study analysis. It is worth noting that whilst we analyse the impact of the event on the market, we are not commenting on the SNB’s policy decision itself.
For such an analysis to be meaningful, it requires the use of transaction data and information about counterparty identities, in order to analyse how different market players responded to the removal of the floor. This is exactly the type of information contained in the EMIR data. TR data provide us with a unique insight into the functioning of the FX derivatives market, going significantly beyond what other data sources can tell us. To fully exploit this highly granular trade-level data we make use of analytical techniques from empirical finance and network science.
1.2. Analytical Results
The Bank is entitled to see trades reported to European TRs where one of the following criteria is satisfied: at least one of the counterparties is a UK entity, the trade is cleared by a UK CCP, or the asset traded is either denominated in sterling or has a UK underlying. In our analysis we use reports for outright forwards, FX swaps (the forward leg) and options, which we obtained from the largest trade repository, DTCC. Given the focus on the SNB announcement, we limit our analysis to just the Swiss franc (CHF) segment of the market. In practice, this means that we only look at reports where one leg of the trade is denominated in the Swiss franc.
The raw data used in the paper included about 100 million reports consisting of new FX derivative trades (not all of which were unique) as well as valuation updates and 300 million outstanding FX positions between November 2014 and March 2015. The length of the period was chosen to cover the Swiss FX market before and after the de-pegging event so that meaningful comparisons would be possible. At this stage the data included FX derivatives for many different currency pairs. In the next step after filtering and cleaning we were left with about 400,000 new CHF trades executed by over 9,000 counterparties and 3 million outstanding CHF positions. Despite using data from only one TR and other limitations7, we estimate that we are able to 4Another study that uses the EMIR TR data is the ESRB Occasional paper no. 11, which provides an excellent description of the data. 5 Note that the SNB removed its Swiss franc floor rather than de-pegged its exchange rate. However, many media and industry reports described the event as “de-pegging”, see for example the coverage in “The Economist” on 18 Jan 2015: http://www.economist.com/blogs/economist-explains/2015/01/economist-explains-13. 6 “Swiss National Bank sets minimum exchange rate at CHF 1.20 per euro”, SNB press release, 6. September 2011. 7The data does not include any trades for counterparty pairs such as Swiss-Swiss, US-US and Swiss-US either because they would not be reportable under EMIR or because the Bank would not be able to access the reports.
Financial Stability Paper January 2017 6
observe more than half of the market (by comparing with OTC derivatives data from BIS (2015)), reflecting the role of London as a global financial centre for FX markets. This ensures to some extent that any observed patterns in the data reflect the whole global market.
Before conducting any in-depth analysis, we report some basic statistics. The Swiss franc market is a medium-sized FX market. We see trades accounting for around $100 billion notional traded daily, of which more than three quarters are forwards (outrights and the forward leg of FX swaps) and the remainder are options. The average maturities are short (<1 year) and we observe some bunching around three-, six-, nine- and twelve-month maturities. The most actively traded currency pair is the US dollar/Swiss franc (USDCHF) followed by the euro/Swiss franc (EURCHF). The market structure is highly concentrated, with trading by a small number (about 11) of big dealers accounting for more than 90% of the market, of which almost half represents interdealer activity. This is consistent with the commonly held view that OTC trading is dominated by a few large dealers.
We look at the structure of the Swiss franc market in more detail using network topology techniques, which allows us to identify three distinct segments of the market: an inner core of big liquidity providers, an outer-core of medium-sized active counterparties, and a periphery of small end-users, who are characterised by more directional trading. We demonstrate how the three-tier structure can have interesting implications for network stability and fragmentation and the analysis of liquidity provision, which we regard as a methodological contribution of the paper.
We next move to the analysis of the de-pegging, firstly by reconstructing the event using the available transaction data and analysing the response of different market counterparties to the SNB announcement, and, secondly by looking at the longer-term impact on market liquidity, trading positions and the structure of the market network.
Intraday analysis: We provide evidence of a rapid V-shaped price movement in the EURCHF OTC forward market similar to the one observed in the spot market. The Swiss franc appreciated by nearly 41% against the euro in the first 20 minutes after the announcement, before stabilising at around 1.05 (an appreciation of around 14%). We find that in the first 15 minutes after the announcement, the provision of liquidity was limited, as evidenced by the low dealer-to-client trading and the small average trade size of EURCHF forwards trades. After 15 minutes, dealers gradually started to play the role of liquidity provider, even if this activity was potentially loss-making as it coincided with the Swiss franc price reversal (i.e. depreciation). Collectively, our analysis provides some evidence that the rapid V-shaped Swiss franc price fluctuation on 15 January was associated with underlying market liquidity conditions. This demonstrates the value of the granular nature of the TR data and that it can be used to analyse intraday market dynamics.
Longer term impact: Looking at the two-and-a-half-month period following the announcement we find that: a) the trading network became more fragmented compared to a similar period before the announcement, in part due to a reduction in inter-dealer activity, b) liquidity in the market decreased, indicated by an increase in measures of volatility and illiquidity, as well as a decrease in average trade sizes, and c) the amount of collateral exchanged by the different counterparties increased (for contracts with short-term maturities). The more volatile prices in the new regime might explain some of the drop in liquidity, due to a higher degree of information asymmetry and inventory holding costs, both of which are expected to have impaired market liquidity. The drop in liquidity might also relate to the finding that the trading network became more fragmented, thus making it harder for dealers to match supply and demand. The increase in the amount of collateral exchanged might suggest that market participants had become more worried about counterparty risk.

Financial Stability Paper January 2017 7
The remainder of this paper is structured as follows. In Section 2 we describe the reporting framework, and the data cleaning processes. Section 3 provides an insight into the composition, participants and structure of the Swiss franc OTC derivatives market. In Section 4 we investigate the event itself. We first examine the intraday trading pattern in the hours following the SNB announcement and how it affected the trading pattern in the EURCHF option and forward markets. We then investigate the longer-term impacts of the policy change on market liquidity and the network structure. We also look at spillovers to the EURUSD market. Section 5 concludes and discusses lessons learnt.
2. Trade Repository Data 2.1. Reporting framework
In September 2009, in response to the financial crisis G20 Leaders agreed that OTC derivatives transactions should be reported to trade repositories so that they could be collected and analysed by the respective regulatory authorities. The trade reporting framework was part of a larger package of reforms aimed at mitigating systemic risk, improving transparency in an opaque market and protecting against market abuse. This reporting obligation has been implemented across jurisdictions, e.g. EMIR in the EU and the Dodd-Frank Act in the U.S. In the EU, trade reporting to the TRs began in February 2014. According to ESMA’s Annual Report8, by the end of 2015 almost 27 billion reports had been received by TRs, with an average of around 330 million trade reports submitted per week. The sections below provide more details on the EMIR reporting framework, briefly discuss the international progress made towards implementing trade reporting and the steps being taken to address some of the technical challenges preventing effective use of the data.
EMIR Trade Reporting: Under EMIR once the reporting obligation had started in February 2014, all OTC and exchange-traded derivatives transactions undertaken by EU counterparties since August 2012 (or open at that point) have had to be reported by the end of the following business day (T+1) to a trade repository (TR) authorised by ESMA. There are currently six such TRs.9
The EMIR reporting obligation covers CCPs; financial counterparties, such as banks, insurance firms or pension schemes; and non-financial counterparties that are EU legal entities10. Some entities are exempt from the reporting obligation, including EU national central banks and bodies performing functions associated with public debt; the Bank for International Settlements (BIS); natural people that are not ‘undertakings’ and most non-EU counterparties.
An important element of EMIR is that it imposes a double-sided reporting regime, i.e. if both counterparties to a trade are covered by the EMIR reporting obligation then both must report the trade. Double-sided reporting helps to highlight errors and problems in the reports. But it also means that there is some data duplication and care must be taken to avoid double-counting trades in analysis.
8 ESMA’s supervision of credit rating agencies and trade repositories 2015 annual report and 2016 work plan at: https://www.esma.europa.eu/sites/default/files/library/2016-234 esma 2015 annual report on supervision and 2016 work plan.pdf 9 DTCC Derivatives Repository Ltd. (referred to as ‘DTCC’ henceforth); Krajowy Depozyt Papierów Wartosciowych S.A. (KDPW); Regis-TR S.A.; UnaVista Limited; CME Trade Repository Ltd. (CME TR); and ICE Trade Vault Europe Ltd. (ICE TVEL). 10 A limited number of non-EU legal entities are also covered.

Financial Stability Paper January 2017 8
The Bank of England’s access to trade reports is as per the conditions stated in EMIR under Article 2 of Commission Delegated Regulation (EU) No 151/2013 - Data access by relevant authorities. This in summary means we can access reports on a) trades cleared by a CCP supervised by the Bank, b) trades where one of the counterparties is a UK entity c) trades where the derivative contract is referencing an entity located in the UK (e.g. CDS on UK banks) or derivatives on UK sovereign debt, d) trades where one of the counterparties is supervised by the Bank (PRA). We would also get access to aggregated position data for all derivative contracts referencing sterling. For this study, the key determinant of what data the Bank can see is point (b). This is because clearing is not used in the FX market (or not to any significant extent) and the relevant contracts are not sterling ones.
Table 1 provides a high level overview on some important milestones in introducing EMIR trade reporting.
Table 1: EMIR timeline on trade reporting
Date Milestone
Sep-09 G20 leaders commit to regulate standardised OTC derivatives
Aug-12 EMIR enters into force on 16 August 2012 although the actual reporting does not start until February 2014.
Nov-13 ESMA adopts the registration of six Trade Repositories
Feb-14 Reporting obligation comes into effect for ETD and OTC derivatives for all asset classes
Aug-14 Reporting obligation on valuation and collateral information of trades comes into effect
Nov-14 ESMA publishes a consultation paper on the revised regulation and implementing technical standards to address problems with the quality of data
Dec-14 ESMA initiates data-quality measures which direct incorrect reports to be rejected by TRs.
Apr-16 ESMA publishes updated regulatory technical standards on access aggregation and comparison of TR data
Feb-17 Deadline of 11th February 2017 for reporting, or ‘backloading’, of OTC contracts
International progress and technical challenges: As per the FSB report11, 19 jurisdictions have reporting requirements in force for over 90% of transactions in their jurisdiction. By the end of 2017, 23 out of 24 jurisdictions expect to have reporting requirements in force. As the reporting regimes have been implemented, several recurring issues have been identified that are posing challenges in supporting the underlying G20 reform objectives. These include:
• concerns over data quality;
• the capacity to effectively aggregate information across TRs;
• the existence of barriers to reporting complete data to TRs; and
• barriers to authorities’ access to TR-held data.
11 OTC Derivatives Market Reforms: Eleventh Progress Report on Implementation - 26 August 2016
Financial Stability Paper January 2017 9
Of the above listed challenges, data quality has been a primary concern in relation to the work presented in this paper. As per the FSB Thematic Review12, some of the findings relating to data quality were: a) inadequacies in data standards both nationally and internationally, b) lack of consistent and harmonised trade and product identifiers, and c) inconsistent use of Legal Entity Identifiers (used to identify the counterparties to trades).
Work is in train by an international working group of regulators (“Harmonisation Group”) established by CPMI-IOSCO to address some of the above shortcomings of the data. The mandate of the Harmonisation Group is to develop guidance on the format and usage of Unique Transaction Identifier (UTI), Unique Product Identifier (UPI) and other Critical Data Elements on derivatives reported to the TRs. The Harmonisation Group has published consultative reports13 on the UTI, UPI and certain of the Critical Data Elements (further consultations are expected). These will be followed by the publication of Technical Guidance documents in all of these areas. Implementation of the Technical Guidance will follow, with future governance arrangements being discussed by a group set up by the FSB, which is expected to consult on these in 2017. When this guidance is implemented, it should significantly improve the quality and usability of TR data, which will help support regulators in fulfilling their G20 mandates.
2.2. The structure of the data and cleaning process
We analyse five months of OTC FX data from between November 2014 and March 2015, provided by DTCC. The data contain reports for forwards and options, with the forward category including both outright forwards and the forward leg of FX swaps. These two types of products account for about 80% of the global FX OTC derivatives market (BIS 2015). The missing 20% consists of mainly currency swaps, which are reported separately as interest rate derivative products, which we did not analyse for this study. We do not observe spot transactions, since these do not fall under EMIR reporting requirements.14
The TR data can be broadly divided into two types of reports: a) activity reports, which contain trade information on flows, for example new trades, modifications, and valuation and cancellation updates; and b) state reports, which contain trade information on stock, i.e. all end-of-day outstanding transactions between individual counterparties. The state and activity reports are generated each day and are available for the Bank to see with a one-day lag. 15 The DTCC TR data used for this study contained more than 100 fields, of which 85 were EMIR fields and the remaining were TR introduced fields (see Box 1 for more details). These fields include information on trade characteristics and, more importantly, counterparty identities. However, not all of them contain information relevant to FX derivatives (e.g. because they are relevant to commodity derivative trades, and so would be blank in practice for FX derivatives; some other fields are also ignored as they would be irrelevant to the analysis here. This includes fields relating to trade confirmations, for example.
12 FSB (2016), Thematic Review on OTC Derivatives Trade Reporting – Peer Review Report, November; available at: http://www.financialstabilityboard.org/2015/11/thematic-review-of-otc-derivatives-trade-reporting/ 13 They are available on the CPMI and IOSCO websites. 14 Nonetheless, we did get access to anonymised spot transactions executed on 15 January from EBS BrokerTec, an electronic FX platform provider. We used this data to visualise the intraday price movement in the spot market on the event day. 15 EMIR requires reports to be made to TRs either on the day of an event or the day after. The resulting data is made available to the Bank on the day after it was reported. The precise timing of the reporting was not significant to this analysis because it was carried out well after the event being analysed.
Financial Stability Paper January 2017 10
EMIR data come with certain limitations and data processing can be time consuming and challenging. We went through several stages of data cleaning to make the raw data suitable for analysis. The steps involved filtering, deduplication and group consolidations, partial outlier detection and the dropping of missing values. The process of filtering and deduplication is described below and in Figure 1.
The raw activity and state reports contained about 100 million and 300 million rows of trades, respectively, between November 2014 and March 2015, not all of which contained new trade information or involved the Swiss franc. So, in step 2, we filtered the data to keep only trades where either one of the legs contained CHF, and were left with about 3.5 million rows in our activity reports and 10 million in state reports. Activity reports had trades with execution dates ranging from 2004 to 2015. We assume that the older trades were being reported as part of the back loading that is required under EMIR, but this assumption does not affect the analysis unless the execution date was being materially mis-reported, for which there is no specific evidence. For our analysis we were mainly interested in trades executed in the five-month time period. Consequently, in step 3, we filtered the activity reports to include trades from November 2014 to March 2015, which left us with approximately 2.5 million trades. This step was omitted for the state reports, so our data contained all the open positions at the corresponding point of time irrespective of the execution date.
This illustrates a feature of the EMIR data, which is that the activity and state reports are complementary, with one being more relevant and useful than the other depending on the
Box 1: EMIR trade fields EMIR trade reports contain both information about the counterparty making the report and information about the trade. The reports contain more than 100 fields for each trade (not all of them are relevant to all trades), including the following which were used in our analysis:
• Information about the reporting trade counterparty, including the name and Legal Entity Identifier (LEI)
• Domicile, corporate sector and the financial or non-financial nature of counterparty
• Details of the transaction, including:
o Unique Trade Identifier (UTI, or Trade ID in EMIR terminology)
o Asset class (FX, interest rates, etc.) and product type (forward/future, swap, option)
o Execution date, effective date, maturity date
o Relevant price, e.g. forward exchange rate for forwards
o For options, information also includes the type of option (call or put), style (e.g. European), strike price and upfront payment, but not further identification of option types, such as barrier options
o Risk mitigation, including confirmation details and collateral posted
o Information about clearing
o Purpose of the report (new trade, amendment, cancellation, etc.)

Financial Stability Paper January 2017 11
analysis being undertaken. For this study, we were carrying out both sorts of analysis and therefore needed to process both types of report.
Figure 1: Summary of the data cleaning process for activity and state reports
In the final step, we removed all duplicate reports, as well as reports from a small number of counterparties whose trade entries appeared incorrect. For state reports we kept only EURCHF trades. Duplication is mainly due to two reasons:
1. EMIR is a double-sided reporting regime, so the Bank would see two copies for a single executed trade when both the counterparties are UK entities (and, in this case, where they are both reporting the trade to DTCC).
2. As per the EMIR regulation, the activity reports could contain several copies of the same trade to reflect each of the modification, correction and valuation updates.
After filtering the data, we were left with a sample of 380,000 activity reports and around 3 million state reports. Importantly, these are single records for each relevant trade, thus avoiding double-counting that could have biased our trading activity analysis.
Trade activity and state reports for FX OTC contracts from November 2014 until March 2015
Activity: 100 million rows State: 300
million rows
Activity: 3.5 million rows
State: 10 million rows
Activity: 2.5 million rows
State: 10 million rows
Filter data to only include contracts where one of the legs is Swiss-franc denominated
Filter the resulting trades to include those that were executed between November 2014 and
March 2015 (only for Activity reports)
Activity: 380 thousand rows State: 3 million
rows
For activity reports, select a single copy from multiple reports. For state reports we filtered to
leave only EURCHF trades
Financial Stability Paper January 2017 12
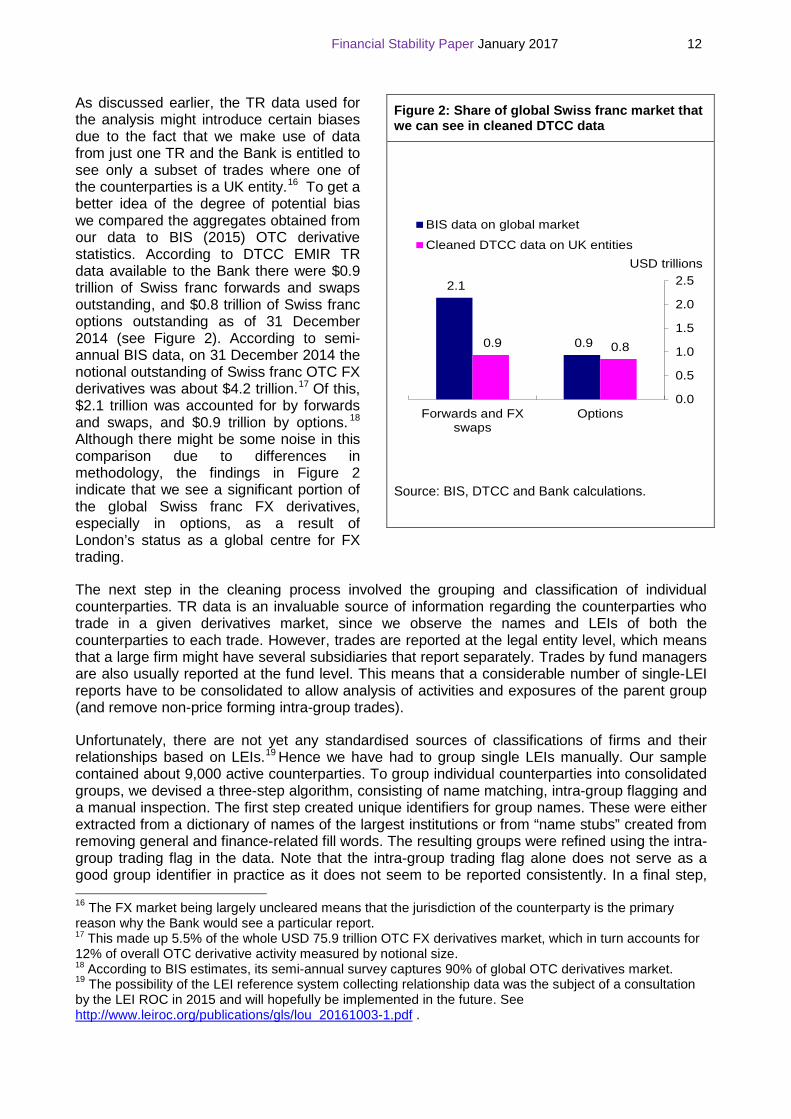
As discussed earlier, the TR data used for the analysis might introduce certain biases due to the fact that we make use of data from just one TR and the Bank is entitled to see only a subset of trades where one of the counterparties is a UK entity.16 To get a better idea of the degree of potential bias we compared the aggregates obtained from our data to BIS (2015) OTC derivative statistics. According to DTCC EMIR TR data available to the Bank there were $0.9 trillion of Swiss franc forwards and swaps outstanding, and $0.8 trillion of Swiss franc options outstanding as of 31 December 2014 (see Figure 2). According to semi-annual BIS data, on 31 December 2014 the notional outstanding of Swiss franc OTC FX derivatives was about $4.2 trillion.17 Of this, $2.1 trillion was accounted for by forwards and swaps, and $0.9 trillion by options. 18 Although there might be some noise in this comparison due to differences in methodology, the findings in Figure 2 indicate that we see a significant portion of the global Swiss franc FX derivatives, especially in options, as a result of London’s status as a global centre for FX trading.
The next step in the cleaning process involved the grouping and classification of individual counterparties. TR data is an invaluable source of information regarding the counterparties who trade in a given derivatives market, since we observe the names and LEIs of both the counterparties to each trade. However, trades are reported at the legal entity level, which means that a large firm might have several subsidiaries that report separately. Trades by fund managers are also usually reported at the fund level. This means that a considerable number of single-LEI reports have to be consolidated to allow analysis of activities and exposures of the parent group (and remove non-price forming intra-group trades).
Unfortunately, there are not yet any standardised sources of classifications of firms and their relationships based on LEIs.19 Hence we have had to group single LEIs manually. Our sample contained about 9,000 active counterparties. To group individual counterparties into consolidated groups, we devised a three-step algorithm, consisting of name matching, intra-group flagging and a manual inspection. The first step created unique identifiers for group names. These were either extracted from a dictionary of names of the largest institutions or from “name stubs” created from removing general and finance-related fill words. The resulting groups were refined using the intra-group trading flag in the data. Note that the intra-group trading flag alone does not serve as a good group identifier in practice as it does not seem to be reported consistently. In a final step, 16 The FX market being largely uncleared means that the jurisdiction of the counterparty is the primary reason why the Bank would see a particular report. 17 This made up 5.5% of the whole USD 75.9 trillion OTC FX derivatives market, which in turn accounts for 12% of overall OTC derivative activity measured by notional size. 18 According to BIS estimates, its semi-annual survey captures 90% of global OTC derivatives market. 19 The possibility of the LEI reference system collecting relationship data was the subject of a consultation by the LEI ROC in 2015 and will hopefully be implemented in the future. See http://www.leiroc.org/publications/gls/lou 20161003-1.pdf .
Figure 2: Share of global Swiss franc market that we can see in cleaned DTCC data
Source: BIS, DTCC and Bank calculations.
2.1
0.9 0.9 0.8
0.0
0.5
1.0
1.5
2.0
2.5
Forwards and FXswaps
Options
BIS data on global market
Cleaned DTCC data on UK entitiesUSD trillions
Financial Stability Paper January 2017 13
we manually inspected the resulting consolidation groups, which confirmed that the great majority of institutions have been classified correctly in the previous two steps.
We then manually split the firms into different categories: (a) the G16 dealers, (b) other banks, (c) real money investors/other funds (including pension funds, insurance firms, asset managers, state institutions and unclassified funds), (d) hedge funds, (e) retail FX trading firms, (f) institutional FX trading (non-bank firms offering trading services or prime brokerage to institutional investors), corporates, and (g) others. The ‘dealers’ category includes the so-called ‘G16’ dealers (after removing any bank with limited or no presence in our data) plus Standard Chartered.20
3. The Swiss franc market 3.1. Summary statistics
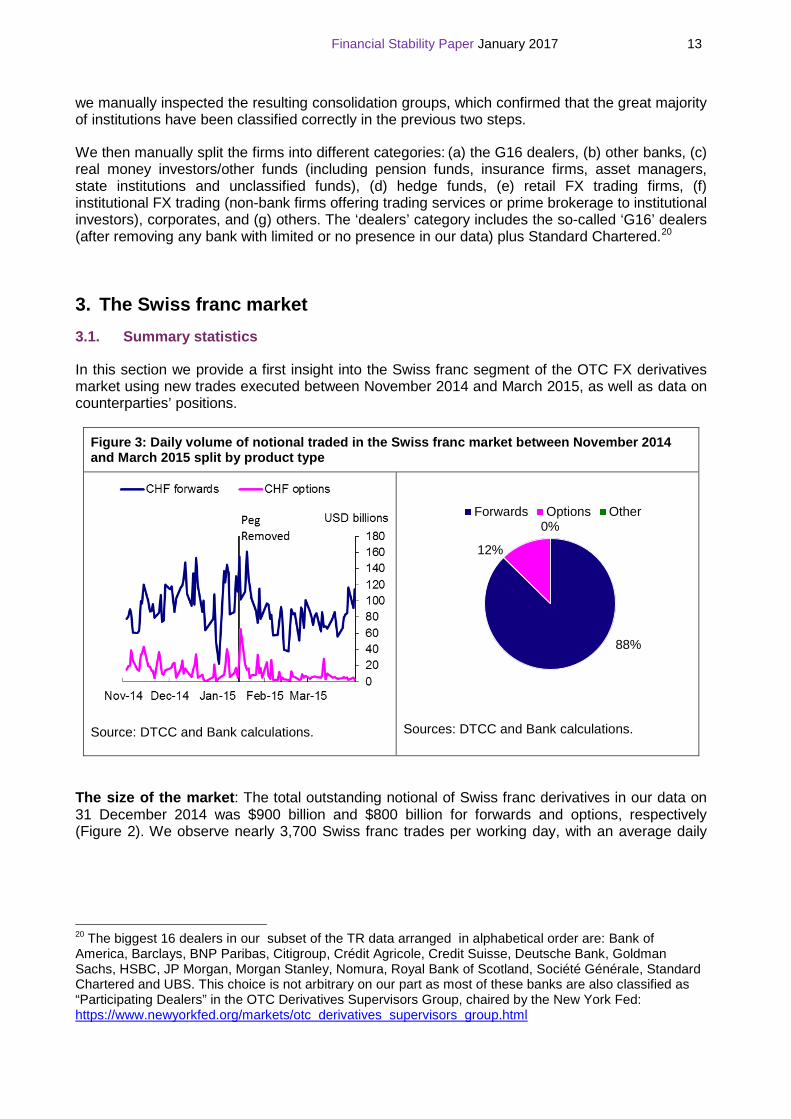
In this section we provide a first insight into the Swiss franc segment of the OTC FX derivatives market using new trades executed between November 2014 and March 2015, as well as data on counterparties’ positions.
Figure 3: Daily volume of notional traded in the Swiss franc market between November 2014 and March 2015 split by product type
Source: DTCC and Bank calculations.
Sources: DTCC and Bank calculations.
The size of the market: The total outstanding notional of Swiss franc derivatives in our data on 31 December 2014 was $900 billion and $800 billion for forwards and options, respectively (Figure 2). We observe nearly 3,700 Swiss franc trades per working day, with an average daily
20 The biggest 16 dealers in our subset of the TR data arranged in alphabetical order are: Bank of America, Barclays, BNP Paribas, Citigroup, Crédit Agricole, Credit Suisse, Deutsche Bank, Goldman Sachs, HSBC, JP Morgan, Morgan Stanley, Nomura, Royal Bank of Scotland, Société Générale, Standard Chartered and UBS. This choice is not arbitrary on our part as most of these banks are also classified as “Participating Dealers” in the OTC Derivatives Supervisors Group, chaired by the New York Fed: https://www.newyorkfed.org/markets/otc derivatives supervisors group.html
88%
12%
0%Forwards Options Other

Financial Stability Paper January 2017 14
traded notional of $118 billion. 88% of notional represented trading in forwards and the rest in options (Figure 3).21
Currencies: The majority of Swiss franc derivatives trades we see were against the US dollar, accounting for 82% of all Swiss franc forward trades and 64% of all options trades in the market (Figures 4-5). When looking at the Swiss franc trades against the euro, a greater share is accounted for by options i.e. of all option trades 33% were against the euro compared to 14% for forwards. This seems intuitively sensible if some of the market participants wanted to position/hedge against sharp changes in the euro to Swiss franc exchange rate.
Figure 4: Volume of Swiss franc forwards trades split by counter currency
Figure 5: Volume of Swiss franc options trades split by counter currency
Sources: DTCC and Bank calculations.
Sources: DTCC and Bank calculations.
Figure 6: Maturity distribution of Swiss franc forwards trades between November 2014 and March 2015
Figure 7: Maturity distribution of Swiss franc options trades between November 2014 and March 2015
Sources: DTCC and Bank calculations. Sources: DTCC and Bank calculations.
Maturities: The average maturity of forwards is very short. Over half of all forwards have a maturity of no more than a week, and over 96% no more than four months (Figure 6). The maturity for options is slightly longer, although the most common maturity for options is between one week and two months. We can observe some bunching around three-, six-, nine- and twelve- 21 We have removed UK bank holidays from the analysis, which were 25-26 December 2014 and 1 January 2015.
82%
14%2% 1% 1%
USD EUR GBP JPY Other
64%
33%
1%1% 1%USD EUR GBP JPY Other
020406080100120140160180
[0d,
8d)
[8d,
1m)
[1m
,2m
)[2
m,3
m)
[3m
,4m
)[4
m,5
m)
[5m
,6m
)[6
m,7
m)
[7m
,8m
)[8
m,9
m)
[9m
,10m
)[1
0m,1
1m)
[11m
,1y)
[1y,
2y)
[2y,
3y)
[3y,
4y)
[4y,
5y)
[5y,
10y)
[10y
, max
]
Number of trades (thousands)
0
1
2
3
4
5
[0d,
8d)
[8d,
1m)
[1m
,2m
)[2
m,3
m)
[3m
,4m
)[4
m,5
m)
[5m
,6m
)[6
m,7
m)
[7m
,8m
)[8
m,9
m)
[9m
,10m
)[1
0m,1
1m)
[11m
,1y)
[1y,
2y)
[2y,
3y)
[3y,
4y)
[4y,
5y)
[5y,
10y)
[10y
, max
]
Number of trades (thousands)
Financial Stability Paper January 2017 15
month maturities (Figure 7). This pattern is indicative of higher liquidity at certain tenors, in line with market convention.
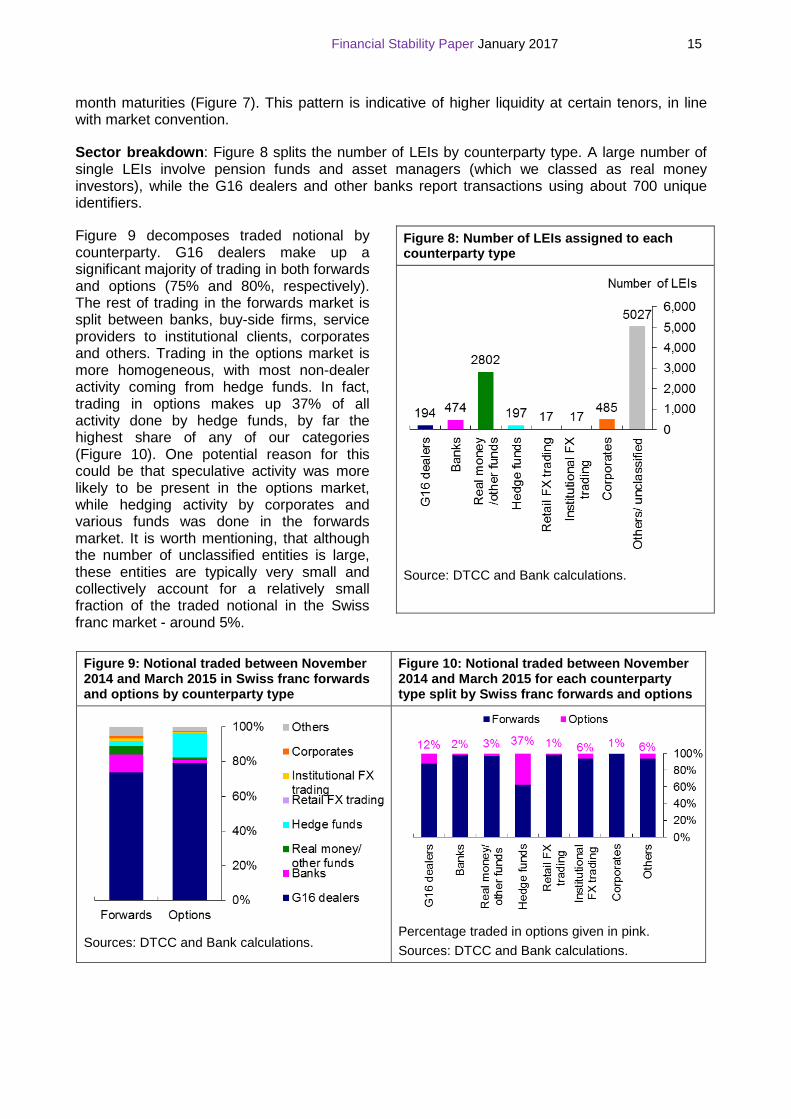
Sector breakdown: Figure 8 splits the number of LEIs by counterparty type. A large number of single LEIs involve pension funds and asset managers (which we classed as real money investors), while the G16 dealers and other banks report transactions using about 700 unique identifiers.
Figure 9 decomposes traded notional by counterparty. G16 dealers make up a significant majority of trading in both forwards and options (75% and 80%, respectively). The rest of trading in the forwards market is split between banks, buy-side firms, service providers to institutional clients, corporates and others. Trading in the options market is more homogeneous, with most non-dealer activity coming from hedge funds. In fact, trading in options makes up 37% of all activity done by hedge funds, by far the highest share of any of our categories (Figure 10). One potential reason for this could be that speculative activity was more likely to be present in the options market, while hedging activity by corporates and various funds was done in the forwards market. It is worth mentioning, that although the number of unclassified entities is large, these entities are typically very small and collectively account for a relatively small fraction of the traded notional in the Swiss franc market - around 5%.
Figure 9: Notional traded between November 2014 and March 2015 in Swiss franc forwards and options by counterparty type
Figure 10: Notional traded between November 2014 and March 2015 for each counterparty type split by Swiss franc forwards and options
Sources: DTCC and Bank calculations.
Percentage traded in options given in pink. Sources: DTCC and Bank calculations.
Figure 8: Number of LEIs assigned to each counterparty type
Source: DTCC and Bank calculations.

Financial Stability Paper January 2017 16
3.2. Market structure
The granularity of the TR data allows us to describe in great detail the composition and structure of the FX OTC derivatives market – a first in the literature. Figures 9 and 10 showed that trading activity in the Swiss franc segment of the market is dominated by G16 dealers, which is consistent with the commonly-held view that a small number of big counterparties dominates OTC markets.
We dig into this result by reporting the shares of traded notional by dealer-client type in Figure 11. Around 98% of trading involves a dealer as a counterparty, i.e. only 2% of the trades did not involve any of the G16 dealers. The inter-dealer market accounts for a little over 49% of the total notional traded. The findings suggest that the CHF derivatives market is representative of a typical two-tier dealer-centric OTC market consisting of a top tier of inter-dealer trading and a second tier for end users to trade with the dealers. This FX derivatives structure is similar to that of other OTC markets. For example, Benos, Payne and Vasios (2016) and Benos, Wetherilt and Zikes (2013) report that the share of inter-dealer activity in OTC interest rate swap (IRS) and credit default swap (CDS) markets is about 55% and 60%, respectively. One difference is the share of client-to-client trading in our data. The 2% that we observe is smaller than that of the IRS market (about 6-12%), but larger than that of the CDS market (about 1%).
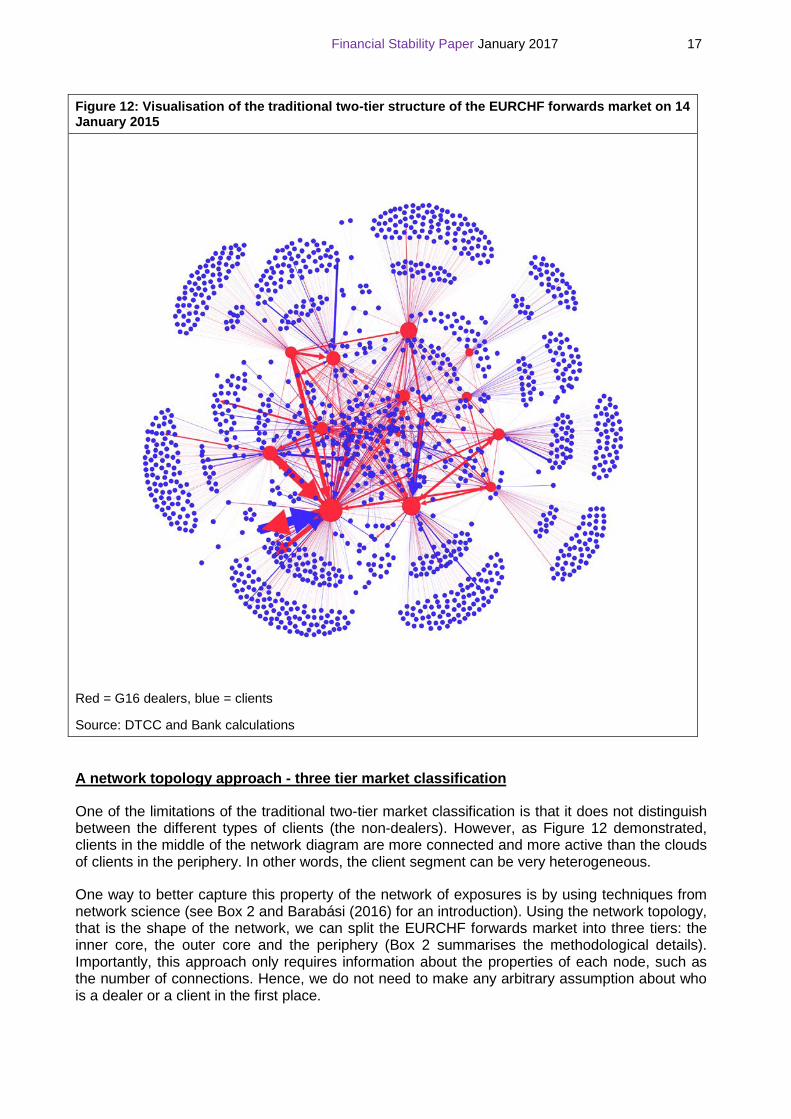
We next look at the network of exposures using the two-tier dealer-to-client approach. Figure 12 presents the network diagram of the EURCHF forward market.22 In this figure, node sizes are proportional to the number of links a counterparty has, while arrow thickness reflects the aggregated notional outstanding amount between two market participants. Dealers are depicted in red and clients in blue.
The first observation in Figure 12 is the pronounced core-periphery structure. G16 dealers are central to the network, forming a densely connected backbone of the core. These dealer banks are surrounded by their respective ‘clouds of clients’ that are typically small- and medium-sized banks, real money investors and corporates. There are also some more densely-connected clients in the middle which are likely to be mid-sized financials that are not dependent on a single dealer. Gross exposures tend to be larger for dealers, while higher net exposures are found in the dealer-to-client segment. One exception is a particularly large gross exposure between a dealer and a large client, the bold pair of arrows in the bottom left part of the network. More generally, the visualisation of the network of exposures and how it changes over time can be a useful tool for identifying financial vulnerabilities and the build-up of systemic risk (see Joseph (2014)). Particularly, this concentrated network structure is likely to be vulnerable to shocks affecting any of the dealer banks.
22 We focus on the forwards market, because the smaller and less dynamic option market makes it less suited for a network description.
Figure 11: Notional traded between November 2014 and March 2015 in Swiss franc forwards and options by dealer-client type
Sources: DTCC and Bank calculations.
49%
49%
2%
Dealer-to-DealerDealer-to-ClientClient-to-Client
Financial Stability Paper January 2017 17
Figure 12: Visualisation of the traditional two-tier structure of the EURCHF forwards market on 14 January 2015
Red = G16 dealers, blue = clients
Source: DTCC and Bank calculations
A network topology approach - three tier market classification
One of the limitations of the traditional two-tier market classification is that it does not distinguish between the different types of clients (the non-dealers). However, as Figure 12 demonstrated, clients in the middle of the network diagram are more connected and more active than the clouds of clients in the periphery. In other words, the client segment can be very heterogeneous.
One way to better capture this property of the network of exposures is by using techniques from network science (see Box 2 and Barabási (2016) for an introduction). Using the network topology, that is the shape of the network, we can split the EURCHF forwards market into three tiers: the inner core, the outer core and the periphery (Box 2 summarises the methodological details). Importantly, this approach only requires information about the properties of each node, such as the number of connections. Hence, we do not need to make any arbitrary assumption about who is a dealer or a client in the first place.
Financial Stability Paper January 2017 18
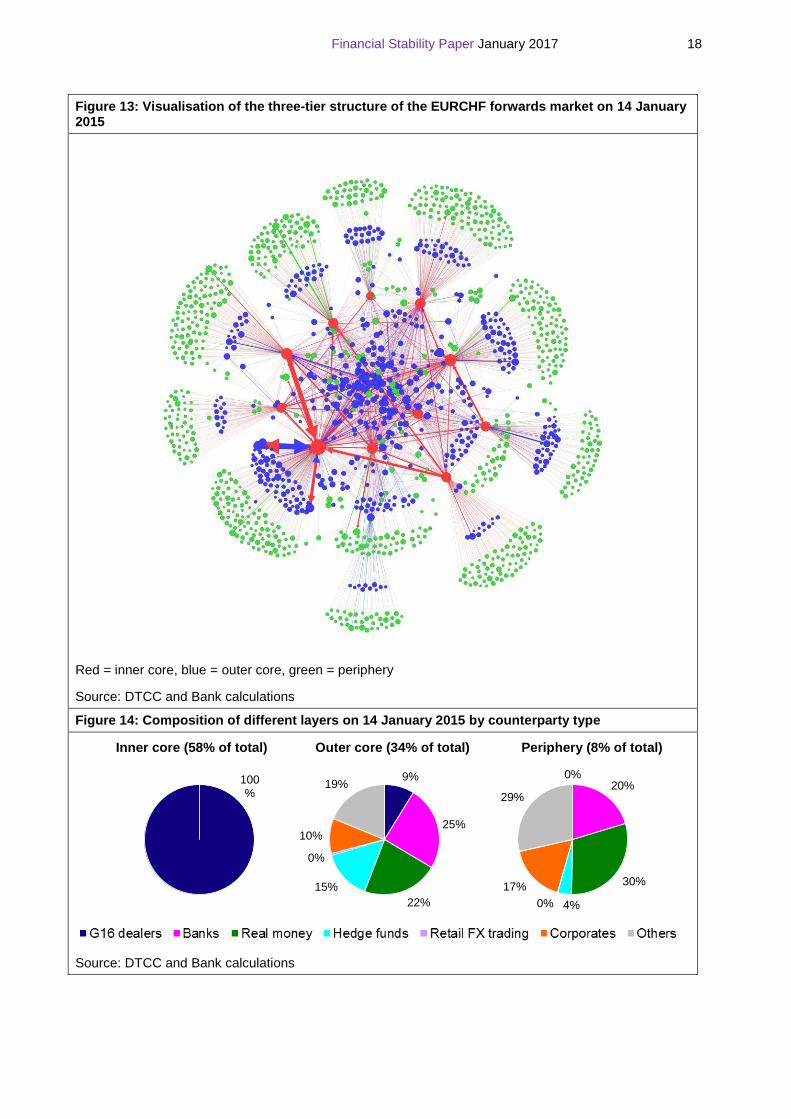
Figure 13: Visualisation of the three-tier structure of the EURCHF forwards market on 14 January 2015
Red = inner core, blue = outer core, green = periphery
Source: DTCC and Bank calculations
Figure 14: Composition of different layers on 14 January 2015 by counterparty type
Inner core (58% of total) Outer core (34% of total) Periphery (8% of total)
Source: DTCC and Bank calculations
0%20%
30%
4%0%17%
29%
9%
25%
22%15%
0%
10%
19%100%
Financial Stability Paper January 2017 19
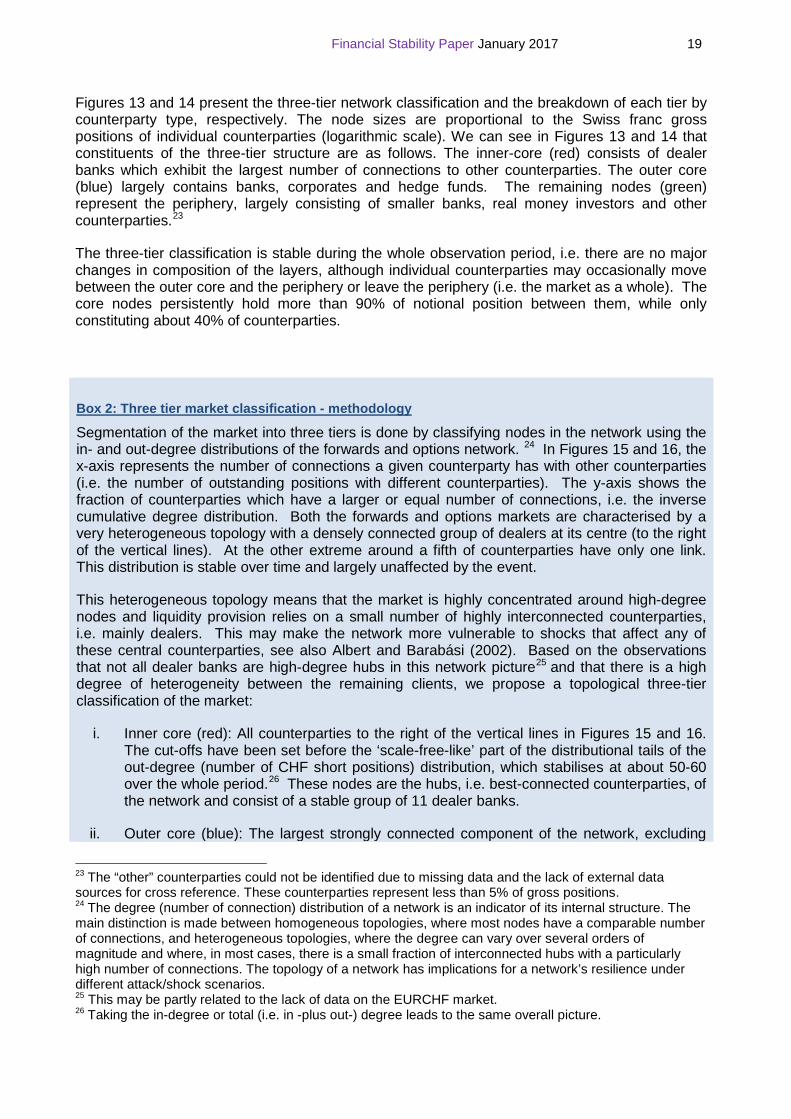
Figures 13 and 14 present the three-tier network classification and the breakdown of each tier by counterparty type, respectively. The node sizes are proportional to the Swiss franc gross positions of individual counterparties (logarithmic scale). We can see in Figures 13 and 14 that constituents of the three-tier structure are as follows. The inner-core (red) consists of dealer banks which exhibit the largest number of connections to other counterparties. The outer core (blue) largely contains banks, corporates and hedge funds. The remaining nodes (green) represent the periphery, largely consisting of smaller banks, real money investors and other counterparties.23
The three-tier classification is stable during the whole observation period, i.e. there are no major changes in composition of the layers, although individual counterparties may occasionally move between the outer core and the periphery or leave the periphery (i.e. the market as a whole). The core nodes persistently hold more than 90% of notional position between them, while only constituting about 40% of counterparties.
23 The “other” counterparties could not be identified due to missing data and the lack of external data sources for cross reference. These counterparties represent less than 5% of gross positions. 24 The degree (number of connection) distribution of a network is an indicator of its internal structure. The main distinction is made between homogeneous topologies, where most nodes have a comparable number of connections, and heterogeneous topologies, where the degree can vary over several orders of magnitude and where, in most cases, there is a small fraction of interconnected hubs with a particularly high number of connections. The topology of a network has implications for a network’s resilience under different attack/shock scenarios. 25 This may be partly related to the lack of data on the EURCHF market. 26 Taking the in-degree or total (i.e. in -plus out-) degree leads to the same overall picture.
Box 2: Three tier market classification - methodology
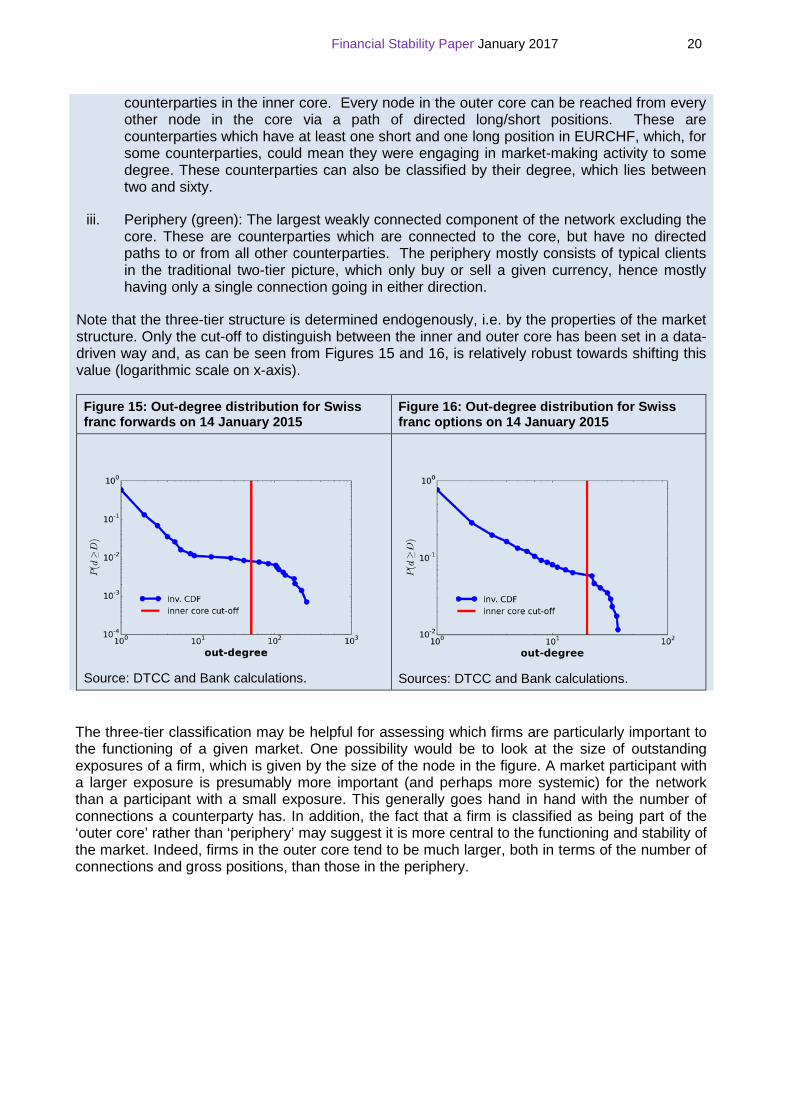
Segmentation of the market into three tiers is done by classifying nodes in the network using the in- and out-degree distributions of the forwards and options network. 24 In Figures 15 and 16, the x-axis represents the number of connections a given counterparty has with other counterparties (i.e. the number of outstanding positions with different counterparties). The y-axis shows the fraction of counterparties which have a larger or equal number of connections, i.e. the inverse cumulative degree distribution. Both the forwards and options markets are characterised by a very heterogeneous topology with a densely connected group of dealers at its centre (to the right of the vertical lines). At the other extreme around a fifth of counterparties have only one link. This distribution is stable over time and largely unaffected by the event.
This heterogeneous topology means that the market is highly concentrated around high-degree nodes and liquidity provision relies on a small number of highly interconnected counterparties, i.e. mainly dealers. This may make the network more vulnerable to shocks that affect any of these central counterparties, see also Albert and Barabási (2002). Based on the observations that not all dealer banks are high-degree hubs in this network picture25 and that there is a high degree of heterogeneity between the remaining clients, we propose a topological three-tier classification of the market:
i. Inner core (red): All counterparties to the right of the vertical lines in Figures 15 and 16. The cut-offs have been set before the ‘scale-free-like’ part of the distributional tails of the out-degree (number of CHF short positions) distribution, which stabilises at about 50-60 over the whole period.26 These nodes are the hubs, i.e. best-connected counterparties, of the network and consist of a stable group of 11 dealer banks.
ii. Outer core (blue): The largest strongly connected component of the network, excluding
Financial Stability Paper January 2017 20
The three-tier classification may be helpful for assessing which firms are particularly important to the functioning of a given market. One possibility would be to look at the size of outstanding exposures of a firm, which is given by the size of the node in the figure. A market participant with a larger exposure is presumably more important (and perhaps more systemic) for the network than a participant with a small exposure. This generally goes hand in hand with the number of connections a counterparty has. In addition, the fact that a firm is classified as being part of the ‘outer core’ rather than ‘periphery’ may suggest it is more central to the functioning and stability of the market. Indeed, firms in the outer core tend to be much larger, both in terms of the number of connections and gross positions, than those in the periphery.
counterparties in the inner core. Every node in the outer core can be reached from every other node in the core via a path of directed long/short positions. These are counterparties which have at least one short and one long position in EURCHF, which, for some counterparties, could mean they were engaging in market-making activity to some degree. These counterparties can also be classified by their degree, which lies between two and sixty.
iii. Periphery (green): The largest weakly connected component of the network excluding the core. These are counterparties which are connected to the core, but have no directed paths to or from all other counterparties. The periphery mostly consists of typical clients in the traditional two-tier picture, which only buy or sell a given currency, hence mostly having only a single connection going in either direction.
Note that the three-tier structure is determined endogenously, i.e. by the properties of the market structure. Only the cut-off to distinguish between the inner and outer core has been set in a data-driven way and, as can be seen from Figures 15 and 16, is relatively robust towards shifting this value (logarithmic scale on x-axis).
Figure 15: Out-degree distribution for Swiss franc forwards on 14 January 2015
Figure 16: Out-degree distribution for Swiss franc options on 14 January 2015
Source: DTCC and Bank calculations.
Sources: DTCC and Bank calculations.
Financial Stability Paper January 2017 21
4. Market impacts from de-pegging the Swiss franc
The unexpected change in SNB policy was one of the key events that took place in the FX market in 2015. One of the key features that distinguishes the event is the fact it was almost completely unexpected by market participants as far as we can determine from the data. In this section we describe the events on 15 January, first, by reconstructing the intraday activity trade-by-trade. We then examine the immediate impact of the SNB announcement, as well as its longer-term effects on market activity, liquidity, and structure of the network of counterparty positions.
4.1. The SNB announcement and its impact on the Spot FX market
At 9.30am UK time the SNB surprised the markets by announcing it was discontinuing the 1.20 EURCHF floor that had been in place since September 2011.27 The SNB also announced it was lowering the interest rate on sight deposit account balances that exceed a given exemption threshold by 50 basis points to -0.75% and moving the target range for the three-month CHF Libor further into negative territory (from between -0.75 and 0.25% previously to between -1.25% and -0.25%). These other announcements are not analysed in this paper.
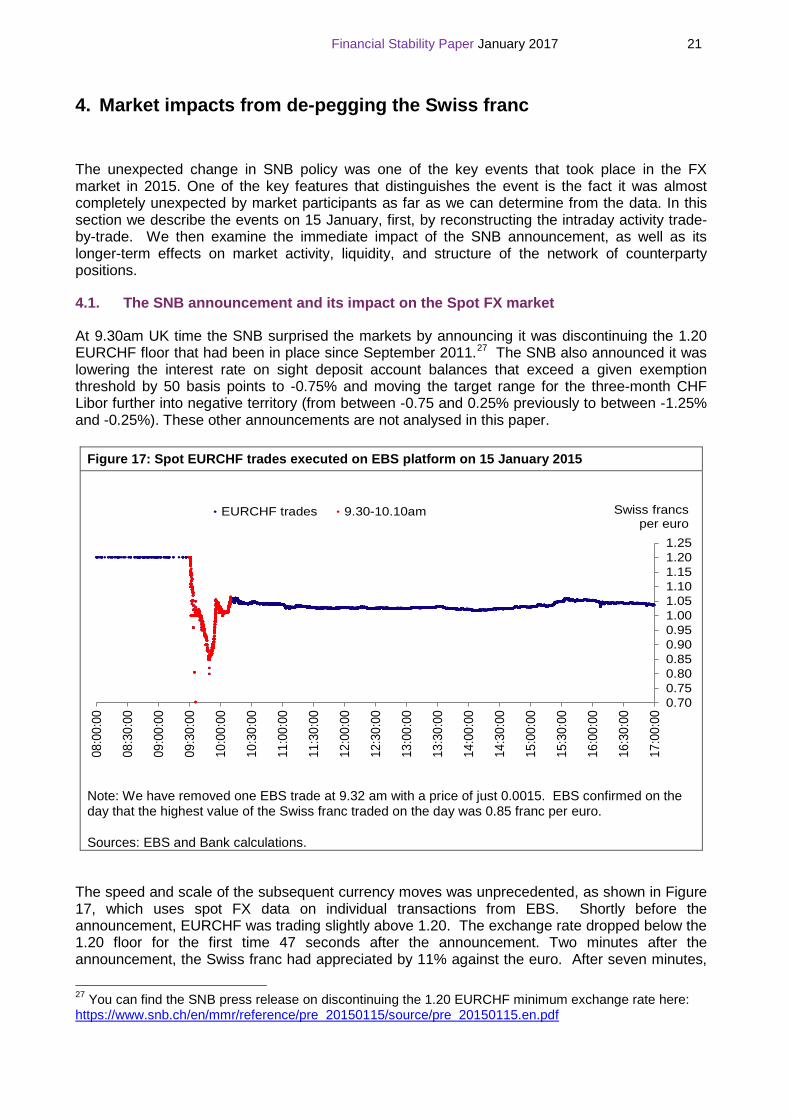
The speed and scale of the subsequent currency moves was unprecedented, as shown in Figure 17, which uses spot FX data on individual transactions from EBS. Shortly before the announcement, EURCHF was trading slightly above 1.20. The exchange rate dropped below the 1.20 floor for the first time 47 seconds after the announcement. Two minutes after the announcement, the Swiss franc had appreciated by 11% against the euro. After seven minutes,
27 You can find the SNB press release on discontinuing the 1.20 EURCHF minimum exchange rate here: https://www.snb.ch/en/mmr/reference/pre 20150115/source/pre 20150115.en.pdf
Figure 17: Spot EURCHF trades executed on EBS platform on 15 January 2015
Note: We have removed one EBS trade at 9.32 am with a price of just 0.0015. EBS confirmed on the day that the highest value of the Swiss franc traded on the day was 0.85 franc per euro.
Sources: EBS and Bank calculations.
0.700.750.800.850.900.951.001.051.101.151.201.25
08:0
0:00
08:3
0:00
09:0
0:00
09:3
0:00
10:0
0:00
10:3
0:00
11:0
0:00
11:3
0:00
12:0
0:00
12:3
0:00
13:0
0:00
13:3
0:00
14:0
0:00
14:3
0:00
15:0
0:00
15:3
0:00
16:0
0:00
16:3
0:00
17:0
0:00
EURCHF trades 9.30-10.10am Swiss francs per euro

Financial Stability Paper January 2017 22
it was 19% higher. It continued to appreciate to reach a peak of 0.85 francs per euro at 9.49 am, an unprecedented 41% appreciation. It subsequently eased back, falling nearly as fast as in the initial upward move. By around 10.10 am, 38 minutes after the announcement, the franc was ‘only’ up 15% from its pre-announcement level at around 1.05, where it remained for most of the day. The franc ended the day 14% higher against the euro, and 12% higher against the US dollar, representing 23- and 15-standard-deviation moves, respectively, compared to daily changes in the last eight years, although it is important to note that the standard deviation would have been artificially lower during the period the EURCHF floor was in place.
4.2. Reconstructing the SNB event trade-by-trade using EMIR TR data
We next use the TR data and reconstruct the trading book on the 15 January 2015. We start with traded prices and notional for the five-day EURCHF forward market. This segment accounted for nearly half (49%) of all EURCHF forwards traded on that day, hence it is a good representation of the whole market. Figure 18 shows all executed trades on the event day, each trade represented by a bubble whose size is proportional to the notional. Trades executed in the interval between 9.30 am and 10.10 am, when prices fall sharply before recovering to the new equilibrium price, are shaded in red.
The pattern is similar to what we observe in the spot market in Figure 17, yet with much higher price dispersion. The price of five day forwards fell sharply following the SNB announcement. We observe three trades executed at forward rates below 0.80, one at 9.33 am and two at 9.34 am. The lowest price was 0.65, but the notional traded was extremely small (for this market) at less than USD 1,000. Apart from these three small trades, the price troughed at the same exchange rate as in the spot market (0.85), at the same time (just before 9.50 am). We do observe a small number of trades executed within an hour after the announcement at prices which seem substantially higher than the prevailing price, around 1.15. These might be genuine trades or there might be some issues with the reported execution timestamp. Since these trades have relatively small notional values they do not have a significant impact on the analysis.
Figure 18: EURCHF five day forwards trades executed on 15 January 2015
Sources: DTCC and Bank calculations.
0.700.750.800.850.900.951.001.051.101.151.201.25
08:0
0:00
08:3
0:00
09:0
0:00
09:3
0:00
10:0
0:00
10:3
0:00
11:0
0:00
11:3
0:00
12:0
0:00
12:3
0:00
13:0
0:00
13:3
0:00
14:0
0:00
14:3
0:00
15:0
0:00
15:3
0:00
16:0
0:00
16:3
0:00
17:0
0:00EURCHF 5-day forwards trades 9.30-10.10 am Swiss francs
per euro

Financial Stability Paper January 2017 23
The SNB announcement appears to have taken markets by surprise and made investors rush into the market to adjust their portfolios, take new hedges or engage in speculative activity. Hence, the sharp price decline to what seemed to be the new EURCHF fair value was expected to some extent: prices adjusted through the trading process. It is the V-shaped price movement, which is highlighted in red, which makes Figure 18 interesting. If markets were efficient, as economic theory suggests, we should not observe such an exchange rate fluctuation and divergence from fundamentals. One explanation might be the limited provision of liquidity between 9:30 am and 10:10 am.
In what follows we examine if this is the case by looking at the different phases of the intraday price movement in conjunction with the trading behaviour of different types of counterparties. We describe each of these in turn, focusing on the building-up of inventories, i.e. the cumulative net positions, and the structure of the trading network. We are particularly interested to see how dealers and the inner-core of the trading network (described in Section 3.2), who are believed to provide liquidity in OTC markets, responded to the SNB announcement.
We decompose the events of 15 January into three parts:
• 9.30-9.50 am, when the Swiss franc was appreciating from 1.20 to a low of 0.85
• 9.50-10.10 am, when the franc was depreciating from 0.85 to around 1.05
• 10.10 am onwards, when the franc stabilised and activity in the market picked up.
9.30-9.50 am: Swiss franc appreciation Figure 18 shows that the number of Swiss franc forwards trades surged in the minutes after the announcement. Between 9.30 and 9.35 am alone there were 268 EURCHF forwards trades, which was nearly 60 times the average trading for a given five-minute interval between 9.00 am and 3.00 pm before the change in SNB policy in our dataset. The number of trades remained above average for the rest of the day. Despite this increase in the number of trades executed between 9.30 and 9:50 am, the total notional traded remained low. This means that the average size of trades executed in this time period was small, which can be seen in the small size of the red bubbles in Figure 18.
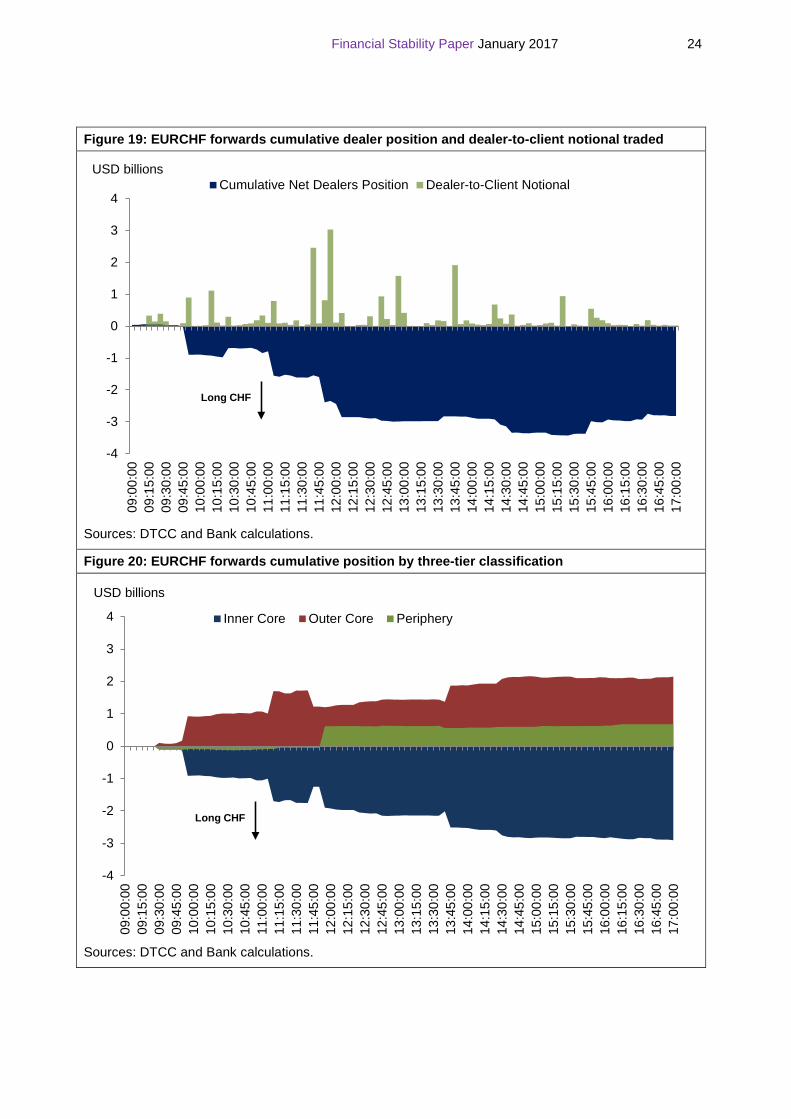
We next look at the behaviour of different counterparties immediately after the SNB announcement. Figures 19 and 20 present the cumulative net positions, i.e. the difference between aggregate long and short positions, of dealers and the different tiers, respectively. Figure 19 also reports the total notional traded in the dealer-to-client market in 5-minute intervals. A first observation is that the dealer-to-client market was very thin in terms of notional traded in the 20 minutes after the event, while dealers’ net position was close to zero. A similar picture emerges when we use the 3-tier classification instead, where we see that the inner-core net positions were small too.
The observed limited provision of liquidity is surprising given that many market participants wanted to buy the Swiss franc in this time period to capitalise on profits from the expected currency appreciation (i.e, buy low – sell high strategy). On the contrary, we observe that the key liquidity providers were unwilling to build-up any potentially loss-making positions by selling the currency to the interested parties. In fact, immediately after the SNB announcement and for few minutes dealers were marginally net buyers of the Swiss franc. This suggests they were initially consuming liquidity (although marginally) instead of providing it.
Financial Stability Paper January 2017 24
Figure 19: EURCHF forwards cumulative dealer position and dealer-to-client notional traded
Sources: DTCC and Bank calculations.
Figure 20: EURCHF forwards cumulative position by three-tier classification
Sources: DTCC and Bank calculations.
-4
-3
-2
-1
0
1
2
3
4
09:0
0:00
09:1
5:00
09:3
0:00
09:4
5:00
10:0
0:00
10:1
5:00
10:3
0:00
10:4
5:00
11:0
0:00
11:1
5:00
11:3
0:00
11:4
5:00
12:0
0:00
12:1
5:00
12:3
0:00
12:4
5:00
13:0
0:00
13:1
5:00
13:3
0:00
13:4
5:00
14:0
0:00
14:1
5:00
14:3
0:00
14:4
5:00
15:0
0:00
15:1
5:00
15:3
0:00
15:4
5:00
16:0
0:00
16:1
5:00
16:3
0:00
16:4
5:00
17:0
0:00
USD billionsCumulative Net Dealers Position Dealer-to-Client Notional
Long CHF
-4
-3
-2
-1
0
1
2
3
4
09:0
0:00
09:1
5:00
09:3
0:00
09:4
5:00
10:0
0:00
10:1
5:00
10:3
0:00
10:4
5:00
11:0
0:00
11:1
5:00
11:3
0:00
11:4
5:00
12:0
0:00
12:1
5:00
12:3
0:00
12:4
5:00
13:0
0:00
13:1
5:00
13:3
0:00
13:4
5:00
14:0
0:00
14:1
5:00
14:3
0:00
14:4
5:00
15:0
0:00
15:1
5:00
15:3
0:00
15:4
5:00
16:0
0:00
16:1
5:00
16:3
0:00
16:4
5:00
17:0
0:00
USD billions
Inner Core Outer Core Periphery
Long CHF

Financial Stability Paper January 2017 25
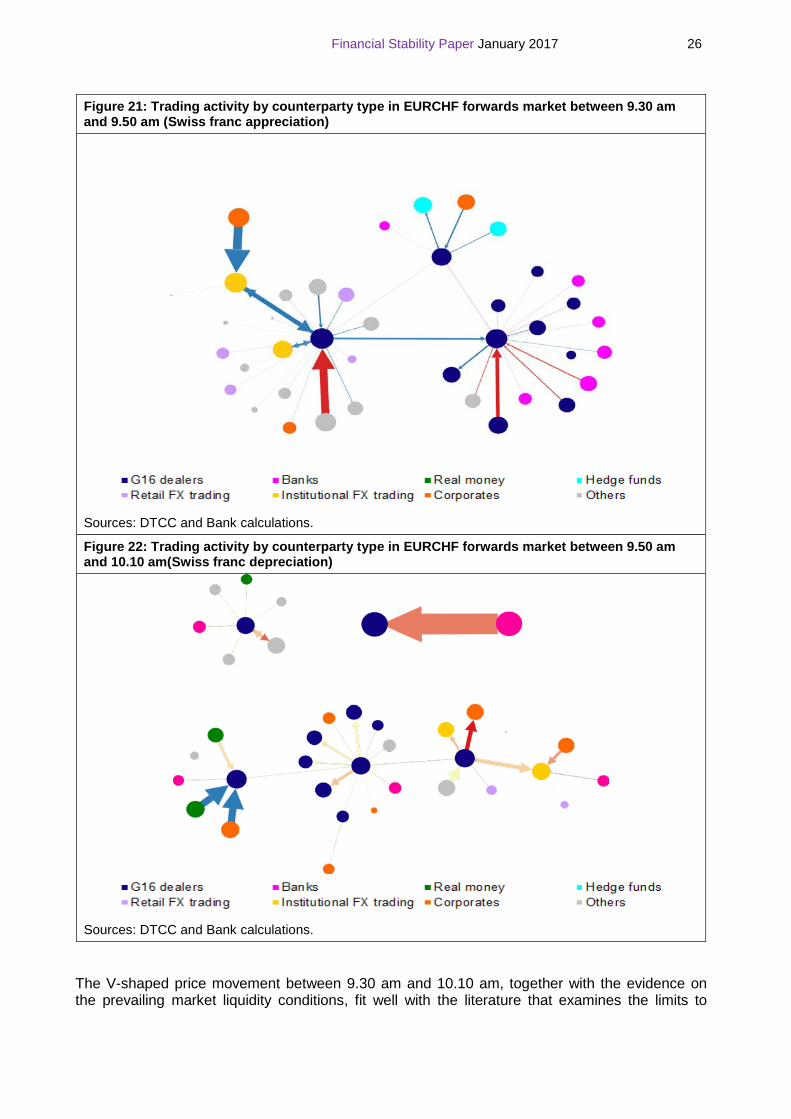
In Figure 21, we zoom in on trading behaviour using more granular data. Each bubble represents a counterparty that was present in the market, with the size of the bubble proportional to the gross notional traded by the given counterparty in this time period.28 Arrows pointing away from a counterparty mean this counterparty was selling the Swiss franc, while the width of the arrows represents the size of the trade. The arrows are also coloured according to the weighted average price at which trades were executed between given counterparties. Blue arrows represent trades with forward exchange rates close to 1.20, while red arrows are trades executed below parity. So for instance a blue arrow pointing away from a counterparty means the counterparty had sold the Swiss franc at a cheap price (a high EURCHF exchange rate), presumably leading to a loss. Similarly, a red arrow pointing to a counterparty means the counterparty in question bought the Swiss franc at an expensive price (a low EURCHF exchange rate), also seemingly at a loss.
The network diagram in Figure 21 shows that eleven of the G16 dealers were present in the market during the first twenty minutes, but with limited dealer-to-client trading. Only three dealers appeared to provide liquidity to non-dealers (upper centre and bottom left), whereas the rest were active mainly in the inter-dealer market. The clients who managed to find liquidity were mainly banks, hedge funds and a few corporates. Hence there was limited liquidity provision between 9:30 to 9:50 am and only after the exchange rate fell below parity against the euro, a few dealers started providing liquidity: they were buying Swiss franc at unfavourable prices, even if the activity was potentially loss-making.
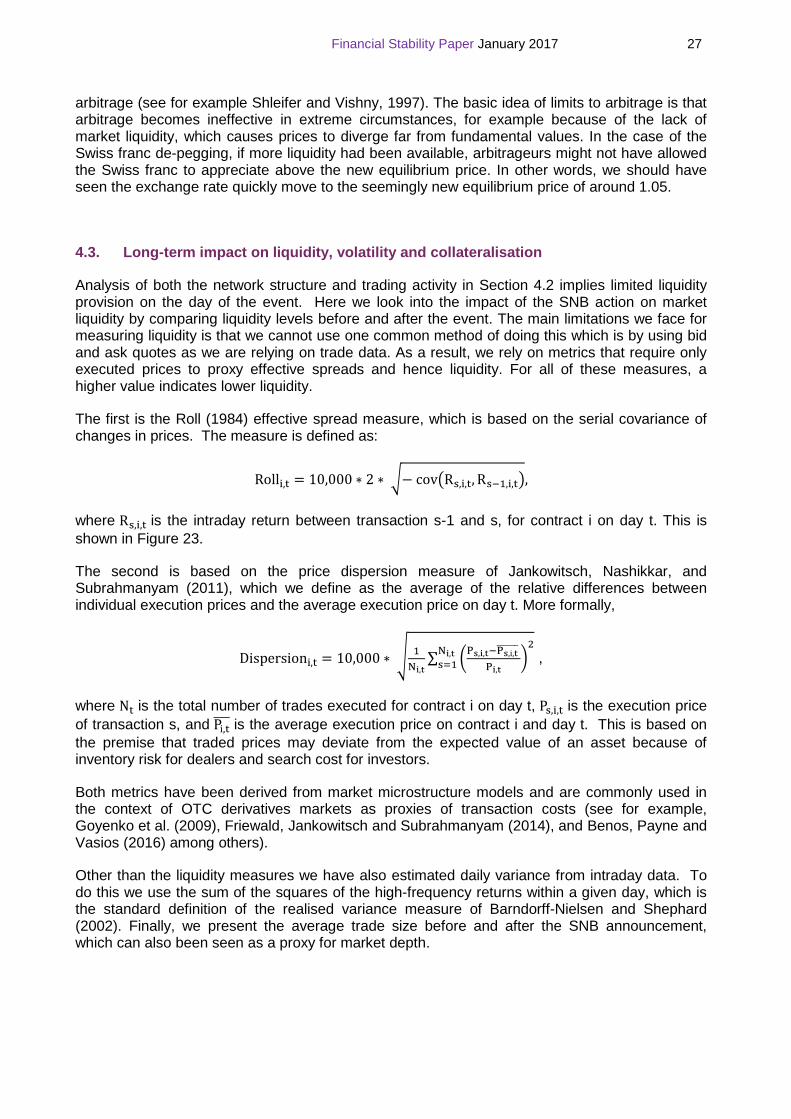
9.50-10.10 am: Swiss franc depreciation In the subsequent 20-minute period between 9.50 am and 10.10 am there was more dealer-to-client activity with dealers building up larger and potentially loss making positions. This can be seen in the increasingly net long Swiss franc positions of dealers and the inner-core in Figures 19 and 20. Figure 20 shows it was mainly the outer-core that was consuming liquidity, while the periphery remained relatively inactive. When looking at the trading behaviour of individual counterparties in Figure 22, we observe there were five dealers providing liquidity to non-dealers, up from three in the previous 20-minute period. These dealers were at the core of clouds of different clients and were actively buying and selling Swiss franc. Clients consisted of mainly banks, real money investors and corporates. The seemingly stronger engagement of dealers in the provision of liquidity coincided with the price reversal to the new equilibrium level at about 1.05 Swiss francs per euro.
10.10 am onwards: Swiss franc stabilises Most other counterparties, such as hedge funds, real money investors and corporates re-entered the market only after the price of the Swiss franc stabilised at around 10.10 am. For example, trading volumes between the inner- and outer-core increased after 10.10 am, with the former taking long Swiss franc positions and the latter short. Around midday the periphery also became more active and started building up short positions. Around the same time we observe that the traded notional in the dealer-to-client market peaked too. Dealers’ net long position continued to increase throughout the day as dealers bought the Swiss franc from their clients.
Overall, the evidence suggests that in the first 20 minutes after the event there was limited provision of liquidity as (i) it was difficult to execute any large trade as demonstrated by the small average trade size, (ii) there was limited dealer-to-client trading, and (iii) dealers seemed to be unwilling to build up potentially loss-making inventories. This impairment of liquidity might explain to some extent the sharp appreciation of the Swiss franc (i.e. overshooting). When dealers started engaging more in the dealer-to-client market, the buying pressures to the Swiss franc eased, prices reversed and gradually stabilised.
28 A logarithmic scale has been used for the size of the nodes to allow all the market participants to be displayed clearly. Some of the larger nodes would have been much larger if a linear scale had been used.
Financial Stability Paper January 2017 26
Figure 21: Trading activity by counterparty type in EURCHF forwards market between 9.30 am and 9.50 am (Swiss franc appreciation)
Sources: DTCC and Bank calculations.
Figure 22: Trading activity by counterparty type in EURCHF forwards market between 9.50 am and 10.10 am(Swiss franc depreciation)
Sources: DTCC and Bank calculations.
The V-shaped price movement between 9.30 am and 10.10 am, together with the evidence on the prevailing market liquidity conditions, fit well with the literature that examines the limits to
Financial Stability Paper January 2017 27
arbitrage (see for example Shleifer and Vishny, 1997). The basic idea of limits to arbitrage is that arbitrage becomes ineffective in extreme circumstances, for example because of the lack of market liquidity, which causes prices to diverge far from fundamental values. In the case of the Swiss franc de-pegging, if more liquidity had been available, arbitrageurs might not have allowed the Swiss franc to appreciate above the new equilibrium price. In other words, we should have seen the exchange rate quickly move to the seemingly new equilibrium price of around 1.05.
4.3. Long-term impact on liquidity, volatility and collateralisation
Analysis of both the network structure and trading activity in Section 4.2 implies limited liquidity provision on the day of the event. Here we look into the impact of the SNB action on market liquidity by comparing liquidity levels before and after the event. The main limitations we face for measuring liquidity is that we cannot use one common method of doing this which is by using bid and ask quotes as we are relying on trade data. As a result, we rely on metrics that require only executed prices to proxy effective spreads and hence liquidity. For all of these measures, a higher value indicates lower liquidity.
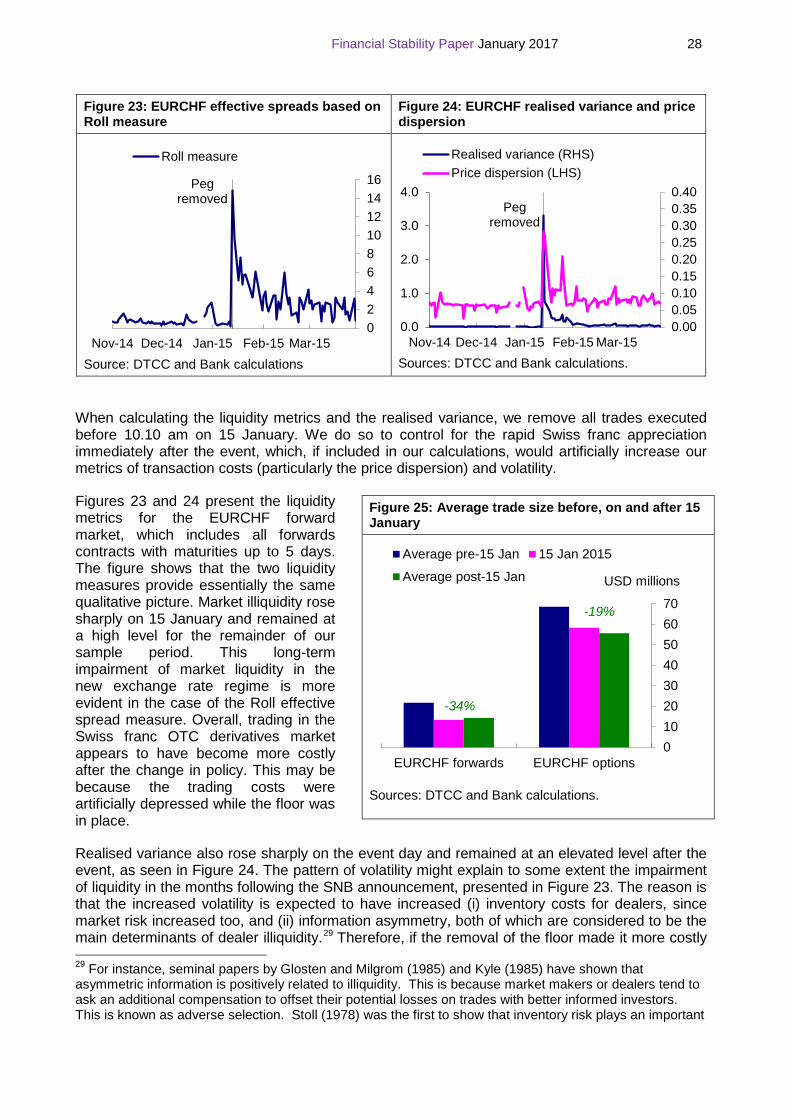
The first is the Roll (1984) effective spread measure, which is based on the serial covariance of changes in prices. The measure is defined as:
Rolli,t = 10,000 ∗ 2 ∗ �− cov�Rs,i,t, Rs−1,i,t�,
where Rs,i,t is the intraday return between transaction s-1 and s, for contract i on day t. This is shown in Figure 23.
The second is based on the price dispersion measure of Jankowitsch, Nashikkar, and Subrahmanyam (2011), which we define as the average of the relative differences between individual execution prices and the average execution price on day t. More formally,
Dispersioni,t = 10,000 ∗ � 1Ni,t
∑ �Ps,i,t−Ps,i,t������ Pi,t
�2Ni,t
s=1 ,
where Nt is the total number of trades executed for contract i on day t, Ps,i,t is the execution price of transaction s, and Pi,t���� is the average execution price on contract i and day t. This is based on the premise that traded prices may deviate from the expected value of an asset because of inventory risk for dealers and search cost for investors.
Both metrics have been derived from market microstructure models and are commonly used in the context of OTC derivatives markets as proxies of transaction costs (see for example, Goyenko et al. (2009), Friewald, Jankowitsch and Subrahmanyam (2014), and Benos, Payne and Vasios (2016) among others).
Other than the liquidity measures we have also estimated daily variance from intraday data. To do this we use the sum of the squares of the high-frequency returns within a given day, which is the standard definition of the realised variance measure of Barndorff-Nielsen and Shephard (2002). Finally, we present the average trade size before and after the SNB announcement, which can also been seen as a proxy for market depth.
Financial Stability Paper January 2017 28
Figure 23: EURCHF effective spreads based on Roll measure
Figure 24: EURCHF realised variance and price dispersion
Source: DTCC and Bank calculations
Sources: DTCC and Bank calculations.
When calculating the liquidity metrics and the realised variance, we remove all trades executed before 10.10 am on 15 January. We do so to control for the rapid Swiss franc appreciation immediately after the event, which, if included in our calculations, would artificially increase our metrics of transaction costs (particularly the price dispersion) and volatility.
Figures 23 and 24 present the liquidity metrics for the EURCHF forward market, which includes all forwards contracts with maturities up to 5 days. The figure shows that the two liquidity measures provide essentially the same qualitative picture. Market illiquidity rose sharply on 15 January and remained at a high level for the remainder of our sample period. This long-term impairment of market liquidity in the new exchange rate regime is more evident in the case of the Roll effective spread measure. Overall, trading in the Swiss franc OTC derivatives market appears to have become more costly after the change in policy. This may be because the trading costs were artificially depressed while the floor was in place.
Realised variance also rose sharply on the event day and remained at an elevated level after the event, as seen in Figure 24. The pattern of volatility might explain to some extent the impairment of liquidity in the months following the SNB announcement, presented in Figure 23. The reason is that the increased volatility is expected to have increased (i) inventory costs for dealers, since market risk increased too, and (ii) information asymmetry, both of which are considered to be the main determinants of dealer illiquidity.29 Therefore, if the removal of the floor made it more costly 29 For instance, seminal papers by Glosten and Milgrom (1985) and Kyle (1985) have shown that asymmetric information is positively related to illiquidity. This is because market makers or dealers tend to ask an additional compensation to offset their potential losses on trades with better informed investors. This is known as adverse selection. Stoll (1978) was the first to show that inventory risk plays an important
Peg removed
0246810121416
Nov-14 Dec-14 Jan-15 Feb-15 Mar-15
Roll measure
Peg removed
0.0
1.0
2.0
3.0
4.0
0.000.050.100.150.200.250.300.350.40
Nov-14 Dec-14 Jan-15 Feb-15 Mar-15
Realised variance (RHS)Price dispersion (LHS)
Figure 25: Average trade size before, on and after 15 January
Sources: DTCC and Bank calculations.
010203040506070
EURCHF forwards EURCHF options
Average pre-15 Jan 15 Jan 2015
Average post-15 Jan USD millions
-34%
-19%
Financial Stability Paper January 2017 29
for dealers to provide liquidity, they might have passed these costs to other market participants by charging a wider bid-ask spread, thus hurting liquidity.
A similar picture arises when we look at the average trade size variable. Figure 25 shows that the drop in average trade size observed on 15 January persisted for the remainder of our sample period. Post announcement we observe the average trade sizes for EURCHF forwards and options were 34% lower and 19% lower, respectively (although the drop in EURCHF options trade size is not statistically significant). The smaller trade size might reflect dealers’ inability (or unwillingness) to accommodate trading of large positons.
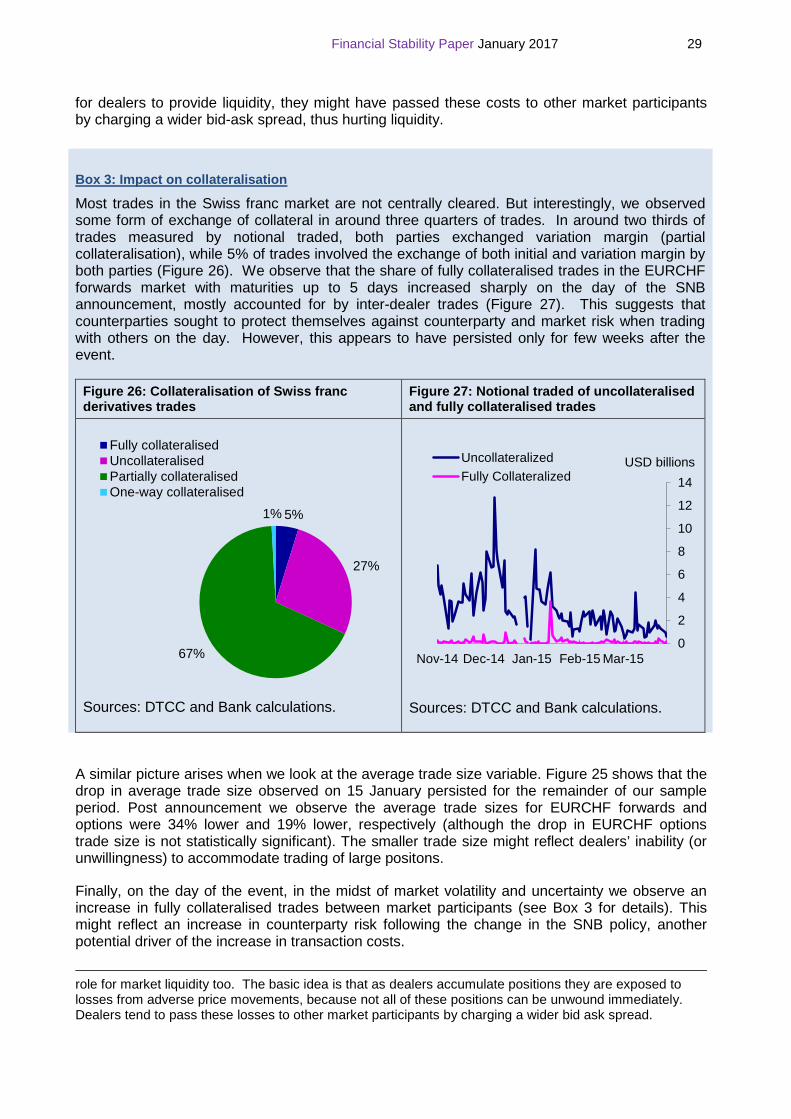
Finally, on the day of the event, in the midst of market volatility and uncertainty we observe an increase in fully collateralised trades between market participants (see Box 3 for details). This might reflect an increase in counterparty risk following the change in the SNB policy, another potential driver of the increase in transaction costs.
role for market liquidity too. The basic idea is that as dealers accumulate positions they are exposed to losses from adverse price movements, because not all of these positions can be unwound immediately. Dealers tend to pass these losses to other market participants by charging a wider bid ask spread.
Box 3: Impact on collateralisation
Most trades in the Swiss franc market are not centrally cleared. But interestingly, we observed some form of exchange of collateral in around three quarters of trades. In around two thirds of trades measured by notional traded, both parties exchanged variation margin (partial collateralisation), while 5% of trades involved the exchange of both initial and variation margin by both parties (Figure 26). We observe that the share of fully collateralised trades in the EURCHF forwards market with maturities up to 5 days increased sharply on the day of the SNB announcement, mostly accounted for by inter-dealer trades (Figure 27). This suggests that counterparties sought to protect themselves against counterparty and market risk when trading with others on the day. However, this appears to have persisted only for few weeks after the event.
Figure 26: Collateralisation of Swiss franc derivatives trades
Figure 27: Notional traded of uncollateralised and fully collateralised trades
Sources: DTCC and Bank calculations.
Sources: DTCC and Bank calculations.
0
2
4
6
8
10
12
14
Nov-14 Dec-14 Jan-15 Feb-15 Mar-15
UncollateralizedFully Collateralized
USD billions
5%
27%
67%
1%
Fully collateralisedUncollateralisedPartially collateralisedOne-way collateralised
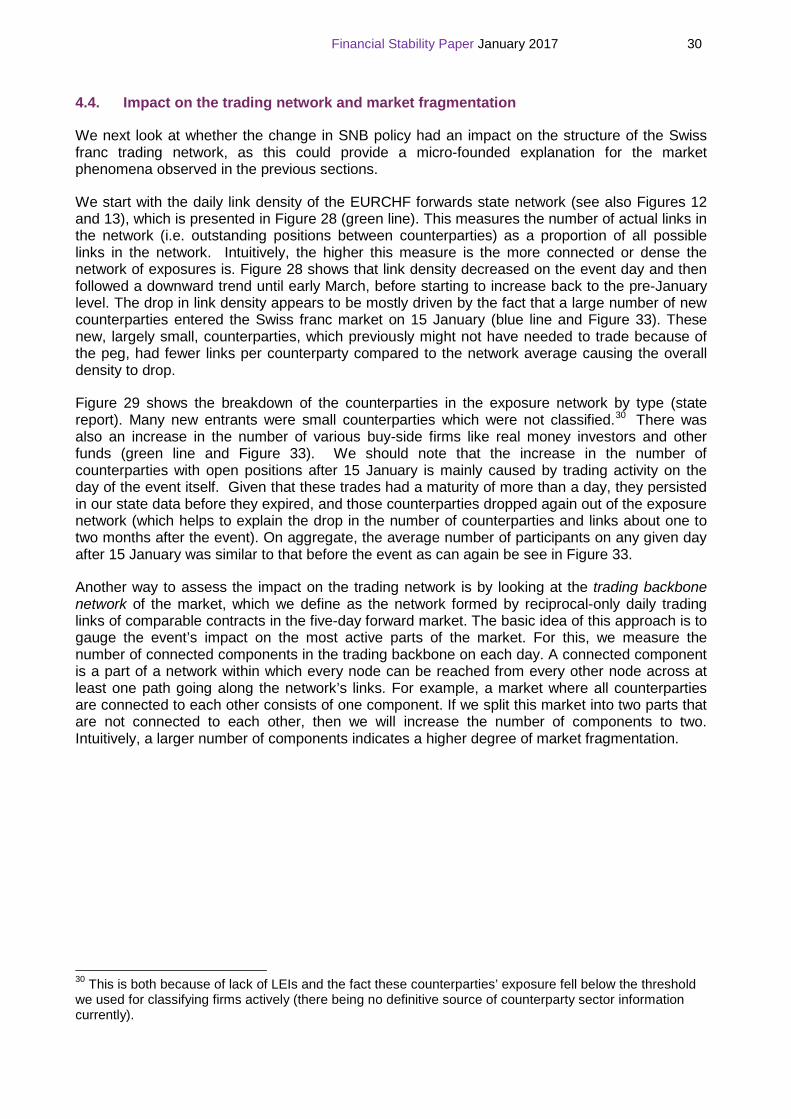
Financial Stability Paper January 2017 30
4.4. Impact on the trading network and market fragmentation
We next look at whether the change in SNB policy had an impact on the structure of the Swiss franc trading network, as this could provide a micro-founded explanation for the market phenomena observed in the previous sections.
We start with the daily link density of the EURCHF forwards state network (see also Figures 12 and 13), which is presented in Figure 28 (green line). This measures the number of actual links in the network (i.e. outstanding positions between counterparties) as a proportion of all possible links in the network. Intuitively, the higher this measure is the more connected or dense the network of exposures is. Figure 28 shows that link density decreased on the event day and then followed a downward trend until early March, before starting to increase back to the pre-January level. The drop in link density appears to be mostly driven by the fact that a large number of new counterparties entered the Swiss franc market on 15 January (blue line and Figure 33). These new, largely small, counterparties, which previously might not have needed to trade because of the peg, had fewer links per counterparty compared to the network average causing the overall density to drop.
Figure 29 shows the breakdown of the counterparties in the exposure network by type (state report). Many new entrants were small counterparties which were not classified.30 There was also an increase in the number of various buy-side firms like real money investors and other funds (green line and Figure 33). We should note that the increase in the number of counterparties with open positions after 15 January is mainly caused by trading activity on the day of the event itself. Given that these trades had a maturity of more than a day, they persisted in our state data before they expired, and those counterparties dropped again out of the exposure network (which helps to explain the drop in the number of counterparties and links about one to two months after the event). On aggregate, the average number of participants on any given day after 15 January was similar to that before the event as can again be see in Figure 33.
Another way to assess the impact on the trading network is by looking at the trading backbone network of the market, which we define as the network formed by reciprocal-only daily trading links of comparable contracts in the five-day forward market. The basic idea of this approach is to gauge the event’s impact on the most active parts of the market. For this, we measure the number of connected components in the trading backbone on each day. A connected component is a part of a network within which every node can be reached from every other node across at least one path going along the network’s links. For example, a market where all counterparties are connected to each other consists of one component. If we split this market into two parts that are not connected to each other, then we will increase the number of components to two. Intuitively, a larger number of components indicates a higher degree of market fragmentation.
30 This is both because of lack of LEIs and the fact these counterparties’ exposure fell below the threshold we used for classifying firms actively (there being no definitive source of counterparty sector information currently).
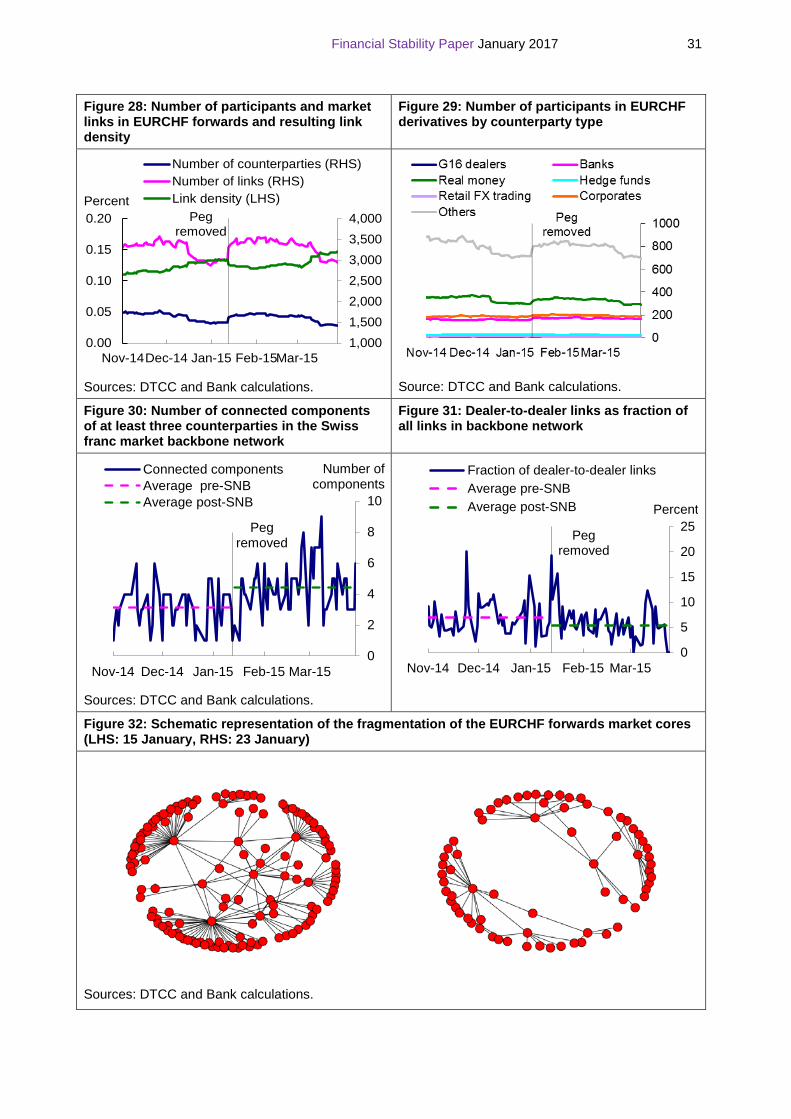
Financial Stability Paper January 2017 31
Figure 28: Number of participants and market links in EURCHF forwards and resulting link density
Figure 29: Number of participants in EURCHF derivatives by counterparty type
Sources: DTCC and Bank calculations.
Source: DTCC and Bank calculations.
Figure 30: Number of connected components of at least three counterparties in the Swiss franc market backbone network
Figure 31: Dealer-to-dealer links as fraction of all links in backbone network
Sources: DTCC and Bank calculations.
Figure 32: Schematic representation of the fragmentation of the EURCHF forwards market cores (LHS: 15 January, RHS: 23 January)
Sources: DTCC and Bank calculations.
Peg removed
0.00
0.05
0.10
0.15
0.20
1,0001,5002,0002,5003,0003,5004,000
Nov-14Dec-14 Jan-15 Feb-15Mar-15
Number of counterparties (RHS)Number of links (RHS)Link density (LHS)Percent
Peg removed
0
2
4
6
8
10
Nov-14 Dec-14 Jan-15 Feb-15 Mar-15
Connected componentsAverage pre-SNBAverage post-SNB
Number of components
Peg removed
0
5
10
15
20
25
Nov-14 Dec-14 Jan-15 Feb-15 Mar-15
Fraction of dealer-to-dealer linksAverage pre-SNBAverage post-SNB Percent
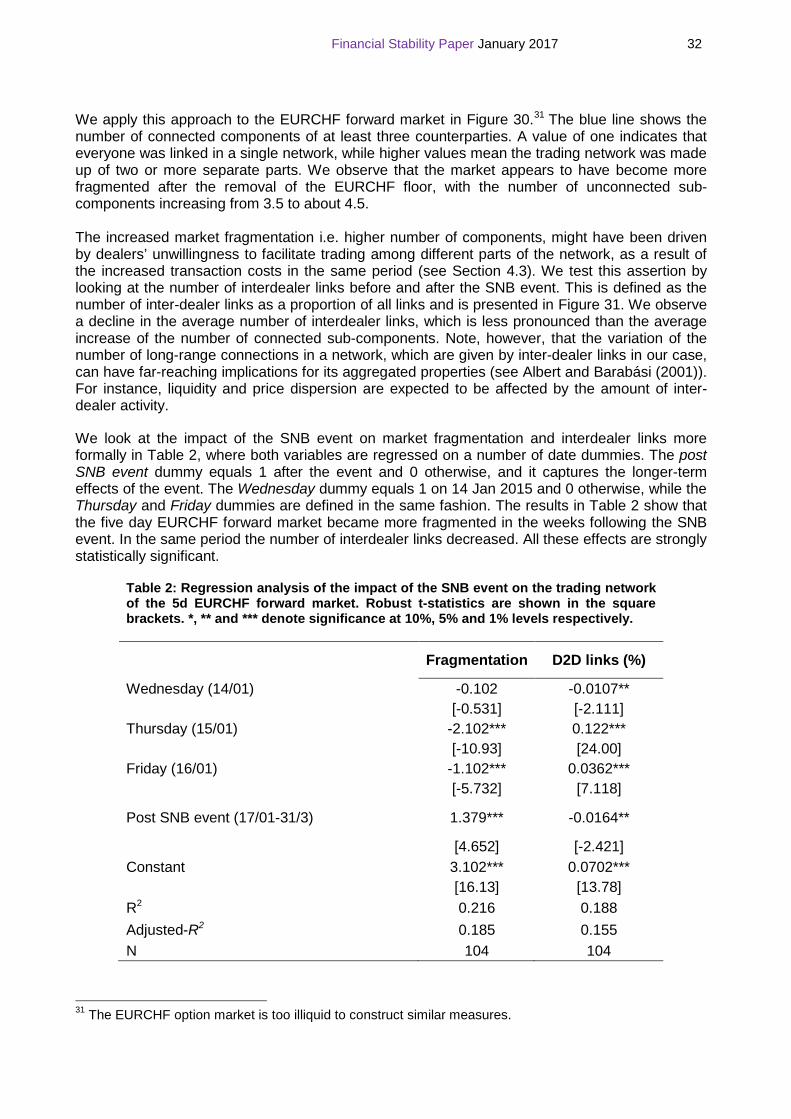
Financial Stability Paper January 2017 32
We apply this approach to the EURCHF forward market in Figure 30.31 The blue line shows the number of connected components of at least three counterparties. A value of one indicates that everyone was linked in a single network, while higher values mean the trading network was made up of two or more separate parts. We observe that the market appears to have become more fragmented after the removal of the EURCHF floor, with the number of unconnected sub-components increasing from 3.5 to about 4.5. The increased market fragmentation i.e. higher number of components, might have been driven by dealers’ unwillingness to facilitate trading among different parts of the network, as a result of the increased transaction costs in the same period (see Section 4.3). We test this assertion by looking at the number of interdealer links before and after the SNB event. This is defined as the number of inter-dealer links as a proportion of all links and is presented in Figure 31. We observe a decline in the average number of interdealer links, which is less pronounced than the average increase of the number of connected sub-components. Note, however, that the variation of the number of long-range connections in a network, which are given by inter-dealer links in our case, can have far-reaching implications for its aggregated properties (see Albert and Barabási (2001)). For instance, liquidity and price dispersion are expected to be affected by the amount of inter-dealer activity.
We look at the impact of the SNB event on market fragmentation and interdealer links more formally in Table 2, where both variables are regressed on a number of date dummies. The post SNB event dummy equals 1 after the event and 0 otherwise, and it captures the longer-term effects of the event. The Wednesday dummy equals 1 on 14 Jan 2015 and 0 otherwise, while the Thursday and Friday dummies are defined in the same fashion. The results in Table 2 show that the five day EURCHF forward market became more fragmented in the weeks following the SNB event. In the same period the number of interdealer links decreased. All these effects are strongly statistically significant.
Table 2: Regression analysis of the impact of the SNB event on the trading network of the 5d EURCHF forward market. Robust t-statistics are shown in the square brackets. *, ** and *** denote significance at 10%, 5% and 1% levels respectively.
Fragmentation D2D links (%)
Wednesday (14/01) -0.102 -0.0107**
[-0.531] [-2.111] Thursday (15/01) -2.102*** 0.122***
[-10.93] [24.00] Friday (16/01) -1.102*** 0.0362***
[-5.732] [7.118]
Post SNB event (17/01-31/3) 1.379*** -0.0164**
[4.652] [-2.421] Constant 3.102*** 0.0702***
[16.13] [13.78] R2 0.216 0.188 Adjusted-R2 0.185 0.155 N 104 104
31 The EURCHF option market is too illiquid to construct similar measures.

Financial Stability Paper January 2017 33
As an illustration of the higher market fragmentation we compare the backbone activity on two days: the event day and 23 January, which are depicted on the left- (LHS) and right-hand-side (RHS) of Figure 32, respectively. Figure 32 shows that the backbone trading network on 15 January was very dense. Most clients were connected to their corresponding dealers in star-shaped sub-structures, and all dealers were connected to each other through the interdealer market. As a result there was just one connected component. In contrast, this network was considerably more sparse on 23 January, splitting up into multiple disconnected components where the two largest ones are shown. This example is representative of the time after the event, when the number of backbone components stayed well above one most of the time. Note that these findings are consistent with the signs of the dummy coefficients in Table 2. A positive (negative) sign for the number of connected components (dealer-dealer links) signifies an increase in the level of market fragmentation. Thus, Table 2 in conjunction with Figure 32 point to an increase of market activity during and directly after the event and decreased activity in the period thereafter.
Figure 33: Daily split of total participants in the Swiss franc derivatives market by counterparty type
Figure 34: Daily split of notional traded in the Swiss franc derivatives market by counterparty type
Source: DTCC and Bank calculations. Sources: DTCC and Bank calculations.
Figure 35: EURCHF long, short and net Swiss franc position – G16 dealers
Figure 36: EURCHF long, short and net Swiss franc position – hedge funds
Source: DTCC and Bank calculations
Sources: DTCC and Bank calculations.
Peg removed
-500-400-300-200-1000100200300400500
Nov-14 Dec-14 Jan-15 Feb-15 Mar-15
Long Short Net
USD billionsPeg
removed
-70
-50
-30
-10
10
30
50
70
Nov-14 Dec-14 Jan-15 Feb-15 Mar-15
Long Short Net
USD billions
Peg Removed
0
200
400
600
800
1000
Nov-14 Dec-14 Jan-15 Feb-15 Mar-15
G16 dealersBanksReal moneyHedge fundsRetail FX tradingInstitutional FX tradingCorporatesOthers
Number of Counterparties
Peg Removed
0%
20%
40%
60%
80%
100%
Nov-14 Dec-14 Jan-15 Feb-15 Mar-15
G16 dealers BanksReal money Hedge fundsInstitutional FX trading Retail FX tradingCorporates Others
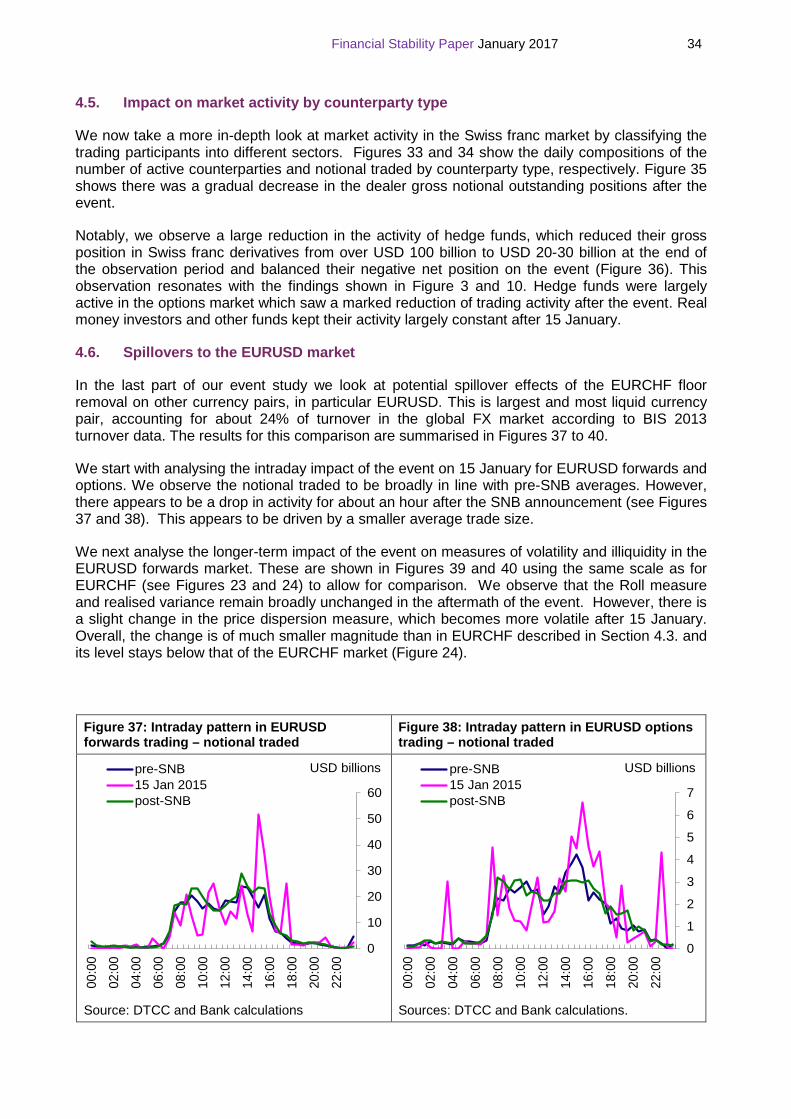
Financial Stability Paper January 2017 34
4.5. Impact on market activity by counterparty type
We now take a more in-depth look at market activity in the Swiss franc market by classifying the trading participants into different sectors. Figures 33 and 34 show the daily compositions of the number of active counterparties and notional traded by counterparty type, respectively. Figure 35 shows there was a gradual decrease in the dealer gross notional outstanding positions after the event.
Notably, we observe a large reduction in the activity of hedge funds, which reduced their gross position in Swiss franc derivatives from over USD 100 billion to USD 20-30 billion at the end of the observation period and balanced their negative net position on the event (Figure 36). This observation resonates with the findings shown in Figure 3 and 10. Hedge funds were largely active in the options market which saw a marked reduction of trading activity after the event. Real money investors and other funds kept their activity largely constant after 15 January.
4.6. Spillovers to the EURUSD market
In the last part of our event study we look at potential spillover effects of the EURCHF floor removal on other currency pairs, in particular EURUSD. This is largest and most liquid currency pair, accounting for about 24% of turnover in the global FX market according to BIS 2013 turnover data. The results for this comparison are summarised in Figures 37 to 40.
We start with analysing the intraday impact of the event on 15 January for EURUSD forwards and options. We observe the notional traded to be broadly in line with pre-SNB averages. However, there appears to be a drop in activity for about an hour after the SNB announcement (see Figures 37 and 38). This appears to be driven by a smaller average trade size.
We next analyse the longer-term impact of the event on measures of volatility and illiquidity in the EURUSD forwards market. These are shown in Figures 39 and 40 using the same scale as for EURCHF (see Figures 23 and 24) to allow for comparison. We observe that the Roll measure and realised variance remain broadly unchanged in the aftermath of the event. However, there is a slight change in the price dispersion measure, which becomes more volatile after 15 January. Overall, the change is of much smaller magnitude than in EURCHF described in Section 4.3. and its level stays below that of the EURCHF market (Figure 24).
Figure 37: Intraday pattern in EURUSD forwards trading – notional traded
Figure 38: Intraday pattern in EURUSD options trading – notional traded
Source: DTCC and Bank calculations
Sources: DTCC and Bank calculations.
0
10
20
30
40
50
60
00:0
0
02:0
0
04:0
0
06:0
0
08:0
0
10:0
0
12:0
0
14:0
0
16:0
0
18:0
0
20:0
0
22:0
0
pre-SNB15 Jan 2015post-SNB
USD billions
0
1
2
3
4
5
6
7
00:0
0
02:0
0
04:0
0
06:0
0
08:0
0
10:0
0
12:0
0
14:0
0
16:0
0
18:0
0
20:0
0
22:0
0
pre-SNB15 Jan 2015post-SNB
USD billions
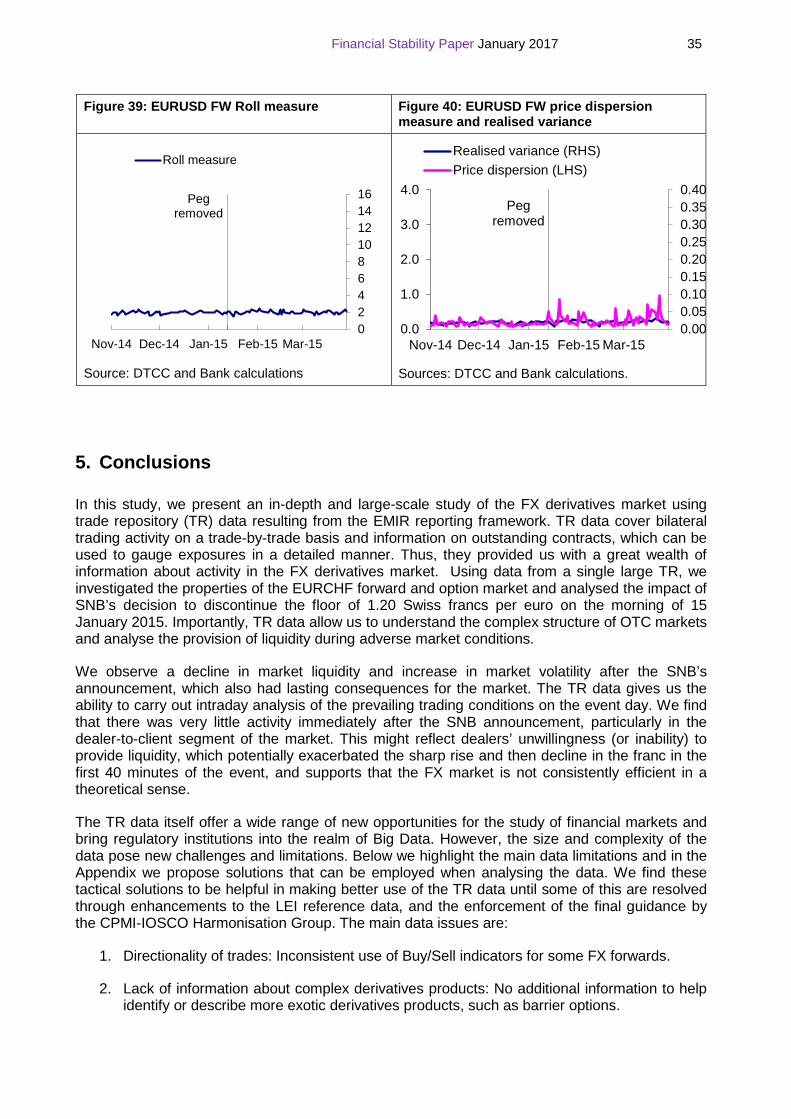
Financial Stability Paper January 2017 35
5. Conclusions
In this study, we present an in-depth and large-scale study of the FX derivatives market using trade repository (TR) data resulting from the EMIR reporting framework. TR data cover bilateral trading activity on a trade-by-trade basis and information on outstanding contracts, which can be used to gauge exposures in a detailed manner. Thus, they provided us with a great wealth of information about activity in the FX derivatives market. Using data from a single large TR, we investigated the properties of the EURCHF forward and option market and analysed the impact of SNB’s decision to discontinue the floor of 1.20 Swiss francs per euro on the morning of 15 January 2015. Importantly, TR data allow us to understand the complex structure of OTC markets and analyse the provision of liquidity during adverse market conditions.
We observe a decline in market liquidity and increase in market volatility after the SNB’s announcement, which also had lasting consequences for the market. The TR data gives us the ability to carry out intraday analysis of the prevailing trading conditions on the event day. We find that there was very little activity immediately after the SNB announcement, particularly in the dealer-to-client segment of the market. This might reflect dealers’ unwillingness (or inability) to provide liquidity, which potentially exacerbated the sharp rise and then decline in the franc in the first 40 minutes of the event, and supports that the FX market is not consistently efficient in a theoretical sense.
The TR data itself offer a wide range of new opportunities for the study of financial markets and bring regulatory institutions into the realm of Big Data. However, the size and complexity of the data pose new challenges and limitations. Below we highlight the main data limitations and in the Appendix we propose solutions that can be employed when analysing the data. We find these tactical solutions to be helpful in making better use of the TR data until some of this are resolved through enhancements to the LEI reference data, and the enforcement of the final guidance by the CPMI-IOSCO Harmonisation Group. The main data issues are:
1. Directionality of trades: Inconsistent use of Buy/Sell indicators for some FX forwards.
2. Lack of information about complex derivatives products: No additional information to help identify or describe more exotic derivatives products, such as barrier options.
Figure 39: EURUSD FW Roll measure Figure 40: EURUSD FW price dispersion measure and realised variance
Source: DTCC and Bank calculations
Sources: DTCC and Bank calculations.
Peg removed
0246810121416
Nov-14 Dec-14 Jan-15 Feb-15 Mar-15
Roll measure
Peg removed
0.0
1.0
2.0
3.0
4.0
0.000.050.100.150.200.250.300.350.40
Nov-14 Dec-14 Jan-15 Feb-15 Mar-15
Realised variance (RHS)Price dispersion (LHS)
Financial Stability Paper January 2017 36
3. Double-counting of dual sided reporting trades: We have identified cases where counterparties seem to be using different Trade IDs for trades which appear identical, which should not be happening.
4. Counterparty hierarchy: Different subsidiaries of the same firm are separate legal entities, hence they all report their trades separately using different LEIs. But, for some purposes such as calculating the currency exposures of the given banks, it is more instructive to look at the consolidated exposures of the parent company.
5. Mismatches between state and activity reports: For the project we have used both activity
and state reports from DTCC. In theory, the two should be consistent, but in practice throughout the project we have found instances where this was not the case. Some trades and counterparties appeared in the state reports and not in the activity reports, and vice versa.
Apart from these drawbacks, most of which will be gradually corrected, TR data provide an invaluable source of information on the vulnerabilities in the financial system that can be used to make it more resilient.

Financial Stability Paper January 2017 37
References
Abad, J., Aldasoro, I., Aymanns, C., D’Errico, M., Fache-Rousová, L., Hoffmann, P., Langfield, S., Neychev, M. and Roukny, T., 2016. “Shedding light on dark markets: first insights from the new EU-wide OTC derivatives dataset”. ESRB Occasional Paper 11.
Albert R. and Barabási, A. L., 2002. “Statistical mechanics of complex networks” Rev. Mod. Phys 74, 47.
BIS, 2015. “OTC derivatives statistics at end-December 2015”.
Barndorff-Nielsen, Ole E., and Shephard, M., 2002. "Estimating quadratic variation using realized variance." Journal of Applied Econometrics 17.5: 457-477.
Benos, E., Wetherilt, A., Zikes, F., 2013. The structure and dynamics of the UK credit default swap market. Bank of England Financial Stability paper No 25.
Benos, E., Payne, R., Vasios, M., 2016. "Centralized trading, transparency and interest rate swap market liquidity: evidence from the implementation of the Dodd-Frank act". Bank of England Working Paper No. 580.
Friewald, N., Jankowitsch, R., Subrahmanyam, M. G., 2012. “Illiquidity or credit deterioration: A study of liquidity in the US corporate bond market during financial crises”. Journal of Financial Economics 105 (1), 18-36.
Glosten, L. R., and Milgrom P. R., 1985. "Bid, ask and transaction prices in a specialist market with heterogeneously informed traders." Journal of financial economics 14.1: 71-100
Goyenko, R. Y., Holden, C. W., Trzcinka, C. A., 2009. “Do liquidity measures measure liquidity?” Journal of financial Economics 92 (2), 153-181.
Jankowitscha, A., Nashikkarb, M. G. Subrahmanyamb, 2011. “Price dispersion in OTC markets: A new measure of liquidity”, Journal of Banking & Finance.
Joseph, A., Joseph, S. and Chen G., 2014, “Cross-border portfolio investment networks and indicators for financial crises”. Scientific Reports 4, 3991.
Kyle, Albert S., 1985. "Continuous auctions and insider trading." Econometrica: Journal of the Econometric Society: 1315-1335.
Loon, Y. C., Zhong, Z. K., 2014. “The impact of central clearing on counterparty risk, liquidity, and trading: Evidence from the credit default swap market”. Journal of Financial Economics 112 (1), 91, 115.
Roll, R., 1984. “A simple implicit measure of the effective bid-ask spread in an efficient market”, Journal of Finance.
Shleifer, A., Vishny, W., R., 1997. "The limits of arbitrage." The Journal of Finance 52.1, 35-55.
Stoll, Hans R., 1978. "The supply of dealer services in securities markets." The Journal of Finance 33.4: 1133-1151.

Financial Stability Paper January 2017 38
Appendix - Lessons learned from working with the TR data
Data scope
The wider the scope of data that is analysed, the more complete the picture is with regards to risks and dynamics in the market. In this pilot project we make use of data from one of the six authorised trade repositories. This approach may introduce bias into our analysis, since firms are free to choose which TR they report their trades to, and certain types of firms may report trades to certain TRs, which are not considered for the analysis.
Data quality issues and solutions
The quality of TR data that the Bank receives is constantly improving, although it is unlikely that older trade reports will be re-submitted to bring them up to current standards. As a result, projects looking at more recent data are likely to encounter fewer issues with the data. The quality of data available since December 2014 has improved after ESMA instigated the “Level 1 validation” measure, which makes it clear which fields are mandatory. “Level 2 validation” came into force in November 2015 (therefore after the period of interest for this paper), which should lead to further improvements. Some of the key issues that we encountered with the data are described below.
Directionality of trades: Buy/Sell Indicators for forwards
For FX forward and swap contracts when two counterparties are exchanging currencies both act as a buyer and a seller of different legs of the trade This makes it difficult to interpret the ‘Counterparty Side’ field which has values ‘B’ and ‘S’ for ‘Buy’ and ‘Sell’, respectively. To help with this uncertainty ESMA issued some guidelines in its Q&A32 but the extent to which they are followed by the reporting counterparties is uncertain. For example, when we look at the double sided reports in our data, it appears that some participants may have been reporting the ’Counterparty Side’ field with respect to ‘Notional Currency 1’: ‘B’ when currency 1 is bought and vice versa, which is not in line with the ESMA Q&A. Hence, to infer directionality we take this inconsistency into account and manually correct the ‘Counterparty Side’.
Double-counting of double-sided-reporting trades
Under EMIR, a unique Trade ID should be generated and agreed with the other counterparty, such that only one Trade ID should be related to any one reported derivatives contract. The unique Trade ID means that if both parties report the same trade to a TR because both fall under the reporting regulation, it is possible to identify double-sided-reporting and remove the duplicates for the purposes of analysing outstanding notional or traded volumes (so that each trade is counted only once). However, in practice counterparties might use different Trade IDs for reporting the same transaction. We looked at the EURCHF segment to test for this possibility and identified less than 1% suspicious trades, where reports with different trade ids shared the same notional amount, time, price and counterparties. Hence, the double reporting under different trade ids should not be a big concern for the FX forward market.
Timestamps
We came across some trades where the execution timestamp of the trades has been filled incorrectly. One large entity, for instance, reported all of its trades as executed at 11.59 pm,
32 “The counterparty that is delivering the currency which is first when sorted alphabetically by ISO 4217 standard should be identified as the ‘seller’ and populate the ‘S’ value in field 13 of the Table 1 Counterparty Data.” ESMA EMIR Q& A: https://www.esma.europa.eu/sites/default/files/library/2016-1176 qa xix emir.pdf
Financial Stability Paper January 2017 39
which was inconsistent with the trade stamps reported by the other counterparty as part of double-sided reporting. These reports have not been included in the event analysis. Timestamps submitted by the two counterparties to a transaction, with the same Trade ID, sometimes do not exactly match up. This may partly be a consequence of the voice-brokered market. Nonetheless, our intraday analysis demonstrated that most timestamps seem to be accurate as the reported trades on 15 January 2015 follow closely the timing of events on that day.
Grouping firms under parent company
EMIR rules state that each entity which falls under the reporting requirements must report the trade. Since different subsidiaries of the same firm are separate legal entities, they all report their trades separately and the counterparties are identified separately (e.g. using different LEIs). But, for some purposes, for instance calculating the currency exposures of given banks, it is more instructive to look at the consolidated exposures of the parent company. This is still difficult, given there is currently no database which can provide the hierarchy of LEIs. In order to get around this problem, we have used simple algorithms which make use the information on intra-group trades in the data, as well as match firms by their names, in order to group firms. We have also manually assigned groupings for a number of firms.
In future projects it should be possible to use different data sources to group firms. For example, there is an ongoing project by the LEI Regulatory Oversight Committee (LEI ROC) to implement hierarchal structures in the Global LEI System. Phased implementation of collecting information about the ultimate parent is expected to start at the end of 2016.
Classifying firms by type
TR data contain no information about the counterparty type. This might be useful, for example, for analysing the behaviour of large dealers and their provision of liquidity, or the behaviour of institutional investors such as pension funds or hedge funds. In this project, we classified the type of counterparties in the Swiss franc market using simple algorithms and manual corrections, an approach which might not be entirely error free. In the future, the use of proprietary databases containing LEI-based counterparty type information might allow for a more definite classification.
Lack of information about more complex derivatives products
TR data do not contain information to identify more exotic derivatives products. For example, it would have been useful to be able to identify barrier options, as participants were using them in the Swiss franc market and were designed to knock out in the event of the Swiss franc floor removal. The ongoing work by CPMI and IOSCO that aims to develop a globally harmonised Unique Product Identifier will eventually help to resolve this issue of identifying exotic options.


![2011 No. 41 TRANSPORT AND WORKS, ENGLAND ......[DfT 00041] STATUTORY INSTRUMENTS 2011 No. 41 TRANSPORT AND WORKS, ENGLAND TRANSPORT, ENGLAND The River Mersey (Mersey Gateway Bridge)](https://img.pdfslide.us/doc/110x75/5f2c9bc09fdbde64cc73444f/2011-no-41-transport-and-works-england-dft-00041-statutory-instruments.jpg)


![STABILITY OF DRUGS AND DRUG PRODUCTS - prr.hec.gov.pkprr.hec.gov.pk/jspui/bitstream/123456789/41/1/Stability of Drugs].pdf · 4.6.8.3 Interaction of α-tocopherol with ascorbic acid](https://img.pdfslide.us/doc/110x75/5e0e467cf213e0278408ea16/stability-of-drugs-and-drug-products-prrhecgovpkprrhecgovpkjspuibitstream123456789411stability.jpg)


![[41 P.M. Anderson, A.A Fouad, Power system control and stability Iowa state university press, Iowa 1977. [5] P. Kundur, " Power system stability and control New York : McGraw Hill,](https://img.pdfslide.us/doc/110x75/5e6891b718ac58552d38e1d3/41-pm-anderson-aa-fouad-power-system-control-and-stability-iowa-state-university.jpg)