Embed Size (px)
Citation preview

49
133
156
255
192
0
127
127
127
0
153
204
191
191
191
203
224
230
234
234
234
0
97
114
Group1 Financial Results
for the nine months ended 30 September 2017
Bank of Cyprus Group
21 November 2017
Financial information included in this presentation is neither reviewed nor audited by the Group’s external auditors. They are presented in Euro (€) and all amounts are rounded as indicated. A comma is
used to separate thousands and a dot is used to separate decimals.
(1) The Group Financial Results referred to in this Presentation relate to the consolidated financial results of Bank of Cyprus Holdings Public Limited Company (BOC Holdings), together with its
subsidiary the Bank of Cyprus Public Company Limited, the “Bank”, and the Bank’s subsidiaries. On 18 January 2017, BOC Holdings was introduced in the Group structure as the new holding company.
On 19 January 2017, the total issued share capital of BOC Holdings was admitted to listing and trading on the London Stock Exchange and the Cyprus Stock Exchange.

49
133
156
255
192
0
127
127
127
0
153
204
191
191
191
203
224
230
234
234
234
0
97
114
9M2017 - Highlights
2
• Quarterly operating profit of €124 mn (€130 mn 2Q2017)
• New lending of €1.7 bn in 9M2017, exceeding new lending in FY2016
• NIM of 3.18% for 9M2017 but 2.86% in 3Q2017 reflecting accelerated de-risking and cost of liquidity compliance
• Cost to income ratio of 45% for 9M2017
• Deposits up by €731 mn (4%) qoq; up by €805 mn in 9M2017 facilitating liquidity ratio compliance
• Loan to deposit ratio at 85%
• Compliance with LCR and NSFR liquidity requirements4
• CET1 at 12.4% and 11.9% fully loaded; Total Capital ratio at 13.8%
• SREP 2018 CET1 ratio reduced to 9.375%2 from 9.50%; SREP 2018 total capital ratio reduced to 12.875%2 from 13.00%
• IFRS 9 estimated impact based on 30 September 2017 Balance Sheet is a decrease in shareholders’ equity of €250 mn - €300 mn.
On a transitional basis and on a fully phased in basis after the period of transition is complete, the impact of IFRS 9 is expected to be
manageable and within the Group’s capital plans3
Preliminary
2018 EPS
Guidance
maintained
• EPS of c.€0.40 maintained
• More normal credit cost (<1% in 2018) but pressure on NIM
• Accelerated de-risking puts pressure on NIM but expected to be offset by reduced provisioning
• CET 1 >13.0% and Total capital ratio >15.0%
Resilient operating
performance
Improved funding
and liquidity
position
Capital is sufficient
• Ten consecutive quarters of NPE reduction
• NPEs down by €588 mn qoq to €9.2 bn (down by 17% during 9M2017 and by 39% since December 2014)
• Coverage at 49%; medium term target substantially achieved; coverage now above EU average1
Continued
Progress on
‘organic’ Balance
Sheet repair
(1) Based on EBA Risk Dashboard as at 30 June 2017
(2) Effective as from 1 January 2018.As at the date of publication of this presentation these requirements remain subject to ECB’s final confirmation, which is expected by the end of 2017
(3) With final transitional arrangements proposal applicable for year 2018. The IFRS 9 assessment is a “point in time” estimate and is not a forecast. The actual effect of the implementation of IFRS 9 on the Bank and
the Group could vary significantly from these estimates. The Bank continues to refine models, methodologies and controls, and monitor regulatory and other developments in advance of IFRS 9 adoption on 1
January 2018. All estimates are based on the Bank’s current interpretation of the requirements of IFRS 9, reflecting industry guidance and discussions to date.
(4) As at 30 September 2017, the Bank was not in compliance with all the local regulatory liquidity requirements set by the Central Bank of Cyprus (CBC), expected to be abolished by the end of 2017. CBC is
expected to proceed in the direction of a measure in the form of a liquidity add-on that will be imposed on top of the LCR
• Launching of listed Real Estate fund in Cyprus of a size of c.€190 mn
• Continue to explore other structured solutions to accelerate de-risking, potentially in the near term, in one or more transactions
Acceleration
initiatives

49
133
156
255
192
0
127
127
127
0
153
204
191
191
191
203
224
230
234
234
234
0
97
114
Continued progress on NPEs reduction
50% NPE coverage ratio substantially achieved
41%
48%
54% 54%
61% 62%
34%
39% 41% 42%
48% 49% >50%
Dec2014
Dec2015
Dec2016
Mar2017
Jun2017
Sep2017
MediumTerm Target
90+DPD provision coverage NPEs provision coverage
3
€1.1 bn reduction in 90+DPD in 9M2017; down by 45% since peak €1.9 bn reduction in NPEs in 9M2017; down by 39% since peak
12.7 11.3
8.3 8.0 7.6 7.2
53% 50%
41% 40% 39% 37%
20%
00%
10%
20%
30%
40%
50%
60%
Dec 2014 Dec 2015 Dec 2016 Mar 17 Jun 2017 Sep 2017 MediumTerm Target
90+DPD (€ bn) 90+DPD ratio
15.0
14.0
11.0 10.4
9.8 9.2
63% 62%
55% 52%
50% 48%
30%
10%
20%
30%
40%
50%
60%
Dec 2014 Dec 2015 Dec 2016 Mar 2017 Jun 2017 Sep 2017 Medium TermTarget
NPEs (€ bn) NPEs ratio
NPE total coverage at 115% when collateral included
41%
42%
48%
49%
68%
67%
66%
66%
109%
109%
114%
115%
Dec 16 Mar-17 Jun-17 Sep-17
Loan loss reserves Tangible Collateral1
(1) Restricted to Gross IFRS balance

49
133
156
255
192
0
127
127
127
0
153
204
191
191
191
203
224
230
234
234
234
0
97
114
68
%
65
%
65
%
63
%
60
%
58
%
58
%
57
%
54%
51%
50%
49
%
48
%
45
%
45
%
45
%
41
%
40
%
36
%
33
%
33
%
31
%
31
%
29
%
29
%
29
%
27
%
26
%
26
%
45%
RO SI HU CZ PL BG HR SK AT FR IT BOC GR BE PT ES DE LU MT NL IE GB LT LV DK SE NO FI EE
50% by year end
1 Based on EBA Risk Dashboard as at 30 June 2017
2 Provision Coverage for BOC relates to NPEs provision coverage as at 30 September 2017
EU average
Coverage ratio above EU average
Medium term target of 50% NPE provision coverage substantially achieved
4

49
133
156
255
192
0
127
127
127
0
153
204
191
191
191
203
224
230
234
234
234
0
97
114
13.26
10.50
8.81
0.85 (1.63)
(1.12)
(0.86) 0.57 (1.30)
(0.66) (0.30)
Dec 2015 Inflows Curing ofrestructuredloans andcollections
Write-offs Consensualforeclosures
Dec 2016 Inflows Curing ofrestructuredloans andcollections
Write-offs Consensualforeclosures
Sep 17
9M2017 NPE net reduction : c.€1.7 bn
€1.7 bn NPEs reduction in 9M2017 (Cy operations)
5
1,2
(1) Value of on-boarded assets is set at a conservative 25%-30% discount from open market valuations, by two independent sources
(2) Includes debt for asset swaps and debt for equity swap
FY2016 NPE net reduction : c.€2.8 bn
Reduction continues through curing of restructured loans, collections, write offs and consensual foreclosures (DFAs)
1,2

49
133
156
255
192
0
127
127
127
0
153
204
191
191
191
203
224
230
234
234
234
0
97
114
3.1
2.2
2.5
1.4
10.1
Multi-tiered strategies launched to accelerate de-risking
(1) In pipeline to exit NPEs subject to meeting all exit criteria
(2) Analysis based on account basis
6
Forborne No impairments
No arrears1,2
NPEs
€9.2 bn
Group -Gross loans €19.3 bn
Performing
€10.1 bn
Performing
Retail NPEs
SMEs NPEs
Performing
• High quality new business
• Re-defaults of new lending in the past 24 months <2%
Forborne, no impairments no arrears
• Expect majority of €1.4 bn to exit NPE status
Area of focus
going forward
€7.8 bn
Corporate
NPEs
SMEs & Corporate - NPEs
• Exploring structured sale solutions to accelerate de-risking, potentially in the near term, in one
or more transactions
• The portfolio is categorised into large, medium and small exposures
• Incremental servicing engine powered by external party
Retail - NPEs
• Additional focus of management on delinquent exposures
• Exploring structured solutions to accelerate de-risking
• Incremental servicing engine powered by external party

49
133
156
255
192
0
127
127
127
0
153
204
191
191
191
203
224
230
234
234
234
0
97
114
1,427 1,548
356 (204) (31)
Stock as at 01 Jan 17 Additions Sales Impairment loss Stock as at 30 Sept 2017
€ mn
BV1
134 284 89 65 508 264 53 151
Residential Offices and other commercial properties Manufacturing and industrial Hotels Land and Plots Golf Under construction Greece and Romania
€ mn
Property stock split – on boarded at conservative carrying value3 (Group)
Assets
#1,491
#
Total
#966 #38 #302 #140 #3
Encouraging trends in Real Estate Market
#5
SOURCE: Central Bank of Cyprus, Cyprus Land Registry
(1) BV= book value = Carrying value prior to the sale of property
(2) Total stock as at 30 September 2017 excludes investment properties and investment properties held for sale
(3) As of 9M2017. Assets in REMU on boarded at conservative prices c.25%-30% discount to open market value (OMV)
2
3
REMU – the engine for dealing with foreclosed assets
REMU focus now on sales (Group) 1
2
7
Cyprus: €1,397 mn
72.2
107.7
74.8
73.3
74.1
50.0
60.0
70.0
80.0
90.0
100.0
110.0
120.0
Q2
.06
Q4
.06
Q2
.07
Q4
.07
Q2
.08
Q4
.08
Q2
.09
Q4
.09
Q2
.10
Q4
.10
Q2
.11
Q4
.11
Q2
.12
Q4
.12
Q2
.13
Q4
.13
Q2
.14
Q4
.14
Q2
.15
Q4
.15
Q2
.16
Q4
.16
Q2
.17
Central Bank of Cyprus Residential Property Price Index
CBC RPPI
12,664
21,245
3,767 4,527
4,952 7,063
4,644 5,523
0
5,000
10,000
15,000
20,000
25,000
30,000
20
00
20
01
20
02
20
03
20
04
20
05
20
06
20
07
20
08
20
09
20
10
20
11
20
12
20
13
20
14
20
15
20
16
20
16
Jan
-Se
p
20
17
Jan
-Se
p
Sales to Cypriots Sales to Non-Cypriots
Sales contracts – Excluding DFAs
€1,548 mn
#37

49
133
156
255
192
0
127
127
127
0
153
204
191
191
191
203
224
230
234
234
234
0
97
114
48 44 14
49 110 39 60
2
2
7 1
4 48 46
16
56
110
40
64
9
1Q2016 2Q2016 3Q2016 4Q2016 1Q2017 2Q2017 3Q2017 post end3Q2017
Sales Cyprus Sales Greece and Romania
Robust REMU sales, to be further supported by launch of Real Estate Fund
€364 mn offers accepted ytd (c.€300 mn sales agreed); REMU profit of €24 mn in 9M2017
(1) BV= book value = Carrying value prior to the sale of property
(2) 2Q2017 sales include a disposal of a property (€10 mn) which was classified in investment properties held for disposal
(3) Positively affected by 2 major sales. Adjusting for these two sales Gross Proceeds/OMV at 97% and Net Proceeds/BV at 114%
(4) Proceeds before selling charge and other leakages
(5) Proceeds after selling charges and other leakages
(6) Amounts as per SPAs
Sales > €380 mn achieved since REMU established (Group) 4
364
270
23 44
27
Offers accepted(YTD)
In process (YTD) SPA in preparation(YTD)
SPA signed (YTD) Sold (YTD)
Total sale
agreements
€297 mn
Year to date sale agreements of c.€300 mn5 (Group) 5
Sales contract prices6 (€ mn)
Prices achieved on average well above Book Value (Group) 6
2
€ mn
BV1
203 properties sold YTD 223
12
51 12
148
116% 99% 110% 115% 119%
0%
20%
40%
60%
80%
100%
Total SalesYTD
Hotels Commercial Residential Land
Hotels Commercial Residentail Land Gross Proceeds / OMV Net Proceeds / BV1
94% 106%
4
3
3
5
€ mn
BV
99% 74% 88%
8
FY16: €166 mn YTD: €223 mn
• Launching of listed Real Estate fund in Cyprus of a size of c.€190 mn
• CySEC granted approval to register CyREIT as an Alternative
Investment Fund (AIF) subject to meeting certain conditions
• Fund will comprise exclusively of commercial income generating real
estate assets in Cyprus with Core/ Core+ strategy
• Fund to be listed on the Non Tradable Investment Schemes Market of
the CSE
• Annual distribution of >80% of available distributable net proceeds in
cash dividends

49
133
156
255
192
0
127
127
127
0
153
204
191
191
191
203
224
230
234
234
234
0
97
114
53 92 74
109 103 93 108 30
53 33
39 68 52 38 80
120 133
192
331
198
310
163
265 240
340
502
343
456
1Q2016 2Q2016 3Q2016 4Q2016 1Q2017 2Q2017 3Q2017
Consumer SME Corporate
New lending of €1.7 bn in 9M2017 exceeding new lending in FY2016
9
Focused on new Good Quality Business; Robust new lending, supporting the Cypriot economy
FY16: €1,008 mn 9M17: €1,301 mn
9M2017– Total New Lending of €1.7 bn (Group)
1,301
424 Cyprus UK
Tourism & Trade core sectors
New lending maps core sectors driving GDP growth
49
107
116
119
120
188
297
305
Manufacturing
Real estate
Construction
Professional and other services
Hotels and restaurants
Other Sectors
Private individuals
Trade
0.2
0.3
0.4
0.6
1.0
1.1
Other
Industry
Professional & admin
Public, education & health
Construction
Tourism & trade
Contribution to 1H2017 Real GDP growth in p.p. (total 3.6%)
New lending Cyprus (€ mn) – 9M2017

49
133
156
255
192
0
127
127
127
0
153
204
191
191
191
203
224
230
234
234
234
0
97
114
14.0%
6.3%
1.8%
(8.8%)
(1.0%)
12.3%
CET 1(transitional) 31 Dec 2014
Operatingprofitability
RWA reduction Provisions& impairments
Other CET 1(transitional)
30 June 2017
85% 85% 85% 83%
79% 76%
Dec 14 Dec 15 Dec 16 Mar 17 Jun 17 Sep 17
Capital ratios remain adequate
10
Organic capital rebuild through operating profitability and b/sheet management
12.4%
CET 1 (transitional)30 September 2017
2018 Operatingprofitability
2018 Provisions &Impairmens
2018 CET 1(transitional)
>13%
(1) Capital deductions, phase-in adjustments & reserve movements
(2) Risk Weighted Assets over Total Assets
(3) Based on data as at 30 September 2017
(4) The IFRS 9 assessment is a “point in time” estimate and is not a forecast. The actual effect of the implementation of IFRS 9 on the Bank and the Group could vary significantly from these
estimates. The Bank continues to refine models, methodologies and controls, and monitor regulatory and other developments in advance of IFRS 9 adoption on 1 January 2018. All estimates
are based on the Bank’s current interpretation of the requirements of IFRS 9, reflecting industry guidance and discussions to date.
(5) http://data.consilium.europa.eu/doc/document/ST-13725-2017-INIT/en/pdf
COR 2018 <1.0%
RWA intensity2 reducing as de-risking continues
9.5% 9.375%
1
min SREP requirement
13.9
%
14.5
%
14.6
%
14.0
%
14.4
%
15.6
%
11.8
%
12.3
%
13.8
%
11.9
%
12.4
%
13.8
%
CET 1 fully loaded CET 1 ratio (transitional) Total capital ratio
Dec 2016 Mar 2017 Jun 2017 Sep 2017
Evolution of capital ratios
9.5% 9.5%
IFRS 9
update3,4
Expected impact based on 30 September 2017 balance sheet:
• Decrease of shareholders’ equity ranging between €250 mn and €300 mn primarily driven by credit impairment provisions; Decrease in TNAV of €0.56 to
€0.67 per share
• The Group expects to implement transitional arrangements for regulatory capital purposes currently being finalised by European regulators5 which would
result in only c.5% of the estimated IFRS 9 impact affecting the capital ratios during 2018
• On a transitional basis and on a fully phased in basis after the period of transition is complete, the impact of IFRS 9 is expected to be
manageable and within the Group’s capital plans.

49
133
156
255
192
0
127
127
127
0
153
204
191
191
191
203
224
230
234
234
234
0
97
114
Lower SREP capital requirement expected for 2018
11
SREP 20185: CET1 ratio reduced to 9.375% SREP 20185: Total Capital ratio reduced to 12.875%
12.4%
4.50% 4.50%
3.75% 3.00%
1.25% 1.875%
CET1 transitional30.09.2017
Min. SREP CET1requirement for 2017
Min. draft SREP CET1requirement for 2018
Pillar 1 Pillar 2 CCB1 2
3 3,5
13.8%
4.50% 4.50%
1.50% 1.50%
2.00% 2.00%
3.75% 3.00%
1.25% 1.875%
Total Capital Ratio30.09.2017
Min. SREP total capitalrequirement for 2017
Min. draft SREP totalcapital requirement for
2018
Pillar 1 AT1 capital Tier 2 capital Pillar 2R CCB
Total
Pillar 1
of 8%
Total
Pillar 1
of 8%
13.00% 12.875%
1` 2 4
• 75 bps improvement in Pillar 2 requirement, partly set off by the 62.5 bps phasing-in of the CCB requirement
• Phased-in CET1 at 9.375% (-12.5 bps)
• Total capital ratio at 12.875% (-12.5 bps)
• ECB has also provided revised lower non-public guidance for additional Pillar 2 CET1 buffer
• Final confirmation expected by ECB in December 2017
• New SREP requirements effective as of 1 Jan 2018
9.50% 9.375%
3
3,5
(1) Pillar 2 requirement in the form of CET1
(2) In accordance with the legislation in Cyprus which has been set for all credit institutions the applicable rate of the CCB is 1.875% for 2018 and 2.5% for 2019 (fully phased-in)
(3) Since 2015, the Bank has been designated as an Other Systemically Important Institution (O-SII). The Central Bank of Cyprus set the O-SII buffer for the Group at 2%. This buffer
will be phased-in gradually, starting from 1 January 2019 at 0.5% and increasing by 0.5% every year thereafter, until being fully implemented (2.0%) on 1 January 2022
(4) Additional Tier 1 Capital
(5) The new SREP requirements will be effective as from 1 January 2018, and as at the date of publication of this announcement these requirements remain subject to ECB final
confirmation, which is expected by the end of 2017

49
133
156
255
192
0
127
127
127
0
153
204
191
191
191
203
224
230
234
234
234
0
97
114
Lower L/D ratio due to increase in deposits
141% 136% 121%
110% 95% 95% 90%
85%
124% 125% 121% 121% 118% 118% 118%
Dec 14 Jun 15 Dec 15 Jun 16 Dec 16 Mar 17 Jun 17 Sept 17 MediumTerm
Target
Loan to deposit ratio EU average Loan to deposit ratio
90%- 110%
Improved funding and liquidity position putting pressure on NIM
12
Strong market shares in resident and non-resident deposits
(1) Based on EBA Risk Dashboard Report, Data as at 30 June 2017
(2) International Business Unit
25.5% 24.1% 27.0% 27.2%
29.5% 29.5% 30.1% 30.9%
32.2%
26.7%
31.1% 34.1%
35.8% 34.5% 35.3% 36.8%
Dec 13 Dec 14 Dec 15 Jun 16 Dec 16 Mar 17 Jun 17 Sept 17
Residents Non-residents
1
7.85 8.94
10.56 10.67 10.93 11.35
3.47
3.75
4.49 4.41 4.08 4.24
1.30
1.49
1.46 1.46 1.57 1.72
0.55
13.17 14.18
16.51 16.54 16.58 17.31
Dec-14 Dec-15 Dec-16 Mar 17 Jun 17 Sept 17
Cyprus non-IBU Cyprus IBU UK Other countries
• LCR (Liquidity Coverage Ratio) compliance
• NSFR (Net stable Funding Ratio) compliance ahead
of introduction in Jan 2018
• Not compliant with all CBC liquidity ratios; expected to
be abolished by the end of 2017. CBC is expected to
proceed in the direction of a measure in the form of a
liquidity add-on that will be imposed on top of the
LCR.
3 3
c.€730 mn increase in deposits in 3Q2017
2
Downward pressure on L/D due to increase in deposits
49
133
156
255
192
0
127
127
127
0
153
204
191
191
191
203
224
230
234
234
234
0
97
114
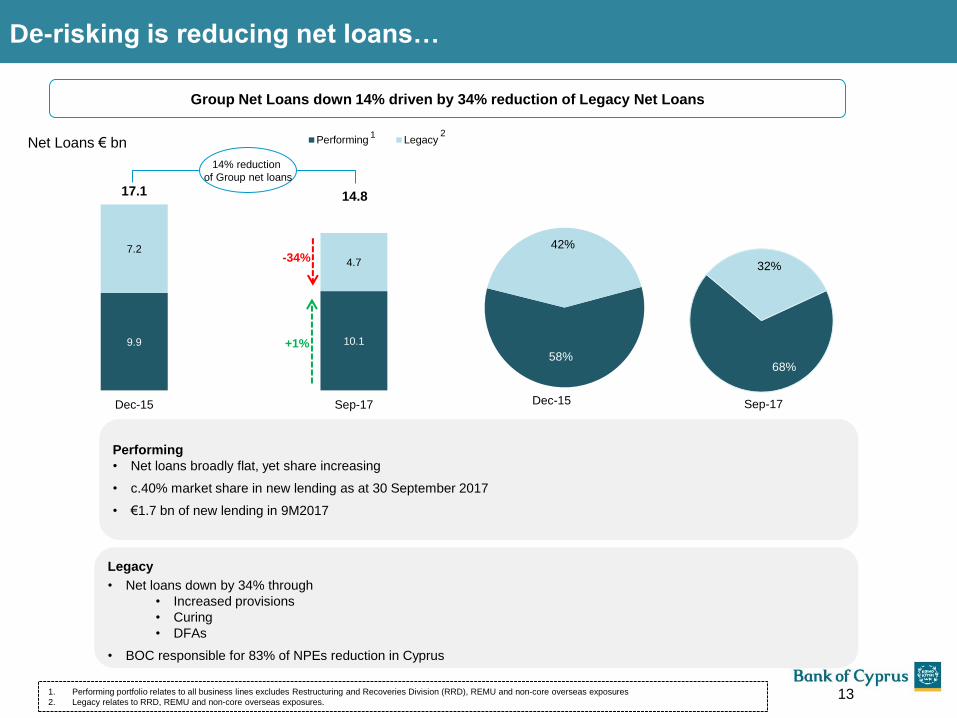
De-risking is reducing net loans…
9.9 10.1
7.2
4.7
17.1 14.8
Dec-15 Sep-17
Performing Legacy
58%
42%
68%
32%
Performing
• Net loans broadly flat, yet share increasing
• c.40% market share in new lending as at 30 September 2017
• €1.7 bn of new lending in 9M2017
Legacy
• Net loans down by 34% through
• Increased provisions
• Curing
• DFAs
• BOC responsible for 83% of NPEs reduction in Cyprus
Net Loans € bn
Group Net Loans down 14% driven by 34% reduction of Legacy Net Loans
Dec-15 Sep-17
13
+1%
-34%
14% reduction
of Group net loans
1. Performing portfolio relates to all business lines excludes Restructuring and Recoveries Division (RRD), REMU and non-core overseas exposures
2. Legacy relates to RRD, REMU and non-core overseas exposures.
1 2
49
133
156
255
192
0
127
127
127
0
153
204
191
191
191
203
224
230
234
234
234
0
97
114
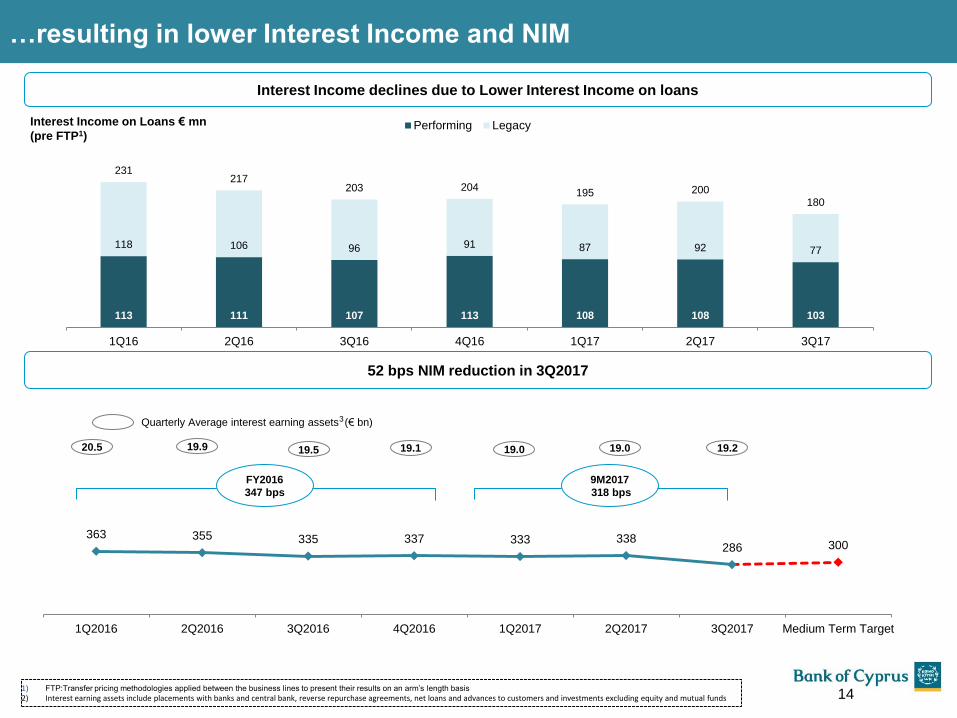
363 355 335 337 333 338 286 300
1Q2016 2Q2016 3Q2016 4Q2016 1Q2017 2Q2017 3Q2017 Medium Term Target
Quarterly Average interest earning assets (€ bn)
FY2016
347 bps
9M2017
318 bps
…resulting in lower Interest Income and NIM
19.9 20.5 19.5 19.1 19.0 19.0
52 bps NIM reduction in 3Q2017
19.2
113 111 107 113 108 108 103
118 106 96 91 87 92 77
231 217
203 204 195 200
180
1Q16 2Q16 3Q16 4Q16 1Q17 2Q17 3Q17
Performing LegacyInterest Income on Loans € mn
(pre FTP1)
Interest Income declines due to Lower Interest Income on loans
14 1) FTP:Transfer pricing methodologies applied between the business lines to present their results on an arm’s length basis
2) Interest earning assets include placements with banks and central bank, reverse repurchase agreements, net loans and advances to customers and investments excluding equity and mutual funds
3

49
133
156
255
192
0
127
127
127
0
153
204
191
191
191
203
224
230
234
234
234
0
97
114
30 September 2017 Performing1 Legacy2
Additional
Provisions
in 2Q2017
Group
Pro
fita
bilit
y
Interest Income
on loans (€ mn)
(9M2017)
(pre FTP)3
318 257 575
Provisions4
(€ mn) 13 (256) (486) (729)
Interest Income
net of provisions4
(€ mn)
331 1 3324
Effective Yield4,5 4.25% 7.94% 5.18%
Risk adjusted
Yield4,6 4.42% 0.03% 2.99%
Ba
lan
ce
Sh
eet
Net Loans4
(€ mn)
9,984 4,313 486 14,783
Total assets4
(€ bn)
16.3 6.1 0.5 22.9
Ca
pit
al
RWA4 (€ bn)
10.0 6.8 0.5 17.3
RWA intensity4 61% 111% 111% 76%
• Performing Book is expected to
grow and to increasingly drive
Group results
• Legacy book revenues
predominantly driven by
provisioning unwinding (but partly
offset via provisions for neutral
P&L impact)
• Risk adjusted yield strong in
Performing book, near zero in
Legacy due to high provisions
• As Legacy book reduces :
Group risk adjusted yield
expected to rise
Group Risk intensity
expected to fall supporting
CET1 ratio build
1) Performing portfolio relates to all business lines excluding RRD, REMU and non-core overseas exposures
2) Legacy relates to RRD, REMU and non-core overseas exposures
3) FTP:Transfer pricing methodologies applied between the business lines to present their results on an arm’s length basis
4) Performing and Legacy breakdown excludes €486 mn additional provisioning charge in 2Q2017 to accelerate de-risking
5) Interest Income on Loans /Net Loans
6) Interest Income on Loans net of provisions /Net Loans
NII & NIM trends – Performing vs Legacy
15

49
133
156
255
192
0
127
127
127
0
153
204
191
191
191
203
224
230
234
234
234
0
97
114
41%
32%
6%
9%
8% 2% 2%
International BankingServices (IBS)
Consumer
SME
Corporate
RRD
Wealth andManagement
Other
Analysis of Non Interest Income (€ mn) – Quarterly
36 38 38 48 43 45 45
14 11 10
9 10
15 14 1 1 1
4 9 1 12
8 13 22
16 15 16
14
59 63
71 77 77 77
85
1Q2016 2Q2016 3Q2016 4Q2016 1Q2017 2Q2017 3Q2017
Net FX gains / (losses) & Net gains/(losses) on other financial instruments, and other income.
Gains/(losses) from revaluation and disposal of investment properties and on disposal of stock of properties
Insurance income net of insurance claims
Net fee and commission income
15% 16% 20%
16%
19% 19% 20%
%
Net fee and commission
income % Total income
16
Non interest income up 11% qoq, driven by €12 mn profit on REMU sales
(1) Excluding non-recurring fees of approximately €7 mn
Fee & commission income in Cyprus by business line
Around one third
of IB, W&M fee &
commission
income
is driven by
Payment
Transactions
41
20 21 26
35 36 38 39
53
35 29 30
37 38 41 42
2013 pre-bail-in
2013 post-bail-in
2014 2015 2016 1Q2017 2Q2017 3Q2017
Incoming Payment Orders Outgoing Payment Orders
Payment Transactions are increasing
Average Number of Payment Transactions per month (thousands)
49
133
156
255
192
0
127
127
127
0
153
204
191
191
191
203
224
230
234
234
234
0
97
114
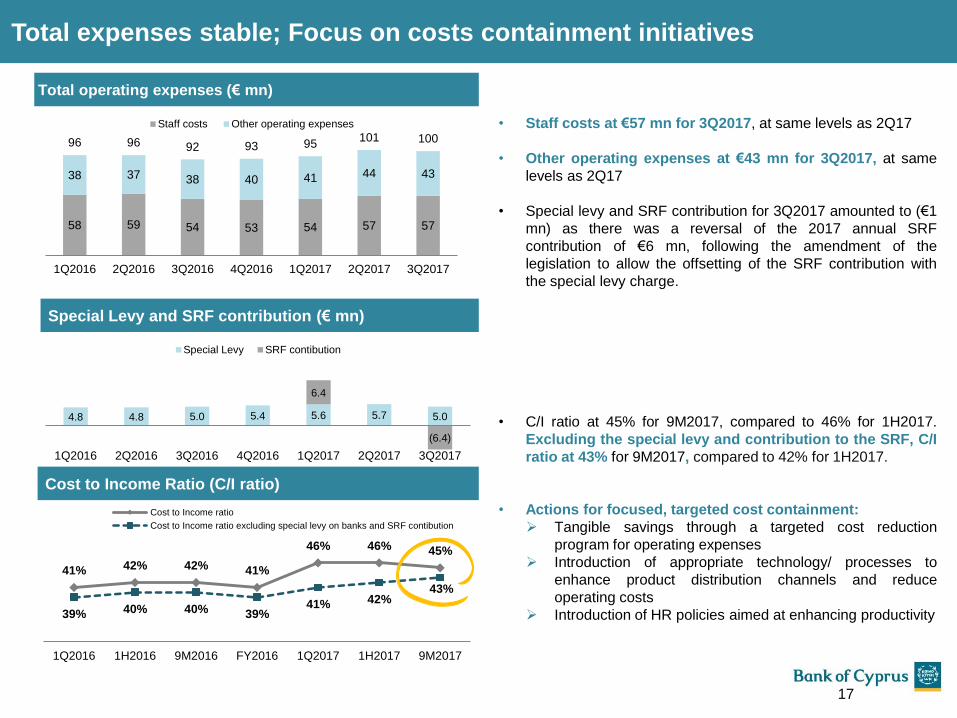
Cost to Income Ratio (C/I ratio)
Total operating expenses (€ mn)
• Staff costs at €57 mn for 3Q2017, at same levels as 2Q17
• Other operating expenses at €43 mn for 3Q2017, at same
levels as 2Q17
• Special levy and SRF contribution for 3Q2017 amounted to (€1
mn) as there was a reversal of the 2017 annual SRF
contribution of €6 mn, following the amendment of the
legislation to allow the offsetting of the SRF contribution with
the special levy charge.
• C/I ratio at 45% for 9M2017, compared to 46% for 1H2017.
Excluding the special levy and contribution to the SRF, C/I
ratio at 43% for 9M2017, compared to 42% for 1H2017.
• Actions for focused, targeted cost containment:
Tangible savings through a targeted cost reduction
program for operating expenses
Introduction of appropriate technology/ processes to
enhance product distribution channels and reduce
operating costs
Introduction of HR policies aimed at enhancing productivity
41% 42% 42% 41%
46% 46% 45%
39% 40% 40% 39% 41% 42%
43%
1Q2016 1H2016 9M2016 FY2016 1Q2017 1H2017 9M2017
Cost to Income ratio
Cost to Income ratio excluding special levy on banks and SRF contibution
58 59 54 53 54 57 57
38 37 38 40 41 44 43
96 96 92 93 95 101 100
1Q2016 2Q2016 3Q2016 4Q2016 1Q2017 2Q2017 3Q2017
Staff costs Other operating expenses
Total expenses stable; Focus on costs containment initiatives
17
Special Levy and SRF contribution (€ mn)
4.8 4.8 5.0 5.4 5.6 5.7 5.0
6.4
(6.4)
1Q2016 2Q2016 3Q2016 4Q2016 1Q2017 2Q2017 3Q2017
Special Levy SRF contibution

49
133
156
255
192
0
127
127
127
0
153
204
191
191
191
203
224
230
234
234
234
0
97
114
€ mn 9M2017 9M2016 3Q2017 2Q2017 qoq % (9M)
yoy%
Net Interest Income 454 524 138 160 -14% -13%
Non interest income 239 193 85 77 11% 24%
Total income 693 717 223 237 -6% -3%
Total expenses (313) (299) (99) (107) -7% 5%
Profit before provisions and impairments1 380 418 124 130 -4% -9%
Loan loss provisions2 (729) (267) (73) (592) -88% 173%
Impairments of other financial and non financial
instruments (38) (34) (2) (4) -61% 11%
Provision for litigation and regulatory matters (73) 0 (38) (18) 109% -
Total Provisions and impairments (840) (301) (113) (614) -82% 180%
Share of profit from associates and joint ventures 5 3 1 2 -36% 64%
(Loss)/profit before tax and restructuring costs (455) 120 12 (482) -102% -
Tax (76) (16) (4) (66) -95% 361%
Profit/(loss) attributable to NCIs (1) (3) (0) (1) 3% -75%
(Loss)/profit after tax and before restr. costs (532) 101 8 (549) -101% -
Advisory, VEP and other restr. costs3 (21) (98) (7) (7) 7% -79%
Net gain on disposal of non-core assets - 59 - - - -
(Loss)/profit after tax (553) 62 1 (556) - -
Net interest margin 3.18% 3.51% 2.86% 3.38% -52bps -33bps
Cost-to-Income ratio 45% 42% 44% 45% -1 p.p. +3 p.p.
Cost-to-Income ratio adjusted for the special levy
and SRF contribution 43% 40% 45% 43% +2 p.p. +3 p.p.
Operating profitability of 3Q2017 directed to provisions
(1) Profit before provisions and impairments, gains/(losses) on derecognition and changes on expected cash flows , restructuring costs and discontinued operations
(2) Provisions for impairment of customer loans and gains /(losses) on derecognition of loans and changes in expected cash flows on acquired loans
(3) Advisory, VEP and other restructuring costs comprise mainly: 1) fees of external advisors in relation to: (i) disposal of operations and non-core assets (ii) customer loan restructuring activities which
are not part of the effective interest rate and (iii) the listing on the London Stock Exchange and 2) voluntary exit plan cost
Key Highlights
18
• NII and NIM for 3Q2017 amounted
to €138 mn and 2.86%
respectively, compared to €160
mn and 3.38% in 2Q2017. The
decline reflects primarily lower cash
collections of interest on delinquent
exposures not previously recognised
usually arising on the curing of
NPEs, lower volumes of loans, the
low interest rate environment and the
cost of liquidity compliance
• Expenses for 3Q17 positively
affected by the reversal of the SRF
contribution following the
amendment in legislation
• Operating profitability directed to
provisions as previously guided
• Provisions for litigation and
regulatory matters of €38 mn
primarily resulting from redress
provisions for UK operations,
following further analysis of the
customer remediation from a pilot
exercise which completed in 3Q2017
• Profit after tax of €1 mn for
3Q2017 and loss after tax of €553
mn for 9M2017

49
133
156
255
192
0
127
127
127
0
153
204
191
191
191
203
224
230
234
234
234
0
97
114
Basis for forward guidance
19
• As asset quality improves, RWA intensity expected to improve
• Positive impact on CET 1 and Total Capital Ratio
• Legacy loans are reducing
• CoR in 2018 expected to be <1%
Capital
Cost of Risk
Outlook
• Interest Income impacted by the reduction of Legacy Loans, 2018 NIM expected ~2.75%
• Short term outlook is dependent on speed of reduction of Legacy book and growth of Performing book
• Focus shifting to New Lending
• Positive contribution from REMU property sales
Revenue Outlook
• Investment in digitalisation puts pressure on costs in the near term Cost
Outlook
Reaffirming 2018 Preliminary Guidance of EPS ~c. €0.40 and CET1 > 13%

49
133
156
255
192
0
127
127
127
0
153
204
191
191
191
203
224
230
234
234
234
0
97
114
Type Key performance
indicators
Dec-
2016
Sept-
2017
Medium
Term
Targets
Preliminary 2018 EPS6 Guidance maintained
Asset
quality
90+ DPD ratio 41% 37% <20% <30%
NPEs ratio 55% 48% <30% <40%
NPEs coverage 41% 49% >50% Substantially delivered
Provisioning charge1 1.7% 4.1%2 <1.0% <1.0%
Funding Net Loans % Deposits 95% 85% 90%-110% <100%
Capital
CET1 14.5% 12.4% >13%5 >13%5
Total capital ratio 14.6% 13.8% >15%5 >15%5
Margins
and
efficiency
Net interest margin 3.5% 3.2% ~3.00% <3%; 25 bps pressure on 2018 target due to change
in balance sheet shape
Fee and commission
income/total income 17%3 19% >20%
Delivered but efforts for further improvement
continuing
Cost to income ratio 41%4 45%4 40%-45% Falling revenue puts pressure on C/I
Balance
Sheet Total assets €22.2 bn €22.9 bn >€25 bn Total assets to reach c.€24 bn by Dec 2018
EPS EPS (€ cent) 0.71 (123.92) ~€0.406
On track to deliver Group KPIs
20
(1) Provisions for impairment of customer loans and gains /(losses) on derecognition of loans and changes in expected cash flows on acquired loans over average gross loans
(2) Including impairments of other financial instruments, the provisioning charge was 1.2% and 4.1% for 3Q2017and 9M2017, respectively. Additional provisions of c.€500 mn charged in 2Q2017 are
included in Cost of Risk but are not annualised
(3) Excluding non-recurring fees of approximately €7 mn
(4) Adjusted for the special levy, and SRF contribution the cost to income ratio for 9M2017 was 43% compared to 39% for FY2016
(5) On an IFRS 9 phased-in basis (per the Proposal of the Council of the European Union) - http://data.consilium.europa.eu/doc/document/ST-13725-2017-INIT/en/pdf
(6) Excluding the impact of any unplanned or unforeseen risk reduction trades or macro events

49
133
156
255
192
0
127
127
127
0
153
204
191
191
191
203
224
230
234
234
234
0
97
114
Key takeaways
21
• Quarterly operating profit of €124 mn (€130 mn 2Q2017)
• New lending of c.€1.7 bn in 9M2017, exceeding new lending in FY2016
• NIM of 3.18% for 9M2017 but 2.86% in 3Q2017 reflecting accelerated de-risking and cost of liquidity compliance
• Cost to income ratio of 45% for 9M2017
• Deposits up by €731 mn (4%) qoq; up by €805 mn in 9M2017 facilitating liquidity ratio compliance
• Loan to deposit ratio at 85%
• Compliance with LCR and NSFR liquidity requirements4
Preliminary
2018 EPS
Guidance
maintained
• EPS of c.€0.40 maintained
• More normal credit cost (<1% in 2018) but pressure on NIM
• Accelerated de-risking puts pressure on NIM but expected to be offset by reduced provisioning
• CET 1 >13.0% and Total capital ratio >15.0%
Resilient
operating
performance
Improved funding
and liquidity
position
Capital is
sufficient
• Ten consecutive quarters of NPE reduction
• NPEs down by €588 mn qoq to €9.2 bn (down by 17% during 9M2017 and by 39% since December 2014)
• Coverage at 49%; medium term target substantially achieved; coverage now above EU average1
Continued
Progress on
‘organic’ Balance
Sheet repair
• Launching of listed Real Estate fund in Cyprus of a size of c.€190 mn
• Continue to explore other structured solutions to accelerate de-risking potentially in the near term, in one or more transactions
Acceleration
initiatives
• CET1 at 12.4% and 11.9% fully loaded; Total Capital ratio at 13.8%
• SREP 2018 CET1 ratio reduced to 9.375%2 from 9.50%; SREP 2018 total capital ratio reduced to 12.875%2 from 13.00%
• IFRS 9 estimated impact based on the 30 September 2017 Balance Sheet is a decrease in shareholders’ equity of €250 mn - €300
mn. On a transitional basis and on a fully phased in basis after the period of transition is complete, the impact of IFRS 9 is expected
to be manageable and within the Group’s capital plans3
(1) Based on EBA Risk Dashboard as at 30 June 2017
(2) Effective as from 1 January 2018.As at the date of publication of this presentation these requirements remain subject to ECB’s final confirmation, which is expected by the end of 2017
(3) With final transitional arrangements proposal applicable for year 2018
(4) As at 30 September 2017, the Bank was not in compliance with all the local regulatory liquidity requirements set by the Central Bank of Cyprus (CBC), expected to be abolished by the end of 2017. CBC is
expected to proceed in the direction of a measure in the form of a liquidity add-on that will be imposed on top of the LCR

49
133
156
255
192
0
127
127
127
0
153
204
191
191
191
203
224
230
234
234
234
0
97
114
Credit Ratings:
Standard & Poor’s Global Ratings:
Long-term issuer credit rating: Assigned at B/B on 23 October 2017 (positive outlook)
Short-term issuer credit rating: Assigned at B/B on 23 October 2017
Fitch Ratings:
Long-term Issuer Default Rating: Affirmed to “B-" on 13 April 2017 (stable outlook)
Short-term Issuer Default Rating: Affirmed to “B" on 13 April 2017
Viability Rating: Affirmed to “b-” on 13 April 2017
Moody’s Investors Service:
Baseline Credit Assessment: Upgraded to caa1 on 29 June 2017
Short-term deposit rating: Affirmed at "Not Prime" on 29 June 2017
Long-term deposit rating: Upgraded to Caa1 on 29 June 2017(positive outlook)
Counterparty Risk Assessment: Assigned at B1(cr) / Not-Prime (cr) on 29 June 2017
Listing:
LSE – BOCH, CSE – BOCH/ΤΡΚΗ, ISIN IE00BD5B1Y92
Visit our website at: www.bankofcyprus.com
Tel: +35722122239, Email: [email protected]
Annita Pavlou Investor Relations Manager, Tel: +357 22 122740, Email: [email protected]
Elena Hadjikyriacou ([email protected]) Marina Ioannou ([email protected])
Styliani Nicolaou ([email protected]) Andri Rousou ([email protected])
Investor Relations
Contacts
Finance Director Eliza Livadiotou, Tel: +35722 122344, Email: [email protected]
Key Information and Contact Details
22

49
133
156
255
192
0
127
127
127
0
153
204
191
191
191
203
224
230
234
234
234
0
97
114
Appendix – Macroeconomic overview
23

49
133
156
255
192
0
127
127
127
0
153
204
191
191
191
203
224
230
234
234
234
0
97
114
SOURCE: Statistical Service of Republic of Cyprus; Bloomberg; European Commission Winter Forecasts 2017; Ministry of Finance; Calculations by BOC Economic Research 24
GDP growth of 3.9% in 3Q2017
Cypriot economy on a sustainable growth path D
ec 1
2
Ma
r 1
3
Jun
13
Se
p 1
3
Dec 1
3
Ma
r 1
4
Jun
14
Se
p 1
4
Dec 1
4
Ma
r 1
5
Jun
15
Se
p 1
5
Dec 1
5
Ma
r 1
6
Jun
16
Se
p 1
6
Dec 1
6
Ma
r 1
7
Jun
17
Se
p 1
7
Cyprus Portgual ItalySpain Greece Ireland
Moody’s credit ratings
Credit ratings improving faster than peers…
A2
Ba3
Ba1
Baa2
Caa2
Baa2
Ba1
Ba3
B2
Caa1
Caa3
A3
C
…reflected in reduced government bond yields
Spreads (%)
Real GDP growth (%)
0
0.2
0.4
0.6
0.8
1
1.2
No
v 2
015
De
c 2
015
Ja
n 2
01
6
Feb
20
16
Mar
20
16
Apr
20
16
May 2
01
6
Ju
n 2
01
6
Ju
l 20
16
Aug
2016
Sep
2016
Oct 20
16
No
v 2
016
De
c 2
016
Ja
n 2
01
7
Feb
20
17
Mar
20
17
Apr
20
17
May 2
01
7
Ju
n 2
01
7
Ju
l 20
17
Aug
2017
Sep
2017
Oct 20
17
No
v 2
017
Cyprus Portugal Spain Italy Greece
Baa2
1.3% 0.3%
(3.2%) (6.0%)
(1.5%)
1.7% 2.8%
3.7% 3.9% 3.9% 3.4%
2010 2011 2012 2013 2014 2015 2016 1Q2017 2Q2017 3Q2017 2017E
Real GDP growth – forecast (MOF) Real GDP growth – Actual CySTAT
Unemployment rate
Falling unemployment rate
11.8%
15.9% 16.1%
14.9%
13.0%
11.5%
6.0%
8.0%
10.0%
12.0%
14.0%
16.0%
18.0%
2012 2013 2014 2015 2016 2017E
Unemployment rate (% of labour force)

49
133
156
255
192
0
127
127
127
0
153
204
191
191
191
203
224
230
234
234
234
0
97
114
2.1 2.2 2.4 2.5 2.4 2.4
2.7
3.2
3.6
0.00
0.50
1.00
1.50
2.00
2.50
3.00
3.50
4.00
2009 2010 2011 2012 2013 2014 2015 2016 2017E
25 SOURCES: Statistical Service of Republic of Cyprus, Eurostat; Calculations by BOC Economic Research
on the back of improving macro fundamentals
Economic activity has been broadly based
with main drivers tourism and construction
34.4%
31.3%
30.2%
29.5%
29.0%
25.0%
20.0%
12.5%
12.5%
Corporate tax rate (2016)
Double taxation
avoidance
treaties with
c.50 countries
Support from key business enablers
Tourism arrivals (mn)
1.5
1.9 2.1 2.0 2.1
2.4
2.7
8.0%
9.9%
11.5% 11.5% 11.9% 13.0%
14.2%
2009 2012 2013 2014 2015 2016e 2017e
€ bn % of GDP
Tourism Revenues
Construction activity - signs of recovery
0.0
0.3
1.0 1.1
0.4
0.0
(0.3)
0.6 0.5
Ag
riculture
Industr
y
Constr
uctio
n
To
ur.
& tra
de
Pro
f. &
ad
min
Info
rma
tio
n
Fin
ancia
l
Pu
bl./e
du/h
ea
lth
Oth
er
Contribution to 2017H1 Real GDP growth in
percentage points (total 3,6%)
37.4%
38.4%
24.3%
Upper secondary
Less than
Upper secondary
Tertiary
Level of education 2016, age 15-64
Cyprus has the highest number of
university graduates in the population
in the EU after the UK and Ireland
-50.0
-40.0
-30.0
-20.0
-10.0
0.0
10.0
20.0
30.0
40.0
20
04Q
4
20
05Q
2
20
05Q
4
20
06Q
2
20
06Q
4
20
07Q
2
20
07Q
4
20
08Q
2
20
08Q
4
20
09Q
2
20
09Q
4
20
10Q
2
20
10Q
4
20
11Q
2
20
11Q
4
20
12Q
2
20
12Q
4
20
13Q
2
20
13Q
4
20
14Q
2
20
14Q
4
20
15Q
2
20
15Q
4
20
16Q
2
20
16Q
4
20
17Q
2
% changes year-on-year of yearly moving averages
Production index in construction Building permits volume

49
133
156
255
192
0
127
127
127
0
153
204
191
191
191
203
224
230
234
234
234
0
97
114
Appendix – Additional asset quality slides
26

49
133
156
255
192
0
127
127
127
0
153
204
191
191
191
203
224
230
234
234
234
0
97
114
380
329
(85
)
265
410
558
96
232
156
402
609
100
64
1,3
19
1,2
40
3,3
19
1,9
72
20
(24
7)
(16
4)
386
(32
5)
136
(14
3)
(64
9)
(66
8)
(1,0
41
)
(1,0
20
)
(50
1)
(459)
(29
8)
(45
0)
(37
9)
2.0
2.3
2.2
2.5
2.9
3.5
3.6
3.8
4.0
4.4
5.0
5.1
5.1
6.5
7.7
11.0
13.0
13.0
12.8
12.6
13.0
12.7
12.8
12.6
12.0
11.3
10.3
9.3
8.8
8.3
8.0
7.6
7.2
06-2
009
09-2
009
12-2
009
03-2
010
06-2
010
09-2
010
12-2
010
03-2
011
06-2
011
09-2
011
12-2
011
03-2
012
06-2
012
09-2
012
12-2
012
06-2
013
09-2
013
12-2
013
03-2
014
06-2
014
09-2
014
12-2
014
03-2
015
06-2
015
09-2
015
12-2
015
03-2
016
06-2
016
09-2
016
12-2
016
03-2
017
06-2
017
09-2
017
Quarterly change of 90+ DPD (€ mn) 90+ DPD (€ bn)
Economic crisis
1
Slow deterioration Stabilisation Recovery
15.0 15.2 14.8 14.2 14.0 13.3 12.5 11.9 11.0 10.4 9.8 9.2
62.9% 63.0% 61.9% 62.2% 61.8% 61.0%
59.3% 57.8% 54.8%
51.8% 50.0%
47.6%
Dec 2014 Mar 2015 Jun 2015 Sep 2015 Dec 2015 Mar 2016 Jun 2016 Sep 2016 Dec 2016 Mar 2017 Jun 2017 Sep 2017
NPEs (€ bn) NPE ratio NPEs with forbearance measures no impairments, no arrears
Ten consecutive quarters of improving credit quality trends
High correlation between formation of problem loans & economic cycle
• €1.1 bn or 14%
drop in 90+DPD in
9M2017
• 90+ DPD reduced
by 43% since Dec
2014
27 (1) Information for 1Q2013 and 2Q2013 is not available as it was not possible to publish the financial results for the three months ended 31 March 2013
(2) Percentage points
NPEs down by €1.87 bn (17%) in 9M2017; down by €588 mn (6%) qoq;
39% drop since Dec 14
6% drop qoq;
• NPEs reduced by
€5.8 bn (39%)
since Dec 2014
• NPEs ratio
reduced by 15.3
p.p2 since Dec
2014
1.9 2.2
2.4
2.0 2.3
1.6 1.6
1.4

49
133
156
255
192
0
127
127
127
0
153
204
191
191
191
203
224
230
234
234
234
0
97
114
95%
83%
82
%
84%
67
%
80
%
57
%
95%
9
0%
99%
74%
68%
75%
93%
0%
20%
40%
60%
80%
100%
No arrears
1Q2014 2Q2014 3Q2014 4Q2014 1Q2015 2Q2015 3Q2015 4Q2015 1Q2016 2Q2016 3Q2016 4Q2016 1Q2017 2Q2017
88%
50%
55
%
75%
69%
67%
58%
49%
71%
68%
73%
63%
69%
70%
72%
No arrears
0.69 0.81
1.33 1.50 1.26
0.68 0.53 0.42 0.56
0.24
0.4 0.3
0.2 0.2 0.2
0.2
0.2
0.3 0.4
0.2 0.2
0.1 0.1
0.1
0.7 0.8
1.3
2.2 2.0
1.1 0.9
0.7 0.9
0.5
2Q
201
5
3Q
201
5
4Q
201
5
1Q
201
6
2Q
201
6
3Q
201
6
4Q
201
6
1Q
201
7
2Q
201
7
3Q
201
7
Restructured loans Write offs & non contractual write offs DFAs1
Quarterly evolution of restructuring activity (€ bn) (Cy operations)
(1) Restructuring activity within quarter as recorded at each quarter end and includes restructurings of 90+ DPD, NPEs, performing loans and re-restructurings
(2) Loans together with the associated provisions are written off when there is no realistic prospect of future recovery. Partial write-offs, including non-contractual write-offs, may occur when it is
considered that there is no realistic prospect for the recovery of the contractual cash flows. In addition, write-offs may reflect restructuring activity with customers and are part of the terms of the
agreement and subject to satisfactory performance
(3) Restructured loans post 31 December 2013 excluding write offs & non contractual write offs and DFAs
(4) The performance of loans restructured during 3Q2017 is not presented in this graph as it is too early to assess
Restructuring efforts continue; re-default level stable
28
2
Corporate SMEs Retail
Cohort analysis of restructured 3,4 loans; 75% of restructured loans present no arrears
51%
62%
65%
68%
63%
58
%
60%
58%
57%
52%
59
%
63
%
67%
70%
No arrears
67%
60%
73%
67%
75%
73%
66%
64%
56%
83%
77%
85%
64%
66%
71%
84%
No arrears
75%
Total Bank – Cyprus

49
133
156
255
192
0
127
127
127
0
153
204
191
191
191
203
224
230
234
234
234
0
97
114
(0.30) (0.26) (0.23)
(0.58) (0.50) (0.40) (0.29)
(0.13) (0.38)
(0.19)
(0.16) (0.11)
(0.10) (0.09)
(0.37) (0.26)
(0.25)
(0.24) (0.22)
(0.25) (0.19)
(0.08) (0.04)
(0.09)
(0.05)
(0.01)
-
(0.10)
(0.88) (0.94)
(0.76)
(1.03)
(0.84) (0.75)
(0.67)
1Q2016 2Q2016 3Q2016 4Q2016 1Q2017 2Q2017 3Q2017
-1.50
-1.30
-1.10
-0.90
-0.70
-0.50
-0.30
-0.10
0.10
0.30
0.50
Curing of restructured loans
DFAs & DFEs
Write offs and non contractual write offs
Other (Interest / Collections / Change in balances)
2.3% 2.1% 2.0% 5.5%
5.1% 4.3% 3.3%
Curing as % of NPEs
NPEs inflows (€ bn)
0.14 0.09 0,07
0.09 0.12
0.06
0.27
0.17 0.19
0.22 0.23
0.21
0.13
4.0%
2.6% 2.8% 2.9% 2.8%
2.4%
1.3%
0.0%
0.5%
1.0%
1.5%
2.0%
2.5%
3.0%
3.5%
4.0%
4.5%
1Q2016 2Q2016 3Q2016 4Q2016 1Q2017 2Q2017 3Q2017
Redefaults New inflows Inflows as % performing loans
29
2
NPE inflows reduced by c.40% qoq; NPE exits as expected (Cy)
(1) Comprises of debt for asset swaps and debt for equity swap
(2) In pipeline to exit NPEs subject to meeting all exit criteria
(3) Analysis based on account basis
• Slowing of new inflows confirm:
quality of new lending
success of prior restructurings
support by improvement of
underlying economic macro
0.1
0.3 0.3
0.2 0.1
0.1
0.3
0.2
0.8
0.4
2017 2018 2019+
Corporate SME Retail
€1.4 bn forborne NPEs with no impairments or arrears2,3
€ bn
Outflows of NPEs on curing and exits (€ bn)
1
FY2016 outflows: €3.61 bn 9M17 outflows: €2.26 bn
49
133
156
255
192
0
127
127
127
0
153
204
191
191
191
203
224
230
234
234
234
0
97
114
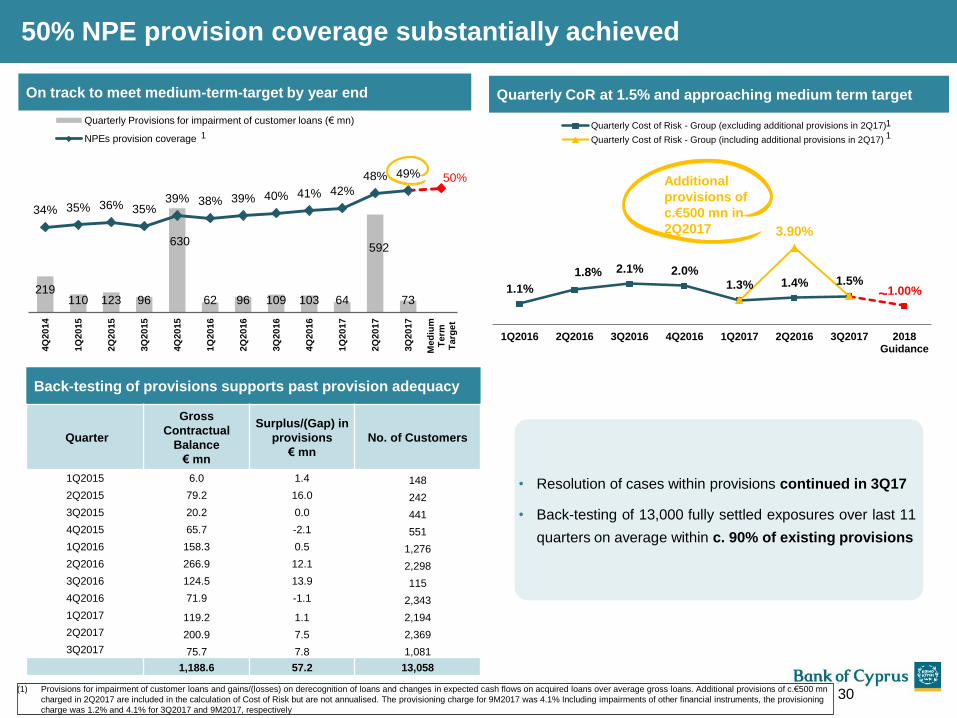
50% NPE provision coverage substantially achieved
30
Quarterly CoR at 1.5% and approaching medium term target
1.1%
1.8% 2.1% 2.0%
1.3% 1.4% 1.5% 1.00%
3.90%
1Q2016 2Q2016 3Q2016 4Q2016 1Q2017 2Q2016 3Q2017 2018Guidance
Quarterly Cost of Risk - Group (excluding additional provisions in 2Q17)
Quarterly Cost of Risk - Group (including additional provisions in 2Q17)
Additional
provisions of
c.€500 mn in
2Q2017
1
1
Back-testing of provisions supports past provision adequacy
Quarter
Gross
Contractual
Balance
€ mn
Surplus/(Gap) in
provisions
€ mn
No. of Customers
1Q2015 6.0 1.4 148
2Q2015 79.2 16.0 242
3Q2015 20.2 0.0 441
4Q2015 65.7 -2.1 551
1Q2016 158.3 0.5 1,276
2Q2016 266.9 12.1 2,298
3Q2016 124.5 13.9 115
4Q2016 71.9 -1.1 2,343
1Q2017 119.2 1.1 2,194
2Q2017 200.9 7.5 2,369
3Q2017 75.7 7.8 1,081
1,188.6 57.2 13,058
(1) Provisions for impairment of customer loans and gains/(losses) on derecognition of loans and changes in expected cash flows on acquired loans over average gross loans. Additional provisions of c.€500 mn
charged in 2Q2017 are included in the calculation of Cost of Risk but are not annualised. The provisioning charge for 9M2017 was 4.1% Including impairments of other financial instruments, the provisioning
charge was 1.2% and 4.1% for 3Q2017 and 9M2017, respectively
• Resolution of cases within provisions continued in 3Q17
• Back-testing of 13,000 fully settled exposures over last 11
quarters on average within c. 90% of existing provisions
On track to meet medium-term-target by year end
219 110 123 96
630
62 96 109 103 64
592
73
34% 35% 36% 35% 39% 38% 39% 40% 41% 42%
48% 49% 50%
0%
10%
20%
30%
40%
50%
60%
4Q
20
14
1Q
20
15
2Q
20
15
3Q
20
15
4Q
20
15
1Q
20
16
2Q
20
16
3Q
20
16
4Q
20
16
1Q
20
17
2Q
20
17
3Q
20
17
Med
ium
Term
Targ
et
Quarterly Provisions for impairment of customer loans (€ mn)
NPEs provision coverage 1
~

49
133
156
255
192
0
127
127
127
0
153
204
191
191
191
203
224
230
234
234
234
0
97
114
Terminated Retail 1.37
Retail 1.44
Terminated SMEs 1.34
SME 1.18
Terminated Corporate 1.61
Corporate 1.87
30 Sep 2017
NPEs (Cy) €8.81 bn
2.52
2.40
2.40
2.96
2.82
2.82
3.37
0.12
(0.56)
0.14
(0.55)
Sep 17
Inflows
Exits
Dec-16
Inflows
Exits
Dec 15
31
€3.48 bn
€2.52 bn
€2.81 bn
NPE ratio
3.48
4.51
6.56
0.17
(1.20)
0.37
(2.42)
Sep 17
Inflows
Exits
Dec-16
Inflows
Exits
Dec 15
46.4%
NPE ratio 45.7%
NPE ratio 66.8%
Corporate
SME
Retail
NPE provision
coverage 51.5%
55.1%
48.2% NPE provision
coverage
NPE provision
coverage
Continuous progress across all segments
2.81
3.03
3.32
0.28
(0.50)
0.35
(0.64)
Sep 17
Inflows
Exits
Dec-16
Inflows
Exits
Dec 15
NPE total
coverage 115.5%
NPE total
coverage
119.3%
NPE total
coverage 111.4%
Focus shifts to Retail and SME after intense Corporate attention
31.4%

49
133
156
255
192
0
127
127
127
0
153
204
191
191
191
203
224
230
234
234
234
0
97
114
20.66 19.98 19.27 18.77 18.27 18.06 17.69 17.41
1.21 1.17 1.18 1.23 1.30 1.44 1.43 1.51
0.72 0.70 0.63 0.60 0.56 0.51 0.38 0.33
22.59 21.85 21.08 20.60 20.13 20.01 19.50 19.25
Dec-15 Mar-16 Jun-16 Sep-16 Dec-16 Mar-17 Jun-17 Sep 17
Other countries
UK
Cyprus
1
Total
(€ bn)
Gross loans by geography
Gross loans by Geography and by Customer Type
90.4%
7.8% 1.8%
Cyprus UK Other countries1
11.42 10.77 10.13 9.78 9.47 9.35 9.14 9.04
4.68 4.65 4.55 4.47 4.35 4.29 4.15 4.03
4.31 4.28 4.27 4.24 4.22 4.19 4.15 4.12
2.18 2.16 2.13 2.11 2.09 2.19 2.06 2.06
22.59 21.85 21.08 20.60 20.13 20.01 19.50 19.25
Dec-15 Mar-16 Jun-16 Sep-16 Dec-16 Mar-17 Jun-17 Sep-17
Retail other
Retail Housing
SMEs
Corporate
(€ bn)
Total
47.0%
20.9%
21.4%
10.7%
Corporate SME
Retail Housing Retail Other
30 September 2017 (%)
30 September 2017 (%) Gross loans by customer type
32 (1) Other countries: Greece, Russia and Romania

49
133
156
255
192
0
127
127
127
0
153
204
191
191
191
203
224
230
234
234
234
0
97
114
13.26 12.64 11.87 10.50 9.89 9.35 8.81
0.07 0.06 0.05
0.02 0.02 0.02 0.02
0.64 0.63 0.57
0.51 0.46 0.38 0.33
13.97 13.33
12.49 11.03
10.37 9.75 9.16
Dec-15 Mar-16 Jun-16 Dec-16 Mar-17 Jun-17 Sep 17
Other countries
UK
Cyprus
1
Total
(€ bn)
(1) Other countries: Greece, Russia and Romania
NPEs by geography
NPEs by Geography and by Customer Type
96.1%
0.2% 3.7%
Cyprus UK Other countries1
41.6%
27.7%
17.6%
13.1%
Corporate SME
Retail Housing Retail Other
30 September 2017 (%)
30 September 2017 (%) NPEs by customer type
7.19 6.61 5.98 5.00 4.53 4.13 3.81
3.44 3.38
3.25
2.99 2.88
2.70 2.54
1.97 1.97
1.93
1.77 1.72
1.69 1.61
1.37 1.37
1.33
1.27 1.24
1.23 1.20
13.97 13.33
12.49
11.03 10.37
9.75 9.16
Dec-15 Mar-16 Jun-16 Dec-16 Mar-17 Jun-17 Sep 17
Retail Other
Retail Housing
SMEs
Corporate
Total
(€ bn)
33

49
133
156
255
192
0
127
127
127
0
153
204
191
191
191
203
224
230
234
234
234
0
97
114
NPE provision coverage increasing to 47%; Total coverage (Cy) at 115%
34
Adequate NPE total coverage when collateral is included (Cyprus operations) 45%
51%
51%
37%
46%
48%
21%
29%
31%
47%
54%
55%
39%
46%
47%
67%
63%
64%
72%
72%
71%
84%
83%
83%
52%
53%
52%
69%
68%
68%
112%
114%
115%
109%
118%
119%
105%
112%
115%
99%
106%
107%
108%
114%
115%
Dec 16 Jun-17 Sep-17 Dec 16 Jun-17 Sep-17 Dec 16 Jun-17 Sep-17 Dec 16 Jun-17 Sep-17 Dec 16 Jun-17 Sep-17
Loan loss reserves Tangible Collateral
Total BoC –Cyprus Corporate SME Retail-Housing Retail-Other
1
(1) Restricted to Gross IFRS balance

49
133
156
255
192
0
127
127
127
0
153
204
191
191
191
203
224
230
234
234
234
0
97
114
Asset Quality- 90+ DPD analysis
(€ mn) Sep-17
Jun-17 Mar-17 Dec-16 Sept-16
A. Gross Loans after Fair value on Initial recognition 18,532 18,693 19,142 19,202 19,607
Fair value on Initial recognition 721 812 869 928 989
B. Gross Loans 19,253 19,505 20,011 20,130 20,596
B1. Loans with no arrears 11,242 11,154 11,126 10,991 10,897
B2. Loans with arrears but not impaired 2,226 2,210 2,283 2,238 2,488
Up to 30 DPD 520 468 454 455 587
31-90 DPD 309 322 420 375 344
91-180 DPD 165 217 173 129 146
181-365 DPD 264 201 164 141 144
Over 1 year DPD 968 1,002 1,072 1,138 1,267
B3. Impaired Loans 5,785 6,141 6,602 6,901 7,211
With no arrears 342 409 379 472 514
Up to 30 DPD 18 15 18 62 22
31-90 DPD 25 14 50 29 52
91-180 DPD 13 51 42 50 15
181-365 DPD 97 91 82 51 106
Over 1 year DPD 5,290 5,561 6,031 6,237 6,502
(90+ DPD)1 7,182 7,561 8,011 8,309 8,768
90+ DPD ratio (90 + DPD / Gross Loans) 37.3% 38.8% 40.0% 41.3% 42.6%
Accumulated provisions (including fair value adjustment on
initial recognition2 ) 4,470 4,638 4,334 4,519 4,703
Gross loans provision coverage 23.2% 23.8% 21.7% 22.4% 22.8%
90+ DPD provision coverage 62.2% 61.3% 54.1% 54.4% 53.6%
(1) Loans in arrears for more than 90 days (90+ DPD) are defined as loans past-due for more than 90 days and those that are impaired (impaired loans are those which are not considered fully
collectable and for which a provision for impairment has been recognised on an individual basis or for which incurred losses exist at their initial recognition or customers in Debt Recovery)
(2) Including the fair value adjustment on initial recognition (difference between the outstanding contractual amount and the fair value of loans acquired from Laiki Bank) and provisions for off-balance
sheet exposures
+
+
+
+
=
35

49
133
156
255
192
0
127
127
127
0
153
204
191
191
191
203
224
230
234
234
234
0
97
114
0.68
0.60
0.34 0.36
0.22
0.11 0.13 0.14 0.14 0.14 0.18 0.20
0.14
3Q2014 4Q2014 1Q2015 2Q2015 3Q2015 4Q2015 1Q2016 2Q2016 3Q2016 4Q2016 1Q2017 2Q2017 3Q2017
Momentum continues in 90+ DPD reduction as inflows are stabilised
Additional tools resolve long outstanding loan portfolios (Cyprus operations)
36 (1) Value of on-boarded assets is set at a conservative 25%-30% discount from open
(2) Includes debt for asset swaps and debt for equity swap
Stable 90+DPD inflows in Cyprus operations (€ bn)
Average: 0.26
10.63
7.78 6.83
0.56 (1.58)
(1.09)
(0.74) 0.53 (0.71)
(0.61) (0.16)
Dec 2015 Inflows Restructurings /Collections
Write-offs Consensualforeclosures
Dec 2016 Inflows Restructurings /Collections
Write-offs Consensualforeclosures
Sep 171,2 1,2
FY2016: 90+ DPD net reduction : c.€2.8 bn 9M2017: 90+ DPD net reduction : c.€1 bn

49
133
156
255
192
0
127
127
127
0
153
204
191
191
191
203
224
230
234
234
234
0
97
114
(1) p.p. = percentage points
(2) Provisions for impairment of customer loans and gains/(losses) on derecognition of loans and changes in expected cash flows on acquired loans over 90+ DPD
(3) Restricted to Gross IFRS balance
90+ DPD provision coverage boosted to 62%; Total Coverage (Cy) at 125%
37
23 pp1 coverage ratio increase since 1Q2014; over €2.7 bn additional provisions
90+ DPD fully covered by Provisions and Tangible Collateral (Cyprus Operations)
122 169 109 219
110 123 96
630
62 96 109 103 64
592
73
39% 39% 38% 41% 42% 43%
41%
48% 49%
53% 54% 54% 54%
61% 62%
1Q2014 2Q2014 3Q2014 4Q2014 1Q2015 2Q2015 3Q2015 4Q2015 1Q2016 2Q2016 3Q2016 4Q2016 1Q2017 2Q2017 3Q2017
Quarterly Provisions for impairment of customer loans (€ mn) 90+ DPD coverage ratio2
60%
67%
67%
48%
59%
61%
35%
43%
43%
59%
63%
65%
53%
60%
61%
61%
59%
60%
67%
68%
67%
78%
79%
80%
48%
50%
49%
63%
64%
64%
121%
126%
127%
115%
127%
128%
113%
122%
123%
107%
113%
114%
116%
124%
125%
Dec-1
6
Jun
-17
Se
p-1
7
Dec-1
6
Jun
-17
Se
p-1
7
Dec-1
6
Jun
-17
Se
p-1
7
Dec-1
6
Jun
-17
Se
p-1
7
Dec-1
6
Jun
-17
Se
p-1
7
Total-LLR Total Tangible CoverageTotal
BoC – Cyprus Corporate SME Retail-Housing Retail-Other
3
49
133
156
255
192
0
127
127
127
0
153
204
191
191
191
203
224
230
234
234
234
0
97
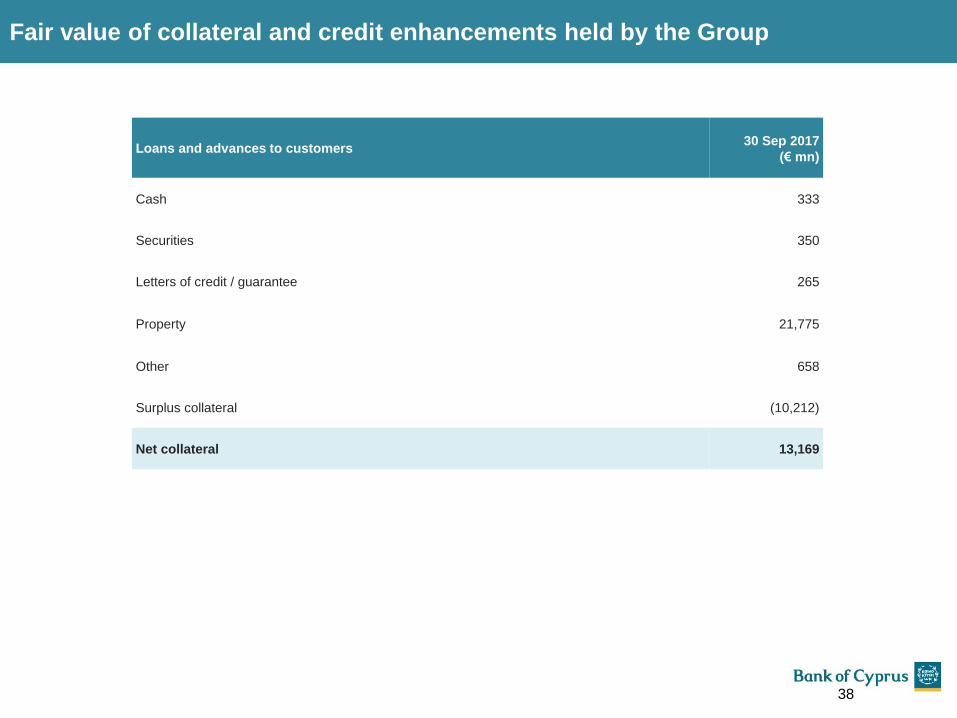
114 Loans and advances to customers
30 Sep 2017
(€ mn)
Cash 333
Securities 350
Letters of credit / guarantee 265
Property 21,775
Other 658
Surplus collateral (10,212)
Net collateral 13,169
Fair value of collateral and credit enhancements held by the Group
38

49
133
156
255
192
0
127
127
127
0
153
204
191
191
191
203
224
230
234
234
234
0
97
114
90+ DPD by Geography (€ bn) 90+ DPD ratios by Geography
9.60
8.65 8.18
7.78 7.53 7.16
6.83
0.06
0.05
0.06
0.02 0.02
0.02 0.02
0.63
0.57
0.53
0.51 0.46
0.38 0.33
10.29
9.27
8.77
8.31 8.01
7.56 7.18
Mar-16 Jun-16 Sep-16 Dec-16 Mar-17 Jun-17 Sep-17
Cyprus UK Other countries
90+ DPD by Geography and business line
48
%
45
%
44
%
43
%
42
%
40
%
39
%
5%
4%
5%
2%
1%
1%
1%
91
%
90
%
90
%
90
%
89
%
10
0%
10
0%
Mar-16 Jun-16 Sep-16 Dec-16 Mar-17 Jun-17 Sep-17
Cyprus UK Other countries1
1
39 (1) Other countries: Greece, Russia and Romania
90+ DPD by business line (€ bn)
5.33 4.49 4.16 3.85 3.61 3.24 2.98
2.79
2.65 2.49
2.36 2.27 2.14 2.01
1.11
1.09 1.09
1.08 1.11 1.15
1.16
1.07
1.04 1.03
1.02 1.02 1.03
1.03
10.29
9.27 8.77
8.31 8.01 7.56
7.18
Mar-16 Jun-16 Sept-16 Dec-16 Mar-17 Jun-17 Sep-17
Corporate SME Retail Housing Retail Other
4.71 3.94 3.64 3.37 3.17 2.87 2.66
2.72 2.59
2.44 2.32 2.24 2.11 1.98
1.11
1.09 1.09
1.08 1.10 1.15 1.16
1.06
1.03 1.01
1.01 1.02 1.03 1.03
9.60
8.65 8.18
7.78 7.53 7.16 6.83
Mar-16 Jun-16 Sept-16 Dec-16 Mar-17 Jun 17 Sep-17
Corporate SME Retail Housing Retail Other
Cyprus 90+ DPD by business line (€ bn)

49
133
156
255
192
0
127
127
127
0
153
204
191
191
191
203
224
230
234
234
234
0
97
114
90+ DPD by business line (€ bn)
0.84 0.67 0.59 0.53 0.55 0.47 0.42
0.32 0.31 0.26 0.21 0.22 0.18 0.09
0.45 0.43 0.43 0.41 0.43
0.13 0.11
0.31 0.28 0.28
0.27 0.28
0.12 0.11
1.65
1.26 1.12
1.03 0.94
0.82 0.75
0.60
0.44 0.41
0.35 0.26
0.24 0.17
0.94
0.84
0.74
0.64 0.59
0.55 0.57
0.54 0.61
2.23
2.13
2.04
1.94 1.86
1.71 1.64
2.95
2.91
2.90
2.93 2.88
2.80 2.71
10.29
9.27
8.77
8.31 8.01
7.56
7.18
Mar 16 Jun 16 Sep-16 Dec-16 Mar-17 Jun-17 Sep-17
Corporate SMEs Housing Consumer Credit
RRD-Major Corporations RRD- Corporates RRD-SMEs RRD-Retail
RRD-Terminated corporates RRD-Terminated SMEs & Retail
(1) As part of the restructuring of the Group, management is currently monitoring the loan portfolio of the Group using new business line definitions. An important component of the
Group’s new operational structure is the establishment of the RRD for the purposes of centralising and streamlining the management of its delinquent loans
(2) New business line established in April 2017. It includes Retail Housing and Retail Other
Further Analysis of 90+ DPD by Business Line1
40
2

49
133
156
255
192
0
127
127
127
0
153
204
191
191
191
203
224
230
234
234
234
0
97
114
90+ DPD ratios by business line
Gross loans by business line (€ bn)
20%
18%
12%
22%
37%
60%
70%
100%
100%
16%
18%
12%
21%
32%
50%
64%
100%
100%
14%
15%
12%
20%
37%
48%
58%
100%
100%
12%
13%
11%
20%
34%
49%
52%
100%
100%
11%
14%
12%
19%
28%
62%
50%
100%
100%
9%
12%
4%
10%
26%
55%
47%
91%
100%
100%
8%
6%
4%
10%
19%
51%
49%
91%
100%
100%
Corporate SMEs Housing Consumer Credit RRD-MidCorporates
RRD-MajorCorporations
RRD-SMEs RRD-Retail RRD-Recoveriescorporates
RRD-RecoveriesSMEs and Retail
31.03.16 30.06.16 30.09.16 31.12.16 31.03.17 30.06.17 30.09.17
4.1
5
1.7
7
3.6
2
1.4
0
1.6
2 2
.76
1.3
5 2.2
3
2.9
4 4
.10
1.7
4
3.6
1
1.3
8
1.3
7 2
.53
1.3
0 2.1
3 2.9
2
4.3
1
1.7
1
3.5
8
1.3
6
1.0
9 2
.34
1.2
6 2.0
4 2.9
1
4.4
0
1.6
2
3.5
4
1.3
4
1.0
1 2
.12
1.2
2
1.9
5 2.9
3
5.0
2
1.6
4
3.5
1
1.4
4
0.9
5
1.5
2
1.1
9
1.8
6 2
.88
5.0
2
1.5
9
3.0
9
1.1
2
0.9
2
1.5
0
1.1
5
0.5
9 1
.71 2
.81
5.0
9
1.5
1
3.0
2
1.1
2
0.8
5
1.4
6
1.1
8
0.6
7 1.6
4 2
.71
Corporate SMEs Housing Consumer Credit RRD-MidCorporates
RRD-MajorCorporations
RRD-SMEs RRD-Retail RRD-Recoveriescorporates
RRD-RecoveriesSMEs and Retail
31.03.16 30.06.16 30.09.16 31.12.16 31.03.17 30.06.17 30.09.17
% of total
(1) As part of the restructuring of the Group, management is currently monitoring the loan portfolio of the Group using new business line definitions. An important component of the
Group’s new operational structure is the establishment of the RRD for the purposes of centralising and streamlining the management of its delinquent loans
(2) New business line established in April 2017. It includes Retail housing and Retail Other
26% 8% 16% 4% 9% 6%
Analysis of Loans and 90+ DPD ratios by Business Line1
6% 8% 14%
41
3%
2
2

49
133
156
255
192
0
127
127
127
0
153
204
191
191
191
203
224
230
234
234
234
0
97
114
90+ DPD ratios by economic activity
44%
49%
38%
68%
46%
35%
54%
58%
42%
50%
34%
65%
39%
35%
49%
56%
39%
46%
34%
63%
37%
35%
46%
57%
38%
46%
32%
62%
35%
35%
45%
55%
36%
45%
32%
60%
31%
35%
45%
60%
37%
43%
29%
61%
29%
36%
43%
42%
35%
43%
27%
59%
27%
36%
41%
35%
31.03.16 30.06.16 30.09.16 31.12.16 31.03.17 30.06.17 30.09.17
Gross loans by economic activity (€ bn)
Trade Manufacturing Hotels &
Restaurants
Construction Real estate Private
Individuals Professional &
other services Other sectors
Analysis of Loans and 90+ DPD ratios by Economic Activity
42
2.2
6
0.8
2
1.4
7 3.9
2
3.3
2
7.2
5
1.6
4
1.1
7
2.2
3
0.8
0
1.4
5 3.4
3
3.3
3
7.1
7
1.5
5
1.1
2
2.1
9
0.7
1
1.4
2
3.2
2
3.3
0
7.1
1
1.4
8
1.1
7
2.1
2
0.7
0
1.4
2
2.9
7
3.3
0
7.0
3
1.5
0
1.0
9
2.1
6
0.7
0
1.4
2
2.8
8
3.3
6
7.0
9
1.4
7
0.9
3
2.1
4
0.6
9
1.5
2
2.6
1
3.2
8
6.8
8
1.3
7
1.0
1
2.1
2
0.6
8
1.4
5
2.5
0
3.2
4
6.8
3
1.3
3
1.1
0
31.03.16 31.06.16 30.09.16 31.12.16 31.03.17 30.06.17 30.09.17
Trade Manufacturing Hotels &
Restaurants Construction Real estate
Private
Individuals
Professional &
other services Other sectors
16% 11% 35% 7% 6% % of
total 15% 7% 3% 17% 11% 35% 7% 5%
% of
total 13% 8% 4%

49
133
156
255
192
0
127
127
127
0
153
204
191
191
191
203
224
230
234
234
234
0
97
114
Rescheduled loans % gross loans1 by customer type
Rescheduled Loans by customer type (€ bn)
Rescheduled Loans for the Cyprus Operations
4.3 4.0 3.8 3.4 3.2 3.2 3.0
1.7 1.8 1.7 1.7 1.6 1.6 1.6
0.6 0.6 0.6 0.6 0.6 0.5 0.6
1.7 1.7 1.7 1.7 1.7 1.6 1.5
8.3 8.1 7.8 7.4 7.1 6.9 6.7
31.03.16 30.06.16 30.09.16 31.12.16 31.03.17 30.06.17 30.09.17
Retail housing Retail consumer SMEs Corporate
(1) Before fair value adjustment on initial recognition relating to loans acquired from Laiki Bank (difference between the outstanding contractual amount and the fair value of loans
acquired) amounting to €721 mn for gross loans and to €335 mn for rescheduled loans (compared to €928 mn and €441 mn respectively at 31 December 2016), including loans of
discontinued operations/disposal group held for sale
46%
40%
40%
28%
47%
41%
41%
27%
46%
41%
42%
28%
44%
41%
40%
27%
42%
41%
39%
26%
42%
42%
38%
27%
41%
42%
37%
26%
Corporate SMES Retail housing Retail Consumer
31.03.16 30.06.16 30.09.16 31.12.16 31.03.17 30.06.17 30.09.17
Rescheduled Loans (€ bn)
7,402
6,660
316
(955)
(299) 216 (20)
RescheduledLoans
31.12.16
New loans andadvances for
the period
Assets noloanger
classified asrescheduled
Applied inwriting off
rescheduledloans andadvances
Interestaccrued onrescheduledloans andadvances
Foreignexchangeadjustment
RescheduledLoans
30.09.17
43

49
133
156
255
192
0
127
127
127
0
153
204
191
191
191
203
224
230
234
234
234
0
97
114
Rescheduled Loans – Asset Quality
44
€ ‘000 Cyprus Greece Russia
United
Kingdom Romania Total
30 September 2017
Neither past due nor impaired 3,459,877 - - 4,839 96 3,464,812
Past due but not impaired 1,335,179 - - 1,025 62 1,336,266
Impaired 1,865,243 338 77,102 1,927 39,415 1,984,025
Total 6,660,299 338 77,102 7,791 39,573 6,785,103
30 June 2017
Neither past due nor impaired 3,653,747 - - 3,885 113 3,657,745
Past due but not impaired 1,300,870 - - 1,260 60 1,302,190
Impaired 1,985,185 336 78,234 1,973 56,557 2,122,285
Total 6,939,802 336 78,234 7,118 56,730 7,082,220
31 March 207
Neither past due nor impaired 3,670,520 - - 3,830 130 3,674,480
Past due but not impaired 1,322,277 - - 950 61 1,323,288
Impaired 2,076,234 336 86,704 2,052 65,926 2,231,252
Total 7,069,031 336 86,704 6,832 66,117 7,229,020

49
133
156
255
192
0
127
127
127
0
153
204
191
191
191
203
224
230
234
234
234
0
97
114
Reconciliation of 90+ DPD to NPES Cyprus Operations (€ bn) (Sep 17)
6.5 6.8
8.8
0.3
0.9
0.6 0.2 0.2 0.1
with arrears>90+DPD
Impaired -noarrears
Total 90+ DPD with forbearancemeasure<90+
DPD
re-forborne within2 years
Forborne >30+DPD
Contagion effect Otherreclassification
adjustment
NPEs
€2.0 bn
45

49
133
156
255
192
0
127
127
127
0
153
204
191
191
191
203
224
230
234
234
234
0
97
114
Appendix – Additional financial information
46

49
133
156
255
192
0
127
127
127
0
153
204
191
191
191
203
224
230
234
234
234
0
97
114
€ mn %
change 30.09.17 31.12.16
Cash and balances with
Central Banks 82% 2,739 1,506
Loans and advances to
banks -11% 972 1,088
Debt securities, treasury bills
and equity investments 52% 1,025 674
Net loans and advances to
customers -5% 14,833 15,649
Stock of property 8% 1,548 1,427
Other assets -5% 1,736 1,828
Total assets 3% 22,853 22,172
€ mn %
change 30.09.17 31.12.16
Deposits by banks 10% 479 435
Funding from central banks -2% 830 850
Repurchase agreements 1% 259 257
Customer deposits 5% 17,315 16,510
Subordinated loan stock - 263 -
Other liabilities 9% 1,109 1,014
Total liabilities 6% 20,255 19,066
Shareholders’ equity -17% 2,562 3,071
Non controlling interests 3% 36 35
Total equity -16% 2,598 3,106
Total liabilities and equity 3% 22,853 22,172
Consolidated Balance Sheet
47

49
133
156
255
192
0
127
127
127
0
153
204
191
191
191
203
224
230
234
234
234
0
97
114
€ mn 9M2017 9M2016 3Q2017 2Q2017 qoq % (9M) yoy%
Net Interest Income 454 524 138 160 -14% -13%
Net fee and commission income 133 112 45 45 0% 19%
Insurance income net of insurance claims 39 35 14 15 5% 13%
Core income 626 671 197 220 -10% -7%
Other income 67 46 26 17 42% 45%
Total income 693 717 223 237 -6% -3%
Total expenses (313) (299) (99) (107) -7% 5%
Profit before provisions and impairments1 380 418 124 130 -4% -9%
Loan loss provisions2 (729) (267) (73) (592) -88% 173%
Impairments of other financial and non financial instruments (38) (34) (2) (4) -61% 11%
Provision for litigation and regulatory matters (73) 0 (38) (18) 109% -
Total Provisions and impairments (840) (301) (113) (614) -82% 180%
Share of profit from associates and joint ventures 5 3 1 2 -36% 64%
(Loss)/profit before tax and restructuring costs (455) 120 12 (482) -102% -
Tax (76) (16) (4) (66) -95% 361%
Profit/(loss) attributable to NCIs (1) (3) (0) (1) 3% -75%
(Loss)/profit after tax and before restr. costs (532) 101 8 (549) -101% -
Advisory, VEP and other restr. costs3 (21) (98) (7) (7) 7% -79%
Net gain on disposal of non-core assets - 59 - - - -
(Loss)/profit after tax (553) 62 1 (556) - -
Net interest margin 3.18% 3.51% 2.86% 3.38% -52bps -33bps
Cost-to-Income ratio 45% 42% 44% 45% -1 p.p. +3 p.p.
Cost-to-Income ratio adjusted for special levy and SRF contribution 43% 40% 45% 43% +2 p.p. +3 p.p.
Income Statement Review
48
(1) Profit before provisions and impairments, gains/(losses) on derecognition and changes on expected cash flows , restructuring costs and discontinued operations
(2) Provisions for impairment of customer loans and gains /(losses) on derecognition of loans and changes in expected cash flows on acquired loans
(3) Advisory, VEP and other restructuring costs comprise mainly: 1) fees of external advisors in relation to: (i) disposal of operations and non-core assets (ii) customer loan restructuring activities which
are not part of the effective interest rate and (iii) the listing on the London Stock Exchange and 2) voluntary exit plan cost

49
133
156
255
192
0
127
127
127
0
153
204
191
191
191
203
224
230
234
234
234
0
97
114
Analysis of Interest Income and Interest Expense
49
Analysis of Interest Income 1Q2016 2Q2016 3Q2016 4Q2016 1Q2017 2Q2017 3Q2017
Loans and advances to customers 231 217 203 204 195 200 180
Loans and advances to banks and central banks 1 3 4 (3) 2 1 0
Investments available-for-sale 3 2 3 3 4 5 5
Investments classified as loans and receivables 4 4 2 1 1 1 1
239 226 212 205 202 207 186
Trading Investment - - - - - - -
Derivative financial instruments 1 2 1 1 6 8 9
Other investments at fair value through profit or loss 0 0 0 0 0 0 -
Total Interest Income 240 228 213 206 208 215 195
Analysis of Interest Expense 1Q2016 2Q2016 3Q2016 4Q2016 1Q2017 2Q2017 3Q2017
Customer deposits (34) (34) (35) (35) (35) (35) (36)
Funding from central banks and deposits by banks (16) (13) (8) (4) (1) (1) (1)
Subordinated loan stock - - - - (5) (6) (6)
Repurchase agreements (1) (1) (2) (2) (2) (2) (2)
(51) (48) (45) (41) (43) (44) (45)
Derivative financial instruments (4) (4) (4) (4) (9) (11) (12)
Total Interest Expense (55) (52) (49) (45) (52) (55) (57)

49
133
156
255
192
0
127
127
127
0
153
204
191
191
191
203
224
230
234
234
234
0
97
114
37.9
%
40.4
%
41.4
%
41.1
%
39.4
%
39.1
%
38.7
%
39.5
%
28.2
%
28.2
%
29.0
%
30.3
%
31.1
%
30.8
%
31.3
%
32.3
%
Dec 2015 Mar 2016 Jun 2016 Sep 2016 Dec 2016 Mar 2017 Jun 2017 Sep 2017
Loans Deposits
Core Cypriot business
50 (1) Profit before provisions and impairments, gains/(losses) on loan derecognition and changes on expected cash flows and restructuring costs
(2) Cost to Income ratio includes the special levy and the SRF contribution and excludes the provisions for pending litigation
(3) Excluding non-recurring fees of approximately €7 mn
NIM in Cyprus operations Healthy Cost to Income ratio for Cyprus
operations
349 332 335 329 334
286
2Q16 3Q16 4Q16 1Q17 2Q17 3Q17
41% 40% 39%
44% 43% 42%
1H16 9M16 FY16 1Q17 1H17 9M17
427
657
-277
381
-439
27 36
-36 -1 -93
454
693
-313
380
-532 Net interest income Total income Total expenses Profit before
provisions andimpairments, andrestructuring costs
Loss after tax andbefore one off items
Cyprus operations Rest of operations Group
94%
% % contribution of Cyprus operations
95% 88% 100% 83%
9M2017 Cyprus Vs Group performance (€ mn)
(bps)
1
75% 70% 68% 67% 67% 61%
17% 16% 20% 19% 19%
21%
8% 14% 12% 14% 14% 18%
2Q16 3Q16 4Q16 1Q17 2Q17 3Q17
Net interest income
Fee and commission income
Other income
% of total income
Improving fee income as a % of revenues
3
2
Strong market shares maintained

49
133
156
255
192
0
127
127
127
0
153
204
191
191
191
203
224
230
234
234
234
0
97
114
€ mn Underlying basis Reclassification Statutory Basis
Net interest income 454 454
Net fee and commission income 133 133
Net foreign exchange gains and net gains on other financial instruments 32 32
Insurance income net of insurance claims 39 39
Net gains from revaluations/disposals of investment properties 22 22
Other income 13 13
Total income 693 693
Total expenses (313) (94) (407)
Profit before provisions and impairments, gains/(losses) on derecognition of loans and
changes in expected cash flows and restructuring costs 380 (94) 286
Provisions for impairment of customer loans and Gains on derecognition of loans and changes in
expected cash flows (729) (729)
Impairments of other financial and non-financial assets (38) (38)
Provision for litigation and regulatory matters (73) 73 -
Share of profit from associates 5 5
Loss before tax, restructuring costs and discontinued operations (455) (21) (476)
Tax (76) (76)
Loss attributable to non-controlling interests (1) (1)
Loss after tax and before restructuring costs, discontinued operations and net profit from
disposal of non-core assets (532) (21) (553)
Advisory and other restructuring costs1 (21) 21 -
Loss after tax (553) (553)
Income Statement bridge for 9M2017
(1) Advisory and other restructuring costs comprise mainly: 1) fees of external advisors in relation to: (i) customer loan restructuring activities which are not part of the effective interest rate and (ii) the listing on the
London stock exchange 51

49
133
156
255
192
0
127
127
127
0
153
204
191
191
191
203
224
230
234
234
234
0
97
114
€ mn Consumer
Banking
SME
Banking
Corporate
Banking
International
Banking
Wealth &
Brokerage &
Asset
Management
RRD REMU Insurance Other Total
Cyprus
Net interest income 164 39 76 51 8 106 (13) 0 (4) 427
Net fee & commission income 38 7 10 49 2 9 - (4) 17 128
Other income 2 1 0 5 2 0 25 39 29 103
Total income 204 47 86 105 12 115 12 35 42 658
Total expenses (86) (9) (9) (20) (3) (22) (6) (13) (109) (277)
Profit/(loss) before provisions
and impairments 118 38 77 85 9 93 6 22 (67) 381
Provisions for impairment of
customer loans net of
gains/(losses) on derecognition
of loans and changes in
expected cash flows
(35) (14) 1 (9) 0 (655) - - 3 (709)
Impairment of other financial
and non financial instruments - - - - - - - (0) (10) (10)
Provision for litigation and
regulatory matters - - - - - - - - (34) (34)
Share of profits from associates - - - - - - - - 5 5
Profit/(loss) before tax 83 24 78 76 9 (562) 6 22 (103) (367)
Tax (10) (3) (10) (10) (1) 72 0 (2) (107) (71)
Profit attributable to non
controlling interest - - - - - - - - (1) (1)
Profit/(loss) after tax and
before one off items 73 21 68 66 8 (490) 6 20 (211) (439)
Cyprus: Income Statement by business line for 9M2017
52

49
133
156
255
192
0
127
127
127
0
153
204
191
191
191
203
224
230
234
234
234
0
97
114
(13.6)
1.6 (2.4)
(29.6)
4Q2016 1Q2017 2Q2017 3Q2017
Loss after tax negatively
affected by legal and
regulatory redress
provision charges
0.93 1.04
1.13
1.26
1.38
1.52
Jun 2015 Dec 2015 Jun 2016 Dec 2016 Jun 2017 Sep 2017
Gross loans and customer deposits Loans by sector at 30 September 2017
0.74 0.83
0.93
1.09
1.24 1.32
Jun 2015 Dec 2015 Jun 2016 Dec 2016 Jun 2017 Sep 2017
Careful Expansion of BOC UK operations
81%
17%
1% 1%
Corporate
SMEs
Consumer credit
Housing
53
Gross loans (£ bn)
Customer deposits (£ bn)
0.2 1.8 1.8 2.2
4Q2016 1Q2017 2Q2017 3Q2017
Core operating profitability is rising
Operating profit (£ mn)
• Gross loans and customer deposits in the UK increased by 59% and 47% since Dec 15 to £1.32 bn and to £1.52 bn, respectively
• New lending of £369 mn during 9M2017
• Loss after tax of £29.6 mn for the 3Q2017, primarily relating to redress provisions for the UK operations.
• Expansion of UK operations that remains consistent with Group's overall credit appetite and regulatory environment
(Loss)/profit after tax (£ mn)

49
133
156
255
192
0
127
127
127
0
153
204
191
191
191
203
224
230
234
234
234
0
97
114
€ mn 30.09.17
Group Equity per financial statements 2,598
Less: Intangibles and other deductions (26)
Less: Deconsolidation of insurance and other entities (226)
Less: Regulatory adjustments (DTA and other items) (151)
Less: Revaluation reserves and other unrealised items transferred to
Tier II (50)
CET 1 (transitional) 2,145
Less: Adjustments to fully loaded (mainly DTA) (98)
CET 1 (fully loaded) 2,047
Risk Weighted Assets 17,273
CET 1 ratio (fully loaded) 11.9%
CET 1 ratio (transitional) 12.4%
Risk Weighted Assets – Regulatory Capital
Equity and Regulatory Capital (€ mn)
30.09.16 31.12.16 31.03.17 30.06.17 30.09.17
Shareholders’ equity 3,063 3,071 3,079 2,543 2,562
CET1 capital 2,736 2,728 2,694 2,142 2,145
Tier I capital 2,736 2,728 2,694 2,142 2,145
Tier II capital 21 21 225 248 247
Total regulatory capital
(Tier I + Tier II) 2,757 2,749 2,919 2,390 2,392
`
54 (1) The increase in Russia RWA is due to one off regulatory adjustments on operational risk in relation to disposed operations where permission to exclude it received from regulators early January 2017
(2) Other countries primarily relates to exposures in Serbia
Risk weighted assets by type of risk (€ mn)
30.09.16 31.12.16 31.03.17 30.06.17 30.09.17
Credit risk 16,747 16,862 16,785 15,474 15,379
Market risk 6 6 7 5 5
Operational risk 2,050 1,997 1,889 1,889 1,889
Total 18,803 18,865 18,681 17,368 17,273
Risk weighted assets by Geography (€ mn)
30.09.16 31.12.16 31.03.17 30.06.17 30.09.17
Cyprus 17,675 17,554 17,336 16,128 16,098
Russia 15 1451 33 32 30
United Kingdom 725 784 896 869 842
Romania 205 182 178 129 94
Greece 140 190 223 193 191
Other2 43 10 15 17 18
Total RWA 18,803 18,865 18,681 17,368 17,273
RWA intensity(%) 84% 85% 83% 79% 76%
Reconciliation of Group Equity to CET 1
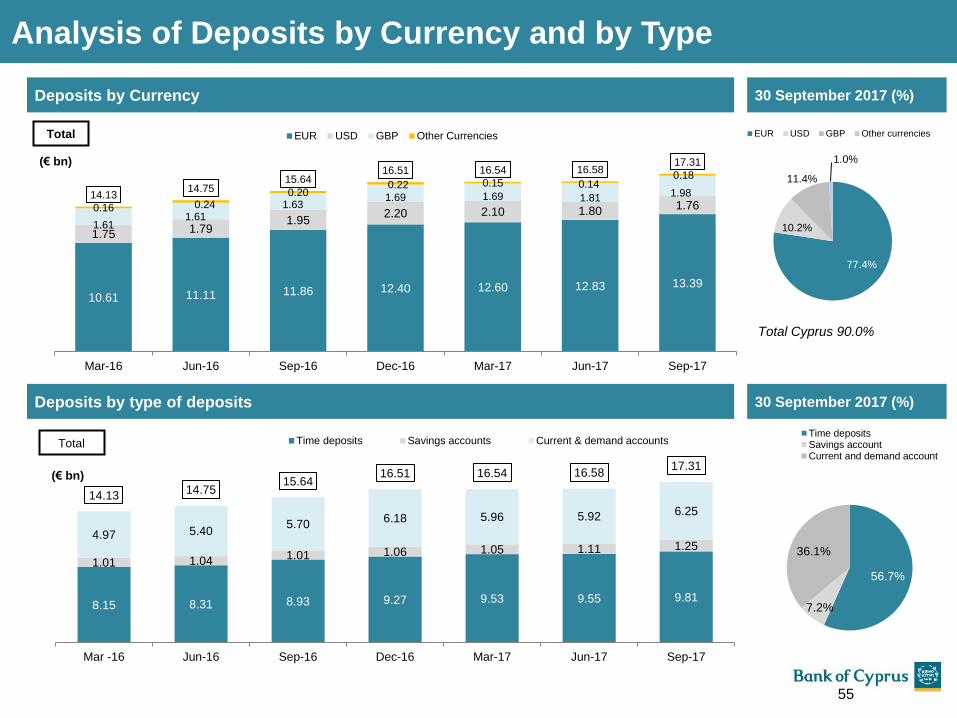
49
133
156
255
192
0
127
127
127
0
153
204
191
191
191
203
224
230
234
234
234
0
97
114 Total
(€ bn)
Deposits by Currency
Analysis of Deposits by Currency and by Type
30 September 2017 (%)
77.4%
10.2%
11.4%
1.0%
EUR USD GBP Other currencies
Total Cyprus 90.0%
8.15 8.31 8.93 9.27 9.53 9.55 9.81
1.01 1.04 1.01 1.06 1.05 1.11 1.25 4.97 5.40
5.70 6.18 5.96 5.92 6.25
14.13 14.75
15.64 16.51 16.54 16.58
17.31
Mar -16 Jun-16 Sep-16 Dec-16 Mar-17 Jun-17 Sep-17
Time deposits Savings accounts Current & demand accountsTotal
(€ bn)
Deposits by type of deposits 30 September 2017 (%)
56.7%
7.2%
36.1%
Time depositsSavings accountCurrent and demand account
55
10.61 11.11 11.86 12.40 12.60 12.83 13.39
1.75 1.79 1.95
2.20 2.10 1.80 1.76
1.61 1.61
1.63 1.69 1.69 1.81 1.98
0.16 0.24 0.20
0.22 0.15 0.14 0.18
14.13 14.75
15.64 16.51 16.54 16.58
17.31
Mar-16 Jun-16 Sep-16 Dec-16 Mar-17 Jun-17 Sep-17
EUR USD GBP Other Currencies
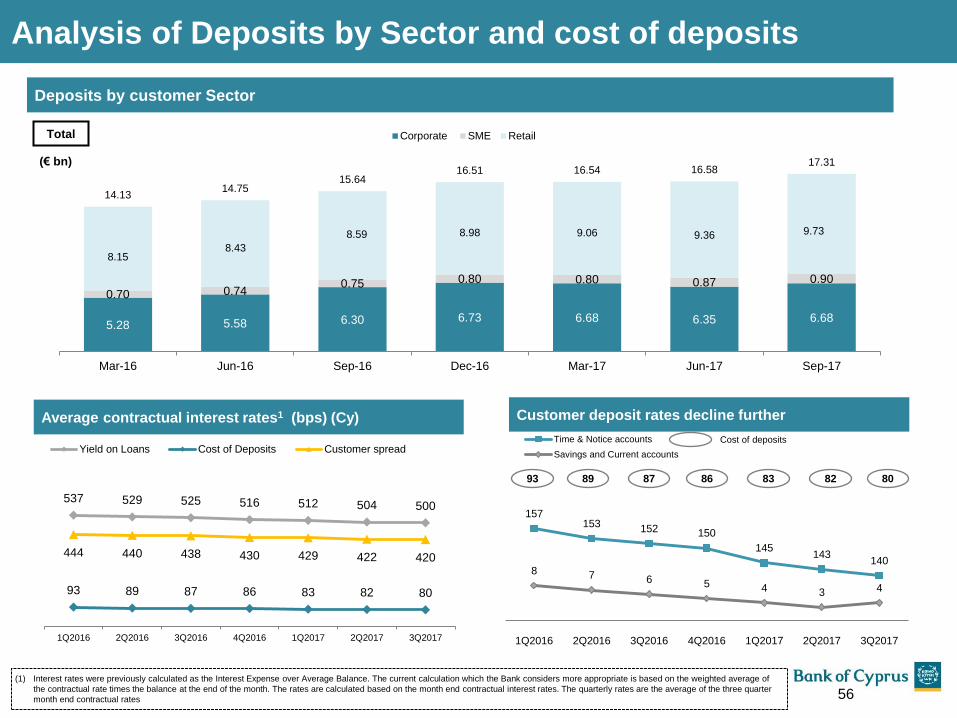
49
133
156
255
192
0
127
127
127
0
153
204
191
191
191
203
224
230
234
234
234
0
97
114 Total
(€ bn)
Deposits by customer Sector
Analysis of Deposits by Sector and cost of deposits
56
5.28 5.58 6.30 6.73 6.68 6.35 6.68
0.70 0.74 0.75 0.80 0.80 0.87 0.90
8.15 8.43
8.59 8.98 9.06 9.36 9.73
14.13 14.75
15.64 16.51 16.54 16.58
17.31
Mar-16 Jun-16 Sep-16 Dec-16 Mar-17 Jun-17 Sep-17
Corporate SME Retail
Customer deposit rates decline further
157 153 152 150
145 143
140 8 7 6 5 4 3 4
0
5
10
15
20
25
30
1Q2016 2Q2016 3Q2016 4Q2016 1Q2017 2Q2017 3Q2017
Time & Notice accounts
Savings and Current accounts
93 86 83 87 89 82 80
Cost of deposits
Average contractual interest rates1 (bps) (Cy)
537 529 525 516 512 504 500
93 89 87 86 83 82 80
444 440 438 430 429 422 420
1Q2016 2Q2016 3Q2016 4Q2016 1Q2017 2Q2017 3Q2017
Yield on Loans Cost of Deposits Customer spread
(1) Interest rates were previously calculated as the Interest Expense over Average Balance. The current calculation which the Bank considers more appropriate is based on the weighted average of
the contractual rate times the balance at the end of the month. The rates are calculated based on the month end contractual interest rates. The quarterly rates are the average of the three quarter
month end contractual rates

49
133
156
255
192
0
127
127
127
0
153
204
191
191
191
203
224
230
234
234
234
0
97
114
BOC - Main performance indicators
Ratios Group 9M2017
Performance
Net Interest Margin 3.18%
Cost to income ratio 45%
Loans to deposits 85%
Asset Quality
90+ DPD / 90+ DPD ratio €7,182 mn (37%)
90+ DPD coverage 62%
Cost of risk (annualised) 4.1%1
Provisions / Gross Loans 23.2%
Capital
Transitional Common Equity Tier 1 capital 2,145
CET1 ratio (transitional basis) 12.4%
Total Shareholders’ Equity / Total Assets 11.2%
(1) Provisions for impairment of customer loans and gains/(losses) on derecognition of loans and changes in expected cash flows on acquired loans over average gross loans. Additional provisions
of c.€500 mn charged in 2Q2017 are included in the calculation of Cost of Risk but are not annualised. The provisioning charge for 9M2017 was 4.1%. Including impairments of other financial
instruments, the provisioning charge was 1.2% and 4.1% for 3Q2017 and 9M2017, respectively 57

49
133
156
255
192
0
127
127
127
0
153
204
191
191
191
203
224
230
234
234
234
0
97
114
Reduction in Overseas Non-Core Exposures
Overseas non-core exposures1 (€ mn)
(1) Comparatives excluding core exposures
(2) Lending exposures to Greek entities in the normal course of business in Cyprus and lending exposures in Cyprus with collaterals in Greece
119
45 45 44 39 38 37
217
205 164 149
111 108 76
54
42
42 42
9 9 9
306
296
288 283
248 240
214
696
588
539 518
407 395
336
Mar 2016 Jun 2016 Sep 2016 Dec 2016 Mar 2017 Jun 2017 Sep 2017
Russia: Net exposure Romania: Net exposure
Serbia: Net exposure Greece: Net exposure
58
• In addition, at 30 September 2017, there were €169
mn of overseas exposures in Greece (€173 mn as
at 30 June 2017) not identified as non-core
exposures
• In accordance with Group’s strategy to exit from
overseas non-core operations, the operations of the
Bank of Cyprus branch in Romania are expected
to be terminated during 2017, subject to
regulatory approvals. The remaining assets and
liabilities of the branch will be transferred to
other entities of the Group.

49
133
156
255
192
0
127
127
127
0
153
204
191
191
191
203
224
230
234
234
234
0
97
114
Non-Performing Loans definition
Non-Performing Exposures (NPEs) –as per the EBA definition: In 2014 the European Banking Authority (EBA) published its reporting standards on
forbearance and non-performing exposures (NPEs). According to the EBA standards, a loan is considered a non-performing exposure if:
i. the debtor is assessed as unlikely to pay its credit obligations in full without the realisation of the collateral, regardless of the existence of any past
due amount or of the number of days past due
ii. the exposures are impaired i.e. in cases where there is a specific provision, or
iii. there are material exposures which are more than 90 days past due, or
iv. there are performing forborne exposures under probation for which additional forbearance measures are extended, or
v. there are performing forborne exposures under probation that present more than 30 days past due within the probation period.
The exit criteria of NPE forborne are the following:
1. The extension of forbearance measures does not lead to the recognition of impairment or default
2. One year has passed since the forbearance measures were extended
3. There is not, following the forbearance measures, any past due amount or concerns regarding the full repayment of the exposure according to the
post forbearance conditions.
90+DPD: Loans in arrears for more than 90 days (90+ DPD) are defined as loans past-due for more than 90 days and those that are impaired
(impaired loans are those which are not considered fully collectable and for which a provision for impairment has been recognised on an individual
basis or for which incurred losses exist at their initial recognition or customers in Debt Recovery).
59

49
133
156
255
192
0
127
127
127
0
153
204
191
191
191
203
224
230
234
234
234
0
97
114
Certain statements, beliefs and opinions in this presentation are forward-looking. Such statements can be generally identified
by the use of terms such as “believes”, “expects”, “may”, “will”, “should”, “would”, “could”, “plans”, “anticipates” and
comparable terms and the negatives of such terms. By their nature, forward-looking statements involve risks and
uncertainties and assumptions about the Group that could cause actual results and developments to differ materially from
those expressed in or implied by such forward-looking statements. These risks, uncertainties and assumptions could
adversely affect the outcome and financial effects of the plans and events described herein. We have based these forward-
looking statements on our current expectations and projections about future events. Any statements regarding past trends or
activities should not be taken as a representation that such trends or activities will continue in the future. Readers are
cautioned not to place undue reliance on forward-looking statements, which are based on facts known to and/ or assumptions
made by the Group only as of the date of this presentation. We assume no obligation to update such forward-looking
statements or to update the reasons that actual results could differ materially from those anticipated in such forward-looking
statements. This presentation does not constitute an offer to sell, or a solicitation of an offer to buy, any security in any
jurisdiction in the United States, to United States Domiciles or otherwise. Some of the information in the presentation is
derived from publicly available information from sources such as the Central Bank of Cyprus, the Statistical Services of the
Cyprus Ministry of Finance, the IMF, Bloomberg and Company Reports and the Bank makes no representation or warranty as
to the accuracy of that information. The delivery of this presentation shall under no circumstances imply that there has been
no change in the affairs of the Group or that the information set forth herein is complete or correct as of any date. This
presentation shall not be used in connection with any investment decision regarding any of our securities, which should only
be made based on expressly authorised materials from us identified as such, nor in connection with any decision whether or
how to vote on any matter submitted to our stockholders. The securities issued by Bank of Cyprus Public Company Ltd have
not been, and will not be, registered under the US Securities Act of 1933 (“the Securities Act”), or under the applicable
securities laws of Canada, Australia or Japan.
Disclaimer
60