Embed Size (px)
Citation preview

June 7, 2010 – London
Bank of America
Merrill Lynch
Telecommunications,
Media, Technology
Conference
Boudewijn BeerkensCFO and Member
of the Executive Board

June 7, 2010 – LondonTelecommunications, Media, Technology Conference 2
Forward-looking Statements
This presentation contains forward-looking statements. These statements may be
identified by words such as "expect", "should", "could", "shall", and similar
expressions. Wolters Kluwer cautions that such forward-looking statements are
qualified by certain risks and uncertainties, that could cause actual results and
events to differ materially from what is contemplated by the forward-looking
statements. Factors which could cause actual results to differ from these forward-
looking statements may include, without limitation, general economic conditions,
conditions in the markets in which Wolters Kluwer is engaged, behavior of
customers, suppliers and competitors, technological developments, the
implementation and execution of new ICT systems or outsourcing, legal, tax, and
regulatory rules affecting Wolters Kluwer's businesses, as well as risks related to
mergers, acquisitions and divestments. In addition, financial risks, such as currency
movements, interest rate fluctuations, liquidity and credit risks could influence
future results. The foregoing list of factors should not be construed as exhaustive.
Wolters Kluwer disclaims any intention or obligation to publicly update or revise any
forward-looking statements, whether as a result of new information, future events
or otherwise.
3
The Professional’s First Choice
Provide information, tools, and
solutions to help professionals
deliver quality results more efficiently
Market-leading global information services company
Leading positions in core markets: health, tax, accounting, corporate
services, financial services, law and regulation
Euronext listed (AEX index)
Market capitalization €4.4 billion (US $6.1 billion)
2009 Revenues of €3.4 billion (US $4.8 billion)
Approximately 19,300 employees
In more than 40 countries across 5 continents
Telecommunications, Media, Technology Conference June 7, 2010 – London

4
Portfolio EvolutionOur portfolio has shifted towards subscription products which
provide greater value
Books 23%
Cyclical 15%
2004 Revenue: €3.0 billion
Books 10%
Cyclical 19%
2009 Revenue: €3.4 billion
Subscription
& Other Non-
Cyclical
62%
Subscription
& Other Non-
Cyclical
71%
Note: Cyclical products include advertising, pharma promotion, mortgage transactions, M&A/IPO/UCC transactions, training and consulting
Telecommunications, Media, Technology Conference June 7, 2010 – London

5
2003 2004 2005 2006 2007 2008 2009
Increased Investment
Average: 8-10%
of Revenue
Consistent Investments across all Markets
Health
Tax & Accounting
Legal & Regulatory
Financial Services
Significant New
Products/Platforms
ProSystem fx® TaxComplete, digital tax preparation.
Telecommunications, Media, Technology Conference June 7, 2010 – London
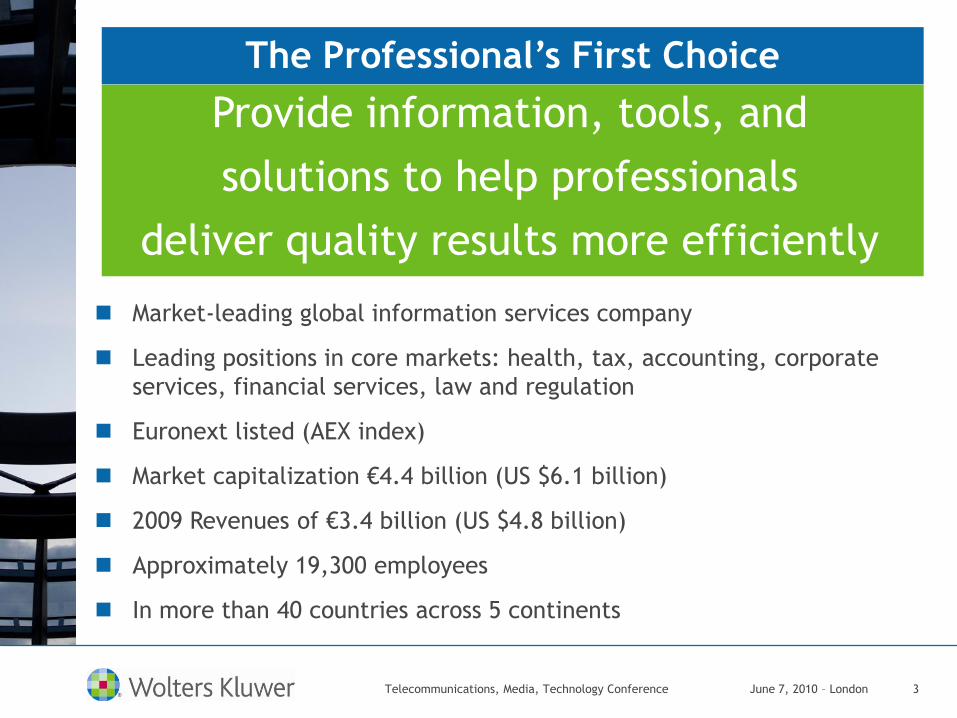
Selective acquisitions support our growth and
transformation
Acquisitions EPS1 ROIC2
2005
DeAgostini, Nolis, Osra, Eon,
Best Case, Tripoint, Entyre,
Amerisearch, Boucher
2
20063
NDC, Heymanns, ProVation,
Sage, ATX, Kleinrock, UTS,
TaxWise
6
2007MCFR, TeamMate, GEE, AppOne,
Europea del Derecho 2
2008MYOB, Addison, UpToDate,
IntelliTax 2
1 EPS accretive in year 1 for all acquisitions
2Year ROIC exceeds weighted average cost of capital
3Includes impaired assets. Excluding impaired assets ROIC > WACC in 3 years.
Telecommunications, Media, Technology Conference June 7, 2010 – London

7
Portfolio Evolution Portfolio shift reflecting the evolution to an information, software
and service provider
31%
38%42%
46% 47%49%
52%
2003 2004 2005 2006 2007 2008 2009
Software & Online Revenue as a % of Total Revenue
9%
CAGR
Telecommunications, Media, Technology Conference June 7, 2010 – London

June 7, 2010 – London Telecommunications, Media, Technology Conference 8
ImplicationMega Trend
Mega Trends and Implications Mega trends encourage our shift to information-enabled solutions
which deliver results
Growing global convergence
of professional standards
and compliance processes
Proliferation of information
and increased compliance
Customer business models
changing with strong focus
on productivity and profits
Shortage of professionals
Information quality and knowledge of regulatory
changes are key points of differentiation
Increase focus on information-enabled solutions and
process management which improve professionals’
expertise, lower costs and increase productivity
Providers with global product lines will be
advantaged

9
2010-2012Strategy
Raise
Innovation
and Effectiveness
Through Global Capabilities
Deliver
Value at the
Point-of-Use
Maximizing Value for Customers
Expand Solutions Across
Processes, Customers
and Networks
Telecommunications, Media, Technology Conference June 7, 2010 – London

10
Strategic Focus: Produce Results for Customers Through
Superior Information and Intelligent Solutions
High Quality,
Proprietary
Information
Telecommunications, Media, Technology Conference June 7, 2010 – London
11
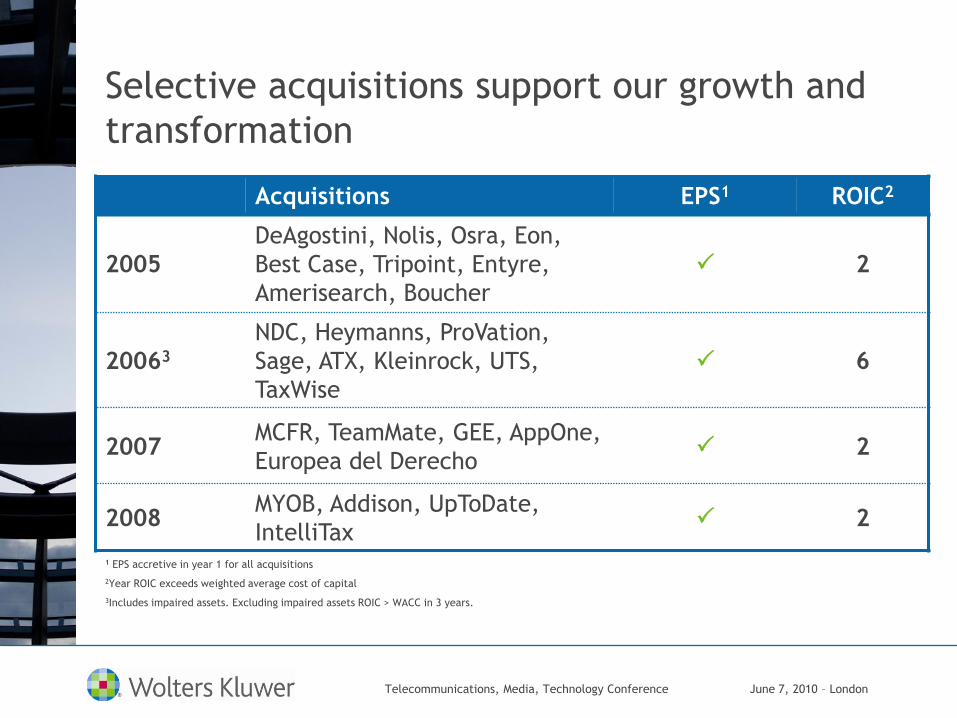
Deliver value at the point of use
Focuses on delivering
a successful outcome
(passing an exam)
rather than delivering
data
Provides Answers at
point of need
(whenever I need to
study)
Mobility and increases
availability driving
usage and value (on
―the‖ device I take
everywhere)
Always on the
device I carry
Practice exams
with instant results
Interactive content
improving
performance
Telecommunications, Media, Technology Conference June 7, 2010 – London

12
Expand solutions across customers,
processes and networks
Mortgage Transaction Lifecycle
Sales & Customer
AssessmentContract
E-delivery
Client Banker
Financial
Institution
External Investor
Compliant
Binding
Contract
Contract
StorageMonitoring and
Detection
E-signature
Mortgage
Application
Asset
Verification
Pre-closing
– document
generation
Closing –
E-close and
E-signature
Servicing-
E-folder
E-Record
Investor
Delivery
Fraud and
Compliance
Monitoring
Processing
-analysisCustomer
Assessment
Telecommunications, Media, Technology Conference June 7, 2010 – London

13
Raise effectiveness through global
back office efficiencies
Infrastructure Delivery Network (IDN) Consolidated and virtualized regional datacenters
to support global lines of business
Services Delivery Network (SDN) Rationalized local support functions into global
back office
Global Shared
Services
Account
Management
QA/Other
Infrastructure
Application
Development
Application
Support
Finance &
Accounting
Telecommunications, Media, Technology Conference June 7, 2010 – London

14
Strategy will deliver greater value
Key Performance
IndicatorsMedium-Term
Revenue Growth/
Portfolio Composition
Double-digit online & software growth
Online, software & services revenue 75%
of total revenues
Ordinary EBITA Continuous improvement
Free cash flow1 ≥ €400 million per annum
Diluted ordinary EPS1 Continuous improvement
Return on invested capital ≥ 8%
¹At constant currencies (EUR/USD = 1.39)
Telecommunications, Media, Technology Conference June 7, 2010 – London
15
2010 Outlook
Beginning to see market conditions stabilize
Slow but steady economic recovery through 2010
North American business units expected to recover ahead of European
Recurring revenues: resilient retention rates partially offset by weaker
2009 new sales
Cyclical revenues: expected to stabilize, other than advertising
Books revenues: will show continued stability
Electronic revenues: expected to continue to show good growth
Springboard program: will continue to deliver margin support
Guidance Reiterated (Trading Update May 12, 2010)
Telecommunications, Media, Technology Conference June 7, 2010 – London
16
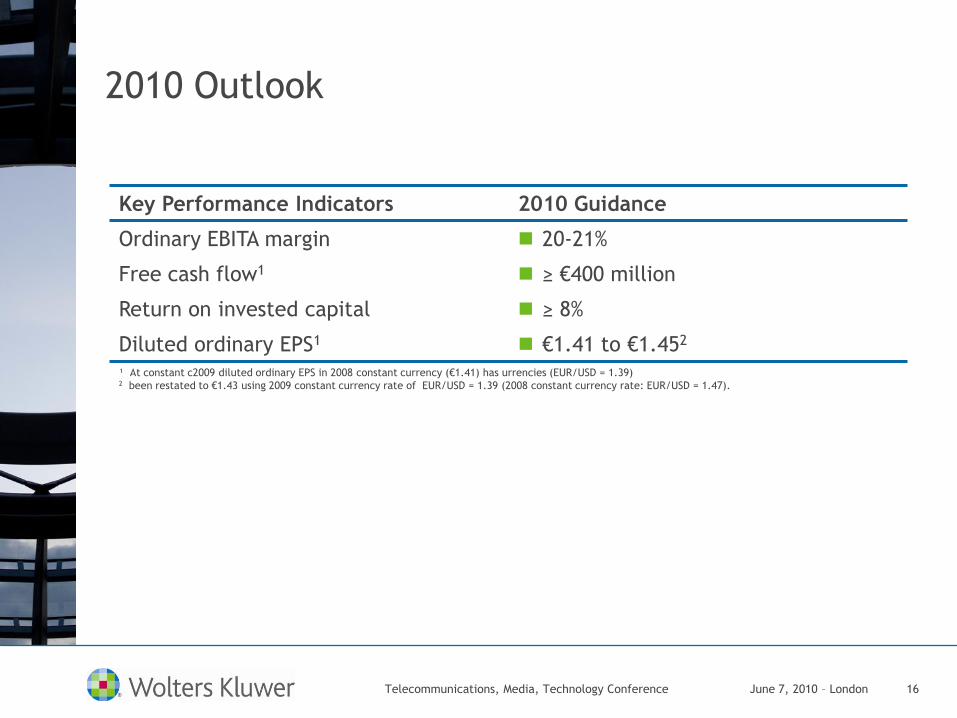
2010 Outlook
Key Performance Indicators 2010 Guidance
Ordinary EBITA margin 20-21%
Free cash flow1 ≥ €400 million
Return on invested capital ≥ 8%
Diluted ordinary EPS1 €1.41 to €1.452
¹ At constant c2009 diluted ordinary EPS in 2008 constant currency (€1.41) has urrencies (EUR/USD = 1.39)2 been restated to €1.43 using 2009 constant currency rate of EUR/USD = 1.39 (2008 constant currency rate: EUR/USD = 1.47).
Telecommunications, Media, Technology Conference June 7, 2010 – London

17
Consistent Delivery of Key Performance Indicators
Ordinary EBITA (Million) Free Cash Flow (Million)
Revenue (Billion)
7.5% 7.7%
9.1% 9.1%
8.5%
2005 2006 2007 2008 2009
Return on Invested Capital1
1Restated
Telecommunications, Media, Technology Conference June 7, 2010 – London
€ 3.07 € 3.38 € 3.41 € 3.37 € 3.43
2005 2006 2007 2008 2009
€ 311
€ 399 € 405 € 395 € 424
2005 2006 2007 2008 2009
€ 474 € 556
€ 667 € 678 € 682
2005 2006 2007 2008 2009

Bank of America
Merrill Lynch
Telecommunications,
Media, Technology
Conference 2010
Q&A

19
2009: Achieved All Key Performance Indicators
Key Performance Indicators Target
Ordinary EBITA margin (%) ±20%
Diluted ordinary EPS (€)1 1.41-1.46
Free cash flow (€ millions)1 ±350
Return on invested capital ≥8%
∆ - % Change; ∆ CC - % Change constant currency (EUR/USD 1.47); ∆ OG – % Organic growth1At constant currencies (EUR/USD = 1.47)
Actual
20%
1.41
404
8.5%
Achieved
Telecommunications, Media, Technology Conference June 7, 2010 – London

20
Revenues: Full-Year 2009
Subscription & other
recurring71%
Books10%
CFS transactions
5%
Advertising3%
Pharma promomotion
3%
Training/ Consulting
4%
Other cyclical4%
(€ million)2009 2008 ∆ ∆ CC ∆ OG
Electronic & service
subscription1,588 1,430 11% 9% 3%
Print subscription 563 606 (7%) (7%) (7%)
Other non-cyclical 293 277 6% 5% (3%)
Recurring revenues 2,444 2,313 6% 4% 0%
Books 331 341 (3%) (4%) (4%)
Cyclical products 650 720 (11%) (11%) (11%)
Total revenues 3,425 3,374 2% 0% (3%)
∆-% Change; ∆CC-% Change constant currency (EUR/USD 1.47); ∆OG–% Organic growth
Resilient performance for
subscription portfolio despite
cautious new sales environment
Overall 8% growth in electronic
revenues with 3% organic growth
in electronic product and
services subscription revenues,
driven by customers demand for
online and intelligent solutions.
Cyclical product revenues
pressured by economic cycle;
negative trends eased in the
second half
Books revenues off 4% due
largely to soft demand across all
markets
Telecommunications, Media, Technology Conference June 7, 2010 – London
21
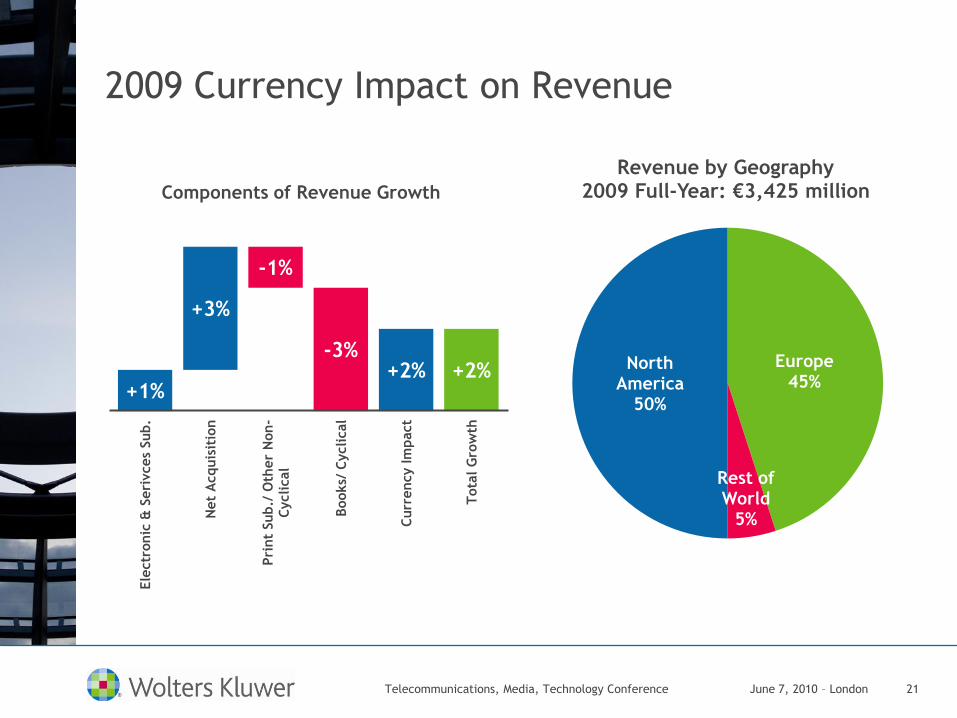
2009 Currency Impact on Revenue
+1%
+3%
-1%
-3%+2% +2%
Ele
ctr
onic
& S
eri
vces
Sub.
Net
Acquis
itio
n
Pri
nt
Sub./
Oth
er
Non-
Cyclical
Books/
Cyclical
Curr
ency Im
pact
Tota
l G
row
th
Components of Revenue Growth
North America
50%
Europe45%
Rest of World
5%
Revenue by Geography 2009 Full-Year: €3,425 million
Telecommunications, Media, Technology Conference June 7, 2010 – London

22
2009 Division Highlights
Health22%
Corporate & Financial
Services14%Tax,
Accounting & Legal26%
Legal, Tax & Regulatory
Europe38%
2009 Full-Year Revenue€3,425 million
Health16%
Corporate & Financial Services
17%
Tax, Accounting &
Legal32%
Legal, Tax & Regulatory
Europe35%
2009 Full-Year Ordinary EBITA €682 million
Year-ended December 31st Revenue Ordinary EBITA %
€ millions 2009 2008 ∆ ∆ CC ∆ OG 2009 2008
Health & Pharma Solutions 750 687 9% 6% (1%) 14.9% 12.5%
Corporate & Financial Services 492 480 3% (3%) (3%) 25.0% 27.6%
Tax, Accounting & Legal 899 879 2% 1% (3%) 25.9% 25.4%
Legal, Tax & Regulatory Europe 1,284 1,328 (3%) (2%) (4%) 19.8% 20.6%
Wolters Kluwer 3,425 3,374 2% 0% (3%) 19.9% 20.1%
∆ - % Change; ∆ CC - % Change constant currency (EUR/USD 1.47); ∆ OG – % Organic growth
Telecommunications, Media, Technology Conference June 7, 2010 – London

23
Health & Pharma Solutions: Revenue
€ million 2009 2008 ∆ ∆ CC ∆ OG
Electronic & service subscription 335 265 26% 23% 4%
Print subscription 86 84 2% (1%) (1%)
Other non-cyclical 41 42 (2%) (4%) (4%)
Recurring revenues 462 391 18% 15% 2%
Books 129 131 (1%) (4%) (4%)
Cyclical product lines 159 165 (3%) (6%) (6%)
Total revenues750 687 9% 6%
(1%)
Ordinary EBITA 112 86 31% 34% 16%
Ordinary EBITA margin 14.9% 12.5%
∆-% Change; ∆CC-% Change constant currency (EUR/USD 1.47); ∆OG–% Organic growth
Online47%
Software5%
Print43%
Services5%
Media Format
46%
52%
2008 2009
Electronic as a % of Total Revenue
Subscription & Other
recurring62%
Books17% Advertising
5%
Pharma Promo14%
Other Cyclical
2%
Product Type
Pharma Solutions
24%
Medical Research
20%
Professional & Education
38%
Clinical Solutions
18%
Business Units
Telecommunications, Media, Technology Conference June 7, 2010 – London
24
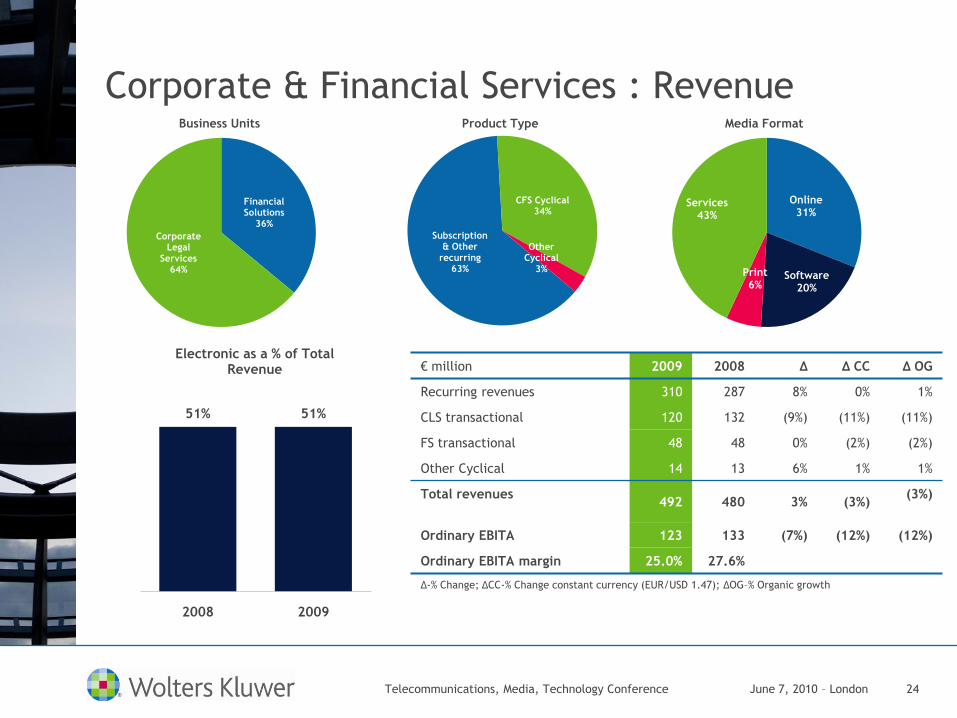
Corporate & Financial Services : Revenue
€ million 2009 2008 ∆ ∆ CC ∆ OG
Recurring revenues 310 287 8% 0% 1%
CLS transactional 120 132 (9%) (11%) (11%)
FS transactional 48 48 0% (2%) (2%)
Other Cyclical 14 13 6% 1% 1%
Total revenues492 480 3% (3%)
(3%)
Ordinary EBITA 123 133 (7%) (12%) (12%)
Ordinary EBITA margin 25.0% 27.6%
∆-% Change; ∆CC-% Change constant currency (EUR/USD 1.47); ∆OG–% Organic growth
Online31%
Software20%
Print6%
Services43%
Media Format
51% 51%
2008 2009
Electronic as a % of Total Revenue
Subscription & Other
recurring63%
CFS Cyclical34%
Other Cyclical
3%
Product Type
Financial Solutions
36%
Corporate Legal
Services64%
Business Units
Telecommunications, Media, Technology Conference June 7, 2010 – London

25
Tax, Accounting & Legal: Revenue
€ million 2009 2008 ∆ ∆ CC ∆ OG
Electronic & service subscription 418 391 7% 5% 4%
Print subscription 107 119 (10%) (12%) (12%)
Other non-cyclical 144 127 14% 12% (5%)
Recurring revenues 669 637 5% 3% (1%)
Books 87 89 (3%) (4%) (4%)
Cyclical product lines 143 153 (7%) (8%) (8%)
Total revenues899 879 2% 1% (3%)
Ordinary EBITA 233 223 4% 1% (4%)
Ordinary EBITA margin 25.9% 25.4%
∆-% Change; ∆CC-% Change constant currency (EUR/USD 1.47); ∆OG–% Organic growth
Online28%
Software27%
Print29%
Services16%
Media Format
54%
55%
2008 2009
Electronic as a % of Total Revenue
Subscription & Other
recurring74%
Books10%
Other Cyclical
16%
Product Type
Law & Business
36%
Tax and Accounting
64%
Business Units
Telecommunications, Media, Technology Conference June 7, 2010 – London
26
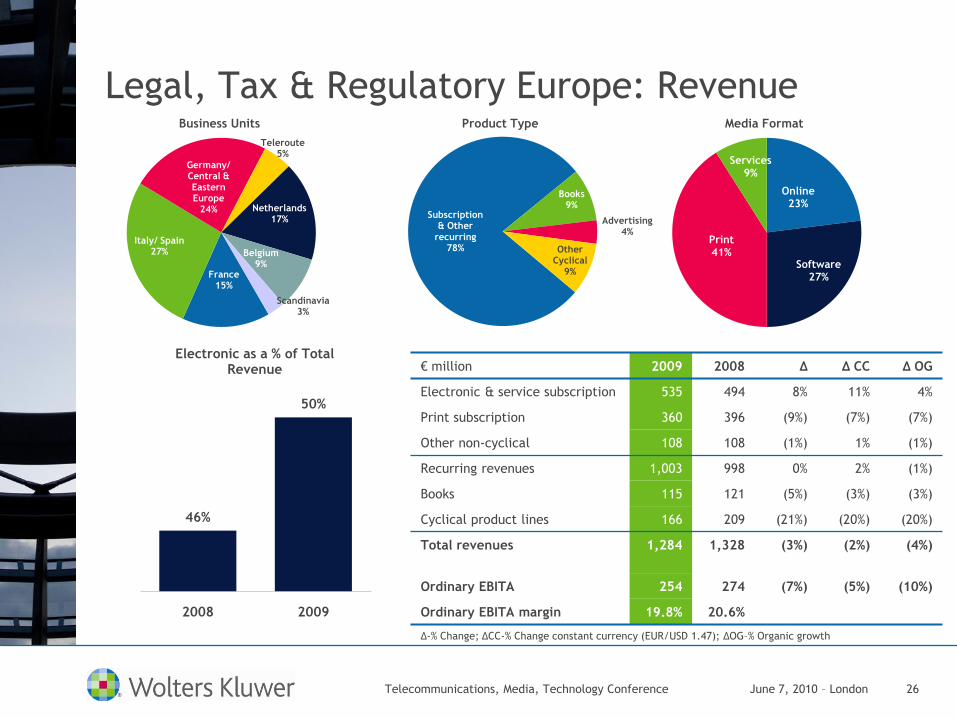
Legal, Tax & Regulatory Europe: Revenue
€ million 2009 2008 ∆ ∆ CC ∆ OG
Electronic & service subscription 535 494 8% 11% 4%
Print subscription 360 396 (9%) (7%) (7%)
Other non-cyclical 108 108 (1%) 1% (1%)
Recurring revenues 1,003 998 0% 2% (1%)
Books 115 121 (5%) (3%) (3%)
Cyclical product lines 166 209 (21%) (20%) (20%)
Total revenues 1,284 1,328 (3%) (2%) (4%)
Ordinary EBITA 254 274 (7%) (5%) (10%)
Ordinary EBITA margin 19.8% 20.6%
∆-% Change; ∆CC-% Change constant currency (EUR/USD 1.47); ∆OG–% Organic growth
Online23%
Software27%
Print41%
Services9%
Media Format
46%
50%
2008 2009
Electronic as a % of Total Revenue
Subscription & Other
recurring78%
Books9%
Advertising4%
Other Cyclical
9%
Product Type
France15%
Italy/ Spain27%
Germany/ Central & Eastern Europe
24%
Teleroute5%
Netherlands17%
Belgium9%
Scandinavia3%
Business Units
Telecommunications, Media, Technology Conference June 7, 2010 – London
27
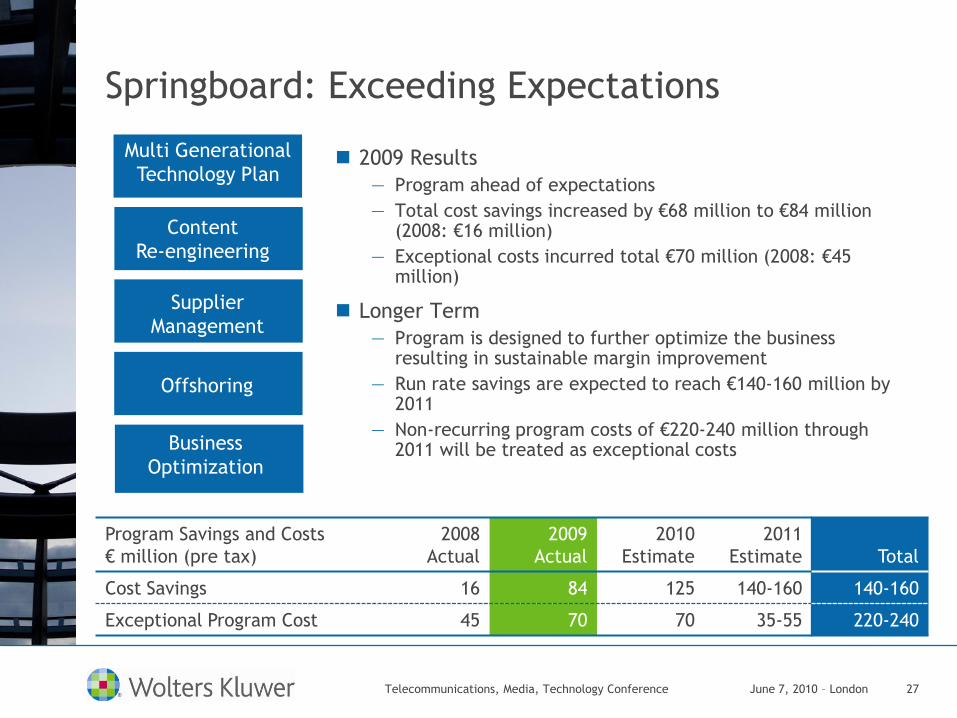
Springboard: Exceeding Expectations
2009 Results
— Program ahead of expectations
— Total cost savings increased by €68 million to €84 million (2008: €16 million)
— Exceptional costs incurred total €70 million (2008: €45 million)
Longer Term
— Program is designed to further optimize the business resulting in sustainable margin improvement
— Run rate savings are expected to reach €140-160 million by 2011
— Non-recurring program costs of €220-240 million through 2011 will be treated as exceptional costs
Multi Generational
Technology Plan
Content
Re-engineering
Supplier
Management
Offshoring
Business
Optimization
Program Savings and Costs
€ million (pre tax)
2008
Actual
2009
Actual
2010
Estimate
2011
Estimate Total
Cost Savings 16 84 125 140-160 140-160
Exceptional Program Cost 45 70 70 35-55 220-240
Telecommunications, Media, Technology Conference June 7, 2010 – London

28
Functional Costs
22.4%
21.4%
20.5% 20.5%
2006 2007 2008 2009
18.4% 18.5% 18.9%18.3%
2006 2007 2008 2009
37.3%
36.2%35.6% 35.8%
2006 2007 2008 2009
Cost of Revenues(as a % of revenue)
Marketing & Sales(as a % of revenue)
5.2%
4.3%4.9%
5.5%
2006 2007 2008 2009
Publishing & Editorial(as a % of revenue)
General & Administrative1
(as a % of revenue)
1Excluding exceptional items
Telecommunications, Media, Technology Conference June 7, 2010 – London
29
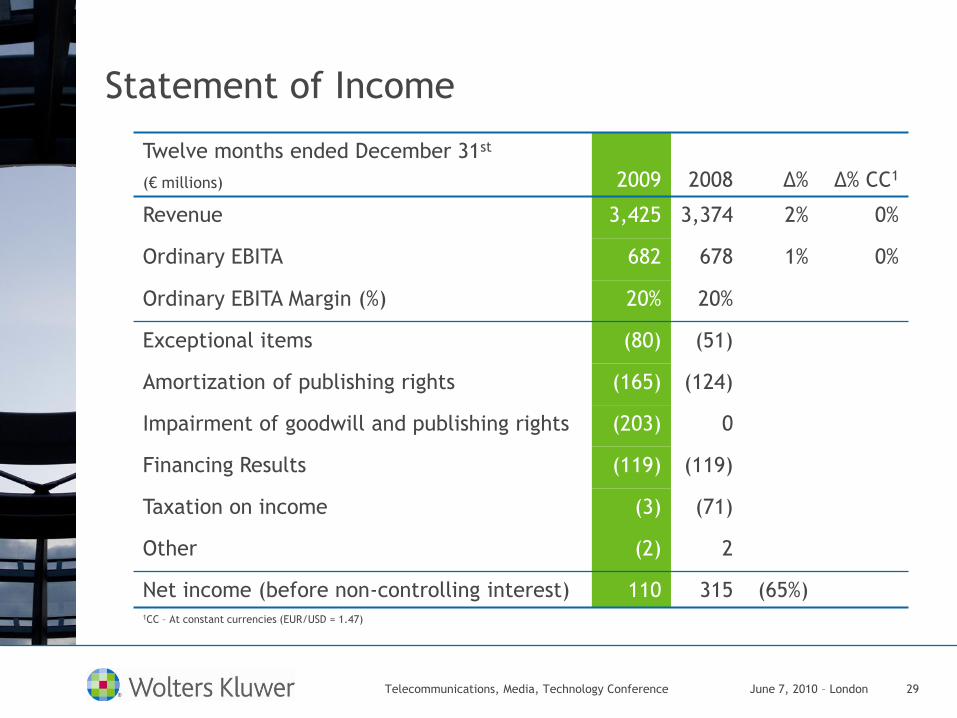
Statement of Income
Twelve months ended December 31st
(€ millions) 2009 2008 ∆% ∆% CC1
Revenue 3,425 3,374 2% 0%
Ordinary EBITA 682 678 1% 0%
Ordinary EBITA Margin (%) 20% 20%
Exceptional items (80) (51)
Amortization of publishing rights (165) (124)
Impairment of goodwill and publishing rights (203) 0
Financing Results (119) (119)
Taxation on income (3) (71)
Other (2) 2
Net income (before non-controlling interest) 110 315 (65%)1CC – At constant currencies (EUR/USD = 1.47)
Telecommunications, Media, Technology Conference June 7, 2010 – London

30
Reconciliation Ordinary Net Income/ EPS
Twelve months ended December 31st
(€ millions) 2009 2008
Net Income 110 315
Non-Controlling Interests 8 (2)
Net Income to Owners of the Company 118 313
Amortization of Publishing Rights2 164 124
Impairment of Publishing Rights and Goodwill2 194 0
Taxation on Amortization and Impairments2 (93) (50)
Results on Disposals (after taxation) (8) 2
Exceptional Items (after taxation) 52 34
Ordinary Net Income 427 423
Diluted Weighted Average # Shares 294 million 288 million
Diluted ordinary EPS €1.45 €1.47
Diluted ordinary EPS (constant currencies)1 €1.41 €1.43¹ CC – At constant currencies (EUR/USD = 1.47) 2Adjusted for non-controlling interests
Telecommunications, Media, Technology Conference June 7, 2010 – London
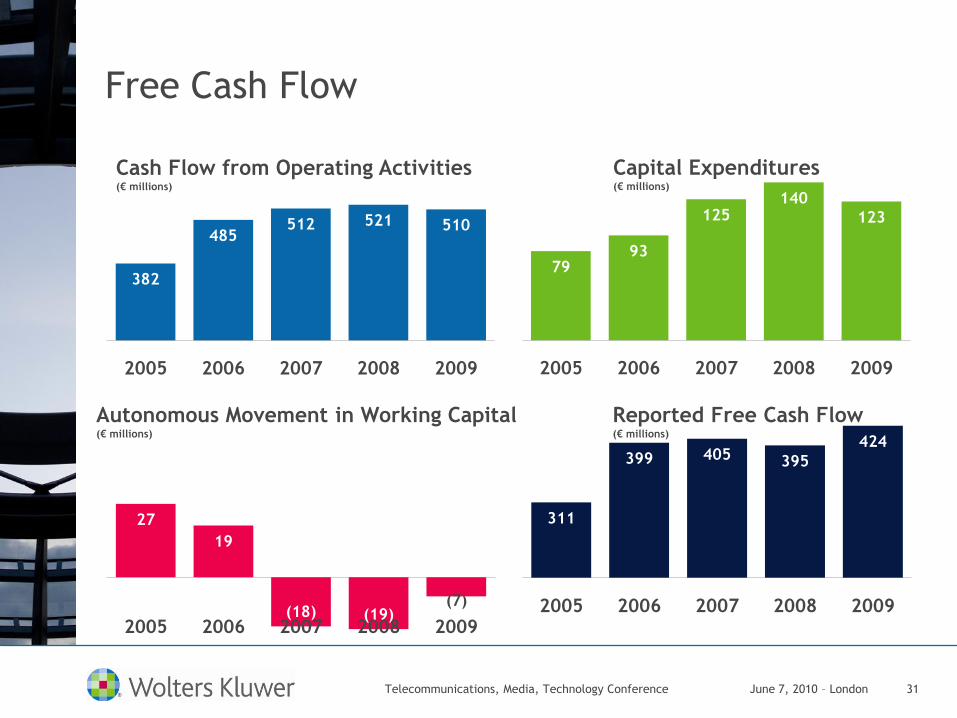
31
311
399 405 395
424
2005 2006 2007 2008 2009
Free Cash Flow
27
19
(18) (19)(7)
2005 2006 2007 2008 2009
7993
125140
123
2005 2006 2007 2008 2009
382
485512 521 510
2005 2006 2007 2008 2009
Cash Flow from Operating Activities(€ millions)
Capital Expenditures(€ millions)
Reported Free Cash Flow(€ millions)
Autonomous Movement in Working Capital(€ millions)
Telecommunications, Media, Technology Conference June 7, 2010 – London

32
Free Cash FlowTwelve months ended December 31st
(€ millions) 2009 2008 ∆%
∆%
CC1
Ordinary EBITA 682 678 1% 0%
Depreciation 101 78
Aut. Movements in Working Capital (7) (19)
Financing Charges (120) (94)
Paid Corporate Income Tax (89) (91)
Appropriation of Provisions (70) (36)
Other 13 5
Cash Flow from Operating Activities 510 521 (2%) (7%)
Net Capital Expenditure (123) (140) (12%) (16%)
Dividends Received 1 1
Appropriation of Springboard Provisions
(after tax)
36 13
Free Cash Flow 424 395 7% 2%
Cash Conversion 96% 88%
¹ CC – At constant currencies (EUR/USD = 1.47)
Telecommunications, Media, Technology Conference June 7, 2010 – London

33
Solid Financial Position
3.03.2
2.4
3.2
2.9
2005 2006 2007 2008 2009
Net-Debt/EBITDA
426
26 11 2
697
1,155
Cash &
2010 2011 2012 2013 2014 Due
€m
illions
Debt Maturity Profile
12010: Outstanding part of redemption on credit
facility maturing in July 2011
DerivativesAfter
2014
4981
542
Telecommunications, Media, Technology Conference June 7, 2010 – London
34
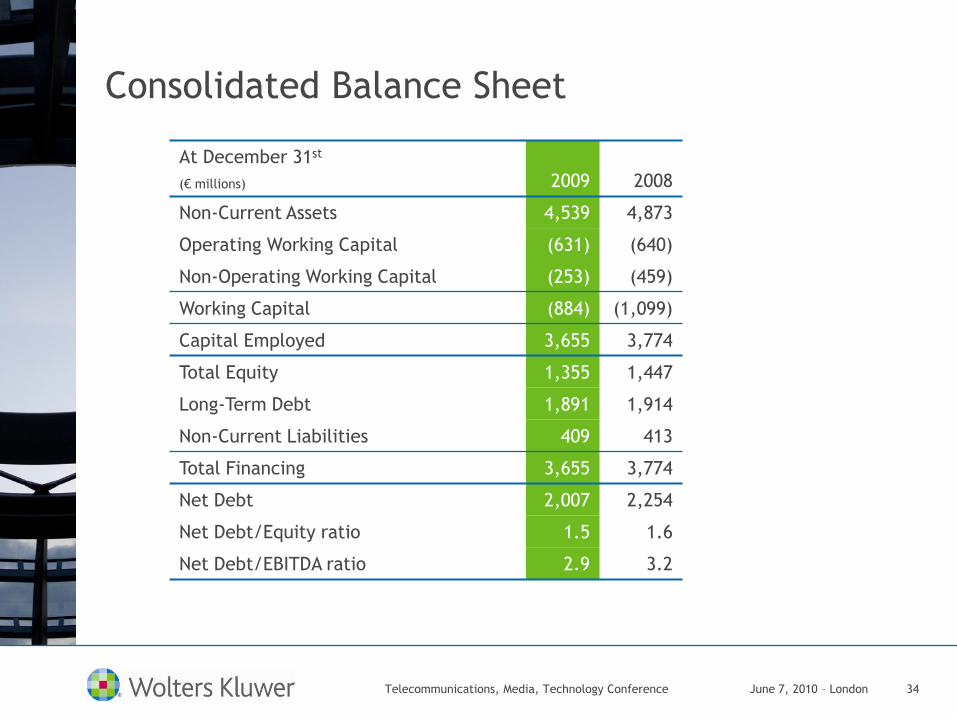
Consolidated Balance Sheet
At December 31st
(€ millions) 2009 2008
Non-Current Assets 4,539 4,873
Operating Working Capital (631) (640)
Non-Operating Working Capital (253) (459)
Working Capital (884) (1,099)
Capital Employed 3,655 3,774
Total Equity 1,355 1,447
Long-Term Debt 1,891 1,914
Non-Current Liabilities 409 413
Total Financing 3,655 3,774
Net Debt 2,007 2,254
Net Debt/Equity ratio 1.5 1.6
Net Debt/EBITDA ratio 2.9 3.2
Telecommunications, Media, Technology Conference June 7, 2010 – London
35
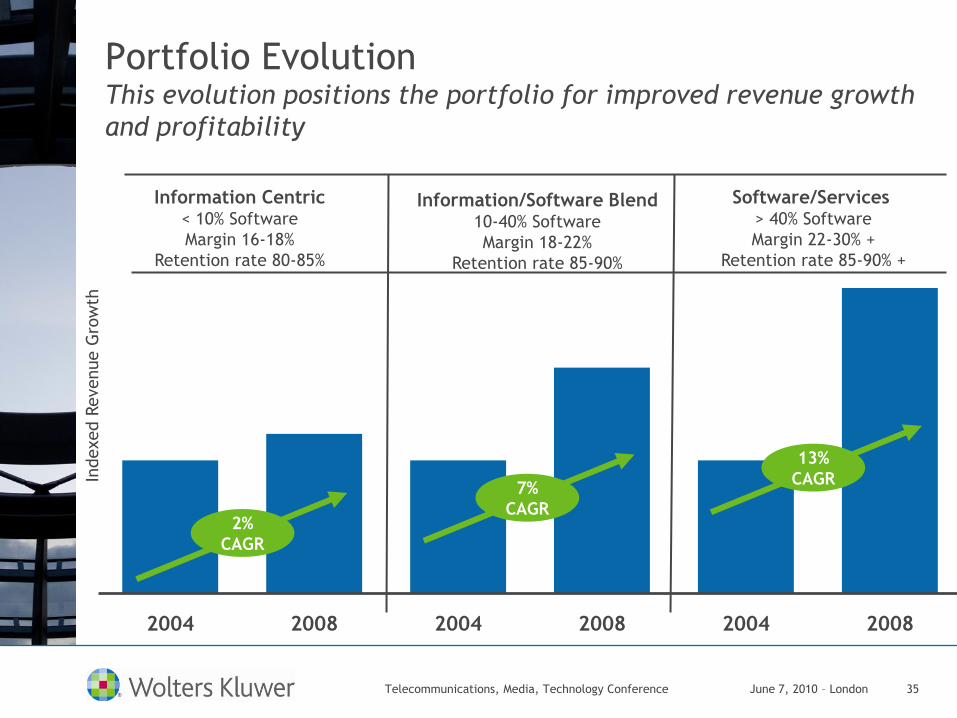
Portfolio EvolutionThis evolution positions the portfolio for improved revenue growth
and profitability
2004 2008 2004 2008 2004 2008
Information Centric< 10% Software
Margin 16-18%
Retention rate 80-85%
Information/Software Blend10-40% Software
Margin 18-22%
Retention rate 85-90%
Software/Services > 40% Software
Margin 22-30% +
Retention rate 85-90% +
Indexed R
evenue G
row
th
2%
CAGR
7%
CAGR
13%
CAGR
Telecommunications, Media, Technology Conference June 7, 2010 – London
36
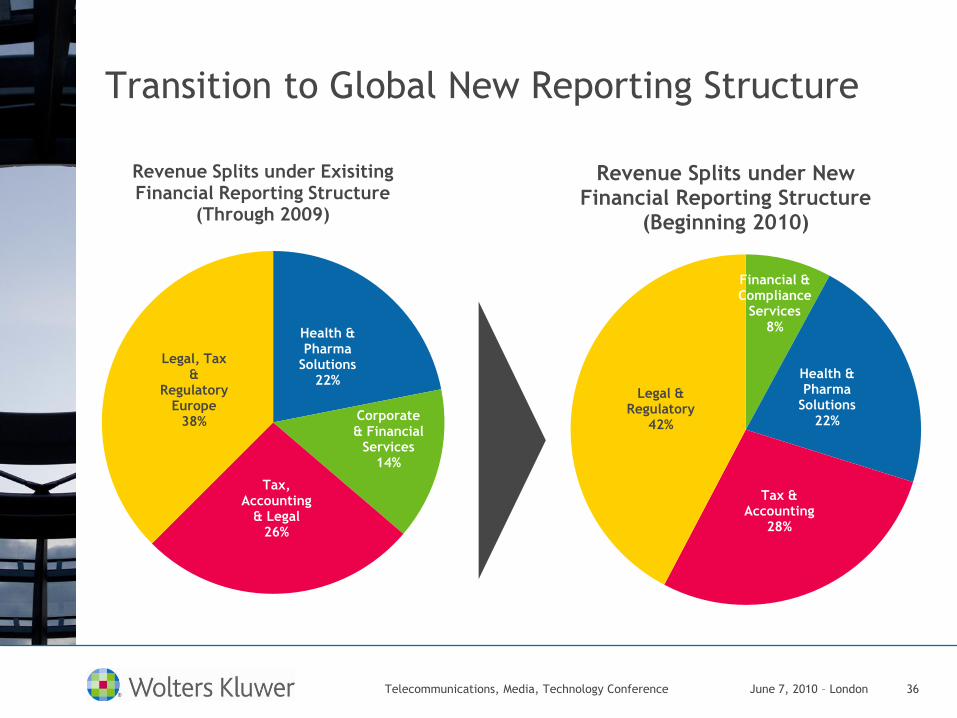
Transition to Global New Reporting Structure
Financial & Compliance
Services8%
Health & Pharma
Solutions22%
Tax & Accounting
28%
Legal & Regulatory
42%
Revenue Splits under New Financial Reporting Structure
(Beginning 2010)
Health & Pharma
Solutions22%
Corporate & Financial
Services14%
Tax, Accounting
& Legal26%
Legal, Tax &
Regulatory Europe
38%
Revenue Splits under Exisiting Financial Reporting Structure
(Through 2009)
Telecommunications, Media, Technology Conference June 7, 2010 – London

37
Wolters Kluwer
Legal & Regulatory
€1.4 billionTax & Accounting
€1.0 billion
Health & Pharma
Solutions
€0.7 billion
Tax & Accounting
Europe
Tax & Accounting
U.S.
Tax & Accounting
Canada and U.K.
Legal & Regulatory
Europe
Law & Business:
U.S. and U.K.
Corporate Legal
Services U.S.
Health & Pharma
Solutions
Europe/Asia
Clinical Solutions
Medical Research
Financial &
Compliance Services
€0.3 billion
Financial &
Compliance Solutions
Europe/Asia
Financial &
Compliance Solutions
U.S.
Governance, Risk &
Compliance (GRC)
Tax & Accounting
ASPAC
Healthcare Analytics
& Pharma Solutions
Professional &
Education
Transportation
Services
Global Market PositionsOur organization will focus on the strength of our global market
positions
75%Note: Figures represent 2009 revenue
Telecommunications, Media, Technology Conference June 7, 2010 – London
38
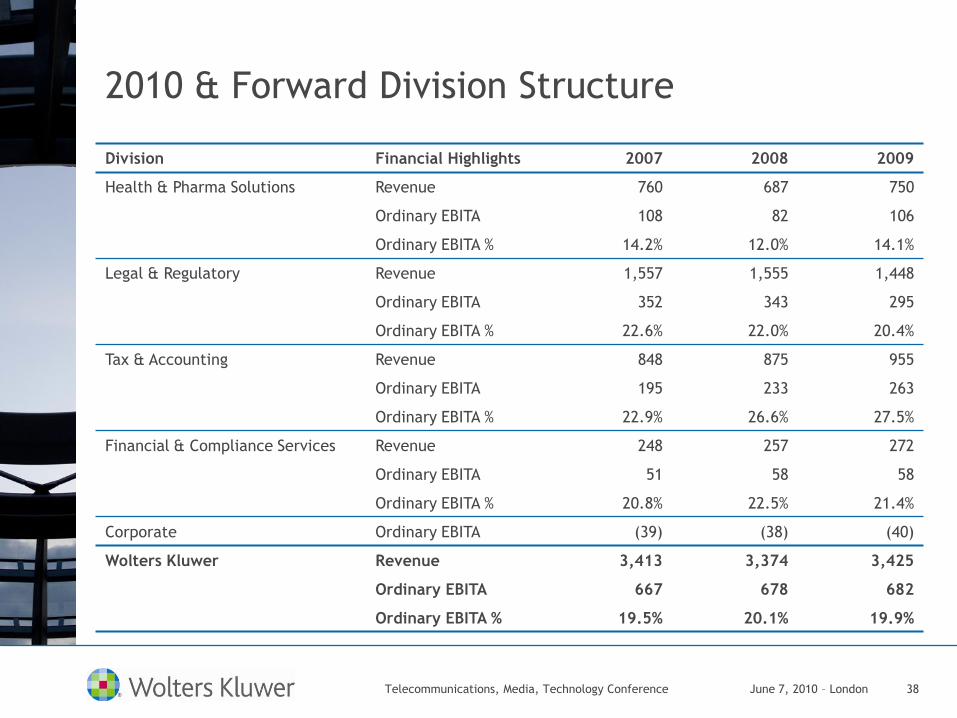
2010 & Forward Division Structure
Division Financial Highlights 2007 2008 2009
Health & Pharma Solutions Revenue 760 687 750
Ordinary EBITA 108 82 106
Ordinary EBITA % 14.2% 12.0% 14.1%
Legal & Regulatory Revenue 1,557 1,555 1,448
Ordinary EBITA 352 343 295
Ordinary EBITA % 22.6% 22.0% 20.4%
Tax & Accounting Revenue 848 875 955
Ordinary EBITA 195 233 263
Ordinary EBITA % 22.9% 26.6% 27.5%
Financial & Compliance Services Revenue 248 257 272
Ordinary EBITA 51 58 58
Ordinary EBITA % 20.8% 22.5% 21.4%
Corporate Ordinary EBITA (39) (38) (40)
Wolters Kluwer Revenue 3,413 3,374 3,425
Ordinary EBITA 667 678 682
Ordinary EBITA % 19.5% 20.1% 19.9%
Telecommunications, Media, Technology Conference June 7, 2010 – London

39
Competitive ScaleToday, Wolters Kluwer has global competitive scale in the Tax &
Accounting, Legal & Regulatory and Health markets
2008 Relative Global Market Positions (revenue € billions)
Legal & Regulatory
Wolters Kluwer
Thomson Reuters
BNA
Datev
Reed Elsevier
Source: Legal Publishing by JP Morgan September
2008; Wolters Kluwer estimates
Tax & Accounting
Wolters Kluwer
Thomson Reuters
Sage
Lefebvre
Intuit
Source: World Accounting (VRL Publishing), Wolters
Kluwer estimates
Health
Wolters Kluwer
Thomson
Reuters
UBM
Reed Elsevier
Springer
Science
Source: Outsell October 2008, Wolters Kluwer
estimates
#1 Position #2 Position #2 Position
€0.9
€0.5
€0.4
€0.2
€0.2
€2.4
€1.3
€0.3
€0.3
€1.5
€1.1
€0.3
€0.3
€0.2
€0.7
Telecommunications, Media, Technology Conference June 7, 2010 – London
40
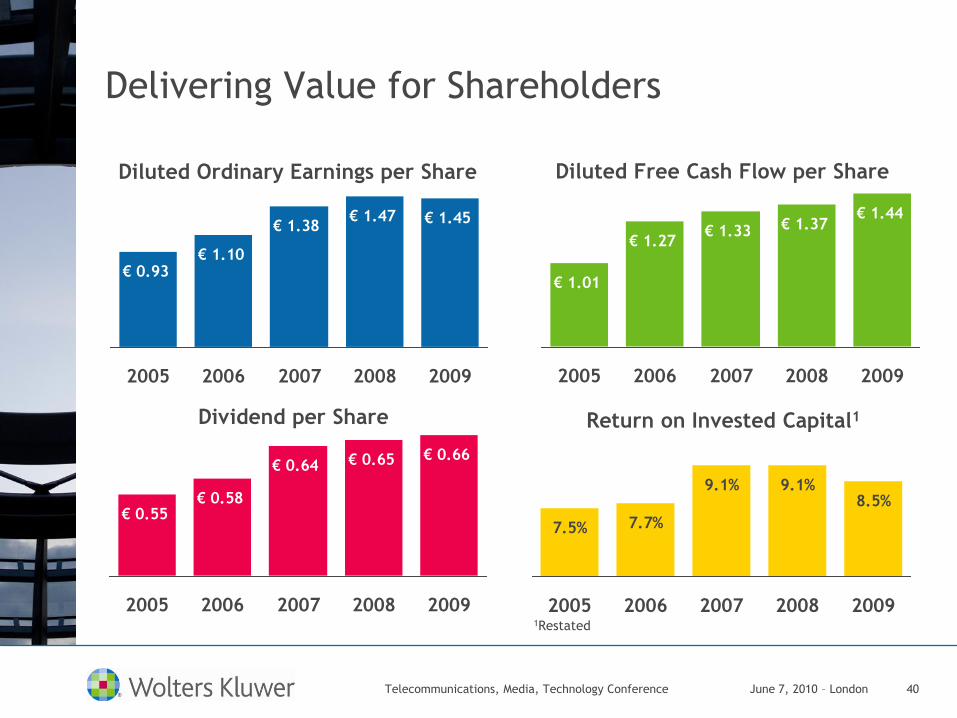
Delivering Value for Shareholders
€ 1.01
€ 1.27€ 1.33 € 1.37
€ 1.44
2005 2006 2007 2008 2009
€ 0.93€ 1.10
€ 1.38€ 1.47 € 1.45
2005 2006 2007 2008 2009
€ 0.55€ 0.58
€ 0.64 € 0.65 € 0.66
2005 2006 2007 2008 2009
Diluted Ordinary Earnings per Share Diluted Free Cash Flow per Share
Dividend per Share
7.5% 7.7%
9.1% 9.1%8.5%
2005 2006 2007 2008 2009
Return on Invested Capital1
1Restated
Telecommunications, Media, Technology Conference June 7, 2010 – London