Embed Size (px)
Citation preview
BANK OF AMERICA MERRILL LYNCH HEALTHCARE CONFERENCE MAY 10-12, 2016
2
Forward-Looking Statements
This presentation may contain forward-looking statements based on current management expectations. Numerous factors, including those related to market conditions and those detailed from time-to-time in the Company’s filings with the Securities and Exchange Commission, may cause results to differ materially from those anticipated in the forward-looking statements. Many of the factors that will determine the Company’s future results are beyond the ability of the Company to control or predict. These statements are subject to risks and uncertainties and, therefore, actual results may differ materially. Readers should not place undue reliance on forward-looking statements, which reflect management’s views only as of the date hereof. The Company undertakes no obligation to revise or update any forward-looking statements, or to make any other forward-looking statements, whether as a result of new information, future events or otherwise. All references to “Select” used throughout this presentation refer to Select Medical Holdings Corporation and its subsidiaries.
3
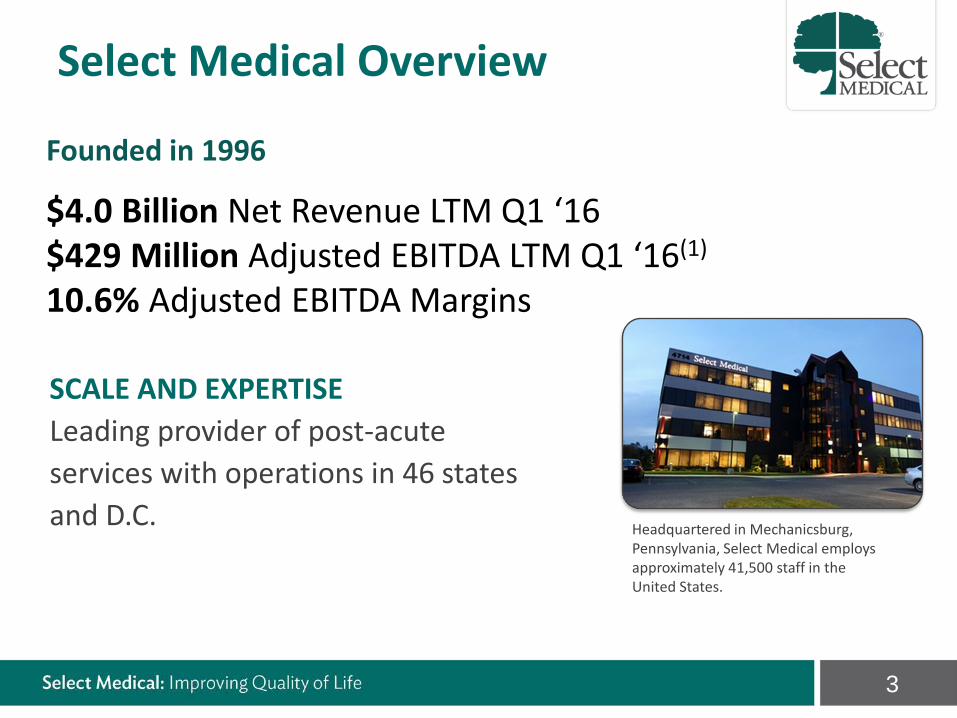
Headquartered in Mechanicsburg, Pennsylvania, Select Medical employs approximately 41,500 staff in the United States.
SCALE AND EXPERTISE Leading provider of post-acute services with operations in 46 states and D.C.
Founded in 1996 $4.0 Billion Net Revenue LTM Q1 ‘16 $429 Million Adjusted EBITDA LTM Q1 ‘16(1) 10.6% Adjusted EBITDA Margins
Select Medical Overview
4
Select Medical’s National Footprint
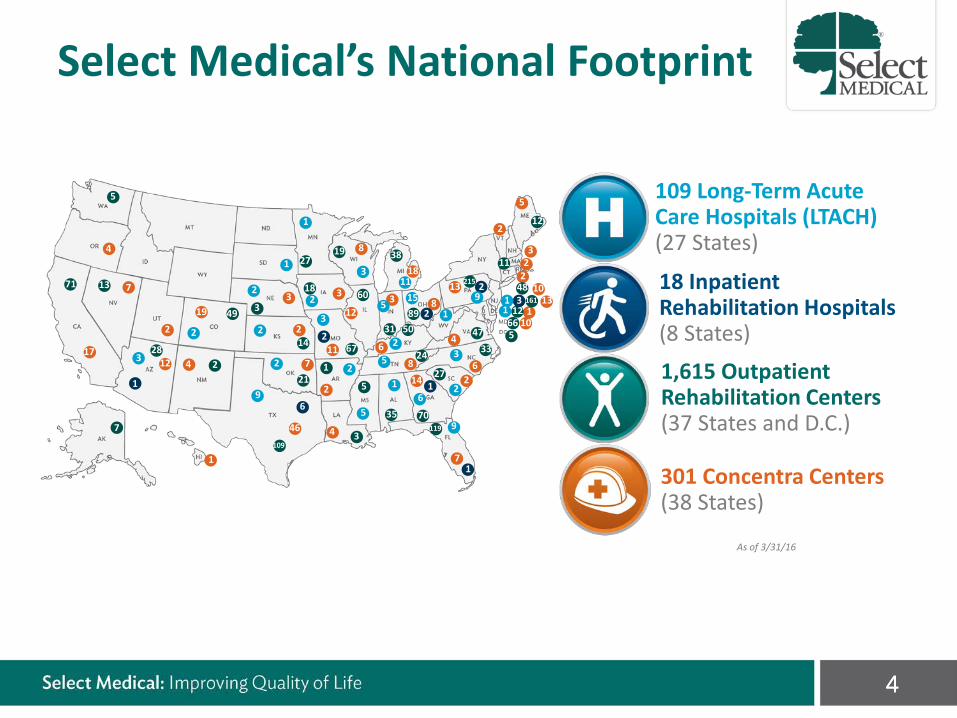
109 Long-Term Acute Care Hospitals (LTACH) (27 States)
18 Inpatient Rehabilitation Hospitals (8 States)
1,615 Outpatient Rehabilitation Centers (37 States and D.C.)
301 Concentra Centers (38 States)
As of 3/31/16
4
17
4
7
19
2
4 12
1
46 4
2
7
2
11
3 3
8
12 3
18 13
8
8 14 2
6
4
7
5
2
3 2
2 10
13 1
10
6
13
28 2
49
3
67
18
27 38
60
89 31
27
70 119
33 47
215
5 66
12 161
48
11
109
7
1 21
14 24
50
12
71
35
5
3
5
19
1
2
6
1
2
2 3
1
3
2 2
2
1
1
2
2
9
2 5
1
5 9
6 2
3
1
2
5
3 11
15 9 1 1
3
5
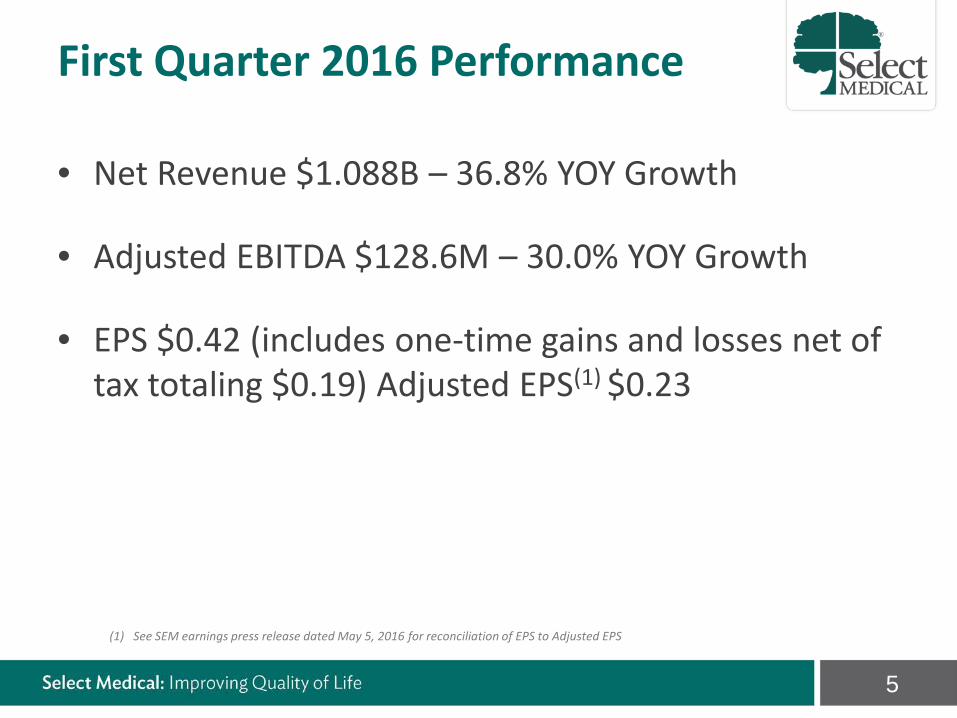
• Net Revenue $1.088B – 36.8% YOY Growth
• Adjusted EBITDA $128.6M – 30.0% YOY Growth
• EPS $0.42 (includes one-time gains and losses net of tax totaling $0.19) Adjusted EPS(1) $0.23
(1) See SEM earnings press release dated May 5, 2016 for reconciliation of EPS to Adjusted EPS
First Quarter 2016 Performance
6
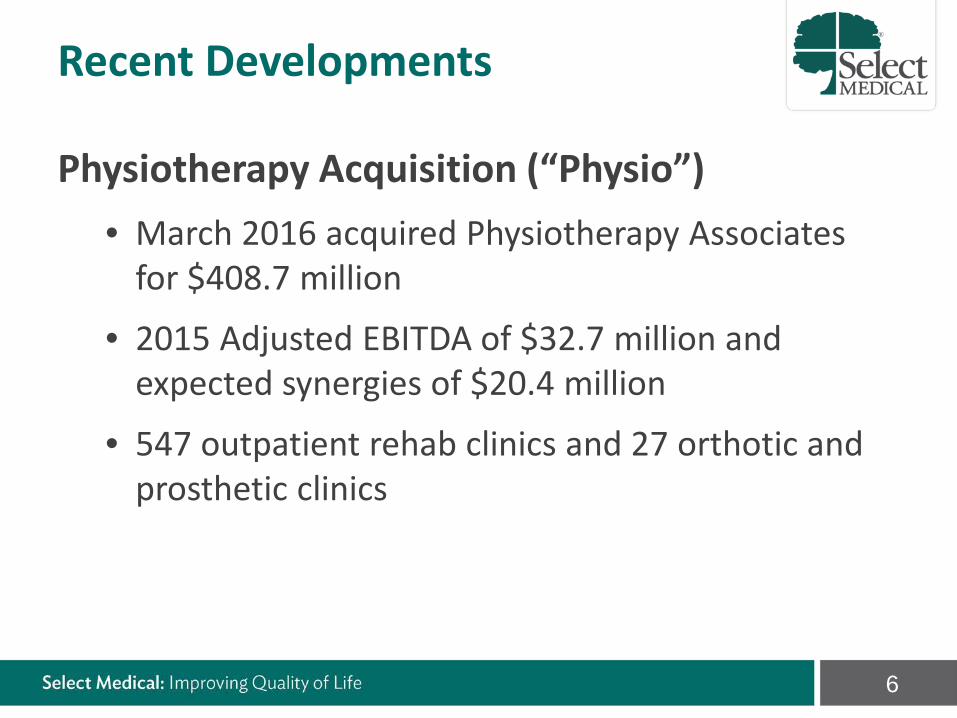
Physiotherapy Acquisition (“Physio”) • March 2016 acquired Physiotherapy Associates
for $408.7 million
• 2015 Adjusted EBITDA of $32.7 million and expected synergies of $20.4 million
• 547 outpatient rehab clinics and 27 orthotic and prosthetic clinics
Recent Developments
7
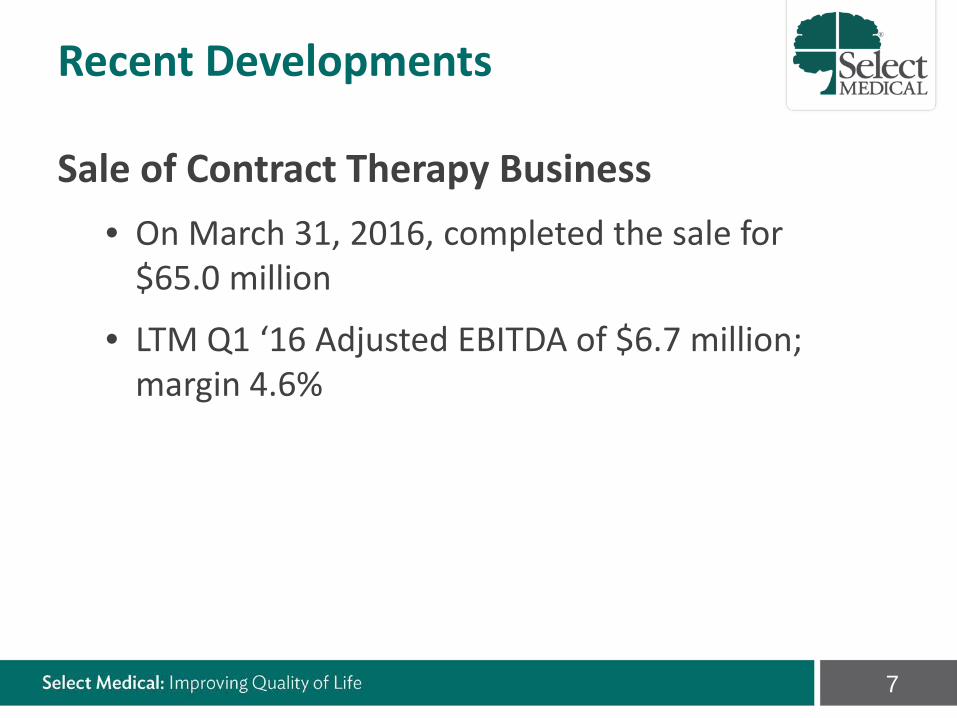
Sale of Contract Therapy Business • On March 31, 2016, completed the sale for
$65.0 million
• LTM Q1 ‘16 Adjusted EBITDA of $6.7 million; margin 4.6%
Recent Developments
8
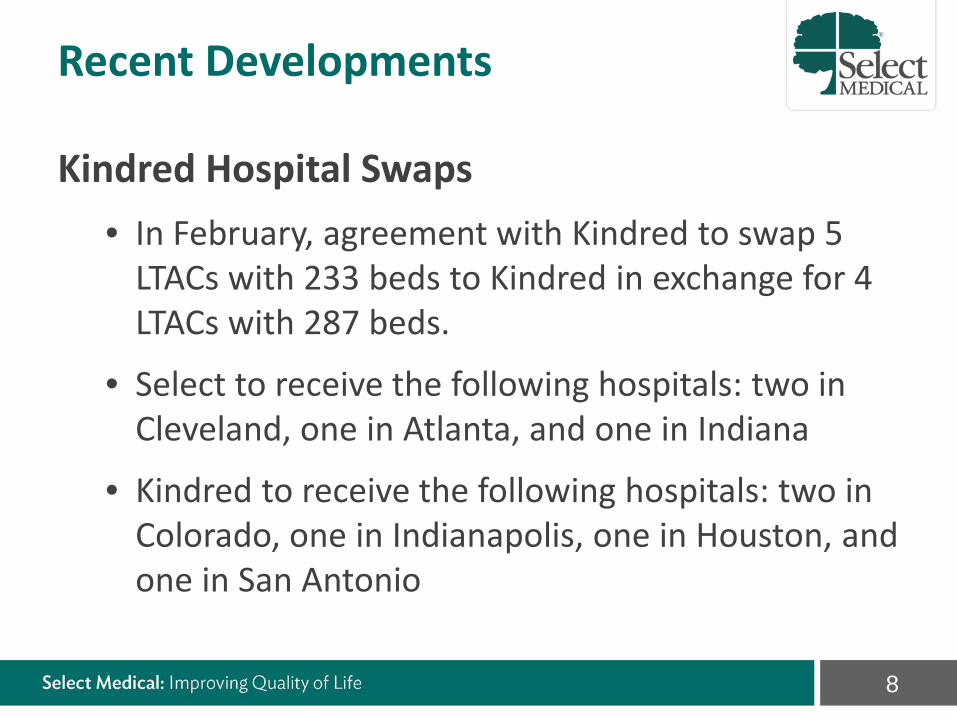
Kindred Hospital Swaps • In February, agreement with Kindred to swap 5
LTACs with 233 beds to Kindred in exchange for 4 LTACs with 287 beds.
• Select to receive the following hospitals: two in Cleveland, one in Atlanta, and one in Indiana
• Kindred to receive the following hospitals: two in Colorado, one in Indianapolis, one in Houston, and one in San Antonio
Recent Developments
9
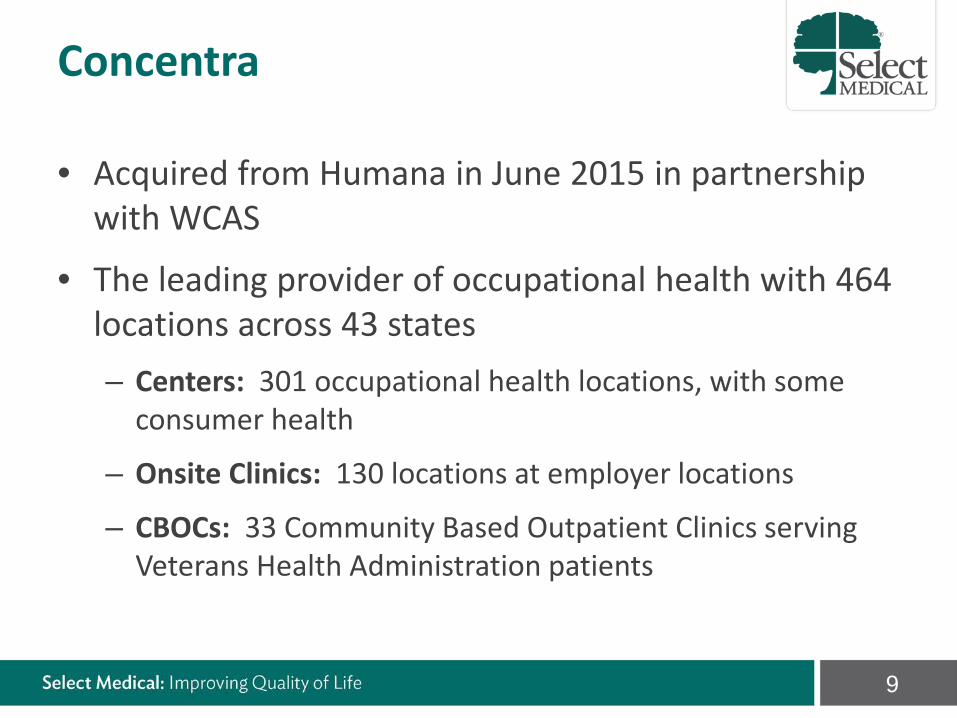
• Acquired from Humana in June 2015 in partnership with WCAS
• The leading provider of occupational health with 464 locations across 43 states – Centers: 301 occupational health locations, with some
consumer health
– Onsite Clinics: 130 locations at employer locations
– CBOCs: 33 Community Based Outpatient Clinics serving Veterans Health Administration patients
Concentra
10
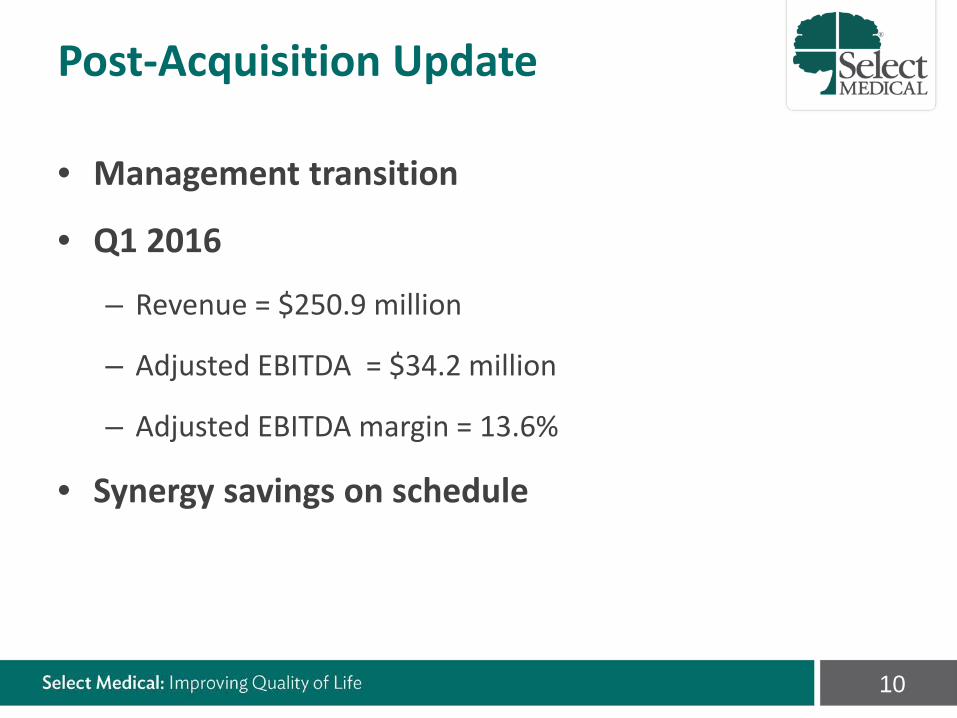
• Management transition
• Q1 2016
– Revenue = $250.9 million
– Adjusted EBITDA = $34.2 million
– Adjusted EBITDA margin = 13.6%
• Synergy savings on schedule
Post-Acquisition Update
11
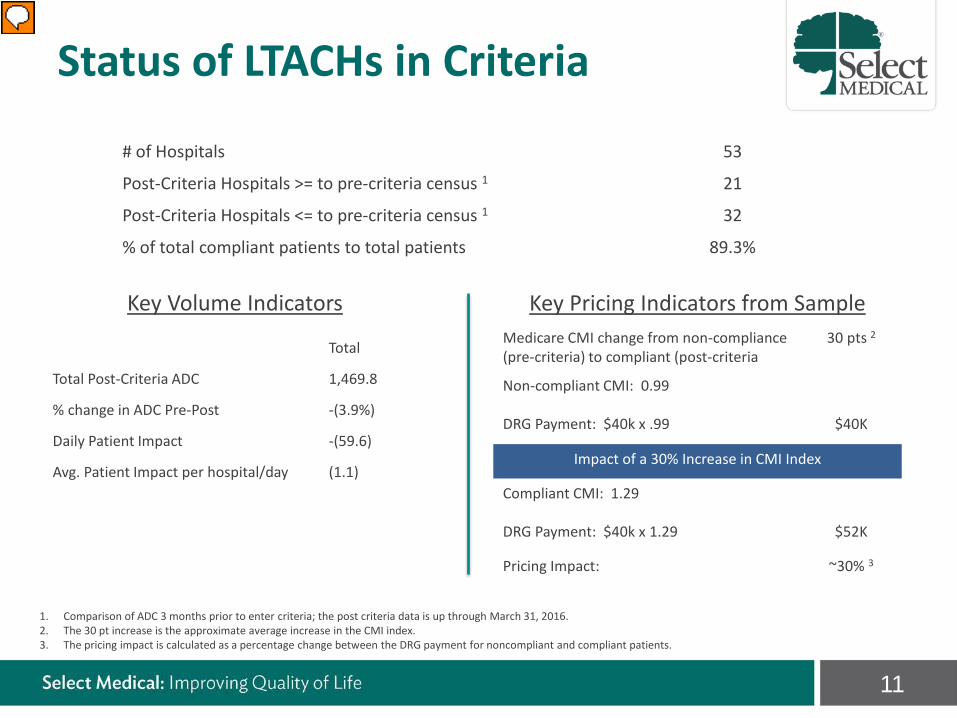
Status of LTACHs in Criteria
# of Hospitals 53
Post-Criteria Hospitals >= to pre-criteria census 1 21
Post-Criteria Hospitals <= to pre-criteria census 1 32
% of total compliant patients to total patients 89.3%
Key Volume Indicators
Total
Total Post-Criteria ADC 1,469.8
% change in ADC Pre-Post -(3.9%)
Daily Patient Impact -(59.6)
Avg. Patient Impact per hospital/day (1.1)
Key Pricing Indicators from Sample Medicare CMI change from non-compliance (pre-criteria) to compliant (post-criteria
30 pts 2
Non-compliant CMI: 0.99
DRG Payment: $40k x .99 $40K
Impact of a 30% Increase in CMI Index
Compliant CMI: 1.29
DRG Payment: $40k x 1.29 $52K
Pricing Impact: ~30% 3
1. Comparison of ADC 3 months prior to enter criteria; the post criteria data is up through March 31, 2016. 2. The 30 pt increase is the approximate average increase in the CMI index. 3. The pricing impact is calculated as a percentage change between the DRG payment for noncompliant and compliant patients.
12
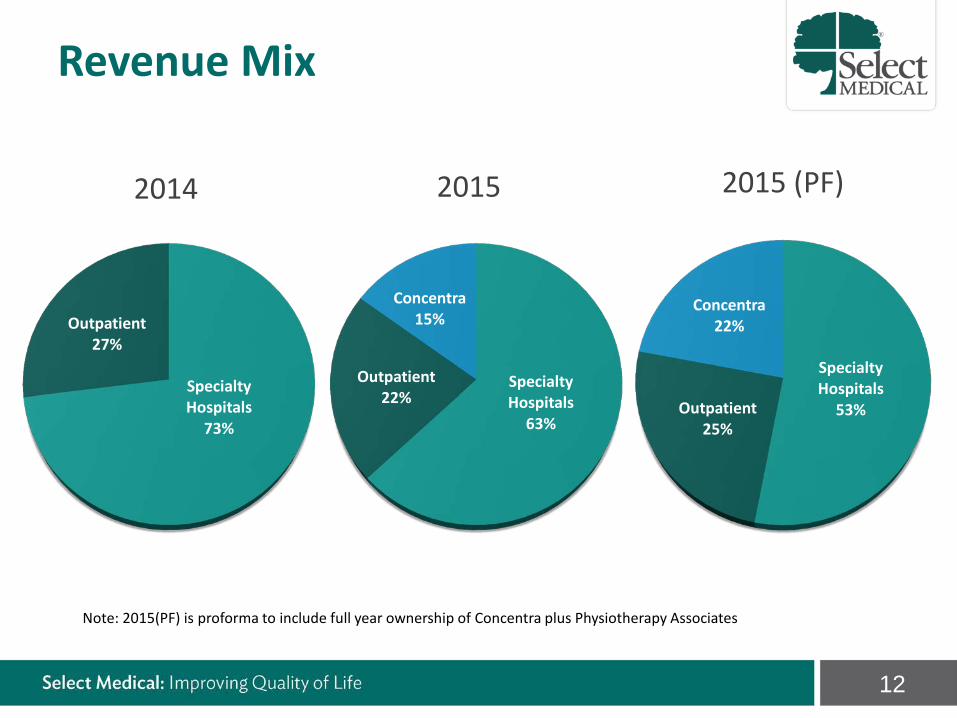
Specialty Hospitals
73%
Outpatient 27%
Specialty Hospitals
63%
Outpatient 22%
Concentra 15%
Specialty Hospitals
53% Outpatient 25%
Concentra 22%
2014 2015 2015 (PF)
Note: 2015(PF) is proforma to include full year ownership of Concentra plus Physiotherapy Associates
Revenue Mix
13
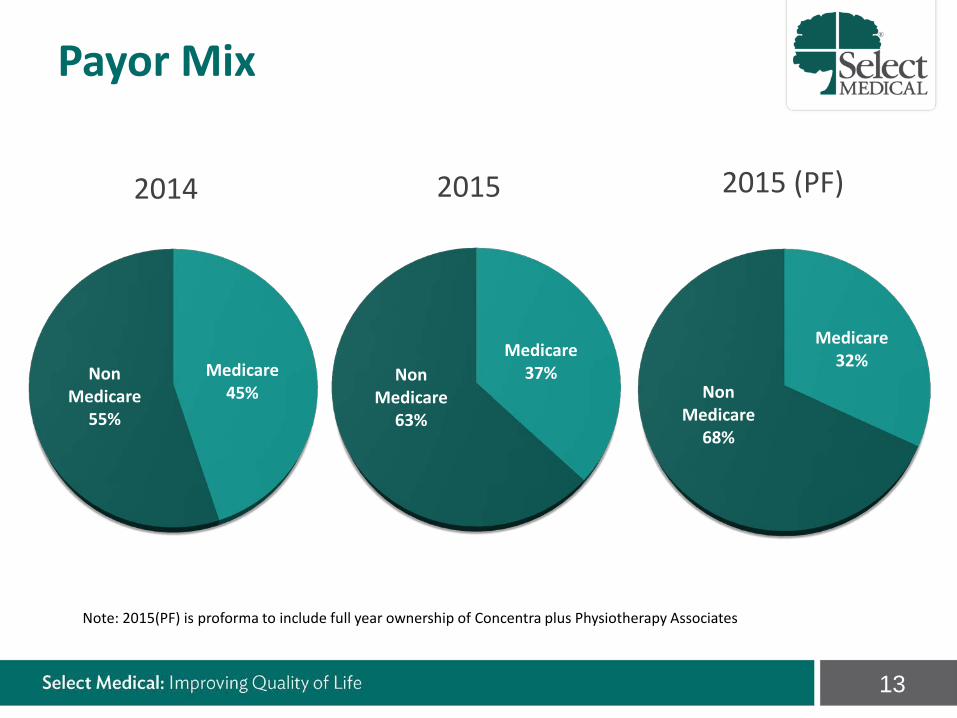
Medicare 45%
Non Medicare
55%
Medicare 32%
Non Medicare
68%
2014 2015 2015 (PF)
Note: 2015(PF) is proforma to include full year ownership of Concentra plus Physiotherapy Associates
Medicare 37% Non
Medicare 63%
Payor Mix
14
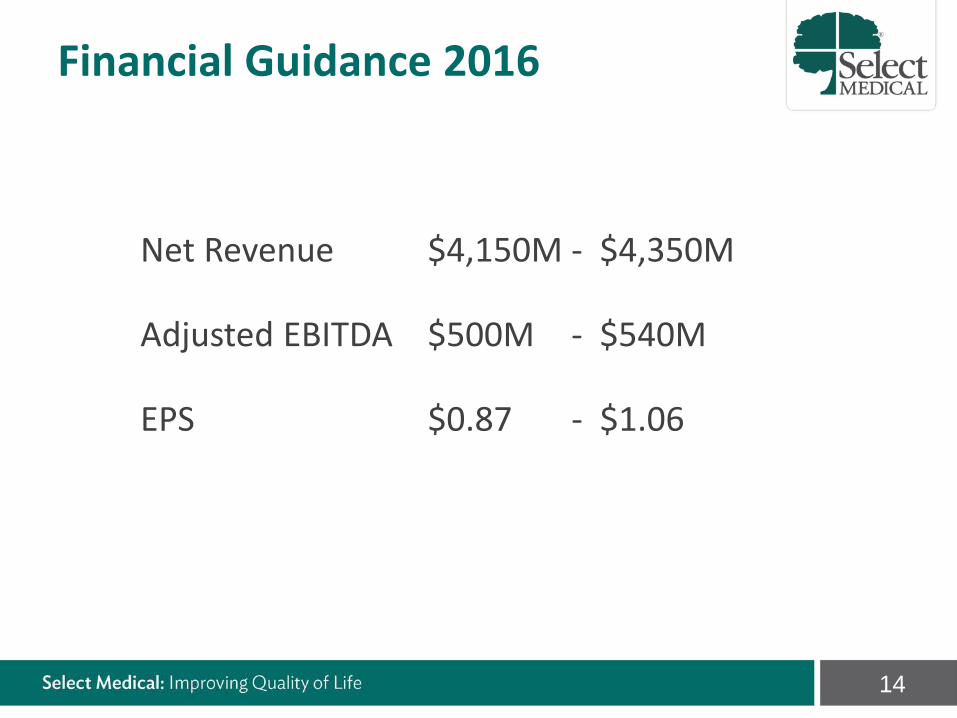
Net Revenue $4,150M - $4,350M
Adjusted EBITDA $500M - $540M
EPS $0.87 - $1.06
Financial Guidance 2016
selectmedical.com/investor-relations/for-investors