Embed Size (px)
Citation preview

Bank of America Merrill Lynch2016 Healthcare ConferenceLas Vegas May 2016
Forward Looking Statements
2
This presentation contains, and answers given to questions that may be asked today may constitute, forward-lookingstatements that are subject to a number of risks and uncertainties, many of which are outside our control. All statementsregarding our strategy, future operations, financial position, estimated revenues or losses, projected costs, prospects, plans andobjectives, other than statements of historical fact included in the presentation, are forward-looking statements. When used inthis presentation or in answers given to questions asked today, the words “may,” “will,” “could,” “would,” “expect,” “intend,”“plan,” “anticipate,” “believe,” “estimate,” “project,” “potential,” “continue,” and similar expressions are intended to identifyforward-looking statements, although not all forward-looking statements contain these identifying words. You should not placeundue reliance on forward-looking statements. While we believe that we have a reasonable basis for each forward-lookingstatement that we make, we caution you that these statements are based on a combination of facts and factors currentlyknown by us and projections of future events or conditions, about which we cannot be certain. For a more complete discussionregarding these and other factors which could affect the Company's financial performance, refer to the Company's variousfilings with the Securities and Exchange Commission, including its filing on Form 10-K for the year ended January 1, 2016 andsubsequently filed Form 10-Q, in particular information under the headings "Special Caution Regarding Forward-LookingStatements" and “Risk Factors.” These cautionary statements qualify all of the forward-looking statements. In addition, marketand industry statistics contained in this presentation are based on information available to us that we believe is accurate. Thisinformation is generally based on publications that are not produced for purposes of securities offerings or economic analysis.
All forward-looking statements speak only as of the date of this presentation. Except asrequired by law, we assume no obligation to update these forward-looking statementspublicly or to update the factors that could cause actual results to differ materially,even if new information becomes available in the future.
We use various Center for Medicare Services (CMS) national data throughout thepresentation which may be either from specific CMS reports or derived from public datareadily available from CMS.
Who We Are
3
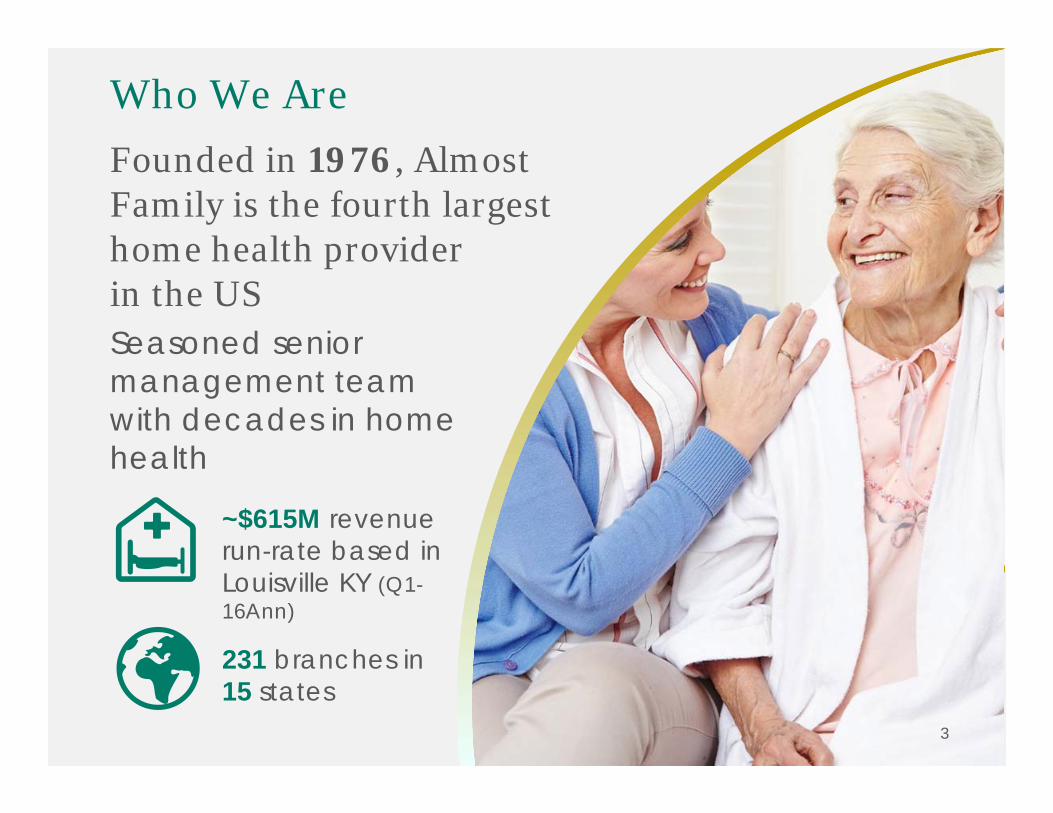
Founded in 1976, Almost Family is the fourth largest home health providerin the USSeasoned senior management team with decades in home health
~$615M revenue run-rate based in Louisville KY (Q1-16Ann)
231 branches in15 states
Focused Geographic Development
4
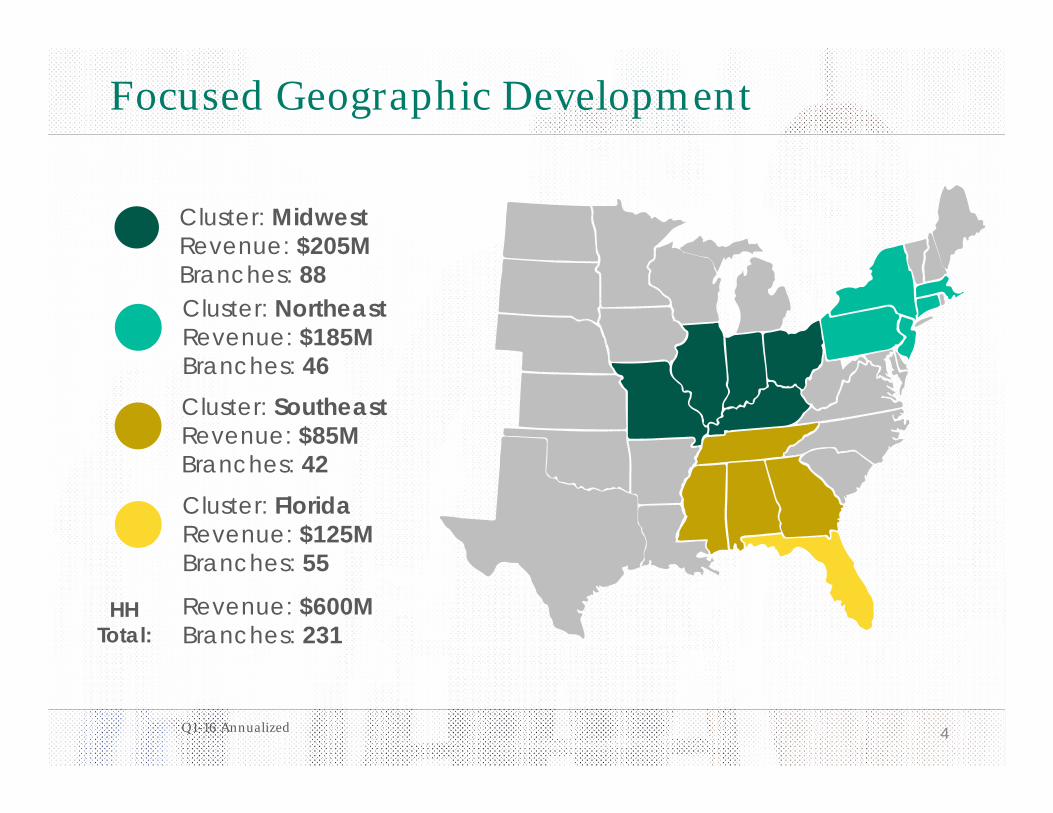
Cluster: MidwestRevenue: $205MBranches: 88Cluster: NortheastRevenue: $185MBranches: 46Cluster: SoutheastRevenue: $85MBranches: 42Cluster: FloridaRevenue: $125MBranches: 55
Branches: 58
HH Total:
Revenue: $600MBranches: 231
Q1-16 Annualized
AFAM – Our Business Model
5
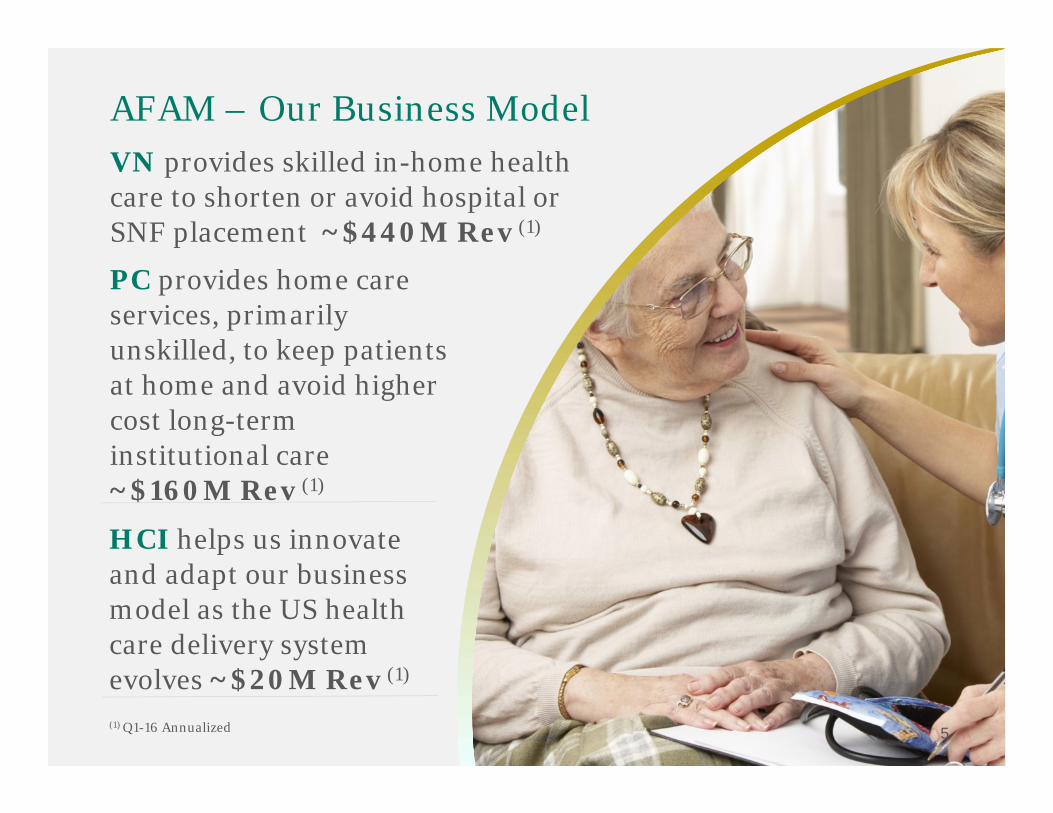
VN provides skilled in-home health care to shorten or avoid hospital or SNF placement ~$440M Rev (1)
PC provides home care services, primarily unskilled, to keep patients at home and avoid higher cost long-term institutional care ~$160M Rev (1)
HCI helps us innovate and adapt our business model as the US health care delivery system evolves ~$20M Rev (1)
(1) Q1-16 Annualized

Last Twelve Months’
Developments
6
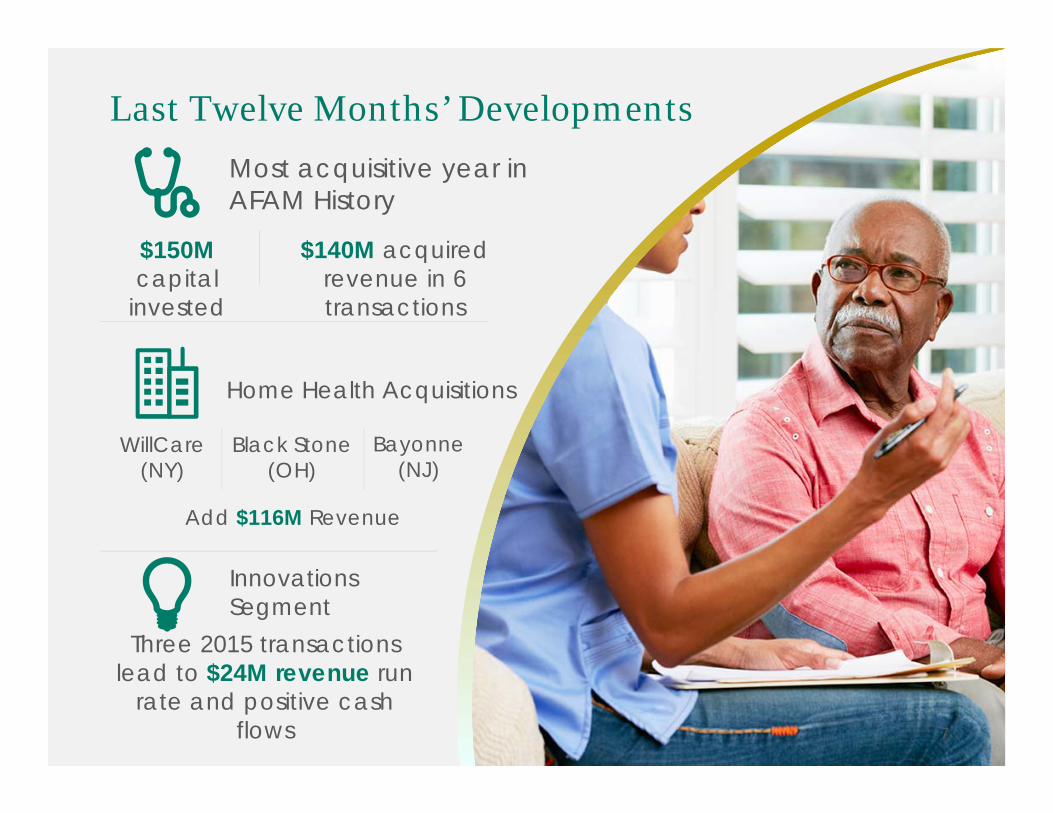
Last Twelve Months’ Developments
7
Most acquisitive year in AFAM History
Home Health Acquisitions
Innovations Segment
WillCare(NY)
Black Stone (OH)
$150M capital
invested
$140M acquired revenue in 6 transactions
Bayonne (NJ)
Add $116M Revenue
Three 2015 transactions lead to $24M revenue run
rate and positive cash flows
Innovations – How it Fits Together
8
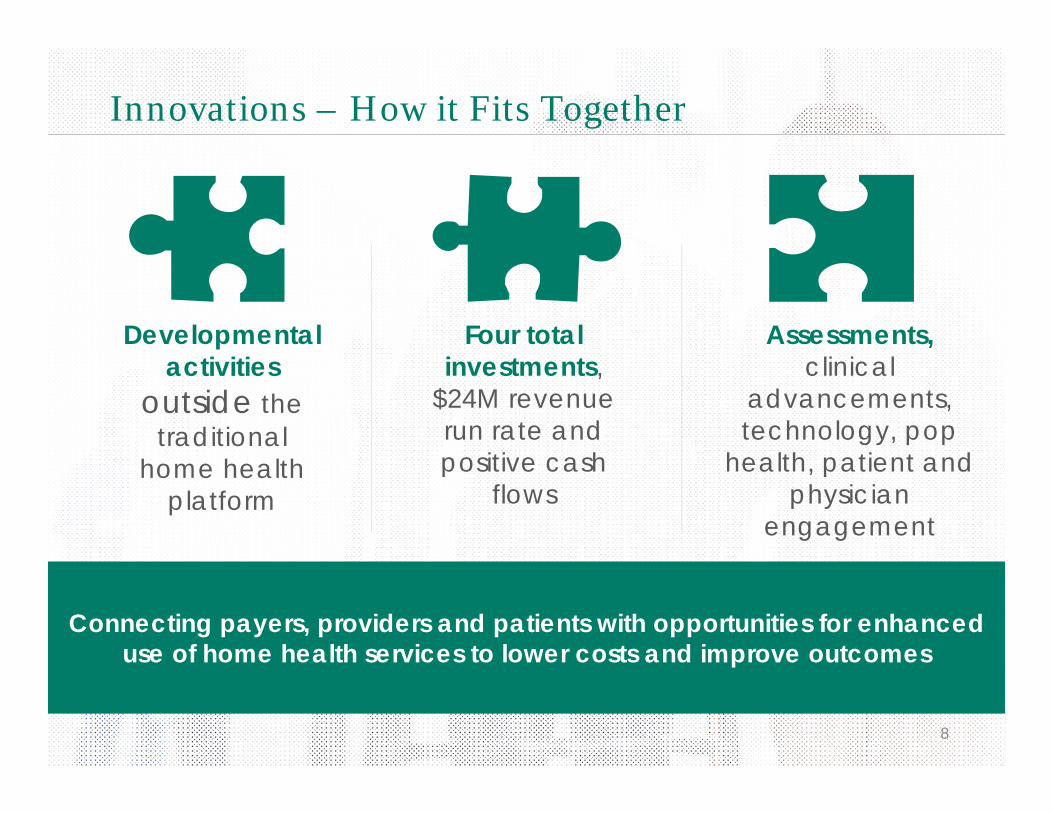
Connecting payers, providers and patients with opportunities for enhanced use of home health services to lower costs and improve outcomes
Developmental activities
outside the traditional
home health platform
Four total investments,
$24M revenue run rate and positive cash
flows
Assessments, clinical
advancements, technology, pop
health, patient and physician
engagement
Home Health Acquisition – WillCare
9
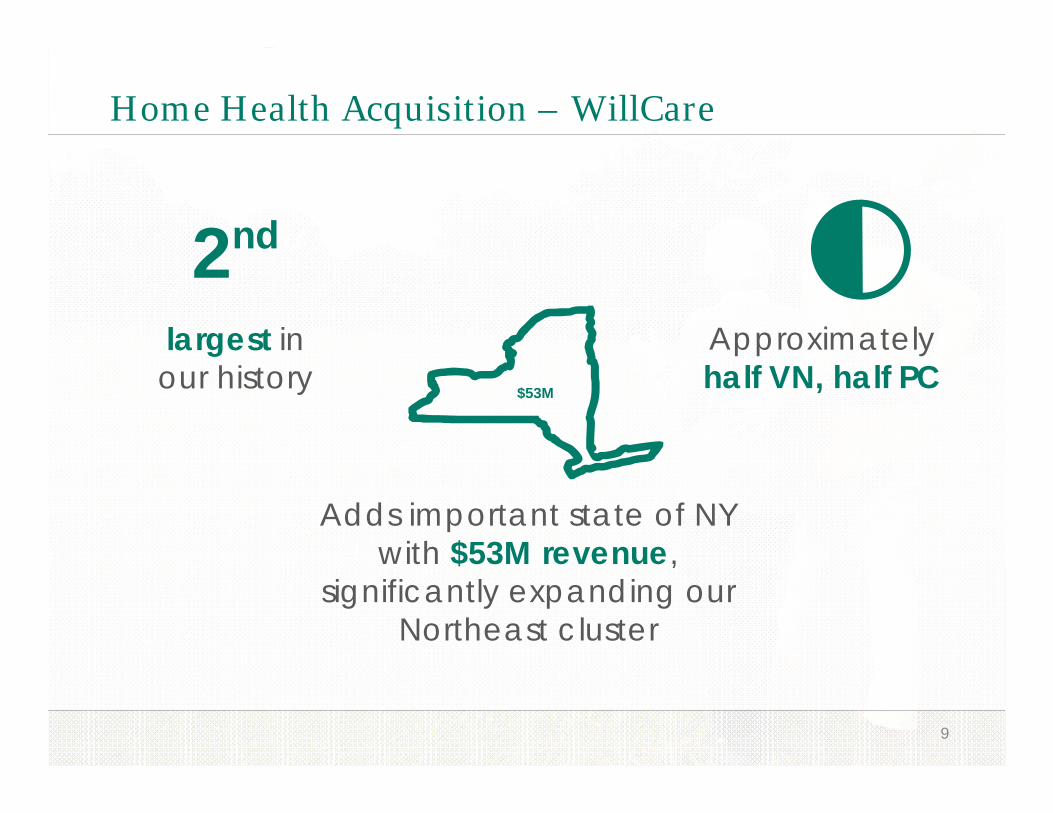
largest in our history
2nd
Adds important state of NY with $53M revenue,
significantly expanding our Northeast cluster
$53M
Approximately half VN, half PC
Home Health Acquisition – Black Stone
10
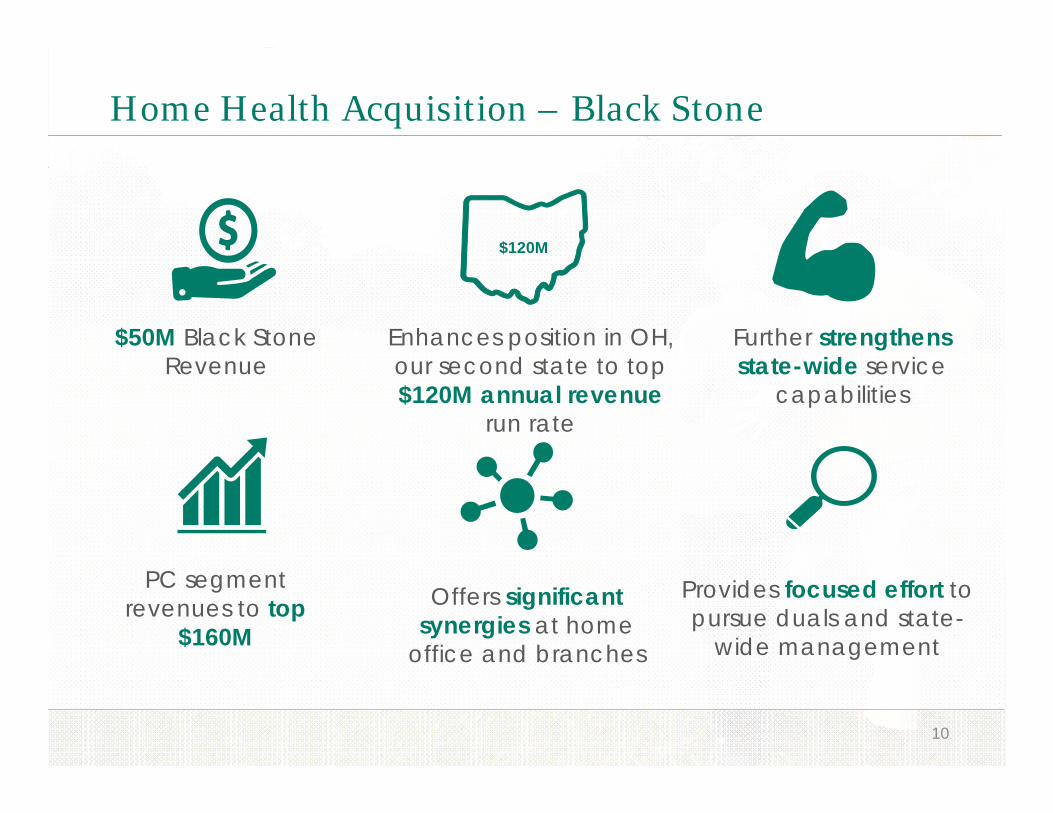
$50M Black Stone Revenue
Enhances position in OH, our second state to top $120M annual revenue
run rate
$120M
PC segment revenues to top
$160M
Provides focused effort to pursue duals and state-
wide management
Further strengthens state-wide service
capabilities
Offers significant synergies at home
office and branches
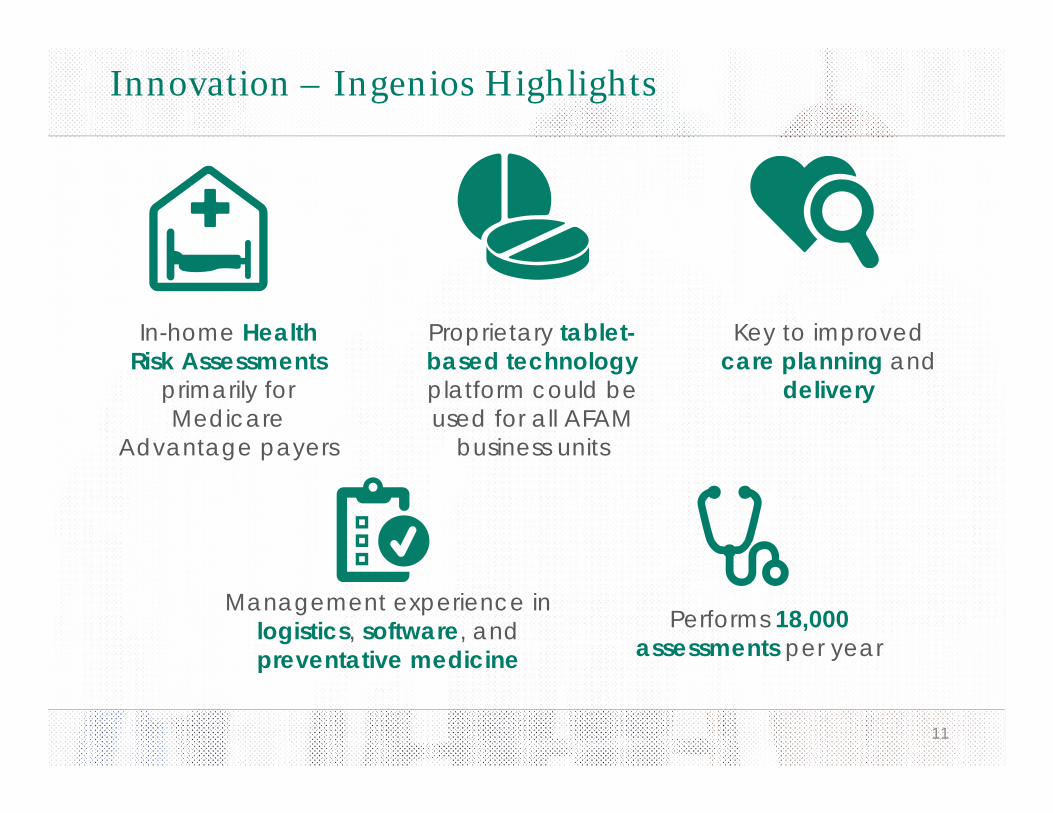
Innovation – Ingenios Highlights
11
In-home Health Risk Assessments
primarily for Medicare
Advantage payers
Proprietary tablet-based technology platform could be used for all AFAM
business units
Management experience in logistics, software, and preventative medicine
Performs 18,000 assessments per year
Key to improved care planning and
delivery
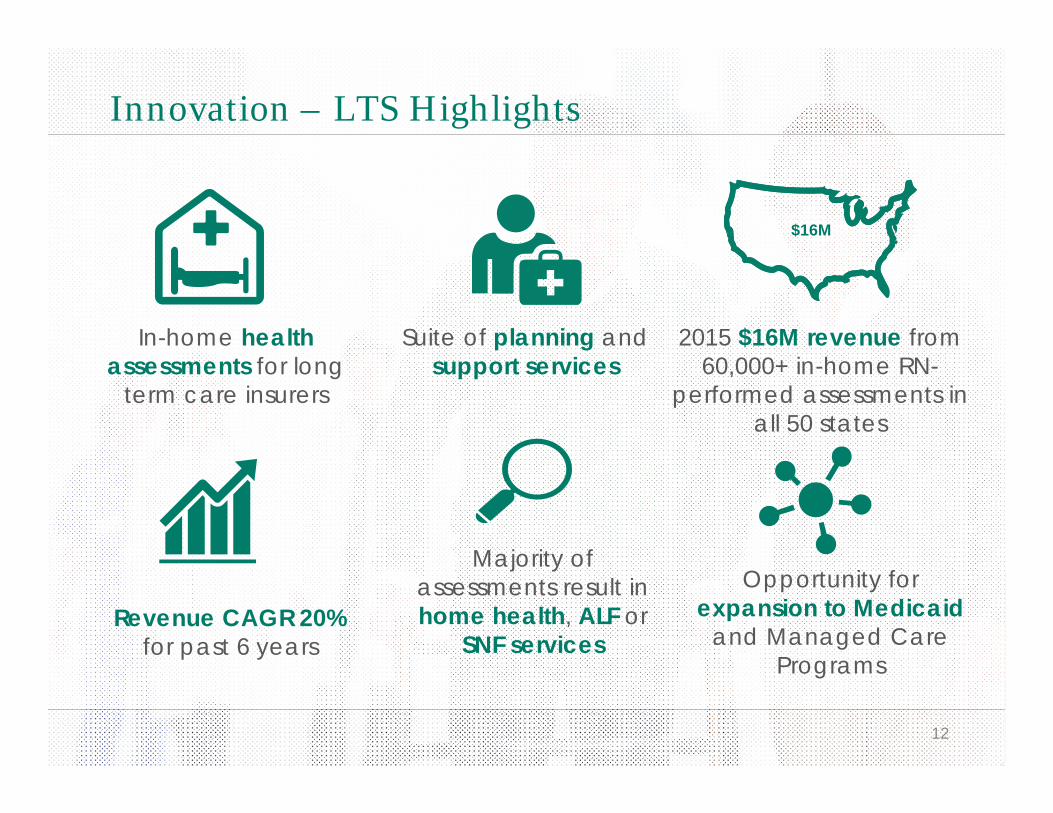
Innovation – LTS Highlights
12
In-home health assessments for long
term care insurers
Suite of planning and support services
Majority of assessments result in home health, ALF or
SNF services
2015 $16M revenue from 60,000+ in-home RN-
performed assessments in all 50 states
Revenue CAGR 20% for past 6 years
$16M
Opportunity for expansion to Medicaid
and Managed Care Programs
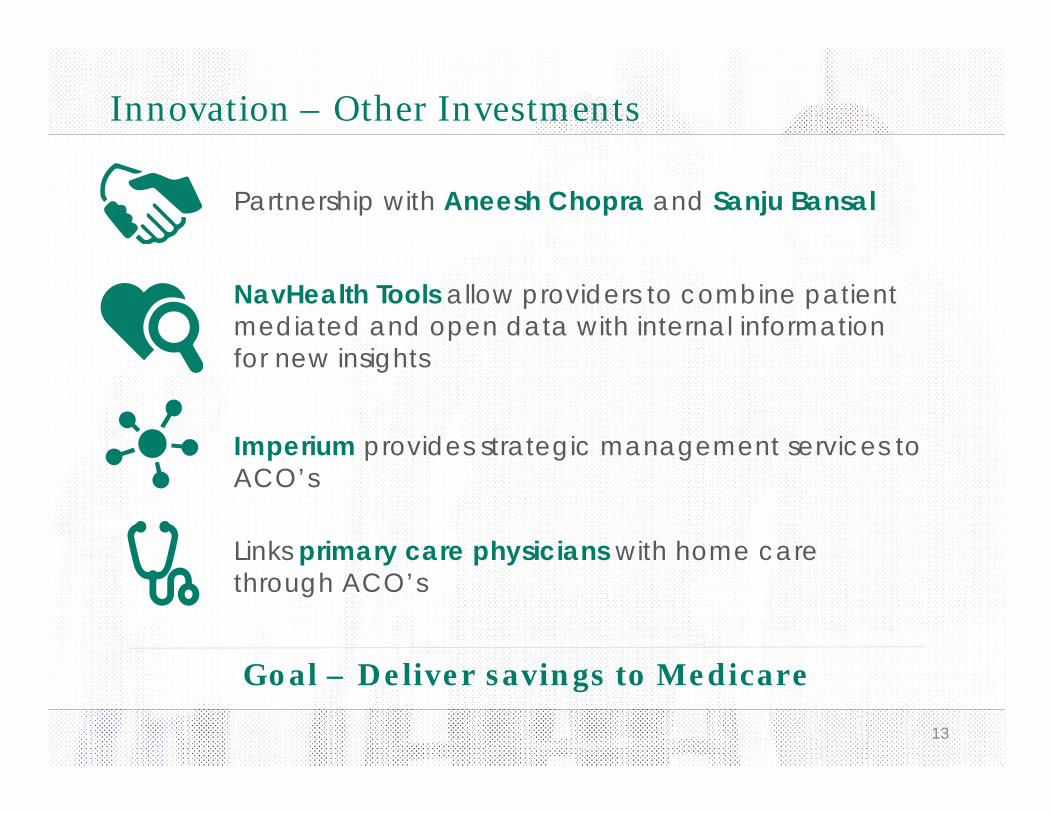
Innovation – Other Investments
13
Goal – Deliver savings to Medicare
Partnership with Aneesh Chopra and Sanju Bansal
NavHealth Tools allow providers to combine patient mediated and open data with internal information for new insights
Imperium provides strategic management services to ACO’s
Links primary care physicians with home care through ACO’s

Home Health Industry
14
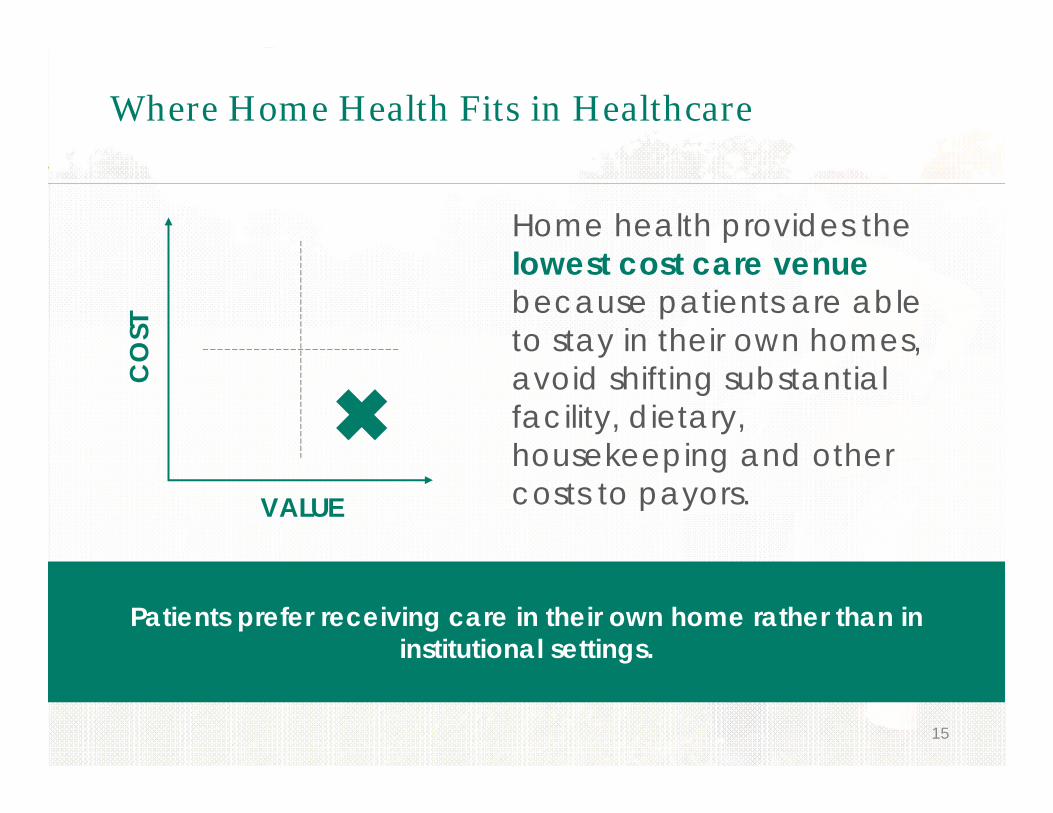
Where Home Health Fits in Healthcare
15
Patients prefer receiving care in their own home rather than in institutional settings.
Home health provides the lowest cost care venuebecause patients are able to stay in their own homes, avoid shifting substantial facility, dietary, housekeeping and other costs to payors.
CO
ST
VALUE
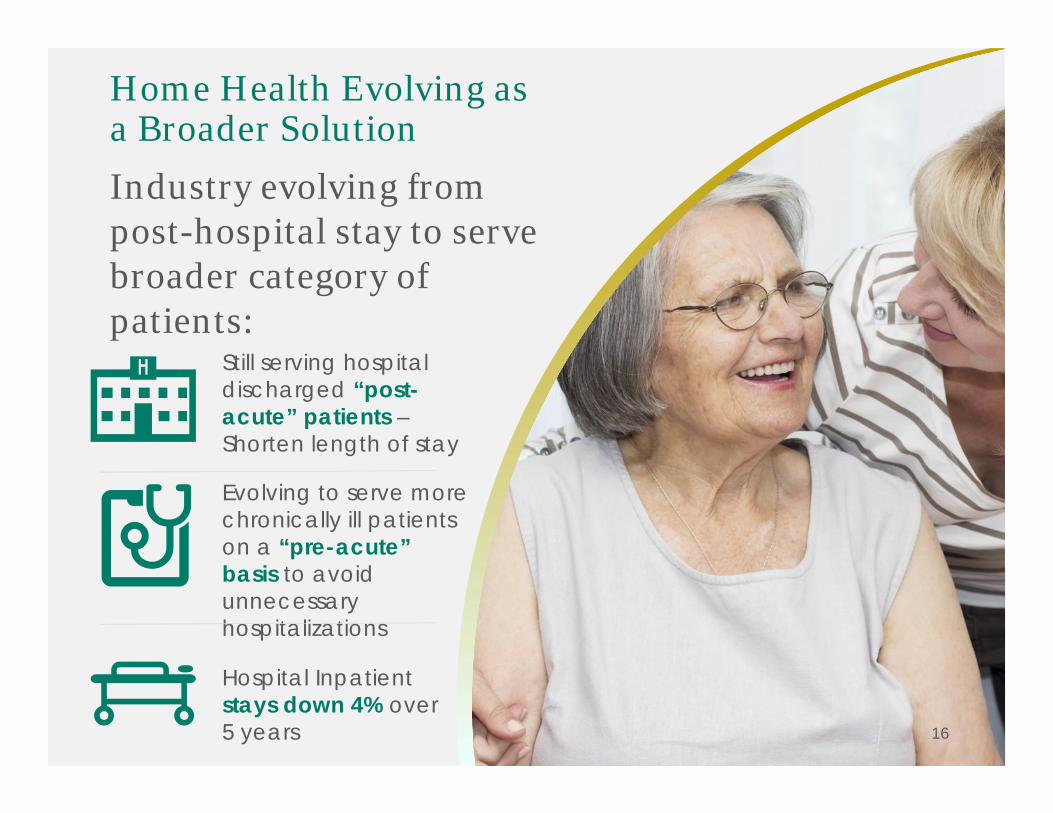
Home Health Evolving asa Broader Solution
16
Industry evolving from post-hospital stay to serve broader category of patients:
Still serving hospital discharged “post-acute” patients –Shorten length of stay
Evolving to serve more chronically ill patients on a “pre-acute” basis to avoid unnecessary hospitalizations
Hospital Inpatient stays down 4% over 5 years
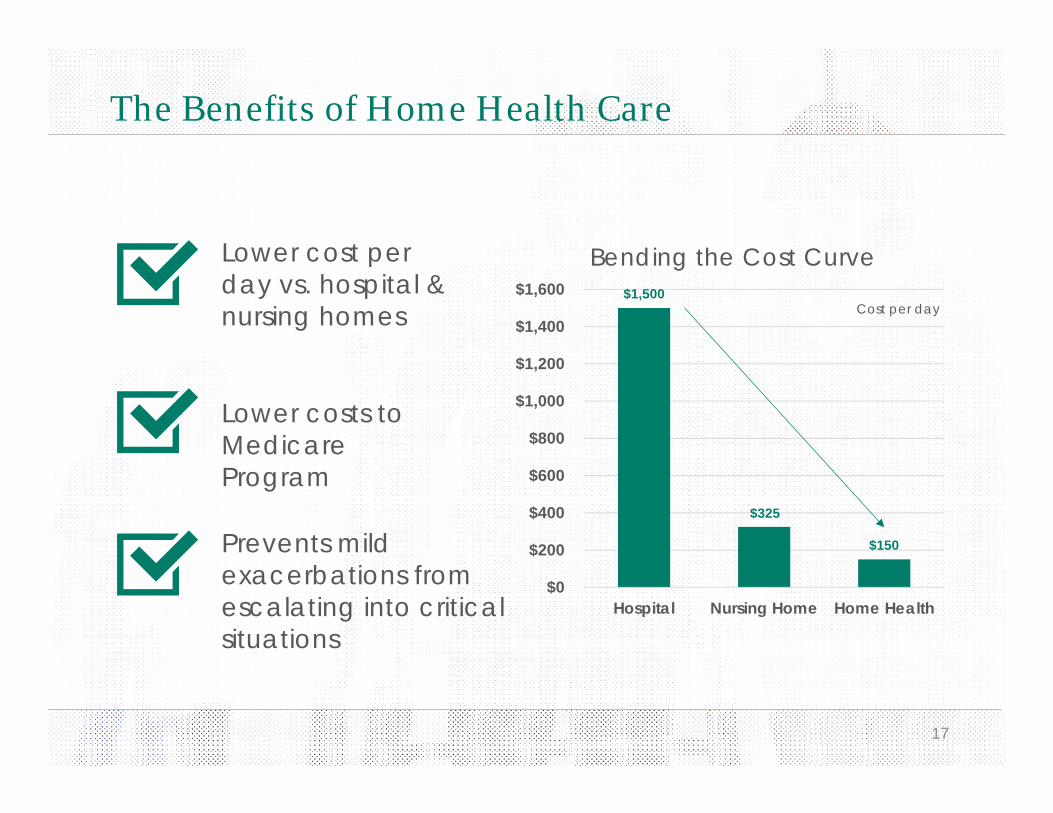
The Benefits of Home Health Care
17
$0
$200
$400
$600
$800
$1,000
$1,200
$1,400
$1,600
Hospital Nursing Home Home Health
Bending the Cost Curve
Lower costs to Medicare Program
Lower cost per day vs. hospital & nursing homes
Prevents mild exacerbations from escalating into critical situations
Cost per day$1,500
$150
$325
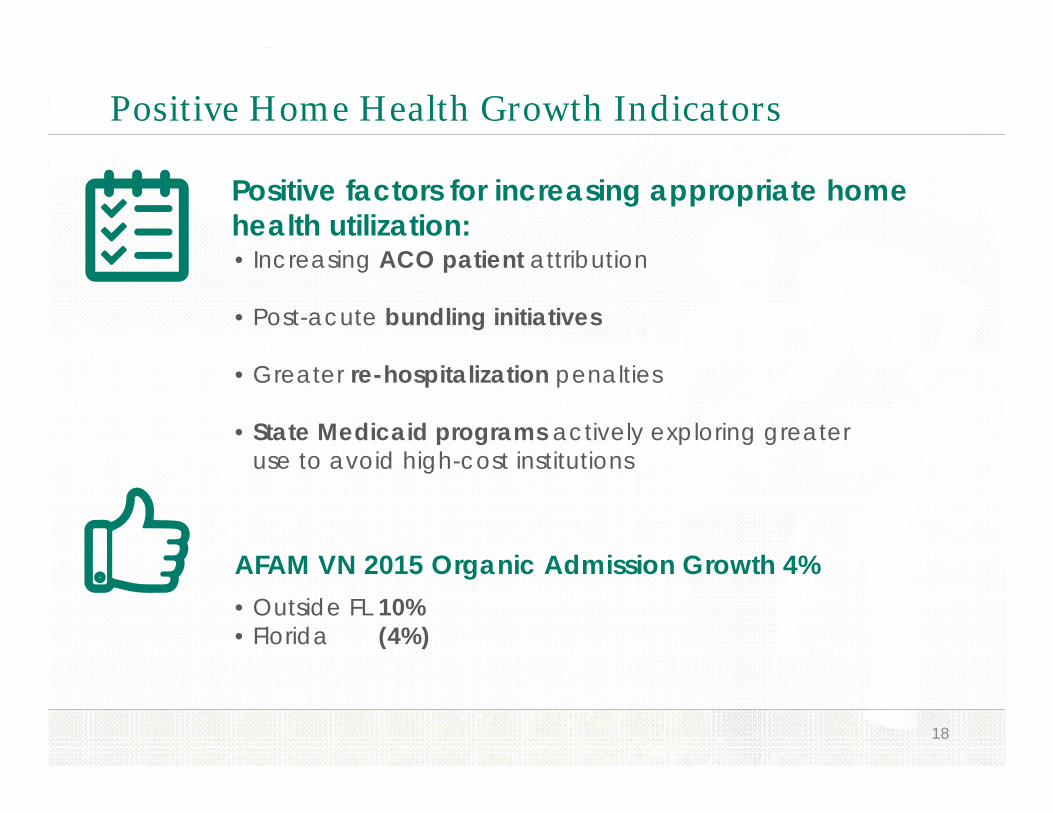
Positive Home Health Growth Indicators
18
AFAM VN 2015 Organic Admission Growth 4%
Positive factors for increasing appropriate homehealth utilization:• Increasing ACO patient attribution
• Post-acute bundling initiatives
• Greater re-hospitalization penalties
• State Medicaid programs actively exploring greater use to avoid high-cost institutions
• Outside FL 10%• Florida (4%)

Regulatory Front
19
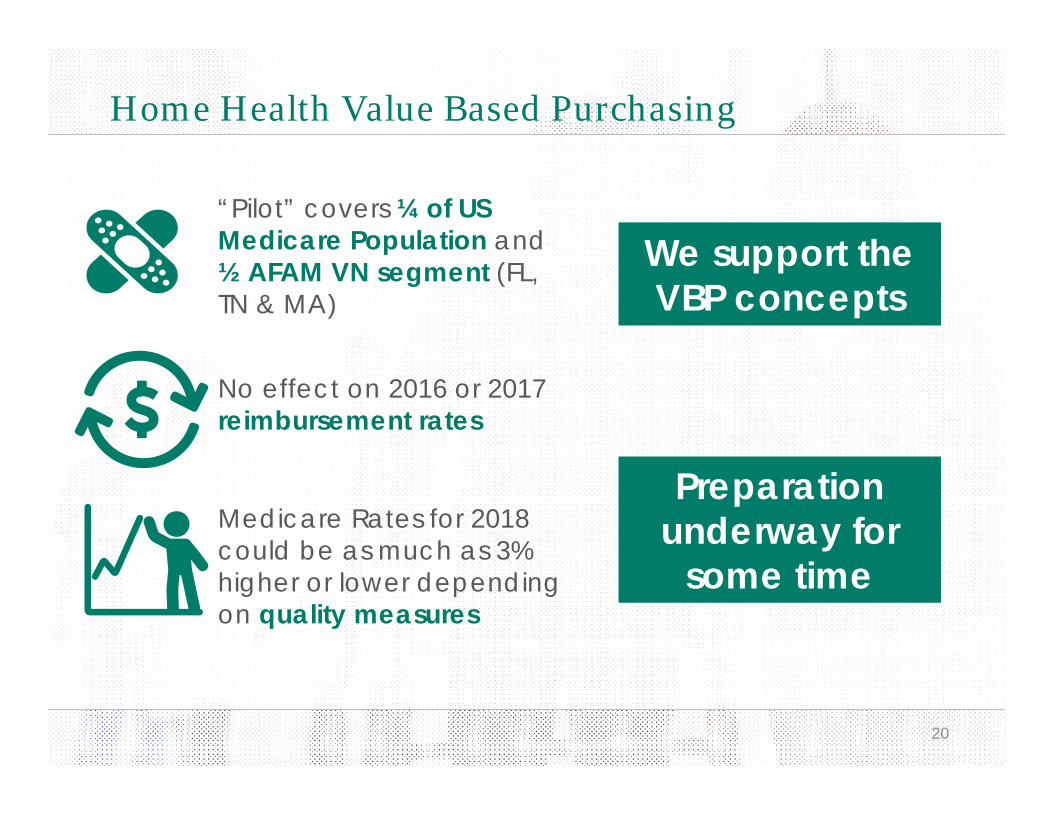
Home Health Value Based Purchasing
20
“Pilot” covers ¼ of US Medicare Population and ½ AFAM VN segment (FL, TN & MA)
No effect on 2016 or 2017 reimbursement rates
Medicare Rates for 2018 could be as much as 3% higher or lower depending on quality measures
We support the VBP concepts
Preparation underway for
some time
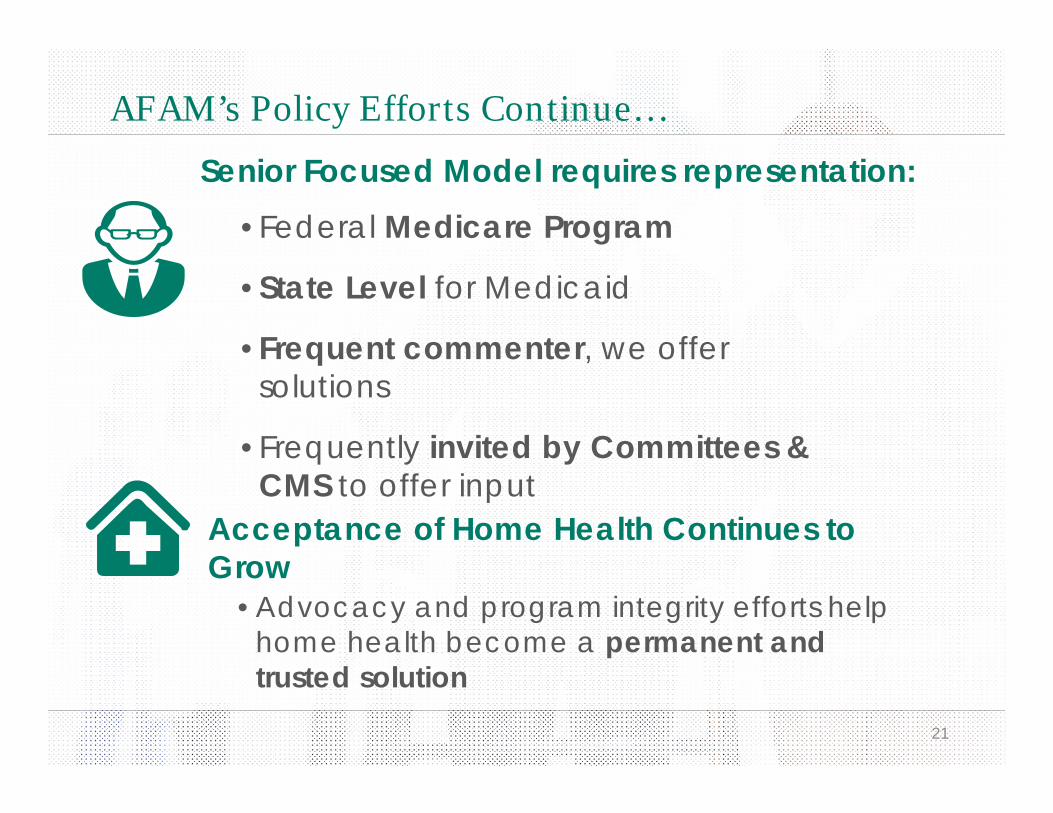
Senior Focused Model requires representation:• Federal Medicare Program
• State Level for Medicaid
• Frequent commenter, we offer solutions
• Frequently invited by Committees & CMS to offer input
AFAM’s Policy Efforts Continue…
21
Acceptance of Home Health Continues to Grow
• Advocacy and program integrity efforts help home health become a permanent and trusted solution
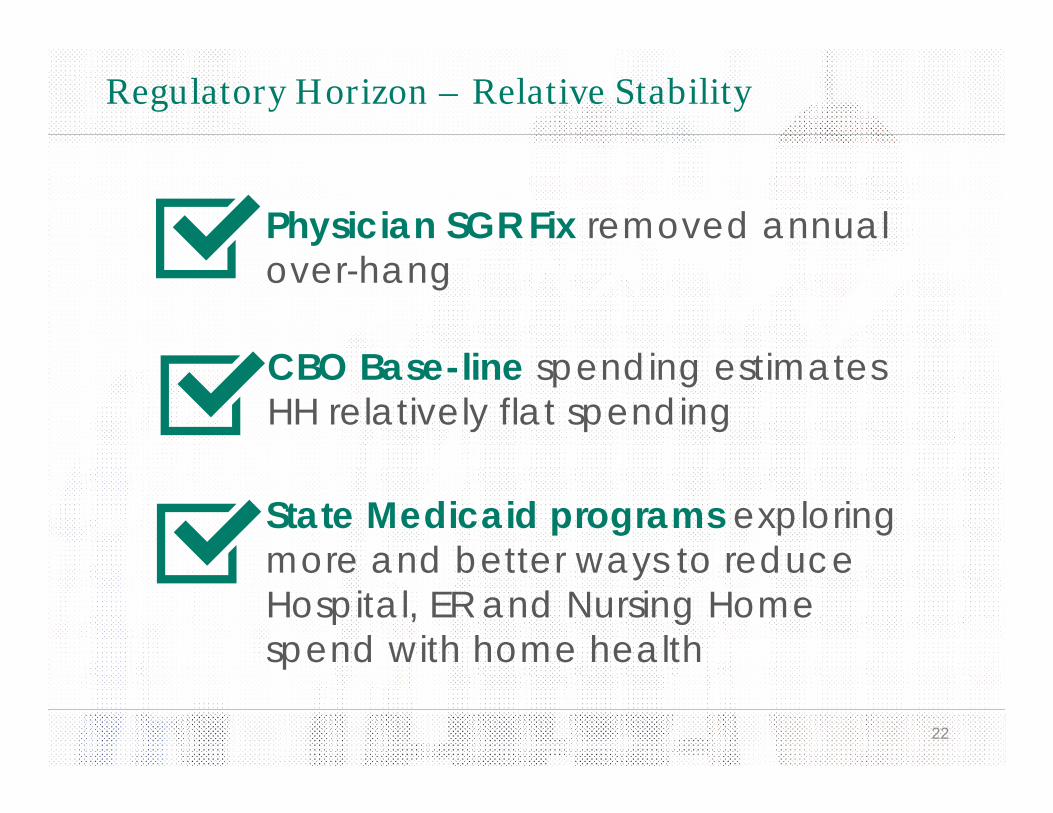
Regulatory Horizon – Relative Stability
22
Physician SGR Fix removed annual over-hang
State Medicaid programs exploring more and better ways to reduce Hospital, ER and Nursing Home spend with home health
CBO Base-line spending estimates HH relatively flat spending

Why AFAM?
23
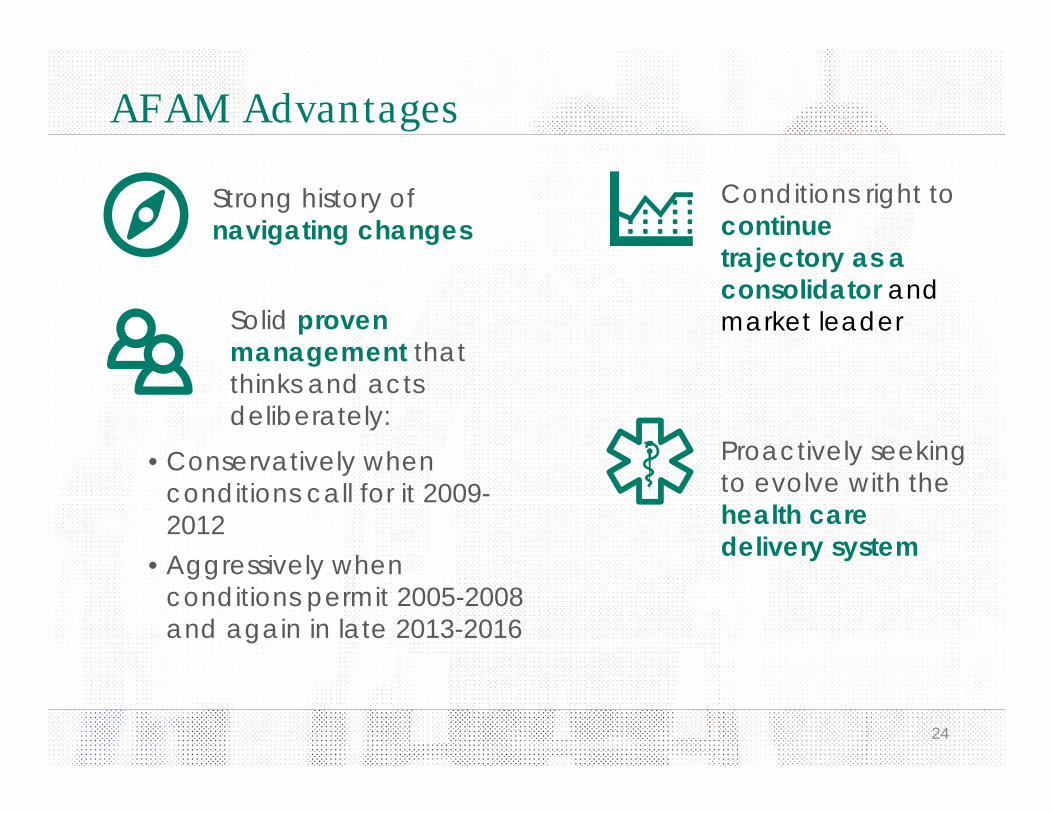
AFAM Advantages
24
Branches: 58
Strong history of navigating changes
Solid proven management that thinks and acts deliberately:
Conditions right to continue trajectory as a consolidator and market leader
Proactively seeking to evolve with the health care delivery system
• Conservatively when conditions call for it 2009-2012
• Aggressively when conditions permit 2005-2008 and again in late 2013-2016
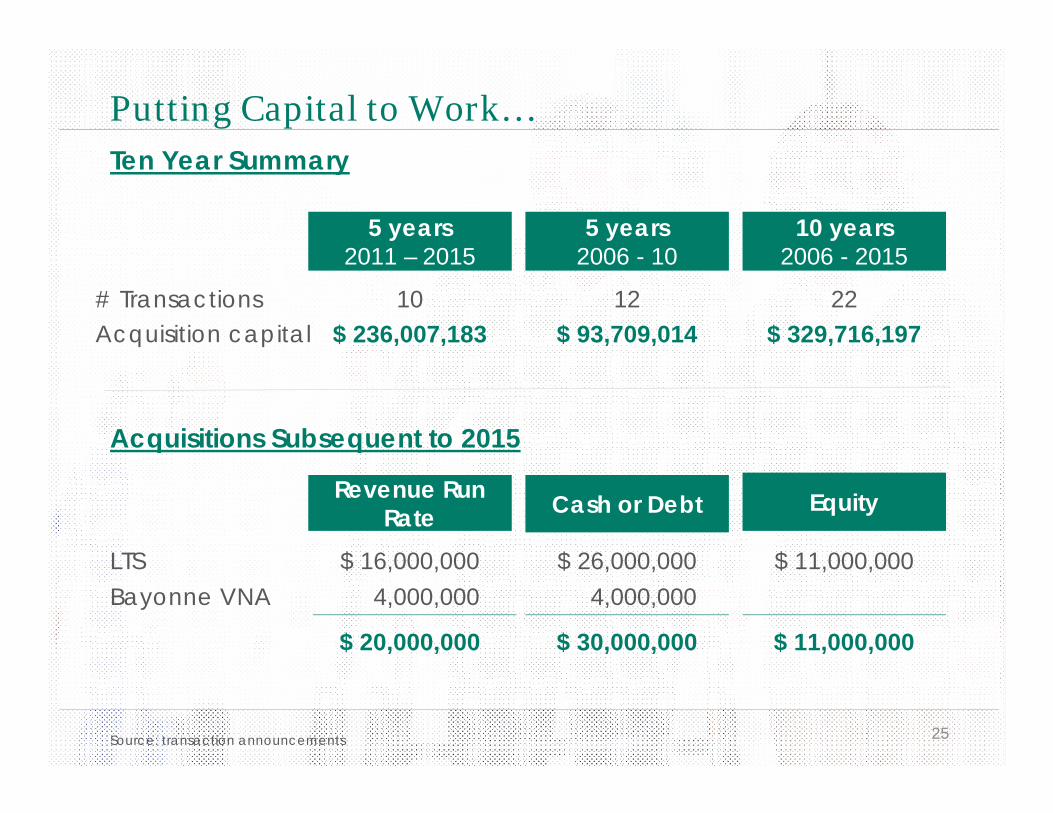
Putting Capital to Work…
25
Ten Year Summary
5 years2011 – 2015
5 years2006 - 10
10 years2006 - 2015
# TransactionsAcquisition capital
10$ 236,007,183
12$ 93,709,014
22$ 329,716,197
Acquisitions Subsequent to 2015
Revenue Run Rate Cash or Debt Equity
LTSBayonne VNA
$ 16,000,0004,000,000
$ 26,000,0004,000,000
$ 11,000,000
$ 20,000,000 $ 30,000,000 $ 11,000,000
Source: transaction announcements
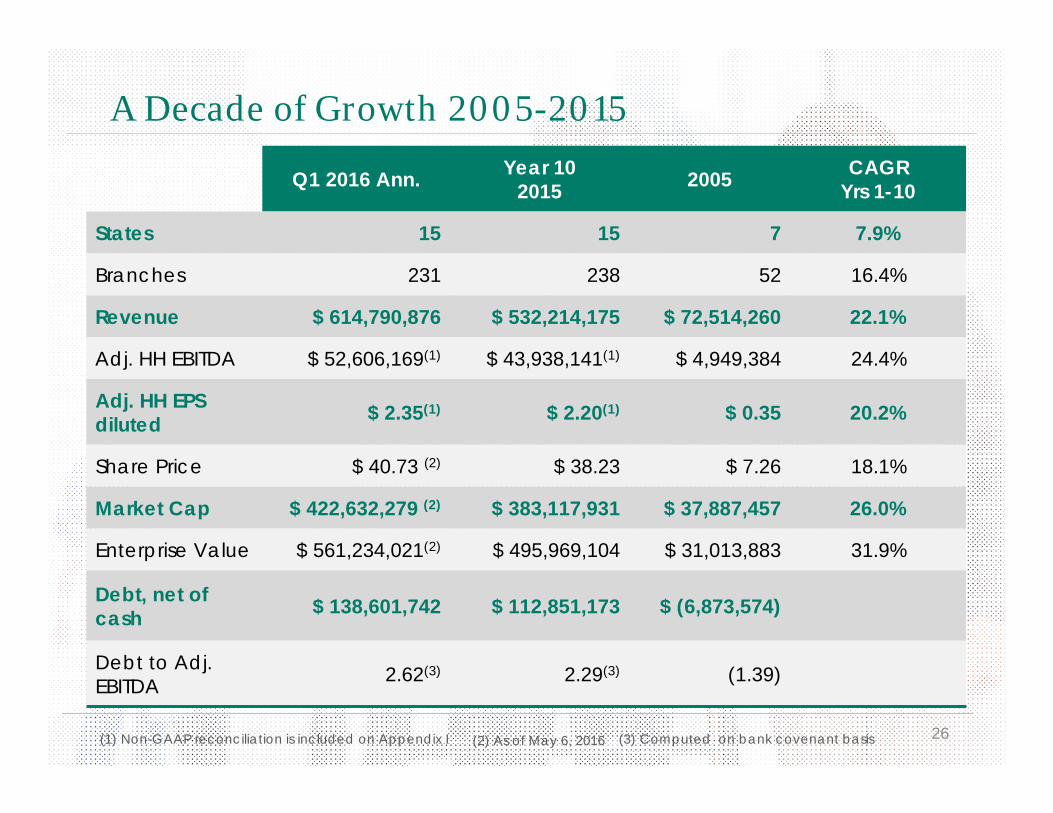
A Decade of Growth 2005-2015
26
Q1 2016 Ann. Year 102015 2005 CAGR
Yrs 1-10
States 15 15 7 7.9%
Branches 231 238 52 16.4%
Revenue $ 614,790,876 $ 532,214,175 $ 72,514,260 22.1%
Adj. HH EBITDA $ 52,606,169(1) $ 43,938,141(1) $ 4,949,384 24.4%
Adj. HH EPS diluted $ 2.35(1) $ 2.20(1) $ 0.35 20.2%
Share Price $ 40.73 (2) $ 38.23 $ 7.26 18.1%
Market Cap $ 422,632,279 (2) $ 383,117,931 $ 37,887,457 26.0%
Enterprise Value $ 561,234,021(2) $ 495,969,104 $ 31,013,883 31.9%
Debt, net of cash $ 138,601,742 $ 112,851,173 $ (6,873,574)
Debt to Adj. EBITDA 2.62(3) 2.29(3) (1.39)
(3) Computed on bank covenant basis(2) As of May 6, 2016(1) Non-GAAP reconciliation is included on Appendix I
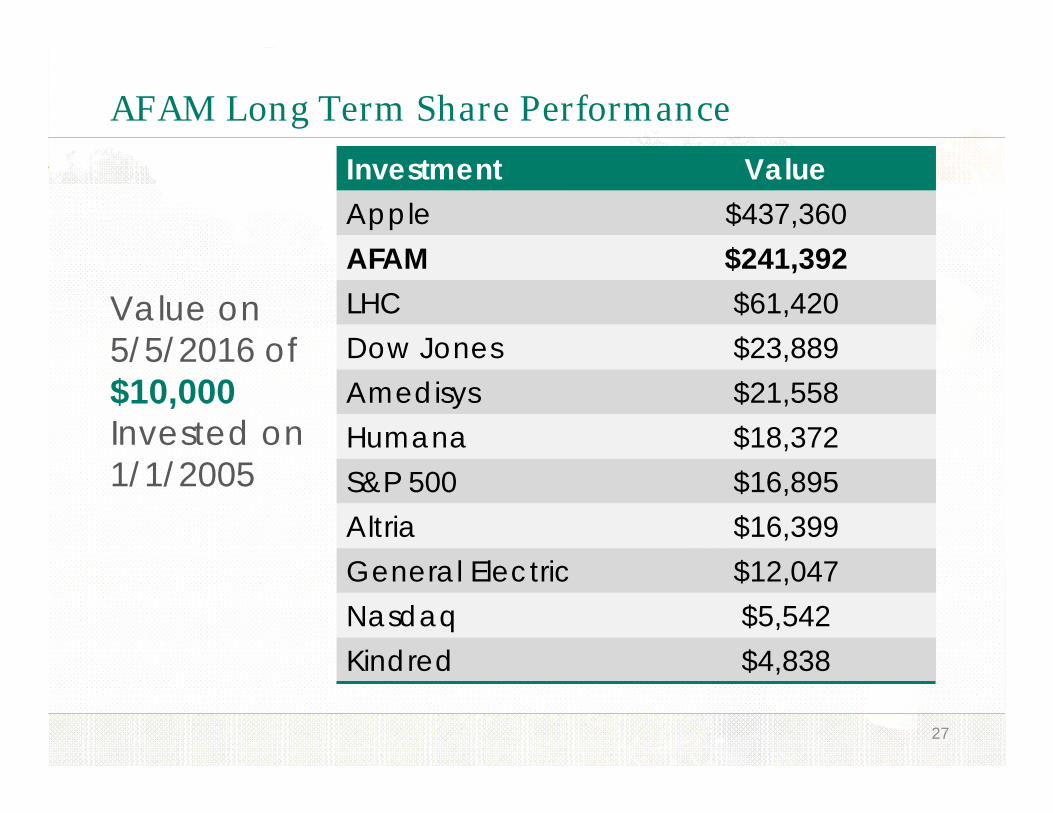
AFAM Long Term Share Performance
27
Investment ValueApple $437,360AFAM $241,392LHC $61,420Dow Jones $23,889Amedisys $21,558Humana $18,372S&P 500 $16,895Altria $16,399General Electric $12,047Nasdaq $5,542Kindred $4,838
Value on 5/5/2016 of $10,000 Invested on 1/1/2005
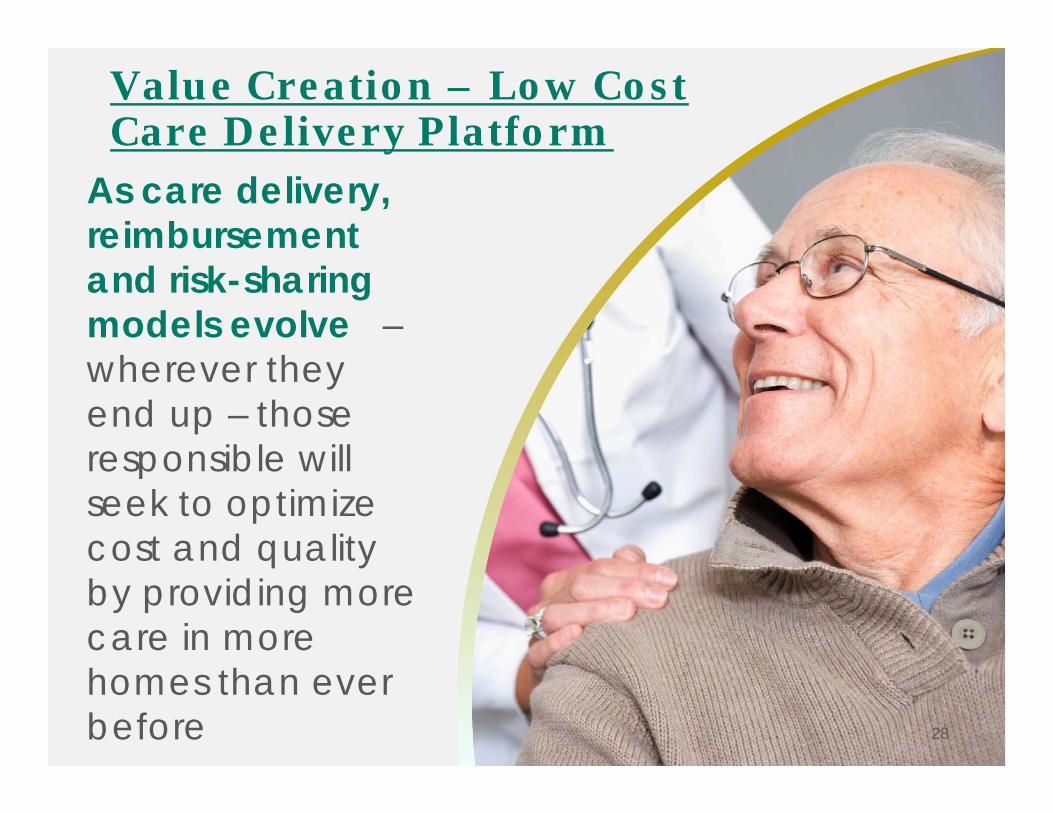
Value Creation – Low Cost Care Delivery Platform
28
As care delivery, reimbursement and risk-sharing models evolve –wherever they end up – those responsible will seek to optimize cost and quality by providing more care in more homes than ever before
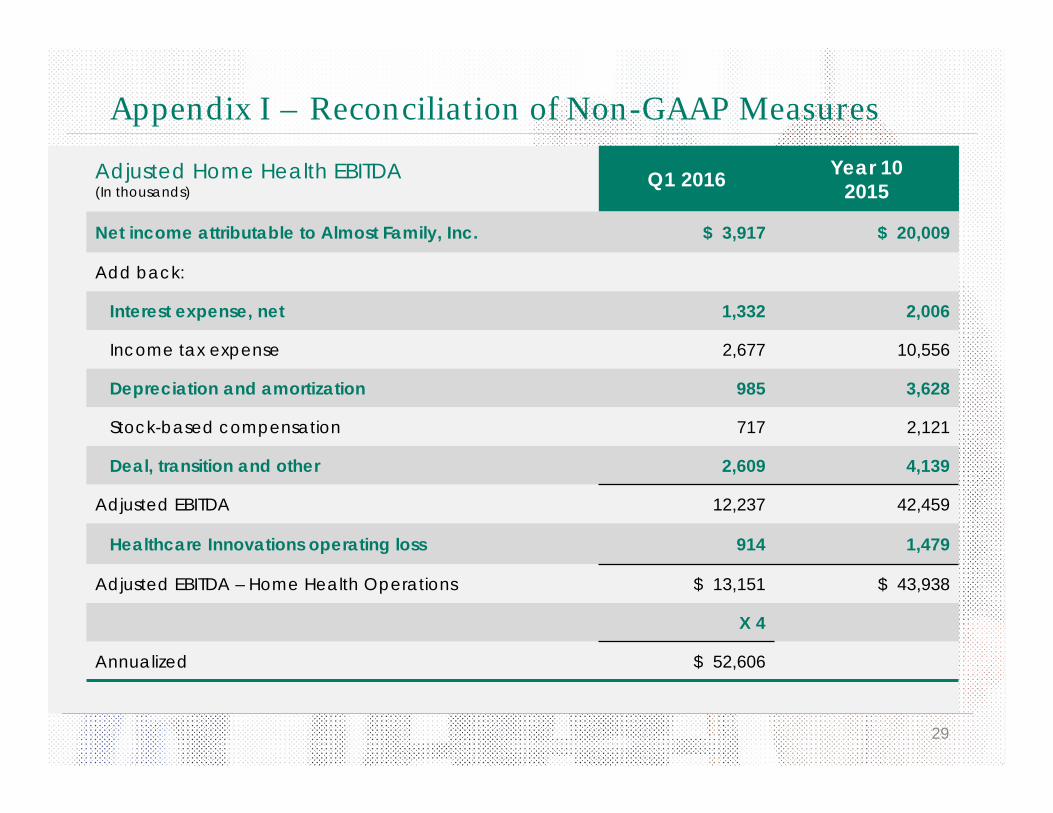
Appendix I – Reconciliation of Non-GAAP Measures
29
Adjusted Home Health EBITDA(In thousands)
Q1 2016 Year 102015
Net income attributable to Almost Family, Inc. $ 3,917 $ 20,009
Add back:
Interest expense, net 1,332 2,006
Income tax expense 2,677 10,556
Depreciation and amortization 985 3,628
Stock-based compensation 717 2,121
Deal, transition and other 2,609 4,139
Adjusted EBITDA 12,237 42,459
Healthcare Innovations operating loss 914 1,479
Adjusted EBITDA – Home Health Operations $ 13,151 $ 43,938
X 4
Annualized $ 52,606
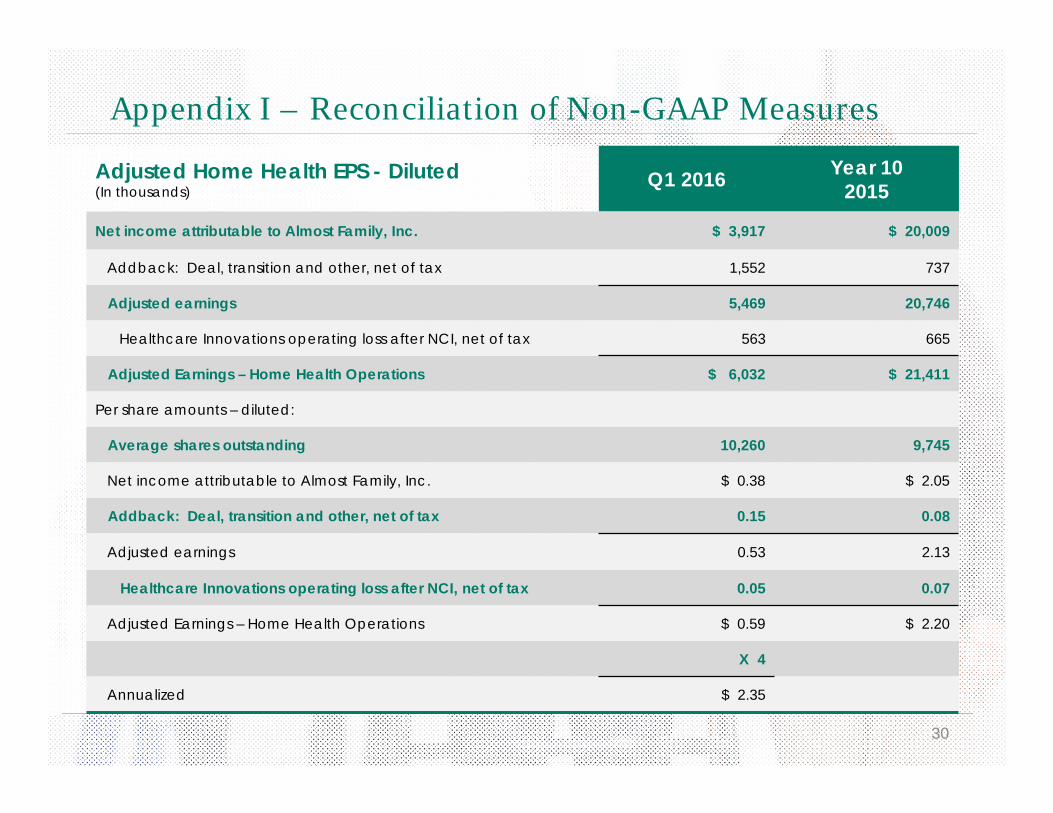
Appendix I – Reconciliation of Non-GAAP Measures
30
Adjusted Home Health EPS - Diluted(In thousands)
Q1 2016 Year 102015
Net income attributable to Almost Family, Inc. $ 3,917 $ 20,009
Addback: Deal, transition and other, net of tax 1,552 737
Adjusted earnings 5,469 20,746
Healthcare Innovations operating loss after NCI, net of tax 563 665
Adjusted Earnings – Home Health Operations $ 6,032 $ 21,411
Per share amounts – diluted:
Average shares outstanding 10,260 9,745
Net income attributable to Almost Family, Inc. $ 0.38 $ 2.05
Addback: Deal, transition and other, net of tax 0.15 0.08
Adjusted earnings 0.53 2.13
Healthcare Innovations operating loss after NCI, net of tax 0.05 0.07
Adjusted Earnings – Home Health Operations $ 0.59 $ 2.20
X 4
Annualized $ 2.35