Embed Size (px)
Citation preview

FIN-673-001 Revised February 28, 2005 American University
_____________________________________________________________________________________
Dario Canal, Natalija Lovric, Scott Macdonald, Nhien Pham, graduate students at Kogod School of Busi-ness, prepared this case under the supervision of Professor Robert Hauswald as the basis for class discus-sion rather than to illustrate either effective or ineffective handling of an administrative situation.
© Robert B.H. Hauswald, Kogod School of Business, American University, Washington, DC 20016-8044. To order copies or request permission for reproduction, please send email to [email protected]. No part of this publication may be reproduced in any form or by any means, or used without prior consent.
Bank of America and FleetBoston Financial: The Bigger, the Better, the more Profitable?
On a a typical New-England summer morning in 2003, Charles “Chad” Gifford, the chief executive officer of FleetBoston Financial (“Fleet”), and Kenneth Lewis, the chief execu-tive officer of Bank of America (“BofA”), gathered for a “business meeting” at The Country Club in Brookline, Massachusetts. Five hours after the meeting “teed off,” Gif-ford lined up a putt on the eighteenth hole. Lewis, disinterested in the outcome of the putt, was instead anxious to return to BofA’s corporate headquarters in Charlotte, North Carolina. Lewis had been able to obtain from Gifford during the round a “back of the scorecard” agreement to explore the combination of Fleet and BofA into the third largest bank in the United States.
Gifford, in the following weeks, reviewed other recent merger inquiries for Fleet from several large banks, including Citigroup, Bank One, Wachovia, and U.S. Bancorp.1 One of Fleet’s most pressing problems was its significant credit exposure to developing countries and failed companies, most notably Argentina and Enron Corporation, that had led to a significant rise in loan-loss provisions.2 Given the deteriorating strength of its balance sheet, Gifford knew that a merger with a healthy rival offered many advantages. “It is increasingly clear that scale is a tremendous advantage [in banking], if properly managed,” Gifford remarked at the time.3 “We do not have the scale of other banks.”4
To Chad Gifford’s relief, Ken Lewis continued to actively pursue a Fleet and BofA combination. “If you want to be in Boston, southern New England, and New York, there is no other single road to that destination.” Lewis explained.5 Wall Street had long worried about BofA’s lacking presence in this region. As an analyst remarked about the possible combination of the two banks: “The northeast United States is the biggest hole in BofA’s footprint, and [such a deal] fills it.”6 In addition to geographic diversification, BofA would gain portfolio diversification, scale and scope economies, product substitu-tions, and credit-risk improvements. As a result, BofA was working to act fast to add Fleet to its “fortress franchise.”7
Bank of America and FleetBoston Financial FIN-04-002
2
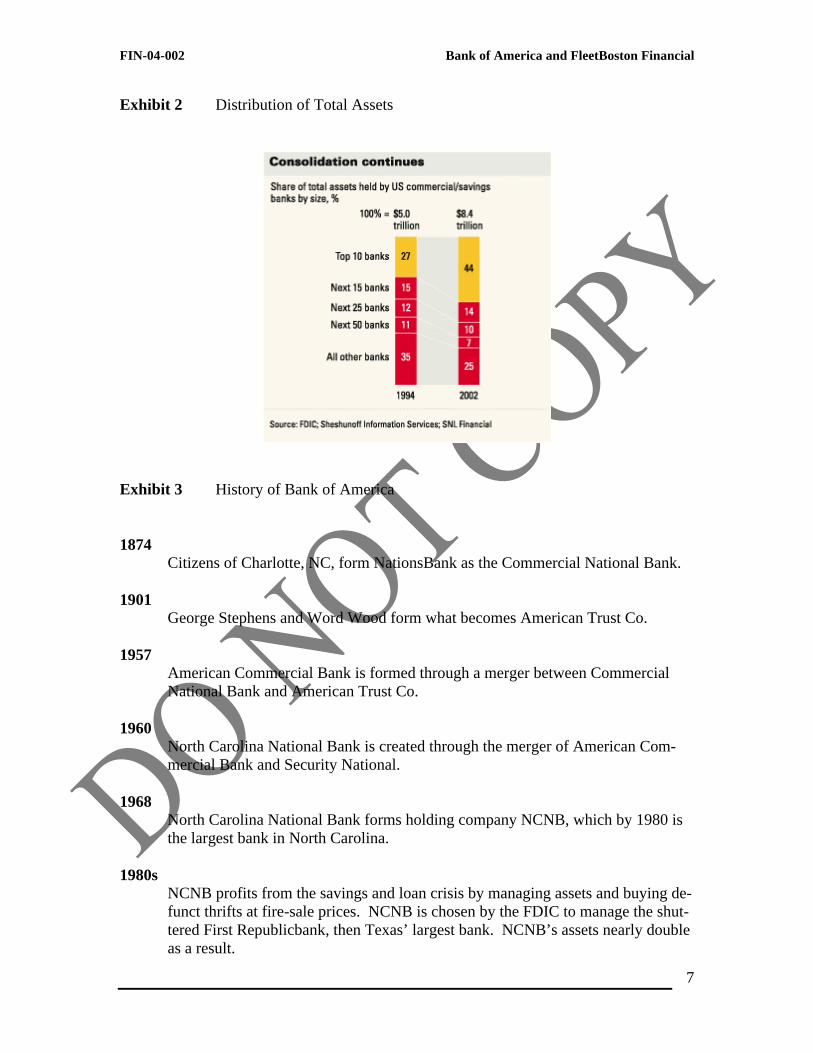
Recent Industry Trends: The Long Road to Consolidation Mergers and acquisitions have played an important role in the consolidation of the frag-mented US banking industry reducing the number of banks from 15,416 in 1984 to 8,191 in 2001, a drop of almost 47 percent.8 In the recent past, this trend seems to have accel-erated because the banking industry experienced a sequence of mega-mergers starting in 1995 when acquisitions reached a then $73bn record in value. As a result, the top ten banks in the United States increased their holdings of deposits from 27 percent in 1994 to 44 percent in 2002.9
The most recent merger wave seems to have primarily been driven by a desire “to
achieve substantial economies of scale by exploiting technology and deregulation.”10 Both the Riegle-Neal Interstate Banking and Branching Efficiency Act of 1994 that per-mitted bank holding companies to acquire banks in any state11 and the Financial Mod-ernization Act of 1999, also known as the Gramm-Leach-Bliley Act, were instrumental in bringing about a favorable regulatory environment by abolishing old geographic or prod-uct limitation dating back to the Great-Depression era. Prior to the former’s enactment, mergers between Bank of America and NationsBank, and Norwest and Wells Fargo would have not taken place.12 Similarly, without the latter mergers between investment and commercial banks such as Citigroup’s and Salomon Bros. would have stood on shaky regulatory grounds.
Overall, merger activity in the 1990s seems to have offered significant profit po-
tential to the fragmented banking industry. Observers estimate that the value of the gen-erated cost and revenue synergies ranged from 30 to 100 percent of the seller’s net in-come. Simultaneously, technology allowed for more efficient consolidation of branches.13 However, given that the most promising transactions typically take place early in merger waves, it is unclear whether banks can still expect to realize similar levels of synergy gains as in the past. While second- and third-tier banks might still be able to achieve the same cost savings from consolidation, industry observers have long expressed doubts about large banks’ ability to do so.14
Given the more concentrated nature of today’s banking industry, geographic over-
lap and significant economies of scale or scope are not automatic in combinations among the larger institutions. Most leading banks’ scale appears sufficiently large to support their IT systems, branding, credit exposure, trading activities, and product-development costs over the next few years. However, the lack of additional scale economies does not seem to deter M&A activity in the industry. The anti-trust rule that no bank can hold more than 10 percent of the nation’s deposits still leaves the top 20 or 25 players with substantial acquisition opportunities to create two or three truly national banks that ob-servers expected to emerge ever since the Riegle–Neal Act’s passage.
Middle-tier regional banks, some of which have survived and prospered without
significant acquisitions, still have a lot to gain from consolidation. Given their strong geographic concentration, the rationale supporting big-bank mergers during the 1990s is still valid for such institutions.15 As George Norman, a business economics professor at Tufts University, puts it, a deal between BofA and Fleet “could unleash a series of copy-

FIN-04-002 Bank of America and FleetBoston Financial
3
cats as national banking companies seek regional merger partners to extend their reaches.”16 In particular, such a transaction could herald the return of the heady days of the late 1990s and initiate a new wave of consolidation after a quieter period following the collapse of shareprices in the banking sector. “It’s not taking us back to those days, but it is certainly an indication of optimism,” says Norman.17
In a similar vein, Tim Ghirskey, president of Ghirskey Capital Management, ex-
pects that a deal between BofA and Fleet would add pressure on Citigroup and J.P. Mor-gan to make acquisitions of their own.18 A BofA and Fleet combination would take Fleet “off the trading block” and prevent an acquisition by BofA’s top competitors. Econo-mists, however, have long taken a less sanguine view of the likely success of such merg-ers:
“A frequent justification for mergers is that they reduce costs and improve operat-ing efficiency, which in turn increases shareholder returns.19 As discussed earlier, the empirical support for this claim in the existing research on bank mergers is weak. [A number of studies] all find that there are typically no cost efficiencies resulting from bank mergers. When costs fall, it is often because banks shed as-sets after mergers.”20
At the same time, empirical evidence suggests that a CEO’s compensation increases significantly even after accounting for the typical decline of the merger partners’ stock price following the announcement of the transaction. Although this fall in stock prices lowers both the existing wealth and subsequent salary gains of executives, “these losses are offset by the increase in CEO compensation from the effect of the merger on bank size… The net result is that even mergers which reduce shareholder value can be in a manager’s private interest”.21
The Partners22, 23 In an influential article, Berger, Demsetz, and Strahan (1999) identified five factors of change in the banking industry: technological progress, deregulation, excess capacity, international consolidation of markets, and the improved financial condition of the bank-ing industry.24 While “the major driver of future change will undoubtedly continue to be technological changes,”25 the transaction between BofA and Fleet exemplifies how the emergence of mega-banks has created its own logic for consolidation. In particular, BofA and Fleet might view consolidation as a way to better compete on a national level against large global players such as Citigroup and JP Morgan/Bank One. For BofA, the Fleet transaction represents the opportunity to reclaim a top spot in the league tables as the second largest bank in the United States. For Fleet, selling out to BofA when its home-made problems have not yet assumed crisis proportions offers its shareholders an enticing exit strategy and saves them from the fate of many a regional bank that has faded to obscurity only to be acquired as a last resort at firesale prices fol-lowing the deterioration of its loan portfolio.

Bank of America and FleetBoston Financial FIN-04-002
4
Bank of America BofA26 is currently the third-largest bank in the United States by assets behind Citigroup and J.P. Morgan Chase, and ahead of hometown competitor Wachovia. With more than 5,700 locations covering two-dozen states and the District of Columbia, BofA currently has the country’s most extensive branch network ahead of Citigroup.27
BofA operates in all three major business segments of modern banking: (i) con-
sumer and commercial banking; (ii) global corporate and investment banking; and (iii) asset management.28 Consumer and commercial banking still represents the largest seg-ment revealing the bank’s roots as a West-Coast commercial bank. It competes in these traditional markets by providing credit cards, loans, deposit products, insurance, treasury services, and financings of car, boat, and recreational vehicle dealerships. BofA, which is the market leader in California, Florida, Maryland, and Washington State, is spending more than $150 million on consumer deposit advertising and is extending its branch net-work, particularly in California, Florida, and Texas.29
Global corporate and investment banking, including subsidiary Banc of America
Securities, is a younger line of business born from the deregulation of the 1990s and a string of acquisitions of investment-banking boutiques together with significant internal growth and investments in building a credible investment-banking franchise. Primarily through its Banc of America Securities subsidiary, BofA offers brokerage, advisory, and capital markets services to corporate and institutional clients.
Asset management serves institutional investors and high-net-worth individuals,
and manages the group’s mutual fund division, NationsFunds.30 FleetBoston Financial Fleet31 is one of the ten largest banks in the United States, operating approximately 1,500 branches in the Northeast through its main subsidiary, Fleet National Bank.32 Itself the product of a merger between two home-town rivals, it operates 250 offices in over twenty-four countries, with a significant presence in Latin America where it offers its services as BancBoston.
In addition to engaging in traditional retail and commercial banking, Fleet is one
of the largest loan service providers in the country, especially for credit cards and resi-dential mortgages.33 Subsidiaries of Fleet include asset manager Columbia Management, discount brokerage Quick & Reilly, and private-equity investment boutiques BancBoston Ventures and BancBoston Capital. The bank’s Fleet Specialist unit was a leading market maker in shares listed on the New York Stock Exchange.34
FIN-04-002 Bank of America and FleetBoston Financial
5
The Bigger, The Better? BofA’s business strategy has always focused on scale and market dominance in the re-gions that it chooses to compete in. With the Fleet acquisition the combined entity will leapfrog past J.P. Morgan Chase to become the nation’s second-largest bank behind Citi-group. In particular, the new BofA will have a 9.8% share of all banking deposits in the United States, which almost reaches the magic 10% ceiling under anti-trust regulation. The bank will also rank among the top three institutions in terms of market share in 21 of the 29 states in which it will have a presence; similarly, it will occupy one of the three top spots in 23 of the nation’s 30 fastest growing metropolitan areas.35 With FleetBoston, BofA will have a business relationship with one out of every three U.S. households.
BofA’s management clearly hopes that greater scale will secure BofA’s position atop the league tables and help it to defend market share against new entrants and new prod-ucts over the long-term. The merger is expected to improve the bank’s geographic and product diversification and thereby reduce the loan losses and, ultimately, its own prob-ability of insolvency. As Eloise Hale, a BofA spokeswoman observes: “The broader the diversity, the larger the revenue stream and the better to manage the risk. We weathered the last economic downturn due to our diverse business mix.”36
In addition to the diversification gains that Bank of America could hope to realize
from a New-England presence, the merger would also allow the combined bank to cut after-tax expenses by an expected $1.1 billion annually, which is equivalent to 6% of the combined base or 27% of Fleet’s expense base, with a one-time after-tax restructuring charge of approximately $800 million.37 While the cost-cutting expectations are at the high end of the range of other bank mergers, the target seems achievable in light of the considerable overlap in expenses.38
The Decision Facing Fleet On Saturday, October 25, 2003, Chad Gifford and Ken Lewis attended a lunch meeting at the midtown Manhattan law offices of Wachtell, Lipton, Rosen & Katz, BofA’s outside counsel.39 The meeting was called by BofA to finalize terms for a “merger of equals” between Fleet and BofA. At the start of the meeting, Gifford looked again at the final term sheet at the center of the conference-room table. After months of negotiations, the parties had arrived at a deal that value Fleet at $47 billion in BofA stock, representing a 40% premium over its market value.
Despite the hefty premium, Gifford had misgivings in light of the intense interest Fleet had generated once its board had been put the company “in play.” However, was it worthwhile to not sign and hope a better deal would materialize? What if Ken Lewis were to call his bluff now and here? Would BofA be willing to renegotiate the “final” term sheet yet again? Ultimately, it all came down to whether the price is right but is a 40% premium really acceptable to Fleet in exchange for its independence?
Bank of America and FleetBoston Financial FIN-04-002
6
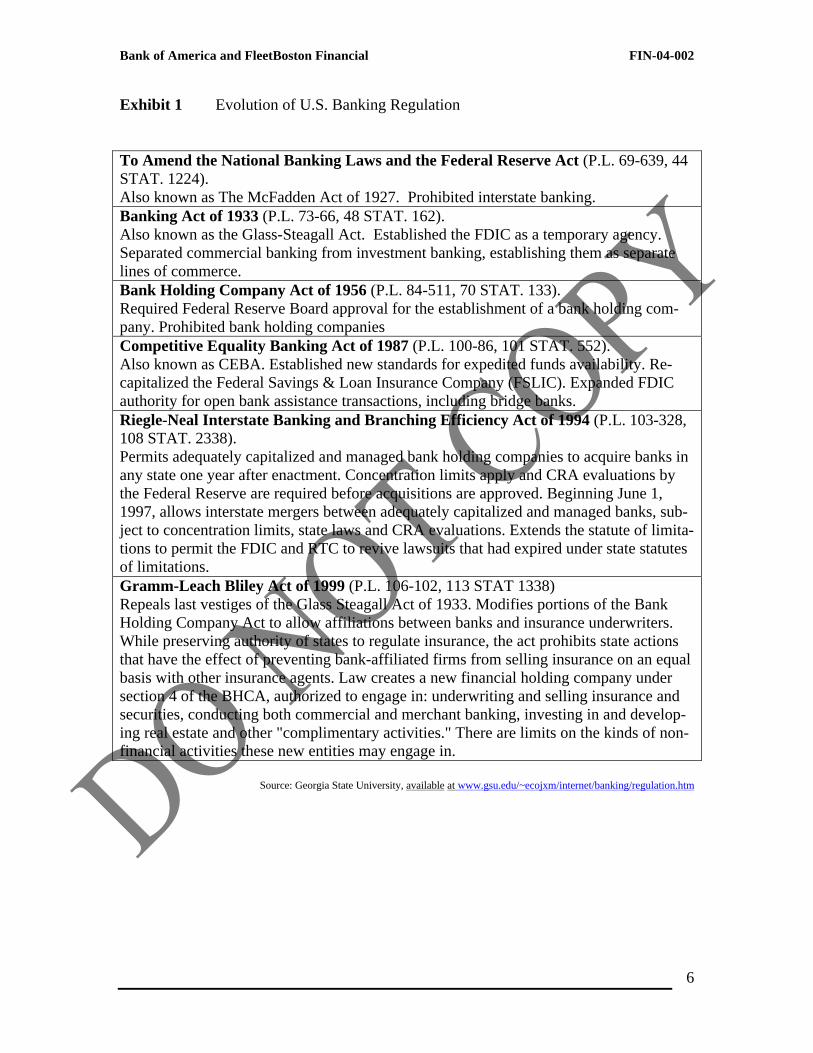
Exhibit 1 Evolution of U.S. Banking Regulation To Amend the National Banking Laws and the Federal Reserve Act (P.L. 69-639, 44 STAT. 1224). Also known as The McFadden Act of 1927. Prohibited interstate banking. Banking Act of 1933 (P.L. 73-66, 48 STAT. 162). Also known as the Glass-Steagall Act. Established the FDIC as a temporary agency. Separated commercial banking from investment banking, establishing them as separate lines of commerce. Bank Holding Company Act of 1956 (P.L. 84-511, 70 STAT. 133). Required Federal Reserve Board approval for the establishment of a bank holding com-pany. Prohibited bank holding companies Competitive Equality Banking Act of 1987 (P.L. 100-86, 101 STAT. 552). Also known as CEBA. Established new standards for expedited funds availability. Re-capitalized the Federal Savings & Loan Insurance Company (FSLIC). Expanded FDIC authority for open bank assistance transactions, including bridge banks. Riegle-Neal Interstate Banking and Branching Efficiency Act of 1994 (P.L. 103-328, 108 STAT. 2338). Permits adequately capitalized and managed bank holding companies to acquire banks in any state one year after enactment. Concentration limits apply and CRA evaluations by the Federal Reserve are required before acquisitions are approved. Beginning June 1, 1997, allows interstate mergers between adequately capitalized and managed banks, sub-ject to concentration limits, state laws and CRA evaluations. Extends the statute of limita-tions to permit the FDIC and RTC to revive lawsuits that had expired under state statutes of limitations. Gramm-Leach Bliley Act of 1999 (P.L. 106-102, 113 STAT 1338) Repeals last vestiges of the Glass Steagall Act of 1933. Modifies portions of the Bank Holding Company Act to allow affiliations between banks and insurance underwriters. While preserving authority of states to regulate insurance, the act prohibits state actions that have the effect of preventing bank-affiliated firms from selling insurance on an equal basis with other insurance agents. Law creates a new financial holding company under section 4 of the BHCA, authorized to engage in: underwriting and selling insurance and securities, conducting both commercial and merchant banking, investing in and develop-ing real estate and other "complimentary activities." There are limits on the kinds of non-financial activities these new entities may engage in.
Source: Georgia State University, available at www.gsu.edu/~ecojxm/internet/banking/regulation.htm
FIN-04-002 Bank of America and FleetBoston Financial
7
Exhibit 2 Distribution of Total Assets
Exhibit 3 History of Bank of America 1874 Citizens of Charlotte, NC, form NationsBank as the Commercial National Bank. 1901 George Stephens and Word Wood form what becomes American Trust Co. 1957
American Commercial Bank is formed through a merger between Commercial National Bank and American Trust Co.
1960
North Carolina National Bank is created through the merger of American Com-mercial Bank and Security National.
1968
North Carolina National Bank forms holding company NCNB, which by 1980 is the largest bank in North Carolina.
1980s
NCNB profits from the savings and loan crisis by managing assets and buying de-funct thrifts at fire-sale prices. NCNB is chosen by the FDIC to manage the shut-tered First Republicbank, then Texas’ largest bank. NCNB’s assets nearly double as a result.

Bank of America and FleetBoston Financial FIN-04-002
8
1991 NCNB becomes NationsBank. 1993
NationsBank buys Chicago Research & Trading, a government securities dealer and provider of oil and gas financing. A joint venture effort with Dean Witter, Discover to open securities brokerages in banks leads to complaints as customers claim to not have been fully informed of the risks of some investments and that brokers were paying rebates to banking personnel for customer referrals.
1994
Dean Witter leaves the joint venture and SEC investigations and a class-action lawsuit ensues, which will be settled for about $30 million the next year.
1997
NationsBank buys St. Louis based Boatmen’s Bancshares and Montgomery Secu-rities (now Banc of America Securities).
1998 NationsBank buys Barnett Banks, Florida’s #1 bank, as well as BankAmerica, once the largest U.S. bank.
1999
The Russian debacle and merger hiccups lead the firm in early 1999 to reorganize and reduce overseas operations, selling its private banking operations in Europe and Asia to UBS. NationsBank furthermore acquires the recreational-vehicle fi-nancing unit of Associates First Capital (now part of Citigroup), 50% of Denver-based mutual fund firm Marsico Capital Management (the rest will be bought in 2001), and BA Merchant Services. NationsBank is renamed Bank of America. Customers now receive the choice of online banking through the bank’s relation-ship with AOL The company runs into problems with labor officials for a pro-gram in which employees were recruited to maintain ATMs without being paid or provided supplies.
2000 EVP Frank Gentry, the man behind the NationsBank / BankAmerica deal, retires, ending the company’s buying spree.
2001 The company announces to cease its subprime lending and car leasing operations.
Source: www.hoovers.com

FIN-04-002 Bank of America and FleetBoston Financial
9
Exhibit 4 Bank of America U.S. Locations
Source: Bank of America Fact Sheet 3Q 2003
Exhibit 5 Revenue Distribution by Business Segments 2003
Source: Bank of America and FleetBoston Financial Presentation: Creating America’sPremier Financial Services Company http://www.snl.com/cache/1500000699.pdf
Bank of America and FleetBoston Financial FIN-04-002
10
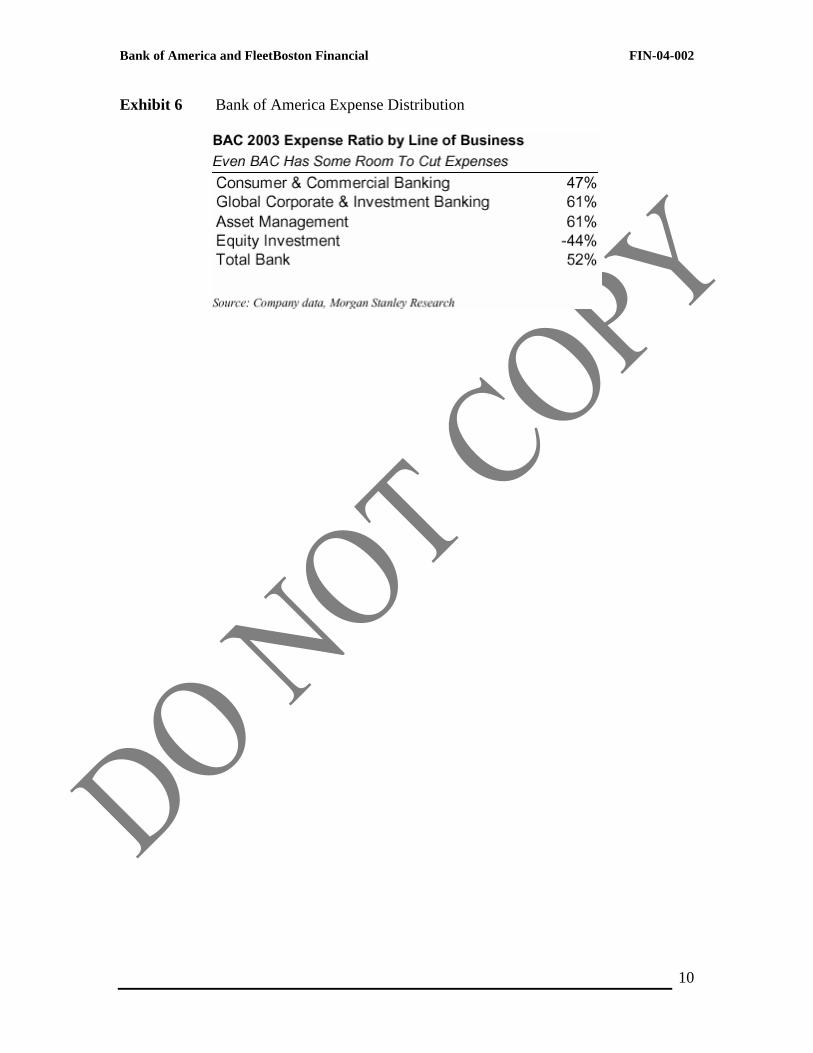
Exhibit 6 Bank of America Expense Distribution

FIN-04-002 Bank of America and FleetBoston Financial
11
Exhibit 7 BofA Balance Sheet (1999-2003)
Source: MERGENT Online
As Reported Annual Balance Sheet 12/31/1999 12/31/2000 12/31/2001 12/31/2002 9/30/2003Currency USD USD USD USD USDScale Millions Millions Millions Millions Millions
Cash & cash equivalents 26,989 27,513 26,837 24,973 22,142Time deposits placed & oth short-term invests 4,838 5,448 5,932 6,813 6,881Fed funds sold & sec purch under resale agree 37,928 28,055 28,108 44,878 67,729Trading account assets 38,460 43,041 47,344 63,996 65,339Derivative assets 16,055 15,534 22,147 34,310 36,810Securities available for sale 81,647 64,651 84,450 68,122 64,363Securities held-to-maturity, at cost 1,422 1,187 1,049 1,026 522Total securities 83,069 65,838 85,499 69,148 64,885Commercial - domestic 143,450 146,040 118,205 105,053 94,870Commercial - foreign 27,978 31,066 23,039 19,912 17,097Commercial real estate - domestic 24,026 26,154 22,271 19,910 19,377Commercial real estate - foreign 325 282 383 295 305Total commercial 195,779 203,542 163,898 145,170 131,649Residential mortgage 81,860 84,394 78,203 108,197 146,424Home equity lines 17,273 21,598 22,107 23,236 22,675Direct/indirect consumer 42,161 40,457 37,638 31,068 33,391Consumer finance 22,326 25,800 5,331 8,384 6,020Credit card 9,019 14,094 19,884 24,729 30,993Foreign consumer 2,244 2,308 2,092 1,971 1,946Total consumer 174,883 188,651 165,255 197,585 241,449Loans & leases 370,662 392,193 329,153 342,755 373,098Allowance for credit losses 6,828 6,838 6,875 6,851 6,716Loans & leases, net of allow for credit loss 363,834 385,355 322,278 335,904 366,382Premises & equipment, net 6,713 6,433 6,414 6,717 5,956Customers' acceptance liability 1,869 - - - -Interest receivable 3,777 4,432 2,800 - -Mortgage banking assets 4,093 3,762 3,886 2,110 2,426Goodwill 12,262 11,643 10,854 11,389 11,456Core deposit intangibles & other intangibles 1,730 1,499 1,294 1,095 966Other assets 30,957 43,638 58,371 59,125 86,116Total assets 632,574 642,191 621,764 660,458 737,088Noninterest -bearing deposits in domestic off 93,476 98,722 112,064 122,686 122,669Interest-bearing deposits in domestic offices 207,048 211,978 220,703 232,320 257,586Non-interest bearing deposits in foreign off 1,993 1,923 1,870 1,673 2,650Interest bearing deposits in foreign offices 44,756 51,621 38,858 29,779 25,605Total deposits 347,273 364,244 373,495 386,458 408,510Fed funds purch & sec sold und agree to repur 74,561 49,411 47,727 65,079 79,775Trading account liabilities 20,958 20,947 19,452 25,574 29,744Derivative liabilities 16,200 22,402 14,868 23,566 25,120Commercial paper 7,331 6,955 1,558 - -Other short-term borrowings 40,340 35,243 20,659 - 41,739Commercial paper & other ST borrowings - - - 25,234 -Acceptances outstanding 1,869 - - - -Accrued expenses & other liabilities 19,169 22,859 27,459 17,052 35,293Long-term debt 55,486 67,547 62,496 61,145 66,462Trust preferred securities 4,955 4,955 5,530 6,031 -Total liabilities 588,142 594,563 573,244 610,139 686,643Preferred stock 77 72 65 58 55Common stock 11,671 8,613 5,076 496 15Retained earnings 35,681 39,815 42,980 48,517 52,320Accumulated other comprehensive income (loss) -2,658 -746 437 1,232 -1,776Other shareholders' equity -339 -126 -38 16 -169Total shareholders' equity 44,432 47,628 48,520 50,319 50,445
Bank of America and FleetBoston Financial FIN-04-002
12
Exhibit 8 BofA Income Statement (1999-2003)
Source: MERGENT Online
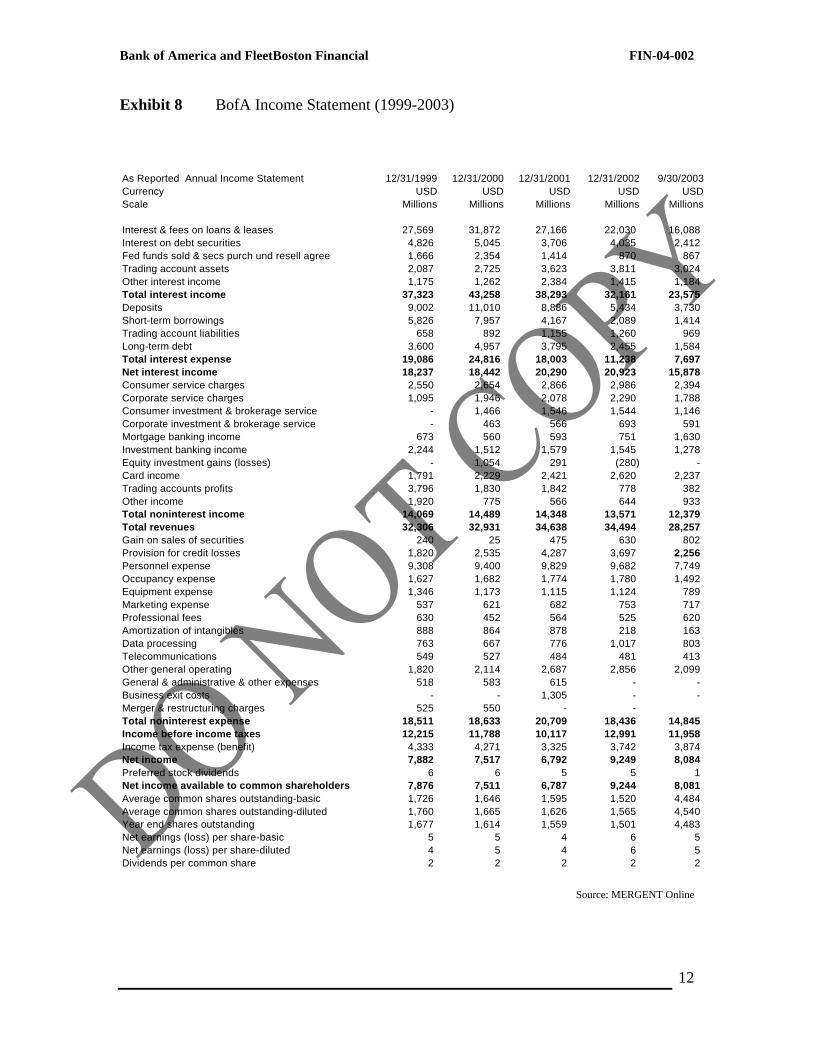
As Reported Annual Income Statement 12/31/1999 12/31/2000 12/31/2001 12/31/2002 9/30/2003Currency USD USD USD USD USDScale Millions Millions Millions Millions Millions
Interest & fees on loans & leases 27,569 31,872 27,166 22,030 16,088 Interest on debt securities 4,826 5,045 3,706 4,035 2,412 Fed funds sold & secs purch und resell agree 1,666 2,354 1,414 870 867 Trading account assets 2,087 2,725 3,623 3,811 3,024 Other interest income 1,175 1,262 2,384 1,415 1,184 Total interest income 37,323 43,258 38,293 32,161 23,575 Deposits 9,002 11,010 8,886 5,434 3,730 Short-term borrowings 5,826 7,957 4,167 2,089 1,414 Trading account liabilities 658 892 1,155 1,260 969 Long-term debt 3,600 4,957 3,795 2,455 1,584 Total interest expense 19,086 24,816 18,003 11,238 7,697 Net interest income 18,237 18,442 20,290 20,923 15,878 Consumer service charges 2,550 2,654 2,866 2,986 2,394 Corporate service charges 1,095 1,946 2,078 2,290 1,788 Consumer investment & brokerage service - 1,466 1,546 1,544 1,146 Corporate investment & brokerage service - 463 566 693 591 Mortgage banking income 673 560 593 751 1,630 Investment banking income 2,244 1,512 1,579 1,545 1,278 Equity investment gains (losses) - 1,054 291 (280) - Card income 1,791 2,229 2,421 2,620 2,237 Trading accounts profits 3,796 1,830 1,842 778 382 Other income 1,920 775 566 644 933 Total noninterest income 14,069 14,489 14,348 13,571 12,379 Total revenues 32,306 32,931 34,638 34,494 28,257 Gain on sales of securities 240 25 475 630 802 Provision for credit losses 1,820 2,535 4,287 3,697 2,256 Personnel expense 9,308 9,400 9,829 9,682 7,749 Occupancy expense 1,627 1,682 1,774 1,780 1,492 Equipment expense 1,346 1,173 1,115 1,124 789 Marketing expense 537 621 682 753 717 Professional fees 630 452 564 525 620 Amortization of intangibles 888 864 878 218 163 Data processing 763 667 776 1,017 803 Telecommunications 549 527 484 481 413 Other general operating 1,820 2,114 2,687 2,856 2,099 General & administrative & other expenses 518 583 615 - - Business exit costs - - 1,305 - - Merger & restructuring charges 525 550 - -Total noninterest expense 18,511 18,633 20,709 18,436 14,845 Income before income taxes 12,215 11,788 10,117 12,991 11,958 Income tax expense (benefit) 4,333 4,271 3,325 3,742 3,874 Net income 7,882 7,517 6,792 9,249 8,084 Preferred stock dividends 6 6 5 5 1 Net income available to common shareholders 7,876 7,511 6,787 9,244 8,081 Average common shares outstanding-basic 1,726 1,646 1,595 1,520 4,484 Average common shares outstanding-diluted 1,760 1,665 1,626 1,565 4,540 Year end shares outstanding 1,677 1,614 1,559 1,501 4,483 Net earnings (loss) per share-basic 5 5 4 6 5 Net earnings (loss) per share-diluted 4 5 4 6 5 Dividends per common share 2 2 2 2 2
FIN-04-002 Bank of America and FleetBoston Financial
13
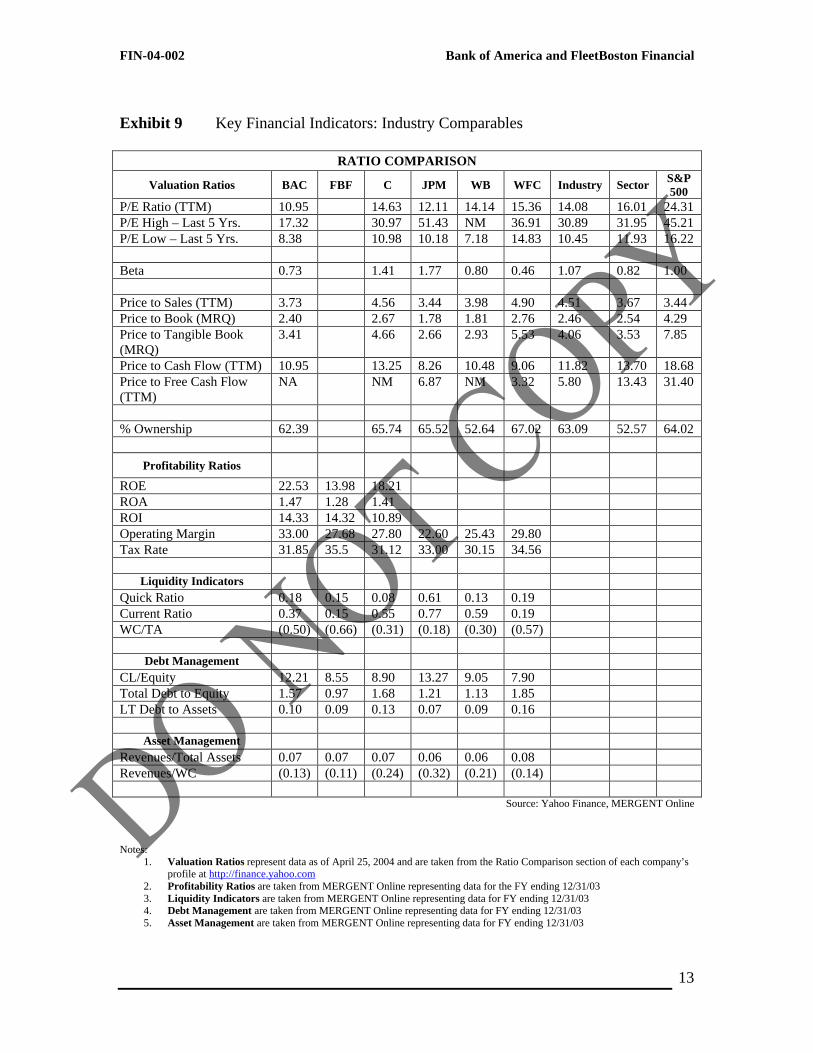
Exhibit 9 Key Financial Indicators: Industry Comparables
RATIO COMPARISON
Valuation Ratios BAC FBF C JPM WB WFC Industry Sector S&P 500
P/E Ratio (TTM) 10.95 14.63 12.11 14.14 15.36 14.08 16.01 24.31 P/E High – Last 5 Yrs. 17.32 30.97 51.43 NM 36.91 30.89 31.95 45.21 P/E Low – Last 5 Yrs. 8.38 10.98 10.18 7.18 14.83 10.45 11.93 16.22 Beta 0.73 1.41 1.77 0.80 0.46 1.07 0.82 1.00 Price to Sales (TTM) 3.73 4.56 3.44 3.98 4.90 4.51 3.67 3.44 Price to Book (MRQ) 2.40 2.67 1.78 1.81 2.76 2.46 2.54 4.29 Price to Tangible Book (MRQ)
3.41 4.66 2.66 2.93 5.53 4.06 3.53 7.85
Price to Cash Flow (TTM) 10.95 13.25 8.26 10.48 9.06 11.82 13.70 18.68 Price to Free Cash Flow (TTM)
NA NM 6.87 NM 3.32 5.80 13.43 31.40
% Ownership 62.39 65.74 65.52 52.64 67.02 63.09 52.57 64.02
Profitability Ratios
ROE 22.53 13.98 18.21 ROA 1.47 1.28 1.41 ROI 14.33 14.32 10.89 Operating Margin 33.00 27.68 27.80 22.60 25.43 29.80 Tax Rate 31.85 35.5 31.12 33.00 30.15 34.56
Liquidity Indicators Quick Ratio 0.18 0.15 0.08 0.61 0.13 0.19 Current Ratio 0.37 0.15 0.55 0.77 0.59 0.19 WC/TA (0.50) (0.66) (0.31) (0.18) (0.30) (0.57)
Debt Management CL/Equity 12.21 8.55 8.90 13.27 9.05 7.90 Total Debt to Equity 1.57 0.97 1.68 1.21 1.13 1.85 LT Debt to Assets 0.10 0.09 0.13 0.07 0.09 0.16
Asset Management Revenues/Total Assets 0.07 0.07 0.07 0.06 0.06 0.08 Revenues/WC (0.13) (0.11) (0.24) (0.32) (0.21) (0.14)
Source: Yahoo Finance, MERGENT Online Notes:
1. Valuation Ratios represent data as of April 25, 2004 and are taken from the Ratio Comparison section of each company’s profile at http://finance.yahoo.com
2. Profitability Ratios are taken from MERGENT Online representing data for the FY ending 12/31/03 3. Liquidity Indicators are taken from MERGENT Online representing data for FY ending 12/31/03 4. Debt Management are taken from MERGENT Online representing data for FY ending 12/31/03 5. Asset Management are taken from MERGENT Online representing data for FY ending 12/31/03

Bank of America and FleetBoston Financial FIN-04-002
14
Exhibit 10 History of FleetBoston 1791 FleetBoston is founded in Rhode Island as the Providence Bank. 1968
Providence Bank becomes a subsidiary of Industrial Bancorp, which specializes in loans to Northeastern jewelers.
1970s The bank acquires consumer finance and mortgage banking firms. 1980s
The company changes its name to Fleet Financial Group and Terrence Murray is named CEO in 1982. Trying to expand its banking operations outside of Rhode Island, the company buys a total of 46 companies in the 1980s, in addition to ac-quiring Conifer Group in 1986, and New York-based Norstar in 1988. Its name is changed to Fleet / Norstar. However, these acquisitions eventually lead the com-pany into a recession.
1991 Fleet buys the failed Bank of New England and a few others from the FDIC. 1992
The company goes back to its original name of Fleet Financial Group and makes six acquisitions in the New England region. A 60 Minutes report accuses Fleet with charging exorbitant home equity interest rates and fees to low-income minor-ity customers. As a result the company pays a large amount to affected customers in Georgia, as well as pumps a significant amount into low-income housing pro-grams.
1995
Fleet merges with Shawmut National Bank, doubling Fleet’s customer base and strengthens its presence in New Jersey and New York. However, organizational problems arise.
1996
Fleet Mortgage stops rewarding employees for making loans exceeding the com-pany’s base rates.
1997
Fleet divests its subprime lending operation and buys mutual fund company Co-lumbia Management.
1998

FIN-04-002 Bank of America and FleetBoston Financial
15
Trying to diversify its operations, Fleet buys Florida-based Quick & Reilly, the number 3 discount brokerage in the U.S. To compete with Citicorp’s consumer credit cards, Fleet buys three credit card portfolios, including Advanta; later suing Advanta for misrepresenting the terms of the deal. Fleet also buys Merrill Lynch Specialists and merges into its newly named Fleet Specialist.
1999 Fleet Financial buys Sanwa Bank’s U.S. business credit unit and its rival Bank-Boston, Boston area’s number 1 bank. The bank is now offering online banking to its customers through Quick & Reilly.
2000
The company sells 300 branches and announces 4,000 layoffs caused by the re-dundancies created through the mergers. FleetBoston consolidates its brokerage operations into Quick & Reilly and spins off its venture capital unit Fleet Equity Partners as Navis Partners. Late in 2000, the company acquires NYSE specialist firm M.J. Meehan & Co. and merges it with Fleet Specialist to establish Fleet Meehan Specialist.
2001
FleetBoston acquires New Jersey’s largest bank, Summit Bancorp, as well as the asset management operations of Liberty Financial. Murray resigns as CEO and Chad Gifford replaces him.
2002
The company is unable to sell its investment bank Robertson Stephens, costing the company $500 million. FleetBoston furthermore suffers from venture losses and from Argentina’s economic instability. Many top executives loose their job as bad loans and the Enron scandal negatively affect FleetBoston’s risk manage-ment department.
2004
Wanting to expand these banking operations in the Philadelphia area, the com-pany buys Progress Financial in February of the year.
Source: www.hoovers.com
Bank of America and FleetBoston Financial FIN-04-002
16
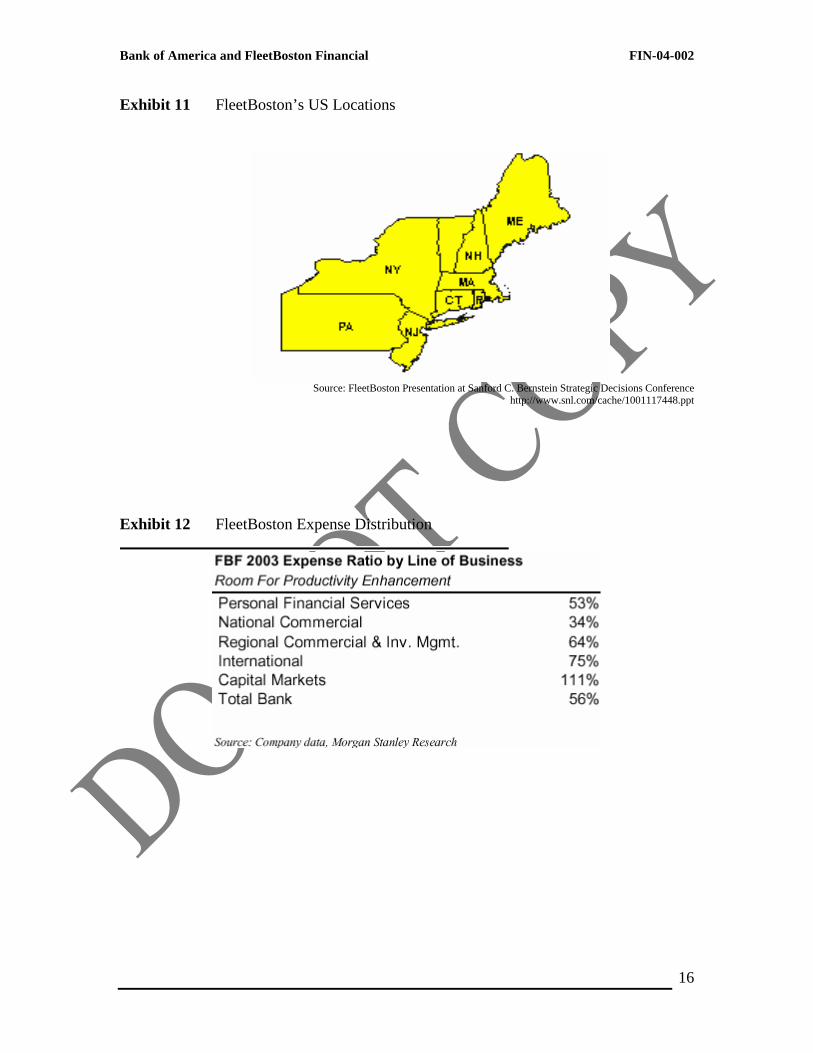
Exhibit 11 FleetBoston’s US Locations
Source: FleetBoston Presentation at Sanford C. Bernstein Strategic Decisions Conference
http://www.snl.com/cache/1001117448.ppt
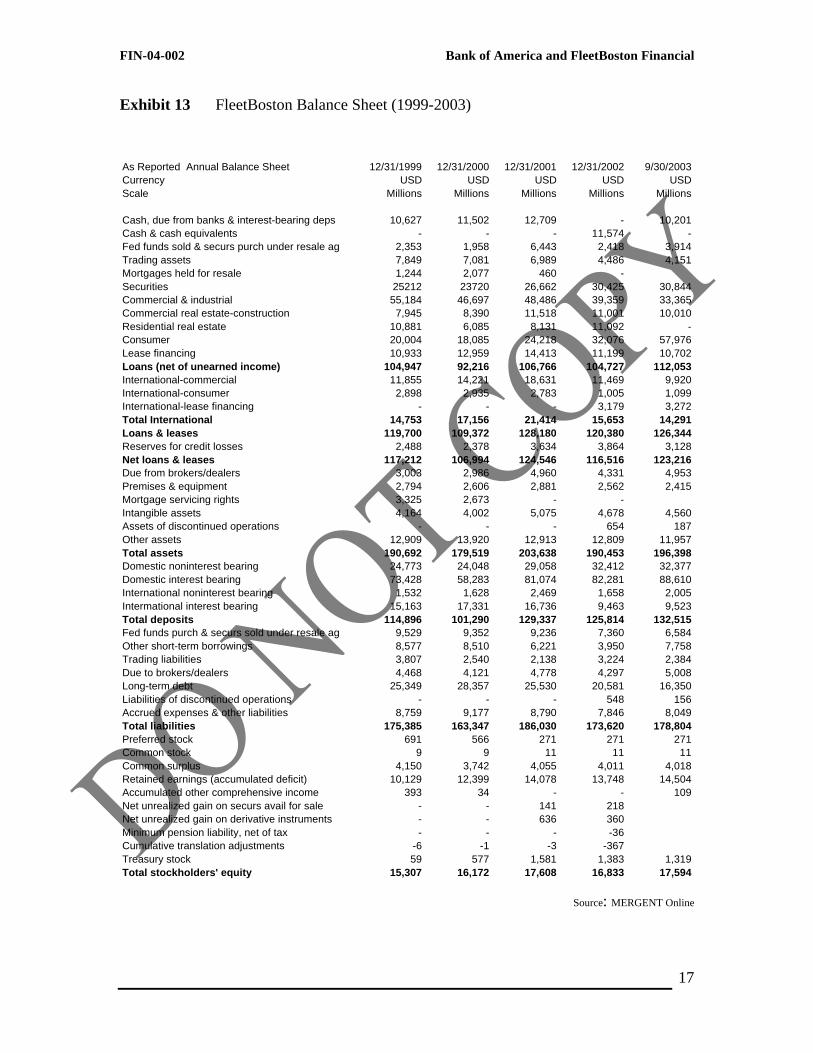
Exhibit 12 FleetBoston Expense Distribution
FIN-04-002 Bank of America and FleetBoston Financial
17
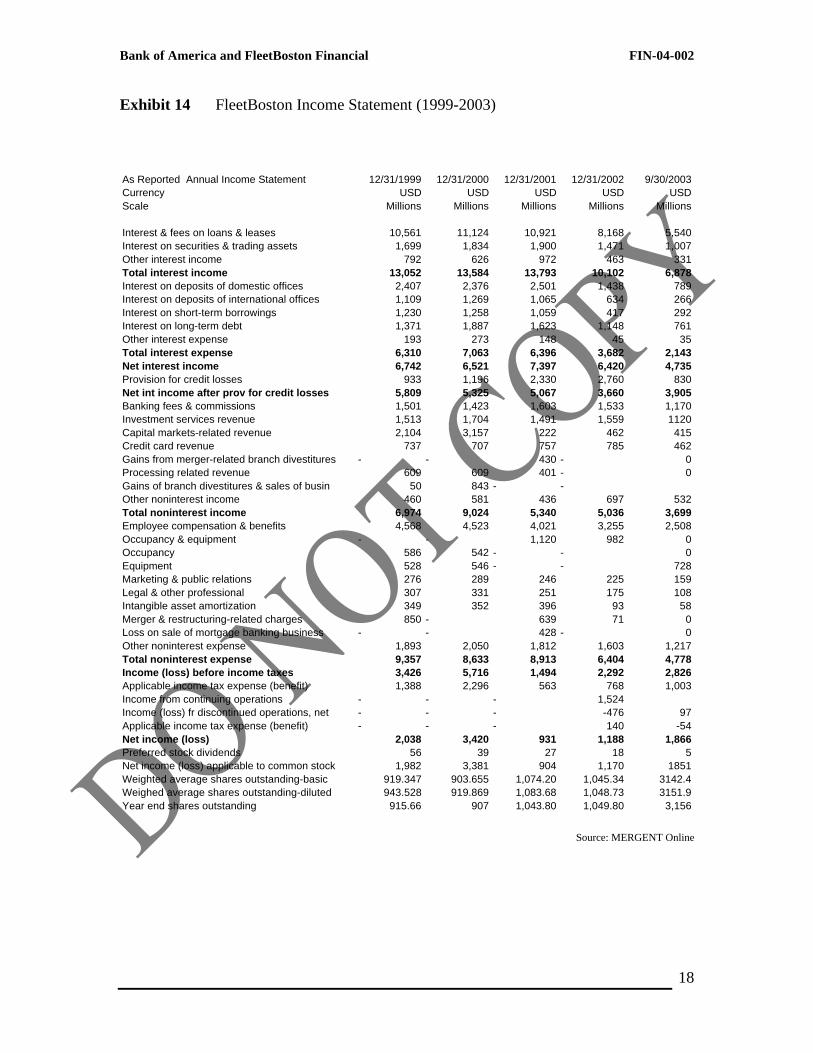
Exhibit 13 FleetBoston Balance Sheet (1999-2003)
Source: MERGENT Online
As Reported Annual Balance Sheet 12/31/1999 12/31/2000 12/31/2001 12/31/2002 9/30/2003Currency USD USD USD USD USDScale Millions Millions Millions Millions Millions
Cash, due from banks & interest-bearing deps 10,627 11,502 12,709 - 10,201Cash & cash equivalents - - - 11,574 -Fed funds sold & securs purch under resale ag 2,353 1,958 6,443 2,418 3,914Trading assets 7,849 7,081 6,989 4,486 4,151Mortgages held for resale 1,244 2,077 460 -Securities 25212 23720 26,662 30,425 30,844Commercial & industrial 55,184 46,697 48,486 39,359 33,365Commercial real estate-construction 7,945 8,390 11,518 11,001 10,010Residential real estate 10,881 6,085 8,131 11,092 -Consumer 20,004 18,085 24,218 32,076 57,976Lease financing 10,933 12,959 14,413 11,199 10,702Loans (net of unearned income) 104,947 92,216 106,766 104,727 112,053International-commercial 11,855 14,221 18,631 11,469 9,920International-consumer 2,898 2,935 2,783 1,005 1,099International-lease financing - - - 3,179 3,272Total International 14,753 17,156 21,414 15,653 14,291Loans & leases 119,700 109,372 128,180 120,380 126,344Reserves for credit losses 2,488 2,378 3,634 3,864 3,128Net loans & leases 117,212 106,994 124,546 116,516 123,216Due from brokers/dealers 3,003 2,986 4,960 4,331 4,953Premises & equipment 2,794 2,606 2,881 2,562 2,415Mortgage servicing rights 3,325 2,673 - -Intangible assets 4,164 4,002 5,075 4,678 4,560Assets of discontinued operations - - - 654 187Other assets 12,909 13,920 12,913 12,809 11,957Total assets 190,692 179,519 203,638 190,453 196,398Domestic noninterest bearing 24,773 24,048 29,058 32,412 32,377Domestic interest bearing 73,428 58,283 81,074 82,281 88,610International noninterest bearing 1,532 1,628 2,469 1,658 2,005Intermational interest bearing 15,163 17,331 16,736 9,463 9,523Total deposits 114,896 101,290 129,337 125,814 132,515Fed funds purch & securs sold under resale ag 9,529 9,352 9,236 7,360 6,584Other short-term borrowings 8,577 8,510 6,221 3,950 7,758Trading liabilities 3,807 2,540 2,138 3,224 2,384Due to brokers/dealers 4,468 4,121 4,778 4,297 5,008Long-term debt 25,349 28,357 25,530 20,581 16,350Liabilities of discontinued operations - - - 548 156Accrued expenses & other liabilities 8,759 9,177 8,790 7,846 8,049Total liabilities 175,385 163,347 186,030 173,620 178,804Preferred stock 691 566 271 271 271Common stock 9 9 11 11 11Common surplus 4,150 3,742 4,055 4,011 4,018Retained earnings (accumulated deficit) 10,129 12,399 14,078 13,748 14,504Accumulated other comprehensive income 393 34 - - 109Net unrealized gain on securs avail for sale - - 141 218Net unrealized gain on derivative instruments - - 636 360Minimum pension liability, net of tax - - - -36Cumulative translation adjustments -6 -1 -3 -367Treasury stock 59 577 1,581 1,383 1,319Total stockholders' equity 15,307 16,172 17,608 16,833 17,594
Bank of America and FleetBoston Financial FIN-04-002
18
Exhibit 14 FleetBoston Income Statement (1999-2003)
Source: MERGENT Online
As Reported Annual Income Statement 12/31/1999 12/31/2000 12/31/2001 12/31/2002 9/30/2003Currency USD USD USD USD USDScale Millions Millions Millions Millions Millions
Interest & fees on loans & leases 10,561 11,124 10,921 8,168 5,540Interest on securities & trading assets 1,699 1,834 1,900 1,471 1,007Other interest income 792 626 972 463 331Total interest income 13,052 13,584 13,793 10,102 6,878Interest on deposits of domestic offices 2,407 2,376 2,501 1,438 789Interest on deposits of international offices 1,109 1,269 1,065 634 266Interest on short-term borrowings 1,230 1,258 1,059 417 292Interest on long-term debt 1,371 1,887 1,623 1,148 761Other interest expense 193 273 148 45 35Total interest expense 6,310 7,063 6,396 3,682 2,143Net interest income 6,742 6,521 7,397 6,420 4,735Provision for credit losses 933 1,196 2,330 2,760 830Net int income after prov for credit losses 5,809 5,325 5,067 3,660 3,905Banking fees & commissions 1,501 1,423 1,603 1,533 1,170Investment services revenue 1,513 1,704 1,491 1,559 1120Capital markets-related revenue 2,104 3,157 222 462 415Credit card revenue 737 707 757 785 462Gains from merger-related branch divestitures - - 430 - 0Processing related revenue 609 609 401 - 0Gains of branch divestitures & sales of busin 50 843 - -Other noninterest income 460 581 436 697 532Total noninterest income 6,974 9,024 5,340 5,036 3,699Employee compensation & benefits 4,568 4,523 4,021 3,255 2,508Occupancy & equipment - - 1,120 982 0Occupancy 586 542 - - 0Equipment 528 546 - - 728Marketing & public relations 276 289 246 225 159Legal & other professional 307 331 251 175 108Intangible asset amortization 349 352 396 93 58Merger & restructuring-related charges 850 - 639 71 0Loss on sale of mortgage banking business - - 428 - 0Other noninterest expense 1,893 2,050 1,812 1,603 1,217Total noninterest expense 9,357 8,633 8,913 6,404 4,778Income (loss) before income taxes 3,426 5,716 1,494 2,292 2,826Applicable income tax expense (benefit) 1,388 2,296 563 768 1,003Income from continuing operations - - - 1,524Income (loss) fr discontinued operations, net - - - -476 97Applicable income tax expense (benefit) - - - 140 -54Net income (loss) 2,038 3,420 931 1,188 1,866Preferred stock dividends 56 39 27 18 5Net income (loss) applicable to common stock 1,982 3,381 904 1,170 1851Weighted average shares outstanding-basic 919.347 903.655 1,074.20 1,045.34 3142.4Weighed average shares outstanding-diluted 943.528 919.869 1,083.68 1,048.73 3151.9Year end shares outstanding 915.66 907 1,043.80 1,049.80 3,156
FIN-04-002 Bank of America and FleetBoston Financial
19
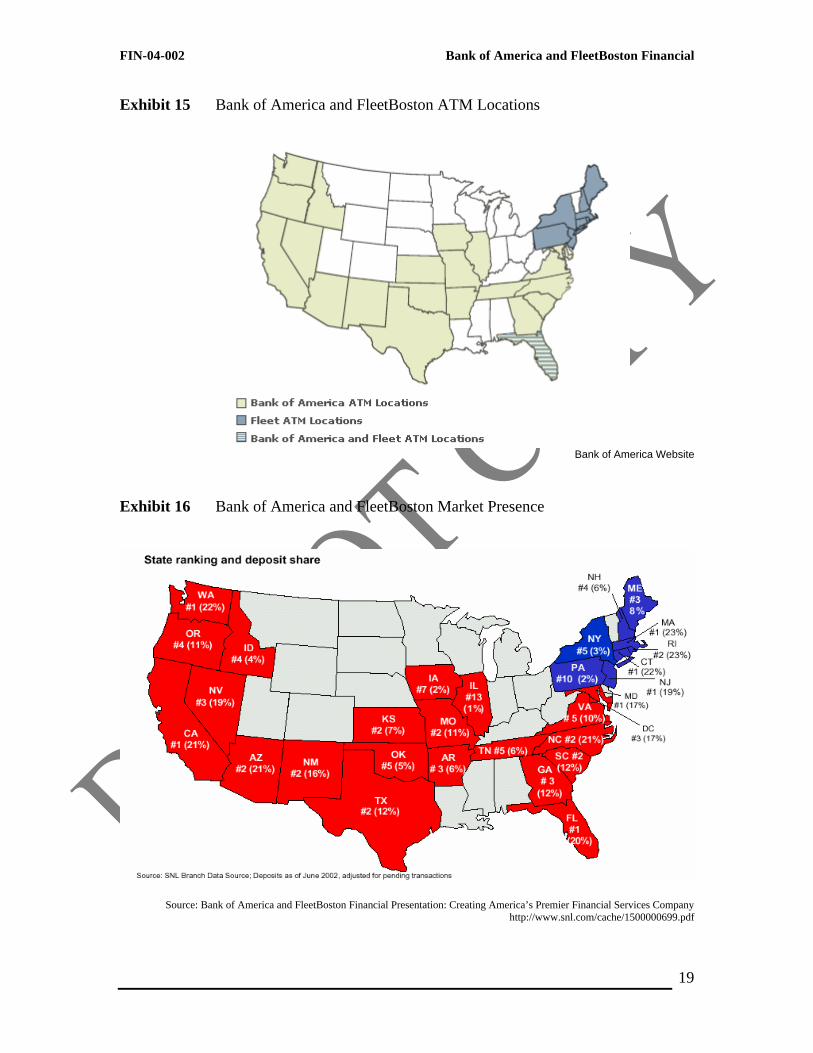
Exhibit 15 Bank of America and FleetBoston ATM Locations
Bank of America Website
Exhibit 16 Bank of America and FleetBoston Market Presence
Source: Bank of America and FleetBoston Financial Presentation: Creating America’s Premier Financial Services Company http://www.snl.com/cache/1500000699.pdf

Bank of America and FleetBoston Financial FIN-04-002
20
Exhibit 17 Targeted and Actual Cost Savings in Banking Mergers
FIN-04-002 Bank of America and FleetBoston Financial
21
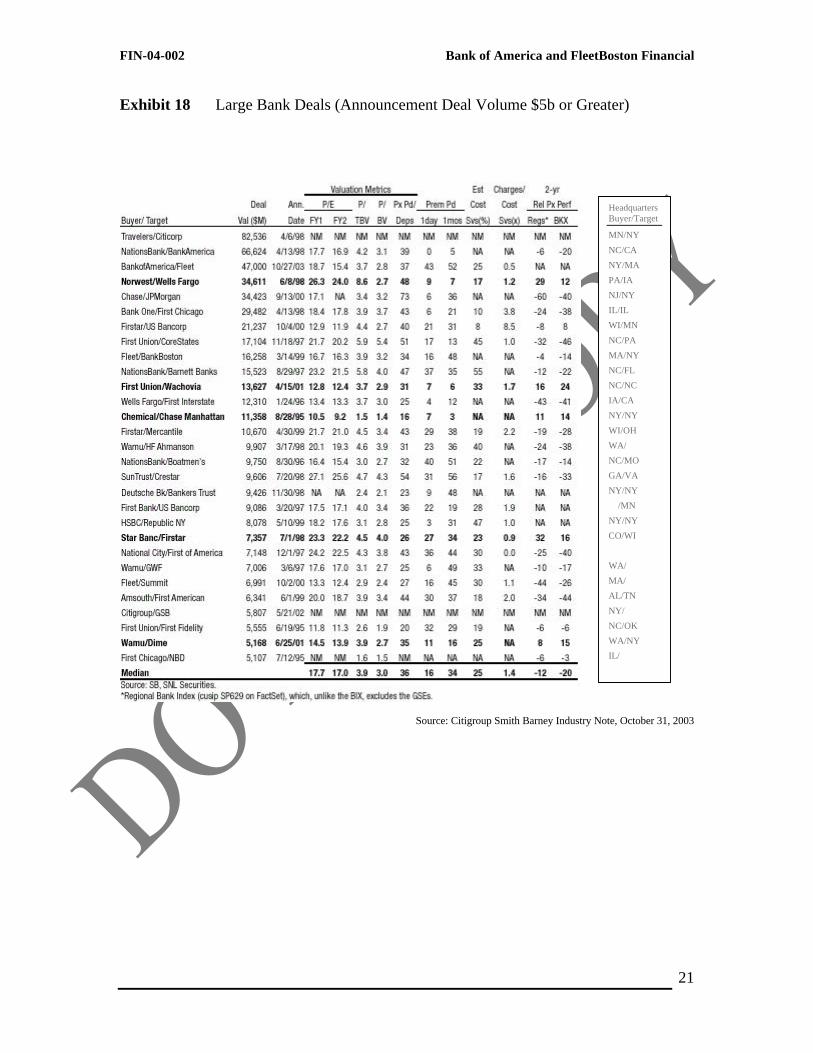
Exhibit 18 Large Bank Deals (Announcement Deal Volume $5b or Greater)
Source: Citigroup Smith Barney Industry Note, October 31, 2003
Headquarters Buyer/Target
MN/NY
NC/CA
NY/MA
PA/IA
NJ/NY
IL/IL
WI/MN
NC/PA
MA/NY
NC/FL
NC/NC
IA/CA
NY/NY
WI/OH
WA/
NC/MO
GA/VA
NY/NY
/MN
NY/NY
CO/WI
WA/
MA/
AL/TN
NY/
NC/OK
WA/NY
IL/

Bank of America and FleetBoston Financial FIN-04-002
22
Exhibit 19 Stock-Price Performance of Large-Bank Acquirers
Source: Citigroup Smith Barney Industry Note, October 31, 2003
FIN-04-002 Bank of America and FleetBoston Financial
23
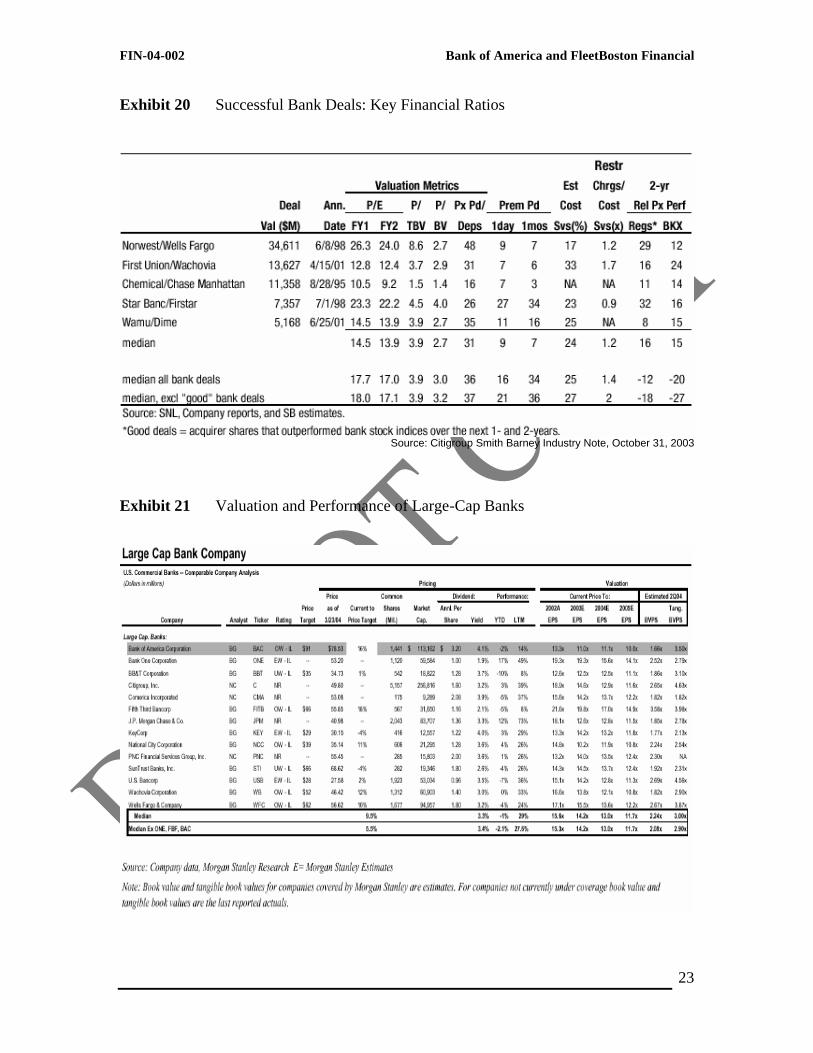
Exhibit 20 Successful Bank Deals: Key Financial Ratios
Source: Citigroup Smith Barney Industry Note, October 31, 2003
Exhibit 21 Valuation and Performance of Large-Cap Banks

Bank of America and FleetBoston Financial FIN-04-002
24
Exhibit 22 Industry Rankings: Banking League Tables
Source: Bank of America 4Q 2003 Fact Book
FIN-04-002 Bank of America and FleetBoston Financial
25
1 See “Big Bank Merger”, Oligopoly Watch (Oct. 27, 2003) available at www.oligopolywatch.com/2003/10/27.html 2 See Jonathan Stempel, “Bank of America to buy FleetBoston for $47 billion”, Reuters (Oct. 27, 2003) available at www.boston.com/business/articles/2003/10/27/bank_of_america_to_buy_fleetboston_for_47_billion/ 3 See Rebecca Byrne, “Bank of America to Acquire Fleet for $47 Billion”, The Street.com (Oct. 27, 2003) available at www.thestreet.com/markets/rebeccabyrne/10122344.html 4 See id. 5 See Jonathan Stempel, “Bank of America to buy FleetBoston for $47 billion”, Reuters (Oct. 27, 2003) available at www.boston.com/business/articles/2003/10/27/bank_of_america_to_buy_fleetboston_for_47_billion/ 6 See id. 7 See Jonathan Stempel, “Bank of America to buy FleetBoston for $47 billion”, Reuters (Oct. 27, 2003) available at www.boston.com/business/articles/2003/10/27/bank_of_america_to_buy_fleetboston_for_47_billion/ 8 See Laderman, Liz. “Trends in the Concentration of Bank Deposits: The Northwest.” FRBSF Economic Letter. Number 2002-21, July 26, 2002. 9 See Exhibit 2 10 See Kevin P. Coyne, Lenny T. Mendonca, and Gregory Wilson, “Can Banks Grow Beyond M&A”, The McKinsey Quarterly, 2004 Number 1. 11 See Federal Deposit Insurance Corporation (FDIC) available at http://www.fdic.gov/regulations/laws/rules/6500-3500.html 12 See Kevin P. Coyne, Lenny T. Mendonca, and Gregory Wilson, “Can Banks Grow Beyond M&A”, The McKinsey Quarterly, 2004 Number 1. 13 See id. 14 See id. 15 See Kevin P. Coyne, Lenny T. Mendonca, and Gregory Wilson, “Can Banks Grow Beyond M&A”, The McKinsey Quarterly, 2004 Number 1. 16 See Thomas Fogarty, “Bank of America, Fleet would create No. 2 bank”, USA Today (Oct. 28, 2003) available at http://www.usatoday.com/money/industries/banking/2003-10-27-bofa-fleet_x.htm 17 See id. 18 See Rebecca Byrne, “Bank of America to Acquire Fleet for $47 Billion”, The Street.com (Oct. 27, 2003) available at www.thestreet.com/markets/rebeccabyrne/10122344.html 19 For Example, NationsBank claimed it would save almost $1 billion per year in costs when it acquired Barnett Banks of Florida (The Wall Street Journal, September 2, 1997). Note that he expected savings are not always real-ized as banks frequently report unforeseen costs associated with mergers (for example, Banc One after merging with First USA in 1997, CoreStates after acquiring Meridian 20 Bliss, Richard T. and Richard J. Rosen. “CEO Compensation and Bank Mergers”, 2000. 21 See id. There is anecdotal evidence of a connection between CEO compensation and bank merger activity. First Chicago NBD Corp.’s 1997 proxy statement attributes the 37% increase in CEO Verne Istock’s annual compensa-tion to the “…successful merger of First Chicago and NBD.” Walter V. Shipley, CEO of Chase Manhattan Corp., received a “special merger bonus” of $5 million, payable in equal annual installments beginning in 1996. (“Chase Chairman Saw ‘96 Income More Than Double”, The Wall Street Journal, March 31, 1997, page A4.) 22 See http://finance.yahoo.com 23 See http://www.hoovers.com 24 See Robertson, Douglas D. A Markov View of Bank Consolidation: 1960-2000. Economic and Policy Analysis Working Paper 2001-4. September 2001 available at http://www.occ.treas.gov/ftp/workpaper/wp2001-4.pdf 25 See Olson, Mark W. “A Look at the Banking Industry in 2002.” Remarks by Governor Mark W. Olson At the 107th Annual Convention of the Maryland Bankers Association, Palm Beach, Florida. The Federal Reserve Board. May 21, 2002 available at http://www.federalreserve.gov/boarddocs/speeches/2002/20020521/default.htm 26 See Exhibit 3. 27 See Exhibit 4. 28 See Exhibit 5. 29 See Exhibits 7, 8, and 9 (providing the financial position of BofA for the last five years). 30 See Exhibit 6. 31 See Exhibit 10. 32 See Exhibit 11. 33 See Exhibit 5.
Bank of America and FleetBoston Financial FIN-04-002
26
34 See Exhibits 9, 12, 13, and 14 (showing Fleet’s financial position for the last five years). See also Exhibits 15 and 16 (outlining BofA’s and Fleet’s geographic reach and market share). 35 “Bank of America to acquire FleetBoston for $49.3 billion, projects 2004 EPS of $7.10”, SNLFinancial, October 27, 2003. 36 Sasha Talcott, “Benefits of big bank mergers challenged”, Globe Correspondent, February 5, 2004 37 “Bank of America to acquire FleetBoston for $49.3 billion, projects 2004 EPS of $7.10”, SNLFinancial, October 27, 2003. 38 See Exhibit 17 39 See Thomas Fogarty, “Bank of America, Fleet would create No. 2 bank”, USA Today (Oct. 28, 2003) available at http://www.usatoday.com/money/industries/banking/2003-10-27-bofa-fleet_x.htm