Embed Size (px)
Citation preview

2012
Ann
ual R
eport
BANK OF AFRICA GROUP
BOA Group celebrates its 30th Anniversary
FOCUSED ON DEvElOpmENt
iN thE hEart OF aFriCa

© All rights reserved.
Table of contentsThe BANK OF AFRICA Group
1 BANK OF AFRICA Group celebrates its 30th Anniversary by Mohamed BENNANI
2-3 30 years of growth and expansion
4 30 years of experience serving customers
5 The commitments of the Group for 30 years
6-7 Products & Services available in the Group Banks
8-9 Comments from the Group Chairman
10-11 Group Key Figures (Fiscal year 2012)
12 Group Highlights 2012
13-15 History of the BANK OF AFRICA Group
16-17 Development of Group Banks from 2008 to 2012
18 The BOA Network Managing Directors
19-26 Current situation and outlook for the Group
BOA GROUP S.A., BOA Group holding28 BOA GROUP S.A. Board of Directors
29-32 Report by the Board of Directors
33-34 Report by the Authorized Statutory Auditor
36-37 BOA GROUP S.A. Balance sheet and Profit & loss account
Synopsis of BANK OF AFRICA Group Companies 38-80 The 21 Group entities
BANK OF AFRICA Group consolidated annual accounts82-83 Report by the Authorized Statutory Auditor on the consolidated annual accounts
84 Auditors' Report on the consolidated annual accounts
85-89 Notes to the consolidated annual accounts
90-91 Consolidated Balance Sheet compared for the last two fiscal years
92-94 Consolidated Income Statement compared for the last two fiscal years
95-97 Personal notes

1Annual Report 2012 - BANK OF AFRICA GROUP Photo © E. Legouhy
BANK OF AFRICA Groupcelebrates its 30th Anniversary
This year we are celebrating our Group’s 30th Anniversary.
BANK OF AFRICA was established at a time when the West Africanbanking sector experienced serious difficulties. The founder’s goal of thefirst BANK OF AFRICA, BOA-MALI, created in 1983 and then headed
by Paul DERREUMAUX, was to fill a gap by creating a private African bank, with African capital,and dedicated to serving the African economy.
The original shareholders felt keenly the immense potential of a project that would help bringAfrica together for a better future.
Investors – both private and public, both national and international – had also placed theirtrust in this project and helped it to develop into what it is today – a group with a presencein 15 African countries through 16 commercial banks as well as numerous financial companies.
The majority shareholder, BMCE Bank, has put at the disposal of BOA Group its multipleskills, as well as its international and continental experience. Alongside other shareholders,it also provides the necessary capital for BOA to develop and expand throughout the continent.
All the BOA subsidiaries have now adopted BMCE Bank’s business model, which is basedon extending banking services to citizens on a large-scale and assisting both private and publiceconomic players with advice and financing to manage their companies and implement theirprojects.
Almost 5,000 staff members of all nationalities conduct their work with conviction and commitment.These women and men comprise teams that have expanded as the Group has developed,by knowing how to make the most of their differences, in order to become even stronger andmore effective together.
But BOA is above all the hundreds of thousands of customers – retail clients of all classesand ages, companies of all sizes and economic sectors, associations, public services, investors,industrialists, and entrepreneurs – who each day place their trust in its professionalism.
This year, as we celebrate the Group’s 30 years of existence, I would like to pay tributeto our shareholders, those who were with us from the start and those who joined later; to ourhundreds of thousands of customers; to our 5,000 staff members; and to the authoritiesin each host country who provide us with their continuous support.
Thank you for your trust, thank you for your work, thank you for your support, thank you, everyone, and long live the BANK OF AFRICA Group!
Mohamed BENNANI
Chairman and CEO

2BANK OF AFRICA GROUP - Annual Report 2012
30 years of growth and expansion
2004 BANK OF AFRICA – KENYACreated in 1981: BANQUE INDOSUEZ Kenyan Branch> CREDIT AGRICOLE–INDOSUEZ > CALYON.Incorporated under Kenyan law, integrated as a subsidiaryinto BOA network in 2004.
14 Branches in Nairobi.12 Regional Branches.
2006 BANK OF AFRICA – UGANDACreated in 1985: SEMBULE INVESTMENT BANK Ltd > ALLIED BANK. Integrated into BOA network in 2006.
20 Branches in Kampala. 13 Regional Branches.
2007 BANK OF AFRICA – TANZANIACreated in 1995: EURAFRICAN BANK – TANZANIA Ltd(EBT). Integrated into BOA network in 2007.
10 Branches in Dar es Salaam. 9 Regional Branches.
2008 BANQUE DE CRÉDIT DE BUJUMBURA Created in 1909 in Brussels: BANQUE DU CONGOBELGE (BCB). 1922: BCB Branch in Usumbura, Burundi.25 July 1964: BANQUE DE CREDIT DE BUJUMBURA(BCB). Integrated into BOA network in 2008.
7 Branches and 3 Counters in Bujumbura.12 Regional Branches and 2 Counters in Provinces.
2010 BANK OF AFRICA – RDC7 Branches in Kinshasa.1 Regional Branch.
2010 BANK OF AFRICA – MER ROUGECreated in 1908: BANQUE INDOSUEZ MER ROUGE(BIRM). Integrated into BOA network in 2011.
3 Branches in Djibouti.
2011 BANK OF AFRICA – GHANACreated in 1999: AMALBANK. Integrated into BOA network in 2011.
14 Branches and 1 Business Centre in Accra.5 Regional Branches.
2013 BANK OF AFRICA – TOGO3 Branches in Lomé.
Bank network*
1983 BANK OF AFRICA – MALI15 Branches and 1 Business Centre in Bamako. 8 Regional Branches and 13 Local Branches.
1990 BANK OF AFRICA – BENIN22 Branches,1 Business Centre and 2 Port Branchesin Cotonou. 21 Regional Branches.
1994 BANK OF AFRICA – NIGERCreated in 1989: NIGERIAN INTERNATIONAL BANK (NIB). Integrated into BOA network in 1994.
8 Branches in Niamey.8 Regional Branches.
1996 BANK OF AFRICA – CÔTE D’IVOIRECreated in 1980: BANAFRIQUE.Integrated into BOA network in 1996.
13 Branches and 1 Business Centre in Abidjan.8 Regional Branches and 1 Local Branch.
1998 BANK OF AFRICA – BURKINA FASO14 Branches and 1 Business Centre in Ouagadougou.13 Regional Branches.
1999 BANK OF AFRICA – MADAGASCARCreated in 1989: BANKIN’NY TANTSAHAMPAMOKATRA (BTM) / National Bank for RuralDevelopment. Integrated into BOA network in 1999.
21 Branches in Antananarivo.56 Regional Branches.
2001 BANK OF AFRICA – SENEGAL17 Branches and 1 Business Centre in Dakar. 10 Regional Branches.
2004 BANQUE DE L’HABITAT DU BENIN2 Branches in Cotonou.

3Annual Report 2012 - BANK OF AFRICA GROUP
Other entities*
1999 BANK OF AFRICA FOUNDATIONHead Office in Bamako. Presence in 11 countries where the Group operates.
2000 BOA REPRESENTATIVE OFFICEHead Office in Paris.
Subsidiaries*
1997 ACTIBOURSEHead Office in Cotonou.1 Liaison Office in Abidjan.1 contact in each BOA company.
2002 AÏSSAHead Office in Cotonou.
2002 AGORAHead Office in Abidjan.
2004 ATTICAHead Office in Abidjan.
2009 BOA-ASSET MANAGEMENTHead Office in Abidjan.
2010 BOA-FRANCE4 Branches in Paris.1 Branch in Marseille.
www.bank-of-africa.net
(*) BANK OF AFRICA Network at 31/3/2013.

4BANK OF AFRICA GROUP - Annual Report 2012
30 years of experience serving customers
A strong network*
5,000 people at the service of more than one million customers.
About 370 dedicated operating and service support offices in 16 countries.
A continuously expanding base of Automated Teller Machines and Electronic PaymentTerminals, numbering around 450.
Close to 1,450,000 bank accounts.
A wide and varied offer
Full range of banking and financial services.
An attractive range of bank insurance products.
Tailored solutions for all financing issues.
Successful financial engineering.
A leading banking partner, BMCE BANK,
which is part of FinanceCom, a major Moroccan financial group.
Strategic partners, including:
PROPARCO,
INTERNATIONAL FINANCE CORPORATION (IFC - WORLD BANK GROUP),
WEST AFRICAN DEVELOPMENT BANK (BOAD),
NETHERLANDS DEVELOPMENT FINANCE COMPANY (FMO),
BELGIUM INVESTMENT COMPANY FOR DEVELOPING COUNTRIES (BIO),
and investment fund AUREOS.
Unique experience in Africa
Continuous development for 30 years.
(*): As at 31 December 2012

5Annual Report 2012 - BANK OF AFRICA GROUP
The commitments of the Group for 30 years
☛ Quality of customer service
☛ Dynamic, accessible staff
☛ Financial solidity
☛ Cohesive network
☛ Wide range of financing solutions
☛ Expertise in financial engineering
☛ Strong partners
Group turnover 2012: euros 451.7 million

Products & Services available in the GroupInsurance Assurance Études
Assurance Prévoyance Assurance Retraite
Accounts Compte ChèqueCompte DevisesCompte ÉliteCompte Jeunes
Investment Products Bons de CaisseBons du Trésor par AdjudicationCompte ÉpargneCompte Épargne ÉliteDépôt à TermePlan Épargne AmbitionPlan Épargne ÉducationPlan Épargne LogementPlan Épargne Pèlerinage
M-Paiement/M-Banking Airtel MoneyOrange Money
Electronic Banking Carte SÉSAME +Carte SÉSAME ÉPARGNECarte VISA LIBRACarte VISA PROXIMACarte VISA Prépayée TUCANACash Advance MASTERCARD
Multimedia B-Phone - B-SMSB-Web
Packages Pack FONXIONARIAPack MON BUSINESSPack SALARIA
Loans AvanceAvance TabaskiDécouvert Autorisé MicrofinancePrêt AssurancesPrêt CollectifPrêt Consommation Prêt ÉquipementPrêt Étudiant 2iEPrêt Événements Familiaux Prêt HabitationPrêt Immobilier « Prêt Ma Maison »Prêt InformatiquePrêt PersonnelPrêt Première InstallationPrêt RechargeablePrêt Scolarité « Prêt Tous à l’école »Prêt Véhicule « Prêt Ma Voiture »
Transfers & Changes BOA ExpressChange Manuel Chèques de VoyageT-CashTransfert FlashWestern Union
BOA Company Services
BOA French speaking network
6BANK OF AFRICA GROUP - Annual Report 2012
The Network also offers a wide range of products and services tothe attention of Corporates and SMEs, organizations, institutionsand professionals.
© BOA

BanksAccounts Current Account
Goodwill AccountRemunerated Current AccountSalary AccountPersonal Current AccountWakili Current AccountJipange AccountElite AccountExecutive Current AccountMwanariadha Account
Investment Products Call Deposits AccountChama AccountChildren Savings Account Classic Saving AccountFamily Savings AccountForexave AccountEro Savings AccountGold Plus AccountVuna AccountOrdinary Savings AccountFixed Deposit AccountPremium Plus AccountReward Saving AccountSchool Fees AccountSESAME Savings AccountTerm DepositStudent Account
Electronic Banking B-SMS / B-PhoneB-WebSESAME ATM Card TOUCAN Card
M-Payment / M-Banking B-Mobile M-PesaMTN Mobile MoneyAirtel Money
Loans Bridging OverdraftInstant CashMotor Cycle LoanMotor Vehicle LoanPersonal LoansPersonal Motor LoanScheme LoanHome FinanceInsurance Premium FinanceSalary AdvanceSchool Fees LoanTax Bridging FinanceWarehouse Receipt Financing
Transfers & Changes Foreign ExchangeMoneyGramTravellers ChequesWestern UnionSigue Money Transfer
Complementary Banker’s Cheques Products & Services e-tax Payments
Utility Bill PaymentsCustodial Services
BOA Company Services
BOA English speaking network
The Network also offers a wide range of products and services tothe attention of Corporates and SMEs, organizations, institutionsand professionals.
7Annual Report 2012 - BANK OF AFRICA GROUP © BOA
8BANK OF AFRICA GROUP - Annual Report 2012
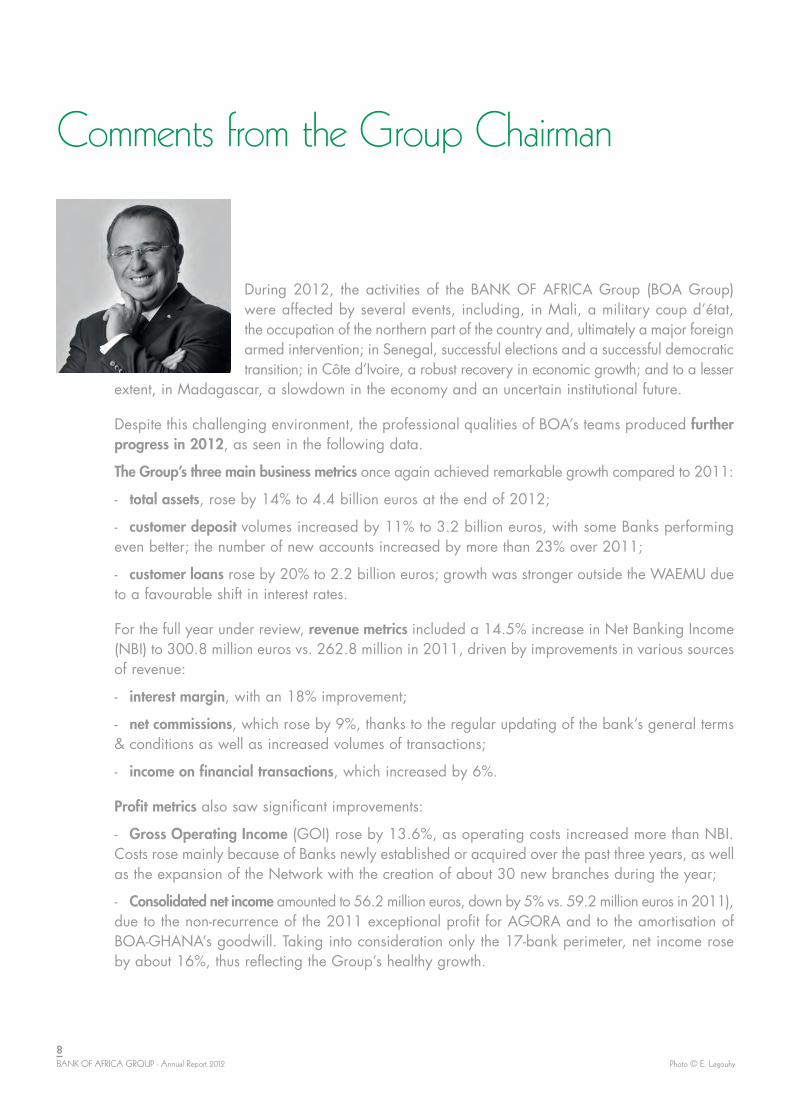
During 2012, the activities of the BANK OF AFRICA Group (BOA Group)were affected by several events, including, in Mali, a military coup d’état,the occupation of the northern part of the country and, ultimately a major foreignarmed intervention; in Senegal, successful elections and a successful democratictransition; in Côte d’Ivoire, a robust recovery in economic growth; and to a lesser
extent, in Madagascar, a slowdown in the economy and an uncertain institutional future.
Despite this challenging environment, the professional qualities of BOA’s teams produced furtherprogress in 2012, as seen in the following data.
The Group’s three main business metrics once again achieved remarkable growth compared to 2011:
- total assets, rose by 14% to 4.4 billion euros at the end of 2012;
- customer deposit volumes increased by 11% to 3.2 billion euros, with some Banks performingeven better; the number of new accounts increased by more than 23% over 2011;
- customer loans rose by 20% to 2.2 billion euros; growth was stronger outside the WAEMU dueto a favourable shift in interest rates.
For the full year under review, revenue metrics included a 14.5% increase in Net Banking Income(NBI) to 300.8 million euros vs. 262.8 million in 2011, driven by improvements in various sourcesof revenue:
- interest margin, with an 18% improvement;
- net commissions, which rose by 9%, thanks to the regular updating of the bank’s general terms& conditions as well as increased volumes of transactions;
- income on financial transactions, which increased by 6%.
Profit metrics also saw significant improvements:
- Gross Operating Income (GOI) rose by 13.6%, as operating costs increased more than NBI.Costs rose mainly because of Banks newly established or acquired over the past three years, as wellas the expansion of the Network with the creation of about 30 new branches during the year;
- Consolidated net income amounted to 56.2 million euros, down by 5% vs. 59.2 million euros in 2011),due to the non-recurrence of the 2011 exceptional profit for AGORA and to the amortisation ofBOA-GHANA’s goodwill. Taking into consideration only the 17-bank perimeter, net income roseby about 16%, thus reflecting the Group’s healthy growth.
Comments from the Group Chairman
Photo © E. Legouhy

9Annual Report 2012 - BANK OF AFRICA GROUP
Meanwhile, the Group continued to build on its past achievements and geographic expansion through:
- increased market share of some Banks;
- a new significant expansion in capital resources, which before distribution, came to 451.2 millioneuros, hence a 14% increase vs. 2011;
- obtaining a banking licence in Togo in 2012, enabling the creation of BANK OF AFRICA – TOGO;
- implementation of new management tools for collections and car loans;
- opening of Business Centres and the ongoing diversification in the range of products and services;
- preparation of the launch of an investment bank in 2013, BOA CAPITAL, in partnership with BMCECAPITAL.
On the corporate front, 2012 saw:
- an increase in BMCE BANK’s stake in BOA GROUP S.A., BOA Group’s holding structure, from59.39% at end-2011 to 65.23% at 31 December 2012;
- a capital increase by BOA GROUP S.A. of 10.1 million euros, from 60.5 to 70.6 million euros,through the issue of 65,077 new shares, and an increase in shareholders’ equity before distributionfrom 150.2 million euros to 186.9 million euros;
- the development and approval of a new Three-Year Development Plan for 2013-2015, basedon the Group’s major strategies.
2012 thus marked the continuation of a strategy initiated in early 2011, founded on tighter controlof the governance and share capital of subsidiaries, pursuing their development and improvingtheir profitability, targeted geographical expansion, and an increasingly strong commercialorganisation, as well as optimum use of synergies with BMCE BANK.
In 2013 BOA Group will pursue this policy of growth, modernisation and institutionalisation, with itsultimate goal not limited to improve our results, but also to attain even closer involvement and greaterefficiency in the economies of the countries where we are located, to better serve the citizens of Africa.
Finally, I would like to thank the BANK OF AFRICA teams for their constant professional commitment,our shareholders for their steadfast support, and in particular our main shareholder BMCE BANK,whose expertise, experience and know-how give us a significant edge in our business activities.
Mohamed BENNANI
BOA GROUP Chairman and CEO

10BANK OF AFRICA GROUP - Annual Report 2012
Group Key Figures (Fiscal year 2012)
4,399
3,158
391
356
142
13,829
167
30
22,024
2,780
1,439
-1,497
33,595
19,200
10,762
9,986
10,305
493,201
1,935
963
14.12
73.92
11.96
0.00
50.74
23.50
9.76
16.00
75.08
0.00
24.92
0.00
99.90
0.00
0.10
0.00
52.38
0.23
47.39
0.00
51.04
2.07
44.18
2.71
64.35
3.63
32.02
0.00
24.01
40.49
0.00
35.50
41.30
0.00
34.50
24.20
58.54
0.05
25.64
15.77
60.00
0.00
0.00
40.00
BOA-MER ROUG
E
BOA-B
ÉNIN
BOA-B
URKINA FASO
BOA-G
HANA
BOA-CÔTE
D’IVOIRE
BOA-K
ENYA
BOA-M
ADAGAS
CAR
BOA-M
ALI
TOTAL ASSETS
ASSETS IN PORTFOLIO / VOLUME OF SHAREHOLDERS OR OPERATIONS
TURNOVER / INCOME FROM SHAREHOLDERS
PRE-TAX PROFIT
92.76
0.00
7.24
0.00
BOA GROUP
OTHER BOA
NATIONAL & OTHERS
INTERNAT. INSTIT.
BOA GROUP
OTHER BOA
NATIONAL & OTHERS
INTERNAT. INSTIT.
TOTAL ASSETS
DEPOSITS
LOANS & ADVANCES
TURNOVER
PRE-TAX PROFIT
0.00
89.60
0.40
10.00
941,933
610,694
340,642
81,362
12,546
530,721
399,089
292,116
45,329
15,678
413,642
311,237
230,246
31,865
4,805
228,423
146,508
122,786
32,766
951
431,207
309,150
263,192
55,655
5,602
495,106
405,992
187,276
50,161
9,724
326,630
245,093
211,635
33,783
3,119
278,524
244,029
66,791
13,686
4,283
ACTIBOURSE
AGORA
BOA-ASSET
MANAGEM
ENT
ATTICA
BOA-FRANCE
SubsidiariesAT 31/12/2012 - IN THOUSANDS OF EUROS
BanksAT 31/12/2012 - IN THOUSANDS OF EUROS
Shareholders (in %)
Shareholders (in %)

11Annual Report 2012 - BANK OF AFRICA GROUP
Excluding restatement of intra-group operations carried out within the consolidated accounts
TOTALALL BANKS
BOA-N
IGER
BOA-RDC
BOA-SÉNÉGAL
BOA-TANZ
ANIA
BOA-U
GANDA
BCB BHB
BOA GROUP
OTHER BOA
NATIONAL & OTHERS
INTERNAT. INSTIT.
GROUP PROFIT 2012
EUROS 56.2 MILLION
286,408
170,560
179,212
24,248
6,318
43,424
14,529
21,024
3,495
-2,635
239,084
185,278
144,334
22,396
5,325
164,382
126,846
94,796
19,767
1,599
125,178
84,010
67,357
21,296
2,479
135,413
114,890
75,447
16,251
2,782
44,927
27,323
35,220
3,416
406
4,685,003
3,395,228
2,332,073
455,477
72,983
49.43
0.00
43.26
7.31
65.01
0.00
0.00
35.00
71.50
2.40
26.10
0.00
25.30
24.05
11.01
39.64
22.48
50.01
0.00
27.51
20.25
0.00
45.00
34.75
42.86
31.07
11.57
14.50

12BANK OF AFRICA GROUP - Annual Report 2012
Group Highlights 2012
JanuaryOrganisation of the 5th Edition of BOA International Marathon of Bamako, in collaboration with BOA-MALI.
Opening of BOA-BENIN’s Business Centre.
FebruaryCommercial reorganisation for corporate customers at BANQUE DE CREDIT DE BUJUMBURA (BCB) based on the BOABusiness Model.
MayOrganisation of the 2012 BANK OF AFRICA network management meetings, in Marrakech, Morocco.
JulySigning of an agreement with SALAFIN, a consumer credit subsidiary of BMCE BANK, to launch the “Prêt Ma Voiture”product, first in Senegal and then in other subsidiaries.
SeptemberCommercial reorganisation for retail customers of BOA Banks in Ghana, Kenya, Uganda and Tanzania based on the BOA Business Model.
Opening of BOA-BURKINA FASO’s Business Centre.
NovemberMerger of EQUIPBAIL-MADAGASCAR with BOA-MADAGASCAR.
DecemberOrganisation of the 2012 BANK OF AFRICA Directors meetings in Arusha, Tanzania.
Certification obtained enabling the creation of BOA-TOGO, 16th bank in the BOA network.
5th BOA International Marathon of Bamako:
the departure of the “juniors”.
The BOA-TANZANIA MDwelcomes Group Directors
to the BANK OF AFRICA 2012Plenary Meeting in Arusha,
Tanzania.
© BOA & © Ludovick Swai.

13Annual Report 2012 - BANK OF AFRICA GROUP
History of the BANK OF AFRICA Group
Since it was founded in Mali in 1982, the Group has expanded in four broad stages, each onecorresponding to a specific development.
Le lancement : 1982 / 1990It started out as a pioneering project to create an African bank that is independent of majorinternational groups, while tapping into private and well diversified African share capital.
After BANK OF AFRICA – MALI (BOA-MALI) was established in 1982, a holding structure was set upin 1988, called AFRICAN FINANCIAL HOLDING (AFH), which later became BOA GROUP S.A.. Thisled to the founding of BANK OF AFRICA – BENIN (BOA-BENIN) in 1989 and its core shareholder.BOA-BENIN is now the leading bank in its country.
L’expansion : 1991 / 1998
The “BANK OF AFRICA” concept, based on the balance of a diversified shareholder structure andon a single strategy, was then fine-tuned, developed and consolidated. Simultaneously, the decisionwas made to expand into the West African Economic and Monetary Union (WAEMU), basedon its bedrock principles of a single brand and a standardised organisational set-up. Three newBANK OF AFRICA subsidiaries were founded: in Niger in 1994, in Côte d’Ivoire in 1996 andin Burkina Faso in 1998.
The Group’s Corporate Structures began to be built, with their organisational and oversight roles.
La diversification : 1999-2010
This determination to diversify, driven by growth objectives, manifested itself at three separate andcomplementary levels: 1) to be upgraded from a group of banks to a true group structure; 2) to shiftfrom purely commercial banking activities towards a greater focus on bank intermediation, assetmanagement, and insurance, in order to create a multi-purpose financial group able to offer a fullrange of financial products and services; and 3) to expand into other parts of sub-Saharan Africa,including English-speaking countries.
During this period, seven new BANK OF AFRICA subsidiaries were added, in Madagascar in 1999,in Senegal in 2001, in Kenya in 2004, in Uganda in 2006, in Tanzania in 2007, in Burundi in 2008,and in the Democratic Republic of Congo and Djibouti in 2010, not to mention the establishmentof a Group-wide investment firm, a financing arm in France dedicated to the African diaspora,a mortgage lending institution in Benin, and a significant stake in a major insurance company.
Launch 1982 / 1990
Expansion 1991 / 1998
Diversification 1999 / 2010

14BANK OF AFRICA GROUP - Annual Report 2012
Les nouvelles perspectives
This strategy also required an expansion in the Group’s resources, financial in particular, whichis why the Group decided as far back as 2005 to seek out a banking partner able to both expandits financial means and to enrich its human and operating resources.
This alliance was born on 25 February 2008, with a 35% capital increase of the BOA GROUP S.A.,as the AFH holding structure was then named, reserved exclusively for BMCE BANK, which thusbecame a shareholder in BANK OF AFRICA Group.
This ambitious capital increase, as well as the appointment of a Deputy Managing Director fromBMCE BANK followed by the arrival of this strategic banking shareholder, provided the means forgreater ambitions by helping to expand each of the BANK OF AFRICA entities and facilitatinggeographical and sector-based expansion projects.
On 31 December 2009, BOA GROUP’s share capital came to about 40.3 million euros, of whichBMCE BANK owned 42.5%, and collaboration between the two Groups unfolded as originallyenvisioned, in a spirit of dialogue and synergy.
In 2010 the alliance between BOA and BMCE BANK was consolidated: - the Moroccan bank’s acquisition of a majority equity stake in BOA GROUP S.A., the BOA Group’sholding structure, and raising that stake from 55.77% at the end of 2010 to 65.23% at the endof 2012;
- a 10.1 million euro capital increase by BOA GROUP S.A., from 40.3 million to 50.4 million euros,through the issue of 65,077 new shares, and the change in BOA GROUP’s Chairman and CEO,effective 1 January 2011.
Today, BOA Group is reinforcing its equity and financial structure. It is modernising and raising itsinstitutional profile, while continuing to expand – geographically, through the founding of BANK OFAFRICA – GHANA (BOA-GHANA) in 2011 and BANK OF AFRICA – TOGO (BOA-TOGO)in 2013, and by sector, with the opening of eight Business Centres (in late September 2013) dedicatedto our corporate customers.
New prospects

15Annual Report 2012 - BANK OF AFRICA GROUP
Our focus now turns to further expansion and to making our Group a permanent fixture in theAfrican banking landscape, based on five main strategic channels:
- enhancing control over subsidiaries’ governance and share capital, pursuing their expansion,and enhancing their profitability, while reinforcing intra-Group cohesion and solidarity;
- pursuing external growth, as well as diversifying and enriching products and services offeredto all types of customers, mainly in bancassurance and home mortgage financing;
- enhancing performance and reinforcing security;
- promoting human resources;
- leveraging synergies with BMCE BANK, which is now the BANK OF AFRICA Group’s majorityshareholder.
BOA Group is adhering with the strategy that it fine-tuned and that has served it well for more than30 years, while maintaining the values and guideposts that have constantly driven its activities:
- professionalism and thoroughness;
- proximity to customers and involvement in national development;
- promotion of Africans, whether they are employees, shareholders, clients or partners.
The development of the BANK OF AFRICA Group over the last five fiscal years is outlined overleaf.
The 2012 BANK OF AFRICA network management meetings, in Marrakech, Morocco.
© Abdeltif Khammali - Photographe Africa

16BANK OF AFRICA GROUP - Annual Report 2012
-6,59
783
8
3,76
12,
786
2,68
3-74
24,
754
BOA-B
ENIN
BOA-BURKINA FASO
BOA-CÔTE
D’IVOIRE
BOA-K
ENYA
BOA-MA
DAGASC
AR
BOA-M
ALI
BOA-MER ROUG
E
TOTALASSETS
DEPOSITS
LOANS&
ADVANCES
TURNOVER
NET
INCOME
08 09 10 11 12 08 09 10 11 1208 09 10 11 1208 09 10 11 1208 09 10 11 1208 09 10 11 12
08 09 10 11 12 08 09 10 11 1208 09 10 11 1208 09 10 11 1208 09 10 11 1208 09 10 11 12
08 09 10 11 12 08 09 10 11 1208 09 10 11 1208 09 10 11 1208 09 10 11 1208 09 10 11 12
08 09 10 11 12 08 09 10 11 1208 09 10 11 1208 09 10 11 1208 09 10 11 1208 09 10 11 12
08 09 10 11 12 08 09 10 11 1208 09 10 11 1208 09 10 11 1208 09 10 11 1208 09 10 11 12
653,
090
74
8,67
074
2,84
0
840,
706
941,
933
305,
743
330,
818
336,
775
335,
871
340,
642
53,1
3762
,732
70,6
0277
,040
81,3
62
9,15
410
,037
10,0
3611
,621
11,9
31
224,
041
268,
888
34
8,35
8
435,
926
53
0,72
1
130,
268
145,
381
182,
050
212,
218
292,
116
20,0
8022
,429
28,9
0336
,364
45,3
29
2,87
53,
464
4,67
17,
467
12,0
68
318,
080
28
0,49
9
321,
841
32
6,08
841
3,64
208 09 10 11 12
176,
198
186,
714
217,
101
244,
251
311,
237
08 09 10 11 12
202,
679
174,
855
189,
496
176,
344
230,
246
08 09 10 11 12
26,5
6327
,556
26,5
3725
,185
31,8
65
08 09 10 11 12
111,
601
154,
618
248,
067
350,
810
431,
207
78,9
2711
3,39
218
3,81
821
7,23
930
9,15
0
62,1
9683
,367
131,
211
195,
991
263,
192
465,
162
436,
680
434,
477
464,
417
495,
106
175,
750
173,
465
169,
888
175,
784
187,
276
46,5
5046
,694
46,5
0248
,470
50,1
61
205,
615
244,
461
287,
648
301,
761
326,
630
140,
011
175,
916
232,
991
229,
791
245,
093
23,0
2625
,674
28,4
3530
,592
33,7
83
1,96
51,
999
1,53
43,
040
2,29
5
271,
618
275,
128
278,
524
236,
847
236,
424
244,
029
69,4
3167
,102
66,7
91
12,9
3212
,323
13,6
86
750
2,76
63,
179
9,43
214
,729
22,1
6932
,994
55,6
55
08 09 10 11 12
BOA-G
HANA
08 09 10 11 12
08 09 10 11 12
08 09 10 11 12
08 09 10 11 12
08 09 10 11 12
436,
297
482,
853
469,
601
583,
058
610,
694
195,
167
231,
127
301,
684
339,
989
399,
089
189,
747
228,
423
144,
383
146,
508
95,6
0512
2,78
631
,596
32,7
66
644
1,75
93,
301
3,91
94,
173
393,
459
372,
106
358,
474
383,
929
405,
992
9,74
02,
353
3,05
68,
532
7,41
4
130,
712
148,
181
155,
890
174,
786
211,
635
Development of Group Banks

17Annual Report 2012 - BANK OF AFRICA GROUP
08 09 10 11 1208 09 10 11 1208 09 10 11 1208 09 10 11 1208 09 10 11 1208 09 10 11 1208 09 10 11 12
08 09 10 11 1208 09 10 11 1208 09 10 11 1208 09 10 11 1208 09 10 11 1208 09 10 11 1208 09 10 11 12
08 09 10 11 12 08 09 10 11 1208 09 10 11 1208 09 10 11 1208 09 10 11 1208 09 10 11 1208 09 10 11 12
08 09 10 11 1208 09 10 11 1208 09 10 11 1208 09 10 11 1208 09 10 11 1208 09 10 11 1208 09 10 11 12
08 09 10 11 1208 09 10 11 1208 09 10 11 1208 09 10 11 1208 09 10 11 1208 09 10 11 1208 09 10 11 12
TOTALALL BANKSBOA
-RDC
BOA-SENEGAL
BOA-TANZA
NIA
BOA-U
GANDA
BCB BHB
08 09 10 11 12
08 09 10 11 12
08 09 10 11 12
08 09 10 11 12
08 09 10 11 12
BOA-N
IGER
143,
684
168,
326
212,
459
241,
700
286,
408
87,4
7397
,065
123,
313
136,
398
170,
560
88,8
0710
0,10
412
8,89
914
6,68
617
9,21
2
15,0
6316
,200
147,
367
21,0
3324
,248
2,04
62,
468
3,37
14,
215
4,79
3
11,5
9223
,313
43,4
24
1,44
16,
724
14,5
29
2,51
212
,486
21,0
24
890
2,04
03,
495
120,
190
146,
703
180,
893
204,
927
239,
084
102,
923
123,
753
153,
028
169,
380
185,
278
63,5
1081
,663
95,0
0311
1,88
514
4,33
4
9,61
312
,083
16,0
8325
,620
22,3
96
2,19
61,
785
2,51
13,
110
3,60
4
68,4
5487
,181
119,
196
138,
491
164,
382
58,5
2278
,180
100,
182
110,
409
126,
846
22,8
3537
,301
52,8
0973
,750
94,7
96
5,19
28,
870
12,3
0014
,467
19,7
67
577
514
942
550
1,21
7
64,3
1081
,464
97,4
2013
4,15
012
5,17
8
9,44
912
,067
12,5
5517
,056
21,2
96
1,37
91,
209
1,19
41,
941
2,73
1
82,2
8598
,493
138,
348
138,
522
135,
413
65,8
5780
,068
113,
283
111,
523
114,
890
29,4
3133
,218
54,3
5571
,863
75,4
47
9,68
09,
751
12,4
9817
,278
16,2
51
1,95
52,
955
3,08
34,
884
1,80
9
22,6
8229
,423
39,7
1640
,818
44,9
27
15,5
5120
,101
23,8
8327
,256
27,3
23
1,79
32,
362
2,96
13,
375
3,41
6
2,47
9,19
5
2,74
5,40
6
3,45
4,47
4
4,10
6,50
4
4,68
5,00
3
47,3
8958
,195
50,7
7386
,077
84,0
10
31,3
6641
,974
72,1
3070
,135
67,3
57
1,25
9,53
8
1,37
4,50
5
1,67
1,51
1
1,95
4,86
3
2,33
2,07
4
229,
578
261,
147
310,
734
395,
433
455,
476
1,79
7,77
5
2,01
9,47
2
2,56
6,41
9
3,02
6,83
1
3,39
5,22
8
36,6
33
31,6
70
36,1
21
42,5
63
58,4
44
9,15
410
,037
10,0
3611
,621
11,9
31
-1,38
2-2,
652
-2,63
9
16,2
4124
,178
31,0
6334
,357
35,2
20
from 2008 to 2012 (in thousands of euros)

The BOA Network Managing Directorsat 1st August 2013
BOA-BENINFaustin AMOUSSOU
BOA-BURKINA FASOSébastien TONI
BOA-CÔTE D’IVOIRELala MOULAYE
BOA-GHANAKobby ANDAH
BOA-KENYAKwame AHADZI
BOA-MADAGASCARJacques DILET
BOA-MALIMamadou Igor DIARRA
BOA-MER ROUGEAbdelali NADIFI
BOA-NIGERSadio CISSÉ
BOA-RDCBruno DEGOY
BOA-SENEGALLaurent BASQUE
BOA-TANZANIAAmmishaddai OWUSU-AMOAH
BOA-UGANDAEdigold MONDAY
BCBTharcisse RUTUMO
BHBMamadou M'BENGUE
18BANK OF AFRICA GROUP - Annual Report 2012
BOA-TOGOChristophe LASSUS-LALANNE
© BANK OF AFRICA

19Annual Report 2012 - BANK OF AFRICA GROUP
Current situation and outlook for the BANK OF AFRICA Group
Photos pages 19 to 26 : © BANK OF AFRICA.
Despite a challenging economic environment and local socio-political events that in somecases undermined economic activity, BOA Group’s results, as expected, improved duringthe 2012 financial year, thus demonstrating its firm control over its activities.
1. Consolidated financial performance The following indicators show the changes in consolidated accounts between 31 December 2011and the end of the year under review.
Number of branchesThe network expanded with another 32 branches, thus bringing the total number from 338at the end of 2011 to 370 at end of 2012. BOA-MADAGASCAR opened 10 new branches duringthe year.
Number of bank accountsThe number of accounts rose by more than 23% compared to 2011, to 1.432 million, vs. 1.161million one year earlier. The increase was significant in certain Banks, such as BOA-BENIN,BOA-BURKINA FASO, BOA-NIGER and BOA-CÔTE D’IVOIRE.
Bank staffBank staff numbers are under control, with 314 new employees raising the total from 4,187 to 4,501.The change occurred to varying degrees depending on the Bank. BOA-MADAGASCAR, for example,increased its staff numbers, as did BOA-BENIN, while BOA-GHANA outsourced non-banking tasks.
BOA-CÔTE D’IVOIRE: the Riviera Branch, in Abidjan. BOA-BURKINA FASO: the new Tenkodogo Branch.

20BANK OF AFRICA GROUP - Annual Report 2012
Total assetsTotal assets rose by 14% in the year, to 4.4 billion euros at year-end-2012 vs. 3.8 billion eurosin 2011.
Deposits Customer deposits amounted to 3.2 billion euros, an 11% increase compared to 2.9 billion eurosin 2011, with a greater increase in the West African Economic and Monetary Union (WAEMU)and a greater focus on cheaper deposits.
LendingLoan volumes came to 2.2 billion euros, a 20% increase from the 1.9 billion euros of 2011, withstronger growth outside the WAEMU, thus reflecting the Group’s determination to accelerate lending,while remaining cautious in managing risk.
Loans to Deposit RatioThe ratio rose from 59.9% to 64.8%, due to the combined effects on deposits and lending.
Interest margin The Interest margin rose from 127.6 million to 152.3 million euros, hence an 18% increase after thestrong development in lending volumes and better management of deposit costs.
Fees and Other Income This indicator rose by 7%, from 124.1 to 132.9 million euros, but was slightly below budget.
Net Banking Income (NBI)Due to the increase in the above aggregates, NBI rose by 14.5%, from 262.7 to 300.8 millioneuros.
BOA-KENYA: the Credit Department, in Nairobi. BOA-NIGER: the officer at the Electronic Banking Department, in Niamey.

21Annual Report 2012 - BANK OF AFRICA GROUP
Operating costsOperating costs rose by 15%, from 158.4 million to 182.2 million euros, which was slightly abovethe budget projections.
Cost to Income ratioAs a corollary of the increase in the aggregates below, the cost-income ratio was stable at closeto 60%, despite the costs at the most recent Banks and for expansion of the Branch Network.
Gross Operating Income (GOI)GOI rose by 13.6% to 118.6 million euros from 104.3 million euros at the end of 2011.
Provisioning rateAlthough Non-Performing Loans rose in absolute terms, the provisioning rate improved slightlyduring the year.
Net incomeNet income declined by 5%, to 56.2 million euros vs. 59.2 million euros in 2011, due to exceptionalincome in 2011 from AGORA and the amortisation of BOA-GHANA’s goodwill. Hence, based solelyon the perimeter of the Banks, net income rose by about 16%, thus reflecting the momentum of theGroup’s banking activity.
BOA-MALI: the Central Branch banking hall, in Bamako. BOA-RDC: the Central Branch banking hall, in Kinshasa.

22BANK OF AFRICA GROUP - Annual Report 2012
2. Strategy and Major Projects
To expand control over governance and equity capital of subsidiaries• A policy of appointing national figures as Board Chairmen who generally, come from the business sectorand are able to be involved in the Banks’ development, is being promoted and implemented Group-wide.
• A review has been done on unwinding financial stakes and this will be done in stages.
• Harmonisation of dividend payout policy has been implemented at the level of the Banks.
To develop subsidiaries and make them more profitable
Accelerated development and organic growth at subsidiaries in countries with great human andeconomic potential, such as Kenya, Tanzania, Uganda, Ghana, Côte d’Ivoire and Senegal, are nowstrategic priorities.
• It was for this purpose that a new Business Model was introduced throughout the network, in orderto develop the market for retail customers while expanding the business market.
• The development of a loan portfolio is also a major source of leverage, and major improvementshave been made, particularly in procedures and the pooling of Banks’ financial capacities.
• Increasing the proportion of fees in NBI is now a priority for enhancing our subsidiaries’ performanceand profitability.
• Enhanced profitability also requires better control of funding and operating costs, and severalprojects have begun in this area, mainly in organisational terms and their initial effects can alreadybe seen.
• The expansion of preventive risk management is the penultimate component of a strategy thataims mainly to endow the subsidiaries with means for their growth while monitoring the quality oftheir portfolio closely.
• A special effort is currently being made to professionalise debt recovery, a high potential sourceof revenue.
This strategy is being successfully implemented by using the proper tools and executing decisionsbased on a consistent policy, and initial results are already beginning to show up.
BOA-GHANA: the Business Centre, in Ridge.BCB: the Rutana Branch.

23Annual Report 2012 - BANK OF AFRICA GROUP
These projects have been a success, thanks mainly to:
• the application of these measures by the Banks’ teams, who as veteran professionals, understandthat all these initiatives are in the Group’s common interest and are helping it develop;
• a modern and high-performance IT tool that offers flexibility and adjustability for fast and easychanges;
• the Central Structure staff’s commitment to these projects.
To make targeted acquisitions
BOA Group’s ultimate objective is to cover all sub-Saharan countries.
All opportunities for geographical expansion are therefore being reviewed, but based on differentapproaches:
• License applications for newly created subsidiaries;
- as in Togo, where our subsidiary opened in September 2013,
- in Cameroon, where a request is pending that would allow BOA to enter the Central AfricanEconomic and Monetary Community (CEMAC) BMCE BANK is already present in the CEMAC throughCONGOLAISE DE BANQUE.
• market prospection visits and initial contacts,
• participation in tenders.
BOA-BENIN: the “Prêt Ma Maison” campaign visual on the front of the Head Office, in Cotonou.

24BANK OF AFRICA GROUP - Annual Report 2012
For enhanced synergies with BMCE BANK
Joint projects and multi-disciplinary contacts are sources of improvement and mutual enrichment, andtheir number is increasing.
• Two major projects were launched in 2012 with a BMCE BANK subsidiary and consumer lendinginstitution, SALAFIN, in the field of granting car loans and handling their repayments.
• Numerous ties have been established between BOA Group and some of BMCE BANK’s entitiesand departments in numerous areas.
• Practical and hands-on projects are now also being conducted jointly, particularly regarding theinternal control and risk surveillance set-up.
These synergies and contacts, these shared projects, and these cumulative and compared experiencesand know-how are helping BOA Group to modernise, advance and improve constantly.
BOA-TANZANIA: the Mtibwa Branch, in Morogoro. BOA-UGANDA: opening of the Kalongo Branch, in Lira.
BOA-MER ROUGE: the Head Office, in Djibouti. BOA-SENEGAL: Grand Yoff Branch, in Dakar.

25Annual Report 2012 - BANK OF AFRICA GROUP
BOA-MADAGASCAR: the BOA stand at the Madagascar International Fair (FIM).
For controlled planning
Three-Year Development Plans (PTD) are a regulatory requirement in WAEMU countries. Consideredthem a good practice, they have been extended to all BOA Banks since 1998, while being monitoredconstantly and thoroughly.
The main objectives of Three-Year Development Plans are:
• to set up a consistent financial framework for trends in the main activity indicators;
• to determine all actions to be undertaken and structural modifications to be made in order toachieve the targeted results over the three years, through practical, quantified and dated programmes;
• to provide the necessary financial and human resources;
• to mobilise all employees in each Bank to adhere to the objectives and programmes which were set,and to make these Plans a true collective undertaking;
• to mobilise the Central Structure teams to assist the Banks in realising their Development Plans.
Through close cooperation between the Banks’ and the Central Structure teams, work began in July2012 on the 2013-2015 Three-Year Development Plans. Documents were completed at yearendand then approved by the Banks’ respective Boards of Directors.
These Three-Year Development Plans permit a precise, detailed and forward-looking steering of ourbusiness possible.

26BANK OF AFRICA GROUP - Annual Report 2012
Conclusion
With remarkable commercial performance and higher financial results at most Banks,the BANK OF AFRICA Group’s 2012 financial year was highlighted by the continuationand stepping up of structural reforms already begun in 2011. These reforms, along withaction plans that are closely monitored and shared with all subsidiary and Central Structureteams, aim to constantly enhance and optimise the operations of a banking institution thatthis year celebrated its 30th year of activity.
Many of these reforms are made possible and accelerated through synergies with BMCE BANKteams, who have lent their experience and skills and thus made an effective contributionto the BOA Group’s development.
These multi-faceted partnerships will continue in future years, as they provide support thatis often decisive and, in any case is always the source of many new projects that offer anundeniable edge in an African banking landscape that is increasingly competitive andin constant flux.
Through its shareholders and its teams who are both committed and able to manage thechanges and transformations of a constantly shifting environment, BOA Group continuesto grow and develop, with its overall objective still being to promote Africa’s developmentand the well-being of its populations.
BOA INTERNATIONAL MARATHON OF BAMAKO 2012: the winner “men”, Elijah MUTURI KARANJA, from Kenya, crossing the finishing line.

27Annual Report 2012 - BANK OF AFRICA GROUP
BOA
GRO
UP S.A
.BO
A G
roup
holding
place des cineastes. ouagadougouburkina faso. 6 avril 2025. 11:45:05
rond-point de l'aeroport. cotonoubenin. 6 avril 2025. 11:45:05
national theatre, accra - ghana.7th of april 2025, 11:45:05 am
la lagune, abidjan - cote d'ivoire. 6 avril 2025, 11:45:05
lac anosy, antananarivo - madagascar. 12 mai 2025, 11:45:05
Uhuru Gardens, Nairobi - Kenya. April 6th 2025. 11:45:05 AM
© MW DDB

28BANK OF AFRICA GROUP - Annual Report 2012
BOA GROUP S.A. Board of Directors
Following the Annual General Meeting held on 11 June 2013, the BOA GROUP S.A. Board of Directors is composed as follows:
Mohamed BENNANI, Chairman of the Board and Managing Director
Brahim BENJELLOUN-TOUIMI
Driss BENJELLOUN
Paulin COSSI
Paul DERREUMAUX, Chairman Emeritus
Azeddine GUESSOUS
Aziz MEKOUAR
Benardus ZWINKELS
PROPARCO, Director, represented by Marie-Hélène LOISON
BMCE BANK INTERNATIONAL (BBI), Director, represented by Mohammed AGOUMI
The 2012 BANK OF AFRICA Directors meetings, in Arusha, Tanzania.
© Ludovick Swai.
29Annual Report 2012 - BANK OF AFRICA GROUP
Report by the Board of Directors to the Annual General Meeting held on 11 June 2013
In accordance with the legal and regulatory requirements, we have the honor of presenting our reporton your company's activity over the last financial year and submitting for your approval the annualaccounts as at 31 December 2012.
First of all, we remind you that the Company's capital increase was approved by shareholders meetingat the Extraordinary General Meeting of 28 September 2012. It amounted to EUR 10,086,935.00 EURthus raising capital from EUR 60,521,920.00 to 70,608,855.00 through the issue of 65,077 sharesof EUR 155.00 par value each. This capital increase comes with an issue premium of EUR 27,657,725.00,or EUR 425 for each newly issued share.
During the 2012 financial year, we acquired:
- 1,026 shares of the company ATTICA at an acquisition price of EUR 2,120,359.35;- 999 shares of the company BOA-ASSET MANAGEMENT at an acquisition price of EUR 15,229.65;- 14,947 shares of the company AGORA S.A. at an acquisition price of EUR 2,847,086.77;- 2,000 shares of the company BOA-RDC at an acquisition price of USD 2,000,000.00;- 2,574 shares of the company ACTIBOURSE at an acquisition price of EUR 6,552.81;- 4,015,996 shares of the company BOA WEST AFRICA EUR 61,223,464.75, paid in part in cashand in part by converting BOA WEST AFRICA receivables in the amount of EUR 45,978,563.02.
The sale of BOA-NIGER shares to BOA WEST AFRICA generated a EUR 1,443,446.68 capital gainand the sale of BOA-CÔTE D’IVOIRE shares generated a EUR 160,943.10 capital gain.
Meanwhile, the Company sold 59 shares of the company AFRICINVEST at a price of EUR 59,000.00,thus generating a capital gain of EUR 1,307.25.
The company also sold 17 shares of the company ÉQUIPBAIL-MADAGASCAR for a price of EUR 27.89,thus generating a capital loss of EUR 277.01.
The company also sold 20,000 shares of the company COLINA MADAGASCAR for EUR 420,759.29.This sale generated a EUR 239,033.95 capital gain.
As of 31 December 2012, share capital is set at EUR 70,608,855.00 represented by 455,541 sharesof EUR 155.00 par value each, which have been fully paid up.
The book value of our financial investments came to EUR 140,891,632.52, that of our intangible assetscame to EUR 1,352,561.03, and that of our securities came to EUR 918,140.85.

30BANK OF AFRICA GROUP - Annual Report 2012
Receivables total EUR 68,766,680.67, broken down as follows:
- Receivables on affiliated companies, amounting to EUR 65,178,901.92; - Receivables on companies with which the Company has an equity stake, amounting to EUR 149,832.39; - Other receivables of an amount of EUR 3,437,946.36.
As of 31 December 2012, our total debts to credit establishments came to EUR 36,701,727.74; debtson purchases and services amounted to EUR 255,108.38 and other debts to EUR 1,655,367.63.
We booked income on long-term financial investments of EUR 13,883,469.91, income on currentfinancial assets of EUR 36,367.88, and other interest and other financial income of EUR 1,087,499.10.We booked exceptional income of EUR 1,901,211.52.
Our external costs came to EUR 1,457,704.53. We amortised our capital increase costs and our tangibleand intangible assets in the amount of EUR 310,934.48.
We also booked interest and other financing expenses in the amount of EUR 2,907,677.12 and provisionedtax charges in the amount of EUR 370,447.35.
The company has no subsidiaries. The company undertakes no research and development activities.
The accounts of 31 December 2012 showed net profit of EUR 12,129,465.45.
Given the positive balance brought forward from the previous financial year of EUR 4,261,668.28,total net profits came to EUR 16,391,133.73 at 31 December 2012.
We propose to set up an inaccessible reserve for a period of five years by drawing the sum of EUR310,000.00.

31Annual Report 2012 - BANK OF AFRICA GROUP
We propose the following appropriation:
- Legal reserve: EUR 606,473.27 - Inaccessible reserve drawn from available income: EUR 310,000.00 - Dividend to be paid out: EUR 12,129,465.45 - Bonus percentage of profits: EUR 137,500 - New balance brought forward: EUR 3,207,695.01
As for the current financial year, on the basis of the company's business thus far, we project trends similarto those of the previous financial year.
We inform you of the following events that have occurred since the closing of the financial year:
We inform you of the following events that have occurred since the closing of the financial year:BOA-TOGO has just obtained bank certification, allowing the Group to expand its presence in thecountries of the West African Economic and Monetary Union (WAEMU).
BOA GROUP S.A. will be called on during the 2013 financial year to recapitalise its BHB and BOA-KENYA subsidiaries, in order to support their development plans. It is awaiting the approval of theBenin Ministry of Economics and Finance to transfer its residual BHB stake to BOA WEST AFRICA.
For the special case of BOA-MALI, has been relatively spared by the events that have occurred innorthern Mali since March 2012 and it generated a net profit in 2012. BOA-CÔTE D’IVOIRE andBOA-GHANA also made a profit during 2012.
Through a special vote, we request that you grant discharge to the Directors for the performance of theirduties up until 31 December 2012 and to certified Statutory Auditor MAZARS LUXEMBOURG forperformance of its duties with respect to the balance sheet of the year ended 31 December 2012.

32BANK OF AFRICA GROUP - Annual Report 2012
Meanwhile, we ask you to reappoint MAZARS LUXEMBOURG as statutory auditor in charge ofreviewing the full-year financial statements of 31 December 2013. Its term expires after this AnnualGeneral Meeting.
Luxembourg, 11 June 2013
Board of Directors
Mr Mohamed BENNANI Mr Paul DERREUMAUX Director DirectorChairman and Managing Director Chairman Emeritus
Mr Driss BENJELLOUN Mr Brahim BENJELLOUN TOUIMIDirector Director
Mr Paulin COSSI Mr Azeddine GUESSOUSDirector Director
Mr Bernardus ZWINKELS Mr Mohammed AGOUMIDirector Director
PROPARCO BMCE BANK InternationalDirector DirectorMrs Marie Hélène LOISON Mr Mohammed AGOUMI

33Annual Report 2012 - BANK OF AFRICA GROUP
Report by the Authorized Statutory Auditoron the annual accounts on 31 December 2012
In accordance with our appointment by the General Meeting of Shareholders on 15 June 2012, we haveaudited the annual accounts of BOA GROUP S.A., which comprise the consolidated balance sheet andincome statement as at 31 December 2012, the profit and loss account and the annexes containinga summary of the principal accounting methods and other explanatory notes.
Board of Director’s responsibility for preparing and presenting the annual accounts
The Board of Directors is responsible for the preparation and fair presentation of these annual accountsin accordance with legal and regulatory requirements relating to the preparation and presentationof annual accounts in force in Luxembourg, and any international control processes it deems necessaryto enable the preparation of annual accounts that are free from significant anomalies, whether due tofraud or error.
Authorized Statutory Auditor’s responsibility
Our responsibility is to express an opinion on these annual accounts based on our audit. We conductedour audit in accordance with International Standards on Auditing as adopted for Luxembourg by theCommission de Surveillance du Secteur Financier (supervisory authority). These standards require thatwe comply with ethical requirements and plan and perform the audit to obtain reasonable assurancethat the consolidated annual accounts are free from material misstatement.
An audit involves implementing procedures to obtain audit evidence about the amounts and disclosuresjudgment, including assessing the risks of material misstatement of the annual accounts, whether due tofraud or error. In conducting our assessment, the Authorized Statutory Auditor’s consideration internalcontrol implemented in the entity for the preparation and fair presentation of the annual accounts,in order to define appropriate auditing procedures in the circumstances but not with a view to expressingan opinion on the effectiveness of this control.
We believe that the audit evidence we have obtained is sufficient and provides an appropriate basisfor the opinion expressed below.

34BANK OF AFRICA GROUP - Annual Report 2012
Opinion
In our opinion, the annual accounts give a true and fair image of the financial position of BOA GROUP S.A.at 31 December 2012, and of its results for the year ended, in accordance with legal and regulatoryrequirements in force in Luxembourg relating to the preparation and presentation of consolidatedannual accounts.
Report on other legal and regulatory requirements
The management report, which is the responsibility of the Board of Directors, is consistent with theannual accounts.
Luxembourg, 18 March 2013
MAZARS LUXEMBOURGAuthorized Statutory Auditor10A, rue Henri M. SchnadtL-2530 Luxembourg
Laurent DECAENAuthorized Independent Auditor

35Annual Report 2012 - BANK OF AFRICA GROUP
BOA
GRO
UP S.A
.Ba
lance
shee
t and
Profit
& loss
acco
unt
Place de l'independance - Bamako - Mali.6 avril 2025. 11:45:05
Downtown, Djibouti - Djibouti. July 6th 2025. 11:45:05
boulevard du 30 juin. kinshasa - rdc. 6 avril 2025, 11:45:05
rond-point hopital national. niameyniger. 6 avril 2025, 11:45:05
© MW DDB

36BANK OF AFRICA GROUP - Annual Report 2012
Balance sheet at 31 December 2012 (in euros)
AssetsSET-UP EXPENSESINVESTMENTSINTANGIBLE ASSETS
- CONCESSIONS, PATENTS, LICENCES, BRANDS AS WELL AS SIMILAR RIGHTS AND VALUES
* ACQUIRED FOR CONSIDERATION
- PRE-PAYMENTS AND CURRENT INTANGIBLE FIXED ASSETS
FIXED ASSETS- OTHER INSTALLATIONS, TOOLS AND FURNISHINGS
INVESTMENTS IN ASSOCIATE- SHARE IN ASSOCIATED COMPANIES
- SHARE IN ENTITIES IN WHICH THE COMPANY HAS AN EQUITY INVESTMENT
- LOANS TO ENTITIES IN WHICH THE COMPANY HAS AN EQUITY INVESTMENT
- LONG-TERM SECURITIES
- LOANS AND OUTSTANDING DEBTS
CURRENT ASSETSLOANS & ADVANCES
- LOANS & ADVANCES TO AFFILIATED COMPANIES
* WITH A RESIDUAL MATURITY EQUAL TO OR LESS THAN ONE YEAR
- LOANS TO ENTITIES IN WHICH THE COMPANY HAS AN EQUITY INVESTMENT
* WITH A RESIDUAL MATURITY EQUAL TO OR LESS THAN ONE YEAR
- OTHER LOANS & ADVANCES* WITH A RESIDUAL MATURITY EQUAL TO OR LESS THAN ONE YEAR
* WITH A RESIDUAL MATURITY OF MORE THAN ONE YEAR
MARKETABLE SECURITIES- OTHER MARKETABLE SECURITIES
BANK ACCOUNTS, POST OFFICE CHEQUE ACCOUNTS, CHEQUES AND CASH IN HAND
TOTAL ASSETS
LiabilitiesSHAREHOLDERS’ EQUITYREGISTERED CAPITALSHARE PREMIUM AND ASSIMILATED PREMIUMSRESERVES
- LEGAL RESERVE
- RETAINED EARNINGS
RETAINED EARNINGSNET INCOME FOR THIS FINANCIAL PERIODPROVISIONSPROVISIONS FOR TAXESNON-SUBORDINATED DEBTAMOUNTS DUE TO BANKS
- WITH A RESIDUAL MATURITY EQUAL TO OR LESS THAN ONE YEAR
- WITH A RESIDUAL MATURITY OF MORE THAN ONE YEAR
DEBTS ON PURCHASES AND SERVICES- WITH A RESIDUAL MATURITY OF MORE THAN ONE YEAR
TAX AND SOCIAL SECURITY DEBTS- TAX DEBTS
OTHER LIABILITIES- WITH A RESIDUAL MATURITY EQUAL TO OR LESS THAN ONE YEAR
TOTAL LIABILITIES
Fiscal year 2012 Fiscal year 20117 067,38 45 041,38
142 263 630,80 89 861 514,641 352 561,03 607 602,56
1 124 924,03 667 602,561 124 924,03 667 602,56227 637,0019 437,2519 437,25
140 891 632,52 89 193 912,08111 634 074,95 35 039 538,86
9 054 029,68 33 075 197,740,00 3 865 118,19
14 125 502,29 14 981 681,216 078 025,60 2 232 376,08
83 821 442,99 108 942 630,4268 766 680,67 96 858 721,86
65 178 901,92 85 367 102,4165 178 901,92 85 367 102,41
149 832,39 4 714 771,47149 832,39 4 714 771,47
3 437 946,36 6 776 847,983 437 946,36 1 615 291,46
0,00 5 161 556,52918 140,85 916 021,20
918 140,85 916 021,2014 136 621,47 11 167 887,36
226 092 141,17 198 849 186,44
Fiscal year 2012 Fiscal year 2011186 851 412,76 150 156 778,9570 608 855,00 60 521 920,0096 367 516,00 68 709 791,003 483 908,03 2 137 355,03
2 858 908,03 2 137 355,03625 000,00
4 261 668,28 4 356 669,0912 129 465,45 14 431 043,83
628 524,66628 524,66
38 612 203,75 48 692 407,4936 701 727,74 44 527 589,86
6 533 328,64 2 238 184,4430 168 399,10 42 289 405,42255 108,38 439 377,41
255 108,38 439 377,41674 153,55
674 153,551 655 367,63 3 051 286,67
1 655 367,63 3 051 286,67
226 092 141,17 198 849 186,44

37Annual Report 2012 - BANK OF AFRICA GROUP
Profit & loss account (in euros) Expenses
EXPENSES
CONSUMPTION OF GOODS, RAW MATERIALS AND CONSUMABLES
OTHER EXTERNAL EXPENSES
VALUE ADJUSTMENTS
- ON SET-UP COSTS, PROPERTY, PLANT AND EQUIPMENT AND INTANGIBLE AND FIXED ASSETS
VALUE ADJUSTMENTS OF FAIR VALUE ON FINANCIAL ELEMENTS
OF CURRENT ASSETS. LOSSES ON SALE OF SECURITIES
INTEREST AND OTHER FINANCIAL EXPENSES
- OTHER INTEREST AND SIMILAR EXPENSES
EXCEPTIONAL EXPENSES
CORPORATE INCOME TAX
OTHER TAXES NOT INCLUDED IN THE ABOVE ITEMS
NET INCOME FOR THE FINANCIAL YEAR
TOTAL EXPENSES
IncomeINCOME
NET REVENUES
OTHER OPERATING INCOME
INCOME FROM FINANCIAL ASSETS
- FROM RELATED COMPANIES
- OTHER INCOME FROM INVESTMENTS
INCOME ON CURRENT FINANCIAL ASSETS
- OTHER INTEREST AND SIMILAR INCOME
OTHER INCOME FROM INVESTMENTS
- FROM RELATED COMPANIES
- OTHER INTEREST AND SIMILAR INCOME
EXCEPTIONAL INCOME
TOTAL INCOME
Fiscal year 2012 Fiscal year 2011
5 055 785,33 3 745 093,94
8 707,94
1 457 704,53 813 394,82
310 934,48 289 331,16
310 934,48 289 331,16
5 137,52
2 907 677,12 2 069 713,55
2 907 677,12 2 069 713,55
313,91 4 393,34
87 947,35 462 558,55
282 500,00 100 565,00
12 129 465,45 14 431 043,83
17 185 250,78 18 176 137,77
Fiscal year 2012 Fiscal year 2011
17 185 250,78 18 176 137,77
276 702,37 89 872,77
13 883 469,91 15 235 486,00
11 301 789,40 6 383 256,34
2 581 680,51 8 852 229,66
36 367,88
36 367,88
1 087 499,10 2 738 426,95
278 848,40 847 366,91
808 650,70 1 891 060,04
1 901 211,52 112 352,05
17 185 250,78 18 176 137,77

Synopsis
of BANK OF AFRICA Group Companies
© MW DDB38BANK OF AFRICA GROUP - Annual Report 2012

39Annual Report 2012 - BANK OF AFRICA GROUP
BANK OF AFRICA - BENIN 40-41
BANK OF AFRICA - BURKINA FASO 42-43
BANK OF AFRICA - CÔTE D’IVOIRE 44-45
BANK OF AFRICA - GHANA 46-47
BANK OF AFRICA - KENYA 48-49
BANK OF AFRICA - MADAGASCAR 50-51
BANK OF AFRICA - MALI 52-53
BANK OF AFRICA - MER ROUGE 54-55
BANK OF AFRICA - NIGER 56-57
BANK OF AFRICA - RDC 58-59
BANK OF AFRICA - SENEGAL 60-61
BANK OF AFRICA - TANZANIA 62-63
BANK OF AFRICA - UGANDA 64-65
BANQUE DE CREDIT DE BUJUMBURA (BCB) 66-67
BANQUE DE L’HABITAT DU BENIN (BHB) 68-69
ACTIBOURSE 70-71
AGORA 72-73
ATTICA 74-75
BOA-ASSET MANAGEMENT 76-77
BOA-FRANCE 78-79
BANK OF AFRICA - TOGO 80
Contents

40BANK OF AFRICA GROUP - Annual Report 2012
Website: www.boabenin.com
Opening date: January 1990
Legal formS.A.
Capital at 31/12/2012CFAF 10.073 billion
Company registration No.15053 - B - B 0061 F
Board of Directors at 18/4/2013Paulin Laurent COSSI, Chairman
Georges ABALLO
Abbé Jean Joachim ADJOVI
Edwige AKAN AHOUANMENOU
WEST AFRICAN DEVELOPMENT BANK (BOAD),
represented by M’Baye THIAM
Driss BENJELLOUN
Mohamed BENNANI
Paul DERREUMAUX
Benoît MAFFON
Gilbert MEHOU-LOKO
Léon NAKA
Francis SUEUR
Principal Shareholders at 31/12/2012BOA WEST AFRICA 36.61%
BOA GROUP S.A. 14.43%
OTHER BANK OF AFRICA 2.07%
ATTICA S.A. 0.27%
WEST AFRICAN DEVELOPMENT BANK (BOAD) 2.71%
PRIVATE SHAREHOLDERS 43.91%
AuditorsMAZARS BENIN
FIDUCIAIRE D'AFRIQUE
Registered officeAvenue Jean-Paul II - 08 BP 0879 - Cotonou
REPUBLIC OF BENIN
Phone: (229) 21 31 32 28 - Fax: (229) 21 31 31 17
SWIFT: AFRIBJBJ
E-mail: <[email protected]>
Cotonou Branches & Port BranchesAgence Centrale & Elite Phone: (229) 21 31 32 28 - Fax: (229) 21 31 31 17
Aidjèdo Phone: (229) 21 32 59 49 / 56
Akpakpa Phone: (229) 21 33 92 22 / 98 88
Cadjehoun Phone: (229) 21 30 99 38 / 40
Dantokpa Phone: (229) 21 32 65 34 / 41 - Fax: (229) 21 32 65 46
Étoile Rouge Phone: (229) 21 30 99 63 / 69
Fidjrosse Phone: (229) 21 31 32 28
Ganhi Phone: (229) 21 31 02 89 - Fax: (229) 21 31 02 31
Gbèdjromédè Phone: (229) 21 32 64 07
Gbegamey Phone: (229) 21 30 36 84 - Fax: (229) 21 30 36 89
Les Cocotiers Phone: (229) 21 30 10 01 / 16 90 - Fax: (229) 21 30 12 30
Missebo Phone: (229) 21 31 00 18 / 21 31 01 25
PK7 Phone: (229) 21 33 93 62 / 81 - Fax: (229) 21 33 91 62
PK10 Phone: (229) 21 33 14 76 / 79 - Fax: (229) 21 33 20 18
Saint-Michel Phone: (229) 21 32 75 75 - Fax: (229) 21 32 75 74
Sainte Rita Phone: (229) 21 32 25 42 / 39
Segbeya Phone: (229) 21 33 60 64 - Fax: (229) 21 33 67 75
Sodjatime Phone: (229) 21 37 72 58 / 59 / 60
Stade de l’Amitié Phone: (229) 21 38 36 28 - Fax: (229) 21 38 36 29
Zogbo Phone: (229) 21 38 03 55 / 57
Zongo Phone: (229) 21 31 52 04 / 21 31 15 54
Guichet Unique Portuaire 1* Phone: (229) 21 31 32 28 - Fax: (229) 21 31 31 17
Guichet Unique Portuaire 2* Phone: (229) 21 31 77 28 - Fax: (229) 21 31 77 29
*Attached to the Central Branch.
Business CentreAgence Centrale de CotonouPhone: (229) 21 36 53 65 - Fax: (229) 21 31 76 93
Regional BranchesAbomey-Calavi Phone: (229) 21 36 35 69 - Fax: (229) 21 36 35 67
Allada Phone: (229) 21 37 14 66 / 67 - Fax: (229) 21 37 14 68
Azové Phone: (229) 22 46 51 41 - Fax: (229) 22 46 51 48
Bohicon Phone: (229) 22 51 08 11 / 00 - Fax: (229) 22 51 08 22
Cocotomey Phone: (229) 21 35 46 81 / 82 - Fax: (229) 21 35 46 83
Comé Phone: (229) 22 43 07 21
Dassa-Zoumé Phone / Fax: (229) 22 53 02 32
Djougou Phone: (229) 23 80 01 13 / 53 - Fax: (229) 23 80 01 37
Godomey Togoudo Phone: (229) 21 35 30 10 - Fax: (229) 21 35 30 11
Hilacondji Phone: (229) 21 31 32 28 - Fax: (229) 21 31 31 17
Kandi Phone: (229) 23 63 06 10 / 11
LokossaPhone: (229) 22 41 03 81/82 - Fax: (229) 22 41 03 83
Nattitingou Phone: (229) 23 82 02 83 / 84 - Fax: (229) 23 82 02 86
Ouando - Porto-Novo Phone: (229) 20 24 76 76 - Fax: (229) 20 24 76 77
Parakou 1 Phone: (229) 23 61 11 02 - Fax: (229) 23 61 11 03
Parakou 2 Tranza Phone: (229) 23 61 14 56 - Fax: (229) 23 61 14 57
Parakou 3 Kpébié Phone: (229) 23 61 40 42 / 43 - Fax: (229) 23 61 40 44
Pobè Phone: (229) 20 25 05 55
Porto-Novo Phone: (229) 20 21 21 03 - Fax: (229) 20 21 21 34
SavalouPhone: (229) 22 54 08 59/60 - Fax: (229) 22 54 08 61
Sèmè Kraké Phone: (229) 20 06 50 27
BANK OF AFRICA – BENIN
© MW DDB

41Annual Report 2012 - BANK OF AFRICA GROUP
Income 2011 2012Expenses 2011 2012
Liabilities 2011 2012
2010
Assets 2011 2012
INTEREST & SIMILAR INCOME
• ON INTERBANK LOANS
• ON CUSTOMER LOANS
• ON SUBORDINATED LOANS AND SECURITIES
• ON INVESTMENT SECURITIES
• OTHER INTEREST AND SIMILAR INCOME
INCOME FROM LEASING & SIMILAR OPERATIONS
COMMISSION
INCOME FROM FINANCIAL TRANSACTIONS
OTHER INCOME FROM BANKING OPERATIONS
GENERAL OPERATING INCOME
WRITE-BACK OF DEPRECIATION
& PROVISIONS ON FIXED ASSETS
SURPLUS ON VALUE ADJUSTMENTS TO LOANS
& OFF-BALANCE-SHEET ITEMS
EXCESS OF WRITE-BACKS OVER PROVISIONING
OF GENERAL BANKING RISKS
EXCEPTIONAL INCOME
INCOME FROM PREVIOUS YEARS
LOSS
TOTAL INCOME
CASH
INTERBANK LOANS
CUSTOMER LOANS
• PORTFOLIO OF DISCOUNTED BILLS
• OTHER CUSTOMER CREDIT FACILITIES
• ORDINARY DEBTOR ACCOUNTS
• FACTORING
INVESTMENT SECURITIES
FINANCIAL ASSETS
LEASING AND SIMILAR TRANSACTIONS
FINANCIAL ASSETS AT EQUITY VALUE
INTANGIBLE ASSETS
FIXED ASSETS
SHAREHOLDERS & ASSOCIATES
OTHER ASSETS
SUNDRY ACCOUNTS
CONSOLIDATED GOODWILL
TOTAL ASSETS
INTERBANK LIABILITIES
CUSTOMER DEPOSITS
• SAVINGS DEPOSIT ACCOUNTS
• TIME DEPOSIT ACCOUNTS
• SHORT-TERM BORROWINGS
• OTHER DEMAND DEPOSITS
• OTHER TIME DEPOSIT ACCOUNTS
DEBT SECURITIES
OTHER LIABILITIES
SUNDRY ACCOUNTS
RESERVES FOR CONTINGENCIES & LOSSES
STATUTORY PROVISIONS
EARMARKED FUNDS
SUBORDINATED LOANS & SECURITIES
INVESTMENT SUBSIDIES
RESERVES FOR GENERAL BANKING RISKS
CAPITAL OR APPROPRIATIONS
SHARE PREMIUMS
RESERVES
RETAINED EARNINGS ( +/- )
NET INCOME
TOTAL LIABILITIES
91 965 016 263 132 963 620 207
382 461 422 625 400 589 120 558
52 769 875 357 59 508 593 243
679 472 873 821 943 022
199 618 477 285 184 726 493 541
129 393 597 110 155 532 090 752
3 600 000 000 2 400 000 000
8 094 298 612 5 679 675 713
9 270 748 372 15 799 852 102
338 619 451 2 542 142 584
8 838 331 691 7 198 194 805
10 072 680 000 10 072 680 000
10 492 915 761 10 492 915 761
18 036 523 916 22 179 905 884
673 438 426 123 530 914
7 622 546 456 7 826 187 450
551 466 541 573 617 867 825 978
25 918 118 978 27 621 037 520
2 639 711 134 3 029 200 705
20 903 871 635 21 294 521 473
22 750 353 2 519 113
2 351 785 856 3 294 796 229
1 380 410 245 918 152 053
4 671 345 917 4 081 065 670
17 778 994 699 18 964 617 664
132 668 385 430 022 855
653 348 452 1 354 965 731
1 640 136 886
115 391 641 215 601 804
43 501 583 103 163 607
50 693 779 900 55 328 763 790
INTEREST AND SIMILAR EXPENSES
• ON INTERBANK LIABILITIES
• ON CUSTOMER DEPOSITS
• ON DEBT SECURITIES
• ON SHAREHOLDERS’ & ASSOCIATES’ BLOCKED ACCOUNTS
AND ON SUBORDINATED DEBT
• OTHER INTEREST AND SIMILAR EXPENSES
EXPENSES ON LEASING AND SIMILAR OPERATIONS
COMMISSION
EXPENSES ON FINANCIAL OPERATIONS
OTHER BANK OPERATING EXPENSES
OPERATING OVERHEADS
• PERSONNEL COSTS
• OTHER OVERHEADS
DEPRECIATION AND PROVISIONS
ON FIXED ASSETS
DEFICIT ON VALUE ADJUSTMENTS TO LOANS
& OFF-BALANCE-SHEET ITEMS
EXCESS OF PROVISIONING OVER WRITE-BACKS
OF GENERAL BANKING RISKS
EXCEPTIONAL EXPENSES
LOSSES FROM PREVIOUS YEARS
CORPORATE INCOME TAX
PROFIT
TOTAL EXPENSES
13 375 291 513 16 753 263 272
56 772 299 476 80 077 472 496
220 317 296 285 223 446 536 255
3 811 023 715 1 510 177 690
197 119 249 646 201 604 658 289
19 387 022 924 20 331 700 276
186 755 556 239 189 728 226 337
41 480 299 088 69 809 129 529
1 372 901 809 304 447 547
561 694 444 586 717 867
14 375 757 421 15 604 118 216
8 935 366 751 13 490 006 921
7 520 078 547 8 067 907 538
551 466 541 573 617 867 825 978
13 813 212 868 15 923 262 800
2 345 736 038 3 686 014 920
11 184 804 840 12 052 572 811
258 667 397 184 675 069
24 004 593
1 549 138 480 989 915 876
126 758 442 153 529 940
3 273 078 207 3 294 625 623
145 264 583 191 748 546
12 489 355 517 13 967 680 457
5 706 491 852 6 163 813 534
6 782 863 665 7 803 866 923
1 751 577 443 1 850 659 222
8 840 480 139 10 307 092 169
316 377 138 197 164 544
263 295 027 223 575 320
502 695 600 403 321 843
7 622 546 456 7 826 187 450
50 693 779 900 55 328 763 790
(In CFAF) At 31.12.12, 1 Euro = 655.957 CFAF
BANK OF AFRICA – BENIN

42BANK OF AFRICA GROUP - Annual Report 2012 © MW DDB
Website: www.boaburkinafaso.com
Opening date: March 1998
Legal formS.A.
Capital at 31/12/2012CFAF 8 billion
Company registration No.B F OUA 2000 B647
Board of Directors at 5/4/2013Lassiné DIAWARA, Chairman
BANK OF AFRICA WEST AFRICA,
represented by Lala MOULAYE
BANK OF AFRICA – NIGER,
represented by Boureima WANKOYE
Mohamed BENNANI
CAURIS CROISSANCE, represented by Noël Yawo EKLO
Mamadou KA
Delchan OUEDRAOGO
UAB-VIE, represented by Soumaila SORGHO
Abderrazzak ZEBDANI
Principal Shareholders at 31/12/2012BOA WEST AFRICA 52.38%
PRIVATE SHAREHOLDERS 23.87%
LASSINE DIAWARA 10.24%
UNION DES ASSURANCES DU BURKINA-VIE 8.98%
ATTICA S.A. 3.89%
CAURIS CROISSANCE 0.41%
OTHER BANK OF AFRICA 0.23%
AuditorsSOFIDEC-SARL
CABINET ROSETTE NACRO
Registered office770, Avenue du Président Aboubacar Sangoulé Lamizana
01 BP 1319 - Ouagadougou 01 - BURKINA FASO
Phone: (226) 50 30 88 70 to 73 - Fax: (226) 50 30 88 74
Telex: 5543 (BF) - SWIFT: AFRIBFBF
E-mail: <[email protected]>
Ouagadougou BranchesAgence CentralePhone: (226) 50 30 88 70 to 73Fax: (226) 50 30 88 74
Agence ElitePhone: (226) 50 49 79 08Fax: (226) 50 30 88 74
Boulevard France-AfriquePhone: (226) 50 38 05 45Fax: (226) 50 38 05 48
Dassasgho-Zone 1Phone: (226) 50 33 20 21Fax: (226) 50 33 20 22
GounghinPhone: (226) 50 34 50 00Fax: (226) 50 34 43 14
Kwamé N'KrumahPhone: (226) 50 30 19 88 / 89Fax: (226) 50 30 19 93
Maison de l'EntreprisePhone: (226) 50 30 88 70Fax: (226) 50 30 88 74
Marché Central Rood-WookoPhone: (226) 50 30 88 70Fax: (226) 50 30 88 74
NemninPhone: (226) 50 33 20 21Fax: (226) 50 33 20 22
Ouaga 2000Phone: (226) 50 37 69 68Fax: (226) 50 37 69 76
PissyPhone: (226) 50 43 72 14Fax: (226) 50 43 72 13
TampouyPhone: (226) 50 49 79 28Fax: (226) 50 35 34 00
UEMOAPhone: (226) 50 79 49 58Fax: (226) 50 30 88 74
ZogonaPhone: (226) 50 36 85 27Fax: (226) 50 36 85 28
Business CentreAgence Centrale de OuagadougouPhone: (226) 50 30 88 70 to 73Fax: (226) 50 30 88 74
Regional BranchesBanforaPhone: (226) 70 21 73 73Fax: (226) 20 97 39 16
Bobo-DioulassoPhone: (226) 20 97 39 15Fax: (226) 20 97 39 16
Bobo-Dioulasso / Agence du BoulevardPhone: (226) 20 97 51 14Fax: (226) 20 97 51 16
Bobo-Dioulasso / Agence du MarchéPhone: (226) 20 97 51 05Fax: (226) 20 97 51 06
DédougouPhone: (226) 20 52 12 34Fax: (226) 20 52 12 37
DoriPhone: (226) 70 21 22 70Fax: (226) 40 46 80 95
EssakanePhone: (226) 40 46 80 94Fax: (226) 40 46 80 95
Fada N'GourmaPhone: (226) 40 77 17 74Fax: (226) 40 77 17 75
GaouaPhone: (226) 20 97 39 15Fax: (226) 20 97 39 16
KoudougouPhone: (226) 50 44 07 45Fax: (226) 50 44 07 46
KoupelaPhone: (226) 40 70 04 44Fax: (226) 40 70 04 33
PouytengaPhone: (226) 40 70 66 66Fax: (226) 40 70 60 66
TenkodogoPhone: (226) 40 70 04 44Fax: (226) 40 70 04 33
BANK OF AFRICA – BURKINA FASO

43Annual Report 2012 - BANK OF AFRICA GROUP (In CFAF) At 31.12.12, 1 Euro = 655.957 CFAF
Income 2011 2012Expenses 2011 2012
Liabilities 2011 2012
2010
Assets 2011 2012
INTEREST & SIMILAR INCOME
• ON INTERBANK LOANS
• ON CUSTOMER LOANS
• ON SUBORDINATED LOANS AND SECURITIES
• ON INVESTMENT SECURITIES
• OTHER INTEREST AND SIMILAR INCOME
INCOME FROM LEASING & SIMILAR OPERATIONS
COMMISSION
INCOME FROM FINANCIAL TRANSACTIONS
OTHER INCOME FROM BANKING OPERATIONS
GENERAL OPERATING INCOME
WRITE-BACK OF DEPRECIATION
AND PROVISIONS ON FIXED ASSETS
SURPLUS ON VALUE ADJUSTMENTS TO LOANS
& OFF-BALANCE-SHEET ITEMS
EXCESS OF WRITE-BACKS OVER PROVISIONING
OF GENERAL BANKING RISKS
EXCEPTIONAL INCOME
INCOME FROM PREVIOUS YEARS
LOSS
TOTAL INCOME
CASH
INTERBANK LOANS
CUSTOMER LOANS
• PORTFOLIO OF DISCOUNTED BILLS
• OTHER CUSTOMER CREDIT FACILITIES
• ORDINARY DEBTOR ACCOUNTS
• FACTORING
INVESTMENT SECURITIES
FINANCIAL ASSETS
LEASING AND SIMILAR TRANSACTIONS
FINANCIAL ASSETS AT EQUITY VALUE
INTANGIBLE ASSETS
FIXED ASSETS
SHAREHOLDERS & ASSOCIATES
OTHER ASSETS
SUNDRY ACCOUNTS
CONSOLIDATED GOODWILL
TOTAL ASSETS
INTERBANK LIABILITIES
CUSTOMER DEPOSITS
• SAVINGS DEPOSIT ACCOUNTS
• TIME DEPOSIT ACCOUNTS
• SHORT-TERM BORROWINGS
• OTHER DEMAND DEPOSITS
• OTHER TIME DEPOSIT ACCOUNTS
DEBT SECURITIES
OTHER LIABILITIES
SUNDRY ACCOUNTS
RESERVES FOR CONTINGENCIES & LOSSES
STATUTORY PROVISIONS
EARMARKED FUNDS
SUBORDINATED LOANS & SECURITIES
INVESTMENT SUBSIDIES
RESERVES FOR GENERAL BANKING RISKS
CAPITAL OR APPROPRIATIONS
SHARE PREMIUMS
RESERVES
RETAINED EARNINGS ( +/- )
NET INCOME
TOTAL LIABILITIES
27 915 093 811 41 101 033 780
223 017 515 171 261 785 183 574
27 369 921 229 37 898 636 999
153 911 618
96 801 133 650 118 066 632 150
98 846 460 292 105 666 002 807
1 800 000 000 5 200 000 000
7 501 457 240 7 909 227 520
2 196 620 107 2 712 367 022
640 334 662 467 870 157
3 324 739 968 3 884 739 968
8 000 000 000 8 000 000 000
2 691 000 000 2 691 000 000
1 761 018 396 2 495 673 126
2 204 016 013 3 967 059 482
4 897 698 199 7 916 249 677
285 949 493 567 348 130 404 306
13 977 472 486 16 809 582 036
1 918 363 187 1 787 073 447
12 059 109 299 15 022 508 589
9 000 000 750 000
2 360 694 577 2 548 334 316
6 395 123 906 8 757 614 282
144 681 765 198 886 802
966 329 492 1 419 415 660
1 871 768 20 299 119
140 257 117 108 436 138
172 835 556 224 834 393
24 168 266 667 30 088 152 746
INTEREST AND SIMILAR EXPENSES
• ON INTERBANK LIABILITIES
• ON CUSTOMER DEPOSITS
• ON DEBT SECURITIES
• ON SHAREHOLDERS’ & ASSOCIATES’ BLOCKED ACCOUNTS
AND ON SUBORDINATED DEBT
• OTHER INTEREST AND SIMILAR EXPENSES
EXPENSES ON LEASING AND SIMILAR OPERATIONS
COMMISSION
EXPENSES ON FINANCIAL OPERATIONS
OTHER BANK OPERATING EXPENSES
OPERATING OVERHEADS
• PERSONNEL COSTS
• OTHER OVERHEADS
DEPRECIATION AND PROVISIONS
ON FIXED ASSETS
DEFICIT ON VALUE ADJUSTMENTS TO LOANS
& OFF-BALANCE-SHEET ITEMS
EXCESS OF PROVISIONING OVER WRITE-BACKS
OF GENERAL BANKING RISKS
EXCEPTIONAL EXPENSES
LOSSES FROM PREVIOUS YEARS
CORPORATE INCOME TAX
PROFIT
TOTAL EXPENSES
8 101 268 023 8 912 362 168
46 521 972 757 40 590 318 059
139 206 326 941 191 615 308 004
1 997 612 522 5 327 341 566
126 359 720 106 160 349 877 165
10 380 009 492 22 494 012 223
468 984 821 3 444 077 050
76 303 501 427 84 008 154 820
2 292 389 070 1 979 474 553
159 453 835 206 108 258
3 847 967 413 4 915 794 786
8 959 012 357 14 607 789 624
557 601 744 1 295 094 034
285 949 493 567 348 130 404 306
7 445 514 665 8 913 073 393
902 967 921 1 229 641 766
6 542 546 744 7 533 033 887
150 397 740
172 188 850 163 618 446
192 313 940 26 822 314
65 555 660 56 320 761
6 690 476 083 8 214 339 325
2 251 089 305 2 908 312 055
4 439 386 778 5 306 027 270
725 477 471 914 493 019
1 787 046 355 687 106 036
530 000 000 560 000 000
132 596 018 86 687 511
125 625 076 181 399 389
1 403 774 350 2 368 042 875
4 897 698 199 7 916 249 677
24 168 266 667 30 088 152 746
BANK OF AFRICA – BURKINA FASO

44BANK OF AFRICA GROUP - Annual Report 2012
Website: www.boacoteivoire.com
Opening date: January 1996Created in 1980: BANAFRIQUE. Integrated into BOA network in 1996.
Legal formS.A.
Capital at 31/12/2012CFAF 7.2 billion
Company registration No.CI-ABJ-1980-B-48869
Board of Directors at 18/4/2013 Léon NAKA, Chairman
Mamoun BELGHITI
Mohamed BENNANI
BOA-BENIN, represented by Benoît MAFFON
BOA WEST AFRICA, represented by Mamadou KA
Ousmane DAOU
Tiémoko KOFFI
Abderrazzak ZEBDANI
Principal Shareholders at 31/12/2012BOA WEST AFRICA 64.35%
ATTICA S.A. 3.34%
AGORA HOLDING 2.47%
BANK OF AFRICA – BENIN 2.35%
PRIVATE SHAREHOLDERS 27.49%
AuditorsMAZARS CÔTE D'IVOIRE
ERNST & YOUNG-CCCA
Registered officeAbidjan Plateau
Angle Avenue Terrasson de Fougères - Rue Gourgas
01 BP 4132 Abidjan 01 - CÔTE D'IVOIRE
Phone: (225) 20 30 34 00 - Fax: (225) 20 30 34 01
SWIFT: AFRICIAB
E-mail: <[email protected]>
Abidjan BranchesAgence Centrale Phone: (225) 20 30 34 00 Fax: (225) 20 30 34 01
Agence Elite Phone: (225) 20 30 34 00 / 12 Fax: (225) 20 30 34 01
Adjamé Phone: (225) 20 30 12 30 to 32 Fax: (225) 20 30 12 33
Angré DjibiPhone: (225) 22 50 19 60Fax: (225) 22 50 19 61
Biétry Phone: (225) 21 35 18 39 to 42 Fax: (225) 21 35 18 43
Commerce Phone: (225) 20 33 13 90 Fax: (225) 20 33 23 98
Marcory Phone: (225) 21 21 79 90 to 98 Fax: (225) 21 21 79 99
II Plateaux Phone: (225) 22 52 75 35 to 38 Fax: (225) 22 52 75 39
Riviera 3 Phone: (225) 22 40 01 80 to 87 Fax: (225) 22 40 01 88
Treichville Phone: (225) 21 75 55 00 / 01 Fax: (225) 21 75 55 02
Vridi Phone: (225) 21 21 80 20 to 23 Fax: (225) 21 21 80 24
Yopougon Phone: (225) 23 53 53 30 to 32 Fax: (225) 23 53 53 33
Zone 4 Phone: (225) 21 75 19 11 to 19 Fax: (225) 21 75 19 10
Business CentreAgence Centrale d’AbidjanPhone: (225) 20 25 54 54Fax: (225) 20 25 59 59
Regional BranchesBouaké Phone: (225) 31 65 92 20 Fax: (225) 31 65 92 24
Daloa Phone: (225) 32 78 82 35 Fax: (225) 32 78 82 39
Gagnoa Phone: (225) 32 77 86 65 to 67 Fax: (225) 32 77 86 69
Korhogo Phone: (225) 36 85 01 10 Fax: (225) 36 85 01 13
San Pedro Phone: (225) 34 71 73 50 to 55 Fax: (225) 34 71 73 51
Sinfra Phone: (225) 30 68 14 40 Fax: (225) 30 68 14 43
Soubré Phone: (225) 34 72 20 02 / 28 Fax: (225) 34 72 20 32
Yamoussoukro Phone: (225) 30 64 63 10 Fax: (225) 30 64 63 13
Local BranchSan Pedro-Bardot Phone: (225) 34 71 97 70 to 78 Fax: (225) 34 71 97 79
BANK OF AFRICA – CÔTE D’IVOIRE
© MW DDB

45Annual Report 2012 - BANK OF AFRICA GROUP
Income 2011 2012Expenses 2011 2012
Liabilities 2011 2012
2010
Assets 2011 2012
INTEREST & SIMILAR INCOME
• ON INTERBANK LOANS
• ON CUSTOMER LOANS
• ON SUBORDINATED LOANS AND SECURITIES
• ON INVESTMENT SECURITIES
• OTHER INTEREST AND SIMILAR INCOME
INCOME FROM LEASING & SIMILAR OPERATIONS
COMMISSION
INCOME FROM FINANCIAL TRANSACTIONS
OTHER INCOME FROM BANKING OPERATIONS
GENERAL OPERATING INCOME
WRITE-BACK OF DEPRECIATION
AND PROVISIONS ON FIXED ASSETS
SURPLUS ON VALUE ADJUSTMENTS TO LOANS
& OFF-BALANCE-SHEET ITEMS
EXCESS OF WRITE-BACKS OVER PROVISIONING
OF GENERAL BANKING RISKS
EXCEPTIONAL INCOME
INCOME FROM PREVIOUS YEARS
LOSS
TOTAL INCOME
CASH
INTERBANK LOANS
CUSTOMER LOANS
• PORTFOLIO OF DISCOUNTED BILLS
• OTHER CUSTOMER CREDIT FACILITIES
• ORDINARY DEBTOR ACCOUNTS
• FACTORING
INVESTMENT SECURITIES
FINANCIAL ASSETS
LEASING AND SIMILAR TRANSACTIONS
FINANCIAL ASSETS AT EQUITY VALUE
INTANGIBLE ASSETS
FIXED ASSETS
SHAREHOLDERS & ASSOCIATES
OTHER ASSETS
SUNDRY ACCOUNTS
CONSOLIDATED GOODWILL
TOTAL ASSETS
INTERBANK LIABILITIES
CUSTOMER DEPOSITS
• SAVINGS DEPOSIT ACCOUNTS
• TIME DEPOSIT ACCOUNTS
• SHORT-TERM BORROWINGS
• OTHER DEMAND DEPOSITS
• OTHER TIME DEPOSIT ACCOUNTS
DEBT SECURITIES
OTHER LIABILITIES
SUNDRY ACCOUNTS
RESERVES FOR CONTINGENCIES & LOSSES
STATUTORY PROVISIONS
EARMARKED FUNDS
SUBORDINATED LOANS & SECURITIES
INVESTMENT SUBSIDIES
RESERVES FOR GENERAL BANKING RISKS
CAPITAL OR APPROPRIATIONS
SHARE PREMIUMS
RESERVES
RETAINED EARNINGS ( +/- )
NET INCOME
TOTAL LIABILITIES
31 834 022 746 37 945 789 003
160 218 227 423 204 157 801 884
12 464 308 535 16 307 120 581
1 148 845 860 1 285 222 696
5 727 306 688 4 587 685 209
85 569 183 605 111 407 975 825
55 308 582 735 70 569 797 573
1 800 000 000 5 200 000 000
2 866 495 264 3 158 504 677
1 159 373 857 1 930 314 669
1 573 576 000 1 062 384 000
473 801 909 782 879 763
7 200 000 000 7 200 000 000
1 675 372 000 1 675 372 000
4 992 873 482 4 992 873 482
593 286 695 106 608 717
-486 677 978 3 118 638 843
213 900 351 398 271 331 167 038
11 353 003 853 12 682 205 409
1 119 872 042 1 157 032 044
10 132 625 783 11 517 526 837
100 506 028 7 646 528
2 020 965 010 3 696 916 941
2 393 319 884 3 651 798 043
568 591 042 442 460 775
183 823 752 428 986 368
946 867 9 643 984
164 213 345 81 753 236
486 677 978
17 171 541 731 20 993 764 756
INTEREST AND SIMILAR EXPENSES
• ON INTERBANK LIABILITIES
• ON CUSTOMER DEPOSITS
• ON DEBT SECURITIES
• ON SHAREHOLDERS’ & ASSOCIATES’ BLOCKED ACCOUNTS
AND ON SUBORDINATED DEBT
• OTHER INTEREST AND SIMILAR EXPENSES
EXPENSES ON LEASING AND SIMILAR OPERATIONS
COMMISSION
EXPENSES ON FINANCIAL OPERATIONS
OTHER BANK OPERATING EXPENSES
OPERATING OVERHEADS
• PERSONNEL COSTS
• OTHER OVERHEADS
DEPRECIATION AND PROVISIONS
ON FIXED ASSETS
DEFICIT ON VALUE ADJUSTMENTS TO LOANS
& OFF-BALANCE-SHEET ITEMS
EXCESS OF PROVISIONING OVER WRITE-BACKS
OF GENERAL BANKING RISKS
EXCEPTIONAL EXPENSES
LOSSES FROM PREVIOUS YEARS
CORPORATE INCOME TAX
PROFIT
TOTAL EXPENSES
6 286 792 093 7 809 026 594
44 214 346 506 44 237 489 207
115 673 697 640 151 031 459 288
5 834 805 789 10 815 642 178
87 868 957 153 113 224 880 636
21 969 934 698 26 990 936 474
22 800 104 312 49 823 430 980
4 539 958 044 4 943 975 781
241 877 257 259 996 930
6 138 398 679 6 927 614 856
13 320 881 056 5 456 249 177
684 295 811 841 924 225
213 900 351 398 271 331 167 038
6 199 417 450 7 477 926 343
2 457 481 518 2 530 094 576
3 611 990 726 4 694 281 008
129 945 206 173 051 507
80 499 252
106 536 056 266 778 931
5 063 988 563 713
194 960 827 166 268 130
6 421 924 824 7 437 817 818
2 539 865 490 3 002 107 740
3 882 059 334 4 435 710 078
829 068 327 946 811 634
3 072 733 913 1 089 376 862
31 224 691 309 077 854
31 169 200 22 080 127
252 932 039 125 362 421
26 510 416 33 062 080
3 118 638 843
17 171 541 731 20 993 764 756
BANK OF AFRICA – CÔTE D’IVOIRE
(In CFAF) At 31.12.12, 1 Euro = 655.957 CFAF

46BANK OF AFRICA GROUP - Annual Report 2012
Website: www.boaghana.com
Opening date: December 2011Created in 1999: AMALBANK. Integrated into BOA network in 2011.
Legal formLimited Liability Company
Capital at 31/12/2012Ghana Cedis 77.46 million
Company registration No.C-74,833
Board of Directors at 28/3/2013 Stephan ATA, Chairman
Kwame AHADZI
Kobby ANDAH
Dr. Patrick ATA
Abdelkabir BENNANI
Mohamed BENNANI
Vincent de BROUWER
Paul DERREUMAUX
John KLINOGO
Nana OWUSU-AFARI
Principal Shareholders at 31/12/2012BOA WEST AFRICA 92.76%
ESTATE OF DR. H. O. K. ATA 4.44%
NANA OWUSU-AFARI 1.67%
OTHER SHAREHOLDERS 1.13%
AuditorERNST & YOUNG
Registered officeC131/3, Farrar Avenue - Adabraka
P. O. Box C1541 - Cantonments - Accra - GHANA
Phone: (233) 302 24 9690
Fax: (233) 302 24 9697
E-mail: <[email protected]>
Accra BranchesAgence Centrale Phone: (233) 302 24 9690 Fax: (233) 302 24 9697
Abossey Okai Phone: (233) 302 685 225 / 6 Fax: (233) 302 685 239
Accra Central Phone: (233) 302 674 484 / 86 Fax: (233) 302 674 487
Dansoman Phone: (233) 302 312 840 / 1 Fax: (233) 302 312 847
Elite BankingPhone: (233) 302 249 690 Fax: (233) 302 249 697
East Legon Phone: (233) 302 520 453 - 5 / 302 520 460 Fax: (233) 302 520 457
Kwashieman Phone: (233) 302 420 045 / 6 Fax: (233) 302 420 049
Maamobi Phone: (233) 302 237 144 / 235 644 / 236 394 Fax: (233) 302 237 132
Madina Phone: (233) 302 522 072 / 3 Fax: (233) 302 522 216
Michel Camp Phone: (233) 303 300 770 / 300 740 Fax: (233) 303 300 742
New TownPhone: (233) 302 243 310 / 243 332 / 243 306 Fax: (233) 302 243 321
Osu Phone: (233) 302 769 588 / 769 518 Fax: (233) 302 769 856
Spintex Phone: (233) 302 816 840 / 1 Fax: (233) 302 816 847
Tema Phone: (233) 303 207 976 / 207 967 / 207 960 Fax: (233) 303 207 981
Business CentreRidge Business CentrePhone: (233) 302 242 100 / 243 488Fax: (233) 302 243 406
Regional BranchesAdumPhone: (233) 3220 491 12 / 3 Fax: (233) 3220 491 19
AmakomPhone: (233) 3220 344 07 / 363 12 Fax: (233) 3220 342 41
SokobanPhone: (233) 28 924 9690 / 1 Fax: (233) 3220 491 19
Takoradi Phone: (233) 3120 232 00 Fax: (233) 3120 246 17
Tamale Phone: (233) 3720 270 12 / 270 13 Fax: (233) 3720 270 15
BANK OF AFRICA – GHANA
© MW DDB

47Annual Report 2012 - BANK OF AFRICA GROUP
2012 2011Income statement
Liabilities 2012 2011
2010
Assets 2012 2011
CASH AND BALANCES WITH CENTRAL BANK
GOVERNMENT SECURITIES
DEPOSITS AND BALANCES DUE FROM BANKING INSTITUTIONS
OTHER INVESTMENTS
LOANS AND ADVANCES TO CUSTOMERS
CURRENT INCOME TAX
PROPERTY AND EQUIPMENT
OTHER ASSETS
TOTAL ASSETS
CUSTOMER DEPOSITS
INTERBANK LIABILITIES
LONG TERM BORROWINGS
OTHER LIABILITIES
TOTAL LIABILITIES
SHARE CAPITAL
STATUTORY PROVISIONS
RETAINED EARNINGS (+/-)
CREDIT RISK RESERVE
TOTAL SHAREHOLDERS EQUITY
TOTAL LIABILITIES
364 043 606 295 625 250
112 798 200 20 841 000
11 037 576 14 319 106
17 149 826 14 376 608
505 029 208 345 161 964
77 460 828 60 460 828
8 858 392 7 817 701
-34 393 132 -31 111 724
10 631 087 6 268 000
62 557 175 43 434 805
567 586 383 388 596 769
62 633 432 52 752 796
-30 489 006 -29 739 432
32 144 426 23 013 364
11 456 333 7 865 658
-437 035 -179 619
11 019 298 7 686 039
7 796 788 4 336 793
50 960 512 35 036 196
-34 344 545 -31 139 265
-14 252 053 -17 420 756
2 363 914 -13 523 825
-282 531 -136 727
2 081 383 -13 660 552
INTEREST INCOME
INTEREST EXPENSE
NET INTEREST INCOME
FEE AND COMMISSION INCOME
FEE AND COMMISSION EXPENSE
NET FEE AND COMMISSION INCOME
OTHER INCOME
OPERATING INCOME
OPERATING EXPENSES
IMPAIRMENT LOSSES ON LOANS AND ADVANCES
PROFIT BEFORE INCOME TAX
NATIONAL STABILIZATION LEVY
INCOME TAX EXPENSE
NET INCOME
51 069 089 41 222 393
154 707 584 76 039 100
24 193 967 53 884 030
305 099 221 196 217 569
1 561 705 490 500
9 230 241 7 104 320
21 724 576 13 638 857
567 586 383 388 596 769
BANK OF AFRICA – GHANA
(In GHS) At 31.12.12, 1 Euro = 2.4848 Ghana Cedis

48BANK OF AFRICA GROUP - Annual Report 2012
Website: www.boakenya.com
Opening date: July 2004Created in 1981: BANQUE INDOSUEZ Kenyan Branch> CREDIT AGRICOLE–INDOSUEZ > CALYON.Incorporated under Kenyan law, integrated as a subsidiary into BOA network in 2004.
Legal formLimited Company
Capital at 31/12/2012Kenyan Shillings (KES) 3.4 billion
Company registration No.105918
Board of Directors at 15/3/2013 Ambassador Dennis AWORI, Chairman
Kwame AHADZI
Abdelkabir BENNANI
Mohamed BENNANI
Vincent de BROUWER
Jean-Geo PASTOURET
Alexandre RANDRIANASOLO
Bernardus A. M. ZWINKELS
Principal Shareholders at 31/12/2012BANK OF AFRICA – BENIN 15.84%
AFH-OCEAN INDIEN 14.01%
BANK OF AFRICA – MADAGASCAR 11.65%
BANK OF AFRICA – CÔTE D'IVOIRE 11.00%
BOA GROUP S.A. 10.00%
AGORA S.A. 2.00%
NETHERLANDS DEVELOPMENT FINANCE
COMPANY (FMO) 20.00%
AUREOS EAST AFRICAN FUND LLC 10.41%
AUREOS AFRICAN FUND LLC 5.09%
AuditorPRICEWATERHOUSECOOPERS
Registered officeReinsurance Plaza - Taifa Road
P.O. Box 69562 - 00400 - Nairobi - KENYA
Phone: (254) 20 327 50 00 / 221 11 75
Fax: (254) 20 221 41 66
E-mail: <[email protected]>
Nairobi BranchesEmbakasi Phone: (254) 20 327 5427 / 30 Fax: (254) 20 211 477
Galleria Phone: (254) 20 327 5531 / 5 / 6 - 20 2085366 Fax: (254) 20 221 41 66
Greenspan Phone: (254) 20 327 5141 / 4 - 20 2636559 Fax: (254) 20 211 41 66
Kitengela Phone: (254) 20 327 5504 / 5 - 61 2311609 Fax: (254) 20 221 41 66
Lunga Lunga Phone: (254) 20 327 5153 / 4
Monrovia Street Phone: (254) 20 327 5281 - 20 316501 / 2 Fax: (254) 20 315 556
Nairobi Phone: (254) 20 327 5319 / 291 - 20 2211175 Fax: (254) 20 221 41 66 / 221 14 77
Ngong Road Phone: (254) 20 327 5409 / 11
Ongata Rongai Phone: (254) 327 5638 / 640 - 20 2145879 Fax: (254) 45 - 312 40 61
River Road Phone: (254) 20 327 5298 / 0Fax: (254) 20 249 04 2
Ruaraka Phone: (254) 20 327 5605 / 6 Fax: (254) 856 62 750 00
Uhuru Highway Phone: (254) 20 327 5404 / 262Fax: (254) 20 650 219
Upper HillPhone: (254) 20 327 5447 / 9 Fax: (254) 20 221 41 66
Westlands Phone: (254) 20 327 5273 / 5 - 20 2100633Fax: (254) 20 445 05 68
Regional BranchesBungoma Phone: (254) 20 3275 5664 / 5 Fax: (254) 20 221 1477
Changamwe Phone: (254) 20 327 5655 / 6 - 041 3430018Fax: (254) 41 231 29 99
Eldoret Phone: (254) 20 327 5632 / 0 Fax: (254) 20 211 47 7
Kericho Phone: (254) 20 327 5649 / 50 - 052 23275592 Fax: (254) 052 307 05
Kisii Phone: (254) 20 327 5680 / 678 - 058 30321
Kisumu Phone: (254) 20 327 5601 / 2 - 20 2674917
Meru Phone: (254) 20 327 5687 / 91 - 064 32899
Mombasa Phone: (254) 20 327 5112 / 23 - 041 2315816 / 8 / 9 Fax: (254) 41 231 29 99
Nakuru Phone: (254) 20 327 5622 / 4 - 051 2047041Fax: (254) 51 221 72 14
Nanyuki Phone: (254) 20 327 5444 / 5 Fax: (254) 20 221 41 66
Nyali Phone: (254) 20 327 5442 / 3 - 20 2678957 Fax: (254) 20 221 41 66
Thika Phone: (254) 20 327 5614 / 5 - 20 2323339 Fax: (254) 672 01 81
BANK OF AFRICA – KENYA
© MW DDB

49Annual Report 2012 - BANK OF AFRICA GROUP
2012 2011Income statement
Liabilities 2012 2011
2010
Assets 2012 2011
CASH AND BALANCES WITH CENTRAL BANK
GOVERNMENT SECURITIES
DEPOSITS AND BALANCES DUE FROM BANKING INSTITUTIONS
AMOUNTS DUE FROM GROUP BANKS
INVESTMENTS
LOANS AND ADVANCES TO CUSTOMERS
CURRENT INCOME TAX
FIXED ASSETS
INTANGIBLE ASSETS
DEFERRED INCOME TAX
LEASING
OTHER ASSETS
TOTAL ASSETS
CUSTOMER DEPOSITS
INTERBANK LIABILITIES
LONG TERM BORROWINGS
AMOUNTS DUE FROM GROUP BANKS
CURRENT INCOME TAX
DEFERRED INCOME TAX
OTHER LIABILITIES
TOTAL LIABILITIES
SHARE CAPITAL
SHARE PREMIUMS
STATUTORY PROVISIONS
RETAINED EARNINGS ( +/- )
DIVIDENDES
TOTAL SHAREHOLDERS EQUITY
TOTAL LIABILITIES
35 099 546 23 986 396
3 066 804 3 074 741
878 422 926 688
4 568 934 5 505 369
13 161
321 297 569 008
43 948 164 34 062 202
3 400 000 3 400 000
421 200 421 200
289 384 211 240
662 305 503 578
236 872 136 000
5 009 761 4 672 018
48 957 925 38 734 220
5 634 468 3 012 731
-3 993 892 -1 641 878
1 640 576 1 370 853
493 396 348 373
-23 776 -21 601
469 620 326 772
172 321 256 323
57 009 -74 915
2 339 526 1 879 033
-1 649 626 -1 305 268
-86 301 -45 048
32 418 25 832
636 016 554 550
-162 273 -121 825
473 743 432 725
INTEREST INCOME
INTEREST EXPENSE
NET INTEREST INCOME
FEE AND COMMISSION INCOME
FEE AND COMMISSION EXPENSE
NET FEE AND COMMISSION INCOME
FOREIGN EXCHANGE INCOME
OTHER INCOME
OPERATING INCOME
OPERATING EXPENSES
IMPAIRMENT LOSSES ON LOANS AND ADVANCES
ACQUISITION SURPLUS VALUE
SHARE OF INCOME OF ASSOCIATES
CAPITAL GAINS ON DISPOSAL OF ASSETS
PROFIT BEFORE INCOME TAX
INCOME TAX EXPENSE
NET INCOME
6 167 146 2 889 002
8 619 856 9 064 680
1 203 068 2 102 491
811 892 923 688
1 009 893 977 475
29 882 472 21 639 691
8 589
578 526 526 576
66 122 72 876
44 539 32 043
4 779 4 864
569 632 492 245
48 957 925 38 734 220
BANK OF AFRICA – KENYA
(In KES thousands) At 31.12.12, 1 Euro = 113.5371 KES

50BANK OF AFRICA GROUP - Annual Report 2012
Website: www.boa.mg
Opening date: November 1999Created in 1989: BANKIN’NY TANTSAHAMPAMOKATRA (BTM) / National Bank for RuralDevelopment. Integrated into BOA network in 1999.
Legal formS.A.
Capital at 31/12/2012Ariary (MGA) 45.510 billion
Company registration No.99B839
Board of Directors at 26/4/2013Alain RASOLOFONDRAIBE, Chairman
BANK OF AFRICA – BENIN,
represented by Georges ABALLO
Mohamed BENNANI
Paulin Laurent COSSI
MALGACHE STATE,
represented by Orlando Rivomanantsoa ROBIMANANA
Mamadou KA
Jean-François MONTEIL
Alexandre RANDRIANASOLO
Francis SUEUR
Abderrazzak ZEBDANI
Bernardus A.M. ZWINKELS
Principal Shareholders at 31/12/2012AFH-OCEAN INDIEN 41.30%
INTERNATIONAL FINANCE CORPORATION (SFI) 10.40%
NETHERLANDS DEVELOPMENT FINANCE
COMPANY (FMO) 9.40%
PROPARCO 4.40%
MALGACHE PRIVATE SHAREHOLDERS 24.80%
MALGACHE STATE 9.40%
OTHER SHAREHOLDERS 0.30%
AuditorsMAZARS FIVOARANA
PRICEWATERHOUSECOOPERS SARL
Registered office2, Place de l'Indépendance
BP 183 Antananarivo 101 - MADAGASCAR
Phone: (261) 20 22 391 00
Fax: (261) 20 22 294 08
SWIFT: AFRIMGMG
E-mail: <[email protected]>
Antananarivo BranchesAGENCE CENTRALE
AGENCE B
AGENCE ELITE
AMBANIDIA
AMBOHIMANARINA
AMPANDRANA
ANOSIZATO
ANDRAVOAHANGY
ANDREFAN’AMBOHIJANAHARY
ANKAZOMANGA
ANKORONDRANO
ITAOSY
IVANDRY
IVATO (Exchange Airport)
MAHAZO
SABOTSY NAMEHANA
SOARANO
TALATAMATY
TANJOMBATO
TSIMBAZAZA
67 HECTARES (67 Ha)
Regional BranchesAMBALAVAO
AMBANJA
AMBATOLAMPY
AMBATONDRAZAKA
AMBILOBE
AMBODIFOTATRA (SAINTE MARIE)
AMBOHIMAHASOA
AMBOSITRA
AMBOVOMBE
AMPARAFARAVOLA
ANDAPA
ANDRAMASINA
ANJOZOROBE
ANTALAHA
ANTSIRABE
ANTSIRANANA
ANTSOHIHY
FARAFANGANA
FARATSIHO
FENERIVE EST
FIANARANTSOA
IHOSY
IMERINTSIATOSIKA
MAHAJANGA
MAHANORO
MAHAZOARIVO (ANTSIRABE)
MAHITSY
MAEVATANANA
MAINTIRANO
MANAKARA
MANANARA NORD
MANANJARY
MANDRITSARA
MANJAKANDRIANA
MAROANTSETRA
MAROVOAY
MIANDRIVAZO
MIARINARIVO
MORAMANGA
MOROMBE
MORONDAVA
NOSY-BE
PORT-BERGE
SAKARAHA
SAMBAVA
SANFILY (TOLIARY)
TANAMBAO (ANTSIRANANA)
TANAMBE
TOAMASINA AUGAGNEUR
TOAMASINA COMMERCE
TOLAGNARO
TOLIARY
TSARAMANDROSO (MAHAJANGA)
TSIROANOMANDIDY
VANGAINDRANO
VOHEMAR
BANK OF AFRICA – MADAGASCAR
© MW DDB

51Annual Report 2012 - BANK OF AFRICA GROUP
Income 2011 2012Expenses 2011 2012
Liabilities 2011 2012
2010
Assets 2011 2012
INTEREST & SIMILAR INCOME
• ON INTERBANK LOANS
• ON CUSTOMER LOANS
• ON SUBORDINATED LOANS AND SECURITIES
• ON INVESTMENT SECURITIES
• OTHER INTEREST AND SIMILAR INCOME
COMMISSION
INCOME FROM FINANCIAL TRANSACTIONS
OTHER INCOME FROM BANKING OPERATIONS
GENERAL OPERATING INCOME
WRITE-BACK OF DEPRECIATION
AND PROVISIONS ON FIXED ASSETS
SURPLUS ON VALUE ADJUSTMENTS TO LOANS
& OFF-BALANCE-SHEET ITEMS
EXCESS OF WRITE-BACKS OVER PROVISIONING
OF GENERAL BANKING RISKS
EXCEPTIONAL INCOME
LOSS
TOTAL INCOME
CASH
INTERBANK LOANS
CUSTOMER LOANS
• PORTFOLIO OF DISCOUNTED BILLS
• OTHER CUSTOMER CREDIT FACILITIES
• ORDINARY DEBTOR ACCOUNTS
INVESTMENT SECURITIES
FINANCIAL ASSETS
LEASING AND SIMILAR TRANSACTIONS
FINANCIAL ASSETS AT EQUITY VALUE
INTANGIBLE ASSETS
FIXED ASSETS
SHAREHOLDERS & ASSOCIATES
OTHER ASSETS
SUNDRY ACCOUNTS
TOTAL ASSETS
INTERBANK LIABILITIES
CUSTOMER DEPOSITS
• SAVINGS DEPOSIT ACCOUNTS
• TIME DEPOSIT ACCOUNTS
• SHORT-TERM BORROWINGS
• OTHER DEMAND DEPOSITS
• OTHER TIME DEPOSIT ACCOUNTS
DEBT SECURITIES
OTHER LIABILITIES
SUNDRY ACCOUNTS
RESERVES FOR CONTINGENCIES & LOSSES
STATUTORY PROVISIONS
EARMARKED FUNDS
SUBORDINATED LOANS & SECURITIES
RESERVES FOR GENERAL BANKING RISKS
CAPITAL OR APPROPRIATIONS
SHARE PREMIUMS
RESERVES
RETAINED EARNINGS ( +/- )
NET INCOME
TOTAL LIABILITIES
31 059 608 505 36 717 169 220
1 118 055 622 464 1 210 156 199 973
230 998 397 685 267 079 563 145
19 907 687 200 18 226 539 147
573 325 422 633 699 674 882 335
293 824 114 945 225 175 215 346
28 568 579 431 30 930 499 091
30 307 272 209 41 703 465 703
5 485 587 557 6 637 658 280
1 155 688 752 1 468 122 338
400 454 196
45 342 580 000 45 509 740 000
25 433 442 144 25 642 392 144
38 614 791 678 42 341 781 027
3 178 019 237 12 575 771 253
24 846 595 656 22 099 600 803
1 352 448 241 828 1 475 782 399 831
101 916 280 682 105 569 153 543
36 701 664 965 34 920 493 194
65 214 615 717 70 648 660 348
27 740 143 089 33 610 909 812
8 856 432 826 9 117 878 091
2 639 161 478 1 217 988 952
2 065 803 416 4 091 976 471
143 217 821 491 153 607 906 869
INTEREST AND SIMILAR EXPENSES
• ON INTERBANK LIABILITIES
• ON CUSTOMER DEPOSITS
• ON DEBT SECURITIES
• OTHER INTEREST AND SIMILAR EXPENSES
EXPENSES ON LEASING AND SIMILAR OPERATIONS
COMMISSION
EXPENSES ON FINANCIAL OPERATIONS
OTHER BANK OPERATING EXPENSES
OPERATING OVERHEADS
• PERSONNEL COSTS
• OTHER OVERHEADS
DEPRECIATION AND PROVISIONS
ON FIXED ASSETS
DEFICIT ON VALUE ADJUSTMENTS TO LOANS
& OFF-BALANCE-SHEET ITEMS
EXCEPTIONAL EXPENSES
LOSSES FROM PREVIOUS YEARS
CORPORATE INCOME TAX
PROFIT
TOTAL EXPENSES
40 065 381 071 52 278 933 677
660 498 450 062 707 707 550 952
511 909 292 334 558 222 471 205
33 743 409 546 45 117 916 143
385 967 168 041 404 306 225 075
92 198 714 747 108 798 329 987
20 372 966 959 17 346 529 486
2 067 019 859
300 000 000
5 829 194 908 5 686 256 744
48 156 894 391 54 597 116 190
64 037 631 409 76 646 450 844
1 278 430 694 1 230 070 875
1 352 448 241 828 1 475 782 399 831
37 107 337 307 35 036 791 447
1 989 442 956 2 192 605 005
35 117 894 352 32 844 186 443
1 698 914 317 1 670 154 296
862 134 578 1 240 745 188
56 149 388 314 64 730 245 120
23 203 815 603 27 804 422 267
32 945 572 711 36 925 822 854
8 703 552 777 10 081 557 761
5 791 971 324 9 870 562 875
831 464 434 1 994 540 842
7 226 462 784 6 883 708 537
24 846 595 656 22 099 600 803
143 217 821 491 153 607 906 869
BANK OF AFRICA – MADAGASCAR
(In MGA) At 31.12.12, 1 Euro = 2,980.74 MGA

52BANK OF AFRICA GROUP - Annual Report 2012
Website: www.boamali.com
Opening date: December 1983
Legal formS.A. with Board of Directors
Capital at 31/12/2012CFAF 7.2 billion
Company registration No.RC : MB.Bko.2004.B.2482
Board of Directors at 30/3/2013Paul DERREUMAUX, Chairman
Mohamed BENNANI
Hachem BOUGHALEB
Alpha Hampaté GAMBY
Mamadou KA
Serge KAPNIST
Oumar KOUMA
Mamadou MAIGA
Léon NAKA
Ernest RICHARD
Abderrazzak ZEBDANI
Principal Shareholders at 31/12/2012BOA WEST AFRICA 58.54%
NETHERLANDS FINANCE COMPANY
FOR DEVELOPING COUNTRIES (FMO) 15.77%
ATTICA S.A. 2.56%
BANK OF AFRICA – BENIN 0.05%
NATIONAL SHAREHOLDERS 20.13%
OTHER SHAREHOLDERS 2.95%
AuditorsSARECI-SARL
EGCC INTERNATIONAL
Registered office418, Avenue de la Marne - BP 2249 - Bamako - MALI
Phone: (223) 20 70 05 00 - Fax: (223) 20 70 05 60
Telex: 2581 - SWIFT: AFRIMLBA
E-mail: <[email protected]>
Bamako BranchesAgence Centrale Phone: (223) 20 70 05 00 - Fax: (223) 20 70 05 60
Agence Elite Phone: (223) 20 70 05 18
ACI 2000 Phone: (223) 20 70 05 43 - Fax: (223) 20 70 05 44
Baco Djicoroni Phone: (223) 20 70 05 29 - Fax: (223) 20 70 05 30
Badalabougou Phone: (223) 20 22 65 75 - Fax: (223) 20 70 05 64
Dibida Phone: (223) 20 70 05 36 - Fax: (223) 20 70 05 37
Faladiè Phone: (223) 20 70 05 41 - Fax: (223) 20 70 05 42
Grand Marché Phone: (223) 20 70 05 49 - Fax: (223) 20 70 05 81
Hamdallaye Phone: (223) 20 70 05 84 - Fax: (223) 20 70 05 85
Hippodrome Phone: (223) 20 70 05 94 - Fax: (223) 20 70 05 93
Magnabougou Phone: (223) 20 70 05 35 - Fax: (223) 20 70 05 72
Marché de Médine Phone: (223) 20 70 05 69 - Fax: (223) 20 70 05 70
Route de l'Aéroport Phone: (223) 20 70 05 33 - Fax: (223) 20 70 05 34
Sébénikoro Phone: (223) 20 70 05 48 - Fax: (223) 20 70 05 49
Zone Industrielle Phone: (223) 20 70 05 22 - Fax: (223) 20 70 05 40
Business CentreAgence Centrale de Bamako Phone: (223) 20 70 05 00 - Fax: (223) 20 70 05 60
Regional BranchesBougouni Phone: (223) 20 70 05 72 - Fax: (223) 20 70 05 99
Kayes Phone: (223) 20 70 05 77 - Fax: (223) 20 70 05 78
Koulikoro Phone: (223) 20 70 05 71 - Fax: (223) 20 70 05 67
Koutiala Phone: (223) 20 70 05 75 - Fax: (223) 20 70 05 76
Mopti Phone: (223) 20 70 05 95 - Fax: (223) 20 70 05 96
Nioro Phone: (223) 20 70 05 88 - Fax: (223) 20 70 05 89
Ségou Phone: (223) 20 70 05 86 - Fax: (223) 20 70 05 87
Sikasso Phone: (223) 20 70 05 74 - Fax: (223) 20 70 05 73
Local BranchesFaso KanuMagnambougou - Station SMC, en face de l’Institut de Géographie du Mali
Morila Rattaché à l’Agence de SikassoPhone: (223) 20 70 05 83 - Fax: (223) 20 70 05 82
Sadiola Rattaché à l’Agence de Kayes Phone: (223) 20 70 05 80 - Fax: (223) 20 70 05 79
Sevaré Phone: (223) 20 70 05 13 - Fax: (223) 20 70 05 19
Sikasso Médine Phone: (223) 21 62 10 14
Offices at TOTAL ServiceStations in BamakoBaco DjicoroniCommune V - Sur la Route de KalabankoroAttached to the Djicoroni Branch
KalabankoroCommune V - Kalabankoro marchéAttached to the Baco Djicoroni Branch
LafiabougouCommune IV - LafiabougouAttached to the Hamdallaye Branch
MédineCommune II - Avenue Al Quods, sur la Route de KoulikoroAttached to the Hippodrome Branch
MissabougouCommune VI - Sur la route du 3e PontAttached to the Faladiè Branch
Niaréla Commune II - Niaréla, sur la route de SotubaAttached to the Zone Industrielle Branch
Place CanCommune IV - Hamdallaye ACI 2000 en face de la Place CANAttached to the Hamdallaye Branch
SotubaCommune I - Sur la route de SotubaAttached to the Zone Industrielle Branch
BANK OF AFRICA – MALI
© MW DDB

53Annual Report 2012 - BANK OF AFRICA GROUP
Income 2011 2012Expenses 2011 2012
Liabilities 2011 2012
2010
Assets 2011 2012
INTEREST & SIMILAR INCOME
• ON INTERBANK LOANS
• ON CUSTOMER LOANS
• ON SUBORDINATED LOANS AND SECURITIES
• ON INVESTMENT SECURITIES
• OTHER INTEREST AND SIMILAR INCOME
INCOME FROM LEASING & SIMILAR OPERATIONS
COMMISSION
INCOME FROM FINANCIAL TRANSACTIONS
OTHER INCOME FROM BANKING OPERATIONS
GENERAL OPERATING INCOME
WRITE-BACK OF DEPRECIATION
AND PROVISIONS ON FIXED ASSETS
SURPLUS ON VALUE ADJUSTMENTS TO LOANS
& OFF-BALANCE-SHEET ITEMS
EXCESS OF WRITE-BACKS OVER PROVISIONING
OF GENERAL BANKING RISKS
EXCEPTIONAL INCOME
INCOME FROM PREVIOUS YEARS
LOSS
TOTAL INCOME
CASH
INTERBANK LOANS
CUSTOMER LOANS
• PORTFOLIO OF DISCOUNTED BILLS
• OTHER CUSTOMER CREDIT FACILITIES
• ORDINARY DEBTOR ACCOUNTS
• FACTORING
INVESTMENT SECURITIES
FINANCIAL ASSETS
LEASING AND SIMILAR TRANSACTIONS
FINANCIAL ASSETS AT EQUITY VALUE
INTANGIBLE ASSETS
FIXED ASSETS
SHAREHOLDERS & ASSOCIATES
OTHER ASSETS
SUNDRY ACCOUNTS
CONSOLIDATED GOODWILL
TOTAL ASSETS
INTERBANK LIABILITIES
CUSTOMER DEPOSITS
• SAVINGS DEPOSIT ACCOUNTS
• TIME DEPOSIT ACCOUNTS
• SHORT-TERM BORROWINGS
• OTHER DEMAND DEPOSITS
• OTHER TIME DEPOSIT ACCOUNTS
DEBT SECURITIES
OTHER LIABILITIES
SUNDRY ACCOUNTS
RESERVES FOR CONTINGENCIES & LOSSES
STATUTORY PROVISIONS
EARMARKED FUNDS
SUBORDINATED LOANS & SECURITIES
INVESTMENT SUBSIDIES
RESERVES FOR GENERAL BANKING RISKS
CAPITAL OR APPROPRIATIONS
SHARE PREMIUMS
RESERVES
RETAINED EARNINGS ( +/- )
NET INCOME
TOTAL LIABILITIES
21 609 852 807 24 859 905 095
150 733 326 356 160 770 696 710
33 209 866 815 41 181 099 427
85 465 681 248 90 634 199 289
32 057 778 293 28 955 397 994
1 800 000 000 1 200 000 000
4 419 933 249 7 785 031 868
1 628 328 026 1 845 234 930
1 595 832 497 1 320 471 858
1 080 000 000 1 080 000 000
7 200 000 000 7 200 000 000
2 750 025 820 2 750 025 820
2 729 030 386 3 028 170 846
401 183 227 909 812 501
1 994 269 734 1 505 745 552
197 941 782 102 214 255 095 180
11 045 055 935 13 828 482 991
898 294 204 848 755 219
9 369 279 633 12 073 350 549
777 482 098 906 377 223
386 568 634 249 574 665
2 592 571 630 2 671 064 154
5 034 933 312 4 106 187 911
747 310 942 714 302 435
455 309 450 590 477 048
2 731 038 233 581 482
97 196 175 145 750 392
142 795 649 525 550 724
20 504 472 765 23 064 971 802
INTEREST AND SIMILAR EXPENSES
• ON INTERBANK LIABILITIES
• ON CUSTOMER DEPOSITS
• ON DEBT SECURITIES
• ON SHAREHOLDERS’ & ASSOCIATES’ BLOCKED ACCOUNTS
AND ON SUBORDINATED DEBT
• OTHER INTEREST AND SIMILAR EXPENSES
EXPENSES ON LEASING AND SIMILAR OPERATIONS
COMMISSION
EXPENSES ON FINANCIAL OPERATIONS
OTHER BANK OPERATING EXPENSES
OPERATING OVERHEADS
• PERSONNEL COSTS
• OTHER OVERHEADS
DEPRECIATION AND PROVISIONS
ON FIXED ASSETS
DEFICIT ON VALUE ADJUSTMENTS TO LOANS
& OFF-BALANCE-SHEET ITEMS
EXCESS OF PROVISIONING OVER WRITE-BACKS
OF GENERAL BANKING RISKS
EXCEPTIONAL EXPENSES
LOSSES FROM PREVIOUS YEARS
CORPORATE INCOME TAX
PROFIT
TOTAL EXPENSES
5 737 112 948 5 467 591 604
29 794 430 686 23 868 124 975
114 651 746 240 138 823 384 730
5 139 059 366 11 003 011 667
109 512 686 874 96 559 988 363
20 104 179 039 29 322 469 196
1 937 915 504
29 608 304 553 20 335 360 683
1 553 129 920 1 478 318 825
693 813 758 485 781 596
249 461 000 283 075 019
11 276 079 126 11 437 893 548
3 655 432 184 10 867 658 642
722 271 687 1 207 905 558
197 941 782 102 214 255 095 180
4 059 431 657 4 321 327 160
793 461 984 1 190 263 701
3 104 618 950 3 032 423 661
161 350 723 98 639 798
319 362 566 203 957 389
120 526 859 133 065 475
362 389 471 243 314 386
194 862 180 205 656 130
8 321 554 274 10 009 318 164
3 987 135 456 5 056 638 735
4 334 418 818 4 952 679 429
1 504 989 034 2 050 273 627
2 145 646 145 2 849 715 510
143 543 373 719 344 102
555 358 196 282 887 314
782 539 276 540 366 993
1 994 269 734 1 505 745 552
20 504 472 765 23 064 971 802
BANK OF AFRICA – MALI
(In CFAF) At 31.12.12, 1 Euro = 655.957 CFAF

54BANK OF AFRICA GROUP - Annual Report 2012 © MW DDB
Opening date: December 2010Created in 1908: BANQUE INDOSUEZ MER ROUGE(BIRM). Integrated into BOA network in 2011.
Legal formS.A.
Capital at 31/12/2012Djibouti Francs (DJF) 1.5 billion
Company registration No.RC 195/B
Board of Directors at 6/5/2013Abdelali NADIFI, Chairman
Mohamed BENNANI
BOA GROUP S.A., represented by Abderrazzak ZEBDANI
Paul DERREUMAUX
Vincent de BROUWER
SOCIÉTÉ FINANCIÈRE NÉERLANDAISE
POUR LE DÉVELOPPEMENT (FMO),
represented by Bernardus A.M. WINKELS
Principal Shareholders at 31/12/2012AFH-OCEAN INDIEN 60.00%
PROPARCO 20.00%
NETHERLANDS DEVELOPMENT FINANCE
COMPANY (FMO) 20.00%
AuditorsCABINET J.C. COLAS
PRICEWATERHOUSECOOPERS SARL
Registered office10, Place Lagarde - BP 88 - Djibouti
REPUBLIC OF DJIBOUTI
Phone: (253) 21 35 30 16 - Fax: (253) 21 35 16 38
Telex: 5543 (BF) - SWIFT: MRINDJ JD
E-mail: <[email protected]>
Djibouti BranchesAgence Centrale Phone: (253) 21 35 30 16 Fax: (253) 21 35 16 38
Plateau du Serpent Phone: (253) 21 31 23 54 Fax: (253) 21 35 36 51
Aviation Phone: (253) 21 35 35 00 Fax: (253) 21 35 35 00
BANK OF AFRICA – MER ROUGE

55Annual Report 2012 - BANK OF AFRICA GROUP (In DJF) At 31.12.12, 1 Euro = 235.2137 DJF
Liabilities 2011 2012
2010
Assets 2011 2012
CASH
INTERBANK LOANS
CUSTOMER LOANS
• PORTFOLIO OF DISCOUNTED BILLS
• OTHER CUSTOMER CREDIT FACILITIES
• ORDINARY DEBTOR ACCOUNTS
• FACTORING
INVESTMENT SECURITIES
FINANCIAL ASSETS
LEASING AND SIMILAR TRANSACTIONS
FINANCIAL ASSETS AT EQUITY VALUE
INTANGIBLE ASSETS
FIXED ASSETS
SHAREHOLDERS & ASSOCIATES
OTHER ASSETS
SUNDRY ACCOUNTS
CONSOLIDATED GOODWILL
TOTAL ASSETS
INTERBANK LIABILITIES
CUSTOMER DEPOSITS
• SAVINGS DEPOSIT ACCOUNTS
• TIME DEPOSIT ACCOUNTS
• SHORT-TERM BORROWINGS
• OTHER DEMAND DEPOSITS
• OTHER TIME DEPOSIT ACCOUNTS
DEBT SECURITIES
OTHER LIABILITIES
SUNDRY ACCOUNTS
RESERVES FOR CONTINGENCIES & LOSSES
STATUTORY PROVISIONS
EARMARKED FUNDS
SUBORDINATED LOANS & SECURITIES
INVESTMENT SUBSIDIES
RESERVES FOR GENERAL BANKING RISKS
CAPITAL OR APPROPRIATIONS
SHARE PREMIUMS
RESERVES
RETAINED EARNINGS ( +/- )
NET INCOME
TOTAL LIABILITIES
3 380 695 336 2 260 466 079
54 273 764 626 57 398 902 506
2 071 406 773 2 203 377 923
700 118 761 1 193 262 267
39 706 418 801 42 404 777 196
11 795 820 291 11 597 485 120
407 768 878 341 966 974
1 521 351 307 1 192 631 137
108 563 983 72 423 789
72 849 542 104 298 500
1 500 000 000 1 500 000 000
150 000 000 150 000 000
1 109 008 121 1 744 170 423
635 162 302 747 790 674
63 159 164 095 65 512 650 082
1 196 975 984 1 817 242 656
43 982 098 494 44 456 400 449
15 404 000 674 15 710 188 893
229 397 920
8 995 293 170 10 152 352 428
6 408 707 504 5 328 438 545
51 395 550 176 418 322
425 973 443 414 184 903
577 368 644 692 530 310
1 521 351 306 2 245 684 549
63 159 164 095 65 512 650 082
BANK OF AFRICA – MER ROUGE
2011 2012Profits and loss account1 821 614 645 2 064 623 065
129 790 903 128 772 971
1 691 823 742 1 935 850 094
644 113 948 439 150 400
47 695 940 37 938 504
596 418 008 401 211 896
413 899 107 697 199 656
2 702 140 857 3 034 261 646
1 631 260 923 1 599 360 119
927 309 416 831 241 537
703 951 507 768 118 582
112 576 937 131 274 448
958 302 997 1 303 627 079
-197 670 852 -287 208 089
760 632 145 1 016 418 990
695 000 -8 881 772
126 164 843 259 746 544
635 162 302 747 790 674
INTEREST AND SIMILAR INCOME
INTEREST AND SIMILAR EXPENSES
NET INTEREST INCOME
FEE AND COMMISSION INCOME
FEE AND COMMISSION EXPENSE
NET COMMISSION
FOREIGN EXCHANGE INCOME
OPERATING INCOME
OPERATING OVERHEADS
PERSONNEL COSTS
OTHER OPERATING EXPENSES
DEPRECIATION
GROSS OPERATING PROFIT
NET INCOME FROM VALUE ADJUSTMENTS
PRE-TAX OPERATING INCOME
EXCEPTIONAL INCOME
CORPORATE INCOME TAX
NET INCOME

56BANK OF AFRICA GROUP - Annual Report 2012
Website: www.boaniger.com
Opening date: April 1994Created in 1989: NIGERIAN INTERNATIONAL BANK(NIB). Integrated into BOA network in 1994.
Legal formS.A.
Capital at 31/12/2012CFAF 8 billion
Company registration No.RCCM NI-NIM-2003-B 0639
Board of Directors at 16/4/2013Boureima WANKOYE, Chairman
Georges ABALLO
BANK OF AFRICA – BENIN, represented by Benoît MAFFON
WEST AFRICAN DEVELOPMENT BANK (BOAD),
represented by Gnandi DJATO-BOUGONOU
Mohamed BENNANI
BOA WEST AFRICA, represented by Mamadou KA
Ousmane DAOU
Mahaman IBRA KABO
Rachid LAHLOU BENKACEM
Francis SUEUR
Fati SITTI TCHIANA
Abderrazzak ZEBDANI
Principal Shareholders at 31/12/2012BOA WEST AFRICA 49.43%
ATTICA S.A. 8.41%
WEST AFRICAN DEVELOPMENT BANK (BOAD) 7.31%
OTHER SHAREHOLDERS 21.27%
NIGERIEN SHAREHOLDERS 13.37%
BOA-NIGER EMPLOYEES 0.21%
AuditorsFIDUCIAIRE CONSEIL & AUDIT (FCA)
GUILBERT & ASSOCIÉS
Registered officeImmeuble BANK OF AFRICA – NIGER
Rue du Gaweye - BP 10973
Niamey - NIGER
Phone: (227) 20 73 36 20 / 21 / 20 73 32 46
Fax: (227) 20 73 38 18
SWIFT: AFRINENI
E-mail: <[email protected]>
Niamey BranchesAgence Centrale Phone: (227) 20 73 36 20 / 21 / 20 73 32 46Fax: (227) 20 73 38 18
Agence Elite Phone: (227) 20 73 35 87Fax: (227) 20 73 38 18
As Salam Phone: (227) 20 74 16 91Fax: (227) 20 74 16 89
Ecogare Phone: (227) 20 34 00 31Fax: (227) 20 34 00 32
Grand Marché Phone: (227) 20 72 60 31Fax: (227) 20 73 38 18
Katako Phone: (227) 20 73 23 94Fax: (227) 20 73 23 72
Plateau Phone: (227) 20 72 23 23 Fax: (227) 20 72 33 78
Zone Industrielle Phone: (227) 20 34 05 78Fax: (227) 20 34 05 79
Regional BranchesAgadez Phone: (227) 20 44 03 31 Fax: (227) 20 44 04 31
Arlit Phone: (227) 20 45 21 15 / 16Fax: (227) 20 45 21 17
Dosso Phone: (227) 20 65 00 84 Fax: (227) 20 65 06 00
Gaya Phone: (227) 20 68 06 03 Fax: (227) 20 68 06 04
Maradi Phone: (227) 20 41 08 80Fax: (227) 20 41 06 65
Tahoua Phone: (227) 20 61 06 68 Fax: (227) 20 61 06 69
Tillaberi Phone: (227) 20 71 10 15 Fax: (227) 20 71 10 16
Zinder Phone: (227) 20 51 21 70 / 71 Fax: (227) 20 51 21 72
BANK OF AFRICA – NIGER
© MW DDB

57Annual Report 2012 - BANK OF AFRICA GROUP
Income 2011 2012Expenses 2011 2012
Liabilities 2011 2012
2010
Assets 2011 2012
INTEREST & SIMILAR INCOME
• ON INTERBANK LOANS
• ON CUSTOMER LOANS
• ON SUBORDINATED LOANS AND SECURITIES
• ON INVESTMENT SECURITIES
• OTHER INTEREST AND SIMILAR INCOME
INCOME FROM LEASING & SIMILAR OPERATIONS
COMMISSION
INCOME FROM FINANCIAL TRANSACTIONS
OTHER INCOME FROM BANKING OPERATIONS
GENERAL OPERATING INCOME
WRITE-BACK OF DEPRECIATION
AND PROVISIONS ON FIXED ASSETS
SURPLUS ON VALUE ADJUSTMENTS TO LOANS
& OFF-BALANCE-SHEET ITEMS
EXCESS OF WRITE-BACKS OVER PROVISIONING
OF GENERAL BANKING RISKS
EXCEPTIONAL INCOME
INCOME FROM PREVIOUS YEARS
LOSS
TOTAL INCOME
CASH
INTERBANK LOANS
CUSTOMER LOANS
• PORTFOLIO OF DISCOUNTED BILLS
• OTHER CUSTOMER CREDIT FACILITIES
• ORDINARY DEBTOR ACCOUNTS
• FACTORING
INVESTMENT SECURITIES
FINANCIAL ASSETS
LEASING AND SIMILAR TRANSACTIONS
FINANCIAL ASSETS AT EQUITY VALUE
INTANGIBLE ASSETS
FIXED ASSETS
SHAREHOLDERS & ASSOCIATES
OTHER ASSETS
SUNDRY ACCOUNTS
CONSOLIDATED GOODWILL
TOTAL ASSETS
INTERBANK LIABILITIES
CUSTOMER DEPOSITS
• SAVINGS DEPOSIT ACCOUNTS
• TIME DEPOSIT ACCOUNTS
• SHORT-TERM BORROWINGS
• OTHER DEMAND DEPOSITS
• OTHER TIME DEPOSIT ACCOUNTS
DEBT SECURITIES
OTHER LIABILITIES
SUNDRY ACCOUNTS
RESERVES FOR CONTINGENCIES & LOSSES
STATUTORY PROVISIONS
EARMARKED FUNDS
SUBORDINATED LOANS & SECURITIES
INVESTMENT SUBSIDIES
RESERVES FOR GENERAL BANKING RISKS
CAPITAL OR APPROPRIATIONS
SHARE PREMIUMS
RESERVES
RETAINED EARNINGS ( +/- )
NET INCOME
TOTAL LIABILITIES
43 314 339 068 47 891 138 411
89 471 409 424 111 879 922 853
11 621 059 299 16 275 549 694
341 086 497 720 488 513
62 980 548 476 77 574 703 214
14 528 715 152 17 309 181 432
1 500 000 000 3 000 000 000
3 396 407 769 2 649 055 502
1 744 853 379 1 804 827 257
616 305 235 782 615 292
454 545 454 272 727 272
1 604 557 798 1 604 557 798
6 000 000 000 8 000 000 000
3 544 500 000 3 544 500 000
4 132 928 869 3 297 850 189
2 764 921 320 3 144 147 502
158 544 768 316 187 871 342 076
8 847 010 119 10 632 394 147
402 689 049 801 185 159
8 444 321 070 9 812 562 012
18 646 976
1 325 087 618 1 573 670 420
2 840 990 022 2 995 013 322
660 972 6 200 308
823 893 115 698 555 869
2 096 943 28 621 561
52 990 266 189 010 068
13 892 729 055 16 123 465 695
INTEREST AND SIMILAR EXPENSES
• ON INTERBANK LIABILITIES
• ON CUSTOMER DEPOSITS
• ON DEBT SECURITIES
• ON SHAREHOLDERS’ & ASSOCIATES’ BLOCKED ACCOUNTS
AND ON SUBORDINATED DEBT
• OTHER INTEREST AND SIMILAR EXPENSES
EXPENSES ON LEASING AND SIMILAR OPERATIONS
COMMISSION
EXPENSES ON FINANCIAL OPERATIONS
OTHER BANK OPERATING EXPENSES
OPERATING OVERHEADS
• PERSONNEL COSTS
• OTHER OVERHEADS
DEPRECIATION AND PROVISIONS
ON FIXED ASSETS
DEFICIT ON VALUE ADJUSTMENTS TO LOANS
& OFF-BALANCE-SHEET ITEMS
EXCESS OF PROVISIONING OVER WRITE-BACKS
OF GENERAL BANKING RISKS
EXCEPTIONAL EXPENSES
LOSSES FROM PREVIOUS YEARS
CORPORATE INCOME TAX
PROFIT
TOTAL EXPENSES
2 882 794 349 4 293 420 869
28 469 774 621 33 223 058 402
96 219 972 151 117 555 233 215
384 750 569 1 015 055 619
66 377 776 399 104 129 802 564
29 457 445 183 12 410 375 032
22 986 600 000 23 409 933 333
1 522 608 984 1 187 374 514
289 935 687 394 899 218
3 048 799 962 3 182 953 816
2 674 953 426 4 154 830 451
449 329 136 469 638 258
158 544 768 316 187 871 342 076
4 042 435 929 4 807 750 821
2 537 955 329 2 897 532 677
1 305 234 414 1 738 645 980
112 048 326 107 890 411
87 197 860 63 681 753
80 494 251 57 346 110
819 070 443 891 953 796
40 212 419 68 500 814
4 159 845 813 4 822 874 514
1 583 711 718 1 983 487 779
2 576 134 095 2 839 386 735
569 556 497 682 095 274
369 164 867 474 179 964
118 225 961 13 085 606
83 255 155 161 599 794
845 546 400 999 931 500
2 764 921 320 3 144 147 502
13 892 729 055 16 123 465 695
BANK OF AFRICA – NIGER
(In CFAF) At 31.12.12, 1 Euro = 655.957 CFAF

58BANK OF AFRICA GROUP - Annual Report 2012
Opening date: April 2010
Legal formSARL
Capital at 31/12/2012Congolese Francs (CDF) 14.774 million
Company registration No.N.R.C. Kinshasa n° KG/6823/M
Board of Directors at 11/3/2013Mohamed BENNANI, Chairman
BOA GROUP S.A., represented by Abderrazzak ZEBDANI
Vincent de BROUWER
Paulin COSSI
Mamadou KA
Henri LALOUX
Denis POMIKALA
Principal Shareholders at 31/12/2012BOA GROUP S.A. 40.01%
AFH-OCEAN INDIEN 25.00%
PROPARCO S.A. 19.98%
BIO S.A. 14.98%
OTHER SHAREHOLDERS 0.04%
AuditorPRICEWATERHOUSECOOPERS
Registered office22, Avenue des Aviateurs
Kinshasa-Gombe - BP 7119 Kin1
DEMOCRATIC REPUBLIC OF CONGO
Phone: (243) 99 300 46 00
E-mail: <[email protected]>
Kinshasa BranchesAgence Centrale Phone: (243) 97 000 31 22Switchboard: (243) 99 300 46 00
Agence Elite Phone: (243) 99 300 46 82 Switchboard: (243) 99 300 46 94
30 Juin Phone: (243) 99 200 04 18 Switchboard: (243) 99 300 46 00
Commerce Phone: (243) 99 2000 415 Switchboard: (243) 99 300 46 00
Delvaux Phone: (243) 97 000 31 45 Switchboard: (243) 99 300 46 00
Victoire Phone: (243) 97 000 31 30 Switchboard: (243) 99 300 46 00
Bureau Avance Triangle Phone: (243) 97 000 31 45 Switchboard: (243) 99 300 46 00
Regional BranchGoma Phone: (243) 97 000 30 86 Switchboard: (243) 99 300 46 00
BANK OF AFRICA – RDC
© MW DDB

59Annual Report 2012 - BANK OF AFRICA GROUP
Liabilities 2011 2012
2010
Assets 2011 2012
CASH
INTERBANK LOANS
CUSTOMER LOANS
• PORTFOLIO OF DISCOUNTED BILLS
• OTHER CUSTOMER CREDIT FACILITIES
• ORDINARY DEBTOR ACCOUNTS
• FACTORING
INVESTMENT SECURITIES
FINANCIAL ASSETS
LEASING AND SIMILAR TRANSACTIONS
FINANCIAL ASSETS AT EQUITY VALUE
INTANGIBLE ASSETS
FIXED ASSETS
SHAREHOLDERS & ASSOCIATES
OTHER ASSETS
SUNDRY ACCOUNTS
CONSOLIDATED GOODWILL
TOTAL ASSETS
INTERBANK LIABILITIES
CUSTOMER DEPOSITS
• SAVINGS DEPOSIT ACCOUNTS
• TIME DEPOSIT ACCOUNTS
• SHORT-TERM BORROWINGS
• OTHER DEMAND DEPOSITS
• OTHER TIME DEPOSIT ACCOUNTS
DEBT SECURITIES
OTHER LIABILITIES
SUNDRY ACCOUNTS
RESERVES FOR CONTINGENCIES & LOSSES
STATUTORY PROVISIONS
EARMARKED FUNDS
SUBORDINATED LOANS & SECURITIES
INVESTMENT SUBSIDIES
RESERVES FOR GENERAL BANKING RISKS
CAPITAL OR APPROPRIATIONS
SHARE PREMIUMS
RESERVES
REVALUATION DIFFERENCES
RETAINED EARNINGS ( +/- )
NET INCOME
TOTAL LIABILITIES
7 222 481 908 22 603 448 032
7 927 644 065 17 641 814 368
1 210 178 561 3 447 346 703
4 713 828 759 9 422 207 166
2 003 636 745 4 772 260 499
585 612 595 591 394 233
15 008 699 429 580 041
3 390 000 003 3 390 000 003
1 821 641 800
205 810 156 204 939 308
10 154 104 500 14 774 082 500
990 376 188 1 120 292 170
-1 698 370 449 -4 825 186 301
-3 126 751 316 -3 203 934 387
27 487 558 149 52 726 429 967
882 226 072 1 723 230 507
2 157 036 513 13 452 828 158
14 722 535 407 25 527 427 082
13 557 101 484 24 337 819 444
1 165 433 923 1 189 607 638
389 858 670 128 477 525
357 125 021
8 227 849 242 10 417 878 451
170 323 401 423 934 138
384 655 977 695 529 085
27 487 558 149 52 726 429 967
BANK OF AFRICA – RDC
(In CDF) At 31.12.12, 1 Euro = 1,214.231 CDF
Income 2011 2012Expenses 2011 2012
INTEREST & SIMILAR INCOME
• ON INTERBANK LOANS
• ON CUSTOMER LOANS
• ON SUBORDINATED LOANS AND SECURITIES
• ON INVESTMENT SECURITIES
• OTHER INTEREST AND SIMILAR INCOME
INCOME FROM LEASING & SIMILAR OPERATIONS
COMMISSION
INCOME FROM FINANCIAL TRANSACTIONS
OTHER INCOME FROM BANKING OPERATIONS
GENERAL OPERATING INCOME
WRITE-BACK OF DEPRECIATION
AND PROVISIONS ON FIXED ASSETS
SURPLUS ON VALUE ADJUSTMENTS TO LOANS
& OFF-BALANCE-SHEET ITEMS
EXCESS OF WRITE-BACKS OVER PROVISIONING
OF GENERAL BANKING RISKS
EXCEPTIONAL INCOME
INCOME FROM PREVIOUS YEARS
LOSS
TOTAL INCOME
1 327 657 677 2 489 077 707
6 313 750 6 040 290
1 265 975 559 2 472 552 317
55 368 368 10 485 100
1 020 066 628 1 217 157 843
1 403 403 151 389 586 417
41 127 358 148 430 148
61 121 089 188 004 521
2 280 425 16 020 138
3 126 751 317 3 203 934 387
6 982 407 644 7 652 211 161
INTEREST AND SIMILAR EXPENSES
• ON INTERBANK LIABILITIES
• ON CUSTOMER DEPOSITS
• ON DEBT SECURITIES
• ON SHAREHOLDERS’ & ASSOCIATES’ BLOCKED ACCOUNTS
AND ON SUBORDINATED DEBT
• OTHER INTEREST AND SIMILAR EXPENSES
EXPENSES ON LEASING AND SIMILAR OPERATIONS
COMMISSION
EXPENSES ON FINANCIAL OPERATIONS
OTHER BANK OPERATING EXPENSES
OPERATING OVERHEADS
• PERSONNEL COSTS
• OTHER OVERHEADS
DEPRECIATION AND PROVISIONS
ON FIXED ASSETS
DEFICIT ON VALUE ADJUSTMENTS TO LOANS
& OFF-BALANCE-SHEET ITEMS
EXCESS OF PROVISIONING OVER WRITE-BACKS
OF GENERAL BANKING RISKS
EXCEPTIONAL EXPENSES
LOSSES FROM PREVIOUS YEARS
CORPORATE INCOME TAX
PROFIT
TOTAL EXPENSES
417 097 171 707 784 402
274 977 997 444 992 991
51 917 989 223 390 617
90 201 185 39 400 794
97 969 996 102 750 391
1 282 419 033 141 612 434
3 881 406 534 5 028 246 484
1 573 536 571 2 279 926 569
2 307 869 963 2 748 319 915
821 483 915 1 072 292 866
376 550 590 431 705 836
26 711 966 67 045 659
74 977 319 96 324 849
3 791 120 4 448 240
6 982 407 644 7 652 211 161

60BANK OF AFRICA GROUP - Annual Report 2012
Website: www.boasenegal.com
Opening date: October 2001
Legal formS.A.
Capital at 31/12/2012CFAF 8.5 billion
Company registration No.RC 2001 B 211
Board of Directors at 23/4/2013Alioune NDOUR DIOUF, Chairman
AXA ASSURANCES SENEGAL,
represented by Alioune DIAGNE
BANK OF AFRICA – CÔTE D'IVOIRE,
represented by Léon NAKA
Mohamed BENNANI
BOA WEST AFRICA, represented by Mor FALL
Diariatou Mariko GUINDO
Mamadou KA
Babacar NGOM
SDIH, represented by Mohamed Ababacar SOW
Abdoulaye SEYDI
Abderrazzak ZEBDANI
Principal Shareholders at 31/12/2012BOA WEST AFRICA 71.5%
BANK OF AFRICA – BENIN 2.1%
BANK OF AFRICA – CÔTE D'IVOIRE 0.3%
PRIVATE SHAREHOLDERS 26.1%
AuditorsMAZARS SENEGAL
EUREKA AUDIT & CONSEILS
Registered officeRésidence Excellence - 4, Avenue Léopold Sédar Senghor
BP 1992 RP - Dakar - SENEGAL
Phone: (221) 33 849 62 40 - Fax: (221) 33 842 16 67
SWIFT: AFRISNDA
E-mail: <[email protected]>
Dakar BranchesAgence CentralePhone: (221) 33 849 62 40 - Fax: (221) 33 842 16 67
Blaise Diagne Phone: (221) 33 889 78 00 - Fax: (221) 33 823 74 57
Bourguiba Phone: (221) 33 869 07 01 - Fax: (221) 33 825 52 47
Elite Phone: (221) 33 849 62 40 - Fax: (221) 33 842 16 67
Fass Phone: (221) 33 889 81 72 - Fax: (221) 33 842 79 25
Golf Phone: (221) 33 879 39 39 - Fax: (221) 33 837 08 52
Grand Yoff Phone: (221) 33 859 47 00 - Fax: (221) 33 867 73 48
Hann Mariste Phone: (221) 33 859 50 01 - Fax: (221) 33 832 03 71
HLM Phone: (221) 33 859 09 30 - Fax: (221) 33 825 15 59
Keur Massar Phone: (221) 33 879 37 62 - Fax: (221) 33 878 21 57
Lamine Gueye Phone: (221) 33 889 43 20 - Fax: (221) 33 842 89 91
Mermoz Phone: (221) 33 869 38 60 / 61 - Fax: (221) 33 825 05 54
Ngor Phone: (221) 33 869 89 80 - Fax: (221) 33 820 49 85
Parcelles Assainies Phone: (221) 33 879 30 20 - Fax: (221) 33 855 97 16
Pikine Tally BoumakPhone: (221) 33 879 19 00 / 01 - Fax: (221) 33 834 08 62
Pikine Rue 10Phone: (221) 33 879 13 29 - Fax: (221) 33 854 51 09
Thiaroye Phone: (221) 33 879 12 40 - Fax: (221) 33 834 53 10
Business CentreZone Industrielle KM 3,5Phone: (221) 33 859 12 80 / 81 - Fax: (221) 33 832 50 99
Regional BranchesKaolack Phone: (221) 33 938 40 16 - Fax: (221) 33 942 20 57
Mbour Phone: (221) 33 939 70 81 - Fax: (221) 33 957 33 23
OurossoguiPhone: (221) 33 938 29 39 - Fax: (221) 33 966 14 57
Saly Portudal Phone: (221) 33 939 71 10 - Fax: (221) 33 957 11 21
SébikotaneRoute Nationale Sébikotane
Thiès - Avenue Général de GaullePhone: (221) 33 939 45 70 - Fax: (221) 33 951 05 25
Thiès - Rue feu Amadou BarroPhone: (221) 33 951 05 01
Tambacounda Phone: (221) 33 939 81 61 - Fax: (221) 33 981 09 08
Touba Phone: (221) 33 939 19 20 / 21 - Fax: (221) 33 974 10 41
Ziguinchor Phone: (221) 33 938 83 30 - Fax: (221) 33 992 50 25
BANK OF AFRICA – SENEGAL
© MW DDB

61Annual Report 2012 - BANK OF AFRICA GROUP
Income 2011 2012Expenses 2011 2012
Liabilities 2011 2012
2010
Assets 2011 2012
INTEREST & SIMILAR INCOME
• ON INTERBANK LOANS
• ON CUSTOMER LOANS
• ON SUBORDINATED LOANS AND SECURITIES
• ON INVESTMENT SECURITIES
• OTHER INTEREST AND SIMILAR INCOME
INCOME FROM LEASING & SIMILAR OPERATIONS
COMMISSION
INCOME FROM FINANCIAL TRANSACTIONS
OTHER INCOME FROM BANKING OPERATIONS
GENERAL OPERATING INCOME
WRITE-BACK OF DEPRECIATION
AND PROVISIONS ON FIXED ASSETS
SURPLUS ON VALUE ADJUSTMENTS TO LOANS
& OFF-BALANCE-SHEET ITEMS
EXCESS OF WRITE-BACKS OVER PROVISIONING
OF GENERAL BANKING RISKS
EXCEPTIONAL INCOME
INCOME FROM PREVIOUS YEARS
LOSS
TOTAL INCOME
CASH
INTERBANK LOANS
CUSTOMER LOANS
• PORTFOLIO OF DISCOUNTED BILLS
• OTHER CUSTOMER CREDIT FACILITIES
• ORDINARY DEBTOR ACCOUNTS
• FACTORING
INVESTMENT SECURITIES
FINANCIAL ASSETS
LEASING AND SIMILAR TRANSACTIONS
FINANCIAL ASSETS AT EQUITY VALUE
INTANGIBLE ASSETS
FIXED ASSETS
SHAREHOLDERS & ASSOCIATES
OTHER ASSETS
SUNDRY ACCOUNTS
CONSOLIDATED GOODWILL
TOTAL ASSETS
INTERBANK LIABILITIES
CUSTOMER DEPOSITS
• SAVINGS DEPOSIT ACCOUNTS
• TIME DEPOSIT ACCOUNTS
• SHORT-TERM BORROWINGS
• OTHER DEMAND DEPOSITS
• OTHER TIME DEPOSIT ACCOUNTS
DEBT SECURITIES
OTHER LIABILITIES
SUNDRY ACCOUNTS
RESERVES FOR CONTINGENCIES & LOSSES
STATUTORY PROVISIONS
EARMARKED FUNDS
SUBORDINATED LOANS & SECURITIES
INVESTMENT SUBSIDIES
RESERVES FOR GENERAL BANKING RISKS
CAPITAL OR APPROPRIATIONS
SHARE PREMIUMS
RESERVES
RETAINED EARNINGS ( +/- )
NET INCOME
TOTAL LIABILITIES
3 583 801 913 8 487 970 313
111 106 219 162 121 534 714 538
5 847 589 195 8 463 067 168
173 338 682 256 691 544
55 141 921 491 57 022 660 050
49 943 369 794 55 792 295 776
2 500 000 000 4 500 000 000
2 788 449 094 3 675 663 535
1 581 692 391 2 391 555 102
86 871 233 139 131 943
190 026 732
7 000 000 000 8 500 000 000
1 562 500 000 2 312 500 000
1 433 219 892 2 389 283 633
549 392 435 533 753 632
2 040 424 938 2 364 133 665
134 422 597 790 156 828 706 361
7 485 798 385 8 679 444 344
376 742 246 269 439 418
7 109 056 139 8 410 004 926
763 534 289 776 918 496
7 469 749 754 3 779 625 363
122 129 809 178 402 176
964 320 578 1 277 009 411
250 299 386 49 053 305
151 728 765 74 373 858
17 207 560 966 14 986 653 762
INTEREST AND SIMILAR EXPENSES
• ON INTERBANK LIABILITIES
• ON CUSTOMER DEPOSITS
• ON DEBT SECURITIES
• ON SHAREHOLDERS’ & ASSOCIATES’ BLOCKED ACCOUNTS
AND ON SUBORDINATED DEBT
• OTHER INTEREST AND SIMILAR EXPENSES
EXPENSES ON LEASING AND SIMILAR OPERATIONS
COMMISSION
EXPENSES ON FINANCIAL OPERATIONS
OTHER BANK OPERATING EXPENSES
OPERATING OVERHEADS
• PERSONNEL COSTS
• OTHER OVERHEADS
DEPRECIATION AND PROVISIONS
ON FIXED ASSETS
DEFICIT ON VALUE ADJUSTMENTS TO LOANS
& OFF-BALANCE-SHEET ITEMS
EXCESS OF PROVISIONING OVER WRITE-BACKS
OF GENERAL BANKING RISKS
EXCEPTIONAL EXPENSES
LOSSES FROM PREVIOUS YEARS
CORPORATE INCOME TAX
PROFIT
TOTAL EXPENSES
1 959 379 545 4 658 670 456
40 821 087 235 36 303 385 787
73 391 729 928 94 677 203 620
11 405 358 014 12 093 499 760
48 462 064 494 61 398 628 822
13 524 307 420 21 185 075 038
10 382 202 861 11 384 624 468
543 867 800 1 047 858 823
208 546 982 228 548 904
2 198 717 431 2 364 575 075
3 399 931 306 4 217 954 384
1 517 134 702 1 945 884 844
134 422 597 790 156 828 706 361
3 541 798 393 3 826 836 022
53 374 917 166 286 395
3 310 285 968 3 463 751 453
162 500 000 192 111 111
15 637 508 4 687 063
37 145 568 25 544 472
5 817 762 673 1 736 948 750
77 764 687 138 123 389
4 230 725 737 4 881 006 763
1 297 391 742 1 625 703 060
2 933 333 995 3 255 303 703
356 638 267 414 219 495
8 652 423 155 376 581
113 366 383 94 064 636
146 058 014 49 727 727
837 223 883 1 128 845 453
2 040 424 938 2 364 133 665
17 207 560 966 14 986 653 762
BANK OF AFRICA – SENEGAL
(In CFAF) At 31.12.12, 1 Euro = 655.957 CFAF

62BANK OF AFRICA GROUP - Annual Report 2012
Website: www.boatanzania.com
Opening date: October 2007Created in 1995: EURAFRICAN BANK – TANZANIALtd (EBT). Integrated into BOA network in 2007.
Legal formLimited Company
Capital at 31/12/2012Tanzanian Shillings (TZS) 18.98 billion
Company registration No.26235
Board of Directors at 24/5/2013 Ambassador Fulgence KAZAURA, Chairman
Mohamed BENNANI
Abdelkabir BENNANI
Vincent de BROUWER
Bernard J. CHRISTIAANSE
Henry LALOUX
Shakir MERALI
Emmanuel Ole NAIKO
Ammishaddai OWUSU-AMOAH
Principal Shareholders at 31/12/2012AFH-OCEAN INDIEN 25.30%
BANK OF AFRICA – KENYA 24.05%
THE BELGIAN INVESTMENT COMPANY
FOR DEVELOPING COUNTRIES (BIO) 22.24%
AUREOS EAST AFRICA FUND LLC 13.70%
TANZANIA DEVELOPMENT FINANCE LTD (TDFL) 10.19%
NETHERLANDS DEVELOPMENT FINANCE
COMPANY (FMO) 3.70%
OTHER SHAREHOLDERS 0.82%
AuditorPRICEWATERHOUSECOOPERS
Registered officeNDC Development House - Ohio Street / Kivukoni Front
P.O. Box 3054 - Dar Es Salaam - TANZANIA
Phone: (255) 22 211 01 04 / 12 90
Fax: (255) 22 211 37 40
Cell: (255) 754 885 538 / 787 933 335
SWIFT: EUAFTZTZ
E-mail: <[email protected]>
Dar Es Salaam BranchesHead Office / NDC Branch Phone: (255) 22 211 01 04 / 12 90 Fax: (255) 22 211 37 40
Aggrey Phone: (255) 22 218 47 91 / 3 Fax: (255) 22 218 47 62
Airport Phone: (255) 22 286 44 81 / 2 Fax: (255) 22 286 04 81
Ilala Phone: (255) 22 286 31 92 / 3 Fax: (255) 22 286 31 94
Kijitonyama Phone: (255) 22 277 13 57 / 14 38 Fax: (255) 22 270 01 48
Mbezi Beach Phone: (255) 22 262 75 73 / 4 Fax: (255) 22 262 75 75
Mtoni Phone: (255) 22 285 68 37 / 8 Fax: (255) 22 285 68 39
Msimbazi Phone: (255) 22 218 01 37 / 8 Fax: (255) 22 218 01 68
Sinza Phone: (255) 22 246 13 58 / 9 Fax: (255) 22 246 13 60
Tandika Phone: (255) 22 285 64 17 / 21 Fax: (255) 22 285 64 19
Regional BranchesArusha Phone: (255) 27 254 51 28 / 9 Fax: (255) 27 254 51 30
KahamaPhone: (255) 28 271 11 39 / 40 Fax: (255) 28 271 11 41
Mbeya Phone: (255) 25 250 31 70 / 26 84 Fax: (255) 25 250 26 27
Morogoro Phone: (255) 23 261 36 81 / 2 Fax: (255) 23 261 36 83
Moshi Phone: (255) 27 275 02 72 / 3 Fax: (255) 27 275 02 98
Mtibwa Phone: (255) 23 262 00 25 / 2Fax: (255) 23 262 00 26
MtwaraPhone: (255) 23 233 46 51 / 2Fax: (255) 23 233 46 50
Mwanza Phone: (255) 28 254 22 98 / 9Fax: (255) 28 254 12 78 / 22 94
Tunduma Phone: (255) 25 253 04 32 Fax: (255) 25 253 04 35
BANK OF AFRICA – TANZANIA
© MW DDB

63Annual Report 2012 - BANK OF AFRICA GROUP
Liabilities 2012 2011
2010
Assets 2012 2011
CASH AND BALANCES WITH CENTRAL BANK
PLACEMENTS WITH OTHER BANKS
FINANCIAL ASSETS
CUSTOMER LOANS
EQUITY INVESTMENT
OTHER ASSETS
PREMISES AND EQUIPMENT
INTANGIBLE ASSETS
INCOME TAX RECOVERABLE
DEFERRED INCOME TAX
TOTAL ASSETS
DEPOSITS FROM OTHER BANKS
CUSTOMER DEPOSITS
SUBORDINATED LOANS
OTHER LIABILITIES
DEFERRED INCOME TAX
TOTAL LIABILITIES
SHARE CAPITAL
ADVANCE TOWARDS SHARE CAPITAL
SHARE PREMIUMS
RETAINED EARNINGS ( +/- )
REGULATORY RESERVE
TOTAL SHAREHOLDER’S EQUITY
TOTAL LIABILITIES
30 170 075 14 009 017
264 495 616 226 105 252
13 700 490 13 555 955
5 106 557 3 123 750
373 644
313 472 738 257 167 618
18 981 953 18 794 138
4 519 055 4 396 565
5 254 097 2 774 690
538 447 480 900
29 293 552 26 446 293
342 766 290 283 613 911
49 605 392 39 246 992
44 022 429 39 871 944
40 275 862 43 870 477
197 666 022 151 031 070
1 000 000
2 301 509 1 812 894
5 294 970 5 996 639
1 578 278 822 125
252 365 961 770
769 463
342 766 290 283 613 911
BANK OF AFRICA – TANZANIA
2012 2011Income statement29 815 411 20 012 368
-12 004 182 -7 860 789
17 811 229 12 151 579
8 192 128 6 597 787
-366 100 -340 352
7 826 028 6 257 435
3 212 911 3 016 214
28 850 168 21 425 228
336 600 371 971
-2 637 578 -1 782 608
-23 215 939 -18 375 026
3 333 251 1 639 565
-796 297 -512 774
2 536 954 1 126 791
INTEREST & SIMILAR INCOME
INTEREST AND SIMILAR INCOME
NET INTEREST INCOME
FEE AND COMMISSION INCOME
FEE AND COMMISSION EXPENSE
NET COMMISSION
FOREIGN EXCHANGE INCOME
OTHER INCOME
OPERATING INCOME
WRITE-BACK OF PROVISIONS
WRITE-BACK OF BAD DEBT PREVIOUSLY WRITTEN
OPERATING EXPENSES
PROFIT BEFORE INCOME TAX
INCOME TAX EXPENSE
NET INCOME
(In TZS thousands) At 31.12.12, 1 Euro = 2,085.18 TZS

64BANK OF AFRICA GROUP - Annual Report 2012
Website: www.boa-uganda.com
Opening date: October 2006Created in 1985: SEMBULE INVESTMENT BANK Ltd > ALLIED BANK. Integrated into BOA network in 2006.
Legal formLimited Liability Company
Capital at 31/12/2012Uganda Shillings (UGX) 25 billion
Company registration No.A1.001
Board of Directors at 15/3/2013 John CARRUTHERS, Chairman
Kwame AHADZI
Abdelkabir BENNANI
Mohamed BENNANI
Vincent de BROUWER
Bernard J. CHRISTIAANSE
Arthur ISIKO
Mohan KIWANUKA
Edigold MONDAY
Principal Shareholders at 31/12/2012BANK OF AFRICA – KENYA 50.01%
AFH-OCEAN INDIEN 22.48%
NETHERLANDS DEVELOPMENT FINANCE
COMPANY (FMO) 17.51%
CENTRAL HOLDINGS UGANDA LTD. 10.00%
AuditorDELOITTE & TOUCHE
Registered officeBANK OF AFRICA House
Plot 45, Jinja Road
P.O. Box 2750 - Kampala - UGANDA
Phone: (256) 414 302001
Fax: (256) 414 230 902
SWIFT: AFRIUGKA
E-mail: <[email protected]>
Kampala BranchesBbira mini-branchPhone: (256) 414 271424 - Fax: (256) 414 271424
Equatoria Phone: (256) 414 255842 - Fax: (256) 414 344064
Kabalagala Phone: (256) 414 501212 - Fax: (256) 414 501211
Kampala Road Phone: (256) 414 259915 - Fax: (256) 414 259915
Kawempe Phone: (256) 414 567240 - Fax: (256) 414 567240
Kololo Phone: (256) 414 302790 - Fax: (256) 414 255417
Luzira Phone: (256) 414 220380 - Fax: (256) 414 220380
Mukono Phone: (256) 414 291092 - Fax: (256) 414 291075
Nakivubo Phone: (256) 414 252050 - Fax: (256) 414 252049
Nalukolongo mini-branchPhone: (256) 414 274923 - Fax: (256) 414 274923
Namasuba Phone: (256) 414 501449 - Fax: (256) 414 501449
Nansana Phone: (256) 716 800118 - Fax: (256) 414 230902
Nateete Phone: (256) 414 271424 - Fax: (256) 414 271424
Ndeeba Phone: (256) 414 270810 - Fax: (256) 414 270810
Ntinda Phone: (256) 414 288779 - Fax: (256) 414 288782
Oasis Phone: (256) 417 130114 - Fax: (256) 417 130113
Park Phone: (256) 414 507145 - Fax: (256) 414 264351
Rwenzori mini-branchPhone: (256) 414 349043 / 234201 / 2
Wandegeya Phone: (256) 414 530057 - Fax: (256) 414 530486
Regional BranchesArua Phone: (256) 476 420482 - Fax: (256) 476 420476
Entebbe Phone: (256) 414 322581 - Fax: (256) 414 322607
Fort Portal Phone: (256) 483 422025 - Fax: (256) 483 422025
Gulu Phone: (256) 471 432622 - Fax: (256) 471 432627
Hoima Phone: (256) 465 440099 - Fax: (256) 465 440099
Jinja Phone: (256) 434 121013 - Fax: (256) 434 123113
Jinja - Clive Road Phone: (256) 434 120093 - Fax: (256) 434 120092
Kalongo mini-branchPhone: (256) 717 800546 - Fax: (256) 473 420049
Lira Phone: (256) 473 420050 - Fax: (256) 473 420049
Mbale Phone: (256) 454 432255 - Fax: (256) 454 432256
Mbarara Phone: (256) 485 420270 - Fax: (256) 485 420173
Patongo Phone: (256) 717 800546 - Fax: (256) 473 420049
Rubirizi Phone: (256) 717 800577
BANK OF AFRICA – UGANDA
© MW DDB

65Annual Report 2012 - BANK OF AFRICA GROUP
Liabilities 2012 2011
2010
Assets 2012 2011
CASH AND BALANCES WITH CENTRAL BANK
PLACEMENTS WITH OTHER BANKS
AMOUNTS DUE FROM GROUP COMPANIES
DERIVATIVE FINANCIAL INSTRUMENTS
CUSTOMER LOANS
INVESTMENT SECURITIES HELD FOR TRADING
FINANCIAL ASSETS
PREMISES AND EQUIPMENT
INTANGIBLE ASSETS
INCOME TAX RECOVERABLE
OTHER ASSETS
DEFERRED INCOME TAX
TOTAL ASSETS
CUSTOMER DEPOSITS
DEPOSITS FROM OTHER BANKS
AMOUNTS DUE TO GROUP COMPANIES
DERIVATIVES AT FAIR VALUE THROUGH PROFIT OR LOSS
OTHER BORROWED FUNDS
DEFERRED INCOME TAX
RETIREMENT BENEFIT OBLIGATIONS
OTHER LIABILITIES
TOTAL LIABILITIES
SHARE CAPITAL
SHARE PREMIUMS
REGULATORY RESERVE
PROPOSED DIVIDENDS
RETAINED EARNINGS ( +/- )
TOTAL SHAREHOLDER’S EQUITY
TOTAL LIABILITIES
299 922 278 184
17 054 38 554
5 717 12 619
12
63 929 51 657
4 683 5 087
391 317 386 101
25 000 20 919
5 390 6 086
2 958 2 465
22 230 16 098
55 578 45 568
893 790 863 338
60 811 47 552
25 305 42 995
8 786 8 941
195
240 468 242 792
81 080 63 440
16 092 16 814
1 964 1 015
364 683
8 459 6 037
3 566 1 205
446 895 431 669
BANK OF AFRICA – UGANDA
2012 2011Income statement58 710 39 998
-26 061 -18 493
32 649 21 505
15 733 11 426
-1 758 -1 159
13 975 10 267
2 174 3 635
744 894
49 542 36 301
-6 363 -1 443
-34 327 -28 065
8 852 6 793
897 -547
9 749 6 246
INTEREST & SIMILAR INCOME
INTEREST AND SIMILAR INCOME
NET INTEREST INCOME
FEE AND COMMISSION INCOME
FEE AND COMMISSION EXPENSE
NET COMMISSION
FOREIGN EXCHANGE INCOME
OTHER INCOME
OPERATING INCOME
IMPAIRMENT LOSSES ON LOANS AND ADVANCES
OPERATING EXPENSES
PROFIT BEFORE INCOME TAX
INCOME TAX EXPENSE / TAXATION CREDIT
NET INCOME
(In MUGX) At 31.12.12, 1 Euro = 3,570.075 UGX

66BANK OF AFRICA GROUP - Annual Report 2012
Website: www.bcb.bi
Opening date: 2008Created in 1909 in Brussels: BANQUE DU CONGOBELGE (BCB). 1922: BCB Branch in Usumbura,Burundi. 25 July 1964: BANQUE DE CREDIT DE BUJUMBURA (BCB). Integrated into BOA network in 2008.
Legal formSM
Capital at 31/12/2012Burundi Francs (BIF) 13 billion
Company registration No.RC 15.560
Board of Directors at 28/3/2013Rose KATARIHO, Chairman
Mohamed BENNANI
Vincent de BROUWER
Jean-Paul COUVREUR
Géneviève KANYANGE
Thierry LIENART
Carole MAMAN
Onésime NDUWIMANA
Tharcisse RUTUMO
Alain SIAENS
Anicet TUYAGA
Principal Shareholders at 31/12/2012SOCIÉTÉ D’ASSURANCE DU BURUNDI (SOCABU) 21.70%
BOA GROUP S.A. 20.25%
THE BELGIAN INVESTMENT COMPANY
FOR DEVELOPING COUNTRIES (BIO) 17.38%
BANQUE DEGROOF 17.37%
REPUBLIC OF BURUNDI 10.65%
OFFICE DU THÉ DU BURUNDI (OTB) 9.10%
COMPAGNIE DE GÉRANCE DU COTON (COGERCO) 1.66%
COMPLEXE TEXTILE DU BURUNDI (COTEBU) 1.28%
OTHER SHAREHOLDERS 0.61%
AuditorFENRAJ CONSEIL S.A.
Registered officeMairie de Bujumbura – Boulevard Patrice Lumumba
BP 300 - Bujumbura - REPUBLIC OF BURUNDI
Phone: (257) 22 20 11 11 - Fax: (257) 22 20 11 15
SWIFT: BCRBBIBI
E-mail: <[email protected]
Bujumbura Branches and Counters Agence Centrale Phone: (257) 22 20 11 11 - Fax: (257) 22 20 11 15
Buyenzi Phone: (257) 22 20 11 53 / 55
Centenaire Phone: (257) 22 20 11 91 / 92
Chaussée PLR Phone: (257) 22 20 11 04 / 06
Kinanira Phone: (257) 22 20 11 56 / 57
Orée du Golf Phone: (257) 22 20 11 12 / 13
Place de l’Indépendance Phone: (257) 22 20 11 43 / 44
Guichet à la Brarudi1
Phone: (257) 22 24 67 25
Guichet de Kigobe1
Phone: (257) 22 20 11 77
Guichet du Port de Bujumbura1
Phone: (257) 22 24 35 11
1 Attached to the BCB Head office
Branches and Counters in Provinces Gitega Phone: (257) 22 40 22 71 / 35 78 - Fax: (257) 22 40 3688
Karusi Phone: (257) 22 40 81 75 - Fax: (257) 22 40 81 47
Kayanza Phone: (257) 22 30 55 95 - Fax: (257) 22 30 57 68
Kirundo Phone: (257) 22 30 46 64 - Fax: (257) 22 30 46 65
MakambaPhone: (257) 22 50 82 47 / 48
Muyinga Phone: (257) 22 30 67 14 - Fax: (257) 22 30 67 14
Ngozi Phone: (257) 22 30 21 12 - Fax: (257) 22 30 20 20
Nyanza-Lac Phone: (257) 22 50 60 95 - Fax: (257) 22 50 60 96
Rugombo Phone: (257) 22 20 11 60
Rumonge Phone: (257) 22 50 43 15 - Fax: (257) 22 50 43 15
Rutana Phone: (257) 22 50 51 78 - Fax: (257) 22 50 51 80
Ruyigi Phone: (257) 22 40 60 78 - Fax: (257) 22 40 60 76
Guichet de la Bragita1
Province de Gitega – Route Nationale 2 - Gitega 1 Attached to the Gitega Branch
Guichet de Gihofi2
Phone: (257) 22 50 70 15 - Fax: (257) 22 50 70 15 2 Attached to the Rutana Branch
BANQUE DE CRÉDIT DE BUJUMBURA (BCB)
© MW DDB

67Annual Report 2012 - BANK OF AFRICA GROUP
Income 2011 2012Expenses 2011 2012
Liabilities 2011 2012
2010
Assets 2011 2012
INTEREST & SIMILAR INCOME
• ON INTERBANK LOANS
• ON CUSTOMER LOANS
• ON SUBORDINATED LOANS AND SECURITIES
• ON INVESTMENT SECURITIES
• OTHER INTEREST AND SIMILAR INCOME
INCOME FROM LEASING & SIMILAR OPERATIONS
COMMISSION
INCOME FROM FINANCIAL TRANSACTIONS
OTHER INCOME FROM BANKING OPERATIONS
GENERAL OPERATING INCOME
WRITE-BACK OF DEPRECIATION
AND PROVISIONS ON FIXED ASSETS
SURPLUS ON VALUE ADJUSTMENTS TO LOANS
& OFF-BALANCE-SHEET ITEMS
EXCESS OF WRITE-BACKS OVER PROVISIONING
OF GENERAL BANKING RISKS
EXCEPTIONAL INCOME
INCOME FROM PREVIOUS YEARS
LOSS
TOTAL INCOME
CASH
INTERBANK LOANS
CUSTOMER LOANS
• PORTFOLIO OF DISCOUNTED BILLS
• OTHER CUSTOMER CREDIT FACILITIES
• ORDINARY DEBTOR ACCOUNTS
• FACTORING
INVESTMENT SECURITIES
FINANCIAL ASSETS
LEASING AND SIMILAR TRANSACTIONS
FINANCIAL ASSETS AT EQUITY VALUE
INTANGIBLE ASSETS
FIXED ASSETS
SHAREHOLDERS & ASSOCIATES
OTHER ASSETS
SUNDRY ACCOUNTS
CONSOLIDATED GOODWILL
TOTAL ASSETS
INTERBANK LIABILITIES
CUSTOMER DEPOSITS
• SAVINGS DEPOSIT ACCOUNTS
• TIME DEPOSIT ACCOUNTS
• SHORT-TERM BORROWINGS
• OTHER DEMAND DEPOSITS
• OTHER TIME DEPOSIT ACCOUNTS
DEBT SECURITIES
OTHER LIABILITIES
SUNDRY ACCOUNTS
RESERVES FOR CONTINGENCIES & LOSSES
STATUTORY PROVISIONS
EARMARKED FUNDS
SUBORDINATED LOANS & SECURITIES
INVESTMENT SUBSIDIES
RESERVES FOR GENERAL BANKING RISKS
CAPITAL OR APPROPRIATIONS
SHARE PREMIUMS
RESERVES
RETAINED EARNINGS ( +/- )
NET INCOME
TOTAL LIABILITIES
1 418 971 2 758 034
196 426 058 234 496 488
143 567 966 162 944 784
24 951 527 40 625 772
92 500 299 500
5 761 092 4 889 050
22 052 973 25 737 382
8 581 647 1 974 466
4 806 823 3 949 409
1 782 506 1 982 506
6 917 6 917
935 000 1 435 000
13 000 000 13 000 000
8 415 563 13 086 295
3 464 3 054
8 603 037 3 692 302
243 979 986 276 384 471
17 023 239 21 984 647
365 908 483 552
16 657 331 21 501 095
79 808 70 757
3 591 493 3 719 021
9 101 952 6 416 607
653 609 977 834
61 770 80 631
62 268 62 268
29 324 30 342
30 603 463 33 342 107
INTEREST AND SIMILAR EXPENSES
• ON INTERBANK LIABILITIES
• ON CUSTOMER DEPOSITS
• ON DEBT SECURITIES
• ON SHAREHOLDERS’ & ASSOCIATES’ BLOCKED ACCOUNTS
AND ON SUBORDINATED DEBT
• OTHER INTEREST AND SIMILAR EXPENSES
EXPENSES ON LEASING AND SIMILAR OPERATIONS
COMMISSION
EXPENSES ON FINANCIAL OPERATIONS
OTHER BANK OPERATING EXPENSES
OPERATING OVERHEADS
• PERSONNEL COSTS
• OTHER OVERHEADS
DEPRECIATION AND PROVISIONS
ON FIXED ASSETS
DEFICIT ON VALUE ADJUSTMENTS TO LOANS
& OFF-BALANCE-SHEET ITEMS
EXCESS OF PROVISIONING OVER WRITE-BACKS
OF GENERAL BANKING RISKS
EXCEPTIONAL EXPENSES
LOSSES FROM PREVIOUS YEARS
CORPORATE INCOME TAX
PROFIT
TOTAL EXPENSES
8 263 016 9 102 001
73 996 069 90 579 447
126 571 506 153 990 023
10 435 064 10 141 874
64 065 712 81 709 758
52 070 730 62 138 391
16 270 400 2 770 400
117 354 123 101
455 476 0
296 179 623 615
14 172 817 17 373 129
3 028 147 1 346 548
809 022 476 207
243 979 986 276 384 471
3 558 439 5 516 840
59 311 252 903
3 494 118 5 246 115
5 010 17 822
11 766 792 13 339 397
5 828 333 5 864 105
5 938 459 7 475 292
1 462 560 1 784 570
1 416 792 5 822 259
350 000 1 200 000
3 445 843 1 986 739
8 603 037 3 692 302
30 603 463 33 342 107
BANQUE DE CREDIT DE BUJUMBURA (BCB)
(In BIF thousands) At 31.12.12, 1 Euro = 2,041.0443 BIF

68BANK OF AFRICA GROUP - Annual Report 2012
Website: www.bhb.bj
Opening date: April 2004
Legal formS.A. with Board of Directors
Capital at 31/12/2012CFAF 5 billion
Company registration No.RB Cotonou 2007 B2267 (ancien 2003 B 1660)
Board of Directors at 28/3/2013 Georges ABALLO, Chairman
BANK OF AFRICA – BENIN,
represented by Cheikh Tidiane N’DIAYE
Mohamed BENNANI
CNSS, represented by René HOUESSOU
ÉTAT DU BÉNIN, represented by Mohamed LATOUNDJI
Benoît MAFFON
Abderrazzak ZEBDANI
Principal Shareholders at 31/12/2012BOA WEST AFRICA 42.86%
BANK OF AFRICA – BENIN 31.07%
NETHERLANDS DEVELOPMENT FINANCE
COMPANY (FMO) 10.00%
PROPARCO 4.50%
BENIN STATE 4.50%
CNSS 3.00%
BHS 1.00%
LA POSTE DU BÉNIN 0.60%
PRIVATE SHAREHOLDERS 2.47%
AuditorsFIDUCIAIRE D'AFRIQUE: JOHANNES DAGNON
MAZARS: ARMAND FANDOHAN
Registered officeBoulevard de France
01 BP 6555 - Cotonou - REPUBLIC OF BENIN
Phone: (229) 21 31 24 25
Fax: (229) 21 31 24 60
E-mail: <[email protected]>
BANQUE DE L'HABITAT DU BÉNIN (BHB)
© MW DDB

69Annual Report 2012 - BANK OF AFRICA GROUP
Income 2011 2012Expenses 2011 2012
Liabilities 2011 2012
2010
Assets 2011 2012
INTEREST & SIMILAR INCOME
• ON INTERBANK LOANS
• ON CUSTOMER LOANS
• ON INVESTMENT SECURITIES
• OTHER INTEREST AND SIMILAR INCOME
COMMISSION
INCOME FROM FINANCIAL TRANSACTIONS
OTHER INCOME FROM BANKING OPERATIONS
GENERAL OPERATING INCOME
WRITE-BACK OF DEPRECIATION
AND PROVISIONS ON FIXED ASSETS
SURPLUS ON VALUE ADJUSTMENTS TO LOANS
& OFF-BALANCE-SHEET ITEMS
EXCESS OF WRITE-BACKS OVER PROVISIONING
OF GENERAL BANKING RISKS
EXCEPTIONAL INCOME
INCOME FROM PREVIOUS YEARS
LOSS
TOTAL INCOME
CASH
INTERBANK LOANS
CUSTOMER LOANS
• PORTFOLIO OF DISCOUNTED BILLS
• OTHER CUSTOMER CREDIT FACILITIES
• ORDINARY DEBTOR ACCOUNTS
INVESTMENT SECURITIES
FINANCIAL ASSETS
INTANGIBLE ASSETS
FIXED ASSETS
SHAREHOLDERS & ASSOCIATES
OTHER ASSETS
SUNDRY ACCOUNTS
TOTAL ASSETS
INTERBANK LIABILITIES
CUSTOMER DEPOSITS
• SAVINGS DEPOSIT ACCOUNTS
• TIME DEPOSIT ACCOUNTS
• SHORT-TERM BORROWINGS
• OTHER DEMAND DEPOSITS
• OTHER TIME DEPOSIT ACCOUNTS
DEBT SECURITIES
OTHER LIABILITIES
SUNDRY ACCOUNTS
RESERVES FOR CONTINGENCIES & LOSSES
STATUTORY PROVISIONS
EARMARKED FUNDS
SUBORDINATED LOANS & SECURITIES
INVESTMENT SUBSIDIES
RESERVES FOR GENERAL BANKING RISKS
CAPITAL OR APPROPRIATIONS
SHARE PREMIUMS
RESERVES
RETAINED EARNINGS ( +/- )
NET INCOME
TOTAL LIABILITIES
1 781 235 000 2 400 639 436
17 879 150 000 17 922 402 956
6 603 744 000 6 481 711 009
1 986 296 000 2 041 603 918
9 289 110 000 9 399 088 029
2 000 000 000
302 949 521 374 553 816
377 000 000 264 691 097
7 026 000 46 593 928
1 000 000 000 1 000 000 000
5 000 000 000 5 000 000 000
14 169 000 64 239 141
80 292 000 214 021 804
333 521 000 182 479 708
26 775 342 521 29 469 621 886
2 117 439 000 2 157 562 598
73 627 000 70 778 246
2 025 042 000 2 062 789 778
18 770 000 23 994 574
58 000 000 45 990 345
35 482 000 30 649 850
2 914 000 6 404 033
1 026 000 1 256 882
28 000 000 47 126 719
2 242 861 000 2 288 990 427
INTEREST AND SIMILAR EXPENSES
• ON INTERBANK LIABILITIES
• ON CUSTOMER DEPOSITS
• ON DEBT SECURITIES
• OTHER INTEREST AND SIMILAR EXPENSES
COMMISSION
EXPENSES ON FINANCIAL OPERATIONS
OTHER BANK OPERATING EXPENSES
OPERATING OVERHEADS
• PERSONNEL COSTS
• OTHER OVERHEADS
DEPRECIATION AND PROVISIONS
ON FIXED ASSETS
DEFICIT ON VALUE ADJUSTMENTS TO LOANS
& OFF-BALANCE-SHEET ITEMS
EXCESS OF PROVISIONING OVER WRITE-BACKS
OF GENERAL BANKING RISKS
EXCEPTIONAL EXPENSES
LOSSES FROM PREVIOUS YEARS
CORPORATE INCOME TAX
PROFIT
TOTAL EXPENSES
39 000 000 79 902 255
2 831 557 000 4 691 917 944
22 537 276 000 23 102 374 469
66 230 000
9 970 092 000 9 755 078 169
12 500 954 000 13 347 296 300
937 500 000 875 000 000
100 000 000 100 000 000
299 521 113 928 893
119 967 000 257 689 562
181 743 000 225 152 396
28 000 000 23 656 367
26 775 342 521 29 469 621 886
798 021 000 864 815 464
99 097 000 112 892 193
698 924 000 724 183 545
27 739 726
7 808 017
631 405
690 262 000 665 642 632
365 702 000 299 834 488
324 560 000 365 808 144
22 871 000 43 525 135
205 525 000 432 248 978
1 277 000 6 150 042
22 384 000 1 303 546
169 000 000 84 385 500
333 521 000 182 479 708
2 242 861 000 2 288 990 427
BANQUE DE L'HABITAT DU BENIN (BHB)
(In CFAF) At 31.12.12, 1 Euro = 655.957 CFAF

70BANK OF AFRICA GROUP - Annual Report 2012
Opening date: December 1997
Legal formS.A. with Board of Directors
Capital at 31/12/2012CFAF 525 million
Company registration No.RB/COT/08 B 2783
Board of Directors at 31/12/2012Mohamed BENNANI, Chairman
BANK OF AFRICA – BENIN,
represented by Patrick SAIZONOU
Youssef BENKIRANE
Paulin Laurent COSSI
Jean-François MONTEIL
Principal Shareholders at 31/12/2012BOA GROUP S.A. 14.12%
BANK OF AFRICA – BENIN 20.33%
BANK OF AFRICA – CÔTE D'IVOIRE 13.07%
BANK OF AFRICA – MALI 13.07%
BANK OF AFRICA – NIGER 13.07%
BANK OF AFRICA – SENEGAL 8.57%
BANK OF AFRICA – BURKINA FASO 5.81%
PRIVATE SHAREHOLDERS 11.96%
AuditorMAZARS BENIN
Registered officeBoulevard de France
08 BP 0879 - Cotonou - REPUBLIC OF BENIN
Phone: (229) 21 31 53 43
Fax: (229) 21 31 78 00
E-mail: <[email protected]>
ACTIBOURSE
© MW DDB

71Annual Report 2012 - BANK OF AFRICA GROUP
Income 2011 2012Expenses 2011 2012
Liabilities 2011 2012
2010
Assets 2011 2012
PRIMARY MARKET OPERATING INCOME
SECONDARY MARKET OPERATING INCOME
INCOME FROM OVER-THE-COUNTER OPERATIONS
SAFE CUSTODY EARNINGS
INCOME FROM OTHER TRANSACTIONS
GENERAL OPERATING INCOME
WRITE-BACK OF PROVISIONS
EXCEPTIONAL INCOME
TOTAL INCOME
INTERBANK LOANS
CUSTOMER ACCOUNTS
INVESTMENT SECURITIES
SUNDRY ACCOUNTS
TRADING AND SETTLEMENT ACCOUNTS
ADJUSTMENT ACCOUNTS
FINANCIAL ASSETS
DEPOSITS AND GUARANTEES
CURRENT ASSETS
OPERATING ASSETS
TOTAL ASSETS
INTERBANK LIABILITIES
CUSTOMER ACCOUNTS
OTHER AMOUNTS DUE TO CUSTOMERS
SUNDRY ACCOUNTS
TRADING AND SETTLEMENT ACCOUNTS
ADJUSTMENT ACCOUNTS
RESERVES FOR CONTINGENCIES & LOSSES
SHARE PREMIUMS AND RESERVES
CAPITAL
RETAINED EARNINGS (+/-)
NET INCOME
TOTAL LIABILITIES
4 175 290 012 4 965 911 654
262 899 936 238 345 707
186 122 287 129 822 281
248 522 685 248 522 685
350 000 000 525 000 000
195 418 182 205 485 262
535 067 080 462 921 817
5 953 320 182 6 776 009 406
665 174 872 591 340 552
120 659 559 84 570 139
39 746 104 9 090 909
356 016 768 413 540 428
84 889 785 110 968 798
52 164 113 60 000 871
311 484 360 37 993 500
1 630 135 561 1 307 505 197
INTERMEDIATION EXPENSES
EXPENSES ON FINANCIAL TRANSACTIONS
OTHER PURCHASING AND EXTERNAL SERVICES
SUNDRY EXPENSES
TAXES
PERSONNEL COSTS
SOCIAL CONTRIBUTIONS
DEPRECIATION AND PROVISION
LOSSES ON IMPAIRED LOANS
EXCEPTIONAL EXPENSES
INCOME TAX EXPENSE
NET INCOME FOR THE YEAR
TOTAL EXPENSES
4 931 109 589 5 519 929 054
142 554 348 146 710 377
457 087 542 463 096 466
252 673 083 412 554 978
135 158 140 158 005 677
4 379 906 41 050 654
30 357 574 34 662 200
5 953 320 182 6 776 009 406
84 647 647 91 117 313
13 978 505 14 502 441
541 388 831 330 039 409
19 784 264 14 163 095
177 003 305 179 616 120
23 852 243 36 787 239
9 132 586 9 367 463
225 281 100 168 990 300
535 067 080 462 921 817
1 630 135 561 1 307 505 197
ACTIBOURSE
(In CFAF) At 31.12.12, 1 Euro = 655.957 CFAF

72BANK OF AFRICA GROUP - Annual Report 2012
Opening date: July 2002
Legal formS.A.
Capital at 31/12/2012CFAF 5 billion
Company registration No.RCCM N° 282497 Abidjan - Plateau
Board of Directors at 31/12/2012Mohamed BENNANI, Chairman
BANK OF AFRICA – BENIN,
represented by Cheikh Tidiane N'DIAYE
BANK OF AFRICA – MALI,
represented by Laurent BASQUE
BANK OF AFRICA – NIGER,
represented by Sadio CISSE
Jean François MONTEIL
Lala MOULAYE
Léon NAKA
Principal Shareholders at 31/12/2012BOA GROUP S.A. 50.74%
NETHERLANDS DEVELOPMENT FINANCE
COMPANY (FMO) 16.00%
BANK OF AFRICA – BENIN 7.50%
AUTRES ENTREPRISES 5.39%
BANK OF AFRICA – BURKINA FASO 5.00%
BANK OF AFRICA – MALI 5.00%
BANK OF AFRICA – NIGER 5.00%
FONDS OUEST AFRICAIN D'INVESTISSEMENT 0.91%
BANK OF AFRICA – CÔTE D'IVOIRE 0.57%
BANK OF AFRICA – SENEGAL 0.43%
PRIVATE SHAREHOLDERS 3.46%
AuditorMAZARS CÔTE D'IVOIRE
Registered officeAbidjan Plateau
Angle Avenue Terrasson de Fougères - Rue Gourgas
01 BP 4132 Abidjan 01 - CÔTE D'IVOIRE
AGORA
© MW DDB

73Annual Report 2012 - BANK OF AFRICA GROUP
Income 2011 2012Expenses 2011 2012
Liabilities 2011 2012
2010
Assets 2011 2012
INTEREST & SIMILAR INCOME
• ON INTERBANK LOANS
• ON CUSTOMER LOANS
• ON INVESTMENT SECURITIES
• OTHER INTEREST AND SIMILAR INCOME
COMMISSION
INCOME FROM FINANCIAL TRANSACTIONS
OTHER INCOME FROM BANKING OPERATIONS
GENERAL OPERATING INCOME
WRITE-BACK OF DEPRECIATION
AND PROVISIONS ON FIXED ASSETS
SURPLUS ON VALUE ADJUSTMENTS TO LOANS
& OFF-BALANCE-SHEET ITEMS
EXCESS OF WRITE-BACKS OVER PROVISIONING
OF GENERAL BANKING RISKS
EXCEPTIONAL INCOME
INCOME FROM PREVIOUS YEARS
LOSS
TOTAL INCOME
CASH
INTERBANK LOANS
CUSTOMER LOANS
• PORTFOLIO OF DISCOUNTED BILLS
• OTHER CUSTOMER CREDIT FACILITIES
• ORDINARY DEBTOR ACCOUNTS
• FACTORING
INVESTMENT SECURITIES
FINANCIAL ASSETS
INTANGIBLE ASSETS
FIXED ASSETS
SHAREHOLDERS & ASSOCIATES
OTHER ASSETS
SUNDRY ACCOUNTS
TOTAL ASSETS
INTERBANK LIABILITIES
CUSTOMER DEPOSITS
• SAVINGS DEPOSIT ACCOUNTS
• TIME DEPOSIT ACCOUNTS
• SHORT-TERM BORROWINGS
• OTHER DEMAND DEPOSITS
• OTHER TIME DEPOSIT ACCOUNTS
DEBT SECURITIES
OTHER LIABILITIES
SUNDRY ACCOUNTS
RESERVES FOR CONTINGENCIES & LOSSES
STATUTORY PROVISIONS
SUBORDINATED LOANS & SECURITIES
RESERVES FOR GENERAL BANKING RISKS
CAPITAL OR APPROPRIATIONS
SHARE PREMIUMS
RESERVES
RETAINED EARNINGS ( +/- )
NET INCOME
TOTAL LIABILITIES
7 062 316 6 225 884
6 632 501 772 4 752 771 684
5 000 000 000 5 000 000 000
2 185 655 540 2 185 655 540
330 574 007 3 584 142 457
14 553 568 450 6 508 241 460
28 709 362 085 22 037 037 025
442 303 628 562 788 560
442 303 628 562 788 560
8 850 128 418 7 059 627 066
6 200 000 1 200 000
29 309 500
6 280 260 000
15 578 892 046 7 652 925 126
INTEREST AND SIMILAR EXPENSES
• ON INTERBANK LIABILITIES
• ON CUSTOMER DEPOSITS
• ON DEBT SECURITIES
• OTHER INTEREST AND SIMILAR EXPENSES
EXPENSES ON LEASING AND SIMILAR OPERATIONS
COMMISSION
EXPENSES ON FINANCIAL OPERATIONS
OTHER BANK OPERATING EXPENSES
OPERATING OVERHEADS
• PERSONNEL COSTS
• OTHER OVERHEADS
DEPRECIATION AND PROVISIONS
ON FIXED ASSETS
DEFICIT ON VALUE ADJUSTMENTS TO LOANS
& OFF-BALANCE-SHEET ITEMS
EXCESS OF PROVISIONING OVER WRITE-BACKS
OF GENERAL BANKING RISKS
EXCEPTIONAL EXPENSES
LOSSES FROM PREVIOUS YEARS
CORPORATE INCOME TAX
PROFIT
TOTAL EXPENSES
14 522 236 293 8 488 266 780
25 551 370 943 587 983
12 505 370 796 12 594 728 589
1 656 203 626 10 453 673
28 709 362 085 22 037 037 025
442 086 820 476 037 940
442 086 820 476 037 940
626 464 976
397 196 026
186 040 750 42 180 750
14 553 568 450 6 508 241 460
15 578 892 046 7 652 925 126
AGORA
(In CFAF) At 31.12.12, 1 Euro = 655.957 CFAF

74BANK OF AFRICA GROUP - Annual Report 2012
Opening date: October 2004
Legal formS.A.
Capital at 31/12/2012CFAF 2.5 billion
Company registration No.RCM N° CI-ABJ-2009-B-2853 Abidjan-Plateau
Board of Directors at 31/12/2012Benoit MAFFON, Chairman
BOA GROUP S.A., represented by Mor FALL
UBA VIE, represented by Lassina COULIBALY
Jean-François MONTEIL
Principal Shareholders at 31/12/2012BOA GROUP S.A. 75.08%
UBA VIE 11.76%
GÉNÉRALE DES ASSURANCES DU BÉNIN 4.00%
AFRICAINE DES ASSURANCES 4.00%
OTHER COMPANY 0.40%
PRIVATE SHAREHOLDERS 4.76%
AuditorMAZARS CÔTE D'IVOIRE
Registered officeAbidjan Plateau
Angle Avenue Terrasson de Fougères - Rue Gourgas
01 BP 4132 Abidjan 01 - CÔTE D'IVOIRE
ATTICA
© MW DDB

75Annual Report 2012 - BANK OF AFRICA GROUP
Income 2011 2012Expenses 2011 2012
Liabilities 2011 2012
2010
Assets 2011 2012
IINTÉRÊTS ET PRODUITS ASSIMILÉS
• ON INTERBANK LOANS
• ON CUSTOMER LOANS
• ON INVESTMENT SECURITIES
• OTHER INTEREST AND SIMILAR INCOME
COMMISSION
INCOME FROM FINANCIAL TRANSACTIONS
OTHER INCOME FROM BANKING OPERATIONS
GENERAL OPERATING INCOME
WRITE-BACK OF DEPRECIATION
AND PROVISIONS ON FIXED ASSETS
SURPLUS ON VALUE ADJUSTMENTS TO LOANS
& OFF-BALANCE-SHEET ITEMS
EXCESS OF WRITE-BACKS OVER PROVISIONING
OF GENERAL BANKING RISKS
EXCEPTIONAL INCOME
INCOME FROM PREVIOUS YEARS
LOSS
TOTAL INCOME
CASH
INTERBANK LOANS
CUSTOMER LOANS
• PORTFOLIO OF DISCOUNTED BILLS
• OTHER CUSTOMER CREDIT FACILITIES
• ORDINARY DEBTOR ACCOUNTS
• FACTORING
INVESTMENT SECURITIES
FINANCIAL ASSETS
INTANGIBLE ASSETS
FIXED ASSETS
SHAREHOLDERS & ASSOCIATES
OTHER ASSETS
SUNDRY ACCOUNTS
TOTAL ASSETS
INTERBANK LIABILITIES
CUSTOMER DEPOSITS
• SAVINGS DEPOSIT ACCOUNTS
• TIME DEPOSIT ACCOUNTS
• SHORT-TERM BORROWINGS
• OTHER DEMAND DEPOSITS
• OTHER TIME DEPOSIT ACCOUNTS
DEBT SECURITIES
OTHER LIABILITIES
SUNDRY ACCOUNTS
RESERVES FOR CONTINGENCIES & LOSSES
STATUTORY PROVISIONS
SUBORDINATED LOANS & SECURITIES
RESERVES FOR GENERAL BANKING RISKS
CAPITAL OR APPROPRIATIONS
SHARE PREMIUMS
RESERVES
RETAINED EARNINGS ( +/- )
NET INCOME
TOTAL LIABILITIES
3 281 156 4 458 181
860 274 690 56 582 176
2 519 460
1 700 000 000 2 500 000 000
70 311 735 87 275 097
5 156 388 7 826 647
169 633 621 229 375 357
2 811 177 050 2 885 517 458
7 338 107 25 278 254
7 338 107 25 278 254
198 526 737 256 255 424
2 519 460
205 864 844 284 053 138
INTEREST AND SIMILAR EXPENSES
• ON INTERBANK LIABILITIES
• ON CUSTOMER DEPOSITS
• ON DEBT SECURITIES
• OTHER INTEREST AND SIMILAR EXPENSES
EXPENSES ON LEASING AND SIMILAR OPERATIONS
COMMISSION
EXPENSES ON FINANCIAL OPERATIONS
OTHER BANK OPERATING EXPENSES
OPERATING OVERHEADS
• PERSONNEL COSTS
• OTHER OVERHEADS
DEPRECIATION AND PROVISIONS
ON FIXED ASSETS
DEFICIT ON VALUE ADJUSTMENTS TO LOANS
& OFF-BALANCE-SHEET ITEMS
EXCESS OF PROVISIONING OVER WRITE-BACKS
OF GENERAL BANKING RISKS
EXCEPTIONAL EXPENSES
LOSSES FROM PREVIOUS YEARS
CORPORATE INCOME TAX
PROFIT
TOTAL EXPENSES
531 948 587 441 537 704
257 092 808 372 056 029
2 022 135 655 2 071 923 725
2 811 177 050 2 885 517 458
34 231 223 50 819 781
34 231 223 50 819 781
2 000 000 3 858 000
169 633 621 229 375 357
205 864 844 284 053 138
ATTICA
(In CFAF) At 31.12.12, 1 Euro = 655.957 CFAF

76BANK OF AFRICA GROUP - Annual Report 2012
Opening date: December 2009
Legal formS.A.
Capital at 31/12/2012CFAF 50 million
Company registration No.CI-ABJ 2008- B – 7102
Board of Directors at 31/12/2012Mohamed BENNANI, Chairman
Amine AMOR
BANK OF AFRICA – CÔTE D’IVOIRE,
represented by Léon NAKA
BOA GROUP S.A.,
represented by Jean-François MONTEIL
Abderrazzak ZEBDANI
Principal Shareholders at 31/12/2012BOA GROUP S.A. 99.90%
PRIVATE SHAREHOLDERS 0.10%
AuditorsMAZARS CÔTE D’IVOIRE
YZAS BAKER TILLY
Registered officeAbidjan Plateau
Angle Avenue Terrasson de Fougères - Rue Gourgas
01 BP 4132 Abidjan 01 - CÔTE D'IVOIRE
Phone: (225) 20 30 34 00
Fax: (225) 20 30 34 01
E-mail: <[email protected]>
BOA-ASSET MANAGEMENT
© MW DDB

77Annual Report 2012 - BANK OF AFRICA GROUP
Income 2011 2012Expenses 2011 2012
Liabilities 2011 2012
2010
Assets 2011 2012
PRIMARY MARKET OPERATING INCOME
SECONDARY MARKET OPERATING INCOME
INCOME FROM OVER-THE-COUNTER OPERATIONS
SAFE CUSTODY EARNINGS
INCOME FROM OTHER TRANSACTIONS
GENERAL OPERATING INCOME
WRITE-BACK OF PROVISIONS
EXCEPTIONAL INCOME
TOTAL INCOME
INTERBANK LOANS
CUSTOMER ACCOUNTS
INVESTMENT SECURITIES
SUNDRY ACCOUNTS
TRADING AND SETTLEMENT ACCOUNTS
ADJUSTMENT ACCOUNTS
FINANCIAL ASSETS
DÉPÔTS ET CAUTIONNEMENTS
CURRENT ASSETS
OPERATING ASSETS
TOTAL ASSETS
INTERBANK LIABILITIES
CUSTOMER ACCOUNTS
OTHER AMOUNTS DUE TO CUSTOMERS
SUNDRY ACCOUNTS
TRADING AND SETTLEMENT ACCOUNTS
ADJUSTMENT ACCOUNTS
RESERVES FOR CONTINGENCIES & LOSSES
SHARE PREMIUMS AND RESERVES
CAPITAL
RETAINED EARNINGS ( +/- )
NET INCOME
TOTAL LIABILITIES
23 669 499 19 512 002
23 322 038 25 446 746
40 000 000 50 000 000
-25 084 605 -19 080 956
6 003 649 17 560 441
67 910 581 93 438 233
62 620 791 107 920 715
1 454 556 1 326 699
3 291 749 5 769 180
67 367 096 115 016 594
INTERMEDIATION EXPENSES
EXPENSES ON FINANCIAL TRANSACTIONS
OTHER PURCHASING AND EXTERNAL SERVICES
SUNDRY EXPENSES
TAXES
PERSONNEL COSTS
SOCIAL CONTRIBUTIONS
DEPRECIATION AND PROVISION
LOSSES ON IMPAIRED LOANS
EXCEPTIONAL EXPENSES
INCOME TAX EXPENSE
NET INCOME FOR THE YEAR
TOTAL EXPENSES
16 656 455 2 606 639
20 588 096 67 028 004
30 666 030 23 803 590
67 910 581 93 438 233
4 100 000
169 499 1 232 038
18 625 550 33 132 670
3 434 583 4 392 524
31 323 569 38 290 491
1 555 913 2 442 885
4 254 333 11 865 545
2 000 000 2 000 000
6 003 649 17 560 441
67 367 096 115 016 594
BOA-ASSET MANAGEM
ENT
(In CFAF) At 31.12.12, 1 Euro = 655.957 CFAF

78BANK OF AFRICA GROUP - Annual Report 2012
Website: www.boafrance.com
Opening date: May 2010
Legal formS.A.
Capital at 31/12/2012Euros 10 million
Company registration No.RCS PARIS 514 242 338
Board of Directors at 31/12/2012Paul DERREUMAUX, Chairman
BANK OF AFRICA – CÔTE D'IVOIRE,
represented by Paul DERREUMAUX
BANK OF AFRICA – KENYA,
represented by Paulin Laurent COSSI
BANK OF AFRICA – MADAGASCAR,
represented by Francis SUEUR
BANK OF AFRICA – MALI,
represented by Serge KAPNIST
Mohamed BENNANI, Director
Principal Shareholders at 31/12/2012BANK OF AFRICA – MADAGASCAR 14.76%
AGORA 13.18%
BANK OF AFRICA – CÔTE D'IVOIRE 11.11%
BANK OF AFRICA – MALI 11.11%
BANK OF AFRICA – BENIN 10.00%
BANK OF AFRICA – BURKINA FASO 10.00%
BANK OF AFRICA – SENEGAL 10.00%
PROPARCO 10.00%
BANK OF AFRICA – KENYA 5.00%
BANK OF AFRICA – NIGER 4.44%
OTHER SHAREHOLDERS 0.40%
AuditorMAZARS FRANCE
Registered office12, rue de la Paix
75002 Paris - FRANCE
Phone: (33) 1 42 96 11 40
Fax: (33) 1 42 96 11 68
E-mail: <[email protected]>
Paris BranchesAgence Entreprise Phone: (33) 1 42 96 11 40 - Fax: (33) 1 42 96 11 68
La Plaine Phone: (33) 1 44 64 90 90 - Fax: (33) 1 44 64 75 95
Strasbourg Phone: (33) 1 42 96 92 94 - Fax: (33) 1 53 24 98 41
Ornano Phone: (33) 1 81 80 18 18 - Fax: (33) 1 42 58 88 37
Regional BranchMarseillePhone: (33) 4 91 19 14 07 - Fax: (33) 4 91 54 08 73
BOA-FRANCE
© Beboy - Fotolia.com

79Annual Report 2012 - BANK OF AFRICA GROUP
Income 2011 2012Expenses 2011 2012
Liabilities 2011 2012
2010
Assets 2011 2012
INTEREST & SIMILAR INCOME
• ON INTERBANK LOANS
• ON CUSTOMER LOANS
• ON SUBORDINATED LOANS AND SECURITIES
• ON INVESTMENT SECURITIES
• OTHER INTEREST AND SIMILAR INCOME
INCOME FROM LEASING & SIMILAR OPERATIONS
COMMISSION
INCOME FROM FINANCIAL TRANSACTIONS
OTHER INCOME FROM BANKING OPERATIONS
GENERAL OPERATING INCOME
WRITE-BACK OF DEPRECIATION
AND PROVISIONS ON FIXED ASSETS
SURPLUS ON VALUE ADJUSTMENTS TO LOANS
& OFF-BALANCE-SHEET ITEMS
EXCESS OF WRITE-BACKS OVER PROVISIONING
OF GENERAL BANKING RISKS
EXCEPTIONAL INCOME
INCOME FROM PREVIOUS YEARS
LOSS
TOTAL INCOME
CASH
INTERBANK LOANS
CUSTOMER LOANS
• PORTFOLIO OF DISCOUNTED BILLS
• OTHER CUSTOMER CREDIT FACILITIES
• ORDINARY DEBTOR ACCOUNTS
• FACTORING
INVESTMENT SECURITIES
FINANCIAL ASSETS
LEASING AND SIMILAR TRANSACTIONS
FINANCIAL ASSETS AT EQUITY VALUE
INTANGIBLE ASSETS
FIXED ASSETS
SHAREHOLDERS & ASSOCIATES
OTHER ASSETS
SUNDRY ACCOUNTS
CONSOLIDATED GOODWILL
TOTAL ASSETS
INTERBANK LIABILITIES
CUSTOMER DEPOSITS
• SAVINGS DEPOSIT ACCOUNTS
• TIME DEPOSIT ACCOUNTS
• SHORT-TERM BORROWINGS
• OTHER DEMAND DEPOSITS
• OTHER TIME DEPOSIT ACCOUNTS
DEBT SECURITIES
OTHER LIABILITIES
SUNDRY ACCOUNTS
RESERVES FOR CONTINGENCIES & LOSSES
STATUTORY PROVISIONS
EARMARKED FUNDS
SUBORDINATED LOANS & SECURITIES
INVESTMENT SUBSIDIES
RESERVES FOR GENERAL BANKING RISKS
CAPITAL OR APPROPRIATIONS
SHARE PREMIUMS
RESERVES
RETAINED EARNINGS ( +/- )
NET INCOME
TOTAL LIABILITIES
6 898 249 14 545 105
714 321 1 536 323
1 536 323
714 321
111 096 92 036
596 202 564 638
7 000 000 10 000 000
-1 639 882 -3 216 974
-1 577 092 -1 497 177
12 102 894 22 023 951
75 975 117 581
58 608 80 263
17 367 37 318
789 447 1 262 633
70 234 41 460
11 089 17 663
1 577 092 1 497 177
2 523 838 2 936 514
INTEREST AND SIMILAR EXPENSES
• ON INTERBANK LIABILITIES
• ON CUSTOMER DEPOSITS
• ON DEBT SECURITIES
• ON SHAREHOLDERS’ & ASSOCIATES’ BLOCKED ACCOUNTS
AND ON SUBORDINATED DEBT
• OTHER INTEREST AND SIMILAR EXPENSES
EXPENSES ON LEASING AND SIMILAR OPERATIONS
COMMISSION
EXPENSES ON FINANCIAL OPERATIONS
OTHER BANK OPERATING EXPENSES
OPERATING OVERHEADS
• PERSONNEL COSTS
• OTHER OVERHEADS
DEPRECIATION AND PROVISIONS
ON FIXED ASSETS
DEFICIT ON VALUE ADJUSTMENTS TO LOANS
& OFF-BALANCE-SHEET ITEMS
EXCESS OF PROVISIONING OVER WRITE-BACKS
OF GENERAL BANKING RISKS
EXCEPTIONAL EXPENSES
LOSSES FROM PREVIOUS YEARS
CORPORATE INCOME TAX
PROFIT
TOTAL EXPENSES
247 599 209 772
6 857 054 1 560 671
22 868 1 219 242
1 215 768
22 709
159 3 475
2 561 501 16 977 002
587 262 487 555
1 193 717 1 067 649
272 031 327 171
360 861 174 887
12 102 894 22 023 951
28 879 24 842
28 879 24 842
28 026 59 136
18 822 50 364
56 594
2 100 953 2 390 886
963 991 1 157 694
1 136 963 1 233 192
283 611 409 740
6 953
1 546
2 523 838 2 936 514
BOA-FRANCE
(In Euros)

80BANK OF AFRICA GROUP - Annual Report 2012
Opening date : September 2013
Legal formS.A.
Capital at 15/06/2013CFAF 10 billion
Company registration No.RCCM TOGO - LOME 2009 B 0340
Board of Directors Paul DERREUMAUX, Chairman
Mohamed BENNANI,
representing BOA WEST AFRICA and AGORA S.A.
Paulin COSSI
Mamadou KA
Principal Shareholders at 31/12/2012BOA WEST AFRICA 68.30%
AGORA S.A. 26.24%
BANK OF AFRICA – BENIN 5.04%
PRIVATE SHAREHOLDERS 0.42%
AuditorsAFRIQUE AUDIT CONSULTING
FIDUCIAIRE D’AFRIQUE
Registered officeBoulevard de la République
BP 229 - Lomé - TOGO
Phone: (228) 22 53 62 62
E-mail: <[email protected]>
Lomé Branches Agence principale Phone: (228) 22 53 62 01
Jardin FréauPhone: (228) 22 53 62 04
BOA-TOGO, which is presented here withoutfinancial data, began operations in 2013 and hastherefore not closed its first financial year.
BANK OF AFRICA – TOGO
BANK OF AFRICA – TOGO

81Annual Report 2012 - BANK OF AFRICA GROUP
BANK
OF A
FRIC
A G
roup
Con
solid
ated
annu
al ac
coun
ts
Chambre de commerce. dakar - senegal. 6 avril 2025, 11:45:05
Colombe de la paix, Lome - Togo. 6 Avril 2025. 11:45:05
Port tower, dar es salaam - tanzania. 27th of june 2025. 11:45:05 AM
Speke roundabout, Kampala - Uganda. 7th of july 2025 11:45:05 AM
© MW DDB
© MW DDB

82BANK OF AFRICA GROUP - Annual Report 2012
Report by the Authorized Statutory Auditor at 31 December 2012
In accordance with our appointment by the General Meeting of Shareholders, we have audited the annualaccounts of BOA GROUP S.A., which comprise the consolidated balance sheet as at 31 December 2012,the consolidated profit and loss account ending on this date and a summary of the principal accountingmethods and other explanatory notes.
Board of Director’s responsibility for preparing and presenting the consolidated annual accounts
The Board of Directors is responsible for the preparation and fair presentation of these consolidatedannual accounts in accordance with legal and regulatory requirements relating to the preparationand presentation of consolidated annual accounts in force in Luxembourg, and for the internal controlprocesses relevant to the preparation and fait presentation of annual accounts that are free from materialmisstatement, whether due to fraud or error.
Authorized Statutory Auditor’s responsibility
Our responsibility is to express an opinion on these annual accounts based on our audit. We conductedour audit in accordance with International Standards on Auditing as adopted for Luxembourg by theCommission de Surveillance du Secteur Financier (supervisory authority). These standards require thatwe comply with ethical requirements and plan and perform the audit to obtain reasonable assurancethat the consolidated annual accounts are free from material misstatement.
An audit involves implementing procedures to obtain audit evidence about the amounts in the consolidatedannual accounts. The procedures selected depend on the Authorized Statutory Auditor’s judgement,including assessing the risks of material misstatement of the consolidated annual accounts, whether dueto fraud or error.
In conducting this assessment, the Authorized Statutory Auditor takes into consideration internal controlimplemented in the entity for the preparation and fair presentation of the consolidated annual accounts,in order to define appropriate auditing procedures in the circumstances but not with a view to expressingan opinion on the effectiveness of this control.
An audit also involves assessing the suitability of the accounting methods used and the soundness of theaccounting estimates made by the Board of Directors, as well as assessing the overall presentation ofthe consolidated annual accounts.
We believe that the audit evidence we have obtained is sufficient and provides an appropriate basisfor the opinion expresses below.

83Annual Report 2012 - BANK OF AFRICA GROUP
Opinion
In our opinion, the consolidated annual accounts give a true and fair image of the consolidatedfinancial position of BOA GROUP S.A. at 31 December 2012, and of its consolidated results for theyear ended, in accordance with legal and regulatory requirements in force in Luxembourg relatingto the preparation and presentation of consolidated annual accounts.
Paragraph of comments
Without questioning this opinion, we would draw your attention to Note 1 of the Notes to theConsolidated Annual Accounts at 31 December 2012, entitled “Consolidation Principles andAssessment Methods”, which states that the consolidated annual accounts for the year ended31 December 2012 are presented according to the recommendations of the West African MonetaryUnion (WAEMU) banking accounting plan. Since this presentation is not force in Luxembourg,we carried out a comparative study of the accounting methods and principles used to present theconsolidated annual accounts and the accounting methods and principles in force in Luxembourg.
Report on other legal and regulatory requirements
The consolidated management report, which is the responsibility of the Board of Directors, is consistentwith the consolidated annual accounts.
Luxembourg, 27 May 2013
MAZARS LUXEMBOURGAuthorized Statutory Auditor10A, rue Henri M. SchnadtL-2530 LUXEMBOURG
Laurent DECAENAuthorized Independent Auditor
on the consolidated annual accounts

84BANK OF AFRICA GROUP - Annual Report 2012
Auditors’ report on the consolidated accountsFiscal year ending 31 December 2012
We have audited the euro-denominated consolidated financial statements of the BOA GROUP S.A. companyappended to this report, including the consolidated balance sheet of 31 December 2012 with positive equityof 451,180,695 euros, with the consolidated income statement showing net income of 56,218,766 euros forthe financial year, the consolidated statement of changes in equity, as well as a summary of the mainaccounting methods used and other explanatory information.
The managers of the BANK OF AFRICA Group are responsible for the preparation and faithful presentationof these consolidated financial statements, in accordance with the accounting law provisions of theOrganisation for the Harmonisation of Business Law in Africa (OHADA) and the accounting rules andprinciples of the bank accounting principles of the West African Monetary Union (WAMU), as well asthe internal controls that it considers necessary to ensure that the consolidated financial statements arefree of material misstatements, whether resulting from fraud or error. We are required to express an opinionon these consolidated financial statements on the basis of our audit.
We have undertaken our audit on the basis of international auditing standards. These standards requirethat we comply with ethical rules and that we plan and undertake the audit in order to obtain reasonableassurance that the consolidated financial statements contain no material misstatements.
An audit is a set of procedures to gather relevant items regarding the amounts and information providedin the consolidated financial statements. The choice of procedures is at the auditor’s discretion, includingits assurance that the consolidated financial statements do not contain any material misstatements,whether due to fraud or error.
In assessing these risks, the auditor takes into consideration the entity’s internal controls of the preparationand faithful presentation of the consolidated financial statements, in order to design audit proceduresthat are suited to the circumstances, and not to express an opinion on the effectiveness of the entity’sinternal controls. An audit also includes an assessment of the appropriateness of the accounting methodsused and of the management’s accounting estimates, as well as an assessment of the presentation of allconsolidated financial statements.
We believe that the relevant items that we obtained are a sufficient and appropriate basis for our auditopinion.
In our view, the consolidated financial statements provide, in their material aspects, a faithful imageof the consolidated financial situation of the BOA GROUP S.A. as of 31 December 2012, as well asthe consolidated income of the Group’s operations for the financial year ended on this same date,in accordance with OHADA accounting law and the accounting rules and principles of the WAMU bankaccounting principles.
Abidjan, 7 March 2013
MAZARS CÔTE D’IVOIRE Armand FANDOHANPartner

85Annual Report 2012 - BANK OF AFRICA GROUP
Notes to the consolidated annual accountsFiscal year ending 31 December 2012
Note 1 - Significant accounting policies
A. SIGNIFICANT EVENTS OF 2012During the 2012 financial year, the Group deconsolidated two items, while undertaking several capitalincreases to bolster its subsidiaries’ respective equity positions. Details are provided below.
Change in the scope of consolidation During the financial year the Group sold 20,000 shares that the parent company owned in COLINA groupvia its MADAGASCAR subsidiary and undertook a merger-absorption of its EQUIPBAIL-MADAGASCARsubsidiary with BOA-MADAGASCAR. The latter operation was in a simplified form and was set up byBOA-MADAGASCAR’s acquisition of all EQUIPBAIL-MADAGASCAR shares held by the Group’s otherentities.
Capital increases realised by Group companies Several Group entities undertook capital increases during the 2012 financial year. Details on the mostimportant changes in capital structure are provided below:
• BOA GROUP during the year undertook the third tranche in a series of four capital increases meantto double its share capital. This tranche, amounting to EUR 10,086,935.00 EUR was paid in cash andresulted in the issue of 65,077 shares at EUR 580 per share. This raised the holding company’s capitalfrom EUR 60,521,920.00 to EUR 70,608,855.00 at 31 December 2012. Capital is now composedof 455,541 shares in the same class with a nominal value of EUR 155 each.
• BOA-FRANCE issued EUR 3,000,000 through cash contribution, issuing 30,000 new shares with a parvalue of EUR 100 each, thus raising its share capital from EUR 7,000,000 to EUR 10,000,000 at 31December 2012.
• BOA-UGANDA undertook a EUR 195,052 capital increase by incorporating reserves, leading to thedistribution of a total of 696,350 free shares.
• BOA-GHANA raised its capital during the 2012 financial year by EUR 6,841,046 through cashcontribution, issuing 10,000,000 new shares. Its share capital now consists of 52,560,051 sharesof the same class with a par value of EUR 0.59 each.
• The share capital of BOA-NIGER was raised to EUR 12,195,921 through incorporation of reservesin the amount of EUR 3,048,980 in the form of 200,000 shares. The total number of shares was raisedto 800,000.
• BOA-TOGO raised its capital by EUR 5,640,614, from EUR 9,604,288 to EUR 15,244,902 duringthe 2012 financial year. This cash capital increase led to the issue of 370,000 new shares, raising thetotal to 1,000,000 shares.
• BOA-MADAGASCAR undertook a cash capital increase of EUR 56,080, thus raising share capitalfrom EUR 15,211,853 to EUR 15,267,933 at 31 December 2012. For this purpose, 8,358 new shareswere issued with an issuing premium of EUR 8.39 each.

86BANK OF AFRICA GROUP - Annual Report 2012
• BOA WEST AFRICA issued EUR 61,223,464 in new shares, thus raising its share capital from EUR30,245,946 to EUR 91,469,410. This was done via cash contribution and led to the issuance of 4,015,996new shares, which raised the total to 6,000,000 shares.
• BOA-SENEGAL undertook a cash capital increase in the amount of EUR 2,286,735, thus raising itsshare capital to EUR 12,958,166 at 31 December 2012. This led to the issuance of 150,000 new shareswith a EUR 7.62 issue premium per share.
B. CONSOLIDATION PRINCIPLES The consolidated financial statements have been prepared in accordance with generally acceptedinternational accounting standards and presented in the format required for banks and financialinstitutions. In order to provide better visibility for the shareholders and given the geographic and economicpre-eminence of the Group's original entities, the presentation adopted is that laid down in the WestAfrican Monetary Union (WAMU) banking chart of accounts.
The method of full consolidation has been applied for the accounts of all subsidiaries of the Group overwhich it has exclusive control. Exclusive control is presumed to exist when the Group directly or indirectlyholds the majority of the voting rights or has effective control through the ability to appoint the majorityof the members of the administrative and management bodies. Full consolidation consists of combiningall the assets, liabilities and income statement items of the companies concerned after eliminating intergrouptransactions and gains or losses. The equity and income of consolidated companies attributable to theGroup (Group share) is shown separately from that attributable to other shareholders (minority interests).
The equity method has been applied for associated companies over which the Group has significantdirect or indirect influence. This accounting method is used for subsidiaries, except for the holdingcompanies and AFH-SERVICES, that are not banks or financial institutions or do not use the sameaccounting policies as banks and financial institutions. The equity method consists of replacing the netbook value of the shares held with the value of the Group's share in the associate's underlying net assetsafter taking account of its profit or loss for the period.
At 31 December 2012, no Group companies were proportionately consolidated.
A list of companies included the scope of consolidation at 31 December 2012 is provided in Note 2,showing the consolidation method used for each.
The income of companies acquired (or sold) during the year is included in the consolidated incomestatement as of the date of acquisition (or p until the date of disposal).
All material transactions between fully consolidated companies and all intergroup gains and losses(including dividends) are eliminated. In the event of discrepancy, the lower amount has been eliminated.
The difference upon initial consolidation of an acquired stake is the difference between the acquisitionprice and the share of the company's share capital at the closest date to acquisition. In accordance withinternational accounting recommendations, this difference is generally allocated to the appropriateconsolidated balance sheet item. Any residual positive difference in recorded under assets as"Goodwill".
Goodwill is amortised over a period of 10 years according to a plan that reflects as reasonably aspossible the assumptions made, targets set and the acquiree's expected prospects at the time ofacquisition.
If there is a subsequent change in these various factors compared with initial forecasts, an impairmentmoss may be taken against the goodwill over and above the scheduled amortisation charge.
Negative goodwill is recorded under liabilities in the consolidated balance sheet and is accounted foraccording to the method describes above.

87Annual Report 2012 - BANK OF AFRICA GROUP
C. YEAR END CLOSING OF ACCOUNTS Companies are consolidated on the basis of their separate financial statements prepared as of31 December 2012. The separate financial statements are restated where required in line with Groupaccounting policies.
D. FOREIGN CURRENCY TRANSLATION BOA GROUP S.A., AFH-SERVICES LTD, AFH-OCEAN INDIEN and BOA-FRANCE use the Euro as theiraccounting currency. The other accounting currencies used by the companies in the scope of consolidationare as follows:
- the CFA Franc (XOF),
- the Malagasy Ariary (MGA),
- the Kenyan Shilling (KES),
- the Ugandan Shilling (UGX),
- the Tanzanian Shilling (TZS),
- the Burundian Franc (BIF),
- the Congolese Franc (CDF),
- the Djiboutian Franc (DJF),
- the Ghanaian Cedi (GHS).
The consolidated balance sheet, consolidated income statements and figures provides in the notes tothe consolidated accounts are expresses in Euros.
Assets and liabilities to third parties are translated at the closing on 31 December 2012, except forequity. Equity is translated into foreign currency using the historic exchange rate. In view of the non-significant differences observed after application of the average annual rates, the profit and lossaccount was translated at the closing rate of the respective currencies on 31 December 2012.
E. FUNDS FOR GENERAL BANKING RISKS (GBR) The provisions for general banking risks are calculated separately by each Bank, in proportion to itstotal on- and off -balance sheet commitments excluding any guarantees, in accordance with the methodset out by the Group's Investment Department. Commitments to public and semi-public companies andexposure covered by cash collateral or first demand bank guarantees are not included in the basis ofcalculation.
A progressive scale is used by the Banks that calculate this provision, with a target rate of 7%.
Provisions booked in the financial statements of the Group entities are similar to reserves and areaccordingly included in the basis reserves.
F. LEASING OPERATIONS Financial leases, operating leases with purchase option and hire purchase agreements are booked inthe consolidated balance sheet on basis of the financial amount outstanding and not the amount carriedin the separate financial statements of the subsidiaries. The lease equalisation reserve is recorded underconsolidated reserves net of deferred tax.
G. INTANGIBLE ASSETSPurchased goodwill, licences, patents and leasehold rights are booked at purchase cost. Purchasedgoodwill is not amortised. Other tangible assets are amortised on a straight-line basis over theirestimated economic lives.

88BANK OF AFRICA GROUP - Annual Report 2012
H. FIXED ASSETSLand, buildings and equipment are measured at historical cost. They are depreciated on a straight-linebasis over their estimated useful lives.
I. EQUITY INVESTMENTSEquity investments include "Investments in associates" and "Equity method investments".The line item "Investments in associates" includes equity investments in non-consolidated companies.It corresponds to the purchase cost of shares in non consolidated companies, less any provisions forimpairment laid down to offset under valuation when assessing the Group share of the last known networth of investments concerned. Dividends received from non-consolidated companies are recognisedas income in the year in which they are received.
The line item "Equity method investments" corresponds to the Group share of net worth of companiesaccounted for by the equity method.
J. DEFERRED TAXDeferred taxes are recognised on all temporary differences between taxable income and accountingincome. They include the elimination of entries made in the separate financial statements in applicationof tax elections.
Deferred tax assets are only recognised if there is reasonable assurance that sufficient taxable profit willbe available in the future to utilise them.
K. RETIREMENT BENEFIT OBLIGATIONSEmployee retirement benefit obligations are determined by each subsidiary in accordance with locallegislation. Retirement benefit provisions are not discounted to present value. They are booked in theconsolidated financial statements on this basis. Previously accounted for retirement benefits for Groupcompanies that have outsourced this service to insurance companies have been incorporated in theconsolidated accounts.
Retirement benefit obligations for companies in the Group that have outsourced this service to insurancecompanies are not included in the consolidated accounts. The expense corresponding to the insurancepremium paid out is incorporated into the respective individual accounts.
L. COMPARABILITY FROM ONE YEAR TO THE NEXT The consolidated financial statements of BOA Group at 31 December 2012 have been prepared usingsimilar accounting methods to those used to prepare consolidated financial statements at 31 December2011 presented for comparison.
The consolidation method used for each subsidiary is determined not only on the basis of the Group'spercentage control but also on the criteria of "effective control".

89Annual Report 2012 - BANK OF AFRICA GROUP
Note 2 - Scope of consolidationThe subsidiaries, joint ventures and affiliated companies that came within the scope of consolidation ofBOA GROUP S.A. at 31 December 2012 are presented in the table below, showing the percentagecontrol, percentage interest and consolidation method used as compared with 31 December 2011:
31 DECEMBER 2012 31 DECEMBER 2011Consolidation Consolidation
COMPANIES % Interest % Control Method % Interest % Control MethodBOA GROUP S.A. 100,00% 100,00% Parent 100,00% 100,00% ParentAFH-OCEAN INDIEN 100,00% 100,00% FC 100,00% 100,00% FCAFH-SERVICES 100,00% 100,00% FC 100,00% 100,00% FCAGORA 63,97% 74,24% FC 60,70% 71,25% FCAGORA-MALI 63,97% 100,00% FC 60,70% 100,00% FCATTICA 75,08% 75,08% FC 50,06% 50,06% FCBOA WEST AFRICA 100,00% 100,00% FC 100,00% 100,00% FCBOA-ASSET MANAGEMENT 99,86% 99,86% FC 99,90% 99,90% FCBOA-BENIN 52,55% 53,37% FC 51,73% 52,66% FCBOA-BURKINA FASO 55,44% 56,50% FC 54,32% 56,36% FCBOA-CÔTE D'IVOIRE 69,68% 72,52% FC 66,97% 70,62% FCBOA-MADAGASCAR 41,26% 41,26% FC 41,04% 41,04% FCBOA-MALI 60,49% 61,15% FC 59,85% 61,15% FCBOA-NIGER 55,75% 57,84% FC 53,64% 57,84% FCBOA-FRANCE 51,84% 89,60% FC 46,47% 85,22% FCBOA-RDC 60,01% 60,01% FC 60,01% 60,01% FCBOA-TOGO 87,74% 99,58% FC 79,12% 99,35% FCBOA-SENEGAL 72,82% 73,91% FC 69,42% 70,54% FCBOA-MER ROUGE 59,99% 59,99% FC 59,99% 59,99% FCBOA-GHANA 89,33% 89,33% FC 86,82% 86,82% FCBOA-KENYA 46,08% 64,50% FC 45,63% 64,50% FCBOA-UGANDA 45,53% 72,49% FC 24,03% 51,22% FCBOA-TANZANIA 36,44% 49,65% FC 35,74% 49,17% FCBANQUE DE CREDIT DE BUJUMBURA (BCB) 20,25% 20,25% EM 20,25% 20,25% EMBANQUE DE L'HABITAT DU BENIN (BHB) 59,19% 73,93% FC 58,93% 73,93% FCEQUIPBAIL-MADAGASCAR 0,00% 0,00% 55,35% 88,11% FCACTIBOURSE 58,57% 88,06% FC 57,04% 87,76% FCAÏSSA SARL 57,92% 100,00% EM 56,19% 100,00% EMCOLINA MADAGASCAR 0,00% 0,00% NC 25,00% 25,00% NCSCI OLYMPE 64,30% 100,00% EM 62,49% 100,00% EMOLYMPE SA-MALI 89,52% 99,00% EM 89,36% 99,00% EM
FC: Full Consolidation - EM: Equity Method - NC: Not Consolidated
BOA-MADAGASCAR and BOA-TANZANIA are fully consolidated as the BOA GROUP exercises effectivecontrol.
EQUIPBAIL-MADAGASCAR was deconsolidated during the 2012 financial year, due to the merger withBOA-MADAGASCAR.

90BANK OF AFRICA GROUP - Annual Report 2012
Consolidated Balance Sheet Assets
CASH
INTERBANK LOANS
• DEMAND DEPOSITS
• CENTRAL BANKS
• TREASURY, POST OFFICE BANK
• OTHER CREDIT INSTITUTIONS
• TERM DEPOSITS
CUSTOMER LOANS
• PORTFOLIO OF DISCOUNTED BILLS
• SEASONAL CREDIT
• ORDINARY CREDIT
• OVERDRAFTS
• OTHER CUSTOMER CREDIT FACILITIES
• SEASONAL CREDIT
• ORDINARY CREDIT
• FACTORING
LEASING AND SIMILAR OPERATIONS
INVESTMENT SECURITIES
FINANCIAL ASSETS
FINANCIAL ASSETS AT EQUITY VALUE
INTANGIBLE ASSETS
FIXED ASSETS
SHAREHOLDERS & ASSOCIATES
OTHER ASSETS
SUNDRY ACCOUNTS
CONSOLIDATED GOODWILL
TOTAL ASSETS
Off-balance sheetCOMMITMENTS GIVEN
• CREDIT COMMITMENTS
• TO CREDIT INSTITUTIONS
• TO CUSTOMERS
• GUARANTEES GIVEN
• ON BEHALF OF CREDIT INSTITUTIONS
• ON BEHALF OF CUSTOMERS
• COMMITMENTS ON SECURITIES
Fiscal year 2012 Fiscal year 2011133,488,285 103,682,738
761,227,106 796,049,813
519,419,290 438,192,811
309,092,012 288,296,796
86,203,083 472,886
124,124,195 149,423,129
241,807,816 357,857,002
2,239,109,799 1,868,039,785
87,576,439 59,229,022
100,967
87,576,439 59,128,055
441,172,888 418,732,968
1,702,155,677 1,389,362,832
40,468,563 42,437,824
1,661,687,114 1,346,925,008
8,204,795 714,963
2,785,968 3,836,235
776,656,648 699,644,914
119,328,363 79,528,233
4,706,017 4,018,233
10,782,671 7,910,587
115,965,221 108,376,060
141,720,422 119,045,418
36,745,745 27,700,020
40,659,493 40,746,572
4,383,175,738 3,858,578,608
Fiscal year 2012 Fiscal year 2011
210,933,027 191,295,103
4,941,142 14,458,873
205,991,885 176,836,230
366,364,341 316,555,360
5,436,228 21,971,105
360,928,113 294,584,255
488,473,307 400,609,182

91Annual Report 2012 - BANK OF AFRICA GROUP
Compared for the last two fiscal years (in euros)
LiabilitiesINTERBANK LIABILITIES • DEMAND
• TREASURY, POST OFFICE BANK
• OTHER CREDIT INSTITUTIONS
• TERM DEPOSITS
CUSTOMER DEPOSITS• SAVINGS DEPOSIT ACCOUNTS
• TIME DEPOSIT ACCOUNTS
• SHORT TERM BORROWINGS
• OTHER DEMAND DEPOSITS
• OTHER TIME DEPOSIT ACCOUNTS
DEBT SECURITIES OTHER LIABILITIES SUNDRY ACCOUNTS CONSOLIDATED GOODWILLRESERVES FOR CONTINGENCIES & LOSSES STATUTORY PROVISIONSSUBORDINATED LOANS & SECURITIESINVESTMENT SUBSIDIESRESERVES FOR GENERAL BANKING RISKSEARMARKED FUNDSCAPITALSHARE PREMIUMS CONSOLIDATED RESERVES, CURRENCY TRANSLATION ADJUSTMENT, DIFFERENCE ON EQUITY ACCOUNTED INVESTMENT • GROUP• MINORITY SHAREHOLDERS
RETAINED EARNINGS (+/-)NET INCOME • GROUP• MINORITY SHAREHOLDERS
TOTAL LIABILITIES
Off-balance sheetCOMMITMENTS RECEIVED
• CREDIT COMMITMENTS
• RECEIVED FROM CREDIT INSTITUTIONS
• RECEIVED FROM CUSTOMERS
• GUARANTEES RECEIVED
• RECEIVED FROM CREDIT INSTITUTIONS
• RECEIVED FROM CUSTOMERS
• COMMITMENTS ON SECURITIES
Fiscal year 2012 Fiscal year 2011460,866,781 297,238,460
58,523,357 59,308,21619,257,963 17,644,24239,265,394 41,663,974
402,343,424 37,930,2443,225,557,295 2,894,437,674
437,221,369 373,149,67014,382,267 283,699,39118,181,749 18,617,843
1,624,217,375 1,480,035,8051,131,554,535 738,934,96534,193,363 18,974,46686,302,374 133,611,44364,928,996 46,676,29316,094,252 17,893,59313,286,108 10,377,972
19,405,929 22,290,038135,094
11,225,851 21,692,76370,608,855 60,521,920
324,352,074 275,698,189173,364,319 131,306,132150,987,755 144,392,057
56,218,766 59,165,79729,282,636 31,435,33226,936,130 27,730,465
4,383,175,738 3,858,578,608
Fiscal year 2012 Fiscal year 2011
20,251,128 30,932,857
20,251,128 30,932,857
2,208,512,154 1,804,534,959
239,886,355 205,672,587
1,968,625,799 1,598,862,372
180,847,931 92,765,747

92BANK OF AFRICA GROUP - Annual Report 2012
Consolidated Income Statement Expenses
INTEREST AND SIMILAR EXPENSES
• ON INTERBANK LIABILITIES
• ON CUSTOMER DEPOSITS
• ON DEBT SECURITIES
• OTHER INTEREST AND SIMILAR EXPENSES
EXPENSES ON LEASING AND SIMILAR OPERATIONS
COMMISSION
EXPENSES ON FINANCIAL OPERATIONS
• INVESTMENT EXPENSES
• FOREIGN EXCHANGE EXPENSES
• OFF-BALANCE-SHEET TRANSACTION EXPENSES
OTHER BANK OPERATING EXPENSES
GOODS PURCHASED
INVENTORY SOLD
CHANGES IN GOODS IN STOCK
OPERATING OVERHEADS
• PERSONNEL COSTS
• OTHER OVERHEADS
DEPRECIATION AND PROVISIONS ON FIXED ASSETS
DEFICIT ON VALUE ADJUSTMENTS TO LOANS & OFF-BALANCE-SHEET ITEMS
EXCEPTIONAL EXPENSES
LOSSES FROM PREVIOUS YEARS
SHARE OF INCOME FROM AFFILIATES ACCOUNTED FOR BY THE EQUITY
CORPORATE INCOME TAX
PROFIT
• GROUP
• MINORITY SHAREHOLDERS
TOTAL EXPENSES
Fiscal year 2012 Fiscal year 2011
134,465,239 106,124,241
19,008,923 11,153,184
111,180,865 90,304,075
976,298 1,256,960
3,299,153 3,410,022
1,820,048 2,834,450
2,487,920 2,374,635
10,754,159 17,591,601
864,806 230,415
9,428,335 16,904,388
461,018 456,798
1,377,688 5,119,410
162,840,877 140,836,725
76,902,148 70,346,584
85,938,729 70,490,141
19,896,739 18,293,039
49,821,104 30,962,467
2,626,812 2,232,853
1,594,369 2,272,437
12,591 74,317
14,254,891 14,328,014
56,218,766 59,165,797
29,282,636 31,435,332
26,936,130 27,730,465
458,171,203 402,209,986

93Annual Report 2012 - BANK OF AFRICA GROUP
Compared for the last two fiscal years (in euros)
Income
INTEREST AND SIMILAR INCOME
• ON INTERBANK LOANS
• ON CUSTOMER LOANS
• ON SECURITIES
• OTHER INTEREST AND SIMILAR INCOME
INCOME FROM LEASING AND SIMILAR OPERATIONS
COMMISSION
INCOME FROM FINANCIAL OPERATIONS
• INCOME FROM INVESTMENT SECURITIES
• DIVIDENDS AND SIMILAR INCOME
• INCOME FROM FOREIGN EXCHANGE TRANSACTIONS
• INCOME FROM OFF-BALANCE SHEET TRANSACTIONS
OTHER INCOME FROM BANKING OPERATIONS
PROFIT MARGINS
SALE OF PRODUCTS
CHANGES IN GOODS IN STOCK
GENERAL OPERATING INCOME
WRITE-BACK OF DEPRECIATION AND PROVISIONS ON FIXED ASSETS
SURPLUS ON CORRECTIONS TO VALUE OF LOANS AND OFF-BALANCE SHEET ITEMS
EXCEPTIONAL INCOME
INCOME FROM PREVIOUS YEARS
SHARE OF INCOME FROM AFFILIATES ACCOUNTED FOR BY THE EQUITY
LOSS
TOTAL INCOME
Fiscal year 2012 Fiscal year 2011
286,570,034 234,705,535
20,809,991 19,669,182
247,123,919 192,241,406
16,410,801 20,633,981
2,225,323 2,160,966
2,000,876 1,874,887
53,596,455 49,248,499
92,596,417 94,886,557
41,838,172 28,203,170
11,928,947 23,191,645
28,372,065 34,410,240
10,457,233 9,081,502
7,130,215 5,269,429
244,880
9,802,638 10,597,247
564,832 722,970
2,411,496 2,433,265
1,949,876 1,157,041
1,548,364 1,069,676
458,171,203 402,209,986

94BANK OF AFRICA GROUP - Annual Report 2012
Consolidated Income Statement Compared for the last two fiscal years (in euros)
Income & ExpensesINTEREST AND SIMILAR INCOME• ON INTERBANK LOANS
• ON CUSTOMER LOANS
• ON SECURITIES
• OTHER INTEREST AND SIMILAR INCOME
INCOME FROM LEASING AND SIMILAR OPERATIONS INTEREST AND SIMILAR EXPENSES• ON INTERBANK LIABILITIES
• ON CUSTOMER DEPOSITS
• ON DEBT SECURITIES
• OTHER INTEREST AND SIMILAR EXPENSES
EXPENSES ON LEASING AND SIMILAR OPERATIONSINTEREST MARGIN• COMMISSION INCOME
• COMMISSION EXPENSES
NET RESULT FROM COMMISSION NET RESULTS FROM:• INVESTMENT SECURITIES TRANSACTIONS
• DIVIDENDS AND SIMILAR TRANSACTIONS
• FOREIGN EXCHANGE TRANSACTIONS
• OFF-BALANCE-SHEET TRANSACTIONS
NET INCOME FROM FINANCIAL OPERATIONS OTHER INCOME FROM BANKING OPERATIONS OTHER BANK OPERATING EXPENSES OTHER INCOME FROM NON-BANKING OPERATIONS OPERATING OVERHEADS• PERSONNEL COSTS
• OTHER OVERHEADS
DEPRECIATION & AMORTIZATION AND PROVISIONS ON FIXED ASSETSWRITE-BACK OF DEPRECIATION AND PROVISIONS ON FIXED ASSETSGROSS OPERATING PROFITNET INCOME FROM VALUE ADJUSTMENTS EXCESS OF PROVISIONING & WRITE-BACK OF FUNDS FOR GENERAL BANKING RISKSPRE-TAX OPERATING INCOME EXTRAORDINARY ITEMSRESULT FROM PREVIOUS FINANCIAL PERIODS CORPORATE INCOME TAXSHARE OF INCOME FROM AFFILIATES ACCOUNTED FOR BY THE EQUITY METHOD NET INCOME FOR THIS FINANCIAL PERIOD• GROUP• MINORITY SHAREHOLDERS
CONSOLIDATED NET INCOME
Fiscal year 2012 Fiscal year 2011286,570,034 234,705,535
20,809,991 19,669,182247,123,919 192,241,40616,410,801 20,633,9812,225,323 2,160,966
2,000,876 1,874,887-134,465,239 -106,124,241
-19,008,923 -11,153,184-111,180,865 -90,304,075
-976,298 -1,256,960-3,299,153 -3,410,022
-1,820,048 -2,834,450152,285,623 127,621,731
53,596,455 49,248,499-2,487,920 -2,374,635
51,108,535 46,873,864
40,973,366 27,972,75511,928,947 23,191,64518,943,730 17,505,8529,996,215 8,624,704
81,842,258 77,294,9567,130,215 5,269,429-1,377,688 -5,119,4109,802,638 10,842,127
-162,840,877 -140,836,725-76,902,148 -70,346,584-85,938,729 -70,490,141
-19,896,739 -18,293,039564,832 722,970
118,618,797 104,375,903-49,821,104 -30,962,467
68,797,693 73,413,436-215,316 200,412355,507 -1,115,396
-14,254,891 -14,328,0141,535,773 995,359
29,282,636 31,435,33226,936,130 27,730,465
56,218,766 59,165,797

95Annual Report 2012 - BANK OF AFRICA GROUP
Personal notes

Personal notes
96BANK OF AFRICA GROUP - Annual Report 2012

97Annual Report 2012 - BANK OF AFRICA GROUP
Personal notes

7/20
13 -
RC : 20
01 B 211
- TA
M TA
M TEAM
- Co
ver:
© M
W DD
B
ACTIBOURSEBoulevard de France - 08 BP 0879 - Cotonou - Bénin Phone: (229) 21 31 53 43 - Fax: (229) 21 31 78 00 E-mail: <[email protected]>
AGORAAngle Av. Terrasson de Fougères et Rue Gourgas 01 BP 4132 - Abidjan 01 - Côte d’Ivoire
ATTICAAngle Av. Terrasson de Fougères et Rue Gourgas 01 BP 4132 - Abidjan 01 - Côte d’Ivoire
BOA-ASSET MANAGEMENTAngle Av. Terrasson de Fougères et Rue Gourgas 01 BP 4132 - Abidjan 01 - Côte d’Ivoire Phone: (225) 20 30 34 00 - Fax: (225) 20 30 34 01 E-mail: <[email protected]>
BOA-FRANCE12, rue de la Paix - 75002 Paris - France Phone: (33) 1 42 96 11 40Fax: (33) 1 42 96 11 68E-mail: <[email protected]> www.boafrance.com
GROUPE BANK OF AFRICA12, rue de la Paix - 75002 Paris - France Phone: (33) 1 42 96 11 40 - Fax: (33) 1 42 96 11 68 - Mobile : (33) 6 84 33 79 39E-mail: <[email protected]>
GROUP SUBSIDIARIES
REPRESENTATIVE OFFICE IN PARIS
NETWORK BANKS
BOA-BENIN Avenue Jean-Paul II - 08 BP 0879 - Cotonou - Benin Phone: (229) 21 31 32 28 - Fax: (229) 21 31 31 17 E-mail: <[email protected]> www.boabenin.com
BOA-BURKINA FASO 770, Av. du Président Aboubakar Sangoulé Lamizana01 BP 1319 - Ouagadougou 01 - Burkina Faso Phone: (226) 50 30 88 70 to 73Fax: (226) 50 30 88 74 E-mail: <[email protected]> www.boaburkinafaso.com
BOA-CÔTE D’IVOIRE Abidjan Plateau, Angle Av. Terrasson de Fougères et Rue Gourgas - 01 BP 4132 - Abidjan 01 Côte d’Ivoire Phone: (225) 20 30 34 00 - Fax: (225) 20 30 34 01 E-mail: <[email protected]> www.boacoteivoire.com
BOA-GHANAC131/3, Farrar Avenue - Adabraka - P.O. Box C1541 Cantonments - Accra - Ghana Phone: (233) 302 24 9690Fax: (233) 302 24 9697 E-mail: <[email protected]>www.boaghana.com
BOA-KENYA Reinsurance Plaza - Taifa Road - P.O. Box 69562 00400 - Nairobi - Kenya Phone: (254) 20 327 50 00 / 221 11 75 Fax: (254) 20 221 41 66 E-mail: <[email protected]> www.boakenya.com
BOA-MADAGASCAR 2, place de l’Indépendance BP 183 - Antananarivo 101 - Madagascar Phone: (261) 20 22 391 00 - Fax: (261) 20 22 294 08 E-mail: <[email protected]> www.boa.mg
BOA-MALI 418, Avenue de la Marne - BP 2249 - Bozola Bamako - Mali Phone: (223) 20 70 05 00 - Fax: (223) 20 70 05 60 E-mail: <[email protected]> www.boamali.com
BOA-MER ROUGE10, place Lagarde - BP 88 - Djibouti République de DjiboutiPhone: (253) 21 35 30 16 - Fax: (253) 21 35 16 38 E-mail: <[email protected]>
BOA-NIGER Immeuble BANK OF AFRICA - NIGER Rue du Gawèye - BP 10973 - Niamey - Niger Phone: (227) 20 73 36 20 / 21 / 20 73 32 46 Fax: (227) 20 73 38 18 E-mail: <[email protected]> www.boaniger.com
BOA-RDC 22, Avenue des Aviateurs - BP 7119 Kin1Kinshasa-GombeRépublique Démocratique du Congo Phone: (243) 99 300 46 00 E-mail: <[email protected]>
BOA-SENEGAL Résidence Excellence - 4, Av. Léopold Sédar Senghor BP 1992 RP - Dakar - Senegal Phone: (221) 33 849 62 40 - Fax: (221) 33 842 16 67 E-mail: <[email protected]> www.boasenegal.com
BOA-TANZANIA NDC Development House, Ohio Street / Kivukoni FrontP.O. Box 3054 - Dar es Salaam - Tanzania Phone: (255) 22 211 01 04 / 211 12 90 Fax: (255) 22 211 37 40 Mobile : (255) 754 885 538 / 787 933 335E-mail: <[email protected]> www.boatanzania.com
BOA-TOGO Boulevard de la République - BP 229 - Lomé - TogoPhone: (228) 22 53 62 62E-mail: <[email protected]>
BOA-UGANDABANK OF AFRICA House - Plot 45, Jinja Road P.O. Box 2750 - Kampala - Uganda Phone: (256) 414 302001 - Fax: (256) 414 230902 E-mail: <[email protected]> www.boa-uganda.com
BANQUE DE CREDIT DE BUJUMBURA(BCB) Mairie de Bujumbura - Boulevard Patrice Lumumba BP 300 - Bujumbura - Burundi Phone: (257) 22 20 11 11 - Fax: (257) 22 20 11 15 E-mail: <[email protected]> www.bcb.bi
BANQUE DE L’HABITAT DU BENIN(BHB)Boulevard de France - 01 BP 6555 - Cotonou - Benin Phone: (229) 21 31 24 25 - Fax: (229) 21 31 24 60 E-mail: <[email protected]>www.bhb.bj
BANK OF AFRICA GROUP
www.bank-of-africa.net