Embed Size (px)
Citation preview

Capital Intelligence, Oasis Complex, Block E, Gladstone Street, P.O. Box 53585, CY 3303 Limassol, Cyprus, Telephone: 357 25 342300, Facsimile: 357 25 817750 E-mail: [email protected]. Web site: http://www.ciratings.com
Bank of Sharjah
July 2010

Rating Report
Bank of Sharjah
United Arab Emirates
July 2010
Capital Intelligence Ltd Oasis Complex, Block E, Gladstone Street PO Box 53585 CY 3303 Limassol Cyprus Telephone: 357 2534 2300 Facsimile: 357 2581 7750 E-mail: [email protected] Web site: http://www.ciratings.com A Capital Intelligence rating is not a recommendation to purchase, sell, or hold a security of the institution, inasmuch as it does not comment as to market price or suitability for a particular investor.
Reproducing or distributing this publication without the publisher’s consent is prohibited. Information has been obtained by Capital Intelligence from sources believed to be reliable. However, because of the possibility of human or mechanical error by our source, Capital Intelligence, or others, Capital Intelligence does not guarantee the accuracy, adequacy or completeness of any information and is not responsible for any error or omissions or for the results obtained from use of such information. Copyright © Capital Intelligence Limited 2010
Contact:
Karti Inamdar Tel: 91 124 239 2142 E-mail: [email protected]
Tom Kenzik Tel: 357 2534 2300 E-mail: [email protected]

1
Ref: AE00609BNK00-1
BANK OF SHARJAH Sharjah, United Arab Emirates
July 2010
RATINGS Current Last Changed From Date Sovereign Long-Term: AA- A+ May 07 Short-Term: A1+ A1 May 07 Outlook Stable - - Foreign Currency Long-Term: A- BBB+ Jul 08 Short-Term: A2 A3 Jun 06 Financial Strength BBB+ BBB Jun 06 Support 2 3 Jul 08 Outlook Foreign Currency Stable Positive Jul 08 Financial Strength Stable - -
FINANCIAL HIGHLIGHTS USD (mn) 2009 2009 2008 2007 AED (mn) USD AED AED AED Total Assets 4,807 17,655 15,282 10,348 Net Loans 3,118 11,450 10,340 5,312 Total Deposits* 3,635 13,351 10,528 6,671 Total Capital 1,116 4,097 3,843 2,298 Gross Income 205 751 694 479 Net Income 129 475 410 404 Exchange Rate: USD/AED 3.6725 3.6725 3.6725 *Customer + Interbank % 2009 2008 2007 NPL / Gross Loans 1.64 1.74 0.84 Loan-Loss Reserves / NPLs 142.89 100.10 106.66 Capital Adequacy Ratio 23.29 21.81 27.74 Net Loans / Stable Funds 71.92 71.75 54.52 Interest Differential 3.72 3.22 2.50 Cost / Income 23.75 18.25 18.03 ROAA 2.89 3.20 4.50
RATINGS DRIVERS Supporting the Rating • Solid capital adequacy ratio (CAR) • Strong profitability, although ROAA has fallen over the last three years • Low level of non-performing loans (NPLs); good NPL coverage ratio • High level of short-term loans and low maturity mismatches • Support from the federal government and the central bank Constraining the Rating • Exposure to Lebanese risk, which however is rated low • Customer concentrations in loans • Uncertainties in many domestic sectors, although modest growth has been forecast for UAE’s GDP
RATING RATIONALE Bank of Sharjah (BOS) was able to endure the economic downturn largely unscathed owing to its conservative policies and good credit judgement. The Bank’s business model focuses on lending to medium-sized and large companies in the country. BOS has a deep understanding of its biggest customers and their markets and many of its customers have very long-standing relationships with the Bank. This has been a significant factor contributing to its historically low NPLs to gross loans ratio. BOS has no exposure to two major Saudi-based conglomerates that defaulted in 2009 nor does it have any significant retail banking delinquencies since its consumer book is very small. The Bank also largely stayed away from the real estate market in the UAE, partly because of the growing speculative activities in some segments of the market. Its principal activity continues to be providing short-term working capital finance to companies in Sharjah, Dubai and Abu Dhabi. The Bank’s Lebanese subsidiary has a business model similar to that of BOS; the subsidiary performed reasonably well last year and is expected to grow in line with the expansion of the local economy. The Bank has delivered strong profitability ratios over the years. However, ROAA declined following a new acquisition in 2008. In addition, increased general provisions and reduced non-interest revenues, reflecting lower trade finance and other activities in the country, contributed to the fall. Still,
2
the Bank’s key ratios continued to be strong and were well above the industry average due to the Bank’s wide interest spreads and low operating cost base. Q1 2010 results were good, although operating profitability declined. Asset quality ratios strengthened at end 2009 with the NPLs to gross loans ratio declining over the end 2008 level and the NPL provision coverage ratio rising substantially owing to higher general provisions. Key asset quality ratios weakened slightly in Q1 2010, but NPLs remained low and were fully covered by provisions. Moreover, BOS did not have any restructured loans in its performing portfolio. The Bank’s good provisioning, high capital base and strong profitability are expected to cushion the impact of a possible further rise in bad debts this year. Historically, BOS’s liquidity ratios have been strong, underscoring management’s commitment to ensuring a liquid balance sheet at all times. Key ratios tightened after the financial crisis but were still at acceptable levels. The Bank’s low asset/liability maturity mismatch position is a mitigating factor here. The capital adequacy ratio was solid at end 2009 and at end March 2010. The Bank’s Foreign Currency ratings are affirmed at A- long-term and A2 short-term with a Stable Outlook and a Support rating of 2, reflecting its government ownership, the availability of federal government support and the Bank’s overall good financials. The Financial Strength rating, which is affirmed at BBB+, is underpinned by the Bank’s good management, strong capital adequacy, sound asset quality and good profitability. The Bank’s exposure to low-rated risk overseas through its subsidiary and the ongoing uncertainties in the domestic market are constraining factors. A Stable Outlook is assigned to the Financial Strength rating in view of the Bank’s good Q1 results. BANK HISTORY AND STRATEGIES Bank Ownership and History Bank History Bank of Sharjah (BOS) was incorporated in 1973 as the emirate of Sharjah’s first bank. It was founded by the Government of Sharjah and Banque Paribas (now BNP Paribas). The latter divested its holdings in 2002, but two former representatives remain on the board as independent members. The principal shareholders currently are the government of Sharjah and members of the ruling family. The Ruler of Sharjah is the honorary chairman. The combined shareholding of the government of Sharjah and members of the ruling families was 30% at end-March 2010. Bank Profile and Current Business Model
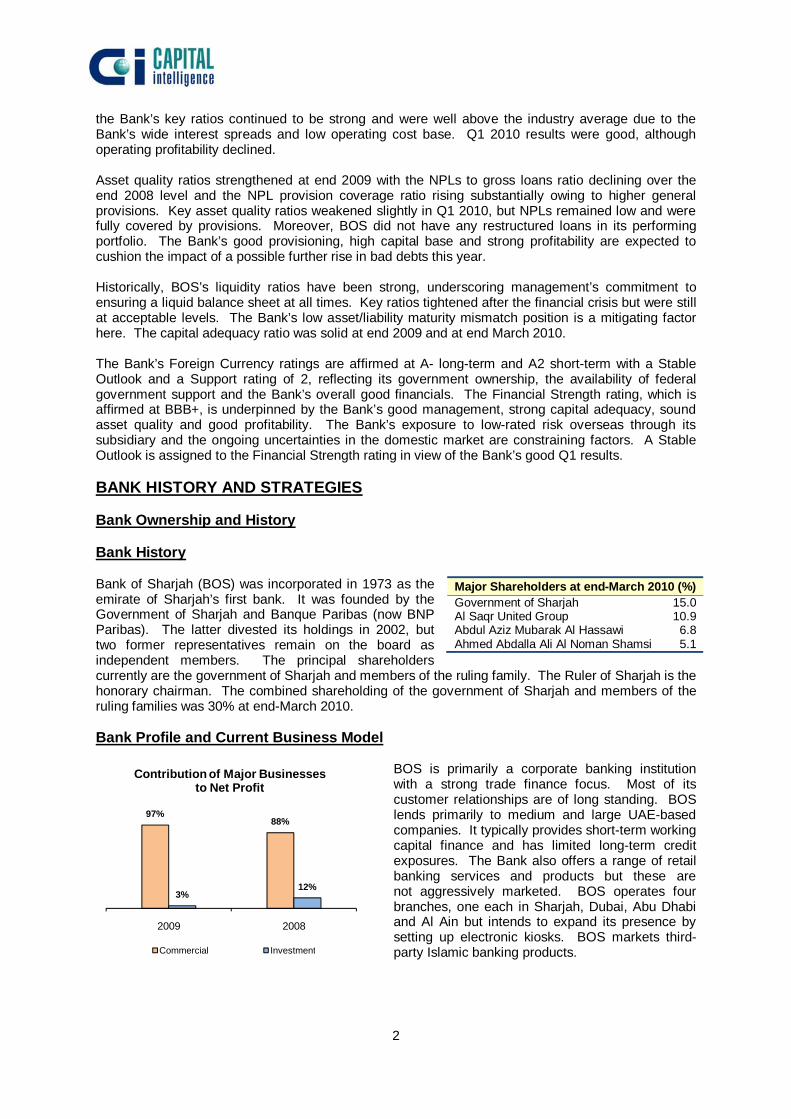
BOS is primarily a corporate banking institution with a strong trade finance focus. Most of its customer relationships are of long standing. BOS lends primarily to medium and large UAE-based companies. It typically provides short-term working capital finance and has limited long-term credit exposures. The Bank also offers a range of retail banking services and products but these are not aggressively marketed. BOS operates four branches, one each in Sharjah, Dubai, Abu Dhabi and Al Ain but intends to expand its presence by setting up electronic kiosks. BOS markets third-party Islamic banking products.
Major Shareholders at end-March 2010 (%) Government of Sharjah 15.0 Al Saqr United Group 10.9 Abdul Aziz Mubarak Al Hassawi 6.8 Ahmed Abdalla Ali Al Noman Shamsi 5.1
97%88%
3%12%
2009 2008
Contribution of Major Businesses to Net Profit
Commercial Investment
3
The Bank has participated in new projects as both banker and investor, but has largely stayed away from the real estate sector during the boom years, preferring to watch and wait for the market to mature. It is authorised by the Dubai Land Department to operate escrow accounts for registered property developers. Emirates Lebanon Bank SAL The Bank acquired the operations of BNPI Lebanon (a subsidiary of BNP Paribas) in September 2008 and renamed it Emirates Lebanon Bank (ELBank). BOS has an 81% stake in ELBank, while BNP Paribas holds 19% of the new entity’s shares. BOS intends to hold only 51% of shares and the remainder will be sold to business associates. The Lebanese bank is small, with total assets of the equivalent of USD1.13 billion (AED4.15 billion) at end 2009. However, the total assets of the subsidiary represented a reasonably high 23.5% of the Bank’s consolidated balance sheet at end 2009. ELBank’s total assets rose by 16.2% in 2009 primarily due to a sizeable increase in its holdings of domestic government securities, which amounted to a fifth of total assets at end 2009. The bank earned a net profit of the equivalent of USD10.8mn in 2009 – this represented a return on assets of 1.03%, reflecting the high level of low-yielding assets, mainly domestic government securities and liquid assets, on the balance sheet (49% at end 2009). ELBank possesses many characteristics that are similar to those of BOS. It has five branches, 204 staff, a good corporate banking franchise and strong private banking capabilities. BOS intends to leverage its presence in Lebanon to expand in the Levant region over the medium term. Management The quality of management is good. The longstanding top management team has deep knowledge of the regions it operates in. The Bank is closely managed. Staffing levels are lean, reflecting the Bank’s corporate banking focus – total staff strength was 225 at end 2009. The risk management area was strengthened in recent years with the appointment of a new head of risk, a credit risk manager and two analysts. Credit administration is centralised and reports to the head of risk. Principal Business Strategies The Bank’s principal business strategies have not changed. It continues to exercise considerable caution. The credit and investment portfolios are closely monitored. Transactions are being selectively financed, with the needs of the Bank’s strongest corporate relationships taking priority over others. Maintaining a comfortable level of liquidity is a major objective. Deposit-gathering activities are being strengthened with the establishment of new electronic outlets in the major emirates and the development of more retail banking products. There are plans to open a new branch in Dubai as well as private banking offices. The Bank is close to establishing a new private banking and wealth management business in collaboration with a major international bank. Long-term goals focus on developing private and investment banking functions and on acquiring direct investments in prime companies, strong potential SMEs and new ventures. BOS intends to further develop its retail banking capabilities, although the objective is not to become a retail banking player or to cater to the mass market. The retail banking strategies are still essentially defensive in nature. The establishment of an Islamic banking division within the Bank is also a medium-term goal. The Bank’s acquisition of BNP’s operations in Lebanon is a first step towards geographical diversification. While the Lebanese subsidiary is expected to grow by servicing the fairly significant UAE-Lebanon business activities that currently exist, BOS intends to use its Lebanese franchise to expand in the Levant region. Its long-term vision is to transform itself into a large financial institution in the region with a diversified business base. It clearly aims to stay primarily within the corporate banking segment but intends to spread its exposure over multiple locations, mainly in the Middle East.
4
SIGNIFICANT RECENT DEVELOPMENTS IN THE FINANCIAL SECTOR UAE’s GDP declined in 2009 According to IMF estimates, UAE’s real GDP contracted by 0.7% in 2009 after expanding by 5.1% in the previous year. This was due to a 6.3% fall in the oil sector GDP (as against a 1.6% rise in 2008) and a much slower rise in the non-oil sector GDP (1%) compared to the previous year (6.3%). Since September 2008, the sharp slowdown in construction and real estate activities across all the emirates (although to a lesser degree in Abu Dhabi) contributed to the much slower non-oil sector expansion in 2009. According to IMF estimates Abu Dhabi’s GDP declined by 0.1% in 2009, with the decline in the emirate’s oil sector GDP (6.3%) offset by the growth in its non-oil sector GDP (6.3%). Total output of Dubai and the northern Emirates shrank by 1.3% in 2009 reflecting the decline in global trade and tourism as well as weak real estate markets. A modest upturn in GDP growth is projected for 2010 The IMF has projected a 1% increase in the country’s GDP in 2010 on the back of a 3% growth in oil sector GDP reflecting rising energy prices over the last 12 months. Non-oil sector GDP is expected to remain flat with a slight contraction in Dubai’s GDP offset by a modest increase in Abu Dhabi’s non-oil sector output. UAE’s GDP growth rate is expected to rise to 3% in 2011 and 4% in 2012 provided uncertainties concerning Dubai’s real estate and construction sectors1 are addressed quickly and the Abu Dhabi government increases its spending. The IMF also believes that a “speedy, orderly, co-operative and predictable” restructuring of Dubai World (DW) followed by the operational restructuring of other Dubai government real estate entities coupled with increased transparency of economic and financial data is critical to delivering sustainable growth after 2010 for Dubai. DW’s debt restructuring announcement The Dubai government’s surprise announcement seeking a standstill of DW’s USD23.5 billion debt until May 2011 has dented its reputation as a reliable counterparty. For the first time the government made a clear distinction between what it considers as obligations pertaining to government entities and those like DW that are regarded as related parties. The Dubai government’s assistance for related parties was implied but not certain and ‘timely’ support could no longer be taken for granted The total debt of Dubai Holdings (DH), DW and Investment Corporation Dubai (ICD) (the three holding companies owned either jointly or severally by Sheikh Mohammed, the ruler of Dubai, and the government of Dubai) was estimated by the IMF at USD85 billion. In addition, the government of Dubai has outstanding obligations of around USD24 billion. The total debt2 of the Dubai government and related parties represented a substantial 130% of Dubai’s 2009 GDP. Abu Dhabi’s support for Dubai cannot be considered axiomatic It is now clear that Abu Dhabi’s support for Dubai-government controlled entities is not self-evident. The IMF report quotes Abu Dhabi as stating that they “did not want to create moral hazard by supporting potentially non-viable corporations, but would provide support if necessary to limit contagion to the UAE economy and banking system”. Nevertheless, substantial support from Abu Dhabi was forthcoming when needed The government of Abu Dhabi has provided indirect support to Dubai since the global financial crisis began in September 2008. The UAE central bank subscribed to USD10 billion of long-term debt issued by the government of Dubai in Q1 2009. In November 2009, the government of Dubai announced that it had commitments from two Abu Dhabi government owned banks, Al Hilal Bank and
1 The Dubai government borrowed heavily between 2004 and 2008 from local and foreign banks to fund its real estate projects and the development of infrastructure. Its borrowings had short-term maturities while cash flows from its various projects accrued only over the long-term. When the financial crisis began in Q4 2008 Dubai was exposed to significant maturity mismatch risks eventually leading to its asking for a standstill agreement for DW’s debts.
2 The IMF states that this excludes information that is not in the public domain such as syndicated loans for which documentation is incomplete, bilateral loans, accounts payable, suppliers credit, as well as derivatives, commitments and other liabilities.

5
the National Bank of Abu Dhabi, to lend USD5 billion. To date, USD500mn has been drawn from each bank. Some details of the DW restructuring On 20 May 2010 the government of Dubai announced that DW had reached an agreement on the terms of restructuring with its major creditors, which hold roughly 60% of the total debt owed to banks. The outstanding bank debt of USD14.4 billion is denominated in both local and foreign currencies and consists of syndicated loans, bilateral loans and bonds. Creditor banks will be paid 100% of the principal through the issuance of two tranches of new debt. DW intends to repay USD4.4 billion over five years and USD10 billion over eight years. The Dubai government will convert its USD9 billion loan to DW into equity. According to press reports, creditors have been offered a 1% interest payment in cash and an additional payment at rates varying from 1.5% to 2.5% on maturity. Since DW’s creditors had extended loans primarily on an unsecured basis, they have little option but to accept the restructuring terms offered by DW. Nakheel has offered 100% payment of principal and accrued interest or profits to its bank creditors through an extension of maturity. Nakheel’s creditor banks had lent primarily on a secured basis. Dubai’s government-owned and government-related entities make a significant contribution to the emirate’s GDP Economic growth in the emirate over the last several years has been led by the significant expansion of these companies. Dubai’s future is therefore inextricably linked to the improvement in the financials of these government related entities. But Dubai’s eventual recovery will depend not only on the successful restructuring of DW but also on the orderly unwinding of the debts of its other property related companies as well as on perceived improvements in financial disclosures of its many companies. In the future these companies will have to rely on the strength of their financials rather than on implicit government support to raise funds. The supply overhang in the commercial and residential properties market is likely to rise by mid 2010 before falling again. Further growth in the real estate sector is not likely to take place until and unless most of the unsold housing and commercial units are absorbed. The Dubai government’s current focus is on expanding the emirate’s non-real estate sectors such as trade, tourism and logistics where it has already developed very strong infrastructure. Recent increases in global trade and higher demand from rapidly expanding economies in Asia could augur well for the economy of Dubai. The DW restructuring is likely to set the tone for a possible restructuring of debt owed by other Dubai government entities in the near future This will eventually permit other Dubai entities to raise funds from the bond market. In fact, Dubai’s future growth could largely depend on this. A strong beginning was made in April 2010 with a successful USD1 billion bond issuance by the Dubai Water and Electricity Authority, a strong credit with a good financial track record. However, the bond was issued at an expensive 8.5%. UAE’s future economic growth is dependent on high levels of spending by the government of Abu Dhabi The emirate of Abu Dhabi has expanded substantially over the last few years owing to large investments made in infrastructure and the real estate, tourism, hospitality and manufacturing sectors. The Abu Dhabi government is supporting its ongoing projects in all the sectors although many private sector funded projects have been delayed or abandoned. Three reclaimed islands off the coast of Abu Dhabi are being developed for commercial and residential purposes and for leisure activities. Massive construction projects have begun in several locations onshore including a USD22 billion ‘green’ city. A Formula 1 race track was finished in 2009 and museums are being built in collaboration with the Louvre and Guggenheim. The emirate has plans to develop projects worth USD180 billion over the next five years. Funding is not a significant constraint for the government of Abu Dhabi and its entities, several of which have successfully raised medium-term funding over the last 12 to 18 months. The UAE central bank and the federal government have provided substantial support to the banking sector The central bank stepped in with a AED50 billion line of credit for banks when the liquidity crisis began in September 2008. In November 2009, when local and international markets

6
reacted adversely to the announcement of DW’s debt standstill, the central bank announced once again that it stood behind UAE banks and branches of foreign banks operating in the country and made available a special liquidity facility linked to the banks’ current accounts with the central bank. The federal government disbursed AED50 billion of deposits to local banks in Q4 2008, of which a large portion was converted into Tier 2 debt. In addition, in September 2008 the government announced that it has guaranteed all customer and interbank deposits for a period of three years although there is no official communication regarding this from the UAE central bank. Central bank tightens prudential norms measures Banks are required to raise their total capital adequacy ratio (CAR) to 12% by mid-2010 (Tier 1 minimum at 8%). The average capital adequacy ratio of UAE banks rose to 20.3% at end March 2010 from 13.3% at end 2008. All banks had implemented the Basel II framework at end 2009. The central bank has also proposed that all banks classify loans over 90 days past due as non-performing. Although many banks have moved to the 90 days norm, a few large banks continue to use 180 days. The central bank is also examining the possibility of increasing general provisions of banks. One proposal that is still being debated by the banking sector is to raise general provisions to 1.25% of total risk weighted assets. NPLs have increased across the banking sector. The average NPLs to gross loans ratio of local banks rose to 4.25% at end 2009 from 2.07% at end 2008, while the NPL provision coverage ratio fell to 92% from 105%. KEY FINANCIAL ISSUES The 2009 accounts were audited by Deloitte in accordance with International Standards on Auditing. The financial statements were prepared in accordance with International Financial Reporting Standards (IFRS) and the requirements under UAE law. The auditor’s report was unqualified. The financial statements include the accounts of its subsidiary in Lebanon (Emirates Lebanon Bank SAL), three very small domestic subsidiaries (handling brokerage activities, real estate services and investment of own funds) and two UAE-based companies that were acquired in the settlement of NPLs. Note: ELBank’s financials were consolidated with BOS’s in 2008, however, only the Q4 2008 earnings of ELBank were included in the consolidated profit and loss statement. Therefore, the 2009 and 2008 profitability ratios are not strictly comparable.
Very profitable bank, although key profitability ratios have declined over the last four years The Bank’s ROAA has been significantly above the industry average3 for several years (see Chart 1). However, in recent years, ROAA has declined due to:
• Higher collective provision charges • Investment-related losses • Consolidation with ELBank’s financials
Nevertheless, the Bank’s net profit has been high, reflecting good net interest income and a low operating cost base.
Net profit rose by 16% to AED475mn in 2009 primarily because of strong growth in net interest income and no permanent impairment provisions on investments, unlike in the previous year when the Bank had incurred an AED98.4mn charge. However, the net impairment charge for loans increased by 54.1% to AED90mn in 2009 due to sizeable collective and specific provisions made during the year. As of end 2009, BOS had met the UAE central bank’s proposed general impairment provision
3 Industry averages are based on the financials of the 18 largest domestic banks in the UAE that collectively accounted for 81% of total banking assets at end 2009.
320 404 410 475
4.79%4.50%
3.20% 2.89%
2.73% 2.50%1.77% 1.47%
-0.5%
1.0%
2.5%
4.0%
5.5%
7.0%
0
100
200
300
400
500
2006 2007 2008 2009
AEDmn
Chart 1: Profitability
Net profit ROAA - BOS ROAA - Industry avg

7
requirement. The total provision charge to average total assets ratio declined to 0.55% in 2009 from 1.23% in 2008. High operating profitability Due to the impact of investment-related gains and losses, the Bank’s operating profit has fluctuated from year to year. Operating profit rose only marginally to AED573mn in 2009, after growing by a substantial 44.6% in 2008. This was due to lower investment-related income in 2009, as a result of which gross income rose by a modest 8.2%, while operating costs rose by 40.9%. Although the Bank’s operating profit on average total assets ratio declined to 3.48% in 2009 from 4.43% in 2008, the ratio was well above the industry average of 2.84%. Operating costs have increased, but the cost to income ratio remained low The Bank’s operating cost base rose by 40.9% in 2009 to AED178mn largely due to the consolidation of ELBank. In 2008, the consolidated profit and loss statement included ELBank’s costs for only one quarter. Around three-quarters of the year-on-year increase in operating costs in 2009 was related to ELBank. Although the cost to income ratio rose to 23.75% from 18.25% in 2008, the ratio is still very low. It was also well below the industry average of 32.05%. BOS’s small branch network and its relatively small retail banking business have contributed to its low cost to income ratio. Strong growth in net interest income, wide interest differential The Bank’s net interest income grew by 50.3% to AED565mn in 2009 partly due to the consolidation of ELBank and partly due to a wider interest differential. The Bank’s interest differential was above the industry average, as in the previous year (see Chart 2). Like other banks in the country, BOS repriced its loans last year; however, spreads could narrow this year and indeed the first indication of this was seen in the Q1 2010 results, which showed a fall in the net interest to average total assets ratio to 3.09% (annualised) from 3.43% in 2009. The Bank’s average funding cost increased to 3.4% in 2009 from 2.44% in the previous year, partly reflecting the consolidation of ELBank, which had a higher funding cost than BOS. The Bank’s average yield on interest-bearing assets rose by 146 basis points to 7.12%, while the banking sector average declined by 7 basis points to 5.83%.
Lower investment earnings and miscellaneous income led to a sharp decline in non-interest income in 2009 (see Table 1) The principal reason for the decline in non-interest income was significantly reduced gains from the sale of investments in 2009 (AED1mn) compared to the previous year (AED215mn). Dividend income fell to AED6mn from AED35mn in 2008 and the Bank incurred a mark-to-market loss of AED12mn on investment property valued at AED185mn at end 2009. Moreover, 2008 revenues were lifted by
one-off income from real estate brokerage and commissions. Profits from foreign exchange trading also fell last year, reflecting reduced corporate banking activities, but fees and commissions rose by 4.2% and there was a net gain from investment valuation (AED30mn) as against a net loss in 2008 (AED135mn). The Bank’s non-interest revenues to average total assets ratio was over 2% in 2006, 2007 and 2008. However, the ratio fell to 1.13% in 2009.
Table 1: Non-Interest Income (AEDmn) 2009 2008 %∆ Fees, Commissions 122 117 4.2 Foreign exchange 23 34 -32.1 Securities Income 40 80 -50.6 Investment Property Valuation -12 - - Dividends 6 35 -82.7 Miscellaneous Income 7 52 -85.6 Total Non-Interest Income 186 318 -41.6 Non-Interest Income/Average Total Assets (%) BOS 1.13 2.48 - Industry Average 1.55 1.54 -
171 233 376 565
1.93%
2.50%
3.22%
3.72%
2.38%2.68%
3.00% 3.07%
0%
1%
2%
3%
4%
0
100
200
300
400
500
600
2006 2007 2008 2009
AEDmn
Chart 2: Interest Differential and Net Interest Income
Net Int. Inc Int. Diff. - BOS Int. Diff. - Ind. Avg.

8
BALANCE SHEET Medium-sized investment portfolio Total investments increased by 37.8% in 2009 due to higher investments in government securities by ELBank (see Table 2). Investments represented 9.3% of total assets at end 2009, and 84% of the portfolio was classified as available-for-sale (AFS).
Direct equity investments in Table 2 comprised strategic stakes in two UAE companies (Dana Gas and Oger Telecom). Dana Gas is a natural gas company based in Sharjah which is investing in upstream and downstream projects in the Middle East and the UAE. The Bank’s strategic investment in Dana Gas enables it to participate in several financing opportunities in the region.
Credit growth slowed substantially in 2009 Gross loans rose by a comparatively modest 11.4% in 2009 after nearly doubling in the previous year due to organic growth and the consolidation of ELBank. Slower loan growth primarily reflected the difficult operating environment, particularly in Dubai. The Bank’s loan book is primarily concentrated in Sharjah (47%) and Dubai (31%). The Lebanese book represented 15.1% of gross loans at end 2009, and loans to Abu Dhabi-based entities amounted to 7%.
ELBank’s loan book was largely concentrated in the manufacturing and trading sectors in Lebanon. These two sectors accounted for 79% of gross loans of this bank at end 2009. Sizeable exposure to large companies and SMEs A large proportion of BOS’s funded credit represented exposures to companies. Loans to large companies, defined as entities with revenues of more than AED200mn, accounted for 43% of total unconsolidated gross loans at end 2009, while SME loans, defined as loans to companies with revenues of between AED20mn and AED200mn, amounted to 24%. Personal loans to individuals accounted for 19.1% of gross loans (of which a small portion represented consumer credit). Loans to the government were low at 3.9%. Trade sector exposures are spread over a wide range of product groups, mainly relating to the retailing and wholesaling of consumer products. Exposure to trading in building and construction materials and vehicles represent a very small proportion of the total. Trade sector loans declined last year, reflecting the downturn in this sector in Dubai. ELBank’s loans to the trading sector in Lebanon represented a sizeable 53% of its small portfolio of gross loans at end 2009. Low direct credit exposures to real estate The Bank had, in the past, decided to stay away from the real estate segment until the sector had matured. Exposures to the real estate sector, through the personal business loans portfolio, were therefore low at AED154mn. Personal business loans were extended mainly to high net worth individuals; the funds were used primarily in the trading, manufacturing and contracting sectors.
Table 2: Breakdown of Investment Securities AEDmn 2009 2008 Direct Equity Investments 593 612 Government Securities 770 357 Quoted Shares 276 220 Total Investments 1,639 1,189 Of which, Available-for-sale 1,381 918 Held-to-maturity 10 42 Held-for-trading 248 229 Investments/Total Assets 9.3% 7.8% Fair Value (Losses)/Gains in Equity/Total capital
1.1%
(1.6%)
Fair Value Changes & Impairments/Avg. Tot. Assets
0.18%
-1.82%
Table 3: Gross Loans by Sector 2009 2008 Sector
AED mn
% of Total
AED mn
% of Total
Trading 3,688 31.2 3,895 36.7 Pers. Bus. Loans 2,251 19.1 1,640 15.5 Services 1,377 11.7 1,227 11.6 Manufacturing 1,342 11.4 1,086 10.3 Construction 914 7.7 821 7.7 Government 464 3.9 538 5.1 Public Utilities 547 4.6 405 3.8 Mining/Quarrying 505 4.3 393 3.7 Transport/Others 720 6.1 599 5.6 Gross Loans 11,808 100.0 10,604 100.0 Related Party/Gross Loans (%) 17.7 - 17.5 - Net Loans Growth Rate (%) 10.7 - 94.7 - Loans of ELBank 1,780 15.1 1,646 15.5

9
However, BOS made some direct investments in the real estate sector in 2008. The Bank purchased land at a cost of AED92mn in Sharjah and has small investments in properties under construction in Dubai which it intends to use in the future. Investment properties were valued at AED185mn at end 2009. Construction Loans to the construction sector rose by 11.3% in 2009, but construction loans represented a relatively low 7.7% of gross loans at year-end. These were primarily in the nature of short-term working capital loans to contractors. Government Loans to the Sharjah government formed 3.9% of gross loans at end 2009. BOS increased its exposure to Sharjah’s well managed public utilities company last year; these loans amounted to 4.6% of gross loans up from 3.8% at end 2008. Customer concentrations in net loans The ten largest funded credit exposures accounted for 25% of gross loans at end 2009. The largest exposure of AED531mn was to an oil and gas company. Other large exposures were to the Sharjah government and public sector, as well as to companies in wholesale trade, energy, services and industrial sectors. The ten largest off-balance sheet exposures accounted for 28.3% of total commitments and contingent accounts at end 2009. High level of short-term loans The Bank has a higher level of short-term loans on its books compared to many other banks, partly due to its large trade finance exposure and very small retail loan book. Loans with less-than-one-year tenors amounted to 76% of total loans at end 2009. Note: The Bank suspends interest accrual when loans are more than 90 days past due.
Solid asset quality Bank of Sharjah’s asset quality ratios have been very strong for several years. This is attributed to the Bank’s good insight into, and understanding of, its major customers’ businesses, several of whom have been associated with BOS for decades. Sound credit judgement and an unwillingness to lend to companies operating in markets that the Bank is unfamiliar with have also contributed to its good asset quality. BOS has a negligible retail credit book and no exposures to the Saad or al Gosaibi groups in Saudi Arabia or to the UAE’s Dubai World or Dubai Holdings. NPLs on a consolidated basis increased substantially in 2008 following the consolidation of ELBank’s financials, but grew at a modest 5%
in 2009 due to recoveries and write-offs. The NPLs to gross loans ratio fell to a low 1.64% at end 2009, which was well below the industry average (see Chart 3). For BOS alone, NPLs (including interest in suspense) rose to AED109mn from AED67mn at end 2008 due to increased impaired loans in the Bank’s loans to manufacturing and trading sectors, which is attributed to the general slowdown in the economy. ELBank’s NPLs (including interest in suspense), on the other hand, fell to AED165mn from AED197mn at end 2008. ELBank’s NPLs were concentrated in the manufacturing (73% of total NPLs) and trading (19%) sectors in Lebanon.
Table 4: Loans by Maturity (%) < 3
months 3-12
months > 1 year Total
2009 62.1 13.9 24.0 100 2008 73.9 9.1 17.0 100 2007 57.9 16.4 25.7 100
56 45 184 193
1.46%
0.84%
1.74% 1.64%
2.18%1.81%
2.07%
3.50%
-1%
0%
1%
2%
3%
4%
0
50
100
150
200
250
2006 2007 2008 2009
AEDmn
Chart 3: NPLs & NPLs to Gross Loans Ratio
NPLs BOS Industry Average

10
Trade and manufacturing sectors accounted for a major portion of NPLs For the Bank as a whole, impaired loans to the wholesale and retail sectors accounted for 46% of its total NPLs; this represented 3.3% of gross loans to the sector. Loans to the manufacturing sector amounted to 27% of total NPLs and 5.1% of total exposures to this sector. Construction sector loans formed 14% of NPLs and 3.9% of total construction loans. BOS’s exposures to other sectors have minimal levels of impairment. Strong NPL provision coverage ratio The Bank had built sizeable general provisions in recent years (AED70mn in both 2009 and 2008) in view of the difficult operating environment. Consequently, its provisions covered 143% of NPLs at end 2009. The high level of collateral held by the Bank is a risk mitigant. At end 2009, the Bank held collateral security valued at AED9.47 billion collateral against its net loans and advances of AED11.45 billion. BOS had not renegotiated or restructured loans at end 2008 and end 2009. The Bank’s large capital provides further cover – capital covered 34.9% of gross loans at end 2009. In addition, risk levels are low due to the short-term nature of the Bank’s credit exposures. Sixty two percent of net loans had maturities of less than three months at end 2009. Strong capital adequacy ratio (CAR) BOS has maintained high capital adequacy ratios for more than a decade. The ratio ranged from 22% to 39% between 2000 and 2009. Paid-up capital rose by 15.1% to AED2 billion at end 2009 after a bonus share issue. Reserves declined by 3.2% to AED1.9 billion due to the issue of AED262.5mn bonus shares by capitalising reserves and the distribution of cash dividends of AED260.6mn, which in the aggregate exceeded net profit of AED475.5mn. The Bank had a small revaluation reserve of AED98.4mn at end 2009 representing cumulative changes in fair value of investments (end 2008: AED53.5mn). Overall, total capital increased by 6.6% to AED4.1 billion and formed a substantial 23.2% of the total balance sheet. The Bank has not issued subordinated debt so far and it also chose not to convert some AED531mn of medium-term fixed deposits received from the federal government in Q4 2008 into subordinated Tier 2 debt, unlike many other banks. The Bank’s Basel II CAR strengthened to 23.29% at end 2009 from 21.81% at end 2008 and nearly all its capital was Tier 1 in nature. There are no plans at present to raise additional capital since the Bank expects its retained earnings to be sufficient to support the growth in risk assets this year. The Bank does not expect any major impairment of loans and advances that might require an injection of capital. The CAR at the end of Q1 2010 was unchanged from the end 2009 level. Shareholders have demonstrated support in the past. In 2003, the Bank more than doubled its capital through a rights issue and in 2006 its shareholders subscribed to an AED500mn bond which was converted into capital in 2008. ELBank is likely to issue new shares in 2010.
48 48 184 276
86%
107% 100%
143%
116% 121%105%
99%
0%
40%
80%
120%
160%
200%
0
50
100
150
200
250
300
2006 2007 2008 2009
AEDmn
Chart 4: Loan-loss Reserves (LLRs) & Coverage Ratio
LLRs LLRs/NPLs - BOS LLRs/NPLs - Ind. Avg.
11
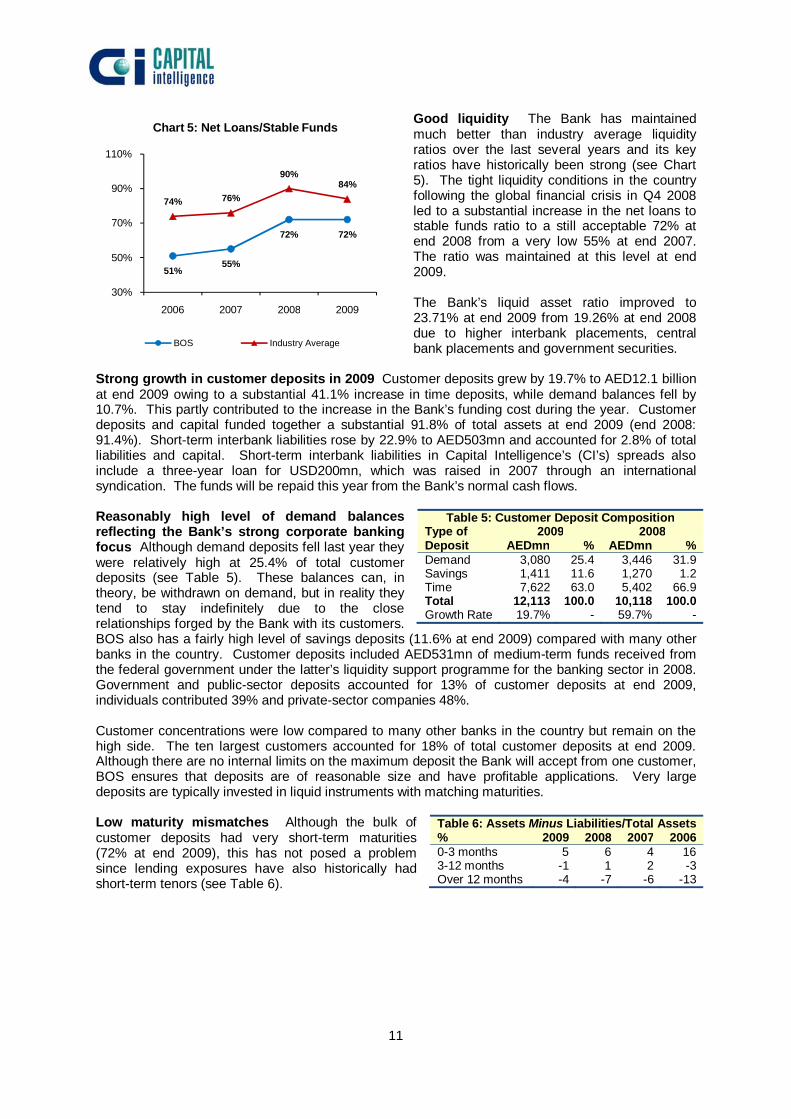
Good liquidity The Bank has maintained much better than industry average liquidity ratios over the last several years and its key ratios have historically been strong (see Chart 5). The tight liquidity conditions in the country following the global financial crisis in Q4 2008 led to a substantial increase in the net loans to stable funds ratio to a still acceptable 72% at end 2008 from a very low 55% at end 2007. The ratio was maintained at this level at end 2009. The Bank’s liquid asset ratio improved to 23.71% at end 2009 from 19.26% at end 2008 due to higher interbank placements, central bank placements and government securities.
Strong growth in customer deposits in 2009 Customer deposits grew by 19.7% to AED12.1 billion at end 2009 owing to a substantial 41.1% increase in time deposits, while demand balances fell by 10.7%. This partly contributed to the increase in the Bank’s funding cost during the year. Customer deposits and capital funded together a substantial 91.8% of total assets at end 2009 (end 2008: 91.4%). Short-term interbank liabilities rose by 22.9% to AED503mn and accounted for 2.8% of total liabilities and capital. Short-term interbank liabilities in Capital Intelligence’s (CI’s) spreads also include a three-year loan for USD200mn, which was raised in 2007 through an international syndication. The funds will be repaid this year from the Bank’s normal cash flows. Reasonably high level of demand balances reflecting the Bank’s strong corporate banking focus Although demand deposits fell last year they were relatively high at 25.4% of total customer deposits (see Table 5). These balances can, in theory, be withdrawn on demand, but in reality they tend to stay indefinitely due to the close relationships forged by the Bank with its customers. BOS also has a fairly high level of savings deposits (11.6% at end 2009) compared with many other banks in the country. Customer deposits included AED531mn of medium-term funds received from the federal government under the latter’s liquidity support programme for the banking sector in 2008. Government and public-sector deposits accounted for 13% of customer deposits at end 2009, individuals contributed 39% and private-sector companies 48%. Customer concentrations were low compared to many other banks in the country but remain on the high side. The ten largest customers accounted for 18% of total customer deposits at end 2009. Although there are no internal limits on the maximum deposit the Bank will accept from one customer, BOS ensures that deposits are of reasonable size and have profitable applications. Very large deposits are typically invested in liquid instruments with matching maturities. Low maturity mismatches Although the bulk of customer deposits had very short-term maturities (72% at end 2009), this has not posed a problem since lending exposures have also historically had short-term tenors (see Table 6).
Table 5: Customer Deposit Composition Type of Deposit
2009 2008 AEDmn % AEDmn %
Demand 3,080 25.4 3,446 31.9 Savings 1,411 11.6 1,270 1.2 Time 7,622 63.0 5,402 66.9 Total 12,113 100.0 10,118 100.0 Growth Rate 19.7% - 59.7% -
Table 6: Assets Minus Liabilities/Total Assets % 2009 2008 2007 2006 0-3 months 5 6 4 16 3-12 months -1 1 2 -3 Over 12 months -4 -7 -6 -13
51%55%
72% 72%
74% 76%
90%84%
30%
50%
70%
90%
110%
2006 2007 2008 2009
Chart 5: Net Loans/Stable Funds
BOS Industry Average

12
CURRENT YEAR UPDATE (Q1 2010) The table below highlights the Bank’s unaudited (but reviewed) financials for the first quarter of 2010: AEDmn Mar 10 Dec 09 ∆% Total Assets 18,062 17,655 2.3 NPLs 240 193 24.4 Provisions 278 276 0.7 Net Loans 11,854 11,451 3.5 Customer Deposits 12,482 12,113 3.0 Inter Bank Liabilities 1,299 1,238 12.1 Total Equity 3,978 4,097 -2.9 % Mar 10 Dec 09 NPLs/Gross Loans 1.98 1.64 Loan-Loss Reserves/NPLs 115.83 142.89 Capital Adequacy Ratio (Basel II) 22.21 23.29 Net Loans/Stable Funds 72.93 71.92 Liquid Asset Ratio 24.01 23.71 Cost To Income 25.93 23.75 Operating Profit/Avg.Tot. Assets *2.98 3.48 ROAA *3.00 2.89
AEDmn Q1 10 Q1 09 ∆% Net Interest Income 138 143 -3.5
Non-Interest Income 44 39 12.8 Of which: Fees, FX, 35 36 -2.8 Net Investment Income 5 2 150.0 Other Income 4 1 300.0
Gross Income 182 182 -
Operating Expenses 49 44 11.3
Operating Profit 133 138 -3.6
Gain on Sale of Associates 7 - -
Share of Loss in Associates -3 -
Provisions -3 -25 -88.0
Tax -1 -1 -
Amortisation – Goodwill -2 - - Net Profit 134 109 22.9
*Annualised The major changes are briefly analysed below: Profit and Loss Statement Net profit grew strongly Net profit rose by 22.9% over the corresponding period of the previous year due to much lower provisions for loan-losses, higher non-interest revenues and a gain from the sale of the Bank’s equity in a real estate fund (the latter was regarded as an associate for accounting purposes). But operating profitability declined on the back of lower net interest income Net interest income declined by 3.5% due to a lower net interest spread. Consequently, operating profit fell by 3.6% and the operating profit to average total assets ratio fell to a still good 2.98% (annualised) from 3.48% in 2009. Non-interest income rose by 12.8% mainly due to higher income from investments and an increase in miscellaneous income. Loan-loss provision charges dropped significantly compared to Q1 2009, thereby pushing up net profit by 22.9% and raising the ROAA to 3% (annualised) from 2.81% in the corresponding period of the previous year. Balance Sheet Asset quality remains sound, although key ratios weakened due to higher NPLs The Bank’s NPLs rose by 24.4% to AED240mn at end March 2010 and the NPLs to gross loans ratio also increased but remained strong at 1.98%. Loan-loss reserves continued to exceed NPLs at end March 2010 although the coverage ratio declined. The Bank states that it classified a few accounts during the first quarter which showed some signs of weakness. However, the loans were primarily extended on a secured basis and chances of recovery are high. BOS does not expect any major impairment problems in its UAE and Lebanese portfolios On the contrary it expects some of its classified accounts to improve their performance this year. BOS holds sizeable general provisions as a buffer against future shocks. The Bank is also profitable enough to make additional provisions should it become necessary.

13
Modest growth in total assets; satisfactory liquidity Cautious credit expansion led to a modest increase in net loans. Net loans rose by 3.5%, while customer deposits increased by 3%. The Bank continued to maintain a reasonably good level of liquid assets, bank placements and government securities; the liquid asset ratio was 24.01% at end March 2010. Liquidity, measured by the net loans to stable funds ratio, was an acceptable 72.93%. Solid capital adequacy ratio (CAR) Capital declined slightly due to the payment of AED240mn dividends for 2009. Nevertheless, the CAR was a solid 22.21% at end March 2010. OUTLOOK Loans and advances could rise in the second half of the year. Some signs of recovery have been noticed in Dubai’s trading sector. Moreover, contractor finance and other business opportunities are rising in Abu Dhabi, where government spending continues to drive economic growth. The Bank also expects to do well in Lebanon, where the economy is growing at a reasonably strong pace. There could be some increase in NPLs in the Bank’s exposures to the manufacturing and trading sectors, but the Bank’s good profitability and large capital are strong mitigants.

BANK OF SHARJAH LTDAE06
PERFORMANCE RATIOSExternal Audit AUD AUD AUD AUD
12/2009 12/2008 12/2007 12/2006
A . SIZE FACTORS1 . Total Assets (USD 000) 4,807,238 4,161,249 2,817,609 2,076,5892 . Total Capital (USD 000) 1,115,507 1,046,396 625,818 570,865
B . ASSET QUALITY3 . Total Assets Growth Rate (Year on Year %) 15.52 47.69 35.68 32.664 . Loan-Loss Reserve to Gross Loans (%) 2.35 1.75 0.89 1.265 . Non-Performing Loans to Gross Loans (%) 1.64 1.74 0.84 1.466 . Loan-Loss Reserve to Non-Performing Loans (%) 142.89 100.10 106.66 86.007 . Unprovided Non-Performing Loans to Free Capital (%) 0.398 . Loan-Loss Provision Charge on Gross Loans (%) 0.77 0.55 0.16 -0.629 . Reserve for Dimin. of Investments to Total Investments (%)
10 . Related Party Loans to Total Capital (%) 39.78 34.24 20.09 26.6711 . Total Contingents on Total Assets (%) 40.63 54.46 58.08 60.45
C . CAPITAL ADEQUACY12 . CI Risk Asset Ratio (%) 19.93 19.06 19.20 24.2613 . Estimated BIS Risk Asset Ratio (%) 20.79 19.94 19.71 24.3414 . Estimated BIS RAR on Tier One Capital (%) 20.28 19.65 18.71 23.6615 . Actual Risk Asset Ratio to Local Standards (%) (2) 23.29 21.81 27.74 30.8016 . Internal Capital Generation (%) 5.37 2.57 6.14 3.8817 . Total Capital Growth Rate (Year on Year %) 6.60 67.20 9.63 9.1018 . Total Capital to Total Assets (%) 23.20 25.15 22.21 27.4919 . Total Capital to Gross Loans (%) 34.94 36.51 42.88 55.1120 . Free Capital Funds (AED 000) 3,808,521 3,558,377 2,171,312 2,072,01621 . Estimated BIS RAR Shortfall (AED 000) 0 0 0 022 . Risk Weighted Assets on Total Footings (%) 77.82 79.96 69.60 69.87
D . LIQUIDITY23 . Net Loans to Total Deposits (%) 85.76 98.22 79.63 77.3324 . Net Loans to Total Customer Deposits (%) 94.53 102.19 83.82 77.5325 . Net Loans to Stable Funds (%) 71.92 71.75 54.52 50.6626 . Customer Deposits to Total Deposits (%) 90.73 96.11 95.00 99.7427 . Liquid Asset Ratio (%) 23.71 19.26 34.84 32.8828 . Quasi-Liquid Asset Ratio (%) 25.27 20.69 40.60 38.5129 . FX Currency Assets to FX Currency Liabilities (%) 30 . FX Currency Loans to FX Currency Deposits (%) 31 . Interbank Assets to Interbank Liabilities (%) 180.34 345.08 73.48 1,241.0032 . Net Interbank Assets (AED 000) 994,671 1,003,734 -88,417 142,032
E . PROFITABILITY33 . Return on Average Assets (%) 2.89 3.20 4.50 4.7934 . Return on Average Equity (%) 11.98 13.35 18.39 15.9335 . Underlying Profits on Average Assets (%) 3.38 3.77 3.18 2.2736 . Underlying Profits on Average Equity (%) 14.03 15.72 12.99 7.5737 . Funding Cost (%) 3.40 2.44 3.54 3.9938 . Interest on Average Earning Assets (%) 7.12 5.66 6.05 5.9339 . Interest Differential (%) 3.72 3.22 2.50 1.9340 . Non-Interest Income to Gross Income (%) 24.74 45.82 51.30 46.4241 . Operating Expenses to Gross Income (%) 23.75 18.25 18.03 20.0942 . Operating Profit Growth Rate (%) 0.95 44.63 53.41 -58.4443 . Operating Profit on Average Assets (%) 3.48 4.43 4.37 3.8244 . Risk Provisioning Charge to Operating Profit (%) 15.70 27.63 2.12 -9.1745 . Dividend Payout Ratio (%) 54.81 76.21 61.88 62.48
RATESExchange Rate (Units per USD) 3.6725 3.6725 3.6725 3.6725Inflation Rate (%) (Estimated) 1.00 13.00 11.00 9.30Imputed Interest Rate on Free Capital (%) 0.43 3.05 5.25 5.30
(6 month USD LIBOR at year-end)
NOTES:(1) 2007: Profit from sale of land; 2006 : Gain on sale of premises and equipment.(2) Capital adequacy ratio for 2009 & 2008 calculated according to Basel II framework
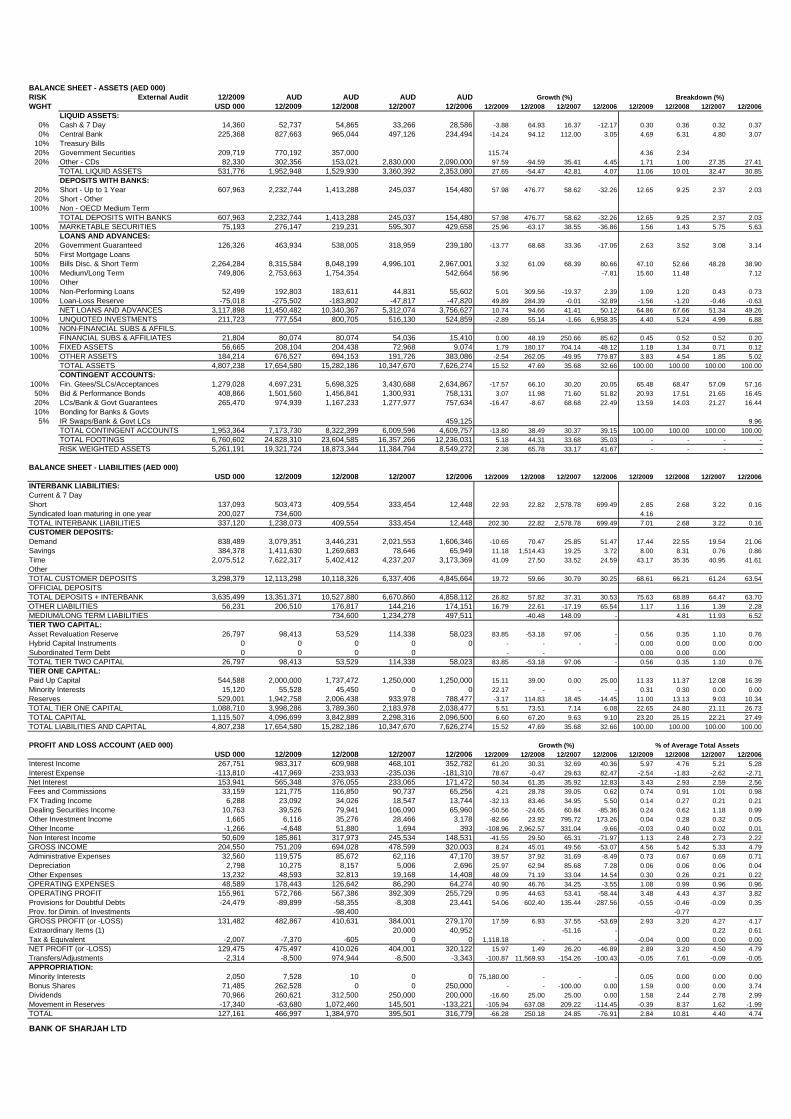
BALANCE SHEET - ASSETS (AED 000)RISK External Audit 12/2009 AUD AUD AUD AUD Growth (%) Breakdown (%)WGHT USD 000 12/2009 12/2008 12/2007 12/2006 12/2009 12/2008 12/2007 12/2006 12/2009 12/2008 12/2007 12/2006
LIQUID ASSETS:0% Cash & 7 Day 14,360 52,737 54,865 33,266 28,586 -3.88 64.93 16.37 -12.17 0.30 0.36 0.32 0.370% Central Bank 225,368 827,663 965,044 497,126 234,494 -14.24 94.12 112.00 3.05 4.69 6.31 4.80 3.07
10% Treasury Bills 20% Government Securities 209,719 770,192 357,000 115.74 4.36 2.34 20% Other - CDs 82,330 302,356 153,021 2,830,000 2,090,000 97.59 -94.59 35.41 4.45 1.71 1.00 27.35 27.41
TOTAL LIQUID ASSETS 531,776 1,952,948 1,529,930 3,360,392 2,353,080 27.65 -54.47 42.81 4.07 11.06 10.01 32.47 30.85DEPOSITS WITH BANKS:
20% Short - Up to 1 Year 607,963 2,232,744 1,413,288 245,037 154,480 57.98 476.77 58.62 -32.26 12.65 9.25 2.37 2.0320% Short - Other
100% Non - OECD Medium Term TOTAL DEPOSITS WITH BANKS 607,963 2,232,744 1,413,288 245,037 154,480 57.98 476.77 58.62 -32.26 12.65 9.25 2.37 2.03
100% MARKETABLE SECURITIES 75,193 276,147 219,231 595,307 429,658 25.96 -63.17 38.55 -36.86 1.56 1.43 5.75 5.63LOANS AND ADVANCES:
20% Government Guaranteed 126,326 463,934 538,005 318,959 239,180 -13.77 68.68 33.36 -17.06 2.63 3.52 3.08 3.1450% First Mortgage Loans
100% Bills Disc. & Short Term 2,264,284 8,315,584 8,048,199 4,996,101 2,967,001 3.32 61.09 68.39 80.66 47.10 52.66 48.28 38.90100% Medium/Long Term 749,806 2,753,663 1,754,354 542,664 56.96 -7.81 15.60 11.48 7.12100% Other 100% Non-Performing Loans 52,499 192,803 183,611 44,831 55,602 5.01 309.56 -19.37 2.39 1.09 1.20 0.43 0.73100% Loan-Loss Reserve -75,018 -275,502 -183,802 -47,817 -47,820 49.89 284.39 -0.01 -32.89 -1.56 -1.20 -0.46 -0.63
NET LOANS AND ADVANCES 3,117,898 11,450,482 10,340,367 5,312,074 3,756,627 10.74 94.66 41.41 50.12 64.86 67.66 51.34 49.26100% UNQUOTED INVESTMENTS 211,723 777,554 800,705 516,130 524,859 -2.89 55.14 -1.66 6,958.35 4.40 5.24 4.99 6.88100% NON-FINANCIAL SUBS & AFFILS.
FINANCIAL SUBS & AFFILIATES 21,804 80,074 80,074 54,036 15,410 0.00 48.19 250.66 85.62 0.45 0.52 0.52 0.20100% FIXED ASSETS 56,665 208,104 204,438 72,968 9,074 1.79 180.17 704.14 -48.12 1.18 1.34 0.71 0.12100% OTHER ASSETS 184,214 676,527 694,153 191,726 383,086 -2.54 262.05 -49.95 779.87 3.83 4.54 1.85 5.02
TOTAL ASSETS 4,807,238 17,654,580 15,282,186 10,347,670 7,626,274 15.52 47.69 35.68 32.66 100.00 100.00 100.00 100.00CONTINGENT ACCOUNTS:
100% Fin. Gtees/SLCs/Acceptances 1,279,028 4,697,231 5,698,325 3,430,688 2,634,867 -17.57 66.10 30.20 20.05 65.48 68.47 57.09 57.1650% Bid & Performance Bonds 408,866 1,501,560 1,456,841 1,300,931 758,131 3.07 11.98 71.60 51.82 20.93 17.51 21.65 16.4520% LCs/Bank & Govt Guarantees 265,470 974,939 1,167,233 1,277,977 757,634 -16.47 -8.67 68.68 22.49 13.59 14.03 21.27 16.4410% Bonding for Banks & Govts
5% IR Swaps/Bank & Govt LCs 459,125 9.96TOTAL CONTINGENT ACCOUNTS 1,953,364 7,173,730 8,322,399 6,009,596 4,609,757 -13.80 38.49 30.37 39.15 100.00 100.00 100.00 100.00TOTAL FOOTINGS 6,760,602 24,828,310 23,604,585 16,357,266 12,236,031 5.18 44.31 33.68 35.03 - - - -RISK WEIGHTED ASSETS 5,261,191 19,321,724 18,873,344 11,384,794 8,549,272 2.38 65.78 33.17 41.67 - - - -
BALANCE SHEET - LIABILITIES (AED 000)USD 000 12/2009 12/2008 12/2007 12/2006 12/2009 12/2008 12/2007 12/2006 12/2009 12/2008 12/2007 12/2006
INTERBANK LIABILITIES:Current & 7 Day Short 137,093 503,473 409,554 333,454 12,448 22.93 22.82 2,578.78 699.49 2.85 2.68 3.22 0.16Syndicated loan maturing in one year 200,027 734,600 4.16 TOTAL INTERBANK LIABILITIES 337,120 1,238,073 409,554 333,454 12,448 202.30 22.82 2,578.78 699.49 7.01 2.68 3.22 0.16CUSTOMER DEPOSITS:Demand 838,489 3,079,351 3,446,231 2,021,553 1,606,346 -10.65 70.47 25.85 51.47 17.44 22.55 19.54 21.06Savings 384,378 1,411,630 1,269,683 78,646 65,949 11.18 1,514.43 19.25 3.72 8.00 8.31 0.76 0.86Time 2,075,512 7,622,317 5,402,412 4,237,207 3,173,369 41.09 27.50 33.52 24.59 43.17 35.35 40.95 41.61Other TOTAL CUSTOMER DEPOSITS 3,298,379 12,113,298 10,118,326 6,337,406 4,845,664 19.72 59.66 30.79 30.25 68.61 66.21 61.24 63.54OFFICIAL DEPOSITS TOTAL DEPOSITS + INTERBANK 3,635,499 13,351,371 10,527,880 6,670,860 4,858,112 26.82 57.82 37.31 30.53 75.63 68.89 64.47 63.70OTHER LIABILITIES 56,231 206,510 176,817 144,216 174,151 16.79 22.61 -17.19 65.54 1.17 1.16 1.39 2.28MEDIUM/LONG TERM LIABILITIES 734,600 1,234,278 497,511 -40.48 148.09 - 4.81 11.93 6.52TIER TWO CAPITAL:Asset Revaluation Reserve 26,797 98,413 53,529 114,338 58,023 83.85 -53.18 97.06 - 0.56 0.35 1.10 0.76Hybrid Capital Instruments 0 0 0 0 0 - - - - 0.00 0.00 0.00 0.00Subordinated Term Debt 0 0 0 0 - - 0.00 0.00 0.00 TOTAL TIER TWO CAPITAL 26,797 98,413 53,529 114,338 58,023 83.85 -53.18 97.06 - 0.56 0.35 1.10 0.76TIER ONE CAPITAL:Paid Up Capital 544,588 2,000,000 1,737,472 1,250,000 1,250,000 15.11 39.00 0.00 25.00 11.33 11.37 12.08 16.39Minority Interests 15,120 55,528 45,450 0 0 22.17 - - - 0.31 0.30 0.00 0.00Reserves 529,001 1,942,758 2,006,438 933,978 788,477 -3.17 114.83 18.45 -14.45 11.00 13.13 9.03 10.34TOTAL TIER ONE CAPITAL 1,088,710 3,998,286 3,789,360 2,183,978 2,038,477 5.51 73.51 7.14 6.08 22.65 24.80 21.11 26.73TOTAL CAPITAL 1,115,507 4,096,699 3,842,889 2,298,316 2,096,500 6.60 67.20 9.63 9.10 23.20 25.15 22.21 27.49TOTAL LIABILITIES AND CAPITAL 4,807,238 17,654,580 15,282,186 10,347,670 7,626,274 15.52 47.69 35.68 32.66 100.00 100.00 100.00 100.00
PROFIT AND LOSS ACCOUNT (AED 000) Growth (%) % of Average Total AssetsUSD 000 12/2009 12/2008 12/2007 12/2006 12/2009 12/2008 12/2007 12/2006 12/2009 12/2008 12/2007 12/2006
Interest Income 267,751 983,317 609,988 468,101 352,782 61.20 30.31 32.69 40.36 5.97 4.76 5.21 5.28Interest Expense -113,810 -417,969 -233,933 -235,036 -181,310 78.67 -0.47 29.63 82.47 -2.54 -1.83 -2.62 -2.71Net Interest 153,941 565,348 376,055 233,065 171,472 50.34 61.35 35.92 12.83 3.43 2.93 2.59 2.56Fees and Commissions 33,159 121,775 116,850 90,737 65,256 4.21 28.78 39.05 0.62 0.74 0.91 1.01 0.98FX Trading Income 6,288 23,092 34,026 18,547 13,744 -32.13 83.46 34.95 5.50 0.14 0.27 0.21 0.21Dealing Securities Income 10,763 39,526 79,941 106,090 65,960 -50.56 -24.65 60.84 -85.36 0.24 0.62 1.18 0.99Other Investment Income 1,665 6,116 35,276 28,466 3,178 -82.66 23.92 795.72 173.26 0.04 0.28 0.32 0.05Other Income -1,266 -4,648 51,880 1,694 393 -108.96 2,962.57 331.04 -9.66 -0.03 0.40 0.02 0.01Non Interest Income 50,609 185,861 317,973 245,534 148,531 -41.55 29.50 65.31 -71.97 1.13 2.48 2.73 2.22GROSS INCOME 204,550 751,209 694,028 478,599 320,003 8.24 45.01 49.56 -53.07 4.56 5.42 5.33 4.79Administrative Expenses 32,560 119,575 85,672 62,116 47,170 39.57 37.92 31.69 -8.49 0.73 0.67 0.69 0.71Depreciation 2,798 10,275 8,157 5,006 2,696 25.97 62.94 85.68 7.28 0.06 0.06 0.06 0.04Other Expenses 13,232 48,593 32,813 19,168 14,408 48.09 71.19 33.04 14.54 0.30 0.26 0.21 0.22OPERATING EXPENSES 48,589 178,443 126,642 86,290 64,274 40.90 46.76 34.25 -3.55 1.08 0.99 0.96 0.96OPERATING PROFIT 155,961 572,766 567,386 392,309 255,729 0.95 44.63 53.41 -58.44 3.48 4.43 4.37 3.82Provisions for Doubtful Debts -24,479 -89,899 -58,355 -8,308 23,441 54.06 602.40 135.44 -287.56 -0.55 -0.46 -0.09 0.35Prov. for Dimin. of Investments -98,400 -0.77 GROSS PROFIT (or -LOSS) 131,482 482,867 410,631 384,001 279,170 17.59 6.93 37.55 -53.69 2.93 3.20 4.27 4.17Extraordinary Items (1) 20,000 40,952 -51.16 - 0.22 0.61Tax & Equivalent -2,007 -7,370 -605 0 0 1,118.18 - - - -0.04 0.00 0.00 0.00NET PROFIT (or -LOSS) 129,475 475,497 410,026 404,001 320,122 15.97 1.49 26.20 -46.89 2.89 3.20 4.50 4.79Transfers/Adjustments -2,314 -8,500 974,944 -8,500 -3,343 -100.87 11,569.93 -154.26 -100.43 -0.05 7.61 -0.09 -0.05APPROPRIATION:Minority Interests 2,050 7,528 10 0 0 75,180.00 - - - 0.05 0.00 0.00 0.00Bonus Shares 71,485 262,528 0 0 250,000 - - -100.00 0.00 1.59 0.00 0.00 3.74Dividends 70,966 260,621 312,500 250,000 200,000 -16.60 25.00 25.00 0.00 1.58 2.44 2.78 2.99Movement in Reserves -17,340 -63,680 1,072,460 145,501 -133,221 -105.94 637.08 209.22 -114.45 -0.39 8.37 1.62 -1.99TOTAL 127,161 466,997 1,384,970 395,501 316,779 -66.28 250.18 24.85 -76.91 2.84 10.81 4.40 4.74
BANK OF SHARJAH LTD

RATIO FORMULAE
A. Size Factors
1. TOTAL ASSETS (USD 000)
2. TOTAL CAPITAL (USD 000)
B. Asset Quality Ratios
3. TOTAL ASSETS GROWTH RATE (YEAR ON YEAR %) (CURRENT YEAR TOTAL ASSETS - LAST YEAR TOTAL ASSETS) X 100 LAST YEAR TOTAL ASSETS
4. LOAN-LOSS RESERVE TO GROSS LOANS (%) LOAN-LOSS RESERVE X 100 GROSS LOANS
5. NON-PERFORMING LOANS TO GROSS LOANS (%) NON-PERFORMING LOANS X 100 GROSS LOANS
6. LOAN-LOSS RESERVE TO NON-PERFORMING LOANS (%) LOAN-LOSS RESERVE X 100 NON-PERFORMING LOANS
7. UNPROVIDED NON-PERFORMING LOANS TO FREE CAPITAL (%) NON-PERFORMING LOANS - LOAN LOSS RESERVE X 100 FREE CAPITAL
8. LOAN-LOSS PROVISION CHARGE ON GROSS LOANS (%) PROVISIONS FOR DOUBTFUL DEBTS CHARGE X 100 GROSS LOANS
9. RESERVE FOR DIMINUTION OF INVESTMENTS TO TOTAL INVESTMENTS (%) RESERVE FOR DIMINUTION OF INVESTMENTS X 100 TOTAL INVESTMENTS
10. RELATED PARTY LOANS TO TOTAL CAPITAL (%) RELATED PARTY LOANS X 100 TIER ONE + TIER TWO CAPITAL
11. TOTAL CONTINGENTS ON TOTAL ASSETS (%) TOTAL CONTINGENTS X 100 TOTAL ASSETS
C. Capital Adequacy Ratios
12. CI RISK ASSET RATIO (%) FREE CAPITAL FUNDS X 100 RISK WEIGHTED ASSETS - NON-FINANCIAL SUBS. - FIXED ASSETS
13. ESTIMATED BIS RISK ASSET RATIO (%) (TOTAL CAPITAL - FINANCIAL SUBSIDIARIES) X 100 RISK WEIGHTED ASSETS
14. ESTIMATED BIS RAR ON TIER ONE CAPITAL (%). TIER ONE CAPITAL - FINANCIAL SUBSIDIARIES X 100 RISK WEIGHTED ASSETS
15. ACTUAL RISK ASSET RATIO TO LOCAL STANDARDS (%) AS REPORTED BY LOCAL CENTRAL OR COMMERCIAL BANKS
16. INTERNAL CAPITAL GENERATION (%). (NET PROFIT - DIVIDENDS -EXTRAORDINARY ITEMS) X 100 TIER ONE CAPITAL
17. TOTAL CAPITAL GROWTH RATE (YEAR ON YEAR %) (CURRENT YEAR TOTAL CAPITAL - LAST YEAR TOTAL CAPITAL) X 100 LAST YEAR TOTAL CAPITAL
18. TOTAL CAPITAL TO TOTAL ASSETS (%) TOTAL CAPITAL X 100 TOTAL ASSETS
19. TOTAL CAPITAL TO GROSS LOANS (%) TOTAL CAPITAL X 100 GROSS LOANS
20. FREE CAPITAL FUNDS (LOCAL CURRENCY) TOTAL CAPITAL - FINANCIAL & NON FINANCIAL SUBSIDIARIES - FIXED ASSETS
21. ESTIMATED BIS RAR SHORTFALL (LOCAL CURRENCY) IF BIS RISK ASSET RATIO IS LESS THAN 8%
(0.08 X RISK WEIGHTED ASSETS) - (TOTAL CAPITAL - FINANCIAL SUBSIDIARIES)
22. RISK WEIGHTED ASSETS ON TOTAL FOOTINGS (%) RISK WEIGHTED ASSETS X 100 TOTAL FOOTINGS
D. Liquidity Ratios
23. NET LOANS TO TOTAL DEPOSITS (%) NET LOANS X 100 TOTAL CUSTOMER DEPOSITS & INTERBANK
24. NET LOANS TO TOTAL CUSTOMER DEPOSITS (%) NET LOANS X 100 TOTAL CUSTOMER DEPOSITS
25. NET LOANS TO STABLE FUNDS (%) NET LOANS X 100 STABLE FUNDS
26. CUSTOMER DEPOSITS TO TOTAL DEPOSITS (%) TOTAL CUSTOMER DEPOSITS X 100 TOTAL DEPOSITS & INTERBANK
27. LIQUID ASSET RATIO (%) (TOTAL LIQUID ASSETS + TOTAL DEPOSITS WITH BANKS) X 100 TOTAL ASSETS
28. QUASI-LIQUID ASSET RATIO (%) QUASI-LIQUID ASSETS X 100 TOTAL ASSETS
29. FOREIGN CURRENCY ASSETS TO FOREIGN CURRENCY LIABILITIES (%) FOREIGN CURRENCY ASSETS X 100 FOREIGN CURRENCY LIABILITIES
30. FOREIGN CURRENCY LOANS TO FOREIGN CURRENCY DEPOSITS (%) FOREIGN CURRENCY LOANS X 100 FOREIGN CURRENCY BORROWINGS + FOREIGN CURRENCY DEPOSITS
31. INTERBANK ASSETS TO INTERBANK LIABILITIES (%) TOTAL DEPOSITS WITH BANKS X 100 TOTAL INTERBANK LIABILITIES
32. NET INTERBANK ASSETS (LOCAL CURRENCY) TOTAL DEPOSITS WITH BANKS - TOTAL INTERBANK LIABILITIES

E. Profitability Ratios
33. RETURN ON AVERAGE ASSETS (%) NET PROFIT (or LOSS) X 100 AVERAGE TOTAL ASSETS
34. RETURN ON AVERAGE EQUITY (%) NET PROFIT (or LOSS) X 100 AVERAGE TIER ONE CAPITAL +AVERAGE REVALUATION RESERVE
35. UNDERLYING PROFITS ON AVERAGE ASSETS (%) (OPERATING PROFIT - INTEREST ON AVERAGE FREE CAPITAL) X 100 AVERAGE TOTAL ASSETS
36. UNDERLYING PROFITS ON AVERAGE EQUITY (%) (OPERATING PROFIT - INTEREST ON AVERAGE FREE CAPITAL) X 100 AVERAGE TIER ONE CAPITAL + AVERAGE REVALUATION RESERVE
37. FUNDING COST (%)
INTEREST EXPENSE X 100 AVERAGE TOTAL DEPOSITS & INTERBANK+AVERAGE MEDIUM/LONG TERM
LIABILITIES+AVERAGE HYBRID CAPITAL INSTRUMENTS+AVERAGE SUBORDINATED TERM DEBT
38. INTEREST ON AVERAGE EARNING ASSETS (%)
INTEREST INCOME X 100 AVERAGE CASH & 7 DAY+AVERAGE T-BILLS+AVERAGE GOVERNMENT
SECURITIES+AVERAGE OTHER LIQUID ASSETS+AVERAGE TOTAL DEPOSITS WITH BANKS+AVERAGE MARKETABLE SECURITIES+AVERAGE NET LOANS
39. INTEREST DIFFERENTIAL (%) INTEREST ON AVERAGE EARNING ASSETS (%) - FUNDING COST (%)
40. NON-INTEREST INCOME TO GROSS INCOME (%) (GROSS INCOME - NET INTEREST) X 100 GROSS INCOME
41. OPERATING EXPENSES TO GROSS INCOME (%) OPERATING EXPENSES X 100 GROSS INCOME
42. OPERATING PROFIT GROWTH RATE (YEAR ON YEAR %) (CURRENT YEAR OPERATING PROFIT - LAST YEAR OPERATING PROFIT) X 100 LAST YEAR OPERATING PROFIT
43. OPERATING PROFIT ON AVERAGE ASSETS (%) OPERATING PROFIT X 100 AVERAGE TOTAL ASSETS
44. RISK PROVISIONING CHARGE TO OPERATING PROFIT (%) PROV. CHARGE FOR DOUBTFUL DEBTS & DIM. OF INVESTMENTS X 100 OPERATING PROFIT
45. DIVIDEND PAYOUT RATIO (%) DIVIDENDS X 100
NET PROFIT (or LOSS)
Definitions
FREE CAPITAL:- FREE CAPITAL FUNDS - TIER TWO CAPITAL
STABLE FUNDS:- TOTAL CUSTOMER DEPOSITS + OFFICIAL DEPOSITS + MEDIUM/LONG
TERM LIABILITIES + FREE CAPITAL FUNDS.
QUASI LIQUID ASSETS:- TOTAL LIQUID ASSETS + TOTAL DEPOSITS WITH BANKS + MARKETABLE
SECURITIES.
TOTAL INVESTMENTS:- MARKETABLE SECURITIES + UNQUOTED INVESTMENTS + NON-FINANCIAL SUBSIDIARIES & AFFILIATES + FINANCIAL SUBSIDIARIES & AFFILIATES.
RISK WEIGHTED ASSETS:- WEIGHTED TOTAL OF ASSETS APPLYING THE FOLLOWING PERCENTAGES:- 100% Non-OECD medium term deposits, marketable securities, bills
discounted & short term loans, medium/long term loans, other loans, non-performing loans, loan-loss provisions, unquoted investments, non-financial subsidiaries & affiliates, fixed assets, other assets, financial guarantees / standby LCs / acceptances.
50% First mortgage loans, bid & performance bonds. 20% Government securities, other liquid assets, up to 1 year deposits with
banks, short/other deposits with banks, government guaranteed / collateralised loans, LCs / bank & government guarantees.
10% T-Bills, bonding for banks & governments. 5% Interest rate swaps/bank & government LCs.
GROSS LOANS:- GOVERNMENT GUARANTEED, FIRST MORTGAGE LOANS, BILLS DISC. &
SHORT TERM, MEDIUM/LONG TERM LOANS, OTHER LOANS, NON-PERFORMING LOANS.
EQUITY:- TIER ONE CAPITAL + ASSET REVALUATION RESERVE

Rev.25/06/2010
RATINGS DEFINITIONS Foreign and Local Currency Ratings Foreign currency ratings refer to an entity’s ability and willingness to meet its foreign currency denominated financial obligations as they come due. Foreign currency ratings take into account the likelihood of a government imposing restrictions on the conversion of local currency to foreign currency or on the transfer of foreign currency to residents and non-residents. Local currency ratings for non-sovereign issuers are an opinion of an entity’s ability and willingness to meet all of its financial obligations on a timely basis, regardless of the currency in which those obligations are denominated and absent transfer and convertibility restrictions. Both foreign currency and local currency ratings are internationally comparable assessments. Foreign and local currency ratings take into account the economic, financial and country risks that may affect creditworthiness as well as the likelihood that an entity would receive external support in the event of financial difficulties. Ratings assigned to banks and corporates are generally not higher than the local and foreign currency ratings assigned by CI to the relevant sovereign government. However, it may be possible for an issuer with particular strengths and attributes such as inherent financial strength, geographically diversified cash flow, substantial foreign assets, and guaranteed external support, to be rated above the sovereign. The following rating scale applies to both foreign currency and local currency ratings. Short-term ratings assess the time period up to one year. Long-Term Issuer Ratings Investment Grade AAA The highest credit quality. Exceptional capacity for timely fulfilment of financial obligations
and most unlikely to be affected by any foreseeable adversity. Extremely strong financial condition and very positive non-financial factors.
AA Very high credit quality. Very strong capacity for timely fulfilment of financial obligations.
Unlikely to have repayment problems over the long term and unquestioned over the short and medium terms. Adverse changes in business, economic and financial conditions are unlikely to affect the institution significantly.
A High credit quality. Strong capacity for timely fulfilment of financial obligations. Possesses
many favourable credit characteristics but may be slightly vulnerable to adverse changes in business, economic and financial conditions.
BBB Good credit quality. Satisfactory capacity for timely fulfilment of financial obligations.
Acceptable credit characteristics but some vulnerability to adverse changes in business, economic and financial conditions. Medium grade credit characteristics and the lowest investment grade category.
Speculative Grade BB Speculative credit quality. Capacity for timely fulfilment of financial obligations is vulnerable
to adverse changes in internal or external circumstances. Financial and/or non-financial factors do not provide significant safeguard and the possibility of investment risk may develop.
Rev.25/06/2010
B Significant credit risk. Capacity for timely fulfilment of financial obligations is very vulnerable to adverse changes in internal or external circumstances. Financial and/or non-financial factors provide weak protection; high probability for investment risk exists.
C Substantial credit risk is apparent and the likelihood of default is high. Considerable
uncertainty as to the timely repayment of financial obligations. Credit is of poor standing with financial and/or non-financial factors providing little protection.
RS Regulatory supervision. The obligor is under the regulatory supervision of the authorities
due to its weak financial condition. The likelihood of default is extremely high without continued external support.
SD Selective default. The obligor has failed to service one or more financial obligations but
CI believes that the default will be restricted in scope and that the obligor will continue honouring other financial commitments in a timely manner.
D The obligor has defaulted on all, or nearly all, of its financial obligations. Short-Term Issuer Ratings Investment Grade A1 Superior credit quality. Highest capacity for timely repayment of short-term financial
obligations that is extremely unlikely to be affected by unexpected adversities. Institutions with a particularly strong credit profile have a “+” affixed to the rating.
A2 Very strong capacity for timely repayment but may be affected slightly by unexpected
adversities. A3 Strong capacity for timely repayment that may be affected by unexpected adversities. Speculative Grade B Adequate capacity for timely repayment that could be seriously affected by unexpected
adversities. C Inadequate capacity for timely repayment if unexpected adversities are encountered in the
short term. RS Regulatory supervision. The obligor is under the regulatory supervision of the authorities
due to its weak financial condition. The likelihood of default is extremely high without continued external support.
SD Selective default. The obligor has failed to service one or more financial obligations but
CI believes that the default will be restricted in scope and that the obligor will continue honouring other financial commitments in a timely manner.
D The obligor has defaulted on all, or nearly all, of its financial obligations.
Rev.25/06/2010
Capital Intelligence appends "+" and "-" signs to foreign and local currency long term ratings in the categories from "AA" to "C" to indicate that the strength of a particular bank is, respectively, slightly greater or less than that of similarly rated peers. Rating symbols written in lower case (e.g. aaa/a1) indicate that the issuer has not participated in the rating process and CI has relied on publicly available information and other information sources it considers reliable. Outlook – expectations of improvement, no change or deterioration in a rating over the 12 months following its publication are denoted Positive, Stable or Negative. Qualified – in cases where data and/or co-operation are such that it is not possible to formulate ratings to CI’s high standards of robustness and reliability the letter “q” is appended to the ratings. Financial Strength Ratings CI’s financial strength ratings provide an opinion of a bank’s inherent financial strength, soundness and risk profile. These ratings do not address sovereign risk factors, including transfer risk, which may affect an institution’s capacity to honour its financial obligations, be they local or foreign currency. Financial strength ratings also exclude support factors, which are addressed by foreign and local currency ratings, as well as CI's support ratings. However, financial strength ratings do take into account the bank’s operating environment including the economy, the structure, strength and stability of the financial system, the legal system, and the quality of banking regulation and supervision. Financial strength ratings do not assess the likelihood that specific obligations will be repaid in a timely manner. The following rating scale applies to the financial strength rating. AAA Financially in extremely strong condition with positive financial trends; significant strengths
in other non-financial areas. Operating environment likely to be highly attractive and stable. AA Financially in very strong condition and significant strengths in other non-financial areas.
Operating environment likely to be very attractive and stable. A Strong financial fundamentals and very favourable non-financial considerations. Operating
environment may be unstable but institution’s market position and/or financial strength more than compensate.
BBB Basically sound overall; slight weaknesses in financial or other factors could be remedied
fairly easily. May be limited by unstable operating environment. BB One or two significant weaknesses in the bank’s financial makeup could cause problems.
May be characterised by a limited franchise; other factors may not be sufficient to avoid a need for some degree of temporary external support in cases of extraordinary adversity. Unstable operating environment likely.
B Fundamental weaknesses are present in the bank's financial condition or trends, and other
factors are unlikely to provide strong protection from unexpected adversities; in such an event, the need for external support is likely. Bank may be constrained by weak market position and/or volatile operating environment.
C In a very weak financial condition, either with immediate problems or with limited capacity to
withstand adversities. May be operating in a highly volatile operating environment. D Extremely weak financial condition and may be in an untenable position.

Rev.25/06/2010
Capital Intelligence appends "+" and "-" signs to financial strength ratings in the categories from "AA" to "C" to indicate that the strength of a particular institution is, respectively, slightly greater or less than that of similarly rated peers. Rating symbols written in lower case (e.g. aaa/a1) indicate that the issuer has not participated in the rating process and CI has relied on publicly available information and other information sources it considers reliable. Outlook – expectations of improvement, no change or deterioration in a rating over the 12 months following its publication are denoted Positive, Stable or Negative. Qualified – in cases where data and/or co-operation are such that it is not possible to formulate ratings to CI’s high standards of robustness and reliability the letter “q” is appended to the ratings. Support Ratings CI's support ratings assess the likelihood that, in the event of difficulties, a bank would receive sufficient financial assistance from the government or private owners to enable it to continue meeting its financial obligations in a timely manner. Support ratings complement CI’s financial strength ratings which, in effect, indicate the likelihood that a bank will fail due to inherent financial weaknesses and/or an unstable operating environment and therefore may require external support to avoid defaulting on its obligations. Neither financial strength ratings or support ratings take account of transfer and convertibility risks associated with sovereign events. The overall creditworthiness of an institution and default risk is captured by CI’s foreign currency ratings. Foreign currency ratings take into account all factors affecting the likelihood of repayment including inherent financial strength, external support, the operating environment, and sovereign-related risks. Although subjective, support ratings are based on a thorough assessment of a bank’s ownership, market position and importance within the sector and economy, as well as the country’s regulatory and supervisory framework and the credit standing of potential supporters. The following rating scale applies to support ratings. 1. The likelihood of a bank receiving support in the event of difficulties is extremely high. The
characteristics of a bank with this support rating may include strong government ownership and/or clear legal guarantees on the part of the state. The bank may also be of such importance to the national economy that state intervention is virtually assured. The ability and willingness of potential supporters to provide sufficient and timely support is extremely strong.
2. The likelihood of support is very high. The ability and willingness of potential supporters to
provide sufficient and timely support is very strong. 3. The likelihood of support is high. The ability and willingness of potential supporters to provide
sufficient and timely support is strong. 4. The likelihood of support is moderate. There is some uncertainty about the ability and
willingness of potential supporters to provide sufficient and timely assistance. 5. The likelihood of support is low. There is considerable uncertainty about the ability and
willingness of potential supporters to provide sufficient and timely assistance.


![arXiv:1107.5414v1 [math.GR] 27 Jul 2011 · Date: 27 мая 2011 г. Key words and phrases. Chevalley groups, unitriangular factorisations, unipotent factorisations, rings of stable](https://img.pdfslide.us/doc/110x75/5ec883b9f7dbcb479e395406/arxiv11075414v1-mathgr-27-jul-2011-date-27-2011-key-words-and-phrases.jpg)