Embed Size (px)
Citation preview
Journal of Banking & Finance 37 (2013) 3930–3950
Contents lists available at SciVerse ScienceDirect
Journal of Banking & Finance
journal homepage: www.elsevier .com/locate / jbf
Bank liquidity, the maturity ladder, and regulation
0378-4266/$ - see front matter � 2013 Elsevier B.V. All rights reserved.http://dx.doi.org/10.1016/j.jbankfin.2013.07.008
⇑ Corresponding author. Tel.: +31 20 5243539; fax: +31 20 5242526.E-mail addresses: [email protected] (L. de Haan), [email protected] (J.W.
van den End).
Leo de Haan ⇑, Jan Willem van den EndDe Nederlandsche Bank, Economics and Research Division, P.O. Box 98, 1000 AB Amsterdam, The Netherlands
a r t i c l e i n f o a b s t r a c t
Article history:Received 17 July 2012Accepted 5 July 2013Available online 12 July 2013
JEL classification:G21G28G32
Keywords:BanksLiquidityRegulation
We investigate the liquidity management of 62 Dutch banks between January 2004 and March 2010,when these banks were subject to a liquidity regulation that is very similar to Basel III’s Liquidity Cover-age Ratio (LCR). We find that most banks hold more liquid assets against their stock of liquid liabilities,such as demand deposits, than strictly required under the regulation. More solvent banks hold fewerliquid assets against their stock of liquid liabilities, suggesting an interaction between capital and liquid-ity buffers. However, this interaction turns out to be weaker during a crisis. Although not required, somebanks consider cash flows scheduled beyond 1 month ahead when setting liquidity asset holdings, butthey seldom look further ahead than 1 year.
� 2013 Elsevier B.V. All rights reserved.
1. Introduction
The crisis that plagues the financial system since 2007 is tosome extent a liquidity crisis (Banque de France, 2008), causedby a collapse in confidence in the sustainability of the banks’ highleverage and maturity mismatches. Wholesale funding has almostcompletely dried up, in particular long-term funding, leading to anincrease of the maturity mismatch. Banks responded to this byhoarding high-quality assets as a buffer against the maturity mis-match and rollover risks of short-term interbank borrowing (Ach-arya and Skeie, 2011).
To strengthen banks’ liquidity profiles, Basel III introduces theLiquidity Coverage Ratio (LCR). The LCR prescribes that banks holda sufficient level of high-quality assets against the net outflow ofliquidity expected in stress conditions during a 30 days period.More specifically, a sufficiently high level of liquid assets shouldensure that banks survive an acute stress scenario lasting for1 month (BCBS, 2009).
Currently, it is foreseen that the LCR proposal will be imple-mented gradually between 2015 and 2019. So far, there is littleempirical evidence on how banks have responded or will respondto such a LCR requirement. This raises the question of how the LCRrelates to existing national supervisory liquidity rules, if any, andhow the LCR relates to banks’ actual liquidity management. The
influence of liquidity regulation on bank behaviour may have widerconsequences for the financial sector, financial markets and the realeconomy. Also from that perspective, insight into the interaction be-tween liquidity regulation and bank behaviour is useful.
This paper contributes to our understanding of how banks willreact to the LCR by investigating banks’ actual liquidity managementunder the quantitative liquidity requirement that has been opera-tional in the Netherlands since 2003, which resembles the Basel IIIproposal. Under the Dutch liquidity regulation, a bank’s actualliquidity must exceed required liquidity, at horizons of both 1 weekand 1 month. Actual liquidity is defined as the stock of liquid assetsminus haircuts plus anticipated cash inflows weighted by the degreeof liquidity. Required liquidity is defined as the anticipated calls oncontingent liquidity lines, anticipated withdrawals of deposits,anticipated drying up of wholesale funding and derivative fundingduring a period of combined market and idiosyncratic stress. TheDutch liquidity requirement, the so-called Liquidity Balance (LB)rule, conceptually resembles the LCR under Basle III.
We examine banks’ liquidity management under the Dutch LBrule. Our sample contains 62 Dutch banks, taking account of nearly99% of total assets of the Dutch banking sector, and our sampleperiod is January 2004 to March 2010, after which the Dutch reg-ulatory system was changed.
Our contribution is the first to relate liquid asset holdings bybanks to the full maturity ladder of future cash flows. The empiri-cal literature until now has not considered maturity transforma-tion as a determinant of banks’ liquid asset holdings. This seemsstriking as liquidity transformation, and the liquidity risk resulting
L. de Haan, J.W. van den End / Journal of Banking & Finance 37 (2013) 3930–3950 3931
from it, is the primary reason for banks to hold liquid assets (Good-hart, 2008). To estimate our model, we use unique monthly data onliquid assets and liabilities and scheduled cash flows for maturitiesranging from 1 month to beyond 1 year. In addition, we confrontthe estimated relationship with the relationships implied by Dutchand international liquidity rules, which link required liquid assetholdings to future cash flows for the coming month. Finally, weexamine the effects of the crisis and bank characteristics, as wellas their interaction, on liquidity management.
The paper is structured as follows. After a short literature re-view, we discuss the liquidity regulation that has been operativesince 2003 in the Netherlands and compare the Dutch system withthe proposed system under Basel III. Next, we present a model ofbanks’ liquidity management, according to which banks hold liquidassets as a buffer against maturity mismatch risk. After discussingthe data, we estimate this model and subsequently examine howthe estimated model relates to both Dutch regulation and regula-tion as proposed under Basel III. Then, we examine whether liquid-ity management was different before and during the crisis. Finally,we test how bank characteristics affect liquidity management, fol-lowed by the conclusion.
2. Literature review
Maturity mismatches are inherent to banks, owing to the trans-formation of liquid liabilities (e.g. deposits) into illiquid assets (e.g.long-term loans). This gives rise to market and funding liquidityrisk, as shown by Diamond and Dybvig (1983). Market liquidityrisk relates to the ability to convert assets into cash at a given priceat short notice, while funding liquidity risk refers to the ability toraise cash to fund asset holdings. Rajan and Bird (2003) demon-strate that maturity transformation is inherent to banks and doesnot depend on implicit safety nets.
Aspachs et al. (2005) analyse the liquidity policy of 57 UK banksover the period 1985Q1 to 2003Q4 and find that the greater the po-tential support from the central bank in case of liquidity crises, thelower the liquidity buffer the banks hold (support is measured asthe pseudo-probability of bail-out, based on the Fitch support rat-ing). Their result raises the issue that activation of the lender of lastresort (LoLR) function encourages moral hazard. Mink (2011) arguesthat through facilitating maturity transformation, the lender of lastresort gives banks an incentive to lever, diversify, and lower theirlending standards. In the recent crisis, many banks, having insuffi-cient liquid assets as first line of defence, have become dependenton LoLR financing. Liquidity regulation aims to address this.
Bonner et al. (2013), using balance sheet data for 7000 banksfrom 24 OECD countries in 1998–2007, find that the main driversof the observed variation in liquid reserves are banks’ businessmodel and size, deposit holdings as well as the intensity of disclo-sure requirements.
Liquidity buffers also reduce the probability and severity of sys-temic liquidity stress. They can prevent negative externalities due toasset fire sales, deleveraging, liquidity hoarding and restriction of cred-it, which may arise if banks have liquidity problems. By this, liquiditybuffers are complementary to capital buffers, in particular countercy-clical capital buffers as applied in Spain (Saurina, 2009). For that reasonthe social optimum for bank liquidity buffers usually lies higher thanthe private optimum (Acharya et al., 2009). However, in an extreme sit-uation characterised by dysfunctional markets and elevated levels ofsystemic risk, the liquidity requirement can become a binding con-straint that precipitates the undesirable externalities that the regu-lation seeks to mitigate (Van den End and Kruidhof, 2013).
Chadha and Corrado (2012), presenting a DSGE model wherebanks have an endogenous choice over holdings of liquid assets,show that the presence of incentives to increase liquid assets dur-
ing economic expansions and reduce such holdings during contrac-tions would be beneficial to the economy.
Schertler (2010), using quarterly data for 2000 German banksfrom 2000-III to 2008-IV, examines banks’ adjustment of securitiesholdings, loan repayments and long-term lending, respectively, inresponse to payment obligations in the coming month. She finds thatmost banks perform ‘asset-side accounting exchanges’ by reducingtheir new long-term loans when they need more liquid assets. Holland Schertler’s (2009) model relates (changes in) liquid asset hold-ings of German savings banks to (sight) deposits and other short-term payment obligations, plus a number of controls. Using monthlydata from July 2000 to December 2006, they find that German sav-ings banks hold more liquid assets than required by regulation espe-cially when they extend relatively few loans to non-banks.
Murta and Garcia (2010) estimate a model for excess reserveholdings for the aggregate of banks in the euro area, using dailydata from April 2004 till December 2008. They use as explanatoryvariables: the spread (between Euribor and the minimum rate ofMRO), the excess reserve holdings of the previous week, and aset of dummy variables capturing end-of-month and end-of-re-serve-maintenance-period effects as well as a crisis dummy. Theseauthors find that precautionary liquidity buffers are motivated byfinancing costs and they do not find evidence that the crisis af-fected the demand for excess reserves.
It is quite striking that the empirical studies do not considermaturity transformation as a determinant of banks’ liquid assetholdings even though liquidity transformation, and the liquidityrisk resulting from it, is the primary reason for banks to hold liquidassets (Goodhart, 2008). Maturity transformation is hard to mea-sure, however. Moreover, data on maturities of banks’ assets andliabilities is scarce. Deep and Schaefer (2004) proxy liquidity trans-formation by the difference between liquid liabilities and liquid as-sets as a percentage of total assets, which they call the liquiditytransformation gap. Berger and Bouwman (2009), focusing on theextent to which banks transform illiquid assets into liquid liabili-ties, construct (four) liquidity creation measures, by classifyingbank assets and liabilities as liquid, semi-liquid, or illiquid, andweighting these together. Both studies do not use actual maturitydata. To the best of our knowledge, the only study employingmaturity data is Gambacorta and Mistrulli (2004), who show thedevelopment of the weighted average for the maturity of Italianbank assets and liabilities.
Our contribution is to estimate empirically a model relating li-quid asset holdings by banks to the full maturity ladder of futurecash flows, using unique monthly data on maturity buckets rangingfrom 1 month to beyond 1 year. We confront the estimated empiri-cal relationship with the relationship implied by Dutch and interna-tional liquidity rules. Further, we examine the effects of the crisisand bank characteristics on banks’ liquidity management.
3. Liquidity regulation
3.1. Dutch regulation
In 2003, the Dutch banking regulator introduced a new quanti-tative liquidity supervisory system. According to this regulation,banks should have a so-called Liquidity Balance (LB) greater thanor equal to zero at all times. The liquidity balance, LB, is defined as:
LB ¼ Available liquidity� Required liquidityRequired liquidity
ð1Þ
where
Available liquidity ¼Weighted stock of liquid assets
þWeighted cash inflow scheduled within the
coming month ð2Þ
3932 L. de Haan, J.W. van den End / Journal of Banking & Finance 37 (2013) 3930–3950
and
Required liquidity ¼Weighted stock of liquid liabilities
þWeighted cash outflow scheduled within the
coming month ð3Þ
Hence, for the numerator of (1) we can write:
Weighted stock of liquid assets
�Weighted stock of liquid liabilities
þWeighted cash inflow scheduled within the coming month
�Weighted cash outflow scheduled within the coming month
ð4Þ
The adjective ‘weighted’ refers to the fact that the items areweighted according to their liquidity and withdrawal rates. Thiswill be explained below. First, we elucidate the nature of the itemsthemselves. The stock of liquid assets consists of banks’ assets thatcan be turned into cash on short notice, such as liquid bonds andasset-backed securities. The stock of liquid liabilities consists ofbanks’ debt that can be called upon immediately, such as demanddeposits without a fixed term. Cash inflows are receipts of pay-ments due within 1 month, for example, 1 month reverse repotransactions. Cash outflows scheduled within the coming monthare payments that are due within 1 month, for example, 1-monthtime deposits.
Concerning the weightings applied, the regulator takes into ac-count both market and funding liquidity risks, by applying so-called regulatory weights on assets, liabilities, cash inflows andoutflows. Liquid assets and cash inflows are weighted by theirliquidity in times of stress. For example, asset-backed securitiesget a lower weight than high-quality bonds (or, stated differently,get a larger haircut). Thus, the regulator accounts for the risk thatin case of financial stress, market liquidity may be so low that cer-tain assets can only be sold immediately at a loss. Liquid liabilitiesand cash outflows are also weighted to reflect the probability ofwithdrawal. In this way, the regulator accounts for differences infunding liquidity risk between, for example, retail deposits andwholesale deposits. The weights, dictated by the regulator, havebeen kept fixed during the sample period. The regulatory weightsfor all liquid assets, liabilities, and cash flows are given in AppendixA.1 To give some numerical examples: fixed-term savings deposits ofhouseholds are weighted by a run-off rate of 20% and lower qualitycorporate bonds get a haircut of 20%. Banks know their liquidity po-sition vis-à-vis the regulatory requirements.
According to (4), LB can be written as a function of liquid assets,liabilities, cash flows and regulatory weights:
LBit ¼X
j
aj � ASSETijt �X
k
bk � LIABikt þX
l
cM¼1l � INFLOWM¼1
ilt
�X
m
dM¼1m � OUTFLOWM¼1
imt ð5Þ
ASSETijt denotes j liquid asset items and LIABikt k liquid liabilityitems for bank i at time t. Both are stock items without an agreedpayment schedule. INFLOWM¼1
ilt denotes l cash inflow items withmaturities of 1 month and less and OUTFLOWM¼1
imt m cash outflowitems with maturities of 1 month and less (hence, suffix ‘M = 1’).Both are payments scheduled to take place within the comingmonth. aj; bk; cM¼1
l ; dM¼1m are the respective regulatory weights,
which are constant over time.The regulator requires the banks to have a liquidity balance
greater than or equal to zero:
LBit P 0 ð6Þ
1 See Van den End and Tabbae (2012) for background information on these weights.
For our purposes, we rewrite the regulatory requirements interms of the minimum required liquid asset holdings. To achievethis, we combine and rearrange Eqs. (5) and (6) and summarizeover all j assets, k liabilities, l cash inflows and m cash outflows,to get the following expression for the minimum required holdingsof liquid assets:
ARit ¼ bLB
it Lit þ kLBit IM¼1
it þ lLBit OM¼1
it ð7Þ
where
ARit ¼X
j
ASSETijt; Lit ¼X
k
LIABikt; Iit ¼X
l
INFLOWM¼1ilt ;
Oit ¼X
m
OUTFLOWM¼1imt ;
bLBit ¼
Pkbk � LIABiktP
kLIABikt
�Pjaj � ASSETijtP
jASSETijt; kLB
it ¼P
lcM¼1l � INFLOWM¼1
iltPl INFLOWM¼1
ilt
,Pjaj � ASSETijtP
jASSETijt;
lLBit ¼
Pjd
M¼1m � OUTFLOWM¼1
imtPmOUTFLOWM¼1
imt
,Pjaj � ASSETijtP
jASSETijt
(7) gives the minimum required liquid asset holdings ARit of bank i at
time t, given the size and composition of liquid liabilities, cash in-flows and outflows up to 1 month, and given the regulatoryweights. Coefficients bLB
it ; kLBit ;lLB
it are hypothetical, in that they relateliquid liabilities, cash inflows and cash outflows to the stock of li-quid assets under the assumption that banks hold exactly the min-imum required levels of stock liquid assets at all times; no more, noless. In the remainder of this paper we will denote them as ‘regula-tory coefficients’. Note that these regulatory coefficients are ratiosof weighted averages of the respective constant regulatory weightsaj; bk; cM¼1
l ; dM¼1m , with the relative shares of the different balance
sheet and cash flow items as weights. As the composition of balancesheet and cash flows may differ between banks and change overtime, these regulatory coefficients vary over time t and across banksi as well.
3.2. Basel III
The new Basel III regulation foresees two ratios for monitoringbank liquidity: the Liquidity Coverage Ratio (LCR) and the Net Sta-ble Funding Ratio (NSFR). The LCR is defined as:
LCR ¼ Stock of high-quality liquid assetsNetcash outflows scheduled within 1 month
ð8Þ
Using the same notation as for LB, the LCR can be written as:
LCRit ¼P
jej � ASSETijtPkfk � LIABikt �
PmgM¼1
l � INFLOWM¼1ilt þ
PmhM¼1
m � OUTFLOWM¼1imt
ð9Þ
As mentioned in Section 3.1, LIABikt are stock items without anagreed payment schedule, such as demand deposits. By applyinganticipated run-off rates fk to such items they are de facto trans-formed into cash outflows. The regulator requires the banks tohave an LCR greater than or equal to 1 at all times:
LCRit P 1 ð10Þ
Combining Eqs. (9) and (10) and rearranging, we get the follow-ing expression for the minimum required holdings of liquid assets:
ARit ¼ bLCR
it Lit þ kLCRit IM¼1
it þ lLCRit OM¼1
it ð11Þ
Thus, we now have two regulatory rules, (7) for Dutch regula-tion and (11) for Basel III, which are almost identical except forthe coefficients (which are therefore equipped with suffixes ‘LB’and ‘LCR’, respectively). This is because the regulatory weights
L. de Haan, J.W. van den End / Journal of Banking & Finance 37 (2013) 3930–3950 3933
under the LCR may differ from those under the LB rule. For exam-ple, the composition of the stock of high-quality liquid assets is de-fined more narrowly under the LCR than under the LB (cf. thetables for LB and LCR, respectively, in Appendix A).
The 1 month horizon of the LCR (and the Dutch LB) is too shortto cope with a prolonged liquidity crisis. This requires that banksmatch their maturity profile of assets and liabilities over the matu-rity ladder that goes beyond 1 month. This is taken into account inthe NSFR, which establishes a minimum acceptable amount of sta-ble funding based on the liquidity characteristics of a bank’s assetsand activities over a 1 year horizon.2 In the remainder of the paper,we focus on LCR and LB.
3.3. Dutch liquidity regulation in the euro area context
The Basel III framework – and its formalisation in EuropeanDirectives – is a first attempt to create an international harmonisedliquidity requirement. The Dutch supervisory liquidity require-ment has been a forerunner. The Dutch regulation dates from2003, when the then existing system was revised to reflect theinternationalization of the banking sector (the scope of the systemwas broadened to the consolidated group level) and the increasedneed to analyse short-term cash flows and off-balance-sheet items.The weights in the Dutch regulation that determine the actual andrequired liquidity of a bank are fixed values and reflect a mix offirm-specific and market wide considerations (DNB, 2003). Theyare based on best practices and values of haircuts on assets andrun-off rates of liabilities typically used by the industry and ratingagencies.
Liquidity requirements are intended as self-insurance for banksto liquidity shocks, next to the insurance provided by the interbankmarket. In the euro area interbank market, bank reserves that areoriginally provided by the Eurosystem of central banks throughmain and longer-term refinancing operations are reallocated.Dutch banks in particular have been dependent on this market gi-ven their domestic retail savings gap; in 2008 foreign counterpar-ties accounted for 80% of their interbank borrowing (Liedorp et al.,2010). Since the crisis the euro area interbank market has dried upand liquidity support by the central bank has become more impor-tant. The Eurosystem operates under a common monetary policyframework for regular refinancing operations conducted throughopen market transactions. Emergency liquidity assistance to illiq-uid but solvent banks is provided by national central banks whichhave some discretion on the modalities of this financing. Whileliquidity requirements are set by the supervisor, the central bankhas a clear interest that liquidity buffers are a sufficient first lineof defence against liquidity shocks to prevent banks to rely onthe central bank too early.
4. Stock liquidity, maturity transformation, and the maturityladder
Maturity transformation is risky, because it implies a maturitymismatch between the assets and the liabilities on the bank’s bal-ance sheet. This is the reason for a bank to hold a buffer stock ofliquidity, i.e. high quality assets which can be sold or pledgedimmediately or at short notice.
In principle, the capacity for maturity transformation is greaterwhen a bank holds a larger stock of liquid assets, since the fundingpressure can be met by selling or pledging these assets. As Good-hart (2008, p. 43) states: ‘‘There is a trade-off between stock liquid-
2 For example, see López-Espinosa et al. (2012) whose findings that short-termwholesale funding emerges as the most relevant systemic factor support the BaselCommittee’s proposal to introduce a net stable funding ratio.
ity and maturity transformation. What, perhaps, we need is a menuof relationships between stock liquidity and maturity transforma-tion, such as if maturity transformation is measured from 0 (notransformation) to infinite, and stock liquidity is measured as apercentage of assets (. . .)’’.
However, Goodhart (op. cit.) notes that there is an immediateproblem: ‘‘this assumes that there is a single accepted scale ofmeasurement, whether cardinal or ordinal, for both maturitytransformation and stock liquidity, and this is not so.’’ He mentionsthat one way to look at maturity transformation is by means ofmaturity ladders, where one looks at the net cash flow positionsof banks over differing horizons. He also sees some problems withthis, though. To name one (Goodhart, op. cit.): ‘‘What does one doabout retail deposits, demandable on sight but normally the moststable and reliable of all liabilities’’?
Yet, in the real world, banks do link their stock of liquid assetsto maturity ladders. According to a survey conducted by the ECB(2002, p. 23–24), ‘‘some banks tie their cash flow limits to theirstock of liquid assets, for example by imposing a minimum ratiobetween the two elements. Volume limits for individual maturitybuckets are often interrelated: lower for short-term maturitiesand higher for long-term maturities.’’ This approach is also oneof the several bank liquidity management techniques that are inuse as discussed by Van Greuning and Brajovic Bratanovic (2000,p. 167): ‘‘Liquid assets actually held can then be compared to thelocal currency value of the short-term mismatch in order to assesshow much of the latter is in fact covered by a buffer stock of high-quality liquid assets.’’
The bank liquid assets management model of Baltensperger(1980), as expounded by Freixas and Rochet (2008, Section 8.2.1),illustrates the principle of the optimal liquid asset holdings for abank. In this model, a bank allocates a given amount of depositsL between liquid assets A and illiquid credit C (see Balance sheetI in Fig. 1, panel A). The bank is subject to withdrawal risk of depos-its. The amount of withdrawals at the end of the period is a randomvariable eO. If deposits partly consist of time deposits with a matu-rity of one period, cash outflow eO may also consist of time depositsnot being rolled over.
We can bring credit C to the right hand side of the balance sheet,and denote (L–C) ‘net liabilities’ (Balance sheet II in Fig. 1, panel B). Ifwe assume that loans are scheduled to be repaid at the end of theperiod, we get the anticipated cash infloweI. Net cash flow is definedas cash inflow minus cash outflow: eZ ¼ eI � eO, which is also random.The bank has an estimated density function of the cash flow f ðeZÞ.
There is a liquidity shortfall if the realization Z of eZ exceeds thebeginning-of-period level of liquid assets A. Such a shortfall makescertain costly adjustments necessary for the bank, such as emer-gency borrowing or selling of loans. These costs are assumed tobe proportional to the size of the liquidity shortfall rp(Z � A), whererp is the ‘penalty rate’. The penalty rate will presumably also reflectthe cost and ease of the liquidity provision from both the centralbank and the interbank market.
Then, the expected cost of a liquidity shortfall isR L�C
A rpðZ � AÞf ðZÞdZ. The rate of return on credit (net of all costs includingadministration and information costs) rC is assumed to be higherthan the interest rate r received on liquid assets. Then, the oppor-tunity cost of holding liquid assets is (rC � r)A.
Differentiating the cost of a liquidity shortfall with respect to li-quid asset holdings A yields �rp
R L�CA f ðZÞdZ < 0. The optimal quan-
tity of liquid asset holdings for a bank will equate the marginalopportunity cost of liquid asset holdings, (rC � r), to their marginal‘return’, i.e. the marginal reduction of the cost of a liquidity short-fall rp
R L�CA f ðZÞdZ.
This is a general rule that is used widely. For instance, Chadhaand Corrado (2012) apply the rule in their macroeconomicDSGE model, where the deviation of reserve requirements from
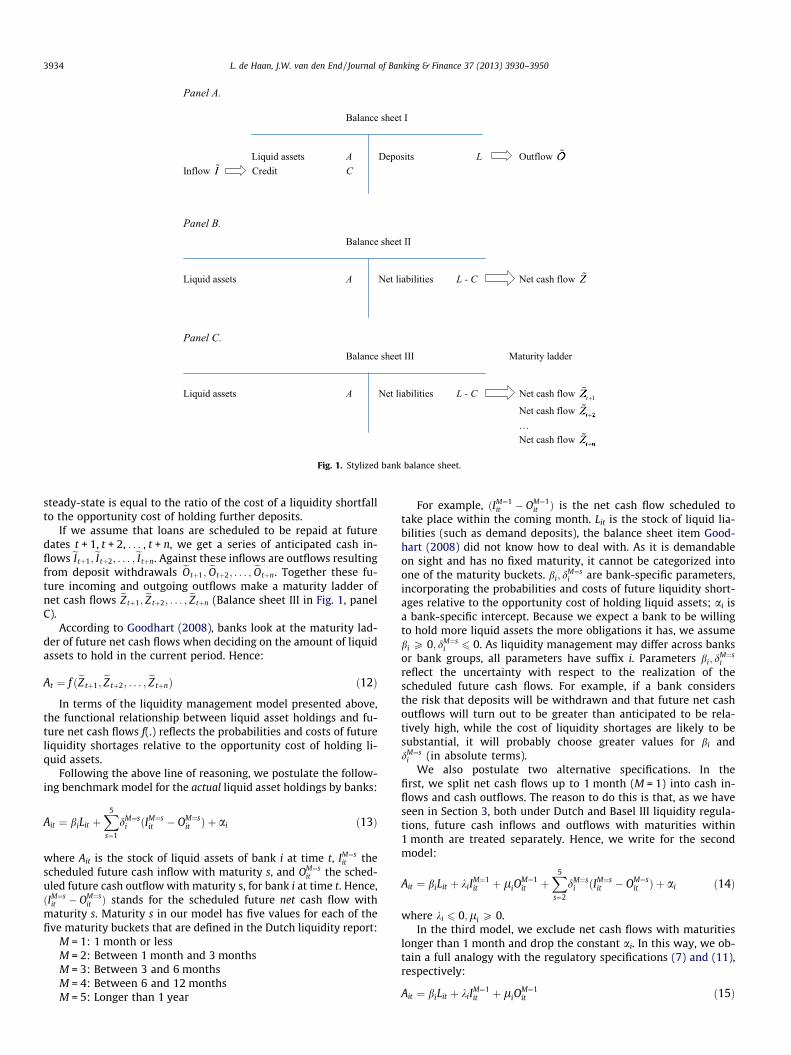
Fig. 1. Stylized bank balance sheet.
3934 L. de Haan, J.W. van den End / Journal of Banking & Finance 37 (2013) 3930–3950
steady-state is equal to the ratio of the cost of a liquidity shortfallto the opportunity cost of holding further deposits.
If we assume that loans are scheduled to be repaid at futuredates t + 1, t + 2, . . . , t + n, we get a series of anticipated cash in-flows eItþ1;eItþ2; . . . ;eItþn. Against these inflows are outflows resultingfrom deposit withdrawals eOtþ1; eOtþ2; . . . ; eOtþn. Together these fu-ture incoming and outgoing outflows make a maturity ladder ofnet cash flows eZtþ1; eZtþ2; . . . ; eZtþn (Balance sheet III in Fig. 1, panelC).
According to Goodhart (2008), banks look at the maturity lad-der of future net cash flows when deciding on the amount of liquidassets to hold in the current period. Hence:
At ¼ f ðeZtþ1; eZtþ2; . . . ; eZtþnÞ ð12Þ
In terms of the liquidity management model presented above,the functional relationship between liquid asset holdings and fu-ture net cash flows f(.) reflects the probabilities and costs of futureliquidity shortages relative to the opportunity cost of holding li-quid assets.
Following the above line of reasoning, we postulate the follow-ing benchmark model for the actual liquid asset holdings by banks:
Ait ¼ biLit þX5
s¼1
dM¼si ðIM¼s
it � OM¼sit Þ þ ai ð13Þ
where Ait is the stock of liquid assets of bank i at time t, IM¼sit the
scheduled future cash inflow with maturity s, and OM¼sit the sched-
uled future cash outflow with maturity s, for bank i at time t. Hence,ðIM¼s
it � OM¼sit Þ stands for the scheduled future net cash flow with
maturity s. Maturity s in our model has five values for each of thefive maturity buckets that are defined in the Dutch liquidity report:
M = 1: 1 month or lessM = 2: Between 1 month and 3 monthsM = 3: Between 3 and 6 monthsM = 4: Between 6 and 12 monthsM = 5: Longer than 1 year
For example, ðIM¼1it � OM¼1
it Þ is the net cash flow scheduled totake place within the coming month. Lit is the stock of liquid lia-bilities (such as demand deposits), the balance sheet item Good-hart (2008) did not know how to deal with. As it is demandableon sight and has no fixed maturity, it cannot be categorized intoone of the maturity buckets. bi; d
M¼si are bank-specific parameters,
incorporating the probabilities and costs of future liquidity short-ages relative to the opportunity cost of holding liquid assets; ai isa bank-specific intercept. Because we expect a bank to be willingto hold more liquid assets the more obligations it has, we assumebi P 0; dM¼s
i 6 0. As liquidity management may differ across banksor bank groups, all parameters have suffix i. Parameters bi; d
M¼si
reflect the uncertainty with respect to the realization of thescheduled future cash flows. For example, if a bank considersthe risk that deposits will be withdrawn and that future net cashoutflows will turn out to be greater than anticipated to be rela-tively high, while the cost of liquidity shortages are likely to besubstantial, it will probably choose greater values for bi anddM¼s
i (in absolute terms).We also postulate two alternative specifications. In the
first, we split net cash flows up to 1 month (M = 1) into cash in-flows and cash outflows. The reason to do this is that, as we haveseen in Section 3, both under Dutch and Basel III liquidity regula-tions, future cash inflows and outflows with maturities within1 month are treated separately. Hence, we write for the secondmodel:
Ait ¼ biLit þ kiIM¼1it þ liO
M¼1it þ
X5
s¼2
dM¼si ðIM¼s
it � OM¼sit Þ þ ai ð14Þ
where ki 6 0;li P 0.In the third model, we exclude net cash flows with maturities
longer than 1 month and drop the constant ai. In this way, we ob-tain a full analogy with the regulatory specifications (7) and (11),respectively:
Ait ¼ biLit þ kiIM¼1it þ liO
M¼1it ð15Þ
L. de Haan, J.W. van den End / Journal of Banking & Finance 37 (2013) 3930–3950 3935
Note that Eq. (15) deals with actual liquid asset holdings, Ait,whereas (7) and (11) are equations for the minimum required liquidasset holdings, AR
it . Hence, the coefficients in (15) do not have suffixes‘LB’ or ‘LCR’ as they reflect liquidity management, not regulation.
Before we estimate these alternative models, we first discussthe data.
Fig. 2. Stock liquidity and scheduled future cash flows, aggregated over all banks(all series are fractions of total assets).
5. Data
We use monthly consolidated data on liquid assets, liabilities,cash inflows and outflows of Dutch banks over the period January2004 to March 2010, the last month in which the Dutch regulatorysystem was left unchanged. This period encompasses both the pre-crisis and the crisis period. Our variables of interest are summa-rized and defined in Appendix B. All balance sheet variables havebeen scaled by total assets, to remove any trends.
The data source is De Nederlandsche Bank’s (DNB) prudentialliquidity report (DNB, 2003). This data source contains end-of-month data on liquid assets, liabilities and cash flows for all Dutchbanks (including branches and foreign branches) under supervision,with a detailed breakdown per balance sheet item. These data areunique for two reasons. First, there is information on the maturitiesof the expected cash inflows and outflows in case there is an under-lying payment schedule. The maturity buckets are as defined in Sec-tion 4: (1) 1 month or less, (2) between 1 month and 3 months, (3)between 3 and 6 months, (4) between 6 and 12 months, and (5)longer than 1 year. Second, there is detailed information on the reg-ulatory weights of all asset, liability and cash flow items.
Not every item is reported by every bank, since some banks donot have exposures in all categories. Also, the data is highly unbal-anced. For that reason, we use data of 62 banks out of a total of 107,for which data is mostly available for the whole sample period. Oursample of 62 banks accounts for 99% of total assets of all banks andconsists of four types of banks. First, there is the ‘top-5’ group con-sisting of the five largest Dutch banks: ABN Amro, ING, Fortis, Raboand SNS.3 These five banks take account of 85% of the Dutch bankingsector’s total assets. The second group of 19 ‘other Dutch banks’comprises a diverse group of medium-sized institutions. The restof the sample consists of foreign banks: 19 ‘foreign subsidiaries’ formthe third group, and 19 ‘foreign branches’ make up the fourth group.Foreign branches can rely on their mother bank for liquidity supportand may therefore show very different behaviour. For instance, theymay have less need for self-insurance by holding liquid asset buffers,since in stressed markets they can resort to liquidity lines providedby the mother bank (Heijmans, 2012).
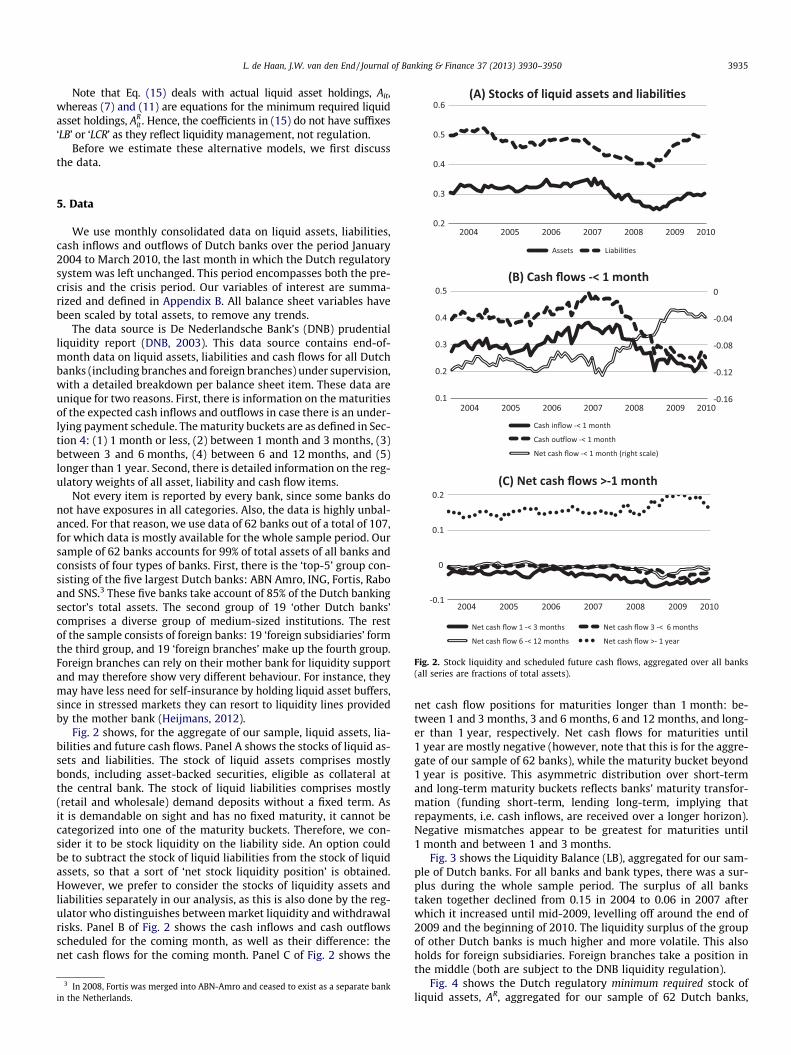
Fig. 2 shows, for the aggregate of our sample, liquid assets, lia-bilities and future cash flows. Panel A shows the stocks of liquid as-sets and liabilities. The stock of liquid assets comprises mostlybonds, including asset-backed securities, eligible as collateral atthe central bank. The stock of liquid liabilities comprises mostly(retail and wholesale) demand deposits without a fixed term. Asit is demandable on sight and has no fixed maturity, it cannot becategorized into one of the maturity buckets. Therefore, we con-sider it to be stock liquidity on the liability side. An option couldbe to subtract the stock of liquid liabilities from the stock of liquidassets, so that a sort of ‘net stock liquidity position’ is obtained.However, we prefer to consider the stocks of liquidity assets andliabilities separately in our analysis, as this is also done by the reg-ulator who distinguishes between market liquidity and withdrawalrisks. Panel B of Fig. 2 shows the cash inflows and cash outflowsscheduled for the coming month, as well as their difference: thenet cash flows for the coming month. Panel C of Fig. 2 shows the
3 In 2008, Fortis was merged into ABN-Amro and ceased to exist as a separate bankin the Netherlands.
net cash flow positions for maturities longer than 1 month: be-tween 1 and 3 months, 3 and 6 months, 6 and 12 months, and long-er than 1 year, respectively. Net cash flows for maturities until1 year are mostly negative (however, note that this is for the aggre-gate of our sample of 62 banks), while the maturity bucket beyond1 year is positive. This asymmetric distribution over short-termand long-term maturity buckets reflects banks’ maturity transfor-mation (funding short-term, lending long-term, implying thatrepayments, i.e. cash inflows, are received over a longer horizon).Negative mismatches appear to be greatest for maturities until1 month and between 1 and 3 months.
Fig. 3 shows the Liquidity Balance (LB), aggregated for our sam-ple of Dutch banks. For all banks and bank types, there was a sur-plus during the whole sample period. The surplus of all bankstaken together declined from 0.15 in 2004 to 0.06 in 2007 afterwhich it increased until mid-2009, levelling off around the end of2009 and the beginning of 2010. The liquidity surplus of the groupof other Dutch banks is much higher and more volatile. This alsoholds for foreign subsidiaries. Foreign branches take a position inthe middle (both are subject to the DNB liquidity regulation).
Fig. 4 shows the Dutch regulatory minimum required stock ofliquid assets, AR, aggregated for our sample of 62 Dutch banks,
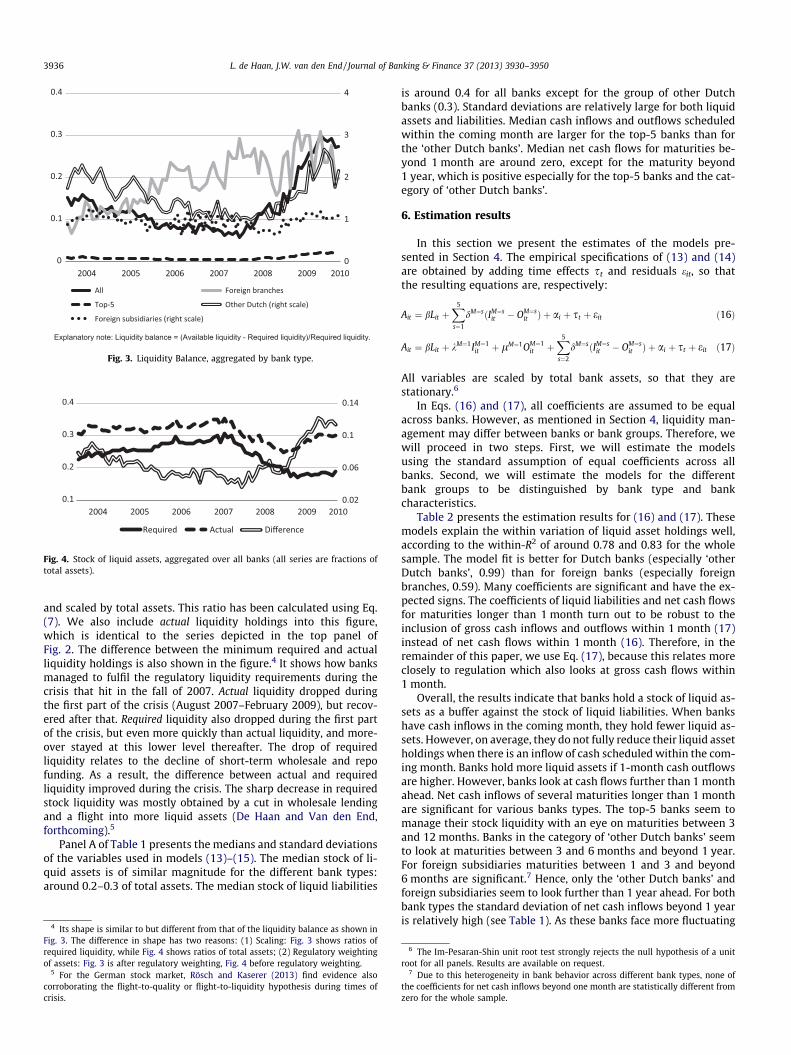
Fig. 3. Liquidity Balance, aggregated by bank type.
Fig. 4. Stock of liquid assets, aggregated over all banks (all series are fractions oftotal assets).
3936 L. de Haan, J.W. van den End / Journal of Banking & Finance 37 (2013) 3930–3950
and scaled by total assets. This ratio has been calculated using Eq.(7). We also include actual liquidity holdings into this figure,which is identical to the series depicted in the top panel ofFig. 2. The difference between the minimum required and actualliquidity holdings is also shown in the figure.4 It shows how banksmanaged to fulfil the regulatory liquidity requirements during thecrisis that hit in the fall of 2007. Actual liquidity dropped duringthe first part of the crisis (August 2007–February 2009), but recov-ered after that. Required liquidity also dropped during the first partof the crisis, but even more quickly than actual liquidity, and more-over stayed at this lower level thereafter. The drop of requiredliquidity relates to the decline of short-term wholesale and repofunding. As a result, the difference between actual and requiredliquidity improved during the crisis. The sharp decrease in requiredstock liquidity was mostly obtained by a cut in wholesale lendingand a flight into more liquid assets (De Haan and Van den End,forthcoming).5
Panel A of Table 1 presents the medians and standard deviationsof the variables used in models (13)–(15). The median stock of li-quid assets is of similar magnitude for the different bank types:around 0.2–0.3 of total assets. The median stock of liquid liabilities
4 Its shape is similar to but different from that of the liquidity balance as shown inFig. 3. The difference in shape has two reasons: (1) Scaling: Fig. 3 shows ratios ofrequired liquidity, while Fig. 4 shows ratios of total assets; (2) Regulatory weightingof assets: Fig. 3 is after regulatory weighting, Fig. 4 before regulatory weighting.
5 For the German stock market, Rösch and Kaserer (2013) find evidence alsocorroborating the flight-to-quality or flight-to-liquidity hypothesis during times ofcrisis.
is around 0.4 for all banks except for the group of other Dutchbanks (0.3). Standard deviations are relatively large for both liquidassets and liabilities. Median cash inflows and outflows scheduledwithin the coming month are larger for the top-5 banks than forthe ‘other Dutch banks’. Median net cash flows for maturities be-yond 1 month are around zero, except for the maturity beyond1 year, which is positive especially for the top-5 banks and the cat-egory of ‘other Dutch banks’.
6. Estimation results
In this section we present the estimates of the models pre-sented in Section 4. The empirical specifications of (13) and (14)are obtained by adding time effects st and residuals eit, so thatthe resulting equations are, respectively:
Ait ¼ bLit þX5
s¼1
dM¼sðIM¼sit � OM¼s
it Þ þ ai þ st þ eit ð16Þ
Ait ¼ bLit þ kM¼1IM¼1it þ lM¼1OM¼1
it þX5
s¼2
dM¼sðIM¼sit � OM¼s
it Þ þ ai þ st þ eit ð17Þ
All variables are scaled by total bank assets, so that they arestationary.6
In Eqs. (16) and (17), all coefficients are assumed to be equalacross banks. However, as mentioned in Section 4, liquidity man-agement may differ between banks or bank groups. Therefore, wewill proceed in two steps. First, we will estimate the modelsusing the standard assumption of equal coefficients across allbanks. Second, we will estimate the models for the differentbank groups to be distinguished by bank type and bankcharacteristics.
Table 2 presents the estimation results for (16) and (17). Thesemodels explain the within variation of liquid asset holdings well,according to the within-R2 of around 0.78 and 0.83 for the wholesample. The model fit is better for Dutch banks (especially ‘otherDutch banks’, 0.99) than for foreign banks (especially foreignbranches, 0.59). Many coefficients are significant and have the ex-pected signs. The coefficients of liquid liabilities and net cash flowsfor maturities longer than 1 month turn out to be robust to theinclusion of gross cash inflows and outflows within 1 month (17)instead of net cash flows within 1 month (16). Therefore, in theremainder of this paper, we use Eq. (17), because this relates moreclosely to regulation which also looks at gross cash flows within1 month.
Overall, the results indicate that banks hold a stock of liquid as-sets as a buffer against the stock of liquid liabilities. When bankshave cash inflows in the coming month, they hold fewer liquid as-sets. However, on average, they do not fully reduce their liquid assetholdings when there is an inflow of cash scheduled within the com-ing month. Banks hold more liquid assets if 1-month cash outflowsare higher. However, banks look at cash flows further than 1 monthahead. Net cash inflows of several maturities longer than 1 monthare significant for various banks types. The top-5 banks seem tomanage their stock liquidity with an eye on maturities between 3and 12 months. Banks in the category of ‘other Dutch banks’ seemto look at maturities between 3 and 6 months and beyond 1 year.For foreign subsidiaries maturities between 1 and 3 and beyond6 months are significant.7 Hence, only the ‘other Dutch banks’ andforeign subsidiaries seem to look further than 1 year ahead. For bothbank types the standard deviation of net cash inflows beyond 1 yearis relatively high (see Table 1). As these banks face more fluctuating
6 The Im-Pesaran-Shin unit root test strongly rejects the null hypothesis of a unitroot for all panels. Results are available on request.
7 Due to this heterogeneity in bank behavior across different bank types, none ofthe coefficients for net cash inflows beyond one month are statistically different fromzero for the whole sample.
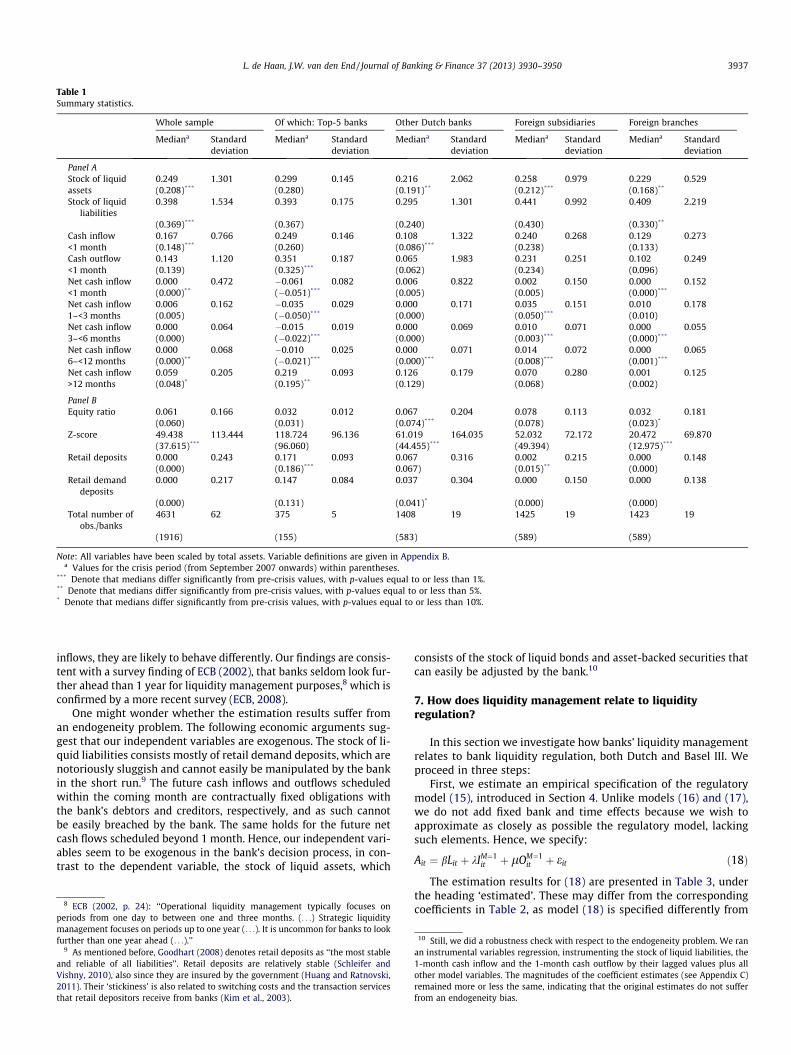
Table 1Summary statistics.
Whole sample Of which: Top-5 banks Other Dutch banks Foreign subsidiaries Foreign branches
Mediana Standarddeviation
Mediana Standarddeviation
Mediana Standarddeviation
Mediana Standarddeviation
Mediana Standarddeviation
Panel AStock of liquid 0.249 1.301 0.299 0.145 0.216 2.062 0.258 0.979 0.229 0.529assets (0.208)*** (0.280) (0.191)** (0.212)*** (0.168)**
Stock of liquidliabilities
0.398 1.534 0.393 0.175 0.295 1.301 0.441 0.992 0.409 2.219
(0.369)*** (0.367) (0.240) (0.430) (0.330)**
Cash inflow 0.167 0.766 0.249 0.146 0.108 1.322 0.240 0.268 0.129 0.273<1 month (0.148)*** (0.260) (0.086)*** (0.238) (0.133)Cash outflow 0.143 1.120 0.351 0.187 0.065 1.983 0.231 0.251 0.102 0.249<1 month (0.139) (0.325)*** (0.062) (0.234) (0.096)Net cash inflow 0.000 0.472 �0.061 0.082 0.006 0.822 0.002 0.150 0.000 0.152<1 month (0.000)** (�0.051)*** (0.005) (0.005) (0.000)***
Net cash inflow 0.006 0.162 �0.035 0.029 0.000 0.171 0.035 0.151 0.010 0.1781–<3 months (0.005) (�0.050)*** (0.000) (0.050)*** (0.010)Net cash inflow 0.000 0.064 �0.015 0.019 0.000 0.069 0.010 0.071 0.000 0.0553–<6 months (0.000) (�0.022)*** (0.000) (0.003)*** (0.000)***
Net cash inflow 0.000 0.068 �0.010 0.025 0.000 0.071 0.014 0.072 0.000 0.0656–<12 months (0.000)** (�0.021)*** (0.000)*** (0.008)*** (0.001)***
Net cash inflow 0.059 0.205 0.219 0.093 0.126 0.179 0.070 0.280 0.001 0.125>12 months (0.048)* (0.195)** (0.129) (0.068) (0.002)
Panel BEquity ratio 0.061 0.166 0.032 0.012 0.067 0.204 0.078 0.113 0.032 0.181
(0.060) (0.031) (0.074)*** (0.078) (0.023)*
Z-score 49.438 113.444 118.724 96.136 61.019 164.035 52.032 72.172 20.472 69.870(37.615)*** (96.060) (44.455)*** (49.394) (12.975)***
Retail deposits 0.000 0.243 0.171 0.093 0.067 0.316 0.002 0.215 0.000 0.148(0.000) (0.186)*** 0.067) (0.015)** (0.000)
Retail demanddeposits
0.000 0.217 0.147 0.084 0.037 0.304 0.000 0.150 0.000 0.138
(0.000) (0.131) (0.041)* (0.000) (0.000)Total number of
obs./banks4631 62 375 5 1408 19 1425 19 1423 19
(1916) (155) (583) (589) (589)
Note: All variables have been scaled by total assets. Variable definitions are given in Appendix B.a Values for the crisis period (from September 2007 onwards) within parentheses.
*** Denote that medians differ significantly from pre-crisis values, with p-values equal to or less than 1%.** Denote that medians differ significantly from pre-crisis values, with p-values equal to or less than 5%.* Denote that medians differ significantly from pre-crisis values, with p-values equal to or less than 10%.
L. de Haan, J.W. van den End / Journal of Banking & Finance 37 (2013) 3930–3950 3937
inflows, they are likely to behave differently. Our findings are consis-tent with a survey finding of ECB (2002), that banks seldom look fur-ther ahead than 1 year for liquidity management purposes,8 which isconfirmed by a more recent survey (ECB, 2008).
One might wonder whether the estimation results suffer froman endogeneity problem. The following economic arguments sug-gest that our independent variables are exogenous. The stock of li-quid liabilities consists mostly of retail demand deposits, which arenotoriously sluggish and cannot easily be manipulated by the bankin the short run.9 The future cash inflows and outflows scheduledwithin the coming month are contractually fixed obligations withthe bank’s debtors and creditors, respectively, and as such cannotbe easily breached by the bank. The same holds for the future netcash flows scheduled beyond 1 month. Hence, our independent vari-ables seem to be exogenous in the bank’s decision process, in con-trast to the dependent variable, the stock of liquid assets, which
8 ECB (2002, p. 24): ‘‘Operational liquidity management typically focuses onperiods from one day to between one and three months. (. . .) Strategic liquiditymanagement focuses on periods up to one year (. . .). It is uncommon for banks to lookfurther than one year ahead (. . .).’’
9 As mentioned before, Goodhart (2008) denotes retail deposits as ‘‘the most stableand reliable of all liabilities’’. Retail deposits are relatively stable (Schleifer andVishny, 2010), also since they are insured by the government (Huang and Ratnovski,2011). Their ‘stickiness’ is also related to switching costs and the transaction servicesthat retail depositors receive from banks (Kim et al., 2003).
consists of the stock of liquid bonds and asset-backed securities thatcan easily be adjusted by the bank.10
7. How does liquidity management relate to liquidityregulation?
In this section we investigate how banks’ liquidity managementrelates to bank liquidity regulation, both Dutch and Basel III. Weproceed in three steps:
First, we estimate an empirical specification of the regulatorymodel (15), introduced in Section 4. Unlike models (16) and (17),we do not add fixed bank and time effects because we wish toapproximate as closely as possible the regulatory model, lackingsuch elements. Hence, we specify:
Ait ¼ bLit þ kIM¼1it þ lOM¼1
it þ eit ð18Þ
The estimation results for (18) are presented in Table 3, underthe heading ‘estimated’. These may differ from the correspondingcoefficients in Table 2, as model (18) is specified differently from
10 Still, we did a robustness check with respect to the endogeneity problem. We ranan instrumental variables regression, instrumenting the stock of liquid liabilities, the1-month cash inflow and the 1-month cash outflow by their lagged values plus allother model variables. The magnitudes of the coefficient estimates (see Appendix C)remained more or less the same, indicating that the original estimates do not sufferfrom an endogeneity bias.
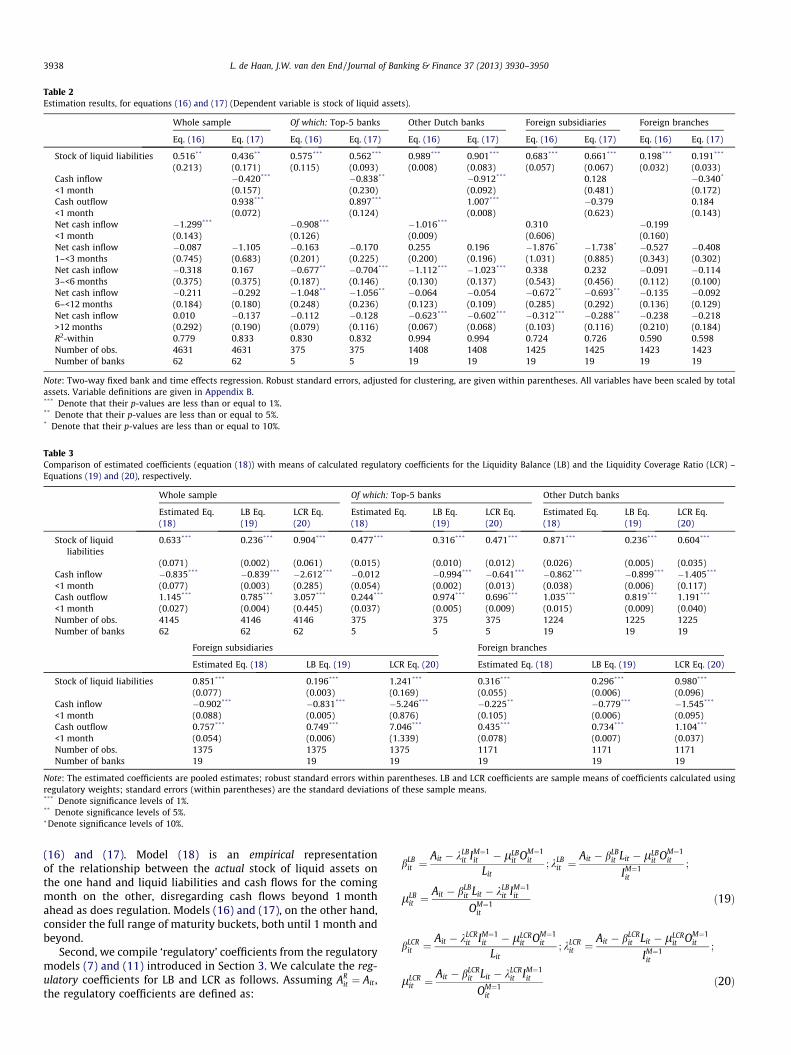
Table 2Estimation results, for equations (16) and (17) (Dependent variable is stock of liquid assets).
Whole sample Of which: Top-5 banks Other Dutch banks Foreign subsidiaries Foreign branches
Eq. (16) Eq. (17) Eq. (16) Eq. (17) Eq. (16) Eq. (17) Eq. (16) Eq. (17) Eq. (16) Eq. (17)
Stock of liquid liabilities 0.516** 0.436** 0.575*** 0.562*** 0.989*** 0.901*** 0.683*** 0.661*** 0.198*** 0.191***
(0.213) (0.171) (0.115) (0.093) (0.008) (0.083) (0.057) (0.067) (0.032) (0.033)Cash inflow �0.420*** �0.838** �0.912*** 0.128 �0.340*
<1 month (0.157) (0.230) (0.092) (0.481) (0.172)Cash outflow 0.938*** 0.897*** 1.007*** �0.379 0.184<1 month (0.072) (0.124) (0.008) (0.623) (0.143)Net cash inflow �1.299*** �0.908*** �1.016*** 0.310 �0.199<1 month (0.143) (0.126) (0.009) (0.606) (0.160)Net cash inflow �0.087 �1.105 �0.163 �0.170 0.255 0.196 �1.876* �1.738* �0.527 �0.4081–<3 months (0.745) (0.683) (0.201) (0.225) (0.200) (0.196) (1.031) (0.885) (0.343) (0.302)Net cash inflow �0.318 0.167 �0.677** �0.704*** �1.112*** �1.023*** 0.338 0.232 �0.091 �0.1143–<6 months (0.375) (0.375) (0.187) (0.146) (0.130) (0.137) (0.543) (0.456) (0.112) (0.100)Net cash inflow �0.211 �0.292 �1.048** �1.056** �0.064 �0.054 �0.672** �0.693** �0.135 �0.0926–<12 months (0.184) (0.180) (0.248) (0.236) (0.123) (0.109) (0.285) (0.292) (0.136) (0.129)Net cash inflow 0.010 �0.137 �0.112 �0.128 �0.623*** �0.602*** �0.312*** �0.288** �0.238 �0.218>12 months (0.292) (0.190) (0.079) (0.116) (0.067) (0.068) (0.103) (0.116) (0.210) (0.184)R2-within 0.779 0.833 0.830 0.832 0.994 0.994 0.724 0.726 0.590 0.598Number of obs. 4631 4631 375 375 1408 1408 1425 1425 1423 1423Number of banks 62 62 5 5 19 19 19 19 19 19
Note: Two-way fixed bank and time effects regression. Robust standard errors, adjusted for clustering, are given within parentheses. All variables have been scaled by totalassets. Variable definitions are given in Appendix B.*** Denote that their p-values are less than or equal to 1%.** Denote that their p-values are less than or equal to 5%.* Denote that their p-values are less than or equal to 10%.
Table 3Comparison of estimated coefficients (equation (18)) with means of calculated regulatory coefficients for the Liquidity Balance (LB) and the Liquidity Coverage Ratio (LCR) –Equations (19) and (20), respectively.
Whole sample Of which: Top-5 banks Other Dutch banks
Estimated Eq.(18)
LB Eq.(19)
LCR Eq.(20)
Estimated Eq.(18)
LB Eq.(19)
LCR Eq.(20)
Estimated Eq.(18)
LB Eq.(19)
LCR Eq.(20)
Stock of liquidliabilities
0.633*** 0.236*** 0.904*** 0.477*** 0.316*** 0.471*** 0.871*** 0.236*** 0.604***
(0.071) (0.002) (0.061) (0.015) (0.010) (0.012) (0.026) (0.005) (0.035)Cash inflow �0.835*** �0.839*** �2.612*** �0.012 �0.994*** �0.641*** �0.862*** �0.899*** �1.405***
<1 month (0.077) (0.003) (0.285) (0.054) (0.002) (0.013) (0.038) (0.006) (0.117)Cash outflow 1.145*** 0.785*** 3.057*** 0.244*** 0.974*** 0.696*** 1.035*** 0.819*** 1.191***
<1 month (0.027) (0.004) (0.445) (0.037) (0.005) (0.009) (0.015) (0.009) (0.040)Number of obs. 4145 4146 4146 375 375 375 1224 1225 1225Number of banks 62 62 62 5 5 5 19 19 19
Foreign subsidiaries Foreign branches
Estimated Eq. (18) LB Eq. (19) LCR Eq. (20) Estimated Eq. (18) LB Eq. (19) LCR Eq. (20)
Stock of liquid liabilities 0.851*** 0.196*** 1.241*** 0.316*** 0.296*** 0.980***
(0.077) (0.003) (0.169) (0.055) (0.006) (0.096)Cash inflow �0.902*** �0.831*** �5.246*** �0.225** �0.779*** �1.545***
<1 month (0.088) (0.005) (0.876) (0.105) (0.006) (0.095)Cash outflow 0.757*** 0.749*** 7.046*** 0.435*** 0.734*** 1.104***
<1 month (0.054) (0.006) (1.339) (0.078) (0.007) (0.037)Number of obs. 1375 1375 1375 1171 1171 1171Number of banks 19 19 19 19 19 19
Note: The estimated coefficients are pooled estimates; robust standard errors within parentheses. LB and LCR coefficients are sample means of coefficients calculated usingregulatory weights; standard errors (within parentheses) are the standard deviations of these sample means.*** Denote significance levels of 1%.** Denote significance levels of 5%.�Denote significance levels of 10%.
3938 L. de Haan, J.W. van den End / Journal of Banking & Finance 37 (2013) 3930–3950
(16) and (17). Model (18) is an empirical representationof the relationship between the actual stock of liquid assets onthe one hand and liquid liabilities and cash flows for the comingmonth on the other, disregarding cash flows beyond 1 monthahead as does regulation. Models (16) and (17), on the other hand,consider the full range of maturity buckets, both until 1 month andbeyond.
Second, we compile ‘regulatory’ coefficients from the regulatorymodels (7) and (11) introduced in Section 3. We calculate the reg-ulatory coefficients for LB and LCR as follows. Assuming AR
it ¼ Ait ,the regulatory coefficients are defined as:
bLBit ¼
Ait � kLBit IM¼1
it � lLBit OM¼1
it
Lit; kLB
it ¼Ait � bLB
it Lit � lLBit OM¼1
it
IM¼1it
;
lLBit ¼
Ait � bLBit Lit � kLB
it IM¼1it
OM¼1it
ð19Þ
bLCRit ¼
Ait � kLCRit IM¼1
it � lLCRit OM¼1
it
Lit; kLCR
it ¼Ait � bLCR
it Lit � lLCRit OM¼1
it
IM¼1it
;
lLCRit ¼
Ait � bLCRit Lit � kLCR
it IM¼1it
OM¼1it
ð20Þ
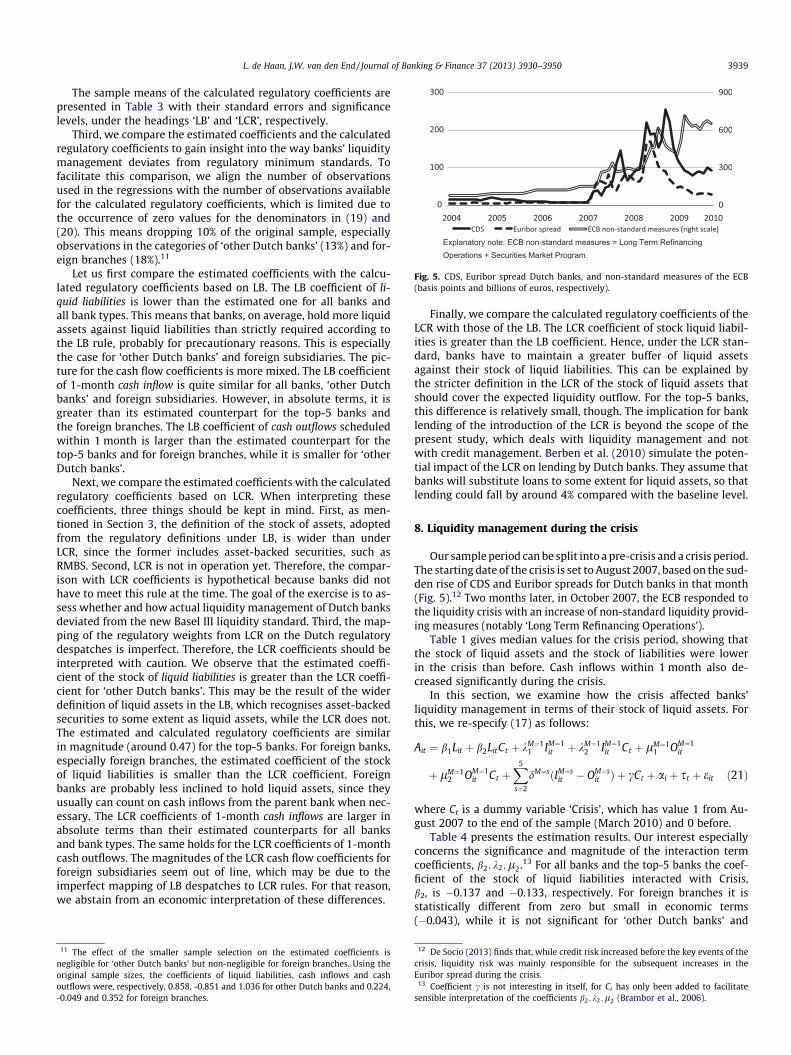
Fig. 5. CDS, Euribor spread Dutch banks, and non-standard measures of the ECB(basis points and billions of euros, respectively).
L. de Haan, J.W. van den End / Journal of Banking & Finance 37 (2013) 3930–3950 3939
The sample means of the calculated regulatory coefficients arepresented in Table 3 with their standard errors and significancelevels, under the headings ‘LB’ and ‘LCR’, respectively.
Third, we compare the estimated coefficients and the calculatedregulatory coefficients to gain insight into the way banks’ liquiditymanagement deviates from regulatory minimum standards. Tofacilitate this comparison, we align the number of observationsused in the regressions with the number of observations availablefor the calculated regulatory coefficients, which is limited due tothe occurrence of zero values for the denominators in (19) and(20). This means dropping 10% of the original sample, especiallyobservations in the categories of ‘other Dutch banks’ (13%) and for-eign branches (18%).11
Let us first compare the estimated coefficients with the calcu-lated regulatory coefficients based on LB. The LB coefficient of li-quid liabilities is lower than the estimated one for all banks andall bank types. This means that banks, on average, hold more liquidassets against liquid liabilities than strictly required according tothe LB rule, probably for precautionary reasons. This is especiallythe case for ‘other Dutch banks’ and foreign subsidiaries. The pic-ture for the cash flow coefficients is more mixed. The LB coefficientof 1-month cash inflow is quite similar for all banks, ‘other Dutchbanks’ and foreign subsidiaries. However, in absolute terms, it isgreater than its estimated counterpart for the top-5 banks andthe foreign branches. The LB coefficient of cash outflows scheduledwithin 1 month is larger than the estimated counterpart for thetop-5 banks and for foreign branches, while it is smaller for ‘otherDutch banks’.
Next, we compare the estimated coefficients with the calculatedregulatory coefficients based on LCR. When interpreting thesecoefficients, three things should be kept in mind. First, as men-tioned in Section 3, the definition of the stock of assets, adoptedfrom the regulatory definitions under LB, is wider than underLCR, since the former includes asset-backed securities, such asRMBS. Second, LCR is not in operation yet. Therefore, the compar-ison with LCR coefficients is hypothetical because banks did nothave to meet this rule at the time. The goal of the exercise is to as-sess whether and how actual liquidity management of Dutch banksdeviated from the new Basel III liquidity standard. Third, the map-ping of the regulatory weights from LCR on the Dutch regulatorydespatches is imperfect. Therefore, the LCR coefficients should beinterpreted with caution. We observe that the estimated coeffi-cient of the stock of liquid liabilities is greater than the LCR coeffi-cient for ‘other Dutch banks’. This may be the result of the widerdefinition of liquid assets in the LB, which recognises asset-backedsecurities to some extent as liquid assets, while the LCR does not.The estimated and calculated regulatory coefficients are similarin magnitude (around 0.47) for the top-5 banks. For foreign banks,especially foreign branches, the estimated coefficient of the stockof liquid liabilities is smaller than the LCR coefficient. Foreignbanks are probably less inclined to hold liquid assets, since theyusually can count on cash inflows from the parent bank when nec-essary. The LCR coefficients of 1-month cash inflows are larger inabsolute terms than their estimated counterparts for all banksand bank types. The same holds for the LCR coefficients of 1-monthcash outflows. The magnitudes of the LCR cash flow coefficients forforeign subsidiaries seem out of line, which may be due to theimperfect mapping of LB despatches to LCR rules. For that reason,we abstain from an economic interpretation of these differences.
11 The effect of the smaller sample selection on the estimated coefficients isnegligible for ‘other Dutch banks’ but non-negligible for foreign branches. Using theoriginal sample sizes, the coefficients of liquid liabilities, cash inflows and cashoutflows were, respectively, 0.858, -0.851 and 1.036 for other Dutch banks and 0.224,-0.049 and 0.352 for foreign branches.
Finally, we compare the calculated regulatory coefficients of theLCR with those of the LB. The LCR coefficient of stock liquid liabil-ities is greater than the LB coefficient. Hence, under the LCR stan-dard, banks have to maintain a greater buffer of liquid assetsagainst their stock of liquid liabilities. This can be explained bythe stricter definition in the LCR of the stock of liquid assets thatshould cover the expected liquidity outflow. For the top-5 banks,this difference is relatively small, though. The implication for banklending of the introduction of the LCR is beyond the scope of thepresent study, which deals with liquidity management and notwith credit management. Berben et al. (2010) simulate the poten-tial impact of the LCR on lending by Dutch banks. They assume thatbanks will substitute loans to some extent for liquid assets, so thatlending could fall by around 4% compared with the baseline level.
8. Liquidity management during the crisis
Our sample period can be split into a pre-crisis and a crisis period.The starting date of the crisis is set to August 2007, based on the sud-den rise of CDS and Euribor spreads for Dutch banks in that month(Fig. 5).12 Two months later, in October 2007, the ECB responded tothe liquidity crisis with an increase of non-standard liquidity provid-ing measures (notably ‘Long Term Refinancing Operations’).
Table 1 gives median values for the crisis period, showing thatthe stock of liquid assets and the stock of liabilities were lowerin the crisis than before. Cash inflows within 1 month also de-creased significantly during the crisis.
In this section, we examine how the crisis affected banks’liquidity management in terms of their stock of liquid assets. Forthis, we re-specify (17) as follows:
Ait ¼ b1Lit þ b2LitCt þ kM¼11 IM¼1
it þ kM¼12 IM¼1
it Ct þ lM¼11 OM¼1
it
þ lM¼12 OM¼1
it Ct þX5
s¼2
dM¼sðIM¼sit � OM¼s
it Þ þ cCt þ ai þ st þ eit ð21Þ
where Ct is a dummy variable ‘Crisis’, which has value 1 from Au-gust 2007 to the end of the sample (March 2010) and 0 before.
Table 4 presents the estimation results. Our interest especiallyconcerns the significance and magnitude of the interaction termcoefficients, b2; k2;l2.13 For all banks and the top-5 banks the coef-ficient of the stock of liquid liabilities interacted with Crisis,b2, is �0.137 and �0.133, respectively. For foreign branches it isstatistically different from zero but small in economic terms(�0.043), while it is not significant for ‘other Dutch banks’ and
12 De Socio (2013) finds that, while credit risk increased before the key events of thecrisis, liquidity risk was mainly responsible for the subsequent increases in theEuribor spread during the crisis.
13 Coefficient c is not interesting in itself, for Ct has only been added to facilitatesensible interpretation of the coefficients b2; k2;l2 (Brambor et al., 2006).
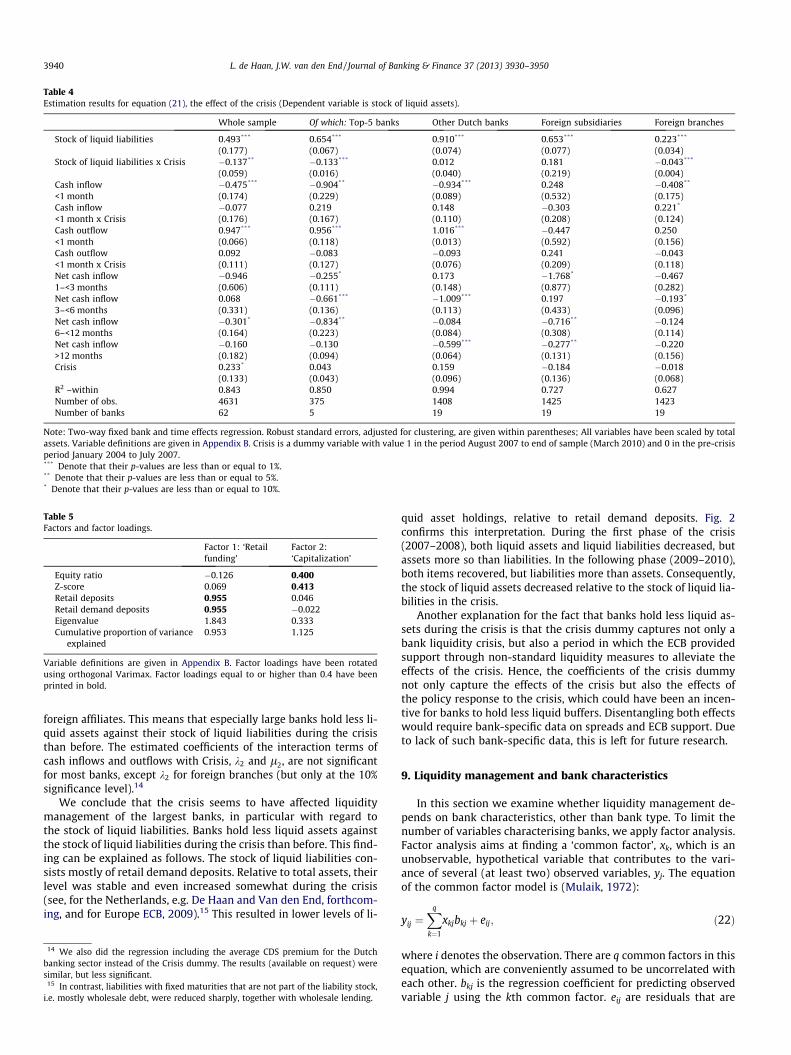
Table 4Estimation results for equation (21), the effect of the crisis (Dependent variable is stock of liquid assets).
Whole sample Of which: Top-5 banks Other Dutch banks Foreign subsidiaries Foreign branches
Stock of liquid liabilities 0.493*** 0.654*** 0.910*** 0.653*** 0.223***
(0.177) (0.067) (0.074) (0.077) (0.034)Stock of liquid liabilities x Crisis �0.137** �0.133*** 0.012 0.181 �0.043***
(0.059) (0.016) (0.040) (0.219) (0.004)Cash inflow �0.475*** �0.904** �0.934*** 0.248 �0.408**
<1 month (0.174) (0.229) (0.089) (0.532) (0.175)Cash inflow �0.077 0.219 0.148 �0.303 0.221*
<1 month x Crisis (0.176) (0.167) (0.110) (0.208) (0.124)Cash outflow 0.947*** 0.956*** 1.016*** �0.447 0.250<1 month (0.066) (0.118) (0.013) (0.592) (0.156)Cash outflow 0.092 �0.083 �0.093 0.241 �0.043<1 month x Crisis (0.111) (0.127) (0.076) (0.209) (0.118)Net cash inflow �0.946 �0.255* 0.173 �1.768* �0.4671–<3 months (0.606) (0.111) (0.148) (0.877) (0.282)Net cash inflow 0.068 �0.661*** �1.009*** 0.197 �0.193*
3–<6 months (0.331) (0.136) (0.113) (0.433) (0.096)Net cash inflow �0.301* �0.834** �0.084 �0.716** �0.1246–<12 months (0.164) (0.223) (0.084) (0.308) (0.114)Net cash inflow �0.160 �0.130 �0.599*** �0.277** �0.220>12 months (0.182) (0.094) (0.064) (0.131) (0.156)Crisis 0.233* 0.043 0.159 �0.184 �0.018
(0.133) (0.043) (0.096) (0.136) (0.068)R2 –within 0.843 0.850 0.994 0.727 0.627Number of obs. 4631 375 1408 1425 1423Number of banks 62 5 19 19 19
Note: Two-way fixed bank and time effects regression. Robust standard errors, adjusted for clustering, are given within parentheses; All variables have been scaled by totalassets. Variable definitions are given in Appendix B. Crisis is a dummy variable with value 1 in the period August 2007 to end of sample (March 2010) and 0 in the pre-crisisperiod January 2004 to July 2007.*** Denote that their p-values are less than or equal to 1%.** Denote that their p-values are less than or equal to 5%.* Denote that their p-values are less than or equal to 10%.
Table 5Factors and factor loadings.
Factor 1: ‘Retailfunding’
Factor 2:‘Capitalization’
Equity ratio �0.126 0.400Z-score 0.069 0.413Retail deposits 0.955 0.046Retail demand deposits 0.955 �0.022Eigenvalue 1.843 0.333Cumulative proportion of variance
explained0.953 1.125
Variable definitions are given in Appendix B. Factor loadings have been rotatedusing orthogonal Varimax. Factor loadings equal to or higher than 0.4 have beenprinted in bold.
3940 L. de Haan, J.W. van den End / Journal of Banking & Finance 37 (2013) 3930–3950
foreign affiliates. This means that especially large banks hold less li-quid assets against their stock of liquid liabilities during the crisisthan before. The estimated coefficients of the interaction terms ofcash inflows and outflows with Crisis, k2 and l2, are not significantfor most banks, except k2 for foreign branches (but only at the 10%significance level).14
We conclude that the crisis seems to have affected liquiditymanagement of the largest banks, in particular with regard tothe stock of liquid liabilities. Banks hold less liquid assets againstthe stock of liquid liabilities during the crisis than before. This find-ing can be explained as follows. The stock of liquid liabilities con-sists mostly of retail demand deposits. Relative to total assets, theirlevel was stable and even increased somewhat during the crisis(see, for the Netherlands, e.g. De Haan and Van den End, forthcom-ing, and for Europe ECB, 2009).15 This resulted in lower levels of li-
14 We also did the regression including the average CDS premium for the Dutchbanking sector instead of the Crisis dummy. The results (available on request) weresimilar, but less significant.
15 In contrast, liabilities with fixed maturities that are not part of the liability stock,i.e. mostly wholesale debt, were reduced sharply, together with wholesale lending.
quid asset holdings, relative to retail demand deposits. Fig. 2confirms this interpretation. During the first phase of the crisis(2007–2008), both liquid assets and liquid liabilities decreased, butassets more so than liabilities. In the following phase (2009–2010),both items recovered, but liabilities more than assets. Consequently,the stock of liquid assets decreased relative to the stock of liquid lia-bilities in the crisis.
Another explanation for the fact that banks hold less liquid as-sets during the crisis is that the crisis dummy captures not only abank liquidity crisis, but also a period in which the ECB providedsupport through non-standard liquidity measures to alleviate theeffects of the crisis. Hence, the coefficients of the crisis dummynot only capture the effects of the crisis but also the effects ofthe policy response to the crisis, which could have been an incen-tive for banks to hold less liquid buffers. Disentangling both effectswould require bank-specific data on spreads and ECB support. Dueto lack of such bank-specific data, this is left for future research.
9. Liquidity management and bank characteristics
In this section we examine whether liquidity management de-pends on bank characteristics, other than bank type. To limit thenumber of variables characterising banks, we apply factor analysis.Factor analysis aims at finding a ‘common factor’, xk, which is anunobservable, hypothetical variable that contributes to the vari-ance of several (at least two) observed variables, yj. The equationof the common factor model is (Mulaik, 1972):
yij ¼Xq
k¼1
xkjbkj þ eij; ð22Þ
where i denotes the observation. There are q common factors in thisequation, which are conveniently assumed to be uncorrelated witheach other. bkj is the regression coefficient for predicting observedvariable j using the kth common factor. eij are residuals that are
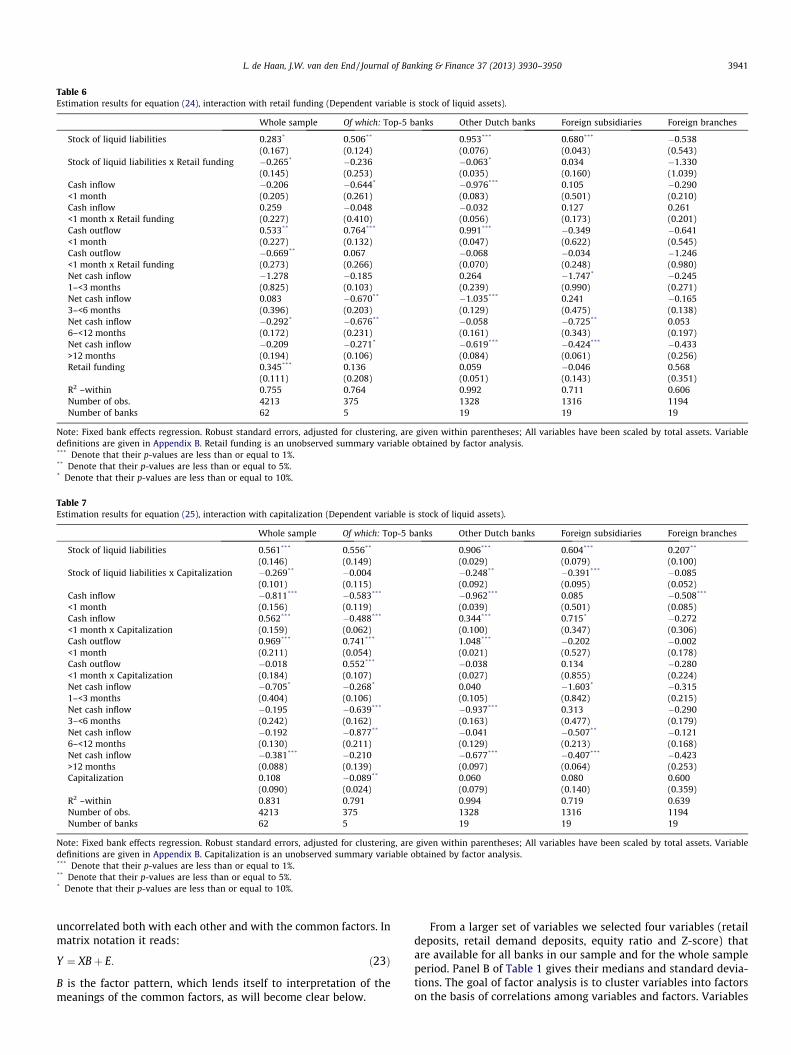
Table 6Estimation results for equation (24), interaction with retail funding (Dependent variable is stock of liquid assets).
Whole sample Of which: Top-5 banks Other Dutch banks Foreign subsidiaries Foreign branches
Stock of liquid liabilities 0.283* 0.506** 0.953*** 0.680*** �0.538(0.167) (0.124) (0.076) (0.043) (0.543)
Stock of liquid liabilities x Retail funding �0.265* �0.236 �0.063* 0.034 �1.330(0.145) (0.253) (0.035) (0.160) (1.039)
Cash inflow �0.206 �0.644* �0.976*** 0.105 �0.290<1 month (0.205) (0.261) (0.083) (0.501) (0.210)Cash inflow 0.259 �0.048 �0.032 0.127 0.261<1 month x Retail funding (0.227) (0.410) (0.056) (0.173) (0.201)Cash outflow 0.533** 0.764*** 0.991*** �0.349 �0.641<1 month (0.227) (0.132) (0.047) (0.622) (0.545)Cash outflow �0.669** 0.067 �0.068 �0.034 �1.246<1 month x Retail funding (0.273) (0.266) (0.070) (0.248) (0.980)Net cash inflow �1.278 �0.185 0.264 �1.747* �0.2451–<3 months (0.825) (0.103) (0.239) (0.990) (0.271)Net cash inflow 0.083 �0.670** �1.035*** 0.241 �0.1653–<6 months (0.396) (0.203) (0.129) (0.475) (0.138)Net cash inflow �0.292* �0.676** �0.058 �0.725** 0.0536–<12 months (0.172) (0.231) (0.161) (0.343) (0.197)Net cash inflow �0.209 �0.271* �0.619*** �0.424*** �0.433>12 months (0.194) (0.106) (0.084) (0.061) (0.256)Retail funding 0.345*** 0.136 0.059 �0.046 0.568
(0.111) (0.208) (0.051) (0.143) (0.351)R2 –within 0.755 0.764 0.992 0.711 0.606Number of obs. 4213 375 1328 1316 1194Number of banks 62 5 19 19 19
Note: Fixed bank effects regression. Robust standard errors, adjusted for clustering, are given within parentheses; All variables have been scaled by total assets. Variabledefinitions are given in Appendix B. Retail funding is an unobserved summary variable obtained by factor analysis.*** Denote that their p-values are less than or equal to 1%.** Denote that their p-values are less than or equal to 5%.* Denote that their p-values are less than or equal to 10%.
Table 7Estimation results for equation (25), interaction with capitalization (Dependent variable is stock of liquid assets).
Whole sample Of which: Top-5 banks Other Dutch banks Foreign subsidiaries Foreign branches
Stock of liquid liabilities 0.561*** 0.556** 0.906*** 0.604*** 0.207**
(0.146) (0.149) (0.029) (0.079) (0.100)Stock of liquid liabilities x Capitalization �0.269** �0.004 �0.248** �0.391*** �0.085
(0.101) (0.115) (0.092) (0.095) (0.052)Cash inflow �0.811*** �0.583*** �0.962*** 0.085 �0.508***
<1 month (0.156) (0.119) (0.039) (0.501) (0.085)Cash inflow 0.562*** �0.488*** 0.344*** 0.715* �0.272<1 month x Capitalization (0.159) (0.062) (0.100) (0.347) (0.306)Cash outflow 0.969*** 0.741*** 1.048*** �0.202 �0.002<1 month (0.211) (0.054) (0.021) (0.527) (0.178)Cash outflow �0.018 0.552*** �0.038 0.134 �0.280<1 month x Capitalization (0.184) (0.107) (0.027) (0.855) (0.224)Net cash inflow �0.705* �0.268* 0.040 �1.603* �0.3151–<3 months (0.404) (0.106) (0.105) (0.842) (0.215)Net cash inflow �0.195 �0.639*** �0.937*** 0.313 �0.2903–<6 months (0.242) (0.162) (0.163) (0.477) (0.179)Net cash inflow �0.192 �0.877** �0.041 �0.507** �0.1216–<12 months (0.130) (0.211) (0.129) (0.213) (0.168)Net cash inflow �0.381*** �0.210 �0.677*** �0.407*** �0.423>12 months (0.088) (0.139) (0.097) (0.064) (0.253)Capitalization 0.108 �0.089** 0.060 0.080 0.600
(0.090) (0.024) (0.079) (0.140) (0.359)R2 –within 0.831 0.791 0.994 0.719 0.639Number of obs. 4213 375 1328 1316 1194Number of banks 62 5 19 19 19
Note: Fixed bank effects regression. Robust standard errors, adjusted for clustering, are given within parentheses; All variables have been scaled by total assets. Variabledefinitions are given in Appendix B. Capitalization is an unobserved summary variable obtained by factor analysis.*** Denote that their p-values are less than or equal to 1%.** Denote that their p-values are less than or equal to 5%.* Denote that their p-values are less than or equal to 10%.
L. de Haan, J.W. van den End / Journal of Banking & Finance 37 (2013) 3930–3950 3941
uncorrelated both with each other and with the common factors. Inmatrix notation it reads:
Y ¼ XBþ E: ð23Þ
B is the factor pattern, which lends itself to interpretation of themeanings of the common factors, as will become clear below.
From a larger set of variables we selected four variables (retaildeposits, retail demand deposits, equity ratio and Z-score) thatare available for all banks in our sample and for the whole sampleperiod. Panel B of Table 1 gives their medians and standard devia-tions. The goal of factor analysis is to cluster variables into factorson the basis of correlations among variables and factors. Variables
Explanatory note: Dotted lines denote 95% confidence bands.
0
0.2
0.4
0.6
0.8
1
1.2Coefficient of liquid liabilities
-1.8
-1.6
-1.4
-1.2
-1
-0.8
-0.6
-0.4
-0.2
0Coefficient of 1-month cash inflow
0
0.2
0.4
0.6
0.8
1
1.2
1.4
1.6
1.8
-0.5 -0.25 0 0.25 0.5 0.75 1Capitalization
Coefficient of 1-month cash outflow
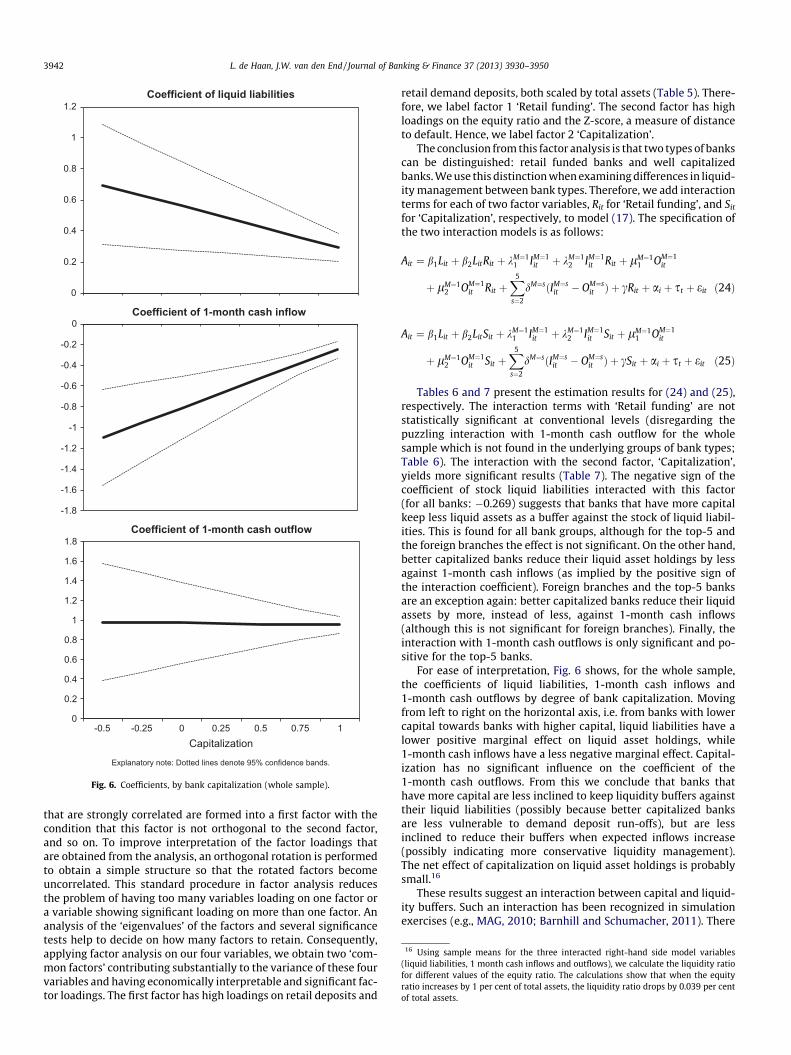
Fig. 6. Coefficients, by bank capitalization (whole sample).
16 Using sample means for the three interacted right-hand side model variables(liquid liabilities, 1 month cash inflows and outflows), we calculate the liquidity ratiofor different values of the equity ratio. The calculations show that when the equityratio increases by 1 per cent of total assets, the liquidity ratio drops by 0.039 per centof total assets.
3942 L. de Haan, J.W. van den End / Journal of Banking & Finance 37 (2013) 3930–3950
that are strongly correlated are formed into a first factor with thecondition that this factor is not orthogonal to the second factor,and so on. To improve interpretation of the factor loadings thatare obtained from the analysis, an orthogonal rotation is performedto obtain a simple structure so that the rotated factors becomeuncorrelated. This standard procedure in factor analysis reducesthe problem of having too many variables loading on one factor ora variable showing significant loading on more than one factor. Ananalysis of the ‘eigenvalues’ of the factors and several significancetests help to decide on how many factors to retain. Consequently,applying factor analysis on our four variables, we obtain two ‘com-mon factors’ contributing substantially to the variance of these fourvariables and having economically interpretable and significant fac-tor loadings. The first factor has high loadings on retail deposits and
retail demand deposits, both scaled by total assets (Table 5). There-fore, we label factor 1 ‘Retail funding’. The second factor has highloadings on the equity ratio and the Z-score, a measure of distanceto default. Hence, we label factor 2 ‘Capitalization’.
The conclusion from this factor analysis is that two types of bankscan be distinguished: retail funded banks and well capitalizedbanks. We use this distinction when examining differences in liquid-ity management between bank types. Therefore, we add interactionterms for each of two factor variables, Rit for ‘Retail funding’, and Sit
for ‘Capitalization’, respectively, to model (17). The specification ofthe two interaction models is as follows:
Ait ¼ b1Lit þ b2LitRit þ kM¼11 IM¼1
it þ kM¼12 IM¼1
it Rit þ lM¼11 OM¼1
it
þ lM¼12 OM¼1
it Rit þX5
s¼2
dM¼sðIM¼sit � OM¼s
it Þ þ cRit þ ai þ st þ eit ð24Þ
Ait ¼ b1Lit þ b2LitSit þ kM¼11 IM¼1
it þ kM¼12 IM¼1
it Sit þ lM¼11 OM¼1
it
þ lM¼12 OM¼1
it Sit þX5
s¼2
dM¼sðIM¼sit � OM¼s
it Þ þ cSit þ ai þ st þ eit ð25Þ
Tables 6 and 7 present the estimation results for (24) and (25),respectively. The interaction terms with ‘Retail funding’ are notstatistically significant at conventional levels (disregarding thepuzzling interaction with 1-month cash outflow for the wholesample which is not found in the underlying groups of bank types;Table 6). The interaction with the second factor, ‘Capitalization’,yields more significant results (Table 7). The negative sign of thecoefficient of stock liquid liabilities interacted with this factor(for all banks: �0.269) suggests that banks that have more capitalkeep less liquid assets as a buffer against the stock of liquid liabil-ities. This is found for all bank groups, although for the top-5 andthe foreign branches the effect is not significant. On the other hand,better capitalized banks reduce their liquid asset holdings by lessagainst 1-month cash inflows (as implied by the positive sign ofthe interaction coefficient). Foreign branches and the top-5 banksare an exception again: better capitalized banks reduce their liquidassets by more, instead of less, against 1-month cash inflows(although this is not significant for foreign branches). Finally, theinteraction with 1-month cash outflows is only significant and po-sitive for the top-5 banks.
For ease of interpretation, Fig. 6 shows, for the whole sample,the coefficients of liquid liabilities, 1-month cash inflows and1-month cash outflows by degree of bank capitalization. Movingfrom left to right on the horizontal axis, i.e. from banks with lowercapital towards banks with higher capital, liquid liabilities have alower positive marginal effect on liquid asset holdings, while1-month cash inflows have a less negative marginal effect. Capital-ization has no significant influence on the coefficient of the1-month cash outflows. From this we conclude that banks thathave more capital are less inclined to keep liquidity buffers againsttheir liquid liabilities (possibly because better capitalized banksare less vulnerable to demand deposit run-offs), but are lessinclined to reduce their buffers when expected inflows increase(possibly indicating more conservative liquidity management).The net effect of capitalization on liquid asset holdings is probablysmall.16
These results suggest an interaction between capital and liquid-ity buffers. Such an interaction has been recognized in simulationexercises (e.g., MAG, 2010; Barnhill and Schumacher, 2011). There
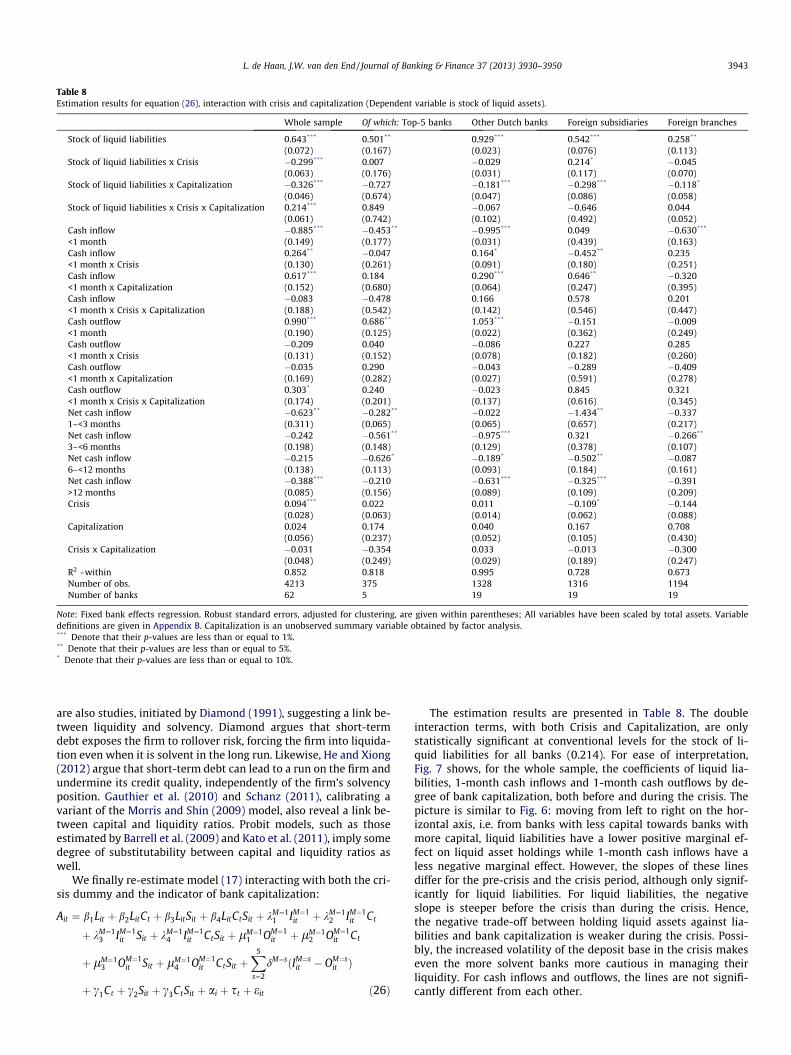
Table 8Estimation results for equation (26), interaction with crisis and capitalization (Dependent variable is stock of liquid assets).
Whole sample Of which: Top-5 banks Other Dutch banks Foreign subsidiaries Foreign branches
Stock of liquid liabilities 0.643*** 0.501** 0.929*** 0.542*** 0.258**
(0.072) (0.167) (0.023) (0.076) (0.113)Stock of liquid liabilities x Crisis �0.299*** 0.007 �0.029 0.214* �0.045
(0.063) (0.176) (0.031) (0.117) (0.070)Stock of liquid liabilities x Capitalization �0.326*** �0.727 �0.181*** �0.298*** �0.118*
(0.046) (0.674) (0.047) (0.086) (0.058)Stock of liquid liabilities x Crisis x Capitalization 0.214*** 0.849 �0.067 �0.646 0.044
(0.061) (0.742) (0.102) (0.492) (0.052)Cash inflow �0.885*** �0.453** �0.995*** 0.049 �0.630***
<1 month (0.149) (0.177) (0.031) (0.439) (0.163)Cash inflow 0.264** �0.047 0.164* �0.452** 0.235<1 month x Crisis (0.130) (0.261) (0.091) (0.180) (0.251)Cash inflow 0.617*** 0.184 0.290*** 0.646** �0.320<1 month x Capitalization (0.152) (0.680) (0.064) (0.247) (0.395)Cash inflow �0.083 �0.478 0.166 0.578 0.201<1 month x Crisis x Capitalization (0.188) (0.542) (0.142) (0.546) (0.447)Cash outflow 0.990*** 0.686** 1.053*** �0.151 �0.009<1 month (0.190) (0.125) (0.022) (0.362) (0.249)Cash outflow �0.209 0.040 �0.086 0.227 0.285<1 month x Crisis (0.131) (0.152) (0.078) (0.182) (0.260)Cash outflow �0.035 0.290 �0.043 �0.289 �0.409<1 month x Capitalization (0.169) (0.282) (0.027) (0.591) (0.278)Cash outflow 0.303* 0.240 �0.023 0.845 0.321<1 month x Crisis x Capitalization (0.174) (0.201) (0.137) (0.616) (0.345)Net cash inflow �0.623** �0.282** �0.022 �1.434** �0.3371–<3 months (0.311) (0.065) (0.065) (0.657) (0.217)Net cash inflow �0.242 �0.561** �0.975*** 0.321 �0.266**
3–<6 months (0.198) (0.148) (0.129) (0.378) (0.107)Net cash inflow �0.215 �0.626* �0.189* �0.502** �0.0876–<12 months (0.138) (0.113) (0.093) (0.184) (0.161)Net cash inflow �0.388*** �0.210 �0.631*** �0.325*** �0.391>12 months (0.085) (0.156) (0.089) (0.109) (0.209)Crisis 0.094*** 0.022 0.011 �0.109* �0.144
(0.028) (0.063) (0.014) (0.062) (0.088)Capitalization 0.024 0.174 0.040 0.167 0.708
(0.056) (0.237) (0.052) (0.105) (0.430)Crisis x Capitalization �0.031 �0.354 0.033 �0.013 �0.300
(0.048) (0.249) (0.029) (0.189) (0.247)R2 –within 0.852 0.818 0.995 0.728 0.673Number of obs. 4213 375 1328 1316 1194Number of banks 62 5 19 19 19
Note: Fixed bank effects regression. Robust standard errors, adjusted for clustering, are given within parentheses; All variables have been scaled by total assets. Variabledefinitions are given in Appendix B. Capitalization is an unobserved summary variable obtained by factor analysis.*** Denote that their p-values are less than or equal to 1%.** Denote that their p-values are less than or equal to 5%.* Denote that their p-values are less than or equal to 10%.
L. de Haan, J.W. van den End / Journal of Banking & Finance 37 (2013) 3930–3950 3943
are also studies, initiated by Diamond (1991), suggesting a link be-tween liquidity and solvency. Diamond argues that short-termdebt exposes the firm to rollover risk, forcing the firm into liquida-tion even when it is solvent in the long run. Likewise, He and Xiong(2012) argue that short-term debt can lead to a run on the firm andundermine its credit quality, independently of the firm’s solvencyposition. Gauthier et al. (2010) and Schanz (2011), calibrating avariant of the Morris and Shin (2009) model, also reveal a link be-tween capital and liquidity ratios. Probit models, such as thoseestimated by Barrell et al. (2009) and Kato et al. (2011), imply somedegree of substitutability between capital and liquidity ratios aswell.
We finally re-estimate model (17) interacting with both the cri-sis dummy and the indicator of bank capitalization:
Ait ¼ b1Lit þ b2LitCt þ b3LitSit þ b4LitCtSit þ kM¼11 IM¼1
it þ kM¼12 IM¼1
it Ct
þ kM¼13 IM¼1
it Sit þ kM¼14 IM¼1
it CtSit þ lM¼11 OM¼1
it þ lM¼12 OM¼1
it Ct
þ lM¼13 OM¼1
it Sit þ lM¼14 OM¼1
it CtSit þX5
s¼2
dM¼sðIM¼sit � OM¼s
it Þ
þ c1Ct þ c2Sit þ c3CtSit þ ai þ st þ eit ð26Þ
The estimation results are presented in Table 8. The doubleinteraction terms, with both Crisis and Capitalization, are onlystatistically significant at conventional levels for the stock of li-quid liabilities for all banks (0.214). For ease of interpretation,Fig. 7 shows, for the whole sample, the coefficients of liquid lia-bilities, 1-month cash inflows and 1-month cash outflows by de-gree of bank capitalization, both before and during the crisis. Thepicture is similar to Fig. 6: moving from left to right on the hor-izontal axis, i.e. from banks with less capital towards banks withmore capital, liquid liabilities have a lower positive marginal ef-fect on liquid asset holdings while 1-month cash inflows have aless negative marginal effect. However, the slopes of these linesdiffer for the pre-crisis and the crisis period, although only signif-icantly for liquid liabilities. For liquid liabilities, the negativeslope is steeper before the crisis than during the crisis. Hence,the negative trade-off between holding liquid assets against lia-bilities and bank capitalization is weaker during the crisis. Possi-bly, the increased volatility of the deposit base in the crisis makeseven the more solvent banks more cautious in managing theirliquidity. For cash inflows and outflows, the lines are not signifi-cantly different from each other.
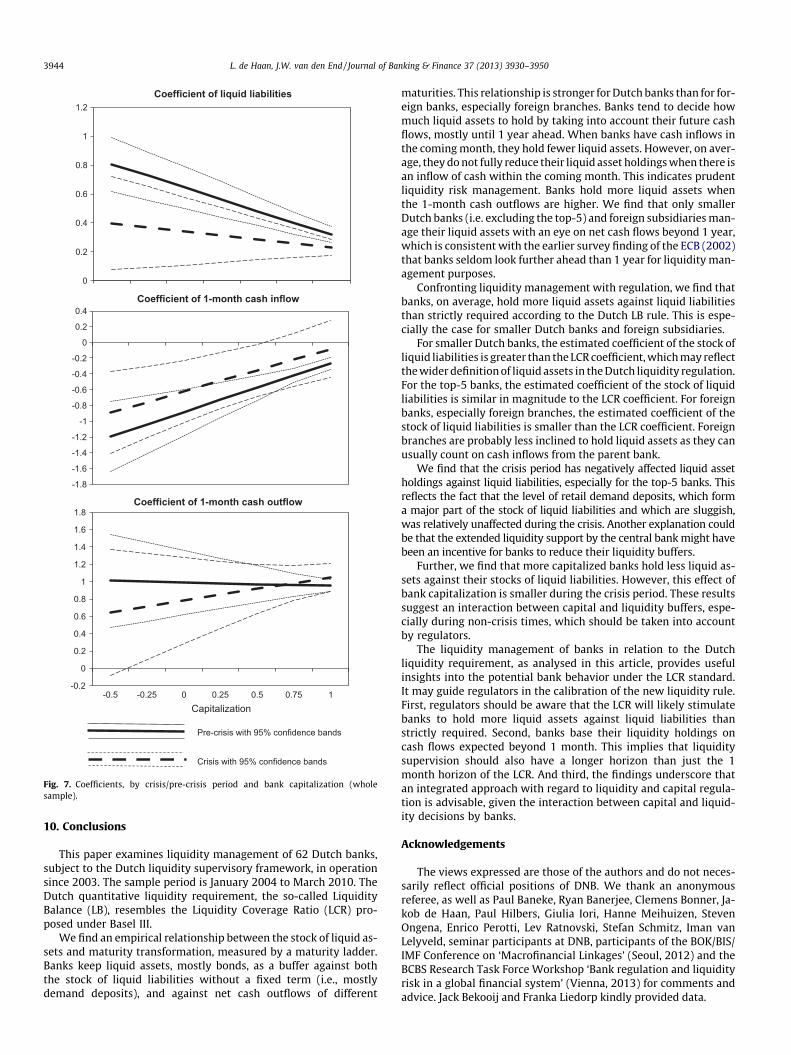
Pre-crisis with 95% confidence bands
Crisis with 95% confidence bands
0
0.2
0.4
0.6
0.8
1
1.2Coefficient of liquid liabilities
-1.8
-1.6
-1.4
-1.2
-1
-0.8
-0.6
-0.4
-0.2
0
0.2
0.4Coefficient of 1-month cash inflow
-0.2
0
0.2
0.4
0.6
0.8
1
1.2
1.4
1.6
1.8
-0.5 -0.25 0 0.25 0.5 0.75 1Capitalization
Coefficient of 1-month cash outflow
Fig. 7. Coefficients, by crisis/pre-crisis period and bank capitalization (wholesample).
3944 L. de Haan, J.W. van den End / Journal of Banking & Finance 37 (2013) 3930–3950
10. Conclusions
This paper examines liquidity management of 62 Dutch banks,subject to the Dutch liquidity supervisory framework, in operationsince 2003. The sample period is January 2004 to March 2010. TheDutch quantitative liquidity requirement, the so-called LiquidityBalance (LB), resembles the Liquidity Coverage Ratio (LCR) pro-posed under Basel III.
We find an empirical relationship between the stock of liquid as-sets and maturity transformation, measured by a maturity ladder.Banks keep liquid assets, mostly bonds, as a buffer against boththe stock of liquid liabilities without a fixed term (i.e., mostlydemand deposits), and against net cash outflows of different
maturities. This relationship is stronger for Dutch banks than for for-eign banks, especially foreign branches. Banks tend to decide howmuch liquid assets to hold by taking into account their future cashflows, mostly until 1 year ahead. When banks have cash inflows inthe coming month, they hold fewer liquid assets. However, on aver-age, they do not fully reduce their liquid asset holdings when there isan inflow of cash within the coming month. This indicates prudentliquidity risk management. Banks hold more liquid assets whenthe 1-month cash outflows are higher. We find that only smallerDutch banks (i.e. excluding the top-5) and foreign subsidiaries man-age their liquid assets with an eye on net cash flows beyond 1 year,which is consistent with the earlier survey finding of the ECB (2002)that banks seldom look further ahead than 1 year for liquidity man-agement purposes.
Confronting liquidity management with regulation, we find thatbanks, on average, hold more liquid assets against liquid liabilitiesthan strictly required according to the Dutch LB rule. This is espe-cially the case for smaller Dutch banks and foreign subsidiaries.
For smaller Dutch banks, the estimated coefficient of the stock ofliquid liabilities is greater than the LCR coefficient, which may reflectthe wider definition of liquid assets in the Dutch liquidity regulation.For the top-5 banks, the estimated coefficient of the stock of liquidliabilities is similar in magnitude to the LCR coefficient. For foreignbanks, especially foreign branches, the estimated coefficient of thestock of liquid liabilities is smaller than the LCR coefficient. Foreignbranches are probably less inclined to hold liquid assets as they canusually count on cash inflows from the parent bank.
We find that the crisis period has negatively affected liquid assetholdings against liquid liabilities, especially for the top-5 banks. Thisreflects the fact that the level of retail demand deposits, which forma major part of the stock of liquid liabilities and which are sluggish,was relatively unaffected during the crisis. Another explanation couldbe that the extended liquidity support by the central bank might havebeen an incentive for banks to reduce their liquidity buffers.
Further, we find that more capitalized banks hold less liquid as-sets against their stocks of liquid liabilities. However, this effect ofbank capitalization is smaller during the crisis period. These resultssuggest an interaction between capital and liquidity buffers, espe-cially during non-crisis times, which should be taken into accountby regulators.
The liquidity management of banks in relation to the Dutchliquidity requirement, as analysed in this article, provides usefulinsights into the potential bank behavior under the LCR standard.It may guide regulators in the calibration of the new liquidity rule.First, regulators should be aware that the LCR will likely stimulatebanks to hold more liquid assets against liquid liabilities thanstrictly required. Second, banks base their liquidity holdings oncash flows expected beyond 1 month. This implies that liquiditysupervision should also have a longer horizon than just the 1month horizon of the LCR. And third, the findings underscore thatan integrated approach with regard to liquidity and capital regula-tion is advisable, given the interaction between capital and liquid-ity decisions by banks.
Acknowledgements
The views expressed are those of the authors and do not neces-sarily reflect official positions of DNB. We thank an anonymousreferee, as well as Paul Baneke, Ryan Banerjee, Clemens Bonner, Ja-kob de Haan, Paul Hilbers, Giulia Iori, Hanne Meihuizen, StevenOngena, Enrico Perotti, Lev Ratnovski, Stefan Schmitz, Iman vanLelyveld, seminar participants at DNB, participants of the BOK/BIS/IMF Conference on ‘Macrofinancial Linkages’ (Seoul, 2012) and theBCBS Research Task Force Workshop ‘Bank regulation and liquidityrisk in a global financial system’ (Vienna, 2013) for comments andadvice. Jack Bekooij and Franka Liedorp kindly provided data.
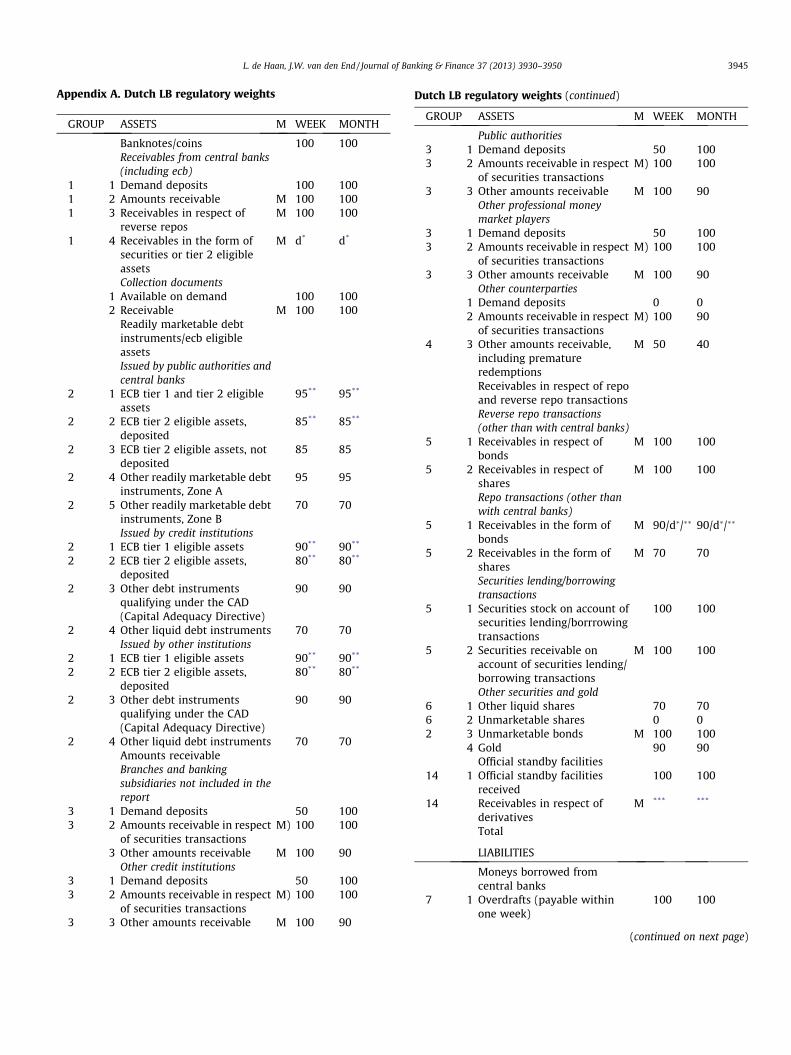
L. de Haan, J.W. van den End / Journal of Banking & Finance 37 (2013) 3930–3950 3945
Appendix A. Dutch LB regulatory weights
GROUP
ASSETS M WEEK MONTHBanknotes/coins
100 100 Receivables from central banks(including ecb)1
1 Demand deposits 100 100 1 2 Amounts receivable M 100 100 1 3 Receivables in respect ofreverse repos
M 100 1001
4 Receivables in the form ofsecurities or tier 2 eligibleassetsM
d* d*Collection documents
1 Available on demand 100 100 2 Receivable M 100 100Readily marketable debtinstruments/ecb eligibleassets
Issued by public authorities andcentral banks2
1 ECB tier 1 and tier 2 eligibleassets95**
95**2
2 ECB tier 2 eligible assets,deposited85**
85**2
3 ECB tier 2 eligible assets, notdeposited85
852
4 Other readily marketable debtinstruments, Zone A95
952
5 Other readily marketable debtinstruments, Zone B70
70Issued by credit institutions
2 1 ECB tier 1 eligible assets 90** 90**2
2 ECB tier 2 eligible assets,deposited80**
80**2
3 Other debt instrumentsqualifying under the CAD(Capital Adequacy Directive)90
902
4 Other liquid debt instruments 70 70 Issued by other institutions2
1 ECB tier 1 eligible assets 90** 90**2
2 ECB tier 2 eligible assets,deposited80**
80**2
3 Other debt instrumentsqualifying under the CAD(Capital Adequacy Directive)90
902
4 Other liquid debt instruments 70 70 Amounts receivable Branches and bankingsubsidiaries not included in thereport3
1 Demand deposits 50 100 3 2 Amounts receivable in respectof securities transactions
M) 100 1003
Other amounts receivable M 100 90 Other credit institutions3
1 Demand deposits 50 100 3 2 Amounts receivable in respectof securities transactions
M) 100 1003
3 Other amounts receivable M 100 90Dutch LB regulatory weights (continued)
GROUP
ASSETS M WEEK MONTHPublic authorities
3 1 Demand deposits 50 100 3 2 Amounts receivable in respectof securities transactions
M) 100 1003
3 Other amounts receivable M 100 90 Other professional moneymarket players3
1 Demand deposits 50 100 3 2 Amounts receivable in respectof securities transactions
M) 100 1003
3 Other amounts receivable M 100 90 Other counterparties1
Demand deposits 0 0 2 Amounts receivable in respectof securities transactions
M) 100 904
3 Other amounts receivable,including prematureredemptionsM
50 40Receivables in respect of repoand reverse repo transactions
Reverse repo transactions(other than with central banks)5
1 Receivables in respect ofbondsM
100 1005
2 Receivables in respect ofsharesM
100 100Repo transactions (other thanwith central banks)
5
1 Receivables in the form ofbondsM
90/d�/�� 90/d�/��5
2 Receivables in the form ofsharesM
70 70Securities lending/borrowingtransactions
5
1 Securities stock on account ofsecurities lending/borrrowingtransactions100
1005
2 Securities receivable onaccount of securities lending/borrowing transactionsM
100 100Other securities and gold
6 1 Other liquid shares 70 70 6 2 Unmarketable shares 0 0 2 3 Unmarketable bonds M 100 1004
Gold 90 90 Official standby facilities14
1 Official standby facilitiesreceived100
10014
Receivables in respect ofderivativesM
*** ***Total
LIABILITIES
Moneys borrowed fromcentral banks
7
1 Overdrafts (payable withinone week)100
100(continued on next page)
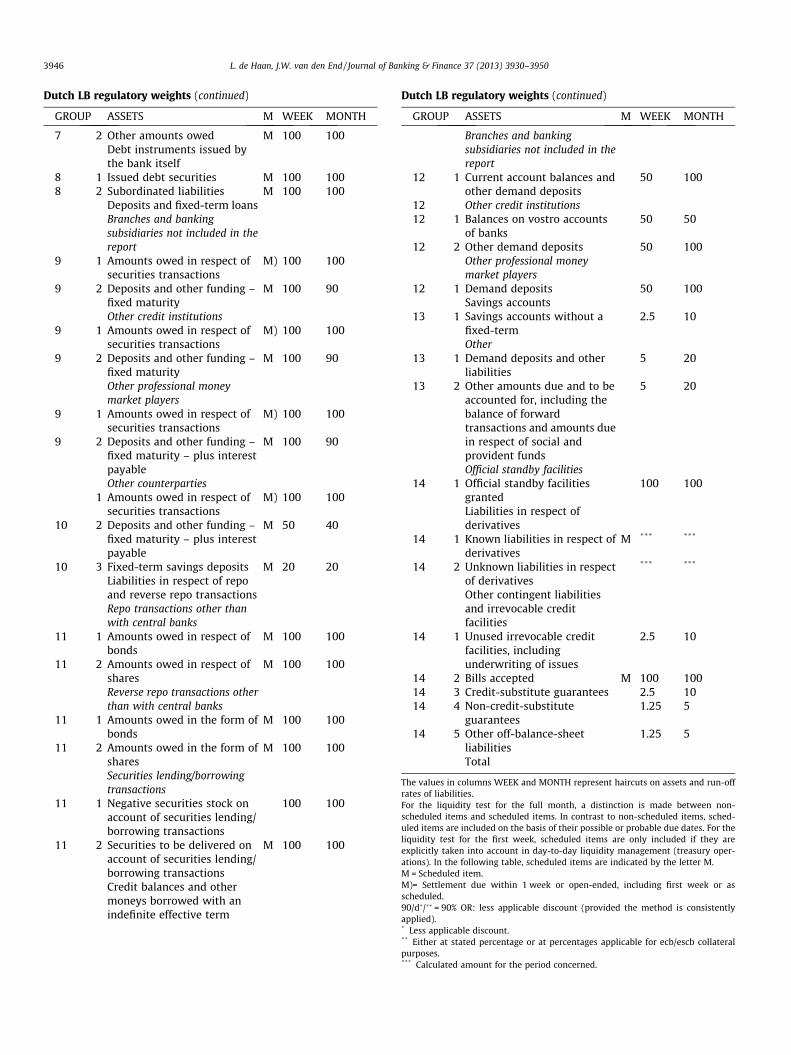
3946 L. de Haan, J.W. van den End / Journal of Banking & Finance 37 (2013) 3930–3950
Dutch LB regulatory weights (continued)
GROUP
ASSETS M WEEK MONTH7
2 Other amounts owed M 100 100 Debt instruments issued bythe bank itself8
1 Issued debt securities M 100 100 8 2 Subordinated liabilities M 100 100Deposits and fixed-term loans
Branches and bankingsubsidiaries not included in thereport9
1 Amounts owed in respect ofsecurities transactionsM)
100 1009
2 Deposits and other funding –fixed maturityM
100 90Other credit institutions
9 1 Amounts owed in respect ofsecurities transactions
M) 100 1009
2 Deposits and other funding –fixed maturityM
100 90Other professional moneymarket players
9
1 Amounts owed in respect ofsecurities transactionsM)
100 1009
2 Deposits and other funding –fixed maturity – plus interestpayableM
100 90Other counterparties
1 Amounts owed in respect ofsecurities transactions
M) 100 10010
2 Deposits and other funding –fixed maturity – plus interestpayableM
50 4010
3 Fixed-term savings deposits M 20 20 Liabilities in respect of repoand reverse repo transactions Repo transactions other thanwith central banks11
1 Amounts owed in respect ofbondsM
100 10011
2 Amounts owed in respect ofsharesM
100 100Reverse repo transactions otherthan with central banks
11
1 Amounts owed in the form ofbondsM
100 10011
2 Amounts owed in the form ofsharesM
100 100Securities lending/borrowingtransactions
11
1 Negative securities stock onaccount of securities lending/borrowing transactions100
10011
2 Securities to be delivered onaccount of securities lending/borrowing transactionsM
100 100Credit balances and othermoneys borrowed with anindefinite effective term
Dutch LB regulatory weights (continued)
GROUP
ASSETS M WEEK MONTHBranches and bankingsubsidiaries not included in thereport
12
1 Current account balances andother demand deposits50
10012
Other credit institutions 12 1 Balances on vostro accountsof banks
50 5012
2 Other demand deposits 50 100 Other professional moneymarket players12
1 Demand deposits 50 100 Savings accounts13
1 Savings accounts without afixed-term2.5
10Other
13 1 Demand deposits and otherliabilities
5 2013
2 Other amounts due and to beaccounted for, including thebalance of forwardtransactions and amounts duein respect of social andprovident funds5
20Official standby facilities
14 1 Official standby facilitiesgranted
100 100Liabilities in respect ofderivatives
14
1 Known liabilities in respect ofderivativesM
*** ***14
2 Unknown liabilities in respectof derivatives***
***Other contingent liabilitiesand irrevocable creditfacilities
14
1 Unused irrevocable creditfacilities, includingunderwriting of issues2.5
1014
2 Bills accepted M 100 100 14 3 Credit-substitute guarantees 2.5 10 14 4 Non-credit-substituteguarantees
1.25 514
5 Other off-balance-sheetliabilities1.25
5Total
The values in columns WEEK and MONTH represent haircuts on assets and run-offrates of liabilities.For the liquidity test for the full month, a distinction is made between non-scheduled items and scheduled items. In contrast to non-scheduled items, sched-uled items are included on the basis of their possible or probable due dates. For theliquidity test for the first week, scheduled items are only included if they areexplicitly taken into account in day-to-day liquidity management (treasury oper-ations). In the following table, scheduled items are indicated by the letter M.M = Scheduled item.M)= Settlement due within 1 week or open-ended, including first week or asscheduled.90/d�/�� = 90% OR: less applicable discount (provided the method is consistentlyapplied).* Less applicable discount.** Either at stated percentage or at percentages applicable for ecb/escb collateralpurposes.*** Calculated amount for the period concerned.

L. de Haan, J.W. van den End / Journal of Banking & Finance 37 (2013) 3930–3950 3947
A.1. Basel III LCR regulatory weights
Illustrative template for the liquidity coverage ratio
Item F
actor (to bemultiplied againsttotal amount)Ta
otalmount
Withfactorapplied
Stock of high quality liquid assets
Cash 1 00% Qualifying marketablesecurities fromsovereigns, centralbanks, public sectorentities, and multi-lateraldevelopment banks
1
00%Qualifying centralbank receivables
1
00%Domestic sovereign orcentral bank debt indomestic currency
1
00%In addition, the Committee will gather data on the followinginstruments to analyse the impact of this standard on thefinancial sector
Qualifying corporatebonds rated AA orhigher
8
0%Qualifying corporatebonds rated A to AA
6
0%Qualifying coveredbonds rated AA orhigher
8
0%Qualifying coveredbonds rated A- toAA-
6
0%Total value of stock of highly liquid assetsCash outflows
Retail deposits
– Stable deposits M inimum 7.5% – Less stable retaildeposits [additionalcategories to bedetermined byjurisdiction]
M
inimum 15%Unsecured wholesale funding
– Stable, smallbusiness customersM
inimum 7.5%– Less stable, smallbusiness customers[additionalcategories to bedetermined byjurisdiction]
M
inimum 15%– Non-financialcorporates, nooperationalrelationship
7
5%Basel III LCR regulatory weights (continued)
Item F
actor (to bemultiplied againsttotal amount)Ta
otalmount
Withfactorapplied
– Non-financialcorporates,sovereigns, centralbanks and publicsector entities withoperationalrelationships
2no
5% of depositseeded forperational purposes
– Other legal entitycustomers andsovereigns, centralbanks, and PSEswithout operationalrelationships
1
00%Secured funding
Funding from repo ofilliquid assets andsecurities lending/borrowingtransactions illiquidassets are lent out
1
00%Additional requirements
Liabilities related toderivative collateralcalls related to adowngrade of up to3-notches
1wccd
00% of collateral thatould be required to
over the contracts inase of up to a 3-notchowngrade
Market valuationchanges onderivativestransactions
An[b
mount should beationally determinedas relevant to specificanks]
Valuation changes onposted noncash ornon-high qualitysovereign debtcollateral securingderivativetransactions
2
0%ABCP, SIVs, Conduits, etc
– Liabilities frommaturing ABCP,SIVs, SPVs, etc
1ar
00% of maturingmounts and 100% ofeturnable assets
Term Asset BackedSecurities(including coveredbonds)
1a
00% of maturingmounts
Currently undrawn portion of committed credit and liquidityfacilities to
– Retail clients 1
0% of outstandinglines– Non-financialcorporates; creditfacilities
1l
0% of outstandingines
– Non-financial 1
00% of outstanding(continued on next page)
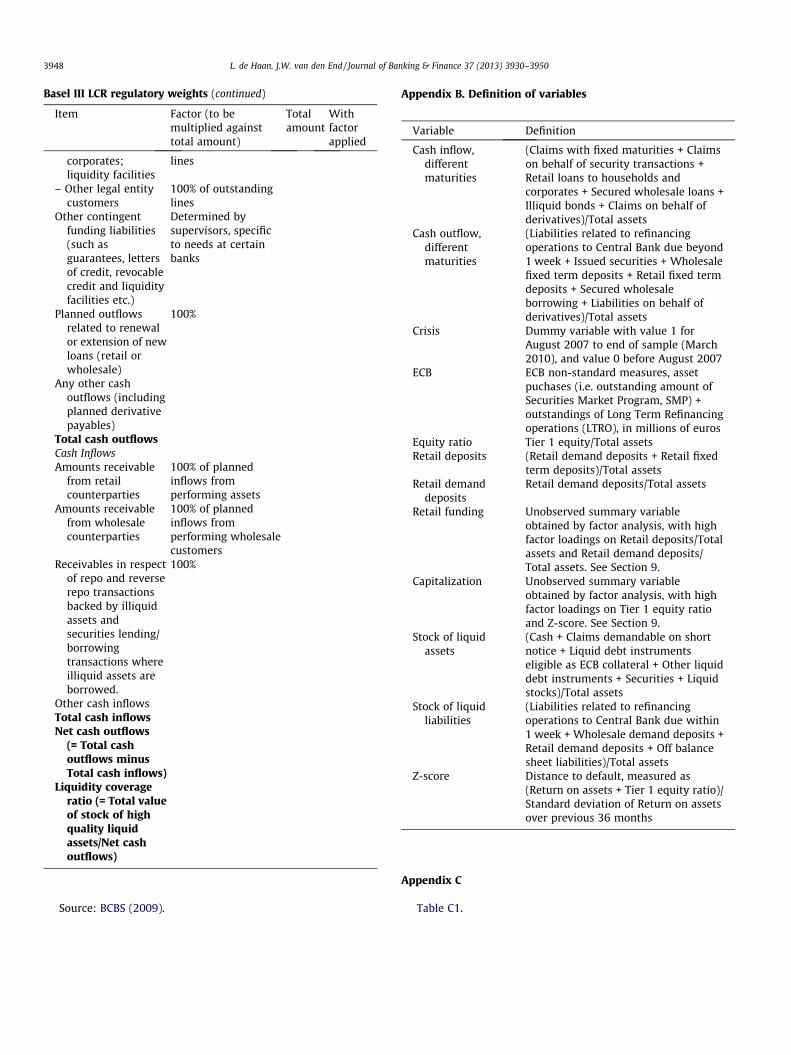
3948 L. de Haan, J.W. van den End / Journal of Banking & Finance 37 (2013) 3930–3950
Basel III LCR regulatory weights (continued)
Item
Factor (to bemultiplied againsttotal amount)Totalamount
Withfactorapplied
corporates;liquidity facilities
lines
– Other legal entitycustomers
100% of outstandinglines
Other contingentfunding liabilities(such asguarantees, lettersof credit, revocablecredit and liquidityfacilities etc.)
Determined bysupervisors, specificto needs at certainbanks
Planned outflowsrelated to renewalor extension of newloans (retail orwholesale)
100%
Any other cashoutflows (includingplanned derivativepayables)
Total cash outflows
Cash Inflows Amounts receivablefrom retailcounterparties
100% of plannedinflows fromperforming assets
Amounts receivablefrom wholesalecounterparties
100% of plannedinflows fromperforming wholesalecustomers
Receivables in respectof repo and reverserepo transactionsbacked by illiquidassets andsecurities lending/borrowingtransactions whereilliquid assets areborrowed.
100%
Other cash inflows
Total cash inflows Net cash outflows(= Total cashoutflows minusTotal cash inflows)
Liquidity coverageratio (= Total valueof stock of highquality liquidassets/Net cashoutflows)
Source: BCBS (2009).
Appendix B. Definition of variables
Variable
DefinitionCash inflow,differentmaturities
(Claims with fixed maturities + Claimson behalf of security transactions +Retail loans to households andcorporates + Secured wholesale loans +Illiquid bonds + Claims on behalf ofderivatives)/Total assets
Cash outflow,differentmaturities
(Liabilities related to refinancingoperations to Central Bank due beyond1 week + Issued securities + Wholesalefixed term deposits + Retail fixed termdeposits + Secured wholesaleborrowing + Liabilities on behalf ofderivatives)/Total assets
Crisis
Dummy variable with value 1 forAugust 2007 to end of sample (March2010), and value 0 before August 2007ECB
ECB non-standard measures, assetpuchases (i.e. outstanding amount ofSecurities Market Program, SMP) +outstandings of Long Term Refinancingoperations (LTRO), in millions of eurosEquity ratio
Tier 1 equity/Total assets Retail deposits (Retail demand deposits + Retail fixedterm deposits)/Total assets
Retail demanddeposits
Retail demand deposits/Total assetsRetail funding
Unobserved summary variableobtained by factor analysis, with highfactor loadings on Retail deposits/Totalassets and Retail demand deposits/Total assets. See Section 9.Capitalization
Unobserved summary variableobtained by factor analysis, with highfactor loadings on Tier 1 equity ratioand Z-score. See Section 9.Stock of liquidassets
(Cash + Claims demandable on shortnotice + Liquid debt instrumentseligible as ECB collateral + Other liquiddebt instruments + Securities + Liquidstocks)/Total assets
Stock of liquidliabilities
(Liabilities related to refinancingoperations to Central Bank due within1 week + Wholesale demand deposits +Retail demand deposits + Off balancesheet liabilities)/Total assets
Z-score
Distance to default, measured as(Return on assets + Tier 1 equity ratio)/Standard deviation of Return on assetsover previous 36 monthsAppendix C
Table C1.
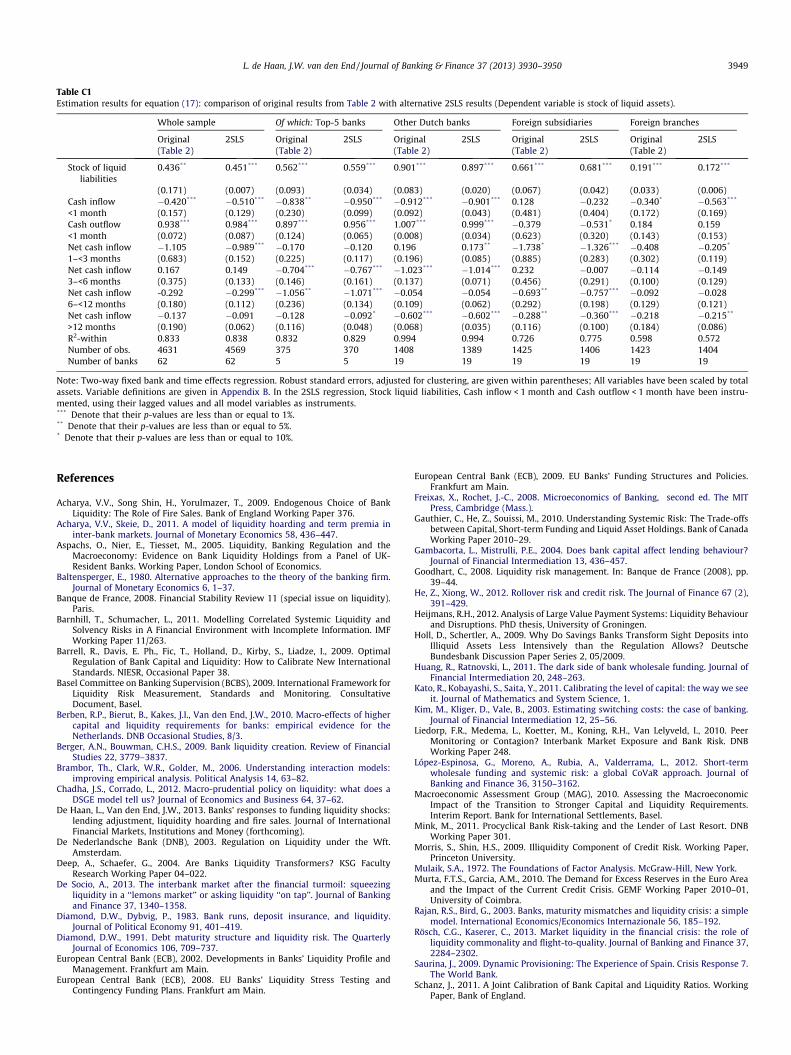
Table C1Estimation results for equation (17): comparison of original results from Table 2 with alternative 2SLS results (Dependent variable is stock of liquid assets).
Whole sample Of which: Top-5 banks Other Dutch banks Foreign subsidiaries Foreign branches
Original(Table 2)
2SLS Original(Table 2)
2SLS Original(Table 2)
2SLS Original(Table 2)
2SLS Original(Table 2)
2SLS
Stock of liquidliabilities
0.436** 0.451*** 0.562*** 0.559*** 0.901*** 0.897*** 0.661*** 0.681*** 0.191*** 0.172***
(0.171) (0.007) (0.093) (0.034) (0.083) (0.020) (0.067) (0.042) (0.033) (0.006)Cash inflow �0.420*** �0.510*** �0.838** �0.950*** �0.912*** �0.901*** 0.128 �0.232 �0.340* �0.563***
<1 month (0.157) (0.129) (0.230) (0.099) (0.092) (0.043) (0.481) (0.404) (0.172) (0.169)Cash outflow 0.938*** 0.984*** 0.897*** 0.956*** 1.007*** 0.999*** �0.379 �0.531* 0.184 0.159<1 month (0.072) (0.087) (0.124) (0.065) (0.008) (0.034) (0.623) (0.320) (0.143) (0.153)Net cash inflow �1.105 �0.989*** �0.170 �0.120 0.196 0.173** �1.738* �1.326*** �0.408 �0.205*
1–<3 months (0.683) (0.152) (0.225) (0.117) (0.196) (0.085) (0.885) (0.283) (0.302) (0.119)Net cash inflow 0.167 0.149 �0.704*** �0.767*** �1.023*** �1.014*** 0.232 �0.007 �0.114 �0.1493–<6 months (0.375) (0.133) (0.146) (0.161) (0.137) (0.071) (0.456) (0.291) (0.100) (0.129)Net cash inflow -0.292 �0.299*** �1.056** �1.071*** �0.054 �0.054 �0.693** �0.757*** �0.092 �0.0286–<12 months (0.180) (0.112) (0.236) (0.134) (0.109) (0.062) (0.292) (0.198) (0.129) (0.121)Net cash inflow �0.137 �0.091 �0.128 �0.092* �0.602*** �0.602*** �0.288** �0.360*** �0.218 �0.215**
>12 months (0.190) (0.062) (0.116) (0.048) (0.068) (0.035) (0.116) (0.100) (0.184) (0.086)R2-within 0.833 0.838 0.832 0.829 0.994 0.994 0.726 0.775 0.598 0.572Number of obs. 4631 4569 375 370 1408 1389 1425 1406 1423 1404Number of banks 62 62 5 5 19 19 19 19 19 19
Note: Two-way fixed bank and time effects regression. Robust standard errors, adjusted for clustering, are given within parentheses; All variables have been scaled by totalassets. Variable definitions are given in Appendix B. In the 2SLS regression, Stock liquid liabilities, Cash inflow < 1 month and Cash outflow < 1 month have been instru-mented, using their lagged values and all model variables as instruments.*** Denote that their p-values are less than or equal to 1%.** Denote that their p-values are less than or equal to 5%.* Denote that their p-values are less than or equal to 10%.
L. de Haan, J.W. van den End / Journal of Banking & Finance 37 (2013) 3930–3950 3949
References
Acharya, V.V., Song Shin, H., Yorulmazer, T., 2009. Endogenous Choice of BankLiquidity: The Role of Fire Sales. Bank of England Working Paper 376.
Acharya, V.V., Skeie, D., 2011. A model of liquidity hoarding and term premia ininter-bank markets. Journal of Monetary Economics 58, 436–447.
Aspachs, O., Nier, E., Tiesset, M., 2005. Liquidity, Banking Regulation and theMacroeconomy: Evidence on Bank Liquidity Holdings from a Panel of UK-Resident Banks. Working Paper, London School of Economics.
Baltensperger, E., 1980. Alternative approaches to the theory of the banking firm.Journal of Monetary Economics 6, 1–37.
Banque de France, 2008. Financial Stability Review 11 (special issue on liquidity).Paris.
Barnhill, T., Schumacher, L., 2011. Modelling Correlated Systemic Liquidity andSolvency Risks in A Financial Environment with Incomplete Information. IMFWorking Paper 11/263.
Barrell, R., Davis, E. Ph., Fic, T., Holland, D., Kirby, S., Liadze, I., 2009. OptimalRegulation of Bank Capital and Liquidity: How to Calibrate New InternationalStandards. NIESR, Occasional Paper 38.
Basel Committee on Banking Supervision (BCBS), 2009. International Framework forLiquidity Risk Measurement, Standards and Monitoring. ConsultativeDocument, Basel.
Berben, R.P., Bierut, B., Kakes, J.I., Van den End, J.W., 2010. Macro-effects of highercapital and liquidity requirements for banks: empirical evidence for theNetherlands. DNB Occasional Studies, 8/3.
Berger, A.N., Bouwman, C.H.S., 2009. Bank liquidity creation. Review of FinancialStudies 22, 3779–3837.
Brambor, Th., Clark, W.R., Golder, M., 2006. Understanding interaction models:improving empirical analysis. Political Analysis 14, 63–82.
Chadha, J.S., Corrado, L., 2012. Macro-prudential policy on liquidity: what does aDSGE model tell us? Journal of Economics and Business 64, 37–62.
De Haan, L., Van den End, J.W., 2013. Banks’ responses to funding liquidity shocks:lending adjustment, liquidity hoarding and fire sales. Journal of InternationalFinancial Markets, Institutions and Money (forthcoming).
De Nederlandsche Bank (DNB), 2003. Regulation on Liquidity under the Wft.Amsterdam.
Deep, A., Schaefer, G., 2004. Are Banks Liquidity Transformers? KSG FacultyResearch Working Paper 04–022.
De Socio, A., 2013. The interbank market after the financial turmoil: squeezingliquidity in a ‘‘lemons market’’ or asking liquidity ‘‘on tap’’. Journal of Bankingand Finance 37, 1340–1358.
Diamond, D.W., Dybvig, P., 1983. Bank runs, deposit insurance, and liquidity.Journal of Political Economy 91, 401–419.
Diamond, D.W., 1991. Debt maturity structure and liquidity risk. The QuarterlyJournal of Economics 106, 709–737.
European Central Bank (ECB), 2002. Developments in Banks’ Liquidity Profile andManagement. Frankfurt am Main.
European Central Bank (ECB), 2008. EU Banks’ Liquidity Stress Testing andContingency Funding Plans. Frankfurt am Main.
European Central Bank (ECB), 2009. EU Banks’ Funding Structures and Policies.Frankfurt am Main.
Freixas, X., Rochet, J.-C., 2008. Microeconomics of Banking, second ed. The MITPress, Cambridge (Mass.).
Gauthier, C., He, Z., Souissi, M., 2010. Understanding Systemic Risk: The Trade-offsbetween Capital, Short-term Funding and Liquid Asset Holdings. Bank of CanadaWorking Paper 2010–29.
Gambacorta, L., Mistrulli, P.E., 2004. Does bank capital affect lending behaviour?Journal of Financial Intermediation 13, 436–457.
Goodhart, C., 2008. Liquidity risk management. In: Banque de France (2008), pp.39–44.
He, Z., Xiong, W., 2012. Rollover risk and credit risk. The Journal of Finance 67 (2),391–429.
Heijmans, R.H., 2012. Analysis of Large Value Payment Systems: Liquidity Behaviourand Disruptions. PhD thesis, University of Groningen.
Holl, D., Schertler, A., 2009. Why Do Savings Banks Transform Sight Deposits intoIlliquid Assets Less Intensively than the Regulation Allows? DeutscheBundesbank Discussion Paper Series 2, 05/2009.
Huang, R., Ratnovski, L., 2011. The dark side of bank wholesale funding. Journal ofFinancial Intermediation 20, 248–263.
Kato, R., Kobayashi, S., Saita, Y., 2011. Calibrating the level of capital: the way we seeit. Journal of Mathematics and System Science, 1.
Kim, M., Kliger, D., Vale, B., 2003. Estimating switching costs: the case of banking.Journal of Financial Intermediation 12, 25–56.
Liedorp, F.R., Medema, L., Koetter, M., Koning, R.H., Van Lelyveld, I., 2010. PeerMonitoring or Contagion? Interbank Market Exposure and Bank Risk. DNBWorking Paper 248.
López-Espinosa, G., Moreno, A., Rubia, A., Valderrama, L., 2012. Short-termwholesale funding and systemic risk: a global CoVaR approach. Journal ofBanking and Finance 36, 3150–3162.
Macroeconomic Assessment Group (MAG), 2010. Assessing the MacroeconomicImpact of the Transition to Stronger Capital and Liquidity Requirements.Interim Report. Bank for International Settlements, Basel.
Mink, M., 2011. Procyclical Bank Risk-taking and the Lender of Last Resort. DNBWorking Paper 301.
Morris, S., Shin, H.S., 2009. Illiquidity Component of Credit Risk. Working Paper,Princeton University.
Mulaik, S.A., 1972. The Foundations of Factor Analysis. McGraw-Hill, New York.Murta, F.T.S., Garcia, A.M., 2010. The Demand for Excess Reserves in the Euro Area
and the Impact of the Current Credit Crisis. GEMF Working Paper 2010–01,University of Coimbra.
Rajan, R.S., Bird, G., 2003. Banks, maturity mismatches and liquidity crisis: a simplemodel. International Economics/Economics Internazionale 56, 185–192.
Rösch, C.G., Kaserer, C., 2013. Market liquidity in the financial crisis: the role ofliquidity commonality and flight-to-quality. Journal of Banking and Finance 37,2284–2302.
Saurina, J., 2009. Dynamic Provisioning: The Experience of Spain. Crisis Response 7.The World Bank.
Schanz, J., 2011. A Joint Calibration of Bank Capital and Liquidity Ratios. WorkingPaper, Bank of England.

3950 L. de Haan, J.W. van den End / Journal of Banking & Finance 37 (2013) 3930–3950
Schertler, A., 2010. Insights on banks’ liquidity management: Evidence fromregulatory liquidity data. Beiträge zur Jahrestagung des Vereins fürSozialpolitik A7–V2, Leibniz.
Schleifer, A., Vishny, R.W., 2010. Unstable banking. Journal of Financial Economics97, 306–318.
Van den End, J.W., Tabbae, M., 2012. When liquidity risk becomes a systemicissue: empirical evidence of bank behaviour. Journal of Financial Stability 8,107–120.
Van den End, J.W., Kruidhof, M., 2013. Modelling the liquidity ratio asmacroprudential instrument. Journal of Banking Regulation 14, 91–106.
Van Greuning, H., Brajovic Bratanovic, S., 2000. Analyzing Bank Risk: A Frameworkfor Assessing Corporate Governance and Financial Risk Management. The WorldBank, Washington.
Bonner, C., Van Lelyveld, I., Zymek, R., 2013. Determinants of Banks’ LiquidityBuffers and the Role of Liquidity Regulation. Working paper, De NederlandscheBank.