Embed Size (px)
Citation preview

Bank Competition in MENA
Diego Anzoategui (DEC-FP)María Soledad Martínez Pería (DEC-FP)
Roberto Rocha (MNSFP)
Presentation for the FPD Academy AwardNovember 30, 2010
1
Banking sectors in MENA are among the largest
2
0%
10%
20%
30%
40%
50%
60%
70%
MENA East Asia Eastern Europe Former Soviet Union Latin America South Asia Sub-Saharan Africa
Bank assets as a ratio of GDP (Average 2002-2008)
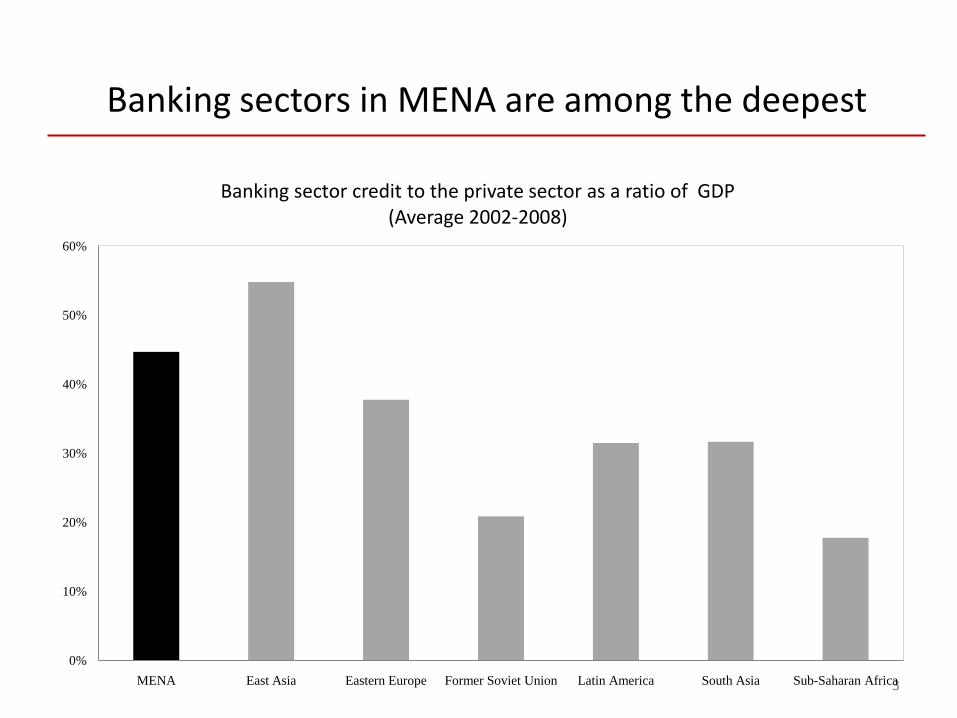
Banking sectors in MENA are among the deepest
3
0%
10%
20%
30%
40%
50%
60%
MENA East Asia Eastern Europe Former Soviet Union Latin America South Asia Sub-Saharan Africa
Banking sector credit to the private sector as a ratio of GDP (Average 2002-2008)
4
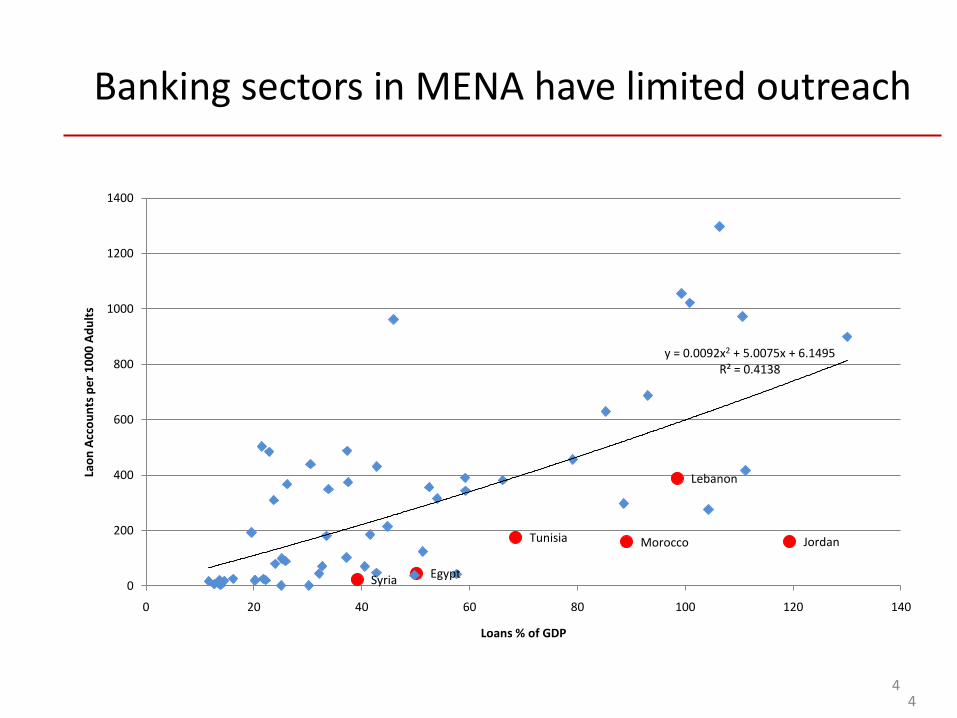
Banking sectors in MENA have limited outreach
4
JordanMorocco
Syria
Tunisia
Egypt
Lebanon
y = 0.0092x2 + 5.0075x + 6.1495R² = 0.4138
0
200
400
600
800
1000
1200
1400
0 20 40 60 80 100 120 140
Lao
n A
cco
un
ts p
er
10
00
Ad
ult
s
Loans % of GDP
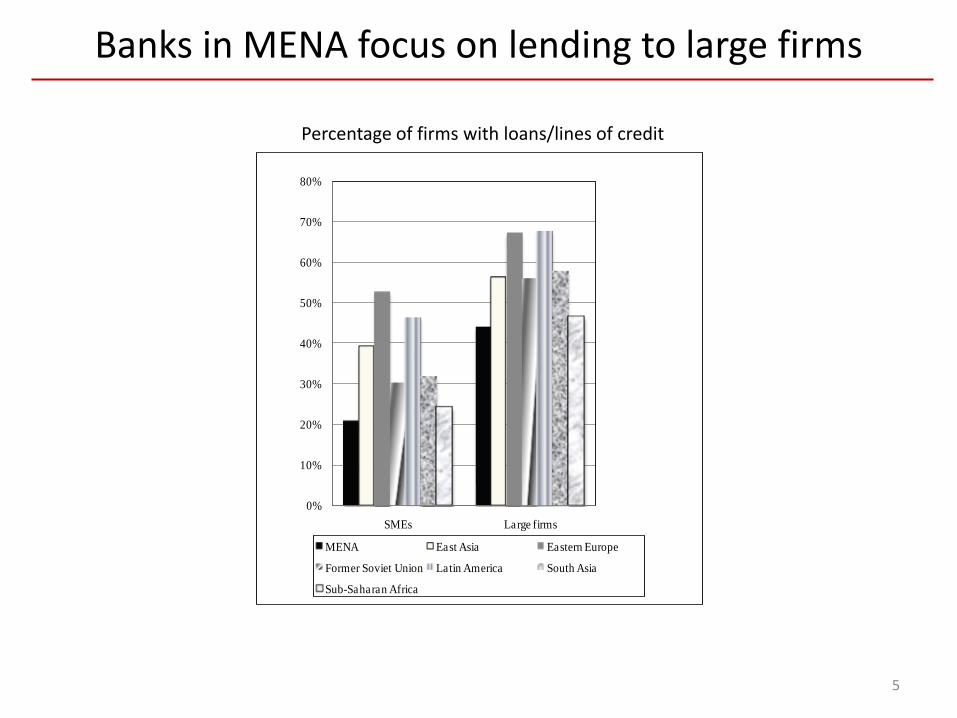
Percentage of firms with loans/lines of credit
Banks in MENA focus on lending to large firms
5
0%
10%
20%
30%
40%
50%
60%
70%
80%
SMEs Large firms
MENA East Asia Eastern Europe
Former Soviet Union Latin America South Asia
Sub-Saharan Africa
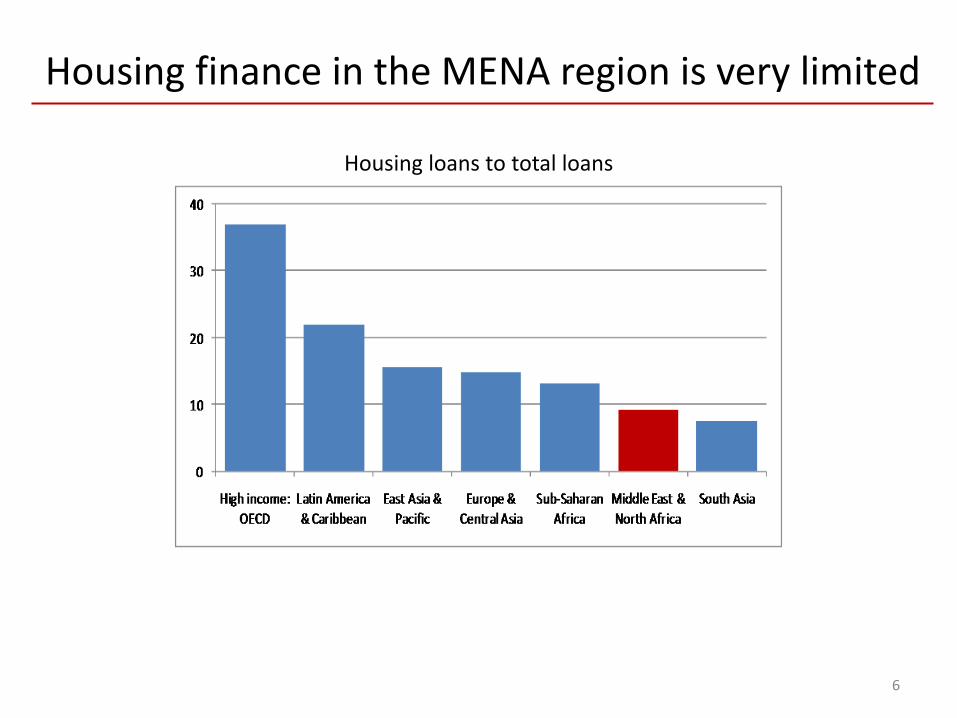
Housing finance in the MENA region is very limited
6
Housing loans to total loans
Main question of this paper:Are MENA’s banking sectors competitive?
• This study analyzes bank competition in MENA using non-structural measures that assess market power from the observed behavior of banks.– Panzar and Rosse H-statistic: Infers competitive behavior/market type
from the elasticity of revenues to input prices
– Lerner index: Directly measures pricing power by examining price markup over marginal costs
• We analyze the evolution of banking competition over time.
• We compare differences in competition across regions.
• We study the drivers of competition in MENA.
7
Why care about bank competition?
• Bank competition may lead to:
– Lower prices for services and products (due to greater efficiencies).
– Greater innovation/variety of services and products.
– Greater access to services and products.
– Lower probability of regulatory capture and incidence of forbearance.
– Greater banking stability as it can avoid “too big to fail” cases or too complex and hard to supervise institutions.
8
Main findings
• We find that competition in MENA is lower than in most other regions.
– H-statistics and Lerner indexes reveal that bank competition is lagging relative to other regions, and has not improved significantly over time.
• An evaluation of the factors driving differences across countries suggests that a worse credit information environment and the fact that banking sectors in MENA are less contestable are the root causes for our findings.
9
Rest of the presentation
• Review main approaches to analyze competition
• Discuss the methodologies to calculate the H-statistic and Lerner index
• Describe the data and sample
• Present results for the H-statistic and Lerner index
• Analyze differences in the H-statistic across regions
• Conclude
10
Approaches to evaluate bank competition
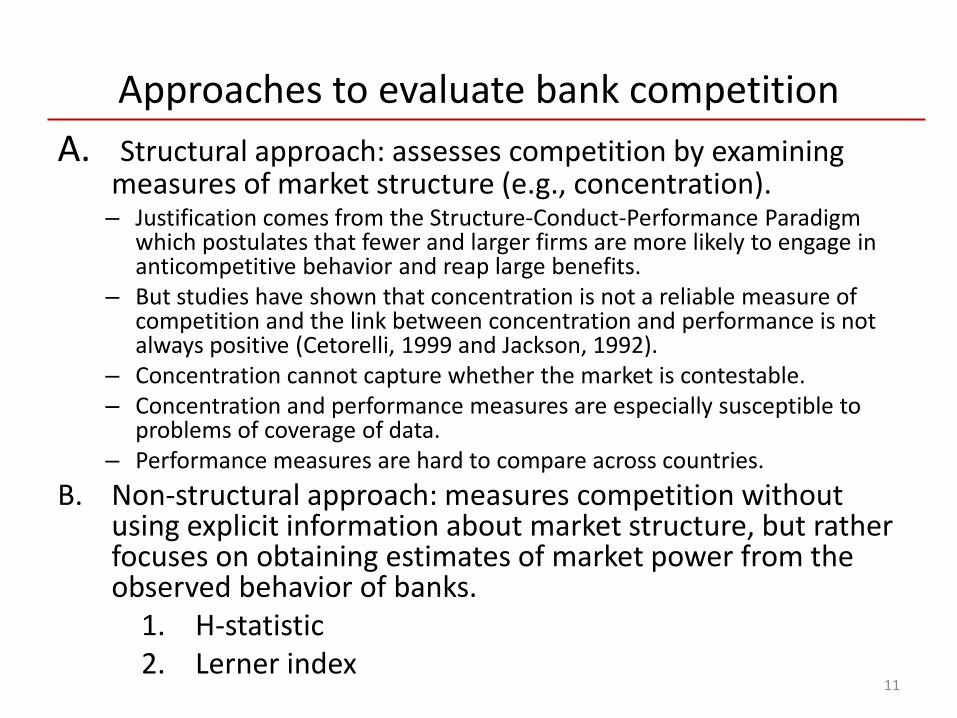
A. Structural approach: assesses competition by examining measures of market structure (e.g., concentration).– Justification comes from the Structure-Conduct-Performance Paradigm
which postulates that fewer and larger firms are more likely to engage in anticompetitive behavior and reap large benefits.
– But studies have shown that concentration is not a reliable measure of competition and the link between concentration and performance is not always positive (Cetorelli, 1999 and Jackson, 1992).
– Concentration cannot capture whether the market is contestable.– Concentration and performance measures are especially susceptible to
problems of coverage of data.– Performance measures are hard to compare across countries.
B. Non-structural approach: measures competition without using explicit information about market structure, but rather focuses on obtaining estimates of market power from the observed behavior of banks.
1. H-statistic2. Lerner index
11
H-statistic
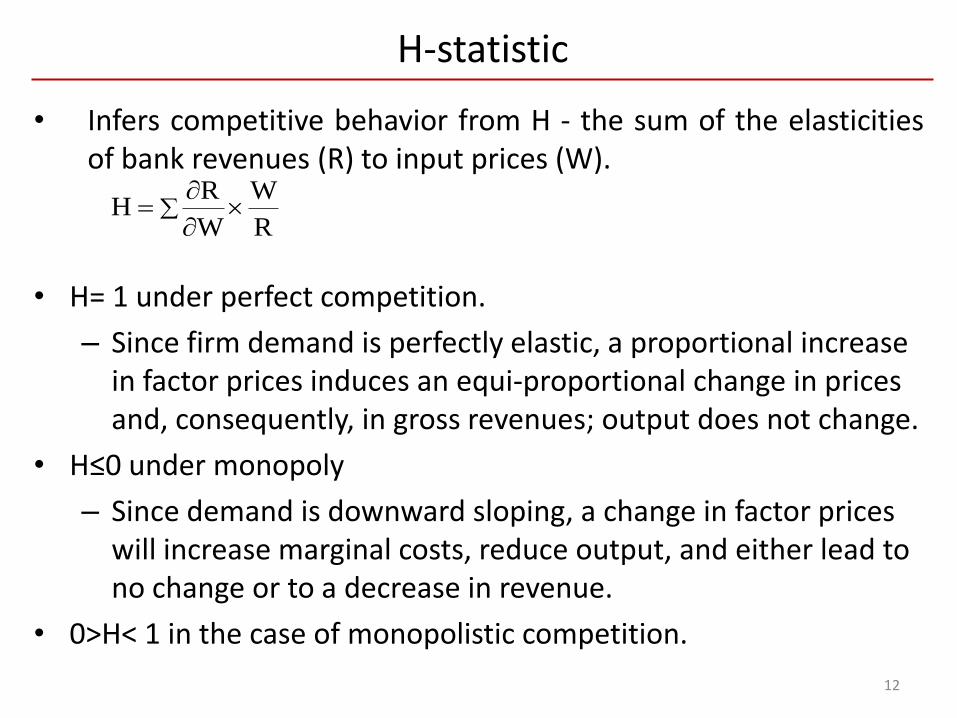
• Infers competitive behavior from H - the sum of the elasticitiesof bank revenues (R) to input prices (W).
• H= 1 under perfect competition.
– Since firm demand is perfectly elastic, a proportional increase in factor prices induces an equi-proportional change in prices and, consequently, in gross revenues; output does not change.
• H≤0 under monopoly
– Since demand is downward sloping, a change in factor prices will increase marginal costs, reduce output, and either lead to no change or to a decrease in revenue.
• 0>H< 1 in the case of monopolistic competition.
12
R
W
W
RH
H-statistic
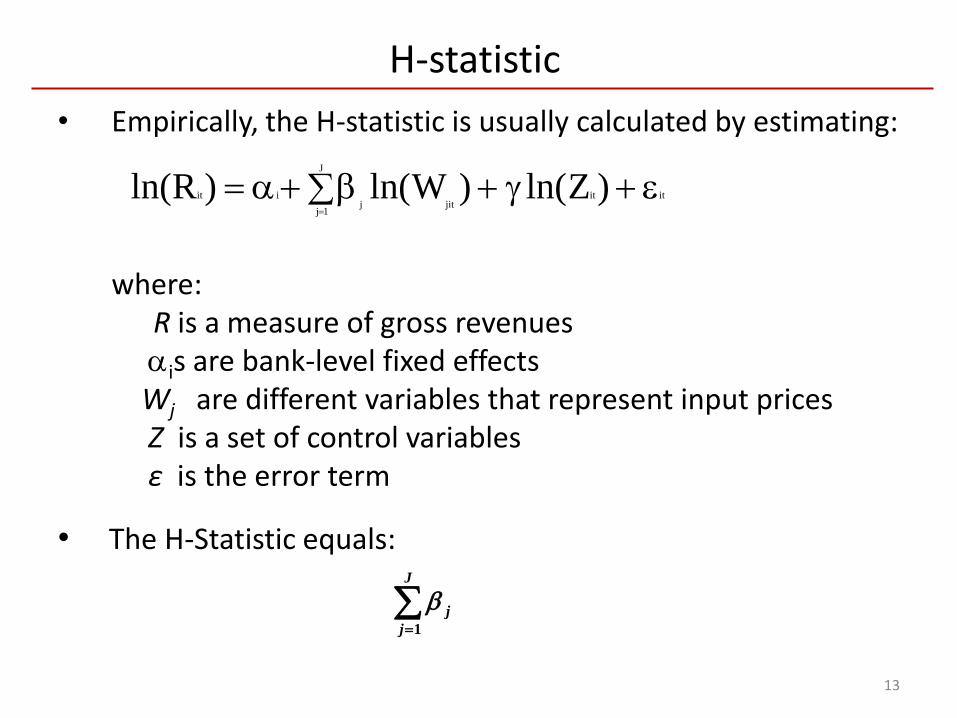
• Empirically, the H-statistic is usually calculated by estimating:
where: R is a measure of gross revenuesis are bank-level fixed effects Wj are different variables that represent input pricesZ is a set of control variablesε is the error term
• The H-Statistic equals:
13
itit
J
1jjitj
iit )Zln()Wln()Rln(
J
j
j
1
Lerner Index
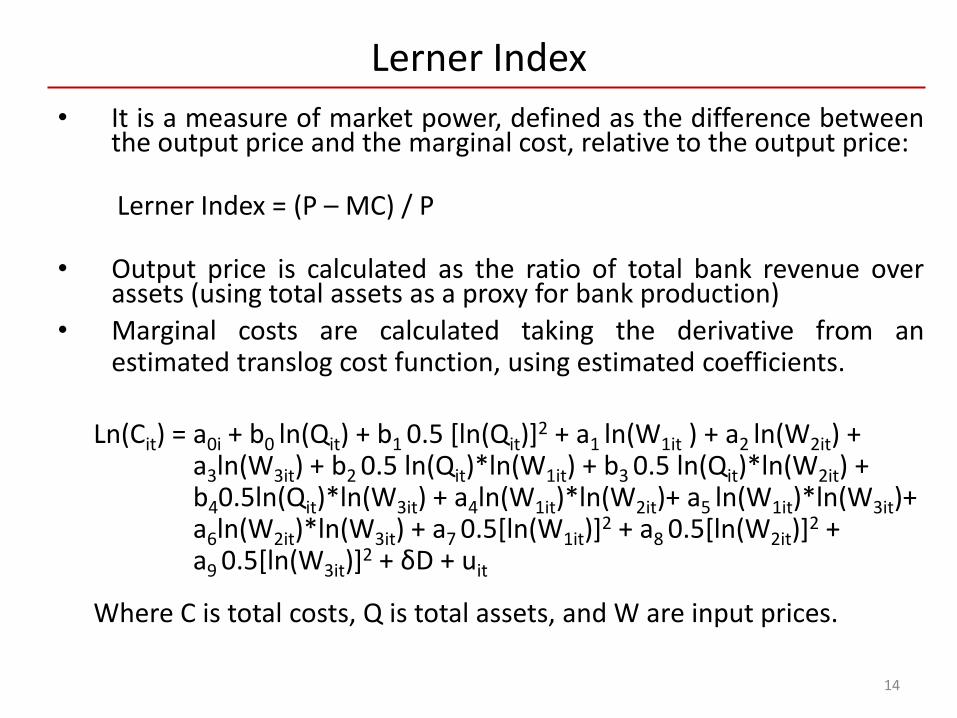
• It is a measure of market power, defined as the difference betweenthe output price and the marginal cost, relative to the output price:
Lerner Index = (P – MC) / P
• Output price is calculated as the ratio of total bank revenue overassets (using total assets as a proxy for bank production)
• Marginal costs are calculated taking the derivative from anestimated translog cost function, using estimated coefficients.
Ln(Cit) = a0i + b0 ln(Qit) + b1 0.5 [ln(Qit)]2 + a1 ln(W1it ) + a2 ln(W2it) +
a3ln(W3it) + b2 0.5 ln(Qit)*ln(W1it) + b3 0.5 ln(Qit)*ln(W2it) +b40.5ln(Qit)*ln(W3it) + a4ln(W1it)*ln(W2it)+ a5 ln(W1it)*ln(W3it)+a6ln(W2it)*ln(W3it) + a7 0.5[ln(W1it)]
2 + a8 0.5[ln(W2it)]2 +
a9 0.5[ln(W3it)]2 + δD + uit
Where C is total costs, Q is total assets, and W are input prices.
14
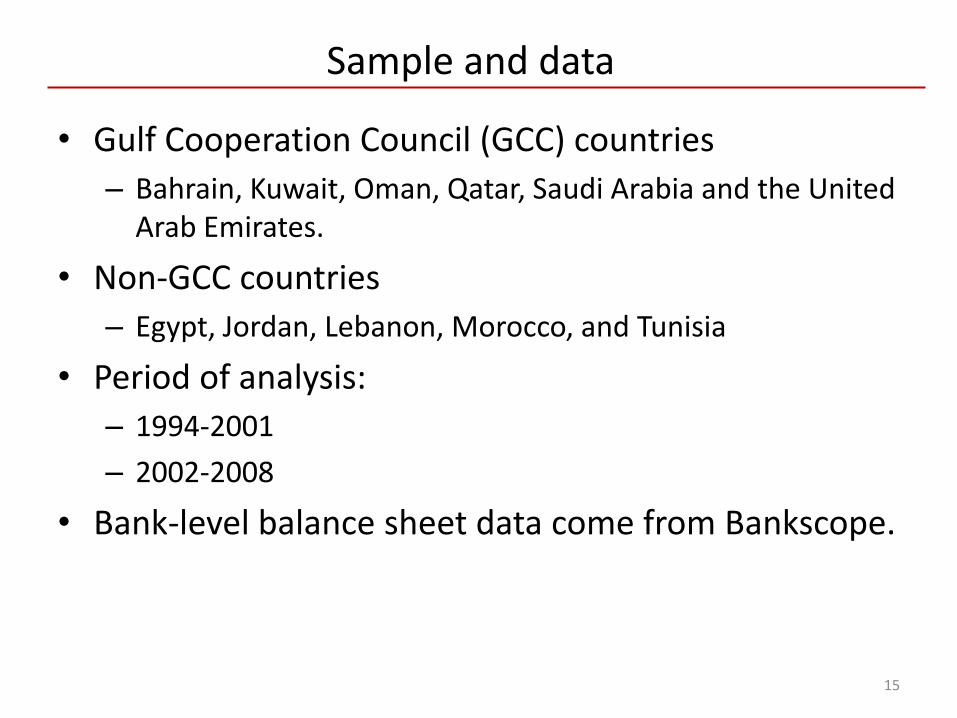
Sample and data
• Gulf Cooperation Council (GCC) countries
– Bahrain, Kuwait, Oman, Qatar, Saudi Arabia and the United Arab Emirates.
• Non-GCC countries
– Egypt, Jordan, Lebanon, Morocco, and Tunisia
• Period of analysis:
– 1994-2001
– 2002-2008
• Bank-level balance sheet data come from Bankscope.
15
16
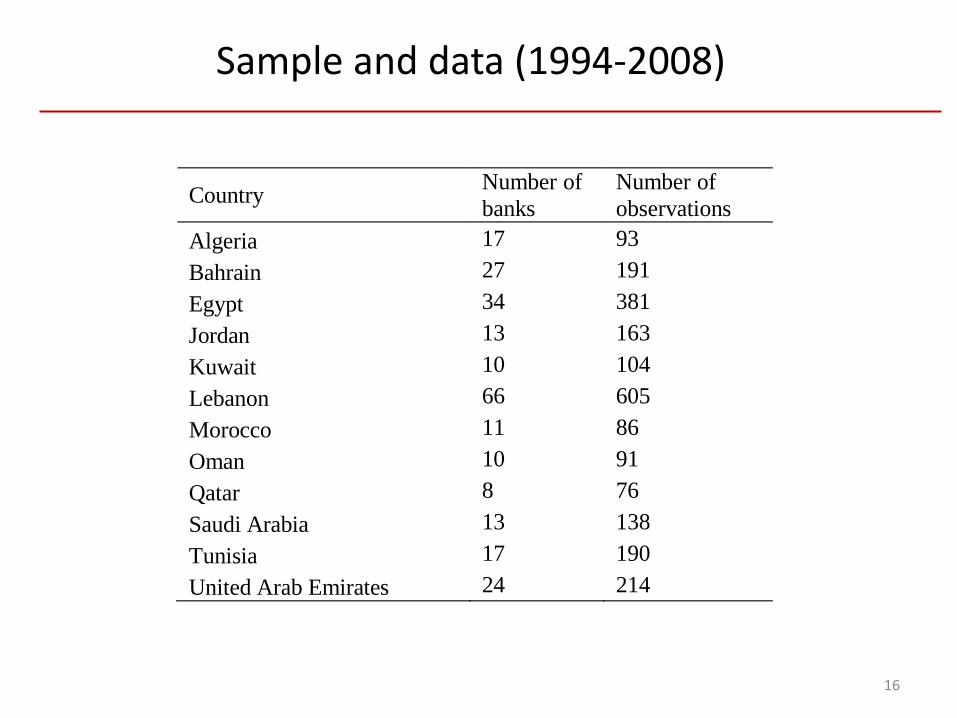
Sample and data (1994-2008)
Country Number of
banks Number of
observations
Algeria 17 93
Bahrain 27 191
Egypt 34 381
Jordan 13 163
Kuwait 10 104
Lebanon 66 605
Morocco 11 86
Oman 10 91
Qatar 8 76
Saudi Arabia 13 138
Tunisia 17 190
United Arab Emirates 24 214
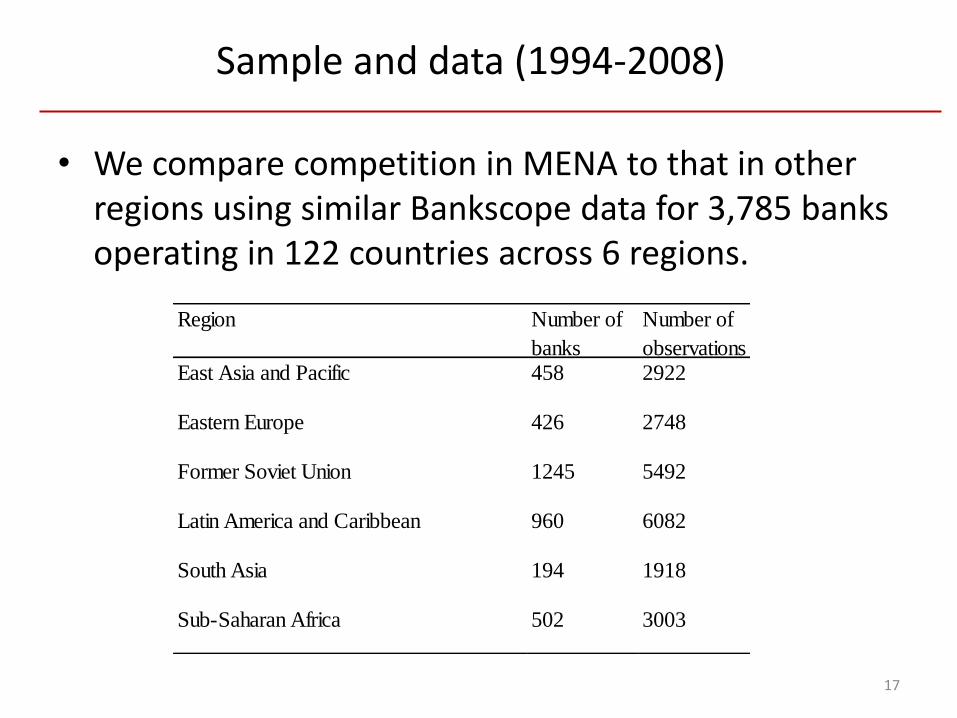
• We compare competition in MENA to that in other regions using similar Bankscope data for 3,785 banks operating in 122 countries across 6 regions.
17
Sample and data (1994-2008)
Region Number of
banks
Number of
observationsEast Asia and Pacific 458 2922
Eastern Europe 426 2748
Former Soviet Union 1245 5492
Latin America and Caribbean 960 6082
South Asia 194 1918
Sub-Saharan Africa 502 3003
18
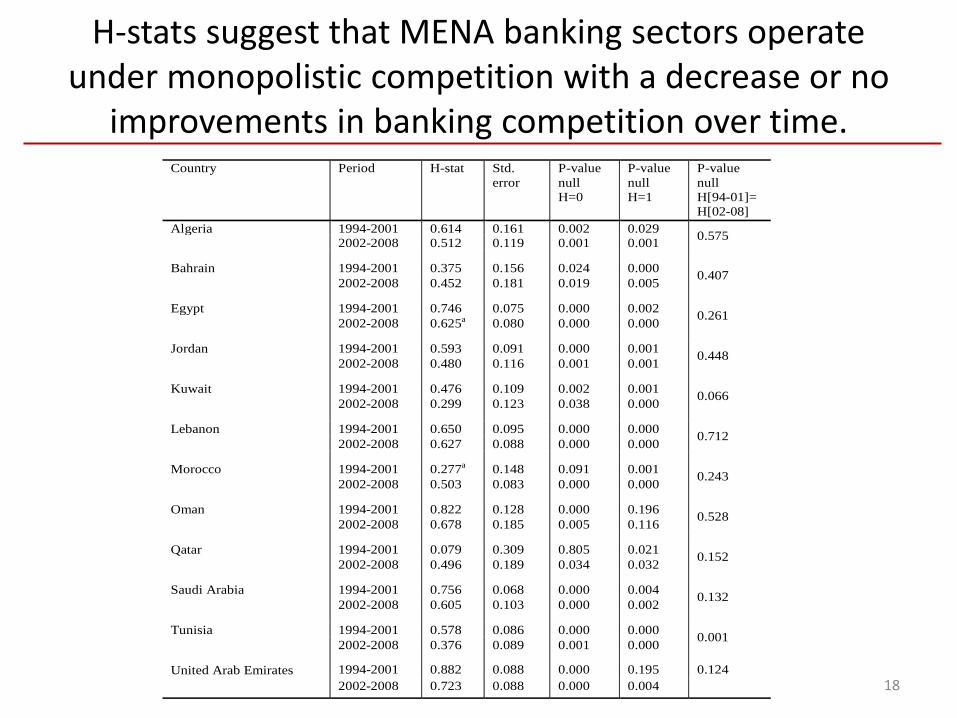
Country Period H-stat Std.
error
P-value
null
H=0
P-value
null
H=1
P-value
null
H[94-01]=
H[02-08]
Algeria 1994-2001 0.614 0.161 0.002 0.029 0.575
2002-2008 0.512 0.119 0.001 0.001
Bahrain 1994-2001 0.375 0.156 0.024 0.000 0.407
2002-2008 0.452 0.181 0.019 0.005
Egypt 1994-2001 0.746 0.075 0.000 0.002 0.261
2002-2008 0.625a 0.080 0.000 0.000
Jordan 1994-2001 0.593 0.091 0.000 0.001 0.448
2002-2008 0.480 0.116 0.001 0.001
Kuwait 1994-2001 0.476 0.109 0.002 0.001 0.066
2002-2008 0.299 0.123 0.038 0.000
Lebanon 1994-2001 0.650 0.095 0.000 0.000 0.712
2002-2008 0.627 0.088 0.000 0.000
Morocco 1994-2001 0.277a 0.148 0.091 0.001 0.243
2002-2008 0.503 0.083 0.000 0.000
Oman 1994-2001 0.822 0.128 0.000 0.196 0.528
2002-2008 0.678 0.185 0.005 0.116
Qatar 1994-2001 0.079 0.309 0.805 0.021 0.152
2002-2008 0.496 0.189 0.034 0.032
Saudi Arabia 1994-2001 0.756 0.068 0.000 0.004 0.132
2002-2008 0.605 0.103 0.000 0.002
Tunisia 1994-2001 0.578 0.086 0.000 0.000 0.001
2002-2008 0.376 0.089 0.001 0.000
United Arab Emirates 1994-2001 0.882 0.088 0.000 0.195 0.124
2002-2008 0.723 0.088 0.000 0.004
H-stats suggest that MENA banking sectors operate under monopolistic competition with a decrease or no
improvements in banking competition over time.
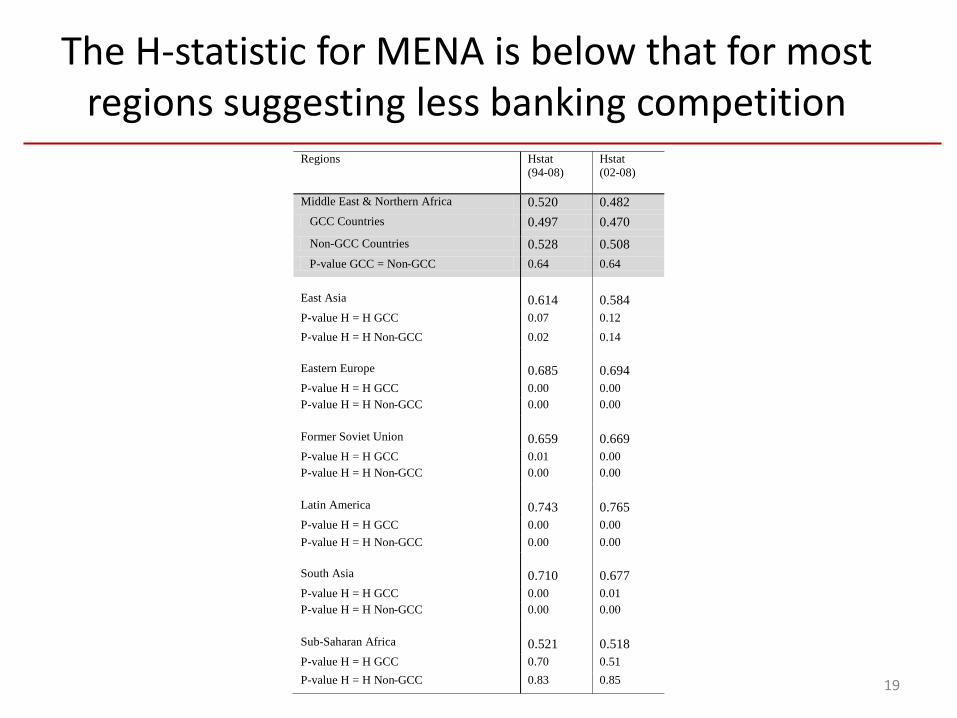
The H-statistic for MENA is below that for most regions suggesting less banking competition
19
Regions Hstat
(94-08)
Hstat
(02-08)
Middle East & Northern Africa 0.520 0.482
GCC Countries 0.497 0.470
Non-GCC Countries 0.528 0.508
P-value GCC = Non-GCC 0.64 0.64
East Asia
0.614
0.584
P-value H = H GCC 0.07 0.12
P-value H = H Non-GCC 0.02 0.14
Eastern Europe
0.685
0.694
P-value H = H GCC 0.00 0.00
P-value H = H Non-GCC 0.00 0.00
Former Soviet Union
0.659
0.669
P-value H = H GCC 0.01 0.00
P-value H = H Non-GCC 0.00 0.00
Latin America
0.743
0.765
P-value H = H GCC 0.00 0.00
P-value H = H Non-GCC 0.00 0.00
South Asia
0.710
0.677
P-value H = H GCC 0.00 0.01
P-value H = H Non-GCC 0.00 0.00
Sub-Saharan Africa
0.521
0.518
P-value H = H GCC 0.70 0.51
P-value H = H Non-GCC 0.83 0.85
20
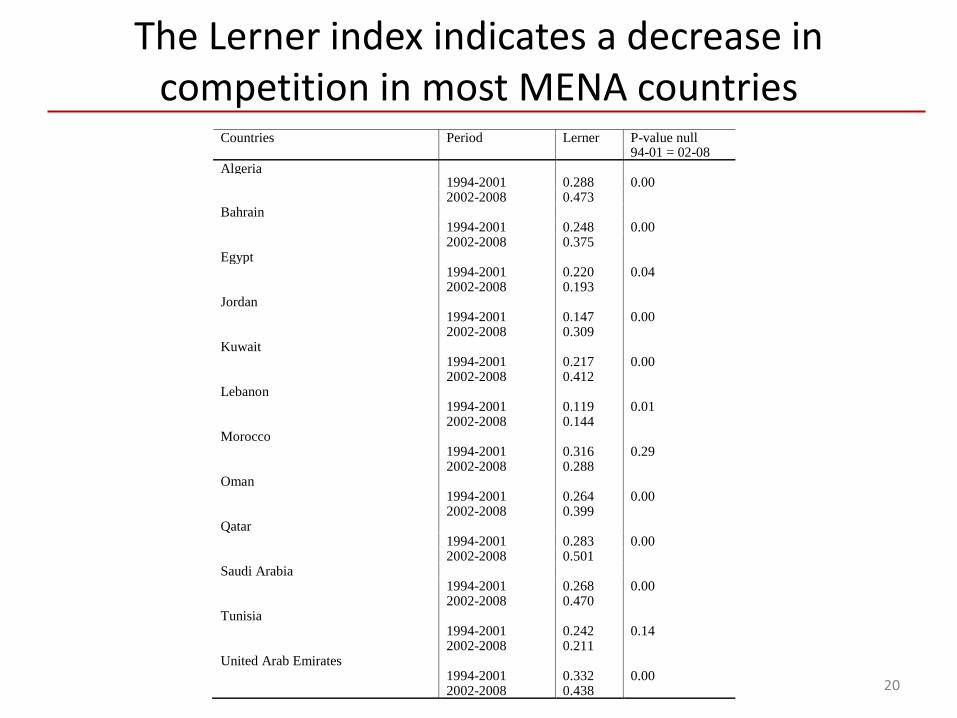
The Lerner index indicates a decrease in competition in most MENA countries
Countries Period Lerner P-value null 94-01 = 02-08
Algeria
1994-2001 0.288 0.00
2002-2008 0.473
Bahrain
1994-2001 0.248 0.00
2002-2008 0.375
Egypt
1994-2001 0.220 0.04
2002-2008 0.193
Jordan
1994-2001 0.147 0.00
2002-2008 0.309
Kuwait
1994-2001 0.217 0.00
2002-2008 0.412
Lebanon
1994-2001 0.119 0.01
2002-2008 0.144
Morocco
1994-2001 0.316 0.29
2002-2008 0.288
Oman
1994-2001 0.264 0.00
2002-2008 0.399
Qatar
1994-2001 0.283 0.00
2002-2008 0.501
Saudi Arabia
1994-2001 0.268 0.00
2002-2008 0.470
Tunisia
1994-2001 0.242 0.14
2002-2008 0.211
United Arab Emirates
1994-2001 0.332 0.00
2002-2008 0.438
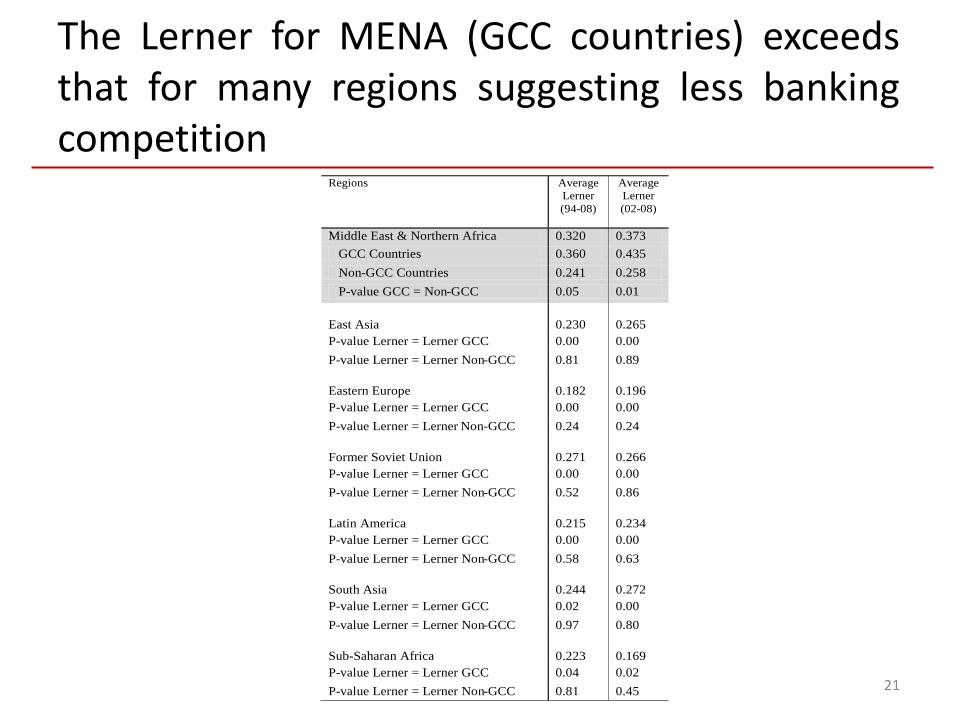
The Lerner for MENA (GCC countries) exceedsthat for many regions suggesting less bankingcompetition
21
Regions Average
Lerner
(94-08)
Average
Lerner
(02-08)
Middle East & Northern Africa 0.320 0.373
GCC Countries 0.360 0.435
Non-GCC Countries 0.241 0.258
P-value GCC = Non-GCC 0.05 0.01
East Asia
0.230
0.265
P-value Lerner = Lerner GCC 0.00 0.00
P-value Lerner = Lerner Non-GCC 0.81 0.89
Eastern Europe
0.182
0.196
P-value Lerner = Lerner GCC 0.00 0.00
P-value Lerner = Lerner Non-GCC 0.24 0.24
Former Soviet Union
0.271
0.266
P-value Lerner = Lerner GCC 0.00 0.00
P-value Lerner = Lerner Non-GCC 0.52 0.86
Latin America
0.215
0.234
P-value Lerner = Lerner GCC 0.00 0.00
P-value Lerner = Lerner Non-GCC 0.58 0.63
South Asia
0.244
0.272
P-value Lerner = Lerner GCC 0.02 0.00
P-value Lerner = Lerner Non-GCC 0.97 0.80
Sub-Saharan Africa
0.223
0.169
P-value Lerner = Lerner GCC 0.04 0.02
P-value Lerner = Lerner Non-GCC 0.81 0.45
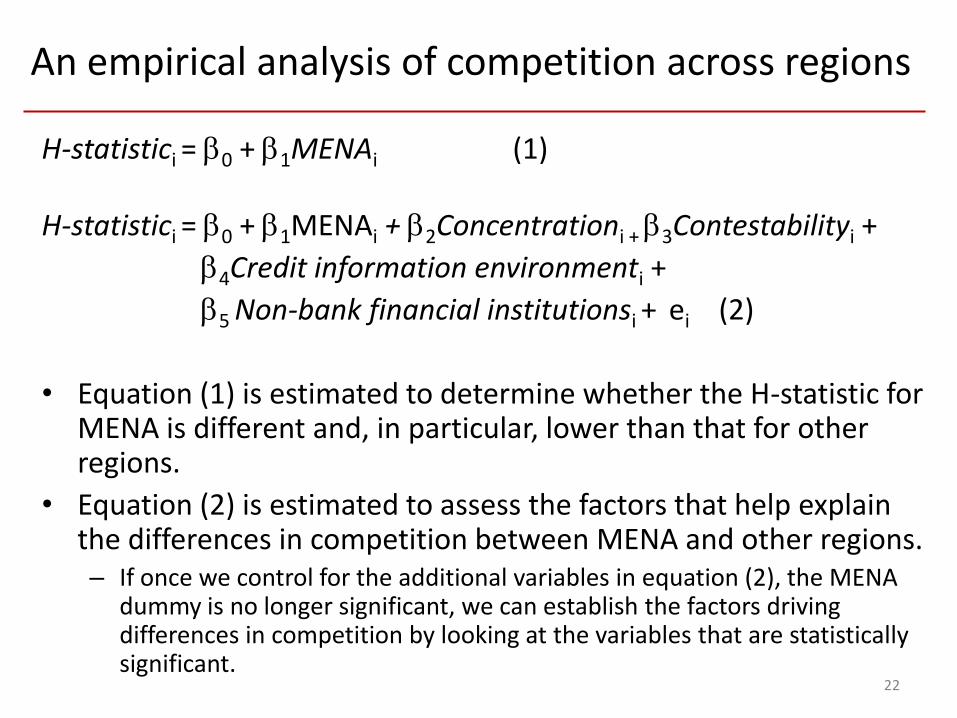
An empirical analysis of competition across regions
H-statistici = 0 + 1MENAi (1)
H-statistici = 0 + 1MENAi + 2Concentrationi + 3Contestabilityi +
4Credit information environmenti +
5 Non-bank financial institutionsi + ei (2)
• Equation (1) is estimated to determine whether the H-statistic for MENA is different and, in particular, lower than that for other regions.
• Equation (2) is estimated to assess the factors that help explain the differences in competition between MENA and other regions. – If once we control for the additional variables in equation (2), the MENA
dummy is no longer significant, we can establish the factors driving differences in competition by looking at the variables that are statistically significant.
22
Potential determinants of competition
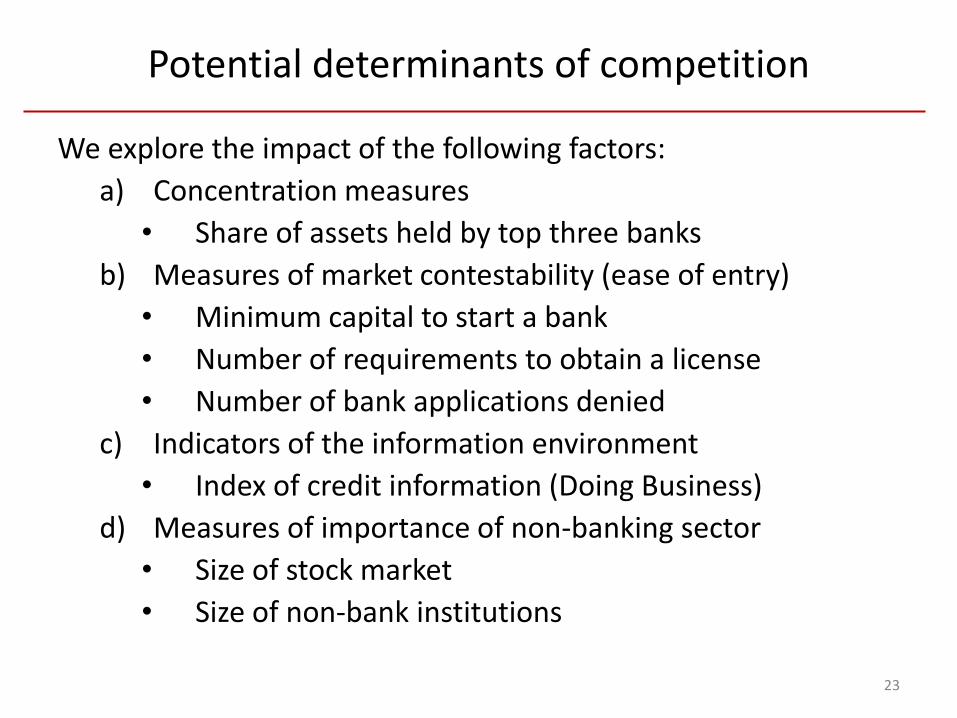
We explore the impact of the following factors:
a) Concentration measures
• Share of assets held by top three banks
b) Measures of market contestability (ease of entry)
• Minimum capital to start a bank
• Number of requirements to obtain a license
• Number of bank applications denied
c) Indicators of the information environment
• Index of credit information (Doing Business)
d) Measures of importance of non-banking sector
• Size of stock market
• Size of non-bank institutions
23
24
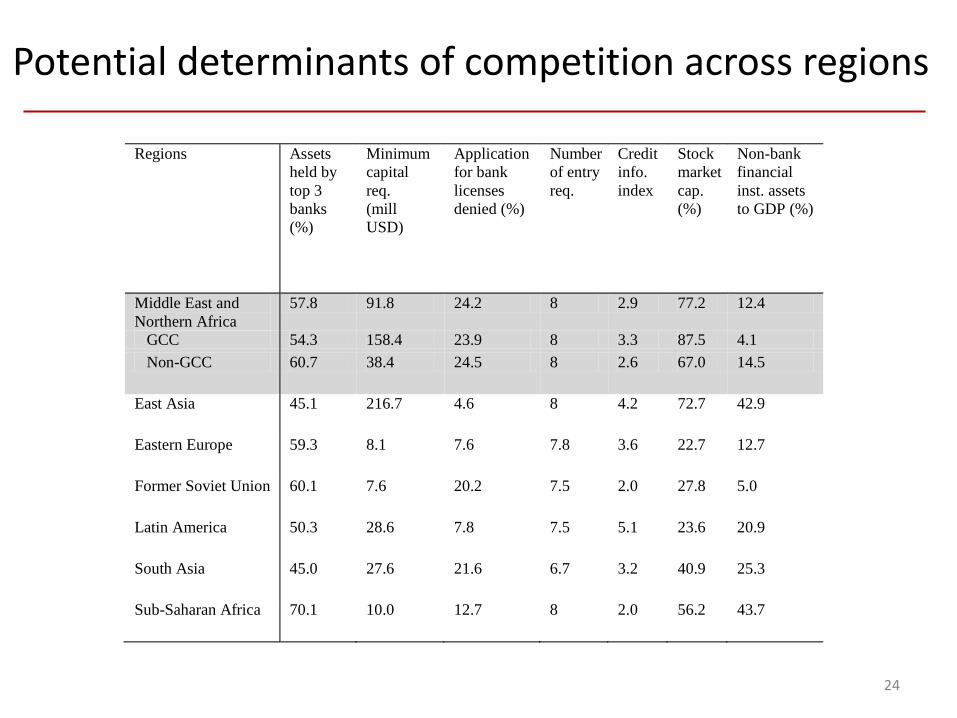
Potential determinants of competition across regions
Regions Assets
held by
top 3
banks
(%)
Minimum
capital
req.
(mill
USD)
Application
for bank
licenses
denied (%)
Number
of entry
req.
Credit
info.
index
Stock
market
cap.
(%)
Non-bank
financial
inst. assets
to GDP (%)
Middle East and
Northern Africa
57.8 91.8 24.2 8 2.9 77.2 12.4
GCC 54.3 158.4 23.9 8 3.3 87.5 4.1
Non-GCC 60.7 38.4 24.5 8 2.6 67.0 14.5
East Asia 45.1 216.7 4.6 8 4.2 72.7 42.9
Eastern Europe 59.3 8.1 7.6 7.8 3.6 22.7 12.7
Former Soviet Union 60.1 7.6 20.2 7.5 2.0 27.8 5.0
Latin America 50.3 28.6 7.8 7.5 5.1 23.6 20.9
South Asia 45.0 27.6 21.6 6.7 3.2 40.9 25.3
Sub-Saharan Africa 70.1 10.0 12.7 8 2.0 56.2 43.7
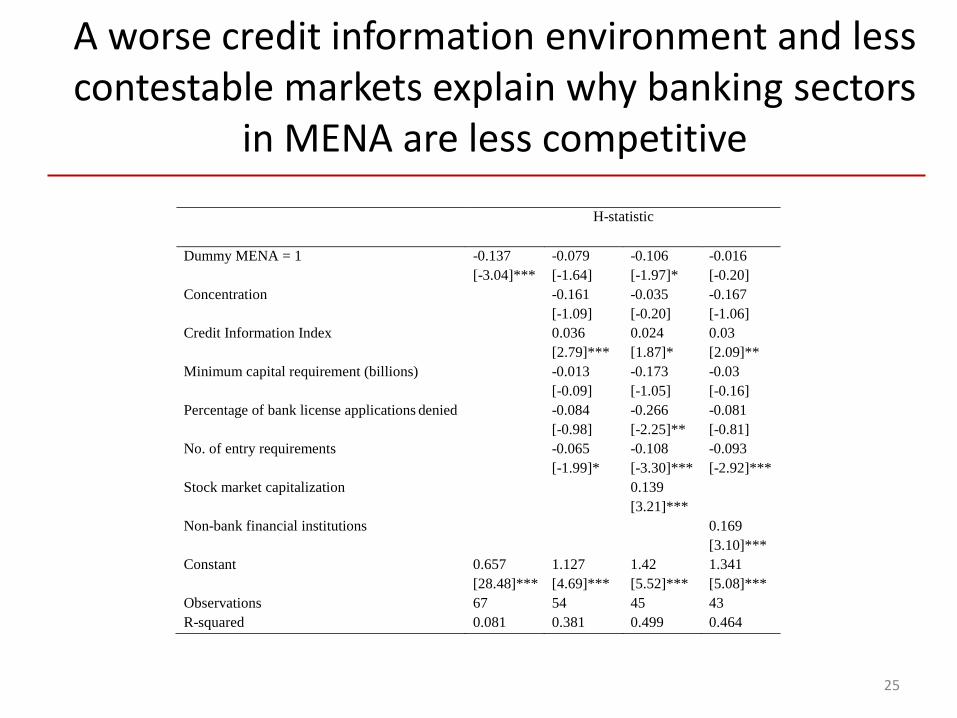
A worse credit information environment and less contestable markets explain why banking sectors
in MENA are less competitive
25
H-statistic
Dummy MENA = 1 -0.137 -0.079 -0.106 -0.016
[-3.04]*** [-1.64] [-1.97]* [-0.20]
Concentration -0.161 -0.035 -0.167
[-1.09] [-0.20] [-1.06]
Credit Information Index 0.036 0.024 0.03
[2.79]*** [1.87]* [2.09]**
Minimum capital requirement (billions) -0.013 -0.173 -0.03
[-0.09] [-1.05] [-0.16]
Percentage of bank license applications denied -0.084 -0.266 -0.081
[-0.98] [-2.25]** [-0.81]
No. of entry requirements -0.065 -0.108 -0.093
[-1.99]* [-3.30]*** [-2.92]***
Stock market capitalization 0.139
[3.21]***
Non-bank financial institutions 0.169
[3.10]***
Constant 0.657 1.127 1.42 1.341
[28.48]*** [4.69]*** [5.52]*** [5.08]***
Observations 67 54 45 43
R-squared 0.081 0.381 0.499 0.464
Conclusions
• We provide evidence that competition in MENA is lower than in most regions of the developing world. – Non-structural measures of competition such as the H-statistic and the
Lerner Index suggest that banking sectors in MENA are lagging behind in terms of competition.
– Comparisons over time indicate that competition has not improved and, in many cases, has worsened with MENA.
• A worse credit information environment and stricter regulations and practices governing bank entry are to blame.
• Hence, measures to promote competition in MENA should focus on making banking sectors in the region more contestable and on improving the scope, access, and quality of credit information among banks.
26


![ARAB BANK MENA FUND - AB Invest · ARAB BANK MENA FUND COMPANY B.S.C. (CLOSED)) Offering of up to [30,000,000] Units each valued at US$10.00 Investment Manager and Placement Agent](https://img.pdfslide.us/doc/110x75/5c80092b09d3f2a2228c3fa7/arab-bank-mena-fund-ab-arab-bank-mena-fund-company-bsc-closed-offering.jpg)