Embed Size (px)
Citation preview
Bangor Business School Working Paper
(Cla 24)
BBSWP/18/01
Bank Profits and Margins in a World of Negative Rates
(Bold, Ce capital By
Philip Molyneux, Alessio Reghezza and Ru Xie
Division of Financial Studies
May, 2018
Bangor Business School Bangor University Hen Goleg College Road Bangor Gwynedd LL57 2DG United Kingdom Tel: +44 (0) 1248 382277 E-mail: [email protected]
Bank Profits and Margins in a World of Negative Rates1
Abstract
This paper investigates the influence of negative interest rate policy (NIRP) on bank margins and profitability.
Using a dataset comprising 7242 banks from 33 OECD member countries over 2012-2016 and a difference-in-
differences methodology, we find that bank margins and profits fell in NIRP-adopter countries compared to
countries that did not adopt the policy. The results are robust to a variety of checks. This adverse NIRP effect
appears to have been stronger for banks that were small, operating in competitive system as well as in countries
where floating loan rates predominate.
JEL: E43, E44, E52, G21, F34
Keywords: Negative interest rates, bank profitability, NIMs, difference-in-differences estimation
1 The authors are grateful to Yener Altunbas, Claudia Girardone, Iftekhar Hasan, Dave Humphrey, Daniel McGowan, Enrico Onali, Klaus Schaeck, Jonathan Williams and Bob De Young for the precious comments. All errors are our responsibility.
Bank Profits and Margins in a World of Negative rates
Introduction Since the Global Financial Crisis (GFC), policy-makers have been facing a challenging economic situation
dominated by economic stagnation, high unemployment and deflation. As a first monetary policy response, central
banks cut interest rates aggressively through conventional accommodative monetary policies. However, when
interest rates approached the zero lower bound (ZLB) without producing the hoped for effects on nominal
spending and inflation, many central banks implemented a range of unconventional monetary policies (UMPs)
including large scale asset purchase (LSAPs), in the form of quantitative easing, as well as policy rate forward
guidance2. UMP took a step further from 2012 onwards when several countries/regions (Denmark, the Euro Area,
Hungary, Norway, Sweden, Switzerland and Japan) implemented negative interest rates policy (NIRP) in order
to provide further economic stimulus to constantly weak economies3. The aim of NIRP (see Couere’., 2016) is to
increase the cost to banks of holding excess reserves at the central bank encouraging them to take them back on
the balance sheet. This should lead to beneficial outcomes for the real economy coming mostly from a greater
supply and demand for loans due to the decline in funding costs for both banks and borrowers. Nevertheless, going
beyond the barrier determined by the ZLB and pushing rates4 into “uncharted” negative territory deserves serious
consideration and analyses. In this regard, the “how low for how long” question has raised concern about the long-
term effect of this policy on financial intermediaries’ performance and on the economy as a whole (see,
McAndrews., 2015)5. A cut in interest rates into negative territory may increase bank profitability if there is
significant loan growth and margins are unaffected, or/and if banks boost fee and commission income on the back
of greater lending. However, if banks are unable to reduce deposit rates to the same extent as loan rates then
margins will be compressed, and if there is limited loan growth and/or cross-selling of fee and commission
services then profits will likely fall. If the latter is the case, the decline in profits can erode bank capital bases and
further limit credit growth thus stifling NIRP monetary transmission effects. This influence of NIRP on bank
performance may further be aggravated in the European context where banks have been struggling to maintain
(respectable) levels of profitability because of a slow economic recovery, historically high levels of non-
performing loans, and a post GFC and European sovereign debt crisis deleveraging phase.
We contribute to the existing literature, which focuses on low and/or more ‘normal’ interest rate environments by
evaluating the impact of an unexplored monetary policy instrument as the NIRP on net interest margins (NIMs)
and bank profitability. We employ a bank-level database comprising 7242 banks in 33 OECD countries for the
period 2012-2016 and a difference-in-differences methodology. This methodology allows us to draw conclusion
as to whether banks’ NIMs and profitability in NIRP adopter countries were impacted differently than countries
that did not adopt the policy. Moreover, it permits us to analyse both macroeconomic and bank-level factors that
2 See Reifschneider and Williams (2000) and Chung et al. (2012) for the impact of the zero lower bound constraint and Gambacorta et al. (2014), Borio and Zabai (2016) and Hamilton et al. (2012) for the effectiveness of unconventional monetary policies. 3 See Bech and Malkhozov (2015) for a discussion of the implementation mechanisms of NIRP in adopting countries. The time of introduction of NIRP is noted in Table A1 in the appendix. 4 $12 trillion of bonds in 2016 were traded at negative yield (see Kunz, 2016). 5 There has been discussion that negative rates promote bubbles in the bond and housing markets. In our analysis, we will focus on the performance of the banking sector.

affect performance in the uncharted territory of NIRP. We find that NIM and return-on-assets (RoAs) show a
strong contraction after NIRP implementation. Our results highlight that NIM contraction reduces banks’
profitability, despite the case that lower rates can boost bank profits through valuation gains on fixed-income
securities (direct) and a reduced cost of non-performing loans (indirect). Finally, the negative effect on profits and
margins appears to have been stronger for banks that are small, operating in countries where markets are more
competitive and floating interest rates predominate.
The paper proceeds as follow. Section 2 reviews the academic literature on the impact of interest rates on bank
profitability and margins. Section 3 introduces our data and methodology. Section 4 presents our results along
with several robustness checks and the final section concludes.
Literature Review
Our study is based on the literature that analyses the effects of interest rates on bank performance. While there is
an extensive literature on the determinants of bank margins and profits that follow the pioneering work of Ho and
Saunders (1981), the literature evaluating interest rates, monetary policy and bank performance is still somewhat
limited6. One of the first empirical papers dates back to the early 1980s, in which the switch from low to high
interest rates determined by the “Volcker doctrine”7 raised concerns about the soundness and stability of
commercial banks and saving and loans associations (“thrift” institutions) that “borrow short and lend long”. In
this context, Flannery (1981) finds that, while drastic interest rate changes can threaten bank stability, large U.S
banks mitigate these risks by hedging against interest rate risk modifying assets and liabilities in order to have
similar average maturities. Hancock (1985) notes that if monetary policy does not affect the spread between
interest earning assets and liabilities, an increase in interest rates tends to boost bank profits. Demirgüç-Kunt and
Huizinga (1999) were among the first to investigate the effect of real interest rates on bank margins and
profitability. Using cross-country and bank-specific data on margins, they find that high real interest rates are
associated with higher NIMs and profitability - especially in emerging economies where deposit rates are
frequently targeted by policymakers to be below-market rates. English (2002), studying the link between interest
rate risk exposure and bank margins in ten OECD countries over the period 1979-1999, points out that the average
yield on bank assets is more closely related to long-term rates than the average yield on liabilities, hence a steep
yield curve should be associated with higher NIMs. In a similar fashion, Albertazzi and Gambacorta (2009) also
use data of ten OECD countries over 1981-2003 and aggregate income statement data to show that short-term and
long-term rates have a differential influence on bank margins8. While short-term rate seems to have no impact on
margins, a 1% increase in long-term rates increases NIMs from 1% after a year to up to 4% in the long-run, hence
margins react mainly to the slope of the yield curve. The relation between the slope of the yield curve and bank
profitability has been evidenced also by Alessandri and Nelson (2014) with reference to the UK banking sector.
Again, their findings suggest that in the long-run (measured using ten-year government bond yields) higher
interest rates have an unambiguous positive effect on bank profitability and margins.
Size and specialness appear to be key factors that enable banks to hedge against interest rate risk avoiding
excessive NIMs and profit volatility in ‘normal’ operating environments. In this regard, Angbazo (1997) finds
that U.S banks with assets size greater than $1 billion have net interest income that is not sensitive to interest risk
volatility, while the opposite is found for small regional banks. Specialness, assets composition and size are also
found to be important by Hanweck and Ryu (2005). Using a sample of U.S banks, they underline how small
regional banks and mortgage specialists are particularly affected by the volatility of interest rates.
There are also a limited number of studies that focus specifically on bank profitability and margins in a low interest
rate environment. Genay and Podjasek (2014) indicate that U.S banks face decreasing NIMs and returns during
6The literature on the determinants of net interest margins and profits is extensive. We refer to section 3 for a select overview of studies on the determinants of bank margins and profits. 7 Paul Volcker, Chairman of the Federal Reserve during the period 1979-1987, is credited with ending the high level of inflation in the United States by using tight monetary policies and high interest rates. 8 In their model Albertazzi and Gambacorta (2009) define short-term and long-term interest rate using the 3-month interbank rate and the rate on long term government bonds, respectively.

periods of low interest rates – and (again) the effect is particularly strong for small institutions. However, they
also suggest that the benefits of low rates (in terms of boosting economic activity) outweigh the costs. Opposing
findings have been reported by Covas et al. (2015) who show that, during a period of low interest rates (2010-
2015 in their sample), NIMs decline more markedly for large U.S banks (70 basis points against 20 for small
banks9) because small banks benefit more from a fall in deposit costs. Claessens et al. (2017), investigating 47
countries, find that low interest rates have a significantly greater impact on bank ROAs and NIMs than high rates.
Although profitability appears to be less affected than margins, persistently low interest rates also reduce the
ability of banks to be profitable. Hence, while a cut in interest rates has the short-term effect of negatively
impacting NIMs, in the long-term there is an adverse pass through to profitability. Busch and Memmel (2015),
studying the German market during ‘normal’ and low interest rate periods, find a small but positive effect of long-
term rates on bank margins. However, they state that, during periods of low interest rates, the ZLB constraint on
deposit products puts additional stress on banks’ margins.
Empirical analysis of the influence of NIRP on bank margins and profits links to the unconventional monetary
policy (UMP) literature. NIRP is one type of UMP together with Quantitative Easing (QE) (large-scale asset
purchases) and policy guidance that manages down long-term interest rate expectations. These policies not only
reduce market interest rates but expand and modify the size and composition10 of both central bank’s and
commercial bank’s balance sheets that can impact margins and profitability. In this regard, Lambert and Ueda
(2014), using a sample of U.S banks over 2007-2012 report a negative relation between the size of central bank’s
assets and NIMs. When central banks expand their balance sheets this helps push down interest rates reducing
bank funding costs but the influence is offset by reduced revenues from new loans. Deposit rates are more ‘sticky-
downward’ than loan rates and compresses margins reducing profits. Similar results have been displayed by
Alessandri and Nelson (2014) who show that Bank of England balance sheet expansion has a negative influence
on NIMs11.
Our contribution to the literature is important in three respects. First, as outlined in the aforementioned studies,
persistently low interest rates are found to adversely impact bank profits and margins. If this is valid for low
interest rates, breaking the ZLB with negative rates might even be more problematic given the reluctant attitude
of banks to start charging customers for their deposits (“stickiness”). Secondly, the literature on NIRP is still small
and generally comprises overviews of developments in key banking and other financial aggregates in the
immediate pre- and post-NIRP periods rather than rigorous econometric analysis. Moreover, studies examining
the effects of NIRP (see Jobst and Lin., 2016; Arteta et al., 2016; Bech and Malkhozov., 2015) point to the
compression of NIMs as lending rates for new loans decline and existing (variable-rate) loans re-price while
deposit rates remain sticky-downward12, but they do not use bank-level data to explicitly test to see if this is
actually the case. If this is indeed the case, all other things being equal, it will lead to a reduction in profitability
and this may reduce the effectiveness of this new monetary policy tool if banks reduced profits curtails lending
9 Small banks are defined in this study as having assets less than $50 billion. 10 See Bernanke and Reinhart (2004) for an explanation of unconventional monetary policies. 11 Both studies apply panel regressions and GMM estimation. 12 The relation between monetary policy changes and the stickiness of deposits has been extensively analysed (see Freixas and Rochet, (1997) for a review).

activity. Third, we perform various robustness checks to validate our results. These provide more information on
specific type of banks and countries financial features that can influence the impact of NIRP.
Our paper adds to the aforementioned literature by examining the impact of NIRP on margins and profits using a
dataset comprising 7242 banks in 33 OECD countries over 2012-2016 and a difference-in-differences
methodology. Our main finding is that bank margins and profits fell in NIRP-adopter countries compared to
countries that did not adopt the policy. The results are robust to a variety of checks. The adverse NIRP effect on
bank performance appears to have been stronger for banks that were small, operating in competitive system as
well as in countries where floating loan rates predominate.
Methodology and Data
Methodology
To capture the effect of NIRP on ROAs and NIMs we use a difference-in-differences methodology. This
methodology has been widely used in the policy evaluation literature and more recently to banking and financial
sector issues (Beck et al., 2010; Calderon and Schaeck., 2013; Berger et al., 2014; Fiordelisi et al., 2017). The
advantage of this approach is that it allows to use a panel data set-up to compare a treated group of banks (those
impacted by the policy change) with those that are not affected (the control group or untreated banks). The
approach also helps to control for the ‘omitted variable bias’13. Our baseline specification takes the following
form:
𝑌𝑌𝑖𝑖𝑖𝑖𝑖𝑖 = 𝛼𝛼 + 𝛽𝛽1𝑇𝑇𝑇𝑇𝑇𝑇𝑇𝑇𝑇𝑇𝑇𝑇𝑇𝑇𝑖𝑖𝑖𝑖 + 𝛽𝛽2𝑃𝑃𝑃𝑃𝑃𝑃𝑇𝑇𝑖𝑖𝑖𝑖 + 𝛽𝛽3�𝑇𝑇𝑇𝑇𝑇𝑇𝑇𝑇𝑇𝑇𝑇𝑇𝑇𝑇𝑖𝑖𝑖𝑖 ∗ 𝑃𝑃𝑃𝑃𝑃𝑃𝑇𝑇𝑖𝑖𝑖𝑖� + 𝜑𝜑𝑖𝑖 + 𝛾𝛾𝑖𝑖 + 𝜀𝜀𝑖𝑖𝑖𝑖𝑖𝑖 (1)
Where 𝑌𝑌𝑖𝑖𝑖𝑖𝑖𝑖 is the NIM (or RoA)14 of bank i in country j at time t, 𝑇𝑇𝑇𝑇𝑇𝑇𝑇𝑇𝑇𝑇𝑇𝑇𝑇𝑇𝑖𝑖𝑖𝑖 is a dummy variable that takes the
value 1 if bank 𝑖𝑖 in country 𝑗𝑗 has been affected by NIRP and 0 otherwise, 𝑃𝑃𝑃𝑃𝑃𝑃𝑇𝑇𝑖𝑖𝑖𝑖 is a dummy variable that takes
the value 1 after the period that country 𝑗𝑗 at time 𝑇𝑇 decided to implement NIRP and 0 before that period15, and 𝛽𝛽3
represents the average difference in NIM and RoA between countries that switched to NIRP and countries that
did not. We also include 𝛾𝛾𝑖𝑖 and 𝜑𝜑𝑖𝑖 to capture, respectively, bank and year fixed effects and limit the potential for
bias in estimates of 𝛽𝛽316.
We introduce bank- and country-specific controls in a second specification that takes the form:
𝑌𝑌𝑖𝑖𝑖𝑖𝑖𝑖 = 𝛼𝛼 + 𝛽𝛽1𝑇𝑇𝑇𝑇𝑇𝑇𝑇𝑇𝑇𝑇𝑇𝑇𝑇𝑇𝑖𝑖𝑖𝑖 + 𝛽𝛽2𝑃𝑃𝑃𝑃𝑃𝑃𝑇𝑇𝑖𝑖𝑖𝑖 + 𝛽𝛽3�𝑇𝑇𝑇𝑇𝑇𝑇𝑇𝑇𝑇𝑇𝑇𝑇𝑇𝑇𝑖𝑖𝑖𝑖 ∗ 𝑃𝑃𝑃𝑃𝑃𝑃𝑇𝑇𝑖𝑖𝑖𝑖� + 𝛽𝛽4𝑋𝑋𝑖𝑖 + 𝜑𝜑𝑖𝑖 + 𝛾𝛾𝑖𝑖 + 𝜀𝜀𝑖𝑖𝑖𝑖𝑖𝑖 (2)
where 𝑋𝑋𝑖𝑖 is a vector of bank- and country-specific characteristics to capture cross-bank and cross-country
heterogeneity over time that can affect NIMs and ROAs17. Bank-specific variables are a combination of balance
13 For example, regulatory changes (such as Basel III) may affect treated and untreated bank performance alike, regardless of the NIRP intervention. But as these changes may affect banks similarly, the difference-in-differences approach avoids this bias by differencing away common trends affecting both groups 14Following Borio et al. (2015) and Claessens et al. (2017), we define bank net interest margins as the difference between interest earning assets and interest bearing liabilities divided by the amount of interest earning assets. Return on assets is calculated by dividing bank’s net income by its assets. 15 The vast majority of NIRP countries in our sample introduced NIRP in 2014, hence 𝑃𝑃𝑃𝑃𝑃𝑃𝑇𝑇𝑖𝑖𝑖𝑖 takes the value 1 from 2014. However, since Sweden, Norway and Switzerland introduced NIRP in 2015 so for these the 𝑃𝑃𝑃𝑃𝑃𝑃𝑇𝑇𝑖𝑖𝑖𝑖 dummy is set at 2015. 16 We include bank-specific dummies to control for time-invariant, unobservable bank characteristics that can shape bank NIMs and RoAs. We include year fixed effects to control for possible shocks over the sample period that can affect bank NIMs and RoAs such as other monetary policies and changes in regulation. All regressions are estimated with bank-level clustering, namely allowing for correlation in the error terms. We use robust standard errors to control for heteroscedasticity and dependence (see Bertrand et al, 2004; Petersen, 2009; Donald and Lang, 2007. We also estimate equation 2 substituting bank fixed effects with country fixed effects to control for differences among our sample of countries limiting the omitted variables bias. 17 The inclusion of covariates in a difference-in-differences framework presents advantages but also disadvantages (Lechner, 2010). On the one hand, introducing explanatory covariates can have the positive advantage of detecting cross-bank and cross-country heterogeneity that can potentially affect bank NIMs and RoAs independently by the introduction of NIRP. On the other hand, the introduction of covariates can cause two main problems. First, when banks are relatively homogeneous in both the treatment and control group, additional covariates can weaken, instead of strengthening, the likelihood that both groups maintain the parallel trend, hence violating our assumption. Second, time varying covariates can change or be influenced by the post-treatment period, leading to endogeneity problems. We assess this problem in several ways. First, we test the control variables for multicollinearity using the variance inflation factor (VIF). A mean VIF of 1.07 suggests that our controls are not highly correlated (a correlation matrix is provided in Table A2 in the appendix). Second, we provide
sheet and performance measures. Our control variables are in-line with the literature on the determinant of NIMs
and profits. We include four bank-specific and two country-specific control variables that have been shown in the
literature to explain banks’ performance. The first variable is size (size) measured by the logarithm of bank total
assets. According to Goddard et al. (2004) and Mirzaei et al. (2013) banks size affects profits positively through
the realisation of economies of scale. However, as suggested by Demirgüç-Kunt and Huizinga (1999) and
Demirgüç-Kunt et al. (2004) large efficient banks apply lower margins to customers through increasing returns to
scale, hence we expect profits and margins to have the opposite signs in relation to size. Several studies (McShane
and Sharpe, 1985; Saunders and Schumacher, 2000; Maudos and Fernandez de Guevara, 2004) use the ratio of
equity to total assets (E/TA) as a proxy for bank risk aversion. A positive relation is expected between this variable
and margins18. Risk averse banks will require higher margins to cover the greater cost of equity. A positive relation
is expected also with reference to profitability as suggested by Berger (1995). Banks with higher franchise value
and well-capitalised face lower expected bankruptcy and funding costs. We also use liquidity (Carbo and
Fernandez, 2007) and a credit risk measure (Carbo and Fernandez., 2007; Poghosyan., 2012; Almarzoqi and
Naceur, 2015) to explain bank margins. In this context, we use the ratio of liquid securities to total assets (liquidity)
and the loan loss provision to gross loans ratio (credit risk), respectively. We expect that less liquid and credit
riskier banks, apply a premium to margins.
The country-specific variables are broad measures of macroeconomic performance and include GDP growth
(GDP growth) and consumer price inflation (inflation). Athanasouglu et al (2008) recognise a twofold GDP
growth effect on bank performance. On one hand, GDP growth has a positive effect on bank profits coming from
a greater demand for loans. In contrast, there may be a negative relationship if the supply of funds (deposits)
declines due to a rise in consumption in-line with GDP growth. The extended literature (Molyneux and Thornton,
1992; Boyd et al, 2001; Demirgüç-Kunt et al, 2004; Gelos, 2006; Almarzoqi and Naceur, 2015) has also
demonstrated a positive relationship between nominal inflation and bank margins and profits. The economic
uncertainty induced by high inflation rates is compensated for by higher spreads.
The difference-in-differences approach requires that three assumptions hold. First, the control group must
constitute a valid counterfactual for the treatment19. Second, assignment of the treatment has to be exogenous with
respect to bank performance. In other words, the policy action (‘intervention’) should affect bank performance
and not vice versa. As explained in the introduction, the aim of NIRP is to increase the cost to banks of holding
excess reserves at the central bank encouraging them to take them back on the balance sheet and increase the
supply of loans. Hence, influencing bank performance (profits and margins) is not the policy-makers main target
but rather reflects a secondary effect. Moreover, figures 1 and 2 show that, prior to the introduction of NIRP,
NIMs and RoAs moved in a similar direction but the relationship changed thereafter. This is confirmed when we
t-test statistics to show that the control variables are not homogenous among treated and untreated banks (see section 3.2 and Table 1). Finally, to avoid the possibility that time varying control variables can be influenced by the intervention (the NIRP introduction), we test the control variables as dependent variables in the difference-in-difference specification. As expected, the test (not reported) suggests that our control variables are not affected by the intervention. 18 Macroeconomic theorists such as Gertler and Kiyotaki (2011) suggest a negative relation. A higher net worth (equity) relative to the capital stock reduces the expected default probability (everything else equal). Thus, banks can charge lower margins to customers. 19 We provide evidence that this assumption holds in the next section.
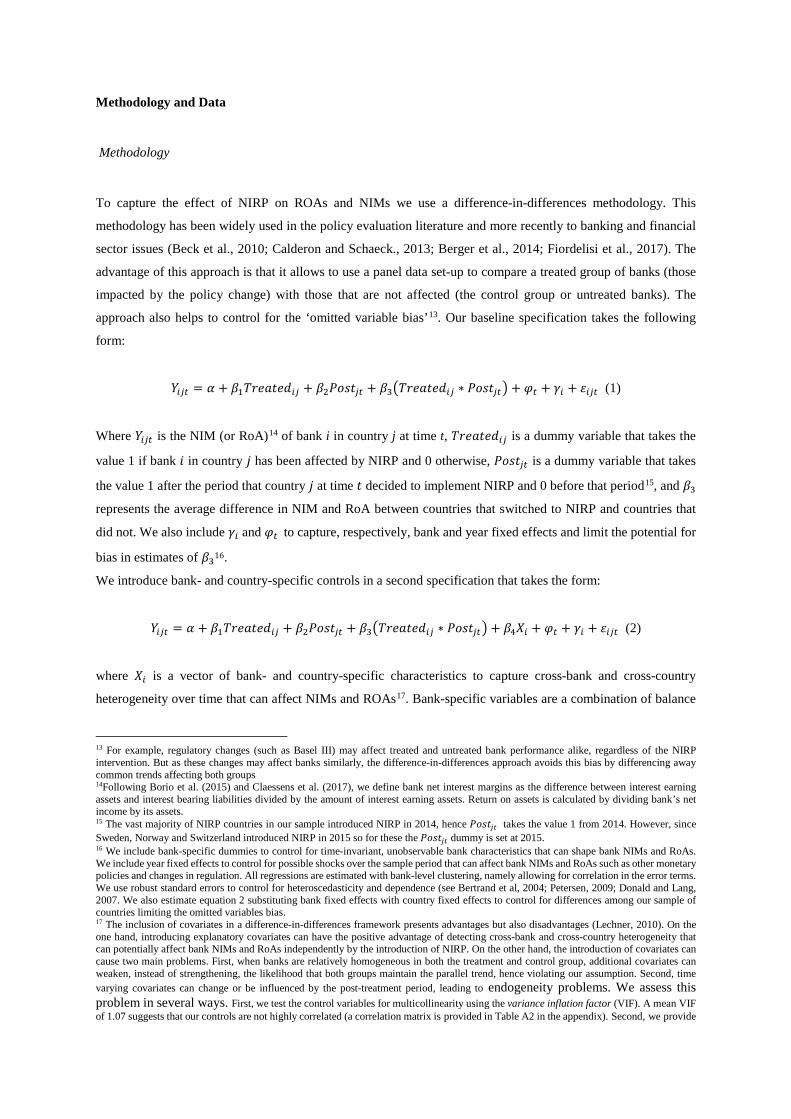
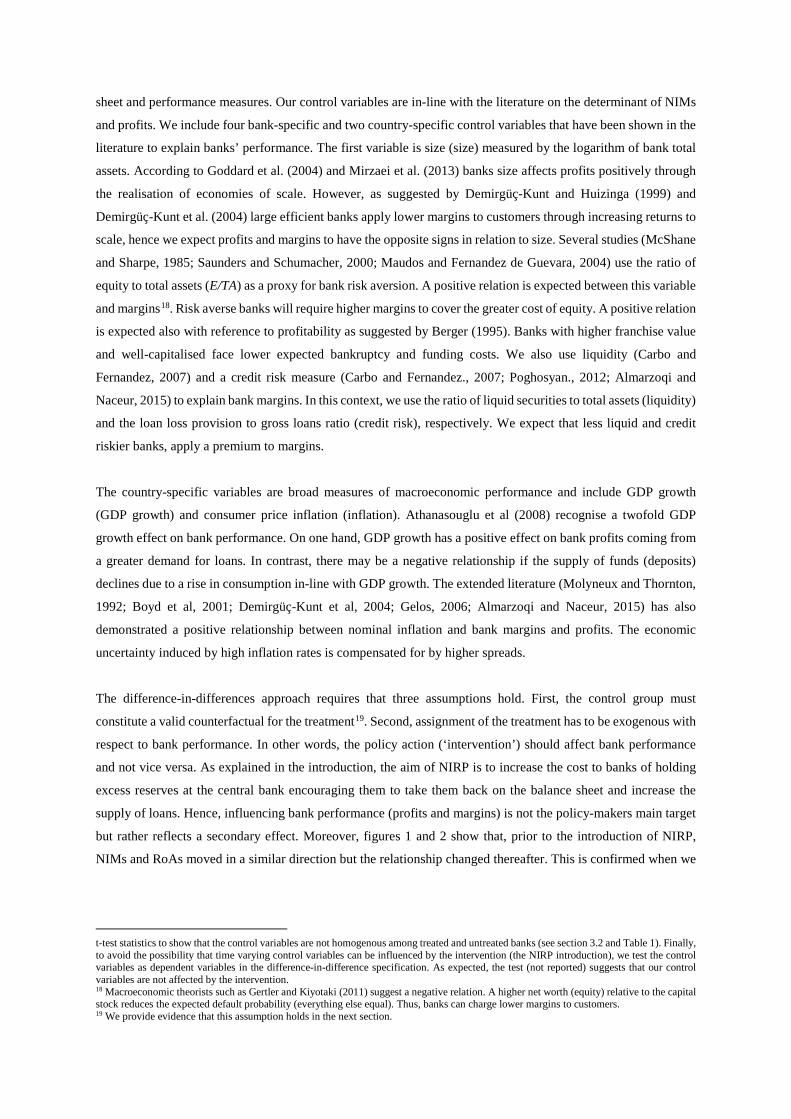
examine the third requirement of a ‘parallel trend assumption’20. Figures 1 depicts level of NIMs and RoAs from
2011 to 2016 for both NIRP adopter and non-adopter countries. Both NIM and RoA move in the same direction
in the pre-treatment period, indicating that the parallel trend assumption holds. Since June 2014, when policy rates
in most of the NIRP adopter countries turned negative, NIRP affected banks register the worst performance since
2011 with level falling below 2% for NIM in 2014-2015 and below 0.40% for RoA in 201521.
Figure 1. Average NIM/ROA among treated banks (blue line) and non-treated banks (red line) from 2011 – 2016.
Data
We rely on Jobst and Lin (2016) for dating the adoption of NIRP regimes and construct a dataset combining
information mostly from two main sources22. The macroeconomic series are from Thompson DataStream and the
bank balance and performance data are from Orbis Bank Focus. Since Orbis comprises cross-country banks that
operate in more than one country, balance sheet data can be either consolidated or unconsolidated. To avoid
concerns regarding banks that operate in more than one country in both treated and not treated groups, we use
bank account data that are either unconsolidated (U1 and U2 codes in Orbis) or consolidated but not with an
unconsolidated subsidiary. Our sample covers 7242 financial institutions (commercial banks, savings banks,
cooperative banks and bank holding companies) from 33 OECD countries over 2012 - 201623. The treated
countries include those of the Euro Area, Hungary, Sweden and Switzerland.24 Descriptive statistics for bank
RoAs and NIMs, other bank balance sheet variables, and the macroeconomic series in the treatment and control
groups of countries are shown in Table 1.25
20According to Bertrand et al. (2004) and Imbens and Wooldridge (2009) the difference-in-differences is valid only under the restrictive assumption that changes in the outcome variable (in our case bank profits and NIM) over time would have been exactly the same in both treatment (countries that experienced NIRP) and control groups (no NIRP) in the absence of the intervention (the introduction of NIRP). 21 A correlation table (Table A3 in the Appendix) of the average level of NIMs and RoAs pre- and post-NIRP confirms the inverse trend among the two group following the intervention. 22 See Table A1 in the Appendix for the dating of NIRP. 23 The sample period is intentionally short. According to Roberts and Whited (2013) and Bertrand et al. (2004) the change in the treatment group should be concentrated around the onset of the treatment. Moving away leads to unobservable and other factors that affect the treatment outcome leading to omitted variable bias threatening the validity of the model. 24 We exclude Japan in our sample as the country only adopted NIRP in early 2016, which provides too short a period to examine the impact of NIRP on profits and margins. 25 We also estimate Pearson correlation coefficients (table A4 in the appendix) for the macroeconomic variables in the treatment and control groups. The significance of coefficients suggests that the countries in the two groups experienced a similar macroeconomic environment validating the fact that the control group constitutes a valid counterfactual scenario for the treatment. This finding, together with the parallel trend assumption that we report in Figures 1 and 2, further supports our decision to choose a difference-in-differences methodology in our
1.8
22.
22.
42.
62.
8NI
M (%
)
2011 2012 2013 2014 2015 2016year
treatment_nim control_nim
2012-2016NIM before & after NIRP
.3.4
.5.6
.7.8
.9Ro
A (%
)2011 2012 2013 2014 2015 2016
year
treatment_roa control_roa
2012-2016ROA before & after NIRP

Panel A and B of Table 1 presents summary statistics on the aforementioned balance sheet data. Panel C displays
macroeconomic condition and monetary policy variables descriptive statistics26. Bank profitability and margin
may also be driven by other macroeconomic, market and monetary policy factors. Accordingly, we control for a
wide range of potentially important explanatory control variables in the regression models. Following Carbo and
Fernandez (2007), Maudos and Fernandez de Guevara (2004), Hawtrey and Liang (2008) Maudos and Solis
(2009), Lepetit et al. (2008), Almarzoqi and Naceur (2015) and Entrop et al. (2015), we use the Lerner index
(Lerner index) to control for competition in the banking sector27. The Lerner index is the difference between the
price and the total margin cost as a proportion of the price and has been taken from the World Bank Global
Financial Development Database. It ranges between 0 (perfect competition) and 1 (monopoly). It is inversely
proportional to banking competition. NIRP is expected to have a more marked impact in more competitive systems
as changes in policy rates are likely to be passed on more effectively.
As other UMP policies, including central banks’ asset purchase programs (Di Maggio et. al, 2016; Rodnyanski
and Darmouni, 2016; Kandrac and Schulsche, 2016; Chakraborty et. al, 2017), were conducted at the same time
as NIRP we include variables to account for these effects. In-line with Gambacorta et al. (2014), Lambert and
Ueda (2014), and Alessandri and Nelson (2015) we employ the log growth rate of a country’s central bank balance
sheet (CB_GR). We also use the log growth rate of the monetary base (M0_GR) as further controls to isolate the
impact of other UMP’s on bank NIMs and RoAs. According to the aforementioned studies other UMP’s are also
expected to compress margins and therefore (we expect) bank profits. This is investigated in the robustness check
section 4.2 of the paper.
Finally, we try to disentangle the impact of NIRP on bank margins and profitability in those countries that for
historical or cultural reasons have a preference for lending at a floating or fixed rate basis. One would expect the
impact of NIRP to be greater in countries where floating rates are more prevalent. Following Albertazzi and
Gambacorta (2009) we address this issue by using the share of variable rate loans in total loans to households and
non-financial corporations (floating-fixed rate) taken from the ECB Statistical Warehouse to identify countries
where the bulk of lending is at a variable or fixed rate.
analysis. We arbitrarily chose a longer time period (in comparison with the sample period) to highlight that these macroeconomic indicators move together for several years after the GFC. 26 Equality of means t-test is also performed. 27 We prefer the non-structural Lerner index measure of competition over a concentration measure such as the Herfindahl-Hirschman Index (HHI). There are, in fact, different views about competition and concentration in the literature. Claessens and Laeven (2003), for example, point out that there are some countries, such as U.S, that show levels of monopolistic competition in banking despite the relatively low level of concentration and large number of banks, while countries like Canada are highly competitive, although the level of concentration is high and number of banks relatively small. Beck and Hesse (2009) suggest that concentration measures are not satisfactory measures of the degree of market competition in the banking industry.
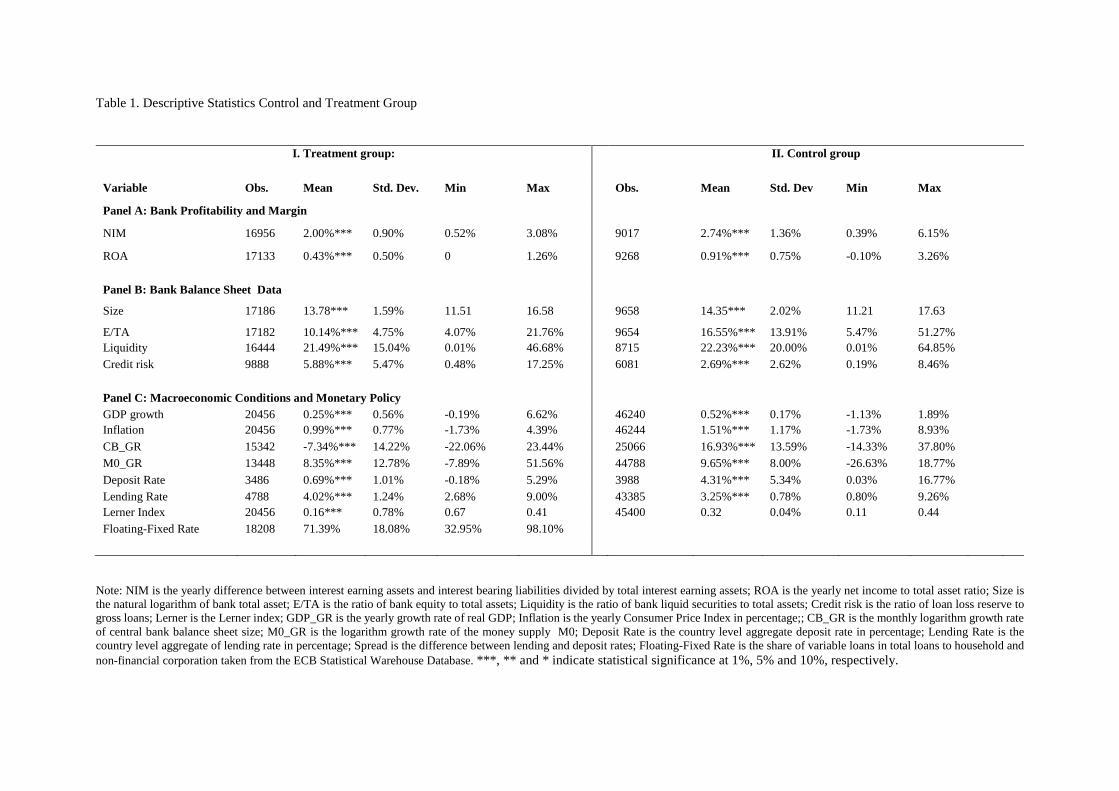
Table 1. Descriptive Statistics Control and Treatment Group
I. Treatment group: II. Control group
Variable Obs. Mean Std. Dev. Min Max Obs. Mean Std. Dev Min Max
Panel A: Bank Profitability and Margin
NIM 16956 2.00%*** 0.90% 0.52% 3.08% 9017 2.74%*** 1.36% 0.39% 6.15%
ROA 17133 0.43%*** 0.50% 0 1.26% 9268 0.91%*** 0.75% -0.10% 3.26% Panel B: Bank Balance Sheet Data
Size 17186 13.78*** 1.59% 11.51 16.58 9658 14.35*** 2.02% 11.21 17.63
E/TA 17182 10.14%*** 4.75% 4.07% 21.76% 9654 16.55%*** 13.91% 5.47% 51.27% Liquidity 16444 21.49%*** 15.04% 0.01% 46.68% 8715 22.23%*** 20.00% 0.01% 64.85% Credit risk 9888 5.88%*** 5.47% 0.48% 17.25% 6081 2.69%*** 2.62% 0.19% 8.46% Panel C: Macroeconomic Conditions and Monetary Policy GDP growth 20456 0.25%*** 0.56% -0.19% 6.62% 46240 0.52%*** 0.17% -1.13% 1.89% Inflation 20456 0.99%*** 0.77% -1.73% 4.39% 46244 1.51%*** 1.17% -1.73% 8.93% CB_GR 15342 -7.34%*** 14.22% -22.06% 23.44% 25066 16.93%*** 13.59% -14.33% 37.80% M0_GR 13448 8.35%*** 12.78% -7.89% 51.56% 44788 9.65%*** 8.00% -26.63% 18.77% Deposit Rate 3486 0.69%*** 1.01% -0.18% 5.29% 3988 4.31%*** 5.34% 0.03% 16.77% Lending Rate 4788 4.02%*** 1.24% 2.68% 9.00% 43385 3.25%*** 0.78% 0.80% 9.26% Lerner Index 20456 0.16*** 0.78% 0.67 0.41 45400 0.32 0.04% 0.11 0.44 Floating-Fixed Rate 18208 71.39% 18.08% 32.95% 98.10%
Note: NIM is the yearly difference between interest earning assets and interest bearing liabilities divided by total interest earning assets; ROA is the yearly net income to total asset ratio; Size is the natural logarithm of bank total asset; E/TA is the ratio of bank equity to total assets; Liquidity is the ratio of bank liquid securities to total assets; Credit risk is the ratio of loan loss reserve to gross loans; Lerner is the Lerner index; GDP_GR is the yearly growth rate of real GDP; Inflation is the yearly Consumer Price Index in percentage;; CB_GR is the monthly logarithm growth rate of central bank balance sheet size; M0_GR is the logarithm growth rate of the money supply M0; Deposit Rate is the country level aggregate deposit rate in percentage; Lending Rate is the country level aggregate of lending rate in percentage; Spread is the difference between lending and deposit rates; Floating-Fixed Rate is the share of variable loans in total loans to household and non-financial corporation taken from the ECB Statistical Warehouse Database. ***, ** and * indicate statistical significance at 1%, 5% and 10%, respectively.

Empirical results
Baseline results
The results from estimating equations (1) and (2) are presented in table 2 and 3. All the estimates include fixed
bank and time effects. Table 2 and 3 report the estimates where the dependent variables are the NIMs (Table 2)
and RoAs (Table 3), respectively. For both variables we incrementally introduce a set of bank and country control
variables28. Our main interest is the size, sign and statistical significance of the coefficient of 𝛽𝛽3 that represents
the average difference in the change of NIMs and RoAs between countries that adopted NIRP and those that did
not, denoted in the table as the NIRP-effect. The baseline results reported in columns 1 of Tables 2 and 3 excludes
all control variables. The coefficient of NIRP-effect is sizeable, negative and statistically significant at the 1%
level for both dependent variables, indicating that countries where central banks implemented NIRP experienced
a decline in NIMs and RoAs of around 12.60% and 6.27% respectively, relative to those countries where central
banks did not follow the same policy29. In-line with expectations the size of the coefficient on NIMs are nearly
double that of RoA. This leads to two preliminary conclusions. First, NIRP directly causes a compression of
banks’ margins suggesting that they are unable to reduce deposit rates to the same extent as loan rates. Second,
the contraction in NIMs (as a key component of bank profitability) indirectly drags down bank RoAs but to a
lesser extent – a fall in margins reduces profits but not to the same extent as the overall effect is likely mitigated
by lower/negative rates boosting non-interest income (via increased security valuations, trading income and such
like)30. The remaining columns of the tables present the results from adding bank- and country- specific controls
sequentially. The baseline regression result holds up well in the face of all controls—though the size of the
coefficient is diminished somewhat (with the marginal effect varying between 9.06% (column 8) and 13.10%
(column 2) for NIM, and between 3.54% (column 7) and 6.20% (column 1) for RoA)31. The coefficients on the
NIRP-effect remain negative and significant at the 1% level in all estimates. The covariates are mostly significant
at conventional levels (although with small coefficients) with signs in-line with the literature on the determinants
of NIMs and RoAs. The E/TA variable is positively correlated with NIMs suggesting that less leveraged and more
profitable banks register higher margins. In contrast, liquidity, and credit risk are negatively related to NIM
indicating that banks that are less liquid and with large non-performing assets apply higher margins to compensate
for greater risks. Size and E/TA appear to be the main factors driving bank RoAs, while less liquid banks are the
ones, in our sample, that show the largest profit reductions. Among the macroeconomic variables, the inflation
28 In trying to avoid biased estimation, we remove credit risk in the RoAs regression as it causes an excessive variation in the NIRP-effect coefficient. 29This has been known for a long time. Samuelson (1945) mentioned:” the banking system as a whole is immeasurably helped rather than hindered by an increase in interest rate”. 30We later test this to see whether NIRP resulted in an increase in non-interest income. For this exercise, we run two difference-in-differences baseline regressions (table A5 column 1 and 2 in the appendix) using the ratios of non-interest income to gross income and net fees and commission to total assets (according to Jobst and Lin (2016) and Arteta et al. (2016) banks should increase fees and commissions to compensate for the decline in interest earnings). The result suggests that NIRP-affected banks experienced an increase in non-interest income (NII), and fees and commissions (FEE), relative to those banks unaffected by the policy. This provides an explanation of the differences between NIMs and RoAs with the former declining more markedly than the latter. 31 As suggested by Roberts and Whited (2013), a large discrepancy of the treatment coefficient with and without controls should raise a ‘red flag’. In our case, variation in the NIRP-Effect coefficient occurs when country control variables are introduced. To assess this problem we run (Table A6 and A7 in the Appendix) two additional regressions removing country control variables and bank fixed effects and introducing country fixed-effects. The NIRP-Effect coefficient is significant and displays smaller variation with the addition of country controls. This suggests that our country measures are not fully able to capture unobservable factors as country fixed effects.

rate displays a strong positive coefficient for both NIMs and RoAs suggesting that the low inflation decade since
the GFC is another factor affecting banking sector performance32.
32 Similar tests (not reported) have been undertaken using another bank profitability measure (RoE). Although the NIRP-effect coefficient remains negative and is statistically significant, it does not hold-up well when the controls are introduced. This is not surprising. RoE is more variable and easy to manipulate by managers via share buy-backs, provisioning and other earnings management techniques. As our estimates also show, it is more strongly influenced by macroeconomic conditions. That is why the empirical banking literature has a strong preference for using RoA as a profits indicator. RoE results are not reported here but are available from the authors on request.

Table 2. NIRP and NIMs
NIM(1) NIM(2) NIM(3) NIM(4) NIM(5) NIM(6) NIM(7) NIM(8)
NIRP-Effect -0.1260*** -0.1310*** -0.1250*** -0.1138*** -0.1177*** -0.1160*** -0.1070*** -0.0856***
(0.0145) (0.0148) (0.0149) (0.0152) (0.0153) (0.0146) (0.0148) (0.0158) Size -0.0371 0.0208 0.0022 -0.0952*** -0.0698
(0.0228) (0.0270) (0.0317) (0.0495) (0.0509) E/TA 0.0053*** 0.0057*** 0.0105*** 0.0108***
(0.0013) (0.0014) (0.0029) (0.0029) Liquidity -0.0010*** -0.0023*** -0.0024*** (0.0003) (0.0006) (0.0006) Credit risk -0.0056*** -0.0041**
(0.0016) (0.0017) GDP growth -0.0619*** -0.0234* -0.0029
(0.0137) (0.0131) (0.0195) Inflation 0.0505*** 0.0416***
(0.0061) (0.0070)
Adj. R2 0.0553 0.0558 0.0603 0.0668 0.1109 0.0577 0.0636 0.1270 N.Banks 7242 7242 7241 6895 4895 7241 7241 4894 N.Obs 25973 25973 25965 24592 15474 25969 25969 15470
All regressions include fixed bank and time effects. Robust standard errors clustered by banks in parenthesis. ***, ** and * indicate statistical significance at 1%, 5% and
10%, respectively.
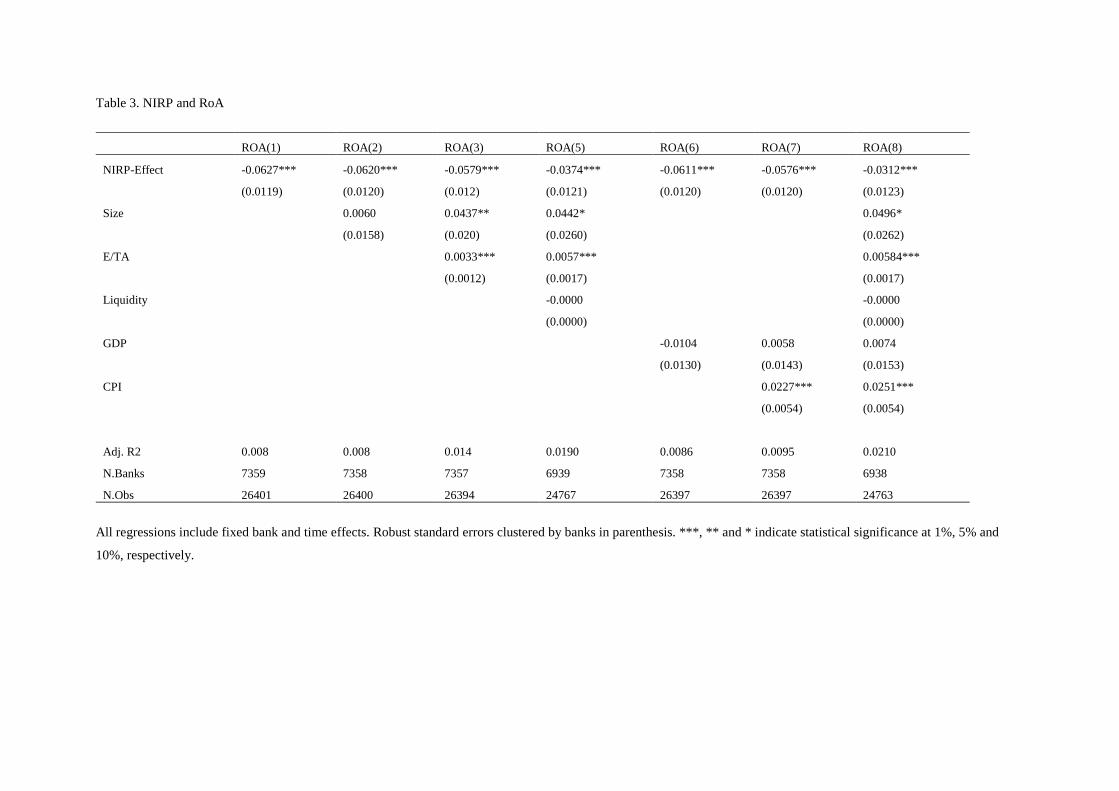
Table 3. NIRP and RoA
ROA(1) ROA(2) ROA(3) ROA(5) ROA(6) ROA(7) ROA(8)
NIRP-Effect -0.0627*** -0.0620*** -0.0579*** -0.0374*** -0.0611*** -0.0576*** -0.0312***
(0.0119) (0.0120) (0.012) (0.0121) (0.0120) (0.0120) (0.0123)
Size 0.0060 0.0437** 0.0442* 0.0496*
(0.0158) (0.020) (0.0260) (0.0262)
E/TA 0.0033*** 0.0057*** 0.00584***
(0.0012) (0.0017) (0.0017)
Liquidity -0.0000 -0.0000
(0.0000) (0.0000)
GDP -0.0104 0.0058 0.0074
(0.0130) (0.0143) (0.0153)
CPI 0.0227*** 0.0251***
(0.0054) (0.0054)
Adj. R2 0.008 0.008 0.014 0.0190 0.0086 0.0095 0.0210
N.Banks 7359 7358 7357 6939 7358 7358 6938
N.Obs 26401 26400 26394 24767 26397 26397 24763
All regressions include fixed bank and time effects. Robust standard errors clustered by banks in parenthesis. ***, ** and * indicate statistical significance at 1%, 5% and
10%, respectively.
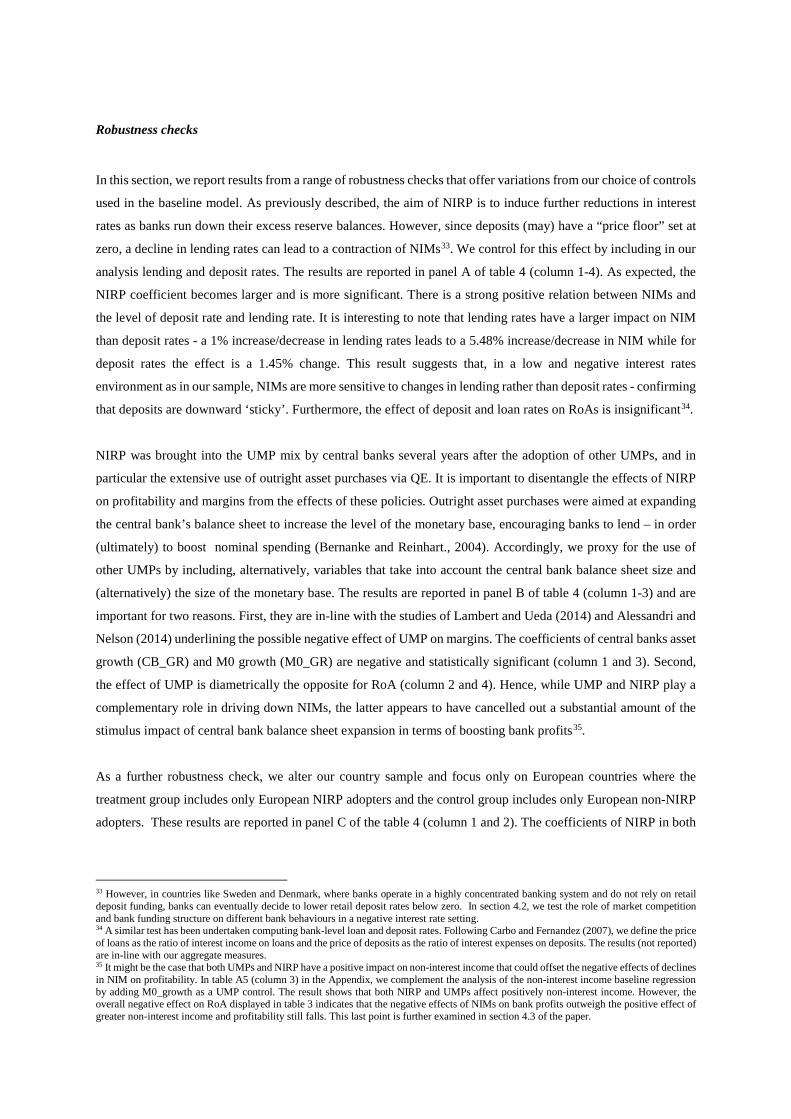
Robustness checks
In this section, we report results from a range of robustness checks that offer variations from our choice of controls
used in the baseline model. As previously described, the aim of NIRP is to induce further reductions in interest
rates as banks run down their excess reserve balances. However, since deposits (may) have a “price floor” set at
zero, a decline in lending rates can lead to a contraction of NIMs33. We control for this effect by including in our
analysis lending and deposit rates. The results are reported in panel A of table 4 (column 1-4). As expected, the
NIRP coefficient becomes larger and is more significant. There is a strong positive relation between NIMs and
the level of deposit rate and lending rate. It is interesting to note that lending rates have a larger impact on NIM
than deposit rates - a 1% increase/decrease in lending rates leads to a 5.48% increase/decrease in NIM while for
deposit rates the effect is a 1.45% change. This result suggests that, in a low and negative interest rates
environment as in our sample, NIMs are more sensitive to changes in lending rather than deposit rates - confirming
that deposits are downward ‘sticky’. Furthermore, the effect of deposit and loan rates on RoAs is insignificant34.
NIRP was brought into the UMP mix by central banks several years after the adoption of other UMPs, and in
particular the extensive use of outright asset purchases via QE. It is important to disentangle the effects of NIRP
on profitability and margins from the effects of these policies. Outright asset purchases were aimed at expanding
the central bank’s balance sheet to increase the level of the monetary base, encouraging banks to lend – in order
(ultimately) to boost nominal spending (Bernanke and Reinhart., 2004). Accordingly, we proxy for the use of
other UMPs by including, alternatively, variables that take into account the central bank balance sheet size and
(alternatively) the size of the monetary base. The results are reported in panel B of table 4 (column 1-3) and are
important for two reasons. First, they are in-line with the studies of Lambert and Ueda (2014) and Alessandri and
Nelson (2014) underlining the possible negative effect of UMP on margins. The coefficients of central banks asset
growth (CB_GR) and M0 growth (M0_GR) are negative and statistically significant (column 1 and 3). Second,
the effect of UMP is diametrically the opposite for RoA (column 2 and 4). Hence, while UMP and NIRP play a
complementary role in driving down NIMs, the latter appears to have cancelled out a substantial amount of the
stimulus impact of central bank balance sheet expansion in terms of boosting bank profits35.
As a further robustness check, we alter our country sample and focus only on European countries where the
treatment group includes only European NIRP adopters and the control group includes only European non-NIRP
adopters. These results are reported in panel C of the table 4 (column 1 and 2). The coefficients of NIRP in both
33 However, in countries like Sweden and Denmark, where banks operate in a highly concentrated banking system and do not rely on retail deposit funding, banks can eventually decide to lower retail deposit rates below zero. In section 4.2, we test the role of market competition and bank funding structure on different bank behaviours in a negative interest rate setting. 34 A similar test has been undertaken computing bank-level loan and deposit rates. Following Carbo and Fernandez (2007), we define the price of loans as the ratio of interest income on loans and the price of deposits as the ratio of interest expenses on deposits. The results (not reported) are in-line with our aggregate measures. 35 It might be the case that both UMPs and NIRP have a positive impact on non-interest income that could offset the negative effects of declines in NIM on profitability. In table A5 (column 3) in the Appendix, we complement the analysis of the non-interest income baseline regression by adding M0_growth as a UMP control. The result shows that both NIRP and UMPs affect positively non-interest income. However, the overall negative effect on RoA displayed in table 3 indicates that the negative effects of NIMs on bank profits outweigh the positive effect of greater non-interest income and profitability still falls. This last point is further examined in section 4.3 of the paper.

cases remains negative and statistically significant (in the case of NIM the relationship is stronger than in the
baseline regression)36.
As a final robustness check, we try to eliminate the possibility that bank margins and profitability in the treatment
group may have altered prior to the introduction of NIRP—for example, in anticipation of the adverse effects of
NIRP, or for some bank-specific reasons—thereby invalidating our choice of difference-in-differences estimation.
If the estimated coefficients on the ‘false’ NIRP are not statistically significant, we can be more confident that our
baseline coefficient is capturing a genuine monetary policy shock. In panel D of the table we report results from
estimates in which we extend our sample to the period from 2011 – 2014 setting the introduction of a “fake” NIRP
in 2013. The coefficient on the NIRP variable is still negative but smaller and not statistically significant adding
further support to the validity of our baseline estimation.
36 We follow the studies conducted by Bertrand and Mullainathan (2003) and Jayaratne and Strahan (1996) that use different control groups, as a further test to control for the omitted variables problem. Multiple control and treatment groups reduce biases and unobservable variables associated with just one comparison.

Table 4. Robustness checks
NIM (1) ROA(2) NIM (3) ROA (4)
a. Lending and deposit rates NIRP-effect -0.1993*** -0.0792*** -0.1493*** -0.0436***
(0.0163) (0.0131) (0.0288) (0.0218)
lending rate 0.0548*** 0.0156
(0.0163) (0.0121) deposit rate 0.0145*** 0.0090
(0.0198) (0.0161)
Adj. R2 0.0440 0.0058 0.0396 0.0103
N.Obs 10901 11112 5678 5738
N.Banks 3142 3210 1719 1737 b. Unconventional Monetary Policy (UMP) NIRP-effect -0.1520*** -0.0584*** -0.1620*** -0.0842***
(0.0144) (0.0108) (0.0142) (0.0105)
CB_GR -0.0393* 0.0733***
(0.0209) (0.0196) M0_GR -0.0012*** 0.0005*
(0.0003) (0.0003)
Adj. R2 0.0723 0.0090 0.0612 0.0121
N.Banks 7238 7354 5335 5422
N.Obs 25212 25627 19486 19809
c.NIRP and the EU NIRP-effect -0.179*** -0.0507***
(0.0267) (0.0175) Adj. R2 0.0950 0.0119 N.Banks 5527 5623 N.Obs 19897 20244 d.fake-NIRP -0.0173 -0.0080 NIRP-effect 0.0175 0.0161 Adj. R2 0.0000 0.0001 N.Banks 7183 7307 N.Obs 20123 20472
All regressions include fixed bank and time effects. Robust standard errors clustered by banks in parenthesis. ***,
** and * indicate statistical significance at 1%, 5% and 10%, respectively
Size, Competition and Asset Composition
As suggested by Jobst and Lin (2016), Brunnermeier and Koby (2016) and Bech and Malkhozov (2015), the
contraction in NIMs and erosion of profitability should be more marked for small banks operating in competitive
markets and with floating rate assets. In this section, using the difference-in-differences framework, we create
NIRP-adopter treatment groups and non-adopter control groups according to various bank-specific factors that
the literature on NIRP suggest might affect bank behaviour in a negative interest rate setting. Specifically, we
focus on bank size, market competition and asset interest rate composition. First, we examine the impact of NIRP
on NIMs and RoAs by running percentile regressions based on size. The results reported in Tables 5 are important
in two respects. First, the largest banks show a significantly smaller contraction in margins (4.1% compared to
21.1% for the smallest (panel A in columns 1 and 4) and statistically insignificant influence on profitability
(column 2). Following dell’Ariccia et al. (2010), this result suggests that NIRP enables large wholesale funded
banks to take greater advantage of a declining funding costs partially offsetting pressure on margins and
profitability. Second, the coefficients get larger in magnitude as banks size shrinks. This is in-line with the
literature mentioned in section 1 indicating that large banks, through hedging and diversification, are better able
to protect themselves against interest rate risk37.
As a second test, we assess the impact of NIRP in the context of competitive conditions in banking markets. In
this case, we use the Lerner index as a proxy for competition conditions38. Sørensen and Werner (2006) argue that
banks operating in a less competitive environment make slower adjustments to interest rates (and therefore to
NIMs), which slows the transmission of monetary policy. Brunnermeier and Koby (2016) present a “reversal
interest rate” hypothesis according to which there is a rate of interest at which accommodative monetary policy
“reverses” its effect and becomes contractionary. They show that low interest policy is likely to have a more
limiting effect on bank lending in competitive markets because of the associated pressure on NIMs. As the Lerner
index varies between 0 and 1, we define a competitive market as those banking markets with a Lerner index
smaller than 0.50, vice versa for non-competitive. The results, reported in panels A and B of table 6, support the
aforementioned studies: namely that the impact of NIRP on bank profits and margins in competitive markets is
negative and statistically significant. In less competitive markets in contrast, the impact of NIRP is negative but
statistically insignificant for NIM while positive and statistically significant for RoA suggesting that banks here
are better able to maintain profitability and margins.
37 If small banks do not increase non-interest income from NIRP, we can more confidently say that the policy has a larger impact on reducing their RoA. In Table A8 (Panel A and Panel B) in the Appendix, we provide percentile regressions based on bank size for the impact on non-interest income and fees and commissions. The results confirm our hypothesis that small banks are the most affected (negatively) by NIRP in term of NIMs and RoAs as well as the least affected (positively) by NIRP in respect of non-interest income. Regressions (not reported) that include M0_growth as a control for UMPs also suggest a similar positive effect of UMPs on non-interest income and fees and commissions for large banks, while small banks are just marginally affected. 38 For this exercise, similar tests were also undertaken using the Boone index and the Herfindahl-Hirschman Index (HHI). The results obtained (table A9 in the Appendix) are in-line with the Lerner index.
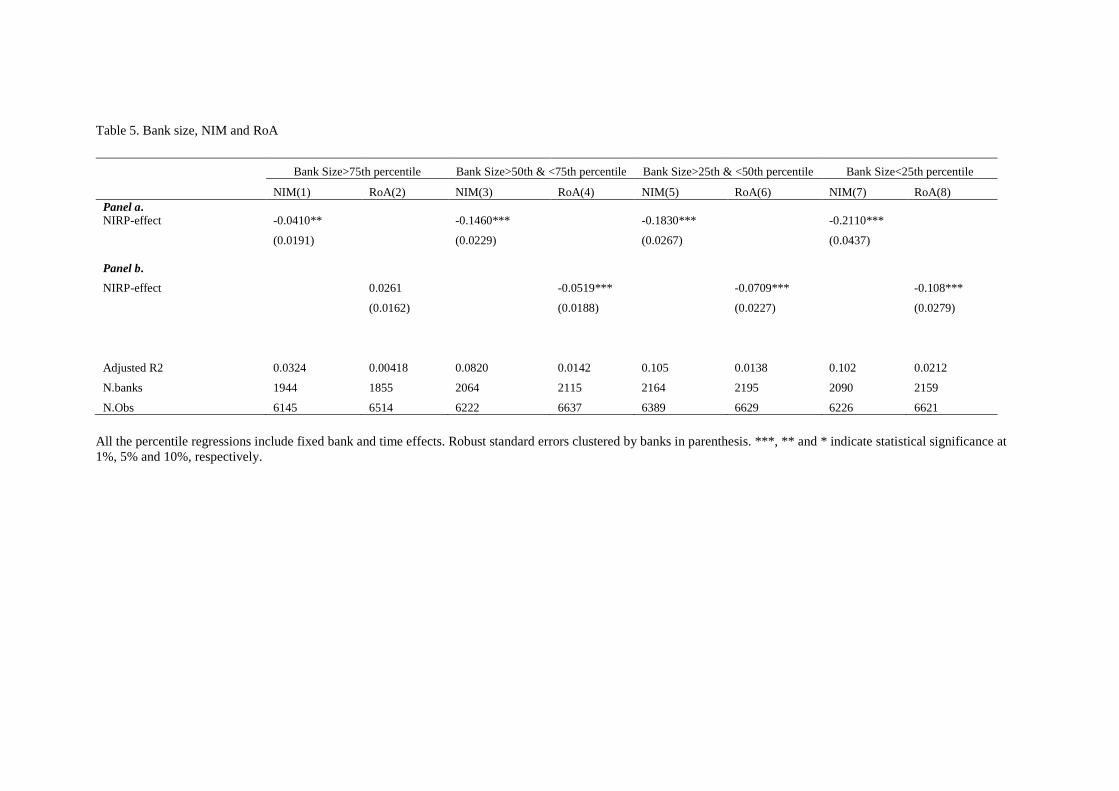
Table 5. Bank size, NIM and RoA
Bank Size>75th percentile Bank Size>50th & <75th percentile Bank Size>25th & <50th percentile Bank Size<25th percentile
NIM(1) RoA(2) NIM(3) RoA(4) NIM(5) RoA(6) NIM(7) RoA(8) Panel a. NIRP-effect -0.0410** -0.1460*** -0.1830*** -0.2110***
(0.0191) (0.0229) (0.0267) (0.0437) Panel b. NIRP-effect 0.0261 -0.0519*** -0.0709*** -0.108***
(0.0162) (0.0188) (0.0227) (0.0279)
Adjusted R2 0.0324 0.00418 0.0820 0.0142 0.105 0.0138 0.102 0.0212
N.banks 1944 1855 2064 2115 2164 2195 2090 2159
N.Obs 6145 6514 6222 6637 6389 6629 6226 6621 All the percentile regressions include fixed bank and time effects. Robust standard errors clustered by banks in parenthesis. ***, ** and * indicate statistical significance at 1%, 5% and 10%, respectively.

Table 6. Banking sector competition and interest rate asset composition
NIM ROA NIM ROA
Panel A. Competitive
Panel B. Non-competitive
NIRP-effect -0.0798*** -0.0695*** -0.0327 0.0680***
(0.0372) (0.0248) (0.0205) (0.0207) r2_a 0.0964 0.0039 0.0187 0.0030 N.Banks 4559 4640 3361 3443 N.Obs 15096 15259 10877 11142
Panel C. Fixed-rate
Panel D. Floating-rate
NIRP-effect 0.0222 0.0286* -0.0368** 0.0031
(0.0155) (0.0141) (0.0141) (0.0107)
r2_a 0.0058 0.0017 0.0244 0.0008 N.Banks 3689 3773 6436 6543
N.Obs 13095 13411 23066 23454 All regressions include fixed bank and time effects. Robust standard errors clustered by banks in parenthesis.
***, ** and * indicate statistical significance at 1%, 5% and 10%, respectively. As a final test, we try to disentangle the effect of NIRP for floating-rate and fixed-rate countries39. According to
Jobst and Lin (2016), Brunnermeier and Koby (2016) and Albertazzi and Gambacorta (2009), the impact of NIRP
should have a greater effect on variable-rate loans and on new loans. Hence, banks having a higher proportion of
outstanding floating rate loans/assets should be strongly adversely impacted by the new monetary regime
compared to those that rely more on fixed rate assets. The ECB’s Statistical Warehouse provides data on the share
of variable rate loans in total loans to household and non-financial corporations. Again, we split the sample
dividing the treatment group into floating and fixed rate countries. For this exercise, we consider a floating rate
country as having a share of variable rate loans to total loans greater than 50%, and vice versa for fixed-rate
countries40. The results are presented in panel C and D of table 6. While it is noticeable that there is a reduction
in NIMs in floating rate countries (as expected), the results display also an increase in bank profits for floating
rate countries as their margins are less affected by NIRP.
39 As already mentioned in section 4.2, splitting control and treatment groups in different sub-groups allows us to reduce biases and unobservable variables associated with just one comparison, hence limiting the omitted variables bias. 40 Germany, Austria, Estonia, Spain, Finland, Greece, Ireland, Italy, Luxembourg, Portugal, Sweden and Slovenia are, according to our computation, floating rate countries. Denmark, France, Hungary, Norway, Netherlands and Slovakia are fixed rate.
Conclusions
Since 2012, several central banks have adopted NIRP aimed at boosting real spending by facilitating an increase
in the supply of bank loans. The policy has generated controversy with skeptics pointing to several factors that
might complicate the transmission from negative policy rates to higher bank lending. One factor that has been
mentioned is that NIRP could compress NIMs and, therefore, bank profits, which may limit a bank’s ability to
lend. Empirical evidence on the impact of NIRP on bank behavior/performance is scant. In this paper, we provide
new evidence that bank margins and profitability fared worse in NIRP-adopter countries than in countries that did
not adopt the policy. Specifically, countries in which central banks implemented NIRP experienced a decline in
NIMs and RoAs compared to those countries in which central banks did not follow this policy. This result holds
and is robust to the inclusion of several bank-specific control variables. It also stands-up in the face of a wide
array of robustness checks, including controlling for the effects of lending and deposit rates, other UMPs, for sub-
sample analysis and to (possible) changes prior to the introduction of NIRP. Finally, our findings support recent
discussion and preliminary analysis of the effect of NIRP on bank-specific factors (size, competition and interest
rate asset composition) that make banks profitability more vulnerable in a negative interest rate environment.

References
Albertazzi, U., Gambacorta, L., 2009. Bank profitability and the business cycle. Journal of Financial Stability 5,
393-409.
Alessandri, P., Nelson, B., 2015. Simple banking profitability and the yield curve. Journal of Money, Credit and
Banking 47, 143-75.
Almarzoqi, R., Naceur, S. B., 2015. Determinants of bank interest margin in the Caucasus and Central Asia.
International Monetary Fund Working Paper 15/87, Washington DC: IMF.
Angbazo, L., 1997. Commercial bank net interest margin, default risk, interest rate risk, and off-balance sheet
banking. Journal of Banking & Finance 21, 57-87.
Arteta, C., Kose, M.A., Stocker, M., Taskin, T., 2016. Negative interest rate policies: Sources and implications.
World Bank Policy Research Paper 7791, August. Washington DC: World Bank.
Athanasoglou, P. P., Brissimis, S. N., Delis, M. D., 2008. Bank-specific industry-specific and macroeconomic
determinants of bank profitability. Journal of International Financial Markets, Institutions and Money 18, 121-
136.
Bech, M., Malkhozov, A., 2015. How have central banks implemented negative policy rates? Bank for
International Settlements, (BIS) Quarterly Review (March), 31-44. Basel: BIS.
Beck, T., Hess, H., 2009. Why are interest spreads so high in Uganda? Journal of Development Economics 88,
192-204.
Beck, T., Levine, R. Levkov, A., 2010. Big bad banks? The winner and the losers from the deregulation in the
United States. Journal of Finance 65, 1367-1667.
Berger, A. N., 1995. The profit-structure relationship in banking: Test of market-power and efficient-structure
hypotheses. Journal of Money, Credit and Banking 27, 404-431.
Berger, A. N., Kick, T., Schaeck, K., 2014. Executive board composition and bank risk taking. Journal of
Corporate Finance 28, 48-65.
Bernanke, B., Reinhart, V., 2004. Conducting monetary policy at very low short-term interest rates. American
Economic Review 94, 85–90.

Bertrand, M., Mullainathan, S., 2003. Enjoying the quiet life? Corporate governance and managerial preferences,
Journal of Political Economy 111, 1043-1075.
Bertrand, M., Duflo, E., Mullainathan, S., 2004. How much should we trust difference-in-differences estimates?
Quarterly Journal of Economics 119, 249-275.
Borio, C. Zabai, A. 2016. Unconventional monetary policies: A re-appraisal. Bank for International Settlement,
(BIS) Working Paper. Bank for International Settlement. No 570. Basel: BIS.
Boyd, J., Levine, R., Smith, B., 2001. Inflation and financial market performance. Journal of Monetary Economics
47, 221-248.
Brunnermeier, M.K., Koby, Y., 2016. The reversal interest rate: the effective lower bound of monetary policy.
Princeton University Department of Economics Working Paper August 27.
https://scholar.princeton.edu/sites/default/files/markus/files/08f_reversalrate.pdf
Bush, R., Memmel, C., 2015. Banks’ net interest margin and the level of interest rates. Deutsche Bundesbank,
Discussion papers No 16/2015, Frankfurt: Deutsche Bundesbank.
Calderon, C., Schaeck, K., 2013. Bank bailouts, competition, and the disparate effects for borrowers and depositor
welfare. World Bank Policy Research Working Paper 6410, Washington: World Bank.
Carbo’, S., Fernandez, F. R. 2007. The determinants of bank margins in European banking. Journal of Banking
& Finance 31, 2043-2063.
Chakraborty, I., Goldstein, I, MacKinlay, A., 2017. Monetary stimulus and bank lending. Finance Down Under
2017 Building on the Best from the Cellars of Finance. June. doi: http://dx.doi.org/10.2139/ssrn.2734910
Claessens, S., Coleman, N., Donnelly, M., 2017. Low-for-long interest rates and banks’ interest margin and
profitability: cross-country evidence. Journal of Financial Intermediation, (forthcoming), doi:
https://doi.org/10.1016/j.jfi.2017.05.004
Claessens, S., Laeven, L., 2003. What drives bank competition? Some international evidence. Journal of Money,
Credit and Banking 36, 563-583.
Coeure’, B. 2016. Assessing the implication of negative interest rate. Speech at the Yale Financial Crisis Forum
in New Haven. July 28, 2016. doi: https://www.ecb.europa.eu/press/key/date/2016/html/sp160728.en.html .
Chung. H. La Forte. J. P. Reifschneider. D. Williams. J. C. 2012. Have we underestimated the probability of
hitting the zero lower bound? Journal of Money, Credit and Banking 44, 47-82.
Covas, F, B., Rezende, M., Vojtech, C, M., 2015. Why are net interest margin of large banks so compressed?
Board of Governors of the Federal Reserve System, FEDS Notes, October. doi:
https://www.federalreserve.gov/econresdata/notes/feds-notes/2015/why-are-net-interest-margins-of-large-banks-
so-compressed-20151005.html.
Dell’Ariccia, G., Laeven, L., Marquez, R., 2010. Monetary policy, leverage and bank risk taking. International
Monetary Fund Working Paper 10/276. Washington DC: IMF.
Demirgüç-Kunt, A., and Huizinga, H., 1999. Determinants of commercial bank interest
margins and profitability: some international evidence, World Bank Economic Review 13,
379-408. Washington: World Bank.
Demirgüç-Kunt, A., Laeven, L., Levine, R., 2004. Regulations, market structure, institutions, and the cost of
financial intermediation. Journal of Money, Credit and Banking 36, 593-622.
Di Maggio, M., Kermani, A., and Palmer, C., 2016, How quantitative easing works: Evidence on the refinancing
channel. National Bureau of Economic Research Working Paper No. 22638, September 2016, Washington D.C:
NBER.
Donald, S., Lang, K., 2007. Inference with difference-in-differences and other panel data. Review of Economics
and Statistics 89, 221-233.
English, W, B., 2002. Interest rate risk and bank net interest margin. Bank for International Settlements. (BIS)
Quarterly Review (December), 67-92, Basel: BIS.
Entrop, O., Memmel, C., Ruprecht, B., Wilkens, M., 2015. Determinants of bank interest margin: impact of
maturity transformation. Journal of Banking & Finance 54, 1-19.
Flannery, M, J., 1981. Market interest rate and commercial bank profitability: an empirical investigation. Journal
of Finance 36, 1085-1101.
Fiordelisi, F., Ricci, O., Stentella Lopes, F. S., 2016. The unintended consequence of the Single-Supervisory
Mechanism launch in Europe. Journal of Financial and Quantitative Analysis, (forthcoming).
Freixas, X., Rochet, C. J., 1997. Micoeconomics of Banking. Cambridge: MIT press.
Gambacorta, L., Hofmann, B. and Peersman, G., 2014. The effectiveness of unconventional monetary policy at
the zero lower bound: A cross-country analysis. Journal of Money, Credit and Banking 46, 615–642.
Gelos, R., 2006. Banking Spreads in Latin America. International Monetary Fund Working Paper 06/44
(February), Washington: IMF.
Genay, H., Podjasek, R., 2014. What is the impact of low interest rate environment on bank profitability? Chicago
Federal Reserve Letter, 324, July.
Gertler, M., Kiyotaki, N., 2011. Financial intermediation and credit policy in business cycle analysis. In Friedman,
B., and Woodford, M., (Eds.), Handbook of Monetary Economics. Elsevier, Amsterdam: Netherlands.
Goddard, J., Molyneux, P., Wilson, J. O. S., 2004. The profitability of European banks: A cross-sectional and
dynamic panel analysis. Manchester School 72, 363-381.
Hamilton, J. and Jing, C. W. 2011. “The effectiveness of alternative monetary policy tools in a zero lower bound
environment”. Journal of Money, Credit and Banking 44, 3-46.
Hancock, D., 1985. Bank profitability, interest rates, and monetary policy. Journal of Money, Credit and Banking
17, 189-202.
Hanweck, G., Ryu, L., 2005. The sensitivity of bank net interest margin and profitability to credit, interest-rate,
and term-structure shocks across bank product specialisation. Federal Deposit Insurance Corporation (FDIC)
Working Paper (January), 2005-02, Washington DC: FDIC.
Hawtrey, K., Liang, H., 2008. Bank interest margins in OECD countries. North American Journal of Economics
and Finance 19, 249-260.
Ho, T S. Y., and Saunders, A., 1981. The determinants of bank interest margins:
Theory and empirical evidence, Journal of Financial and Quantitative Analysis 16, 581-600.
Imbens, G. W., Wooldridge, J. M., 2009. Recent developments in the econometrics of program evaluation.
Journal of Economic Literature 47, 5-86.
Jayaratne, J., Strahan, P. E., 1996. The finance-growth nexus: Evidence from bank branch deregulation. Quarterly
Journal of Economics 101, 639-670.
Jobst, A., Lin, H., 2016. Negative interest rate policy (NIRP): implications for monetary transmission and bank
profitability in the euro area. International Monetary Fund Working Paper 16/172 (August). Washington D.C:
IMF.
Kandrac, J., and Schulsche, B., 2017. Quantitative easing and bank risk taking: evidence from lending. (September
25). Available from http://dx.doi.org/10.2139/ssrn.2684548
Kunz, P., 2016. Negative-yielding bonds jump to almost 12$ trillion. Bloomberg. Available at:
https://www.bloomberg.com/news/articles/2016-10-02/negative-yielding-bonds-jump-to-almost-12-trillion-
after-ebbing.
Lambert, F., Ueda, K., 2014. The effects of unconventional monetary policies on bank soundness. International
Monetary Fund Working Paper 14/152 (August), Washington DC: IMF.
Lechner, M., 2010. The estimation of causal effects by difference-in-difference methods. Foundations and Trends
in Econometrics 4, 165-224.
Lepetit, L., Nys, E., Rous, P., Tarazi, A., 2008. The expansion of services in European banking: implications for
loan pricing and interest margins. Journal of Banking & Finance 32, 2325-2335.
Maudos, J., Fernandez de Guevara, J., 2004. Factors explaining interest margin in the banking sectors of the
European Union. Journal of Banking & Finance 28, 2259-2281.
Madous, J., Solis, L., 2009. The determinants of net interest income in the Mexican banking system: an integrated
model. Journal of Banking & Finance 33, 1920-1931.
McAndrews, J., 2015. Negative nominal central bank policy rates: where is the lower bound? Remarks at the
University of Wisconsin, May 8, New York Federal Reserve Speeches.
https://www.newyorkfed.org/newsevents/speeches/2015/mca150508.html
McShane, R. W., Sharpe, I. G., 1985. A time series/cross section analysis of the determinants of Australian trading
bank loan/deposit interest margin: 1962-1981. Journal of Banking & Finance 9, 115-136.
Mirzaei, A., Moore, T., Liu, G., 2013. Does market structure matter on bank’s profitability and stability? Emerging
vs. advanced economies. Journal of Banking & Finance 37, 2920-2937.
Molyneux, P., Thornton, J., 1992. Determinants of European banking profitability: A note. Journal of Banking &
Finance 16, 1173-1178.
Petersen, M., 2009. Estimating standard error in finance panel dataset: comparing approaches. Review of Financial
Studies 22, 435-480.
Poghosyan, T., 2012. Financial intermediation costs in low-income countries: the role of regulatory, institutional,
and macroeconomic factors. International Monetary Fund Working Paper 12/140, Washington DC: IMF.

Reifschneider, D. L. and Williams, J. C. 2000. Three lessons for monetary policy in a low-inflation era. Journal
of Money, Credit and Banking 32, 936-66.
Roberts, M. R., Whited, T. M., 2012. Endogeneity in empirical corporate finance. Handbook of the Economics of
Finance, Editors G.M. Constantinides, M. Harris and R. M. Stulz, Volume 2 Part A, Chapter 7, 493-572 (NY:
Elsevier)
Rodnyansky, A., Darmouni, O., 2017. The effects of quantitative easing on bank lending behavior. The Review of
Financial Studies (Forthcoming). Available at: https://doi.org/10.1093/rfs/hhx063
Samuelson, P. A., 1945. The effect of interest rate increases on the banking system. American Economic Review
35, 16-27
Saunders, A., Schumacher, L., 2000. The determinants of bank interest rate margins: an international study.
Journal of International Money and Finance 19, 813-832.
Sørensen, K. C., Werner, T., 2006. Bank interest rate pass-through in the euro area: a cross-country comparison.
European Central Bank Working Paper Series 580 (January). Frankfurt: ECB.

Appendix
Table.A1 Time of Adoption of NIRP.
Country NIRP adoption date
Austria June 2014 Belgium June 2014 Denmark July 2012 Estonia June 2014 Finland June 2014 France June 2014 Germany June 2014 Greece June 2014 Hungary March 2014 Ireland June 2014 Italy June 2014 Luxembourg June 2014 Netherlands June 2014 Norway September 2015 Portugal June 2014 Slovakia June 2014 Slovenia June 2014 Spain June 2014 Sweden February 2015 Switzerland January 2015
Table A2. Correlation Matrix control variables
size E/TA Liquidity Credit risk GDP growth Inflation
Size 1.0000
E/TA -0.2015*** 1.0000
Liquidity 0.0706*** 0.0097*** 1.0000
Credit risk -0.0966*** 0.2031*** 0.0553*** 1.0000
GDP growth 0.1117*** 0.1040*** -0.0745*** -0.1291*** 1.0000
Inflation 0.0102*** 0.2022*** 0.044*** 0.0186*** -0.0174*** 1.0000
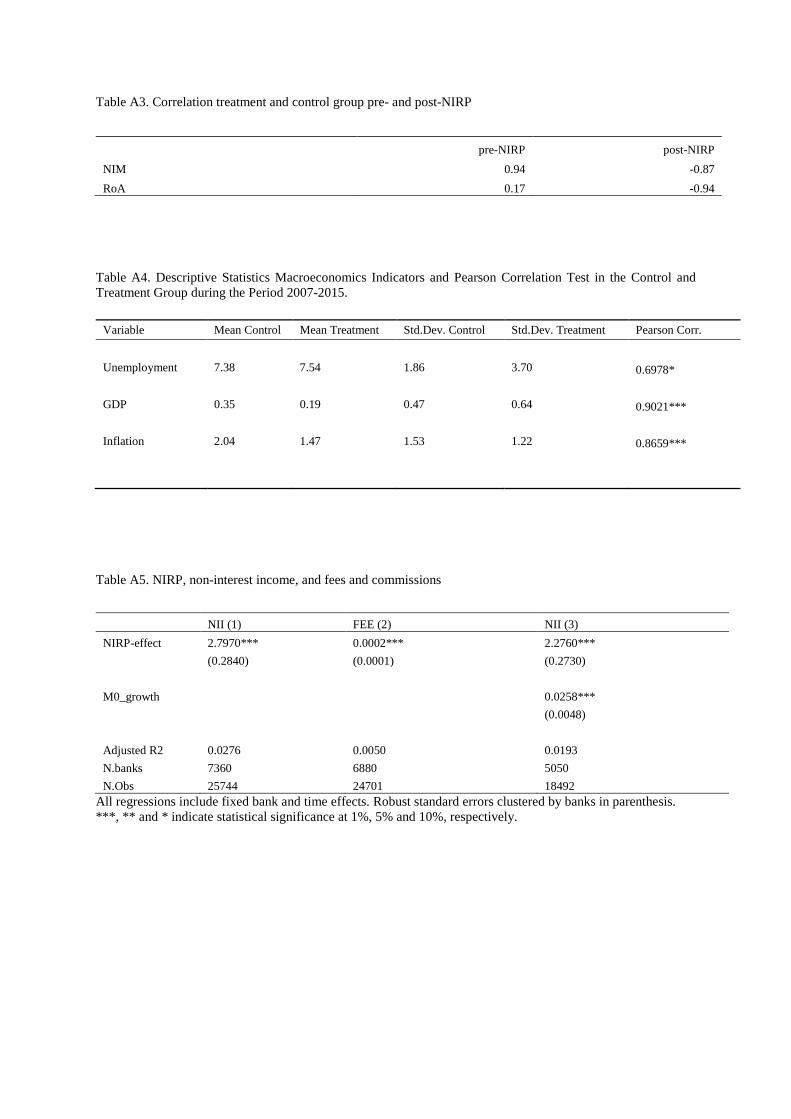
Table A3. Correlation treatment and control group pre- and post-NIRP
pre-NIRP post-NIRP NIM 0.94 -0.87 RoA 0.17 -0.94
Table A4. Descriptive Statistics Macroeconomics Indicators and Pearson Correlation Test in the Control and Treatment Group during the Period 2007-2015.
Variable Mean Control Mean Treatment Std.Dev. Control Std.Dev. Treatment Pearson Corr.
Unemployment 7.38 7.54 1.86 3.70 0.6978*
GDP 0.35 0.19 0.47 0.64 0.9021***
Inflation 2.04 1.47 1.53 1.22 0.8659***
Table A5. NIRP, non-interest income, and fees and commissions
NII (1) FEE (2) NII (3) NIRP-effect 2.7970*** 0.0002*** 2.2760***
(0.2840) (0.0001) (0.2730)
M0_growth 0.0258***
(0.0048)
Adjusted R2 0.0276 0.0050 0.0193 N.banks 7360 6880 5050 N.Obs 25744 24701 18492
All regressions include fixed bank and time effects. Robust standard errors clustered by banks in parenthesis. ***, ** and * indicate statistical significance at 1%, 5% and 10%, respectively.
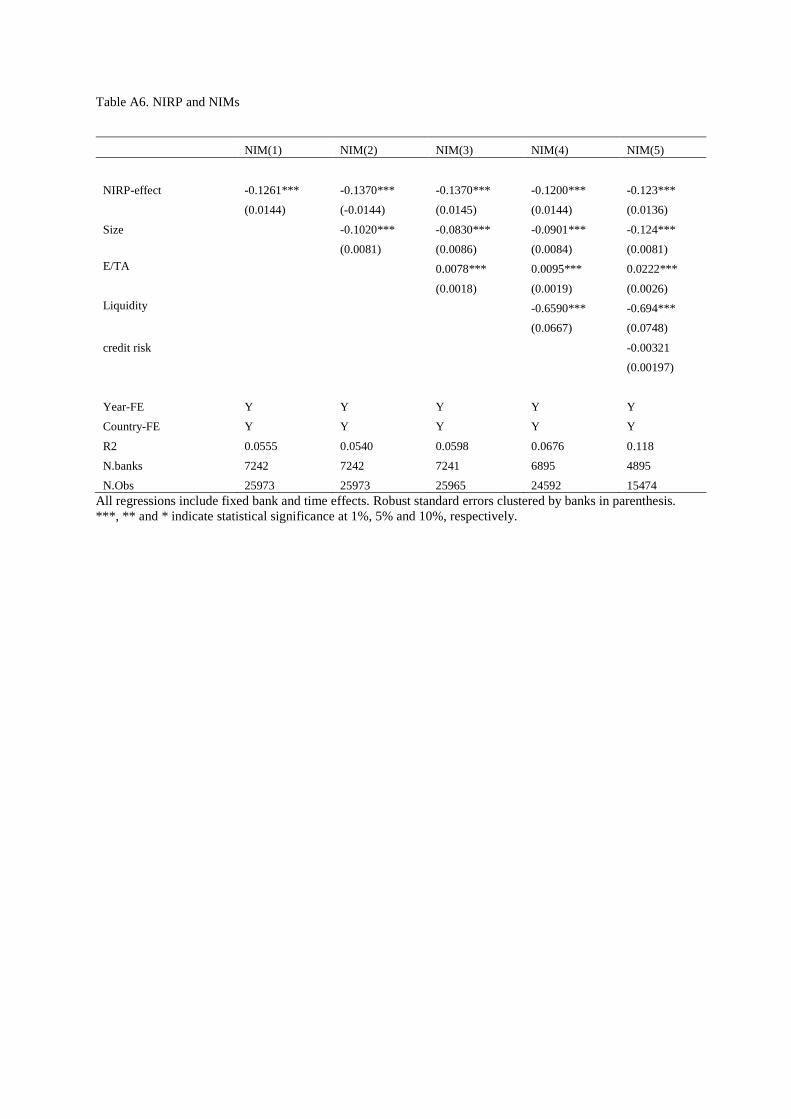
Table A6. NIRP and NIMs
NIM(1) NIM(2) NIM(3) NIM(4) NIM(5)
NIRP-effect -0.1261*** -0.1370*** -0.1370*** -0.1200*** -0.123***
(0.0144) (-0.0144) (0.0145) (0.0144) (0.0136) Size -0.1020*** -0.0830*** -0.0901*** -0.124***
(0.0081) (0.0086) (0.0084) (0.0081) E/TA 0.0078*** 0.0095*** 0.0222***
(0.0018) (0.0019) (0.0026) Liquidity -0.6590*** -0.694***
(0.0667) (0.0748) credit risk -0.00321
(0.00197)
Year-FE Y Y Y Y Y Country-FE Y Y Y Y Y R2 0.0555 0.0540 0.0598 0.0676 0.118 N.banks 7242 7242 7241 6895 4895 N.Obs 25973 25973 25965 24592 15474
All regressions include fixed bank and time effects. Robust standard errors clustered by banks in parenthesis. ***, ** and * indicate statistical significance at 1%, 5% and 10%, respectively.

Table A7. NIRP and RoAs
RoA(1) RoA(2) RoA(3) RoA(4)
NIRP-effect -0.0629*** -0.0650*** -0.0629*** -0.0455***
(0.0118) (0.0118) (0.0118) (0.0119)
Size -0.0218*** 0.0291*** 0.0344***
(0.0040) (0.0037) (0.0038) E/TA 0.0246*** 0.0269***
(0.0011) (0.0012) Liquidity -0.136***
(0.0411)
Year-FE Y Y Y Y
Country-FE Y Y Y Y
R2 0.0081 0.0080 0.0241 0.0284
N.banks 7359 7358 7357 6939
N.Obs 26401 26400 26394 24767 All regressions include fixed bank and time effects. Robust standard errors clustered by banks in parenthesis. ***, ** and * indicate statistical significance at 1%, 5% and 10%, respectively.
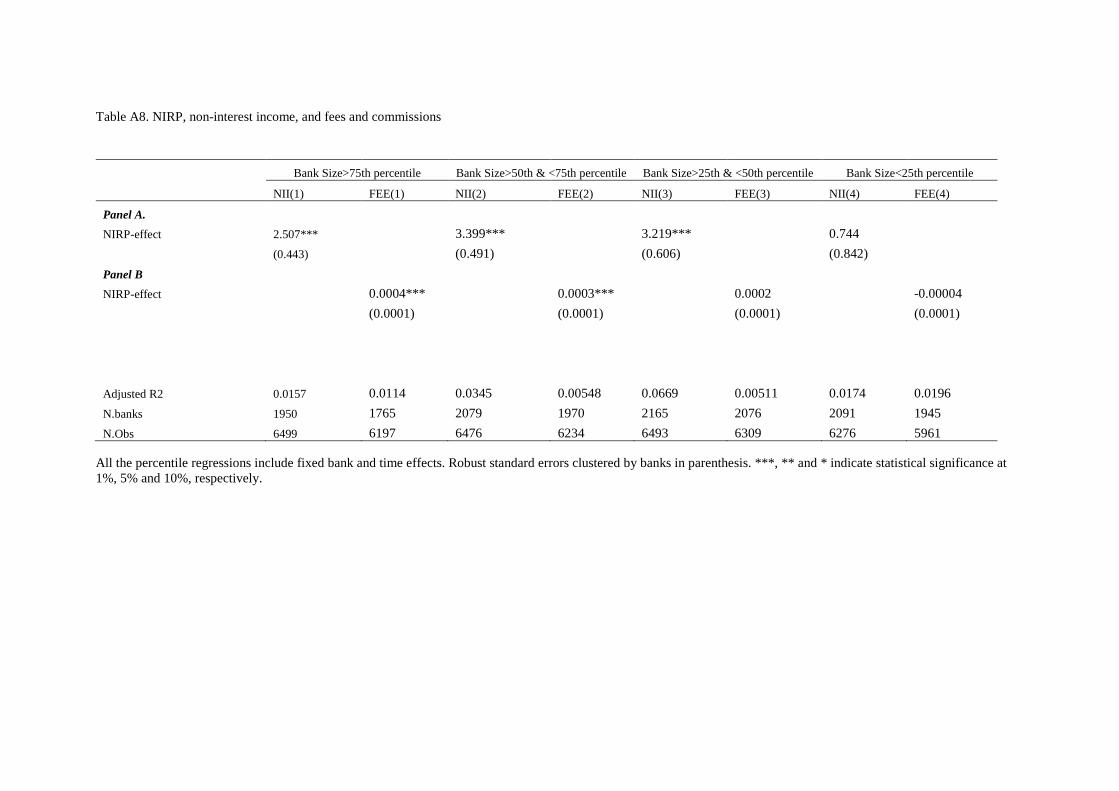
Table A8. NIRP, non-interest income, and fees and commissions
Bank Size>75th percentile Bank Size>50th & <75th percentile Bank Size>25th & <50th percentile Bank Size<25th percentile
NII(1) FEE(1) NII(2) FEE(2) NII(3) FEE(3) NII(4) FEE(4)
Panel A. NIRP-effect 2.507*** 3.399*** 3.219*** 0.744
(0.443) (0.491) (0.606) (0.842) Panel B NIRP-effect 0.0004*** 0.0003*** 0.0002 -0.00004
(0.0001) (0.0001) (0.0001) (0.0001)
Adjusted R2 0.0157 0.0114 0.0345 0.00548 0.0669 0.00511 0.0174 0.0196
N.banks 1950 1765 2079 1970 2165 2076 2091 1945
N.Obs 6499 6197 6476 6234 6493 6309 6276 5961 All the percentile regressions include fixed bank and time effects. Robust standard errors clustered by banks in parenthesis. ***, ** and * indicate statistical significance at 1%, 5% and 10%, respectively.
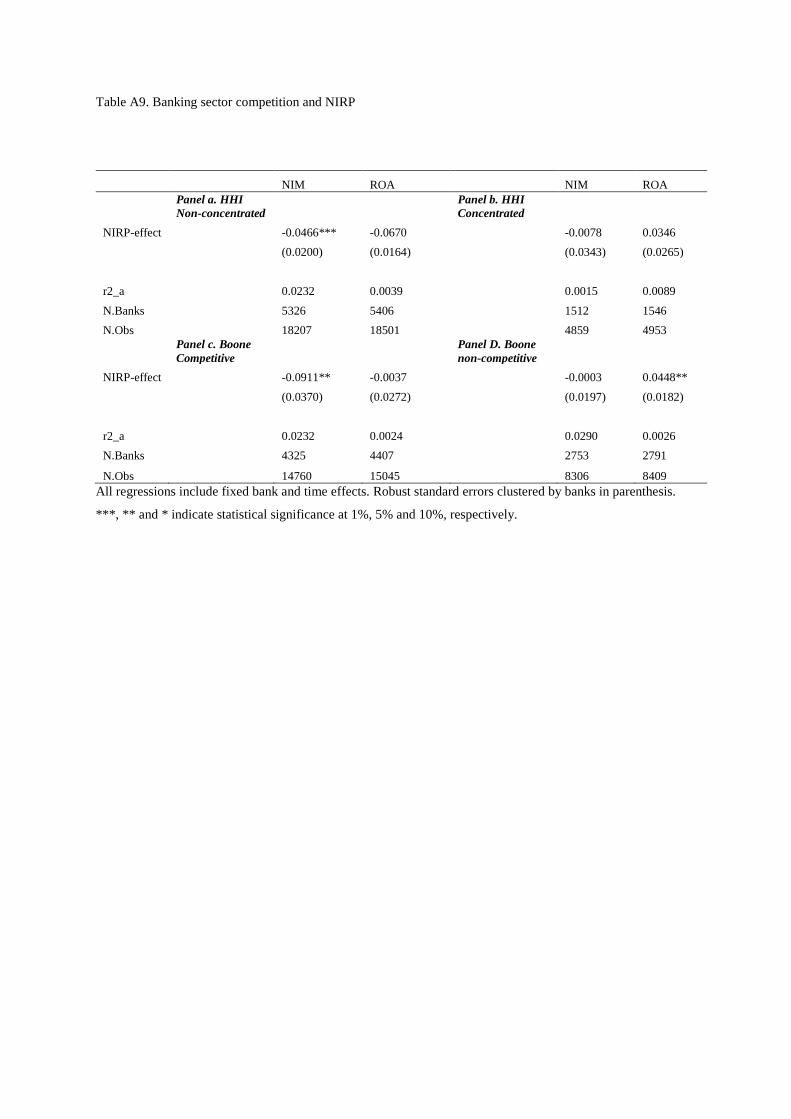
Table A9. Banking sector competition and NIRP
All regressions include fixed bank and time effects. Robust standard errors clustered by banks in parenthesis.
***, ** and * indicate statistical significance at 1%, 5% and 10%, respectively.
NIM ROA NIM ROA
Panel a. HHI Non-concentrated
Panel b. HHI Concentrated
NIRP-effect -0.0466*** -0.0670 -0.0078 0.0346
(0.0200) (0.0164) (0.0343) (0.0265) r2_a 0.0232 0.0039 0.0015 0.0089 N.Banks 5326 5406 1512 1546 N.Obs 18207 18501 4859 4953
Panel c. Boone Competitive
Panel D. Boone non-competitive
NIRP-effect -0.0911** -0.0037 -0.0003 0.0448**
(0.0370) (0.0272) (0.0197) (0.0182)
r2_a 0.0232 0.0024 0.0290 0.0026 N.Banks 4325 4407 2753 2791
N.Obs 14760 15045 8306 8409