Embed Size (px)
Citation preview

Bangladesh Renal Journal
OFFICIAL JOURNAL OF
BANGLADESH RENAL ASSOCIATION
Volume 03 Number 01
Editorial
l Quality of Life in patients of end stage renal disease on different
modalities of treatment 1
Muhammad Rafiqul Alam
Original Articles
l Quality of Life among the CKD Patients on Different 3
Modalities of Treatment
Mesbah Uddin Noman, Abu Saleh Ahmed, Ratan Das Gupta,
Hedayetul Islam, Syed Mahtab-Ul-Islam, Fazla Alahi Khan
l Micro and Macrovascular Complications in Diabetic Nephropathy 12
in Different Stages of
Chronic Kidney Disease
Momtaz Hossain, Md. Nizamuddin Chowdhury, Md.Mahmud Hasan,
Ferdous Jahan, Syed Mahbub Morshed, Abdullah Al Mamun
l Effect of Atorvastatin on Lipid and Cardiovascular Events in 19
Patients on Maintenance Hemodialysis
Muhammed Arshad Ul Azim, Md. Habibur Rahman , Abdus Salam,
Sayed Mahtabul Islam, Shahryar Waheed
Case Reports
l A Middle Age Women with Amyloidosis and Nephrotic 32
Syndrome – A Case Report
Md. Abdullah Al Mamun, Md. Bellal Hossain, Farzana Hafiz,
Sayed Mahbub Murshed, Ratan Das Gupta
l Prostatic Carcinoma with Metastasis to Colon Causing Obstructed 36
Uropathy: A Case Report
Tabassum Samad, Md. Abdur Rahim, Faria Riffat Chowdhury,
Md Anisur Rahman, Wasim M M Haque, Sarwar Iqbal,
Md. Abul Mansoor
CONTENTS
January 2021
BANGLADESH RENAL JOURNAL
(A Journal of continuing education in kidney diseases)
GENERAL INFORMATION
Bangladesh Renal Journal is the official organ of the Bangladesh Renal Association. The Journal publishes two issue in
a year i.e. June and December. The Journal is devoted to continuing education in kidney diseases.
For Contributors
Papers for Publication should be sent to editorial office or submitted directly by e-mail to: [email protected]. Only
scientific papers written in English will be accepted. The message of a recently published paper may be communicated
in the “recent advances in the renal disease section”. Original articles, review articles, practical procedures, case reports,
clinical communications are wellcome. We would invite opinion and criticism regarding the journal through the letter to
the editor column. Contributors are requested to follow the guidelines for submitting manuscripts.
For Readers and Subscribers
The annual subscription for this journal is as follows
Medical students : Taka 250.00
Graduate and General practitioner : Taka 500.00
Specialist : Taka 1000.00
Overseas : US dollar $ 50.00
(including postage by air)
Please write for regular supply of your copy to editor.
For Advertisers
Please send the advertisements to : editorial office Room-407, Block-C, Bangabandhu Sheikh Mujib Medical University,
Dhaka-1000, Bangladesh
NATIONAL ADVISORY BOARD
Prof. Md. Firoj Khan
Prof. Shahidul Islam Selim
INTERNATIONAL ADVISORY BOARD
John Dirks (Canada)
Nathan Levin (USA)
A.J. Collins (USA)
Kelvin Lynn (USA)
Ziauddin Ahmed (USA)
Ram Gokal (UK)
A.M. Meyers (South Africa)
Visith Sitprija (Thailand)
S.C. Dash (India)
Syeed Ali Zaffar Naqvi (Pakistan)
Adibul Hasan Rizvi (Pakistan)
Rizvi Sheriff (Sri Lanka)
EDITORIAL BOARD
Editor in Chief : Prof. Harun-Ur-Rashid
Executive Editor : Prof. Brig. Gen. (Retd.)
Dr. Mamun Mostafi
Editors : Prof. Muhammad Rafiqul Alam
Prof. M Muhibur Rahman
Prof. Shamim Ahmed
Board of the Editors : Prof. Dilip Kumar Roy
Prof. Prodip Kumar Datta
Prof. Asia Khanam
Prof. A Ali Chowdhury
Prof. Nizam Uddin Chowdhury
Dr. Nazrul Islam
Dr. Kazi Shanoor Alam
Dr. Ratan Das Gupta
Prof. Sarwar Iqbal
Prof. Ehtasamul Hoque
Prof. AKM Mahbubul Islam
Editorial Office : Room-407, Block-C, Bangabandhu Sheikh, Mujib Medical University (BSMMU), Dhaka-1000, Bangladesh
Tel & Fax : 880-2-8614811, e-mail : [email protected], Web: www.brabd.org
Quality of life in patients of end stage renal disease on
different modalities of treatment
Editorial
In Bangladesh, nearly 35,000 patients with chronic kidney
disease report to Government hospitals with features of
ESRD who require renal replacement therapy. Most of the
patients cannot afford any form of RRT and have no option
other than conservative management. Only few fortunate
patients can start HD, fewer than 10% of patients choose
PD as their initial therapy 1.
Comparisons of KDQOL on HD and PD have produced
conflicting results. A review of this literature that focused
on the relationship of dialysis modality to mental health
domains suggested that patients experience less distress
and better psychologic well-being on PD 2. However,
interpretation of this literature was limited because of small
and convenient samples of patients, use of new
instruments or instruments not tested in ESRD, inadequate
control of case-mix, and a lack of repeated measures.
There have been just a few studies on quality of life in
ESRD who are on conservative, HD and CAPD. It is
expected that quality of life cannot be maintained without
RRT, it is only to calculate the days of life without dialysis.
Mejbah Uddin Noman and others in their paper in this
issue of BRJ has shown that conservative management
has no role in the ESRD management. At the same time it
also evident that an eight hour dialysis is inadequate.
The only longitudinal comparison of modalities was a
study of consecutive patients who began dialysis in 13
Dutch dialysis centers. The results suggested that HD
was associated with a relative benefit in physical aspects
of patient-reported health 3. Patients on both HD and PD
reported improvements in nearly all aspects of general
functioning and psychologic well-being. The surprising
finding was that patients on HD improved more on aspects
of general parameters of quality of life than patients on
PD, with greater improvements. Despite lower scores at
baseline, at 1 yr, patients on HD actually reported better
scores in some domains, such as better physical role
functioning. These findings remained after adjustment for
baseline patient characteristics, although the differences
were no longer statistically significant.
Changes in dialysis-specific aspects of life were more
mixed, and there were more differences between the two
modalities. HD patients improved more in some aspects,
such as sleep (which for PD patients actually became worse
over time) and body image. At the end of 1 yr, patients on
HD reported significantly better sexual functioning than
those on PD. PD patients improved more on other dialysis-
spectrum. The good news for patients on both modalities
is that health and general well-being should improve during
the first year of dialysis. In their paper of Mejbah uddin et
al there is a clear benefit with CAPD in alleviating mental
and physical parameters. This clear difference in the
findings of Dutch study and Bangladesh study could be
regional, socio-economic or due to factors yet to found
out. More and more studies required in this field to solve
these issues.
Prof. (Dr.) Muhammad Rafiqul Alam
Pro-Vice Chancellor (Admin), BSMMU, Dhaka
President, Bangladesh Renal Association
References:
1. United States Renal Data System: USRDS 2002 Annual Data
Report, Bethesda, MD, National Institute of Diabetes,
Digestive and Kidney Diseases, National Institutes of
Health,2002
2. Cameron JI, Whiteside C, Katz J, Devins GM: Differences in
quality of life across renal replacement therapies: A meta-
analytic comparison. Am J Kidney Dis 35: 629–637, 2000
3. Cameron JI, Whiteside C, Katz J, Devins GM: Differences in
quality of life across renal replacement therapies: A meta-
analytic comparison. Am J Kidney Dis 35: 629–637, 2000
(Bang. Renal J. 2021; 3(1): 1)
Original Articles
1. *Dr. MesbahUddinNoman, Assistant Professor (Nephrology), M. Abdur Rahim Medical College, [email protected]
2. Dr. Abu Saleh Ahmed, Assistant Professor (Nephrology), Kustia Medical College, Kustia.
3. Dr. Ratan Das Gupta, Associate Professor(Nephrology) & Head, Department of Nephrology, Sohrawardi Medical College, Dhaka.
4. Dr. Hedayetulislam, SMO, Dialysis Unit, BIRDEM.
5. Dr.SyedMahtab-Ul-Islam, Assistant Professor (Nephrology), Cox’s Bazar Medical College, Cox’s Bazar.
6. Dr. Fazla Alahi Khan, Assistant Professor, Department of Nephrology, Abdul Malek Ukil Medical College, Noakhali
Address of correspondence : Dr. Mesbah Uddin Noman, Assistant Professor (Nephrology), M. Abdur Rahim Medical College, dinajpur.
Quality of Life among the CKD Patients on Different
Modalities of TreatmentMesbah Uddin Noman1, Abu Saleh Ahmed2, Ratan Das Gupta3, Hedayetul Islam4, Syed Mahtab-Ul-Islam5,
Fazla Alahi Khan6
Abstract
Quality of life is considered not only as parameter of efficacy of a treatment modality but also an indicator for morbidity and
survival in chronic kidney disease. In Bangladesh, 8 hours dialysis per week has been adopted as renal replacement therapy in
government hospitals and became a common practice even in non-government institutes mainly due to financial strain. This
longitudinal study with purposive sampling was conducted in Dhaka Medical College and Dialysis Unit, BIRDEM, during the
period from November 2010 to October, 2011among 132 patients. The subjects were divided in four groups, patients only on
conservative treatment (42 patients), patients on 8 hours dialysis per week (39 patients), patients on 12 hours dialysis per week (30
patients), patients on CAPD (23 patients). The patients were followed up at monthly interval using KDQOL survey. The result
showed that physical and mental component of the patients on conservative and 8 hours dialysis per week did not show any
difference and both groups were significantly worse than that of 12 hours dialysis and CAPD; CAPD patients were found to enjoy
best physical and mental component. The ‘burden of kidney disease’ and ‘effects of kidney disease’ were also significantly lower
among the patients with conservative treatment and 8 hours dialysis in comparison to 12 hours dialysis per week and CAPD
patients, the CAPD patients were even better also in these two components. In the component which compared efficacy of a
treatment modality to reduce the symptoms of kidney disease, 8 hours dialysis showed significant difference from conservative
treatment, but 12 hours dialysis per week and CAPD were still better even in this segment. The study result concluded that 8 hours
dialysis per week does not provide any benefit in comparison to conservative treatment except in symptom relief, whereas 12 hours
dialysis per week and CAPD were found to be effective alleviating in all the components of quality of life among CKD patients.
Introduction
The protean physical manifestations of chronic kidney
disease (CKD) span every organ system, range in severity
from minute disturbance to life threatening, and negatively
disrupt patients’ lifestyles without exception.1-2
Hemodialysis, peritoneal dialysis and kidney transplantation
are miracles of medical technology, and the ability of these
technologies to sustain lives is of unquestioned
significance. Blake et al.3 and Lin et al.4 documented in two
different population that hemodialysis, which is time-
intensive, expensive, and requires fluid and dietary
restrictions, in long term often results in a loss of freedom,
dependence on caregivers, disruption of marital, family, and
social life, and reduced or loss of financial income.
Canadian Erythropoietin Study Group5 and Moreno et
al.6 showed patients having dialysis have lower QOL score
in comparison to normal person of same age and sex.
Evans, Manninen and Garrison7 and Simmons8 compared
hemodialysis against continuous peritoneal dialysis, which
showed better result among continuous peritoneal dialysis
group. A multicentre study in Italy showed more
independence and positive attitude among continuous
peritoneal dialysis patients but more anxiety and feeling
(Bang. Renal J. 2021; 3(1): 3-11 )
of insecurity in the same group.9Impaired functioning and
well-being in dialysis patients is linked to increased risk of
death and hospitalization while improvement in scores
has been associated with better outcomes.10
In Bangladesh, due to financial strain and inadequate
health facility, almost all government hospitals and semi
government organization that provide hemodialysis at low
cost and contribute to major share of health care delivered
to Chronic kidney disease patients allocate only 8 hours
dialysis per week for each patient rather than recommended
at least 12 hours dialysis per week. On the other hand, due
to poverty, illiteracy and lack of health consciousness in
majority people risk of infection is assumed to be very
high among Continuous Ambulatory Peritoneal Dialysis
patients and still it is not a widely prescribed method of
renal replacement therapy in Bangladesh. The scenario is
further complicated by lack of regular use of erythropoietin
and very high incidence of malnutrition among the patients
undergoing hemodialysis11which are independent
predictors of Quality of life.
This study is intended to assess KDQOL among patients
receiving hemodialysis for 8 hours and 12 hours per week,
patients receiving CAPD, and patients of CKD stage V
who decline any form of renal replacement therapy and
remained on conservative treatment.For the purpose of
measurement KDQOL SF-36 survey which was used in
DOPPS study and proved to be validated in terms of
reproducibility and internal consistency, translated in
Bengali version, obtained from KDQOL Working group
website has been adopted.
Material and Methods
The patients who received dialysis at Department of
Nephrology,Dhaka Medical College Hospital, Dialysis
Unit, BIRDEM, and the patients who received consultation
at Outdoor Department of Nephrology, Dhaka Medical
College Hospital during the period of November, 2010 to
October, 2011 were enrolled in the study. This longitudinal
study was conducted by purposive sampling. All the
patients diagnosed as chronic kidney disease stage V
fulfilling the criteria to commence renal replacement therapy
were included. The patients who received dialysis for less
than 3 months, those who were compelled to choose one
certain form of renal replacement therapy or those who
were admitted due to acute illness were not included in
the study. The patients who were not able to answer the
questionnaire due to cognitive impairment were also not
included. 134 patients were enrolled in this study, out of
which 42 patients who were advised to commence renal
replacement therapy and after counseling opted to remain
in conservative treatment were enrolled in GROUP I, 39
patients who received hemodialysis 8 hours per week were
enrolled in GROUP II, 30 patients who received
hemodialysis 12 hours per week in one or more centers
were enrolled in GROUP III and 23 patients who received
Continuous Peritoneal Dialysis at least 3 exchanges per
day were enrolled in GROUP IV.
Data was collected using Kidney Disease Quality Of Life-
36 (KDQOL-36) survey. KDQOL-36 is 36 items health
related quality of life survey which has a generic
component consisting of 12 assessments adopted from
SF12 for aspects of general health and another specific
component for kidney disease consisting of 24
assessments. KDQOL-36 has five subscales: Physical
component summary (PCS), Mental component score
(MCS), Burden of kidney disease, Symptoms /Problem
subscale and Effects of Kidney disease. However, while
conducting the study it was noticed that some of the
questions were not self-explanatory in our context which
required assistance of the researcher. To overcome this
short coming a number of questions have been elaborated
with appropriate examples. A detailed history and
examination according to designed preform was conducted
which included demographic data like age, sex,
employment, income level and monthly expenditure.
KDQOL-36 survey was administered in Bengali language
during first 2 hours of hemodialysis and during first 2
hours of first exchange of the day among patients having
CAPD and during outdoor visit among the patients of
CKD stage V receiving conservative treatment, preferably
by patient himself and if not possible in form of interview
after obtaining written consent. The process was repeated
for three times at approximately 30 days interval keeping
all parameters uninterrupted. Biochemical variables are to
be investigated include Hemoglobin level, Serum albumin.
Statistical analyses of the results were obtained by using
SPSS-16. For statistical analysis continuous variable was
analyzed by unpaired t-test, ANOVA and categorical data
was analyzed by c2 test (Chi-square test) and Pearson’s
correlation coefficient was used. A ‘p’ value of <0.05 was
considered significant.
Result
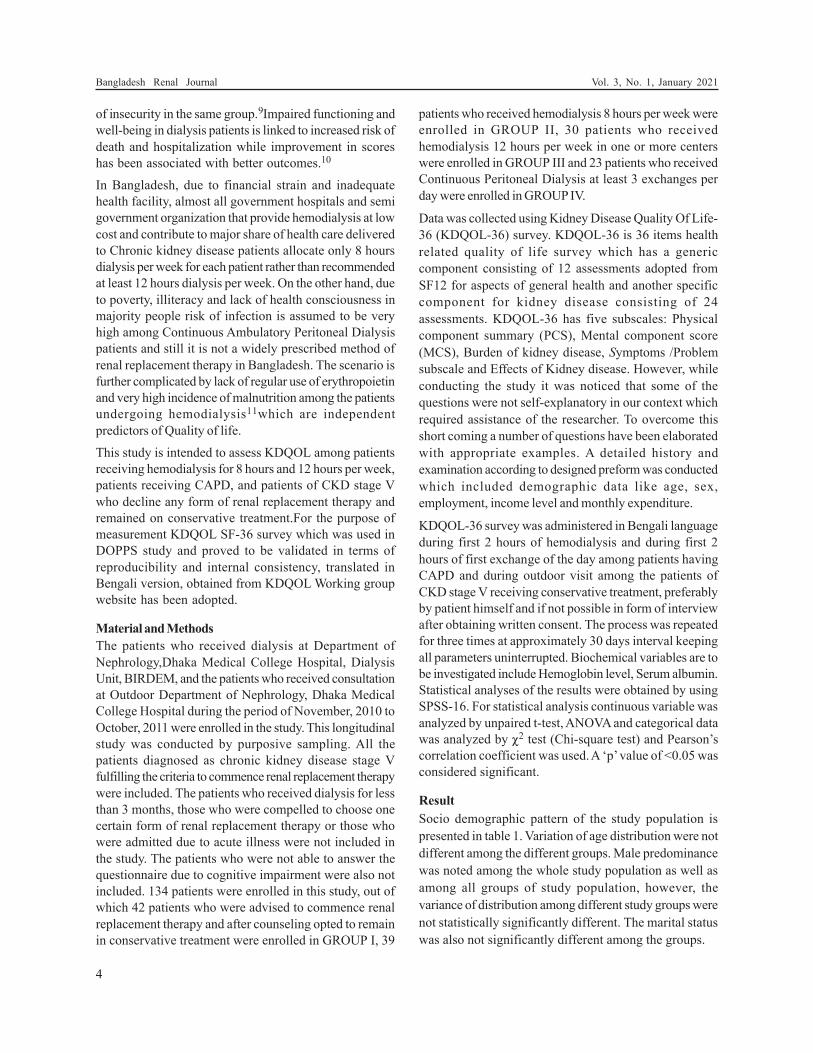
Socio demographic pattern of the study population is
presented in table 1. Variation of age distribution were not
different among the different groups. Male predominance
was noted among the whole study population as well as
among all groups of study population, however, the
variance of distribution among different study groups were
not statistically significantly different. The marital status
was also not significantly different among the groups.
4
Bangladesh Renal Journal Vol. 3, No. 1, January 2021
The distribution of physical component summary of
quality of life (table 2) were analyzed in three consecutive
follow ups 1 month apart and it was found that in all the
follow ups the patients belonging to 8 hours dialysis per
week (Group 2) and the patients on conservative treatment
(Group 1) did not show significant difference. On the
contrary 12 hours dialysis per week Group 3) and the
patients on CAPD (Group 4) were significantly better than
Group 1 and Group 2. Moreover, the patients on CAPD
were better than 12 hours dialysis per week in all the follow
ups.
Table 3 showed the mental component summary among
the study groups and it was found that group 1 and group
2 did not show any significant difference. Whereas in
comparison between 8 hours dialysis/week and 12 hours
dialysis/week, though mental component summary was
better among the patients with 12 hours dialysis/week in
all the follow ups but it was statistically significant in 1st
and 3rd follow up but not in 2nd follow up.CAPD patients
(group 4) showed better performance in terms of mental
component summary significantly in comparison to 8 hours
dialysis/week in all follow ups. However, the results were
not significantly different between CAPD patients and
the patients with 12 hours/ week dialysis though CAPD
patients enjoyed better mental component.
The distribution of the treatment modalities to reduce the
burden of kidney disease is shown in table 4. The patients
on conservative treatment only and 8 hours dialysis/week
suffered almost same burden and the results were not
significantly different in any follow up. 12 hours dialysis/
week reduced the burden more efficiently in comparison
to 8 hours dialysis/week, thought the results were not
significantly different in 1st follow up between these two
groups, but they were significantly different in consecutive
follow ups. Group 4 (CAPD patients) were better in terms
of reducing the burden of kidney disease in all the follow
ups in comparison to 8 hours dialysis/ week, but there
was no statistical difference among the patients with 12
hours dialysis/ week and CAPD patients, although the
latter group showed better performance.
Table I
Socio-demographic characteristics of the study patients (n=134).
Socio-demographic Group I Group II Group III Group IV P
characteristics (n=42) (n=39) (n=30) (n=23) value
Age (in year) n % n % n % n %
<20 1 2.4 0 0.0 0 0.0 0 0.0
21-30 7 16.7 7 17.9 3 10.0 0 0.0
31-40 7 16.7 4 10.3 6 20.0 0 0.0
41-50 8 19.0 15 38.5 9 30.0 8 34.8
51-60 11 26.2 10 25.6 5 16.7 14 60.9
61-70 5 11.9 2 5.1 6 20.0 0 0.0
71-80 2 4.8 1 2.6 1 3.3 1 4.3
>80 1 2.4 0 0.0 0 0.0 0 0.0
Mean ± SD 48.14 ±16 46.28 ±12.11 48.07 ±12.43 53.57 ±7.16 0.130ns
Range (min-max) (18 -82) (23 -75) (25 -71) (43 -75)
Sex
Male 27 64.3 30 76.9 20 66.7 14 60.9 0.521ns
Female 15 35.7 9 23.1 10 33.3 9 39.1
Marital status
Married 37 88.1 34 87.2 29 96.7 23 100.0 0.182ns
Unmarried 5 11.9 5 12.8 1 3.3 0 0.0
s= significant; ns=not significant
P value reached from ANOVA test.
P value reached from Chi square test
5
Quality of Life among the CKD Patients on Different Modalities of Treatment Mesbah Uddin Noman et al
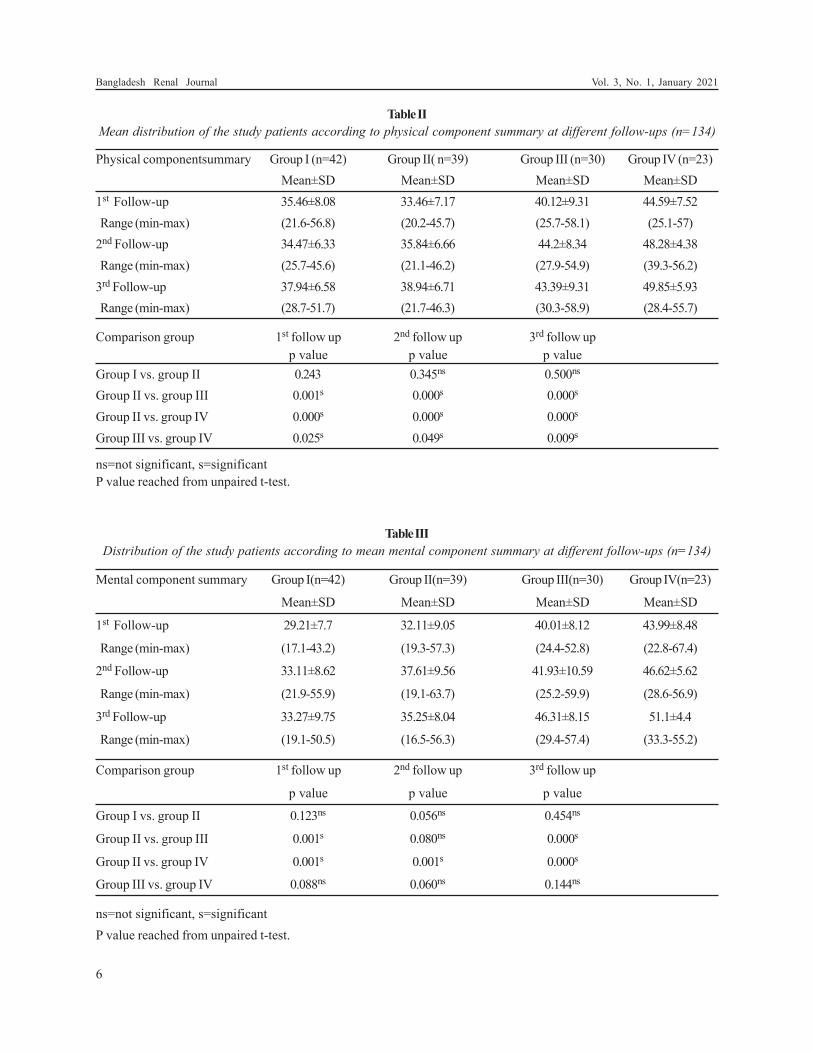
Table II
Mean distribution of the study patients according to physical component summary at different follow-ups (n=134)
Physical componentsummary Group I (n=42) Group II( n=39) Group III (n=30) Group IV (n=23)
Mean±SD Mean±SD Mean±SD Mean±SD
1st Follow-up 35.46±8.08 33.46±7.17 40.12±9.31 44.59±7.52
Range (min-max) (21.6-56.8) (20.2-45.7) (25.7-58.1) (25.1-57)
2nd Follow-up 34.47±6.33 35.84±6.66 44.2±8.34 48.28±4.38
Range (min-max) (25.7-45.6) (21.1-46.2) (27.9-54.9) (39.3-56.2)
3rd Follow-up 37.94±6.58 38.94±6.71 43.39±9.31 49.85±5.93
Range (min-max) (28.7-51.7) (21.7-46.3) (30.3-58.9) (28.4-55.7)
Comparison group 1st follow up 2nd follow up 3rd follow up
p value p value p value
Group I vs. group II 0.243 0.345ns 0.500ns
Group II vs. group III 0.001s 0.000s 0.000s
Group II vs. group IV 0.000s 0.000s 0.000s
Group III vs. group IV 0.025s 0.049s 0.009s
ns=not significant, s=significant
P value reached from unpaired t-test.
Table III
Distribution of the study patients according to mean mental component summary at different follow-ups (n=134)
Mental component summary Group I(n=42) Group II(n=39) Group III(n=30) Group IV(n=23)
Mean±SD Mean±SD Mean±SD Mean±SD
1st Follow-up 29.21±7.7 32.11±9.05 40.01±8.12 43.99±8.48
Range (min-max) (17.1-43.2) (19.3-57.3) (24.4-52.8) (22.8-67.4)
2nd Follow-up 33.11±8.62 37.61±9.56 41.93±10.59 46.62±5.62
Range (min-max) (21.9-55.9) (19.1-63.7) (25.2-59.9) (28.6-56.9)
3rd Follow-up 33.27±9.75 35.25±8.04 46.31±8.15 51.1±4.4
Range (min-max) (19.1-50.5) (16.5-56.3) (29.4-57.4) (33.3-55.2)
Comparison group 1st follow up 2nd follow up 3rd follow up
p value p value p value
Group I vs. group II 0.123ns 0.056ns 0.454ns
Group II vs. group III 0.001s 0.080ns 0.000s
Group II vs. group IV 0.001s 0.001s 0.000s
Group III vs. group IV 0.088ns 0.060ns 0.144ns
ns=not significant, s=significant
P value reached from unpaired t-test.
6
Bangladesh Renal Journal Vol. 3, No. 1, January 2021
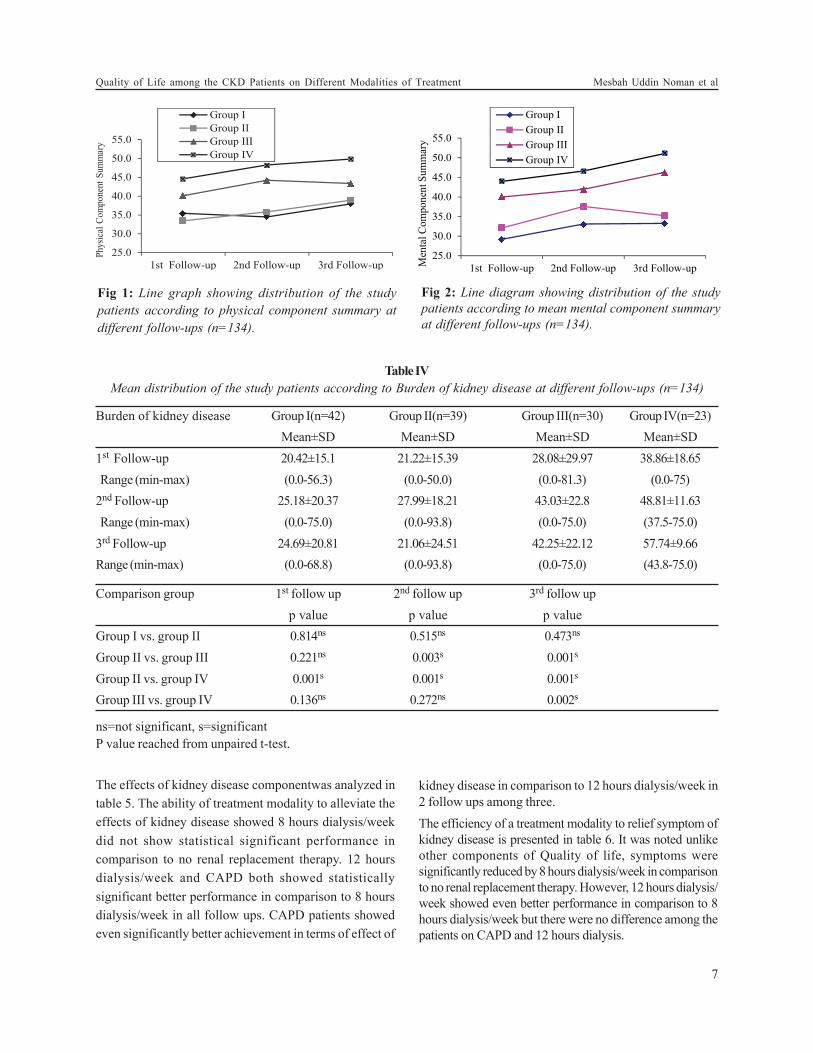
Fig 1: Line graph showing distribution of the study
patients according to physical component summary at
different follow-ups (n=134).
Fig 2: Line diagram showing distribution of the study
patients according to mean mental component summary
at different follow-ups (n=134).
Table IV
Mean distribution of the study patients according to Burden of kidney disease at different follow-ups (n=134)
Burden of kidney disease Group I(n=42) Group II(n=39) Group III(n=30) Group IV(n=23)
Mean±SD Mean±SD Mean±SD Mean±SD
1st Follow-up 20.42±15.1 21.22±15.39 28.08±29.97 38.86±18.65
Range (min-max) (0.0-56.3) (0.0-50.0) (0.0-81.3) (0.0-75)
2nd Follow-up 25.18±20.37 27.99±18.21 43.03±22.8 48.81±11.63
Range (min-max) (0.0-75.0) (0.0-93.8) (0.0-75.0) (37.5-75.0)
3rd Follow-up 24.69±20.81 21.06±24.51 42.25±22.12 57.74±9.66
Range (min-max) (0.0-68.8) (0.0-93.8) (0.0-75.0) (43.8-75.0)
Comparison group 1st follow up 2nd follow up 3rd follow up
p value p value p value
Group I vs. group II 0.814ns 0.515ns 0.473ns
Group II vs. group III 0.221ns 0.003s 0.001s
Group II vs. group IV 0.001s 0.001s 0.001s
Group III vs. group IV 0.136ns 0.272ns 0.002s
ns=not significant, s=significant
P value reached from unpaired t-test.
The effects of kidney disease componentwas analyzed in
table 5. The ability of treatment modality to alleviate the
effects of kidney disease showed 8 hours dialysis/week
did not show statistical significant performance in
comparison to no renal replacement therapy. 12 hours
dialysis/week and CAPD both showed statistically
significant better performance in comparison to 8 hours
dialysis/week in all follow ups. CAPD patients showed
even significantly better achievement in terms of effect of
kidney disease in comparison to 12 hours dialysis/week in
2 follow ups among three.
The efficiency of a treatment modality to relief symptom of
kidney disease is presented in table 6. It was noted unlike
other components of Quality of life, symptoms were
significantly reduced by 8 hours dialysis/week in comparison
to no renal replacement therapy. However, 12 hours dialysis/
week showed even better performance in comparison to 8
hours dialysis/week but there were no difference among the
patients on CAPD and 12 hours dialysis.
7
Quality of Life among the CKD Patients on Different Modalities of Treatment Mesbah Uddin Noman et al
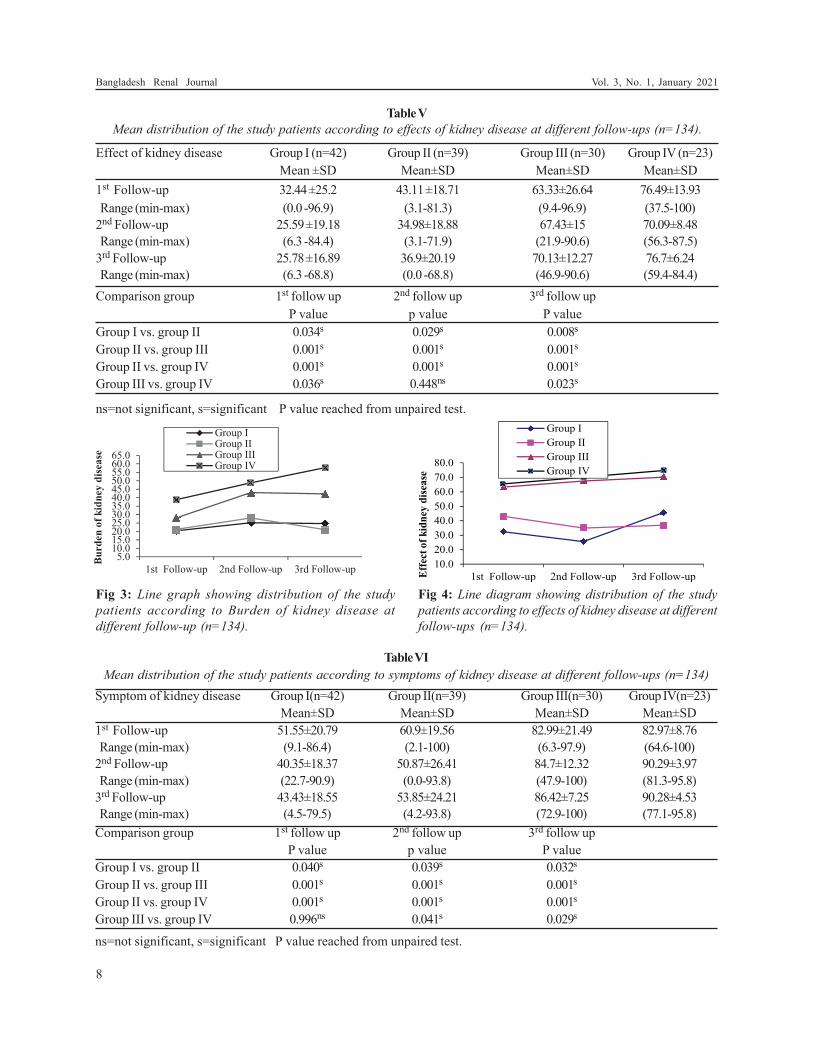
Table V
Mean distribution of the study patients according to effects of kidney disease at different follow-ups (n=134).
Effect of kidney disease Group I (n=42) Group II (n=39) Group III (n=30) Group IV (n=23)
Mean ±SD Mean±SD Mean±SD Mean±SD
1st Follow-up 32.44 ±25.2 43.11 ±18.71 63.33±26.64 76.49±13.93
Range (min-max) (0.0 -96.9) (3.1-81.3) (9.4-96.9) (37.5-100)
2nd Follow-up 25.59 ±19.18 34.98±18.88 67.43±15 70.09±8.48
Range (min-max) (6.3 -84.4) (3.1-71.9) (21.9-90.6) (56.3-87.5)
3rd Follow-up 25.78 ±16.89 36.9±20.19 70.13±12.27 76.7±6.24
Range (min-max) (6.3 -68.8) (0.0 -68.8) (46.9-90.6) (59.4-84.4)
Comparison group 1st follow up 2nd follow up 3rd follow up
P value p value P value
Group I vs. group II 0.034s 0.029s 0.008s
Group II vs. group III 0.001s 0.001s 0.001s
Group II vs. group IV 0.001s 0.001s 0.001s
Group III vs. group IV 0.036s 0.448ns 0.023s
ns=not significant, s=significant P value reached from unpaired test.
Fig 3: Line graph showing distribution of the study
patients according to Burden of kidney disease at
different follow-up (n=134).
Fig 4: Line diagram showing distribution of the study
patients according to effects of kidney disease at different
follow-ups (n=134).
Table VI
Mean distribution of the study patients according to symptoms of kidney disease at different follow-ups (n=134)
Symptom of kidney disease Group I(n=42) Group II(n=39) Group III(n=30) Group IV(n=23)
Mean±SD Mean±SD Mean±SD Mean±SD
1st Follow-up 51.55±20.79 60.9±19.56 82.99±21.49 82.97±8.76
Range (min-max) (9.1-86.4) (2.1-100) (6.3-97.9) (64.6-100)
2nd Follow-up 40.35±18.37 50.87±26.41 84.7±12.32 90.29±3.97
Range (min-max) (22.7-90.9) (0.0-93.8) (47.9-100) (81.3-95.8)
3rd Follow-up 43.43±18.55 53.85±24.21 86.42±7.25 90.28±4.53
Range (min-max) (4.5-79.5) (4.2-93.8) (72.9-100) (77.1-95.8)
Comparison group 1st follow up 2nd follow up 3rd follow up
P value p value P value
Group I vs. group II 0.040s 0.039s 0.032s
Group II vs. group III 0.001s 0.001s 0.001s
Group II vs. group IV 0.001s 0.001s 0.001s
Group III vs. group IV 0.996ns 0.041s 0.029s
ns=not significant, s=significant P value reached from unpaired test.
8
Bangladesh Renal Journal Vol. 3, No. 1, January 2021
Discussion:
This longitudinal study was carried out in the department
of Nephrology, Dhaka Medical College Hospital, Dialysis
Unit, BIRDEM, and the patients who received consultation
at Outdoor Department of Nephrology, Dhaka Medical
College Hospital during the period of November, 2010 to
October, 2011 were enrolled in the study.
In this present study it was observed that the mean ± SD
age was 48.14± 16 years in group I, 46.28±12.11 years in
group II, 48.07±12.43 years in group III and 53.57±7.16
years in group IV, which were almost similar in all modalities
of treatment and majority of the patients were in 5th and 6th
decade but under 5th decade patients were not observed
in group IV patients. In a study, Jaar et al.12 showed the
mean age of patients on hemodialysis (HD) was 53.7±14.8
years and in Peritoneal dialysis (PD) was 59.3±14.8 years
(P<0.001). Thaweethamcharoen et al.13 worked on Quality
of Life of hemodialysis patients and found the mean age
was 57.32 ± 14.52 years. Bloembergen et al.14 have shown
the mean age of Hemodialysis group was 60.8±16.5 years
and 56.1±7.3 years in peritoneal dialysis group. Albert et
al.15 showed the mean age of HD group was 59 years and
PD group 54 years at base line (p<0.001). Similarly, Han et
al.16 and Finkelstein et al.17found higher mean age in their
study patients. This discrepancy may be due to, the
etiological difference of CKD in our country in comparison
to Western World; In Bangladesh a good proportion of
CKD results from glomerulonephritis, though in this study
DM was found to be the major cause of CKD in patients
getting renal replacement therapy, a good number of
patient suffered from glomerulonephritis in all groups
except group IV.
In this present series it was observed that male female
ratio was 2.1:1 in the whole study, which indicates that
chronic kidney disease stage V was more common in male
subjects. However, 64.3% in group I, 76.9% in group II,
66.7% in group III and 60.9% in group IV patients were
male. Sex difference was not statistically significant
(p>0.05) among the groups, which closely resemble with
Jaar et al.12 study, where the authors showed male 55.5%
and 53.7% in HD and PD group respectively. Similarly,
male predominant showed by Albert et al.15 and Finkelstein
et al.17 are consistent with the current study.
The above results revealed that physical component score
increased significantly in Group III and Group IV at
consecutive follow ups; however it was higher in Group
IV. In a study, Zhang et al.18 compare Physical component
between Quality of life between patients on Hemodialysis
and Peritoneal dialysis and observed 45.07 ± 30.86 and
49.88 ± 30.63 respectively, which support the current study.
Gabbay et al.19 studied temporal trends in Health-Related
Quality of Life among Hemodialysis Patients and found
Physical component improved “0.2 points/year from a
baseline of 43.0. In this current study it was observed that
patients in group II, the mean±SD physical component
was 33.46±7.17 at first follow-up, 35.84±6.66 second follow-
up and 38.94±6.71 third follow-up, which are significantly
(p<0.05) lower than group III and group IV. Sathvik et al.20
conducted a study on the patients getting hemodialysis
for 8 hours per week which is equivalent to group II of
present study found the physical component was 38.81 +
18.36, which support the present study. On the other hand,
the mean±SDphysical component was
35.46±8.08,34.47±6.33 and 37.94±6.58 in group I patients,
at 1st, 2nd and 3rdfollow-up respectively.
The mean±SD mental component score was 40.01±8.12 in
group III and 43.99±8.48 in group IV during 1st follow-up,
at second follow-up mean±SD mental component score
were 41.93±10.59 and 46.62±5.62 in group III and group IV
respectively and at third follow-up the mean±SD mental
component was 46.31±8.15 in group III and 51.1±4.4 in
group IV, thus were higher in group IV at all follow-ups,
but two groups did not differ significantly. Albert et al.15
showed the mean mental component were 46.8 and 47.3 in
HD and PD patients respectively. Gabbay et al.19 studied
temporal trends in Health-Related Quality of Life among
Hemodialysis Patients and found mental component
superior +0.15 points/year from a baseline of 61.2. Lacson
et al.21 compared mental component summary (MCS)
among hospitalized patients and non-hospitalized MCS
score were 46.1 ± 10.8 and 47.8 ± 10.4 respectively (p<0.05).
In group II the mean±SD mental component was 32.11±9.05
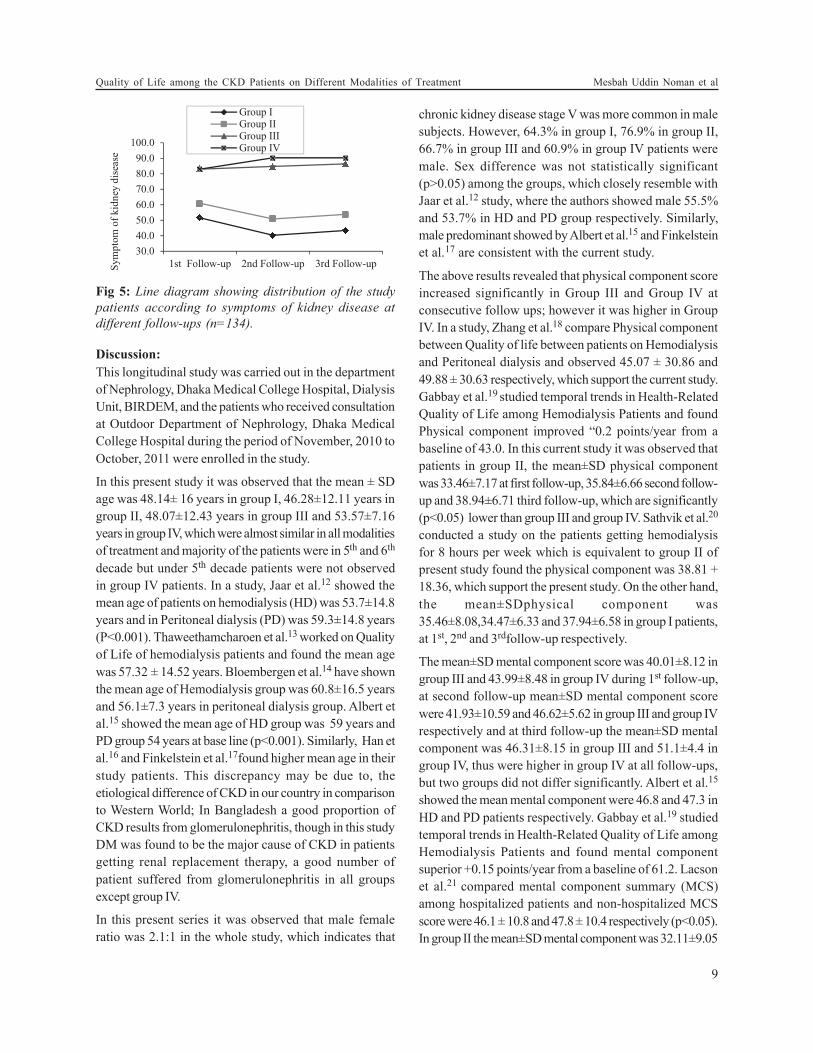
Fig 5: Line diagram showing distribution of the study
patients according to symptoms of kidney disease at
different follow-ups (n=134).
9
Quality of Life among the CKD Patients on Different Modalities of Treatment Mesbah Uddin Noman et al
at first follow-up, 37.61±9.56 in 2nd follow-up and 35.25±8.04
in 3rd follow-up. In a study, Sathvik et al.20 showed the
mean mental component was 40.92 + 18.66), which is
comparable with the current study. In group I, the mean±SD
mental component was 29.21±7.7 at first follow-up,
33.11±8.62 at second follow-up and 33.27±9.75 at 3rdfollow-
up.
The efficacy of a treatment modality to decrease the burden
of kidney disease was noted significantly better in Group
IV (mean±SD score 38.86±18.65 at 1st follow-up,
48.81±11.63 at 2nd follow-up and 57.74±9.66 at 3rd follow-
up) followed by Group III (28.08±29.97 at 1st follow-up,
43.03±22.8 at 2nd follow-up and 42.25±22.12 at 3rd follow-
up), but it was poor in Group I and worse in Group II in
which it declined at consecutive follow ups and at the end
it was 24.69±20.81 in group I and 21.06±24.51. in group II,
which was not significantly different. Fong, Bragman and
Chan22 found that in peritoneal dialysis patient the score
of burden of kidney disease was 47± 3.8 which was
comparable to group IV of the present study
population.Fukuhara et al.23 conducted assessment of the
same domain of quality of life among the patients on
hemodialysis for 12 hours per week which is similar to
group III of the current study.Gorodetskaya et al.24 showed
the mean±SDBurden of Kidney Disease was 38.6±23.8 in
Dialysis patients. Fukuhara et al.23 documented
international differences in HRQOL among dialysis
patients and found the mean±SDBurden of Kidney
Disease were 35.4 in Europe, 28.6 in Japan and 40.8 in
America. The above findings support the current study.
These findings support the current study. However, this
domain of quality of life was not widely studied in
population comparable to other groups of current study.
The performance of a treatment modality in alleviating
effect of kidney disease upon a patient’s life were increased
significantly in group IV (76.49±13.93 at 1st follow-up,
70.09±8.48 at 2nd follow-up and 76.7±6.24 at 3rd follow-up)
and group III (63.33±26.64 at 1st follow-up, 67.43±15 at 2nd
follow-up and 70.13±12.27 at 3rd follow-up) at all follow-up
and remained higher in comparison to other two groups.
In the study conducted in Toronto39 found that in
peritoneal dialysis patient the score of effect of kidney
disease was 60.7± 2.7 which was comparable to group IV
of the present study population, on the other hand
Fukuhara et al.23 undertake a study to find out the
international differences in HRQOL among hemodialysis
patients who were comparable to group III of this current
study and have shown the mean±SD effect of kidney
nd follow-up
and 36.9±20.19 at third follow-up and in group I, the
mean±SD effect of kidney disease score was 32.44±25.2 in
first follow-up, 25.59±19.18 at second follow-up and
25.78±16.89 at third follow-up. But these two study
population under group I and II, were not studied regarding
this domain of quality of life hence comparison with the
current study was not possible.
The efficacy of reducing symptoms of kidney disease
was significantly higher in group IV (82.97±8.76 at 1st
follow-up, 90.29±3.97 at 2nd follow-up and 90.28±4.53 at
3rd follow-up), group III (82.99±21.49 at 1st follow-up,
84.7±12.32 at 2nd follow-up and 86.42±7.25 at 3rd follow-
up) and inclined in consecutive follow ups. Fong, Bragman
and Chan22 found that in peritoneal dialysis patient the
score of symptoms of kidney disease was 71.9± 2.6 which
was comparable to group IV of the present study
population. Fukuhara et al.23 showed the international
differences on symptom of kidney disease score in HRQOL
among hemodialysis patients and observed that mean±SD
symptom of kidney disease score was 69.9 in Europe, 75.8
Japan and 71.1 in America, which is consistent with the
current study. In group II, the mean±SD symptom of kidney
disease score was 60.9±19.56 at first follow-up, 50.87±26.41
at 2nd follow-up and 53.85±24.21 at third follow-up and in
group I, the mean±SD symptom of kidney disease score
was 51.55±20.79 in first follow-up, 40.35±18.37 at second
follow-up and 43.43±18.55 at third follow-up. No study
population comparable to these two groups were found in
which this domain of QOL was evaluated.
Conclusion:
All the domains of quality of life scored by KDQOL 36
were highest among continuous ambulatory peritoneal
dialysis patients, followed by patients receiving
hemodialysis for 12 hours per week, patients receiving 8
10
Bangladesh Renal Journal Vol. 3, No. 1, January 2021
disease score was 57.3 in Europe, 67.7 in Japan and 62.5 in
America. It is evident that in both hemodialysis for 12
hours per week and peritoneal dialysis group this score is
found to be higher in current study in comparison to other
studies conducted abroad, though all other studies were
cross sectional study in contrast to longitudinal study
design of present study the exact cause of these findings
are not clear; however effect of kidney disease score
depends on anticipation of adverse effects of a certain
disease and ultimate perception of its effect on an
individual, so a more positive perception of our population
may be responsible for these optimistic findings. In group
II, the mean±SD effect of kidney disease score was
43.11±18.71 at first follow-up, 34.98±18.88 at 2
hours per week hemodialysis and those on conservative
treatment had worse quality of life score in comparison to
other two groups and more importantly 8 hours per week
hemodialysis failed to show any improvement in QOL in
comparison to conservative treatment at most domains of
quality of life.
References:
1. Kouidi E. Health-related quality of life in end-stage renal
disease patients: The effects of renal rehabilitation. Clin
Nephrol 2004; 61: 60– 71.
2. Mapes DL, Young EW, Wolfe RA, Held PJ and Port FK.
Worldwide Dialysis Outcomes and Practice Patterns Study
Committee: Health-related quality of life and associated
outcomes among hemodialysis patients of different
ethnicities in the United States: The Dialysis Outcomes and
Practice Patterns Study (DOPPS). Am J Kidney Dis 2003;41:
605– 615.
3. Blake C, Codd MB, Cassidy A and O2 Meara YM. Physical
function, employment and quality of life in end-stage renal
disease. J Nephrol 2000;13: 142-9.
4. Lin CC, Lee BO and Hicks FD. The phenomenology of
deciding about hemodialysis among taiwanese. West J Nurs
Res 2005; 27: 915-29.
5. Canadian Erythropoietin Study Group. Association between
recombinant human erythropoietin and quality of life and
exercise capacity of patients receiving hemodialysis.Br Med
J 1990; 300: 573–578.
6. Moreno F, Lopez Gomez JM, Sanz Guajardo D, Jofre R and
Valderrabano F. The Spanish Cooperative Renal Patients
Quality of Life Study Group: Quality of life in dialysis patients.
A Spanish multicentre study.Nephrol Dial Transplant 1996;
11 (Suppl 2): 125–129
7. Evans R, Manninen D and Garrison L. The quality of life of
patients with end-stage renal disease.New Engl J Med 1985;
312: 553–559.
8. Simmons J. End-stage renal disease therapy groups. Scand J
UrolNephrol 1990; 131: 7–22.
9. Maiorca R, Ruggieri G, Vaccaro CM and Pellini F.
Psychological and social problems of dialysis.Nephrol Dial
Transplant 1997; 13 (Suppl 7): 89–95
10. DeOreo PB. Hemodialysis patient-assessed functional health
status predicts continued survival, hospitalization, and
dialysis-attendance compliance. Am J Kidney Dis 1997;30:
204– 212.
11. Khan MH. Assessment of nutritional status in maintenance
haemodialysis patients.MD(Nephrology) Thesis, Dhaka
University 2010.
12. Jaar BG, Coresh J, Plantinga LC, Fink NE, Klag MJ, Levey
AS, Levin NW, Sadler JH, Kliger A and PoweNR.Comparing
the Risk for Death with Peritoneal Dialysis and Hemodialysis
in a National Cohort of Patients with Chronic Kidney Disease.
Ann Intern Med 2005; 143: 174-183.
13. Thaweethamcharoen T, Sakulbumrungsil R, Vasuvattakul S
and Nopmaneejumruslers C. Quality of Life and Hemoglobin
Levels of Hemodialysis Patient at Siriraj Hospital. Siriraj
Medical Journal 2011; 63(1): 12 – 16.
14. Bloembergen WE, Port FK, Mauge EA and Wolfe RA. A
Comparison of mnortality Between Patients Treated With
Hemodialysis and peritoneal Dialysis. J. Am. Soc. Nephrol
1995; 6: 177-183.
15. Albert WW, Nancy EF, Jane VR, Marsh-Manzi, Klemens
BM, Finkelstein FO, Chapman MM and Powe NR. Changes
in Quality of Life during Hemodialysis and Peritoneal Dialysis
Treatment: Generic and Disease Specific Measures. J Am
SocNephrol 2004;15: 743-753.
16. Han SS, KimKW, Young K, Chae DW, KimYS, KimS and
Chin HJ. Quality of life and mortality from a nephrologist’s
view: a prospective observational study.BMC Nephrology
2009; 10: 39.
17. Finkelstein FO, Story K, Firanek C, Mendelssohn D, Barre
P, Takano T, Soroka S and Mujais S. Health-Related Quality
of Life and Hemoglobin Levels in Chronic Kidney Disease
Patients. Clin J Am SocNephrol2009; 4(1): 33–38.
18. Zhang AH, Cheng LT, Zhu N, Sun LH and Wang T.
Comparison of quality of life and causes of hospitalization
between hemodialysis and peritoneal dialysis patients in
China. Health Qual Life Outcomes 2007; 5: 49.
19. GabbayE, Klemens B, MeyerJL, GriffithMM and
RichardsonDC. Temporal Trends in Health-Related Quality
of Life among Hemodialysis Patients in the United
States.CJASN 2010; 5(2): 261-267.
20. Sathvik BS, Parthasarathi G, Narahari MG and Gurudev KC.
An assessment of the quality of life in hemodialysis patients
using the WHOQOL-BREF questionnaire. Indian J Nephrol
2008; 18: 141-9.
21. Lacson E, Jianglin X, Shu-Fang L, Dean SG, Lazarus J and
Hakim R. A Comparison of SF-36 and SF-12 Composite
Scores and Subsequent Hospitalization and Mortality Risks
in Long-Term Dialysis Patients. CJASN 2010; 5: 252-260.
22. Fong E, Bargman JM and Chan CT. Cross-Sectional
Comparison of Quality of Life and Illness Intrusiveness in
Patients Who Are Treated with Nocturnal Home
Hemodialysis versus Peritoneal Dialysis. Clinical Journal of
American Society of Nephrology 2007; 2(6): 1195-1200.
23. Fukuhara S, Lopes AA, Bragg-Gresham JL, Kurokawa K,
Mapes DL, Akizawa T, Bommer J, Canaud BJ, Port FK and
Held PJ. Health-related quality of life among dialysis patients
on three continents: the Dialysis Outcomes and Practice
Patterns Study. Kidney Int. 2003; 64(5): 1903-10.
24. Gorodetskaya I, ZeniosS,MccullochCE,Bostrom A, Hsu
CY,Bindman AB, Go AS and Chertow GM. Health-related
quality of life and estimates of utility in chronic kidney
disease. Kidney International2005; 68(6): 2801-2808.
11
Quality of Life among the CKD Patients on Different Modalities of Treatment Mesbah Uddin Noman et al
Micro and Macrovascular Complications in Diabetic
Nephropathy in Different Stages of Chronic Kidney DiseaseMomtaz Hossain1, Md. Nizamuddine Chowdhury2, Md.Mahmud Hasan3, Ferdous Jahan4, Syed Mahbub
Morshed5, Abdullah Al Mamun6
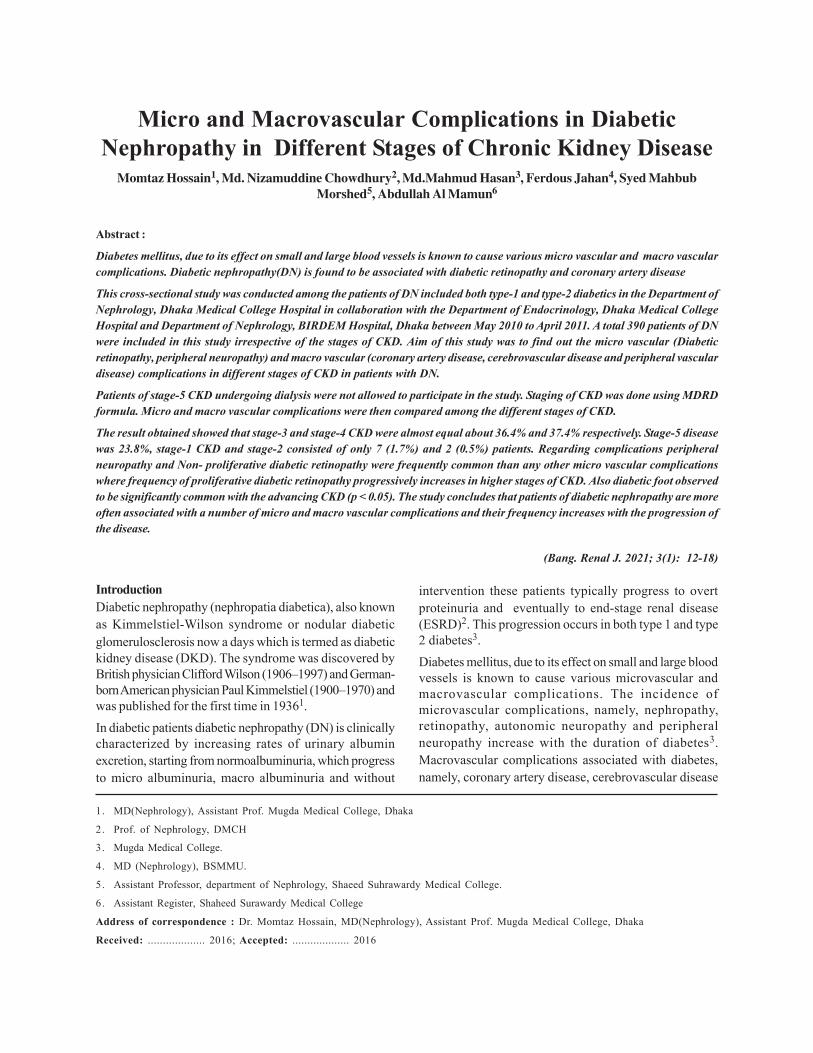
Abstract :
Diabetes mellitus, due to its effect on small and large blood vessels is known to cause various micro vascular and macro vascular
complications. Diabetic nephropathy(DN) is found to be associated with diabetic retinopathy and coronary artery disease
This cross-sectional study was conducted among the patients of DN included both type-1 and type-2 diabetics in the Department of
Nephrology, Dhaka Medical College Hospital in collaboration with the Department of Endocrinology, Dhaka Medical College
Hospital and Department of Nephrology, BIRDEM Hospital, Dhaka between May 2010 to April 2011. A total 390 patients of DN
were included in this study irrespective of the stages of CKD. Aim of this study was to find out the micro vascular (Diabetic
retinopathy, peripheral neuropathy) and macro vascular (coronary artery disease, cerebrovascular disease and peripheral vascular
disease) complications in different stages of CKD in patients with DN.
Patients of stage-5 CKD undergoing dialysis were not allowed to participate in the study. Staging of CKD was done using MDRD
formula. Micro and macro vascular complications were then compared among the different stages of CKD.
The result obtained showed that stage-3 and stage-4 CKD were almost equal about 36.4% and 37.4% respectively. Stage-5 disease
was 23.8%, stage-1 CKD and stage-2 consisted of only 7 (1.7%) and 2 (0.5%) patients. Regarding complications peripheral
neuropathy and Non- proliferative diabetic retinopathy were frequently common than any other micro vascular complications
where frequency of proliferative diabetic retinopathy progressively increases in higher stages of CKD. Also diabetic foot observed
to be significantly common with the advancing CKD (p < 0.05). The study concludes that patients of diabetic nephropathy are more
often associated with a number of micro and macro vascular complications and their frequency increases with the progression of
the disease.
1. MD(Nephrology), Assistant Prof. Mugda Medical College, Dhaka
2. Prof. of Nephrology, DMCH
3. Mugda Medical College.
4. MD (Nephrology), BSMMU.
5. Assistant Professor, department of Nephrology, Shaeed Suhrawardy Medical College.
6. Assistant Register, Shaheed Surawardy Medical College
Address of correspondence : Dr. Momtaz Hossain, MD(Nephrology), Assistant Prof. Mugda Medical College, Dhaka
Received: ................... 2016; Accepted: ................... 2016
Introduction
Diabetic nephropathy (nephropatia diabetica), also known
as Kimmelstiel-Wilson syndrome or nodular diabetic
glomerulosclerosis now a days which is termed as diabetic
kidney disease (DKD). The syndrome was discovered by
British physician Clifford Wilson (1906–1997) and German-
born American physician Paul Kimmelstiel (1900–1970) and
was published for the first time in 19361.
In diabetic patients diabetic nephropathy (DN) is clinically
characterized by increasing rates of urinary albumin
excretion, starting from normoalbuminuria, which progress
to micro albuminuria, macro albuminuria and without
2. This progression occurs in both type 1 and type
2 diabetes3.
Diabetes mellitus, due to its effect on small and large blood
vessels is known to cause various microvascular and
macrovascular complications. The incidence of
microvascular complications, namely, nephropathy,
retinopathy, autonomic neuropathy and peripheral
neuropathy increase with the duration of diabetes3.
Macrovascular complications associated with diabetes,
namely, coronary artery disease, cerebrovascular disease
(Bang. Renal J. 2021; 3(1): 12-18)
intervention these patients typically progress to overt
proteinuria and eventually to end-stage renal disease
(ESRD)
and peripheral vascular disease are mainly due to
accelerated atherosclerosis.
Diabetic nephropathy is the leading cause of end stage
renal disease (ESRD)4, diabetic patients with nephropathy
are at higher risk of fatal and non fatal cardiovascular and
other complications5. Not only stroke and myocardial
infarction but retinopathy and peripheral vascular disease
have correlation with DN6,7.
Diabetic nephropathy is the leading cause of chronic renal
failure in the United States today (ADA, 1999). It is also
one of the most significant long-term complications in
terms of morbidity and mortality for individual patients
with diabetes. Both type 1 and type 2 diabetes mellitus
(insulin-dependent diabetes mellitus [IDDM] and non –
insulin-dependent diabetes mellitus [NIDDM],
respectively) lead to ESRD. Approximately 40% of patients
with type-1 diabetes and 5-15% of patients with type- 2
diabetes eventually develop ESRD, although the incidence
is substantially higher in certain ethnic groups7.
This study was conducted to document association
between diabetic nephropathy and other microvascular
and macrovascular complications in diabetics presenting
in Bangladesh.Aims and Objectives
To find out the micro vascular (Diabetic retinopathy,
peripheral neuropathy) and macro vascular (coronary
artery disease, cerebrovascular disease and peripheral
vascular disease) complications in different stages of CKD
in patients with Diabetic nephropathy (DN).
Patients & Methods
This was a cross sectional study carried out in the
Department of Nephrology, Dhaka Medical College
hospital (DMCH) in collaboration with Department of
Endocrinology, DMCH and Department of Nephrology,
BIRDEM Hospital, Dhaka conducted in the period of May
2010 to April 2011. Patients of diabetic nephropathy of all
stages, except patients of stage V CKD who were already
on dialysis, were the study population. Sampling done by
Convenience sampling and sample size was 390.The study
done after taking permission from the Ethical Committee
of Dhaka Medical College (DMC), Dhaka, Bangladesh.
Patients who were included in this study are
• Patients with diabetic nephropathy irrespective of
stages of CKD except those in stage V who have
already underwent dialysis.
• Patients of DN of all ages and both sexes.
Patients who were excluded from this study are
• Patients of DN with CKD stage V who were already
on dialysis.
• Patients of DN with valvular heart disease and
collagen vascular diseases.
A structured questionnaire was developed containing all
the variables of interest like demographic and
anthropometric variables, risk factors, clinical
characteristics and micro and macro vascular complications
of diabetes and biochemical characteristics and data were
collected by interview of the patients, clinical examination
and laboratory investigations using the structured
questionnaire.
Variables studied are defined as
.Microalbuminuria defined by Presence of 30 - 299 mg
of albumin in a 24 hours urine sample or 30-300 mg albumin
per gm of creatinine.
Macroalbuminuria diagnosed by the presence of more
than 300 mg albumin in urine over 24 hours, or albumin
creatinine ratio (ACR) more than 300 mg/gm.
Nephropathy defined by presence of microalbuminuria or
macroalbuminuria with or without raised serum creatinine
(>130 micro mole/liter or 1.5mg/dl). K/DOQI criteria for the
definition of CKD used to estimate prevalence of chronic
kidney disease stages 1 to 5. GFR estimation was done by
MDRD formula
Non-proliferative diabetic retinopathy (NPDR) was
diagnosed by the presence of, micro aneurysms exudates
and blot hemorrhages on direct ophthalmoscopic
examination in full dilated eye.
Proliferative diabetic retinopathy (PDR) was diagnosed
by the presence of neovascularization in the retina.
Peripheral sensory neuropathy (PN) was assessed
clinically by history of persistent paresthesia in the
peripheral parts of the body or decreased pain by pinprick
testing, or decreased touch by fine cotton wisp or
decreased vibration sense by tuning fork of frequency
256Hz or absence of ankle reflexes.
Cerebrovascular disease (CVD) was assessed by history
of previous transient ischemic attack or stroke which was
also supported by focal neurological deficit like extensor
planter reflex, absence or exaggeration of knee jerk, ankle
jerk, bicep jerk, triceps jerk and or facial deviation.
Coronary artery diseases (CAD) were assessed by history
of angina, acute coronary syndrome (ACS) and myocardial
infarction (MI) and verified by previous hospital record,
or ECG changes of Q waves, ST segment change, T wave
13
Micro and Macrovascular Complications in Diabetic Nephropathy in Different Stages of CKD Momtaz Hossain et al
abnormality or poor progression of R waves in anterior
leads with Echocardiography showing evidence of wall
motion abnormalities, dilated left ventricle or ejection
fraction of < 40%.
Peripheral vascular disease (PVD) was ascertained
clinically by the absence of peripheral pulses.
Data processing and statistical analysis:
Data were processed using software SPSS (statistical
Package for Social Sciences) version 11.5. The test
statistics used to analyze the data were descriptive
statistics and Chi-square (c2) Test.. For all analytical tests,
the level of significance was set at 0.05 and p < 0.05 was
considered significant.
Results
This study intended to find out the microvascular and
macrovascular complications in patients of diabetic
nephropathy included a total 390 patients. The non
proliferative diabetic retinopathy, proliferative diabetic
retinopathy, peripheral neuropathy and diabetic foot were
the variables for studying microvascular complications,
while the variables for macrovascular complications were
coronary artery disease (CAD), angina, acute coronary
syndrome. Myocardial infarction, peripheral vascular
disease and cerebro vascular disease or stroke . The
findings obtained presented below.
Age distribution:
Table I shows the age distribution of the patients.
Table I
Age distribution of the participants
Age (years) Frequency Percentage
£40 18 4.6
41 – 50 109 28.0
51 – 60 147 37.7
> 60 116 29.7
Total 390 100.0
# Mean age = (55.9 ± 9.9 ) years; range = ( 24 – 92 ) years
Family history of DM:
Table II
Distribution of patients by family history of DM
Family history of DM Frequency Percentage
Yes 182 46.7
No 208 53.3
Total 390 100.0
Body Mass Index (BMI):
Table III
Distribution of patients by BMI
BMI (kg/m2) Frequency Percentage
<18.5 (under weight) 18 4.7
18.5 – 24.9 (normal) 263 67.4
³25 (over weight & obese) 109 27.9
Total® 390 100.0
# Mean BMI = (25.3 ± 1.8) kg/m2; range: (15.2 – 40.4) kg/
/m2Clinical characteristics at presentation:
Table IV
Distribution of patients by Clinical characteristics (n
= 390)
Clinical presentation Frequency Mean ± SD Range
(%)
Systolic BP (Supine) - 137 ± 21 85 - 210
Systolic BP (Standing) - 132 ± 19 80 - 200
Diastolic BP (Supine) - 82 ± 12 40 – 120
Diastolic BP (Standing) - 80 ± 11 30 - 100
Age of onset of DM - 45.5 ± 9.5 13 - 72
Duration of DM - 10.6 ± 6.9 1 - 17
Type of DM
Type-I 58(14.9) - -
Type-II 332(85.1)
Hypertension 275(70.5) - -
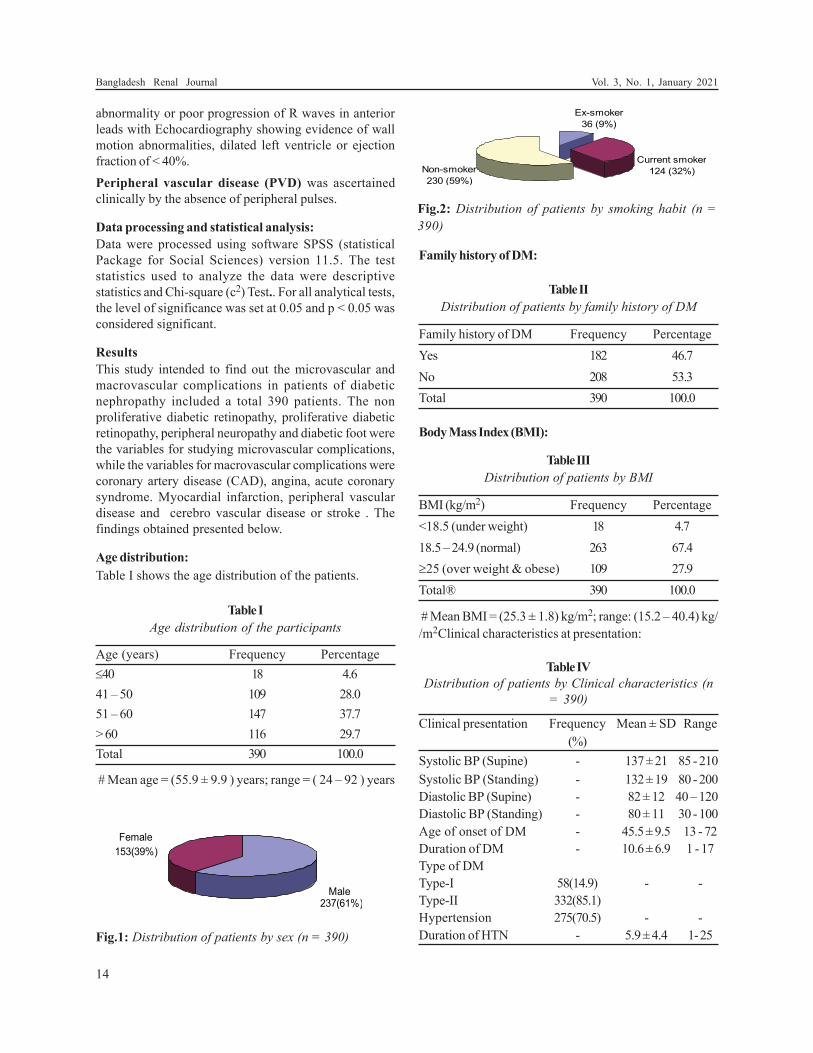
Duration of HTN - 5.9 ± 4.4 1- 25Fig.1: Distribution of patients by sex (n = 390)
Fig.2: Distribution of patients by smoking habit (n =
390)
14
Bangladesh Renal Journal Vol. 3, No. 1, January 2021
Diabetic complications:
Table V
Distribution of patients by diabetic complications (n =
390)
Complications Frequency Percentage
Micro vascular complications
Nonproliferative diabetic retinopathy 139 35.6
Proliferative diabetic retinopathy 72 18.5
Peripheral neuropathy 197 50.5
Diabetic foot 91 23.3
Macro vascular complications
CAD 121 31.0
MI 84 21.5
ACS 22 5.6
Angina 52 13.3
Stroke 48 12.3
Peripheral vascular disease 45 11.5
#Total will not correspond to 100% because of multiple
responses.
Biochemical investigations:
Table VI
Distribution of patients by biochemical investigations
(n = 390)
Biochemical investigations Frequency Mean ± SD
(%)
Urine for albumin (n = 390)
Nil/Trace 220 (56.5) -
++ 107 (27.4) -
+++ 50 (12.8) -
++++ 13 (3.3) -
Total urinary protein (gm/24 hrs) - 3.1 ± 0.2
Serum creatinine (mg/dl) - 3.9 ± 0.5
Serum cholesterol (mg/dl) 169.8 ± 2.6
LDL (mg/dl) 112.5 ± 3.0
HDL (mg/dl) 41.9 ± 1.4
TG (mg/dl) 190.5 ± 6.7
FBS (mmol/l) 8.5 ± 0.3
HBA1c (%) 7.4 ± 0.1
Distribution of patients in different stages of CKD:
Table VII shows the prevalence of different stages of
CKD by MDRD equations. Stage-3 and stage-4 CKD
were found to be predominant (36.4% and 37.6%
respectively). Nearly one-quarter (23.8%) of the patients
were screened as having stage-5 disease (end stage renal
disease).
Table VII
CKD staging by MDRD equations (n = 390)
CKD staging Frequency Percentage
Stage 1 07 1.7
Stage 2 02 0.5
Stage 3 142 36.4
Stage 4 146 37.6
Stage 5 93 23.8
Total 390 100.0
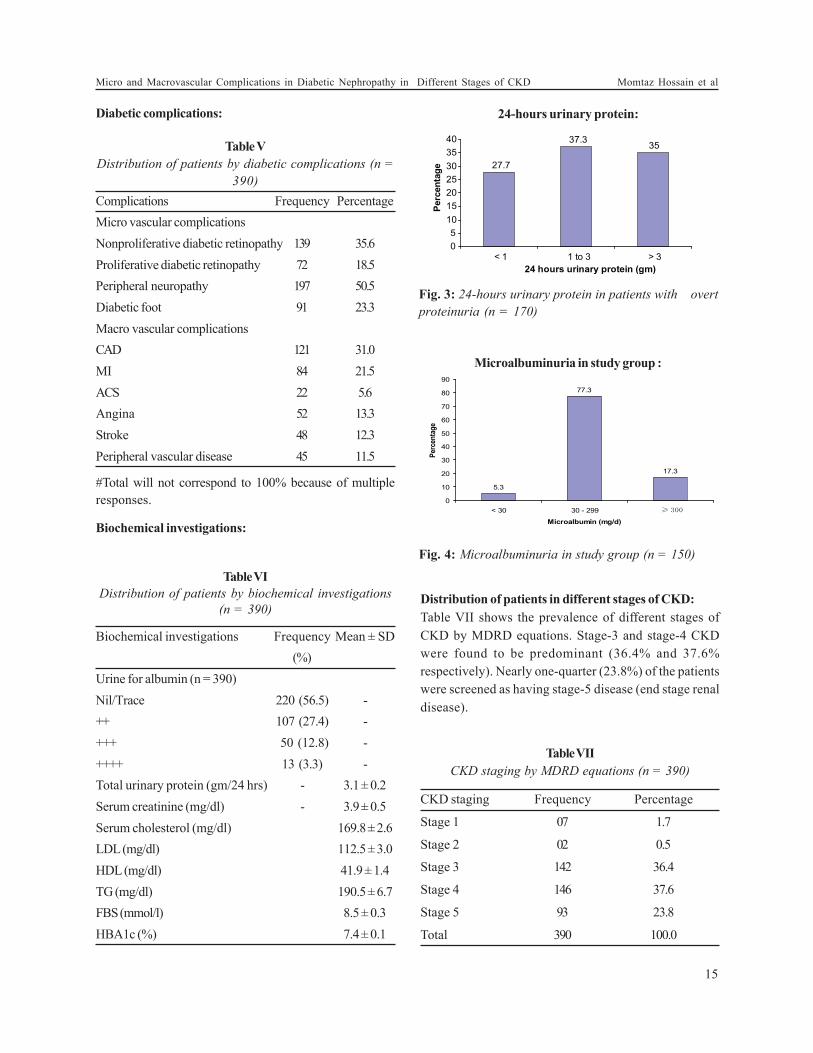
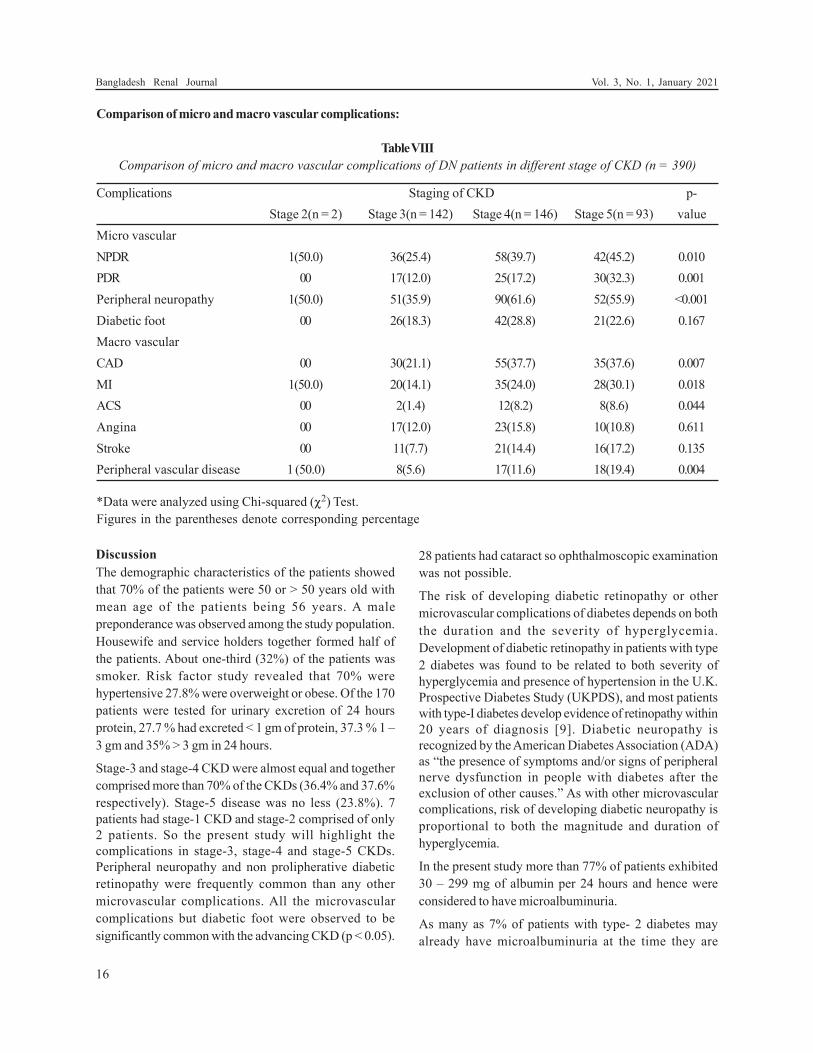
Fig. 3: 24-hours urinary protein in patients with overt
proteinuria (n = 170)
Fig. 4: Microalbuminuria in study group (n = 150)
Microalbuminuria in study group :
24-hours urinary protein:
15
Micro and Macrovascular Complications in Diabetic Nephropathy in Different Stages of CKD Momtaz Hossain et al
Discussion
The demographic characteristics of the patients showed
that 70% of the patients were 50 or > 50 years old with
mean age of the patients being 56 years. A male
preponderance was observed among the study population.
Housewife and service holders together formed half of
the patients. About one-third (32%) of the patients was
smoker. Risk factor study revealed that 70% were
hypertensive 27.8% were overweight or obese. Of the 170
patients were tested for urinary excretion of 24 hours
protein, 27.7 % had excreted < 1 gm of protein, 37.3 % 1 –
3 gm and 35% > 3 gm in 24 hours.
Stage-3 and stage-4 CKD were almost equal and together
comprised more than 70% of the CKDs (36.4% and 37.6%
respectively). Stage-5 disease was no less (23.8%). 7
patients had stage-1 CKD and stage-2 comprised of only
2 patients. So the present study will highlight the
complications in stage-3, stage-4 and stage-5 CKDs.
Peripheral neuropathy and non prolipherative diabetic
retinopathy were frequently common than any other
microvascular complications. All the microvascular
complications but diabetic foot were observed to be
significantly common with the advancing CKD (p < 0.05).
28 patients had cataract so ophthalmoscopic examination
was not possible.
The risk of developing diabetic retinopathy or other
microvascular complications of diabetes depends on both
the duration and the severity of hyperglycemia.
Development of diabetic retinopathy in patients with type
2 diabetes was found to be related to both severity of
hyperglycemia and presence of hypertension in the U.K.
Prospective Diabetes Study (UKPDS), and most patients
with type-I diabetes develop evidence of retinopathy within
20 years of diagnosis [9]. Diabetic neuropathy is
recognized by the American Diabetes Association (ADA)
as “the presence of symptoms and/or signs of peripheral
nerve dysfunction in people with diabetes after the
exclusion of other causes.” As with other microvascular
complications, risk of developing diabetic neuropathy is
proportional to both the magnitude and duration of
hyperglycemia.
In the present study more than 77% of patients exhibited
30 – 299 mg of albumin per 24 hours and hence were
considered to have microalbuminuria.
As many as 7% of patients with type- 2 diabetes may
already have microalbuminuria at the time they are
Comparison of micro and macro vascular complications:
Table VIII
Comparison of micro and macro vascular complications of DN patients in different stage of CKD (n = 390)
Complications Staging of CKD p-
Stage 2(n = 2) Stage 3(n = 142) Stage 4(n = 146) Stage 5(n = 93) value
Micro vascular
NPDR 1(50.0) 36(25.4) 58(39.7) 42(45.2) 0.010
PDR 00 17(12.0) 25(17.2) 30(32.3) 0.001
Peripheral neuropathy 1(50.0) 51(35.9) 90(61.6) 52(55.9) <0.001
Diabetic foot 00 26(18.3) 42(28.8) 21(22.6) 0.167
Macro vascular
CAD 00 30(21.1) 55(37.7) 35(37.6) 0.007
MI 1(50.0) 20(14.1) 35(24.0) 28(30.1) 0.018
ACS 00 2(1.4) 12(8.2) 8(8.6) 0.044
Angina 00 17(12.0) 23(15.8) 10(10.8) 0.611
Stroke 00 11(7.7) 21(14.4) 16(17.2) 0.135
Peripheral vascular disease 1 (50.0) 8(5.6) 17(11.6) 18(19.4) 0.004
*Data were analyzed using Chi-squared (c2) Test.
Figures in the parentheses denote corresponding percentage
16
Bangladesh Renal Journal Vol. 3, No. 1, January 2021
diagnosed with diabetes. In the European Diabetes
Prospective Complications Study, the cumulative
incidence of microalbuminuria in patients with type 1
diabetes was 12% during a period of 7 years10.
Like other microvascular complications of diabetes, there
are strong associations between glucose control (as
measured by hemoglobin A1c [HbA1c] ) and the risk of
developing diabetic nephropathy. Patients should be
treated to the lowest safe glucose level that can be obtained
to prevent or control diabetic nephropathy (The DCCT
Research, 1993). Treatment with angiotensin-converting
enzyme (ACE) inhibitors has not been shown to prevent
the development of microalbuminuria in patients with type-
1 diabetes but has been shown to decrease the risk of
developing nephropathy and cardiovascular events in
patients with type- 2 diabetes11.
In the present study CAD, MI, ACS and peripheral vascular
disease (macrovascular complications) demonstrated their
increasing presence with advancing stage of CKD. Twenty
one patients (5.3%) have already had amputation of either
leg or toes because of gangrene resulting from peripheral
vascular disease and/or peripheral neuropathy, 6 (1.5%)
patients experienced coronary artery bypass graft (CABG)
and 8 (2%) stenting. Among macrovascular diabetes
complications, coronary artery disease has been
associated with diabetes in numerous studies beginning
with the Framingham study12. Diabetes is an independent
predictor of risk of stroke or cerebrovascular disease.
Patients with type- 2 diabetes have a much higher risk of
stroke, with an increased risk of 150-400%13. CVD is the
primary cause of death in people with either type 1 or
type- 2diabetes14 but this study show there is no
significant association between DN and CVD
Thus the study revealed that patients of diabetic kidney
disease are frequently associated with a number micro
and macrovascular complications and their frequency
increases with advance of the disease.
Limitation:
1. As this study was a clinical study and this study
may not exclude other causes of vascular
complications which might have confounded the
study findings.
2. As no patient was not allowed to undergo
investigations like Exercise Tolerance Test (ETE) or
angiogram because of ethical ground and therefore
in a substantial proportion of patients the diagnosis
coronary artery disease was based on clinical history,
previous medical records, ECG and Echocardiogram.
3. As the main bulk of the study population taken from
the department of Nephrology of DMCH and
BIRDEM and as nephrology department is a
department of specialty and patient come to this
department after being referred from other
departments after diagnosis. So early stages of CKD
especially stage 1 and 2 was failed to be included in
this study possibly due to late referral or late
diagnosis.
Conclusion
From the data analysis and discussion thereof, it is
concluded that patients of diabetic nephropathy are more
often associated with micro and macrovascular
complications. Of the microvascular complications,
peripheral neuropathy and non proliferative diabetic
retinopathy are frequently associated with diabetic
nephropathy than with any other microvascular
complications. Of the macrovascular complications,
coronary artery disease, MI and peripheral vascular disease
are more often encountered than other macro vascular
complications. Both micro and macro vascular
complications appears with increasing frequency as the
diabetic nephropathy advances.
References
1. Berkman J & Rifkin H, ‘Unilateral nodular diabetic
glomerulosclerosis (Kimmelstiel-Wilson): Report of a case’,
Metabolism, 1973; vol.22, no.5, pp.715–22.
2. Unnikrishnan RI, Rema M, Pradeepa R, Deepa M,
Subramaniam CS, Deepa R & Mohan V. ‘Prevalence and risk
factors of diabetic nephropathy in an urban south Indian
population’, Diabetes Care, 2007, ; vol.30,pp.2019-24.
3. Fowler MJ, ‘Microvascular and macrovascular complications
of diabetes’, Clinical diabetes, 2008; vol.26, pp.77-82.
4. Al-Wakeel JS, Mitwalli AH, Abu-Aisha H, et al, ‘Single center
experience with pre-dialysis patients’, Saudi J Kidney Dis
Transpl, 2002; vol. 13, no. 3, pp. 363-70.
5. Hirata-Dulas CA, Rith-Najarian SJ & Mcintyre MC ‘Risk
factors for nephropathy and cardiovascular diseases in
diabetic Northern Minnesota American Indians’, Clin
Nephrol, 1996; vol.46,no.2, pp.92-8.
6. Sarnak MJ, Levey AS & Schoolwerth AS, ‘Kidney disease as
a risk factor for development of cardiovascular disease’,
Hypertension, 2003; vol.42,no.5,pp.1050-65.
7. Czekalski S, ‘Diabetic nephropathy and cardiovascular
diseases’, Rocz Akad Med Bialymst, 2005; vol.50,
pp.122-5.
8. DeFronzo R, ‘Diabetic nephropathy:etiologic and
therapeutic considerations’, Diabetes rev, 1995;
vol.3,pp.510-64.
17
Micro and Macrovascular Complications in Diabetic Nephropathy in Different Stages of CKD Momtaz Hossain et al
9. Kannel WB & McGee DL, ‘Diabetes and cardiovascular
disease: the Framingham study’, JAMA, 1979;vol.241,
pp.2035 -8.
10. Gross JL, de Azevedo MJ, Silveiro SP, Canani LH, Caramori
ML & Zelmanovitz T ‘Diabetic nephropathy: diagnosis,
prevention, and treatment. Diabetes Care, 2005; vol.28,
pp.164-76.
11. Heart Outcomes Prevention Evaluation Study Investigators
‘Effects of ramipril on cardiovascular and microvascular
outcomes in people with diabetes mellitus: results of the
HOPE study and MICRO-HOPE substudy’, Lancet, 2000;
vol. 355, pp. 253-9.
12. Keenan HA, Costacou T, Sun JK, Doria A, Cavellerano J &
Coney J, ‘Clinical factors associated with resistance to
microvascular complications in diabetic patients of extreme
disease duration: the 50-year medalist study’, Diabetes Care;
2007; vol.30, pp.1995-97.
13. Beckman JA, Creager MA & Libby P, ‘Diabetes and
atherosclerosis: epidemiology, pathophysiology, and
management’, JAMA, 2002; vol.287, pp. 2570-81.
14. Laing SP, Swerdlow AJ, Slater SD, Burden AC, Morris A &
Waugh NR, ‘Mortality from heart disease in a cohort of
23,000 patients with insulin-treated diabetes’, Diabetologia,
2003;vol.46,pp.760-5.
18
Bangladesh Renal Journal Vol. 3, No. 1, January 2021

Introduction:
Chronic kidney disease (CKD) is a major public health
problem. The incidence and prevalence of End Stage Renal
Disease (ESRD) is increasing dramatically.
Death of patients with chronic renal failure (CRF) and in
patients on dialysis makes it imperative to consider the
risk factors involved.
Patients with CKD are in the highest risk category for
coronary heart disease (CHD). (K/DOQI; 2002)1 .The
incidence of cardiovascular disease (CVD) is high in
patients on hemodialysis (HD). (Gowdak LH et al, 2007)2
Approximately 50% of individuals with ESRD die from
cardiovascular events. The cardiovascular (CV) mortality
is 15 to 30 times higher than the age-adjusted CV mortality
in the general population [Schiffrin et al. 2007].3
Original Article
Effect of Atorvastatin on Lipid and Cardiovascular Events in
Patients on Maintenance HemodialysisMuhammed Arshad Ul Azim1, Md. Habibur Rahman 2, Abdus Salam3,
Sayed Mahtabul Islam4, Shahryar Waheed5
Abstract:
Background: Cardiovascular disease is the major cause of death in chronic kidney disease patient as well as in patients on
hemodialysis. Dyslipidaemia is highly prevalent in patients on maintenance haemodialysis which increase the risk for cardiovascular
mortality.
Objective: To see the lipid abnormalities in ESRD patients on maintenance hemodialysis and effect of Atorvastatin on cardiovascular
events.
Methods: In this prospective clinical study, 55 patients of ESRD undergoing maintenance hemodialysis participated voluntarily.
The study population was divided randomly into group-A (atorvastatin was prescribed) and group-B (without atorvastatin). We
compared the lipid status and cardiovascular events of both groups after 6 months.
Results: The two groups of patients were well matched in respect to baseline characteristics, history of risk factors and dialysis
duration and session. Mean age of study population was about 48 years. LDL cholesterol was reduced by 18.79% ,total cholesterol
was reduced by 9.32% and triglyceride was reduced by 22% in atorvastatin group. In group-A, HDL cholesterol was increased by
6% where was reduced by 6% in group-B. In this study, myocardial ischemia/infarction on ECG was present 22% in group-A and
14% in group-B at randomization. After 6 months, ischemia/infarction was found 33% in group–A and 25% in group-B.
Statistically the ECG findings showed no significant changes after 6 month. In this study, mean ejection fraction (EF %) was 54%
in group-A and 51% in group-B at 0 month, after 6 months atorvastatin group failed to show any significant change.
In this study, after 6 months of statin therapy there was slight increase of SGPT (16.13%) but that was not significant.
Conclusion: In our study majority of patient had lipid abnormalities. Atorvastatin improved the lipid abnormalities significantly
but a significant reduction of cardiovascular events was not achieved.
Key word: Lipid profile, Atorvastatin, Hemodialysis.
1. Assistant Professor, Department of Nephrology, Shahid Sheikh Abu Naser Specialized Hospital, Khulna, Bangladesh.
2. Professor, Department of Nephrology, Bangabandhu Sheikh Mujib Medical University, Dhaka, Bangladesh.
3. Assistant professor, Department of Neurology, Shahid Sheikh Abu Naser Specialized Hospital, Khulna, Bangladesh.
4. Assistant professor, Department of Nephrology, Chittagong Medical College, Chittagong, Bangladesh.
5. Assistant professor, Department of Nephrology, Sir Salimullah Medical College, Dhaka. Bangladesh.
Address of Correspondence: Dr. Muhammed Arshad Ul Azim, Assistant professor, Department of Nephrology, Shahid Sheikh Abu Naser
Specialized Hospital, Khulna, Bangladesh. Email: [email protected], Phone no: +8801742141516.
(Bang. Renal J. 2021; 3(1): 19-31)
20
Bangladesh Renal Journal Vol. 3, No. 1, January 2020
As cardiovascular disease is the most common cause of
mortality in patients with end stage renal disease (ESRD).
So many factors contribute to this high rate of cardiac
mortality, including traditional risk factors typically
identified in the general population and renal- specific
risk factors. (USRDS; 2002)4
Dyslipidaemia is highly prevalent in patients on
maintenance haemodialysis (MHD), with predominance
of the atherogenic triad, i.e., hypertriglyceridemia, elevated
VLDL and reduced HDL. (Pennell P et al, 2006).5 This mimics
the lipid abnormalities of metabolic syndrome, which
accelerate the progression of atherosclerosis and increase
the risk for cardiovascular mortality.(Abrass CK ,2006).6
High triglyceride concentration predicts coronary heart
disease independently from other known factors. (Castelli
et al, 1977)7
Statin treatment has been proven to reduce the mortality
and morbidity in cardiovascular disease, both in primary
and secondary prevention settings. 8, 9
ESRD patient typically have reduced levels of HDL
cholesterol. This abnormality is a well-described risk factor
for atherosclerosis, and has been associated with an
increased risk factor of cardiovascular death in general
population and increased risk of coronary artery disease
among hemodialysis patients.
In dialysis patients, some studies have shown an increase
in HDL with statin. Therefore, it is possible that statins
may protect against cardiovascular mortality in dialysis
patients by increasing HDL.8
In patients with ESRD, levels of oxidized LDL may be
increased compared to patients without renal disease 10
Statins have anti-oxidant properties in vitro, and may
modulate atherosclerosis by preventing oxidation of LDL-
cholesterol. When studied in vitro, statins have yet other
effects that in theory might mediate a cardio-protective
effect in patients .11
Statins may have direct antithrombotic properties, by up-
regulating endothelial nitric oxide production, by up
regulating tissue plasminogen activator (tPA) activity, and
by inhibiting platelet aggregation. Thus, there are a number
of mechanisms that could explain the association between
the uses of statin and reduced cardiovascular death in
the ESRD patients.
However, in none of these full-scale statin trials include
patients with a significant renal impairment. This is
especially true regarding patients subjected to renal
replacement therapy. In addition, it has recently been
reported that total and CV mortality were 32% and 36%
lower among ESRD patients receiving a statin, when
compared to not receiving a statin, respectively, based
upon observational registry date.12 The magnitude of these
apparent benefits was in the range observed in the 4S
study, and other studies of hyper-cholesterolemic patients
with CHD but normal or near normal renal function.8, 9
Recognizing that there is no data obtained from
prospective studies of statin treatment in patients
receiving HD treatment, there is evidence that these agents
favorably alter the atherogenic lipid profile and can be
used in this population. Statins have proved to be safe,
well tolerated, and effective in reducing both total and
CHD mortality in high-risk patients with normal or near
normal renal function, in patients both with, and without,
preexisting CHD. The safety or CV risk-reducing efficacy
of lipid-altering drug treatment has not been proved in
randomized prospective studies of patients receiving HD.
The purpose of this study was to see the Lipid
abnormalities in ESRD patients on maintenance
hemodialysis, and effect of atorvastatin on lipid profile
and effect of Atorvastatin on cardiovascular events in
patients on maintenance hemodialysis.
Material and Methods:
The present study was a Prospective randomized
experimental study.
The study was carried out on ESRD patients on MHD at
the department of nephrology, Bangabandhu Sheikh Mujib
Medical University (BSMMU), Shahbag, Dhaka, during
period of May 2009 to June 2011.
Total sixty six (66) patients with age more than 15 yrs of
both sexes who are on maintenance hemodialysis were
included in this study. Patients with SGPT more than 3
times upper limit, serious hematological or neoplastic
diseases and patient on lipid lowering medication were
excluded from the study.
Informed consent is obtained from each patient. The study
protocol is approved by ethical committee.
Demographic profile, clinical examination and relevant
investigation reports of all patients were recorded in pre-
designed data collection sheet. The anti-ischcmic, anti-
hypertensive, if taking was continued. Fasting lipid profile,
ECG and echocardiography was done at initiation.
Study population was given serial number from 1 to 66.
Starting point (1st sampling unit) being chosen at random
by lottery. Then every alternative patient belongs to one
group, like group – A and group -B. Group-A was
prescribed atorvastatin 10 mg/day. Group-B was not
prescribed atorvastatin. And follow up was done after 6
months.
After 6 months, four (4) patients died from group-A and
five (5) patients died from group-B. One patient was lost
due to transfer of dialysis center in group-B and one patient
underwent kidney transplantation in group-A. Total fifty
five (55) patients completed the study.
We compared the lipid status and cardiovascular events
of both groups after 6 months.
Operational definition:
Hypertension: was defined on the basis of presence of
Systolic Blood Pressure (SBP) ³ 140 mmHg and / or
Diastolic Blood Pressure (DBP) ³ 90 mmHg, or the use of
any anti-hypertensive agent.
Diabetes mellitus (DM): was defined on the basis of
random plasma glucose level ³ 11.1 mmol /liter, or fasting
plasma glucose ³ 7 mmol/liter or the use of insulin or an
oral hypoglycemic agent.
Cardiovascular disease (CVD): Diagnosis of
Cardiovascular Disease included-
• Convincing history of angina or any coronary
intervention. Or
ECG evidence of myocardial infarction or ischemia:
ST segment elevation or depression or pathological
Q wave and/or T wave inversion. ST segment shift of
> 1 mm is indicative of ischemia (Boon NA et al.2006)13
ECG evidence of left ventricular hypertrophy (LVH).
In ECG, LVH was diagnosed when -
‘S’ in V1 + ‘R’ in V5 or V6 ³ 35 mm (Hampton JR. 1997)14
· Echocardiography evidence of myocardial infarction
or ischemia. Myocardial damage or ischemia results in
wall motion abnormalities are present.
Concentric LVH: Increased LV mass and increased RWT
LV mass = 1.05 (total volume –chamber volume)
1.05 – specific density of myocardium
RWT = relative wall thickness.
EF% = (stroke volume / end diastolic volume) 100% (OTTO
et al.2010)15
Normal level 55% to 70% 16
• Congestive heart failure (CHF) or Left ventricular failure
(LVF) diagnosed clinically;
CHF: raised JVP, dependent oedema, & tender
hepatomegaly.
LVF: pulsus alternans, gallop rhythm & bilateral basal
crepitations.
• Stroke (Sarnak et al. 2003)17 – defined by the presence
of focal neurological deficit, eg. hemiplegia, or CT
scan evidence of infarction or hemorrhage in the brain.
BMI:
18.5—24.9 kg/m2= Normal
25—29.9 kg/m2= Overweight
30 kg/m2 = Obese 18
Level of serum lipids:
According to the executive summary of the third report of
National Cholesterol Education Programme (NECP), Serum
cholesterol, LDL & HDL level range. 19
Total Cholesterol <200mg/dl desirable.
200-239 mg/dl- borderline high
240 mg/dl- high.
LDL Cholesterol <100 mg/dl- Optimal.
100-129 mg/dl- Near or above normal.
130-159 mg/dl- Borderline high.
160-189 mg/dl- High.
190 mg/dl- Very high.
HDL Cholesterol < 40 mg/dl- Low.
40-59 mg/dl- Average.
60 mg/dl- High.
The American Heart association recommends the following
guideline for blood triglycerides level: normal range is less
than 150 mg/dl. Borderline high is 150 to 199 mg/dl, high is
200 to 499 mg/dl and very high is 500 mg/dl or above.
(Morag et al, 2002)20
Data collection procedure:
a) Data was collected from all participants by direct
interview and using structured questionnaires.
Informed consent was obtained from all participants.
b) Age, sex, occupation, marital status was noted as per
statement of the participants at the time of interview.
History regarding smoking habit, hypertension,
diabetes mellitus. History of any cardiovascular
events (Myocardial infarction, stroke, heart failure,)
was taken. Drug history regarding anti-hypertensive,
anti-diabetic, lipid-lowering, and anti-ischaemic drugs
21
Effect of Atorvastatin on Lipid and Cardiovascular Events in Patients on Maintenance Hemodialysis M Arshad Ul Azim et al
22
was noted. Family history of hypertension, diabetes
was recorded.
c) Then the participants were examined for height,
weight, blood pressure, anemia, and edema. Also
precordium and lung bases were auscultated.
d) Height was measured without shoes in erect posture
on a flat surface placing the heels, buttock, scapulae
and occiput touching the wall on the back while
extending great toes and gazing horizontally forward
to a point on the opposite wall.
e) Weight was taken wearing light cloths without shoes
by an appropriately calibrated weight measuring scale
placed on a flat surface.
f) Blood pressure (B.P) was measured after taking rest
for 5 minutes and the patient sitting relaxed in a chair
with a support on the back and keeping bared arm on
a table at heart level. A conventional
sphygmomenometer, ALP K2 made in Japan, having
12 cm cuff was used covering 80% of the arm covered
by the bladder. 1st and 5th korotkoff sounds were
taken as systolic and diastolic B.P respectably. The
averages of the two readings taken 2 minutes apart
were taken for analysis. Hypertension was staged
according to JNC-7 guideline.
Laboratory method:
Lab sample collection:
Blood was collected for estimation of glucose, SGPT, Serum
albumin and lipid profile at the beginning and after six
months. 4 cc blood was collected on the spot from every
participants with a 5 cc disposable syringe with aseptic
precaution and the participant in sitting posture and a
tourniquet tied in the arm. Sample was poured in a clean
test tube labeled with known registration number for each
participant and was allowed to clot. After 10-20 minutes,
serum was separated by centrifuging at 3000 rmp for 10
minutes. The serum was then taken by using micro-pipettes
in appropriately labeled appendrops.
ECG and echocardiography was done by Fukuda ME
machine made in Japan to look for evidence of LVH and
myocardial ischemia or infarction, ejection fraction,
pericardial effusion.
Laboratory procedure:
The summarized information was presented in the form of
tables and charts. Blood glucose, serum albumin, SGPT
and serum lipid profile were done in KIDNEY RESEARCH
LAB, BSMMU. Blood glucose was estimated by Hospitex
Screen Master, Techno-168 (ISE SRL, Italy).
10 hours fasting lipid profile was done in Kidney Research
Lab. Total cholesterol, HDL and Triglyceride were
estimated directly by using reagent kits (End point method)
by RA-50 Biochemistry Analyzer. LDL was calculated from
total cholesterol, HDL and Triglyceride by using Freid-
Wald equation if TG is less than 400 mg/dl.
LDL= Total cholesterol –TG/2.2-HDL 21
Data Analysis and Statistical Test:
Data was processed and analyzed using computer software
SPSS (Statistical Package for Social Science) version 11.5.
The Test statistics used to analyze the data are descriptive
statistics, chi square test, Student’s t-test. The descriptive
statistics are frequency, mean, and standard deviation.
Continuous data was presented as mean and standard
deviation from the mean and was compared using
student’s t-test. Categorical data was expressed as
percentage and evaluated using chi-square test. P value
< 0.05 was considered significant.
Observation and Results:
A total of fifty five (55) patients who fulfilled the inclusion
criteria, were studied during the period. Patients were
divided into two groups. Group A (n = 27) where
atorvastatin was prescribed and group-B (n = 28) where
atorvastatin was not prescribed. There were no significant
differences in baseline characteristics between groups
(Table I). There were also no significant differences in risk
factors present and history of dialysis between groups
(Table II, Table III). In this study mean (±SD) systolic
blood pressure in group A and group B, respectively, at 0
month were 155.93±16.47 and 156.07±15.24 mmHg, and at
6 month were 151.11±12.81 and 153.93±13.97 mmHg.
Statistical comparison showed no significant difference
either at 0 month or at 6 month (Table IV).
According to the executive summary of the third report of
NCEP and the American Heart Association
recommendation, in this study 84% patient had desirable
level of total cholesterol and 16% had border line high.
Bangladesh Renal Journal Vol. 3, No. 1, January 2021
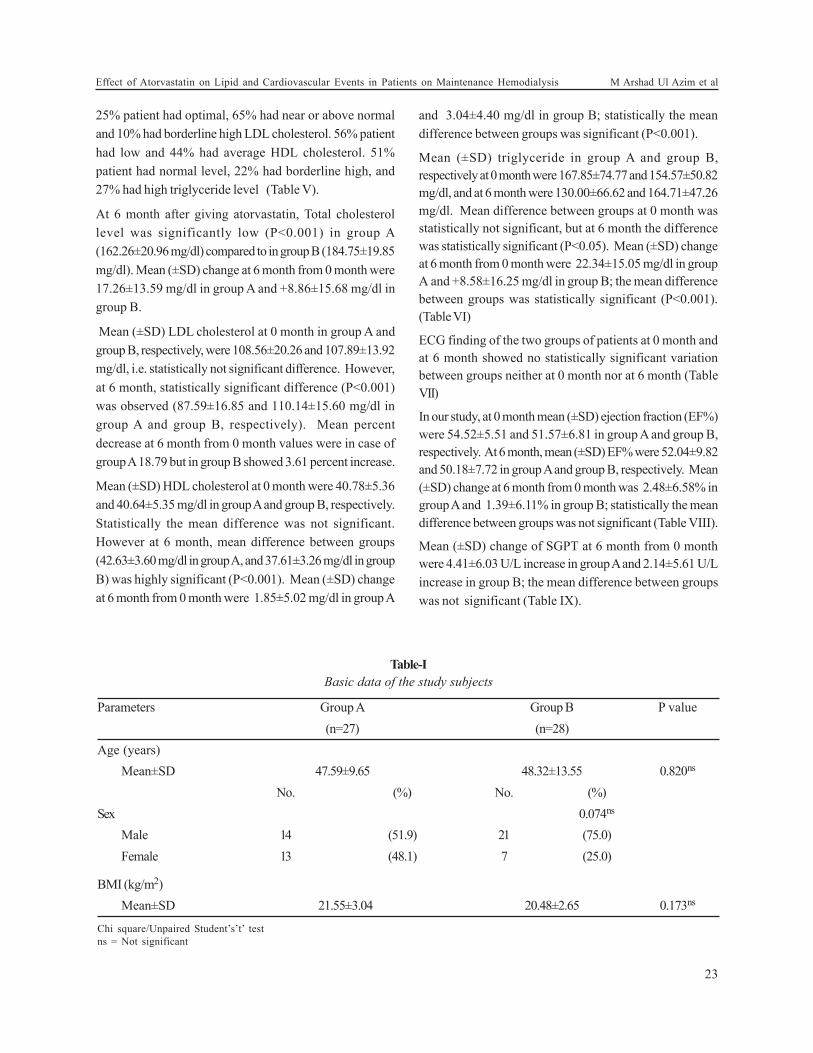
25% patient had optimal, 65% had near or above normal
and 10% had borderline high LDL cholesterol. 56% patient
had low and 44% had average HDL cholesterol. 51%
patient had normal level, 22% had borderline high, and
27% had high triglyceride level (Table V).
At 6 month after giving atorvastatin, Total cholesterol
level was significantly low (P<0.001) in group A
(162.26±20.96 mg/dl) compared to in group B (184.75±19.85
mg/dl). Mean (±SD) change at 6 month from 0 month were
17.26±13.59 mg/dl in group A and +8.86±15.68 mg/dl in
group B.
Mean (±SD) LDL cholesterol at 0 month in group A and
group B, respectively, were 108.56±20.26 and 107.89±13.92
mg/dl, i.e. statistically not significant difference. However,
at 6 month, statistically significant difference (P<0.001)
was observed (87.59±16.85 and 110.14±15.60 mg/dl in
group A and group B, respectively). Mean percent
decrease at 6 month from 0 month values were in case of
group A 18.79 but in group B showed 3.61 percent increase.
Mean (±SD) HDL cholesterol at 0 month were 40.78±5.36
and 40.64±5.35 mg/dl in group A and group B, respectively.
Statistically the mean difference was not significant.
However at 6 month, mean difference between groups
(42.63±3.60 mg/dl in group A, and 37.61±3.26 mg/dl in group
B) was highly significant (P<0.001). Mean (±SD) change
at 6 month from 0 month were 1.85±5.02 mg/dl in group A
and 3.04±4.40 mg/dl in group B; statistically the mean
difference between groups was significant (P<0.001).
Mean (±SD) triglyceride in group A and group B,
respectively at 0 month were 167.85±74.77 and 154.57±50.82
mg/dl, and at 6 month were 130.00±66.62 and 164.71±47.26
mg/dl. Mean difference between groups at 0 month was
statistically not significant, but at 6 month the difference
was statistically significant (P<0.05). Mean (±SD) change
at 6 month from 0 month were 22.34±15.05 mg/dl in group
A and +8.58±16.25 mg/dl in group B; the mean difference
between groups was statistically significant (P<0.001).
(Table VI)
ECG finding of the two groups of patients at 0 month and
at 6 month showed no statistically significant variation
between groups neither at 0 month nor at 6 month (Table
VII)
In our study, at 0 month mean (±SD) ejection fraction (EF%)
were 54.52±5.51 and 51.57±6.81 in group A and group B,
respectively. At 6 month, mean (±SD) EF% were 52.04±9.82
and 50.18±7.72 in group A and group B, respectively. Mean
(±SD) change at 6 month from 0 month was 2.48±6.58% in
group A and 1.39±6.11% in group B; statistically the mean
difference between groups was not significant (Table VIII).
Mean (±SD) change of SGPT at 6 month from 0 month
were 4.41±6.03 U/L increase in group A and 2.14±5.61 U/L
increase in group B; the mean difference between groups
was not significant (Table IX).
Table-I
Basic data of the study subjects
Parameters Group A Group B P value
(n=27) (n=28)
Age (years)
Mean±SD 47.59±9.65 48.32±13.55 0.820ns
No. (%) No. (%)
Sex 0.074ns
Male 14 (51.9) 21 (75.0)
Female 13 (48.1) 7 (25.0)
BMI (kg/m2)
Mean±SD 21.55±3.04 20.48±2.65 0.173ns
Chi square/Unpaired Student’s’t’ test
ns = Not significant
23
Effect of Atorvastatin on Lipid and Cardiovascular Events in Patients on Maintenance Hemodialysis M Arshad Ul Azim et al
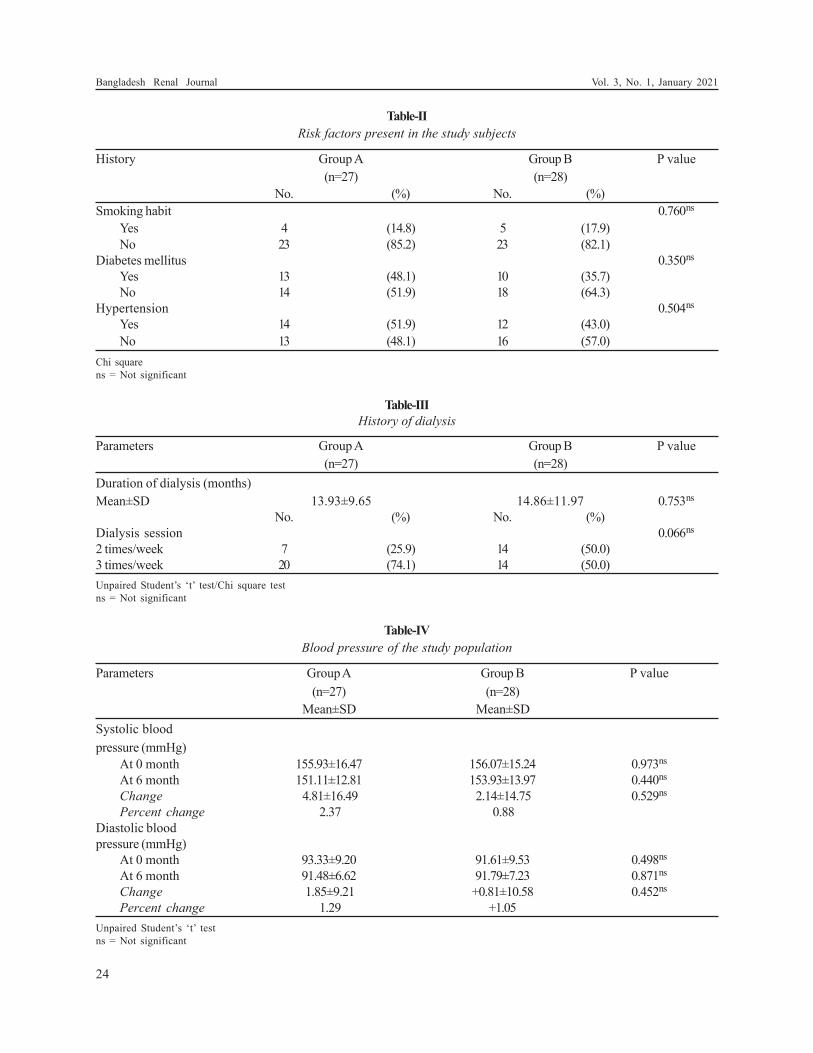
Table-II
Risk factors present in the study subjects
History Group A Group B P value
(n=27) (n=28)
No. (%) No. (%)
Smoking habit 0.760ns
Yes 4 (14.8) 5 (17.9)
No 23 (85.2) 23 (82.1)
Diabetes mellitus 0.350ns
Yes 13 (48.1) 10 (35.7)
No 14 (51.9) 18 (64.3)
Hypertension 0.504ns
Yes 14 (51.9) 12 (43.0)
No 13 (48.1) 16 (57.0)
Chi square
ns = Not significant
Table-III
History of dialysis
Parameters Group A Group B P value
(n=27) (n=28)
Duration of dialysis (months)
Mean±SD 13.93±9.65 14.86±11.97 0.753ns
No. (%) No. (%)
Dialysis session 0.066ns
2 times/week 7 (25.9) 14 (50.0)
3 times/week 20 (74.1) 14 (50.0)
Unpaired Student’s ‘t’ test/Chi square test
ns = Not significant
Table-IV
Blood pressure of the study population
Parameters Group A Group B P value
(n=27) (n=28)
Mean±SD Mean±SD
Systolic blood
pressure (mmHg)
At 0 month 155.93±16.47 156.07±15.24 0.973ns
At 6 month 151.11±12.81 153.93±13.97 0.440ns
Change 4.81±16.49 2.14±14.75 0.529ns
Percent change 2.37 0.88
Diastolic blood
pressure (mmHg)
At 0 month 93.33±9.20 91.61±9.53 0.498ns
At 6 month 91.48±6.62 91.79±7.23 0.871ns
Change 1.85±9.21 +0.81±10.58 0.452ns
Percent change 1.29 +1.05
Unpaired Student’s ‘t’ test
ns = Not significant
24
Bangladesh Renal Journal Vol. 3, No. 1, January 2021
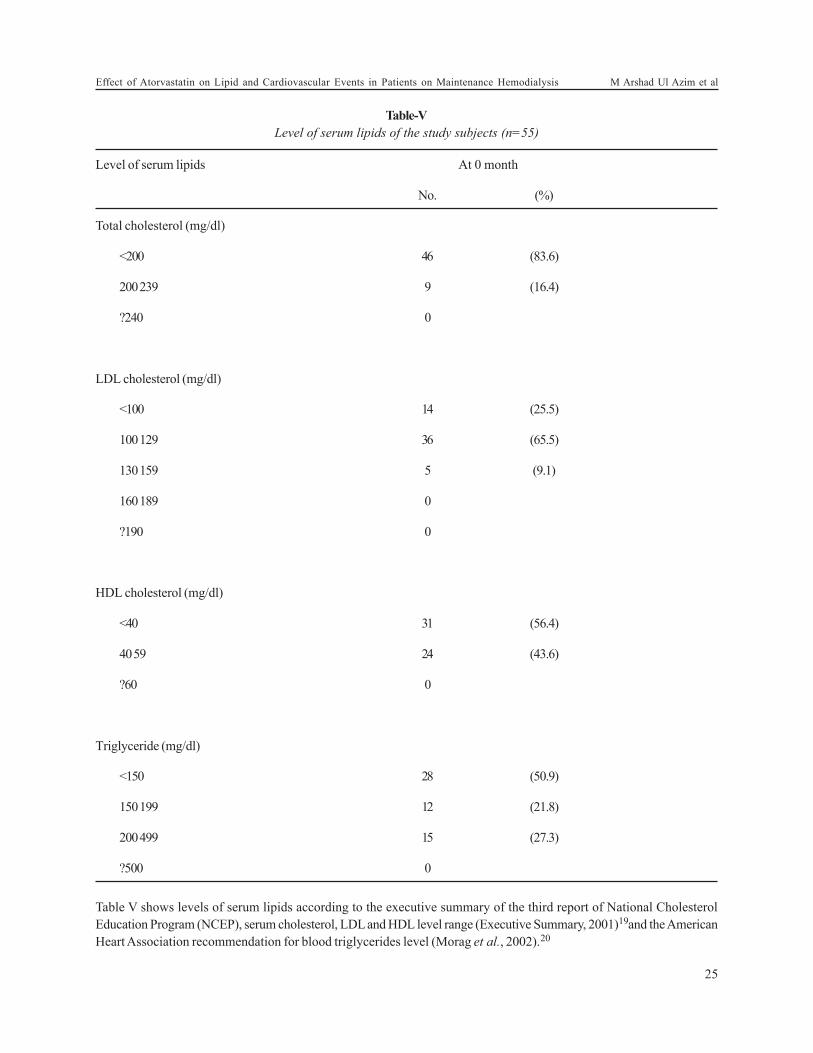
Table-V
Level of serum lipids of the study subjects (n=55)
Level of serum lipids At 0 month
No. (%)
Total cholesterol (mg/dl)
<200 46 (83.6)
200 239 9 (16.4)
?240 0
LDL cholesterol (mg/dl)
<100 14 (25.5)
100 129 36 (65.5)
130 159 5 (9.1)
160 189 0
?190 0
HDL cholesterol (mg/dl)
<40 31 (56.4)
40 59 24 (43.6)
?60 0
Triglyceride (mg/dl)
<150 28 (50.9)
150 199 12 (21.8)
200 499 15 (27.3)
?500 0
Table V shows levels of serum lipids according to the executive summary of the third report of National Cholesterol
Education Program (NCEP), serum cholesterol, LDL and HDL level range (Executive Summary, 2001)19and the American
Heart Association recommendation for blood triglycerides level (Morag et al., 2002).20
25
Effect of Atorvastatin on Lipid and Cardiovascular Events in Patients on Maintenance Hemodialysis M Arshad Ul Azim et al
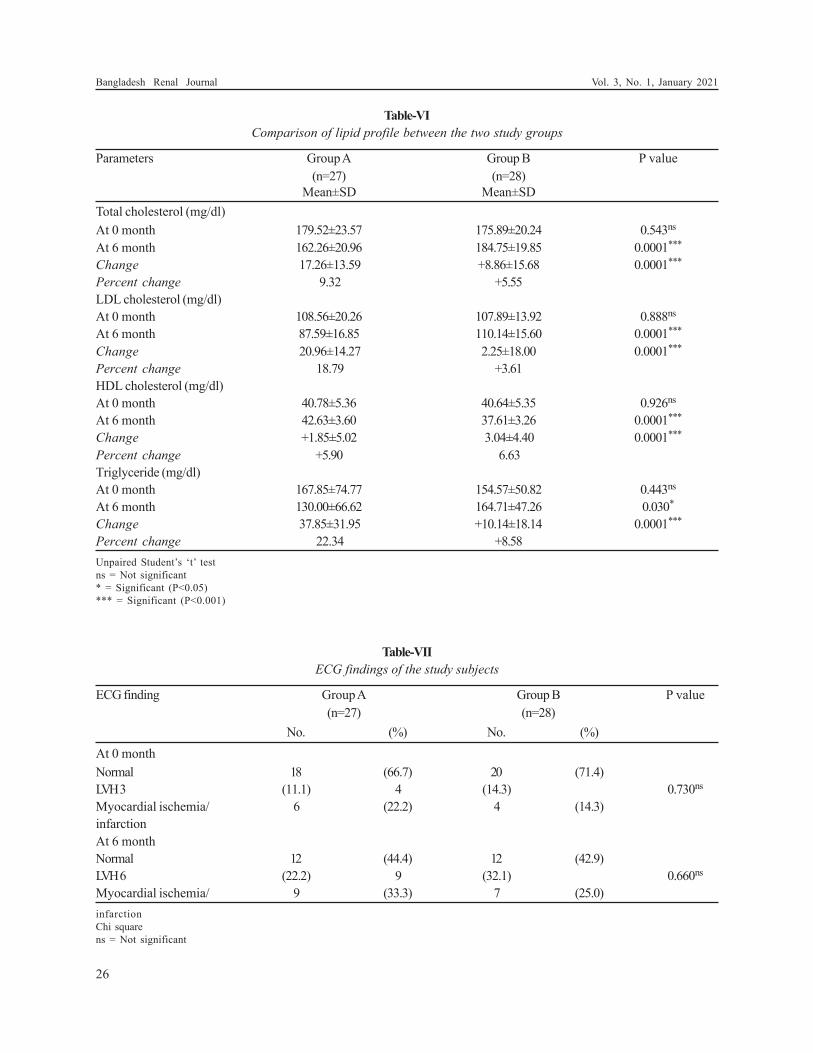
Table-VI
Comparison of lipid profile between the two study groups
Parameters Group A Group B P value
(n=27) (n=28)
Mean±SD Mean±SD
Total cholesterol (mg/dl)
At 0 month 179.52±23.57 175.89±20.24 0.543ns
At 6 month 162.26±20.96 184.75±19.85 0.0001***
Change 17.26±13.59 +8.86±15.68 0.0001***
Percent change 9.32 +5.55
LDL cholesterol (mg/dl)
At 0 month 108.56±20.26 107.89±13.92 0.888ns
At 6 month 87.59±16.85 110.14±15.60 0.0001***
Change 20.96±14.27 2.25±18.00 0.0001***
Percent change 18.79 +3.61
HDL cholesterol (mg/dl)
At 0 month 40.78±5.36 40.64±5.35 0.926ns
At 6 month 42.63±3.60 37.61±3.26 0.0001***
Change +1.85±5.02 3.04±4.40 0.0001***
Percent change +5.90 6.63
Triglyceride (mg/dl)
At 0 month 167.85±74.77 154.57±50.82 0.443ns
At 6 month 130.00±66.62 164.71±47.26 0.030*
Change 37.85±31.95 +10.14±18.14 0.0001***
Percent change 22.34 +8.58
Unpaired Student’s ‘t’ test
ns = Not significant
* = Significant (P<0.05)
*** = Significant (P<0.001)
Table-VII
ECG findings of the study subjects
ECG finding Group A Group B P value
(n=27) (n=28)
No. (%) No. (%)
At 0 month
Normal 18 (66.7) 20 (71.4)
LVH3 (11.1) 4 (14.3) 0.730ns
Myocardial ischemia/ 6 (22.2) 4 (14.3)
infarction
At 6 month
Normal 12 (44.4) 12 (42.9)
LVH6 (22.2) 9 (32.1) 0.660ns
Myocardial ischemia/ 9 (33.3) 7 (25.0)
infarction
Chi square
ns = Not significant
26
Bangladesh Renal Journal Vol. 3, No. 1, January 2021
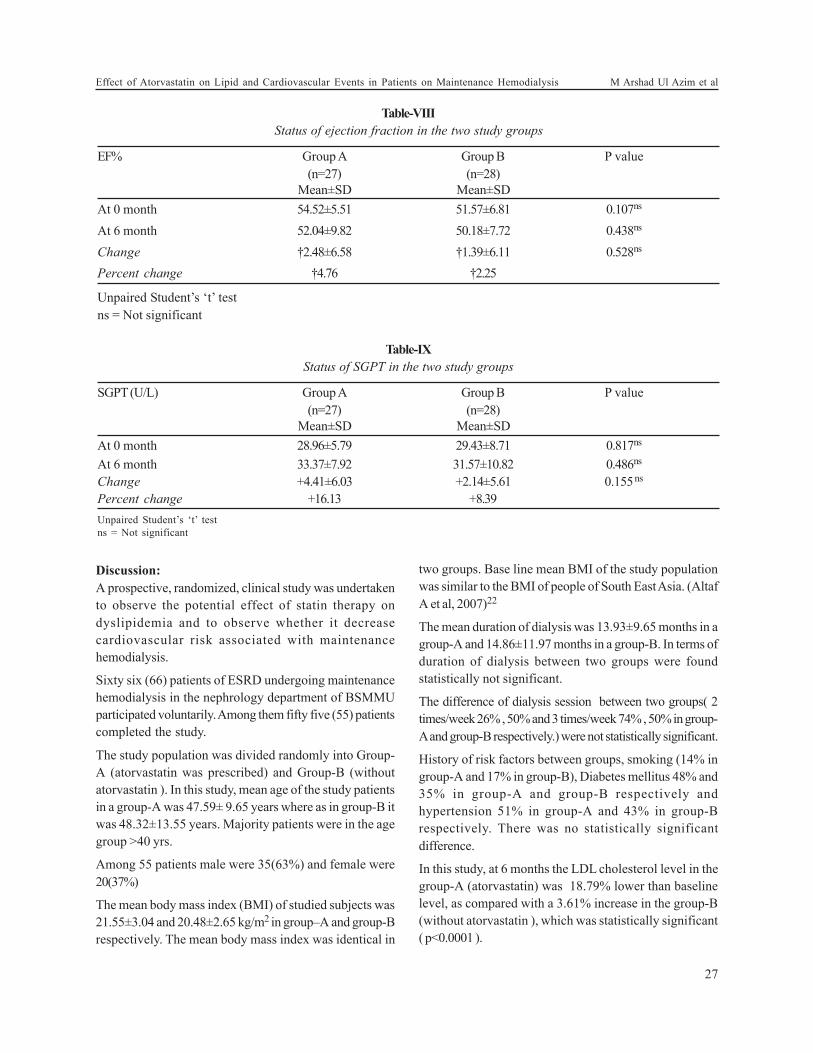
Table-VIII
Status of ejection fraction in the two study groups
EF% Group A Group B P value
(n=27) (n=28)
Mean±SD Mean±SD
At 0 month 54.52±5.51 51.57±6.81 0.107ns
At 6 month 52.04±9.82 50.18±7.72 0.438ns
Change †2.48±6.58 †1.39±6.11 0.528ns
Percent change †4.76 †2.25
Unpaired Student’s ‘t’ test
ns = Not significant
Table-IX
Status of SGPT in the two study groups
SGPT (U/L) Group A Group B P value
(n=27) (n=28)
Mean±SD Mean±SD
At 0 month 28.96±5.79 29.43±8.71 0.817ns
At 6 month 33.37±7.92 31.57±10.82 0.486ns
Change +4.41±6.03 +2.14±5.61 0.155 ns
Percent change +16.13 +8.39
Unpaired Student’s ‘t’ test
ns = Not significant
Discussion:
A prospective, randomized, clinical study was undertaken
to observe the potential effect of statin therapy on
dyslipidemia and to observe whether it decrease
cardiovascular risk associated with maintenance
hemodialysis.
Sixty six (66) patients of ESRD undergoing maintenance
hemodialysis in the nephrology department of BSMMU
participated voluntarily. Among them fifty five (55) patients
completed the study.
The study population was divided randomly into Group-
A (atorvastatin was prescribed) and Group-B (without
atorvastatin ). In this study, mean age of the study patients
in a group-A was 47.59± 9.65 years where as in group-B it
was 48.32±13.55 years. Majority patients were in the age
group >40 yrs.
Among 55 patients male were 35(63%) and female were
20(37%)
The mean body mass index (BMI) of studied subjects was
21.55±3.04 and 20.48±2.65 kg/m2 in group–A and group-B
respectively. The mean body mass index was identical in
two groups. Base line mean BMI of the study population
was similar to the BMI of people of South East Asia. (Altaf
A et al, 2007)22
The mean duration of dialysis was 13.93±9.65 months in a
group-A and 14.86±11.97 months in a group-B. In terms of
duration of dialysis between two groups were found
statistically not significant.
The difference of dialysis session between two groups( 2
times/week 26% , 50% and 3 times/week 74% , 50% in group-
A and group-B respectively.) were not statistically significant.
History of risk factors between groups, smoking (14% in
group-A and 17% in group-B), Diabetes mellitus 48% and
35% in group-A and group-B respectively and
hypertension 51% in group-A and 43% in group-B
respectively. There was no statistically significant
difference.
In this study, at 6 months the LDL cholesterol level in the
group-A (atorvastatin) was 18.79% lower than baseline
level, as compared with a 3.61% increase in the group-B
(without atorvastatin ), which was statistically significant
( p<0.0001 ).
27
Effect of Atorvastatin on Lipid and Cardiovascular Events in Patients on Maintenance Hemodialysis M Arshad Ul Azim et al
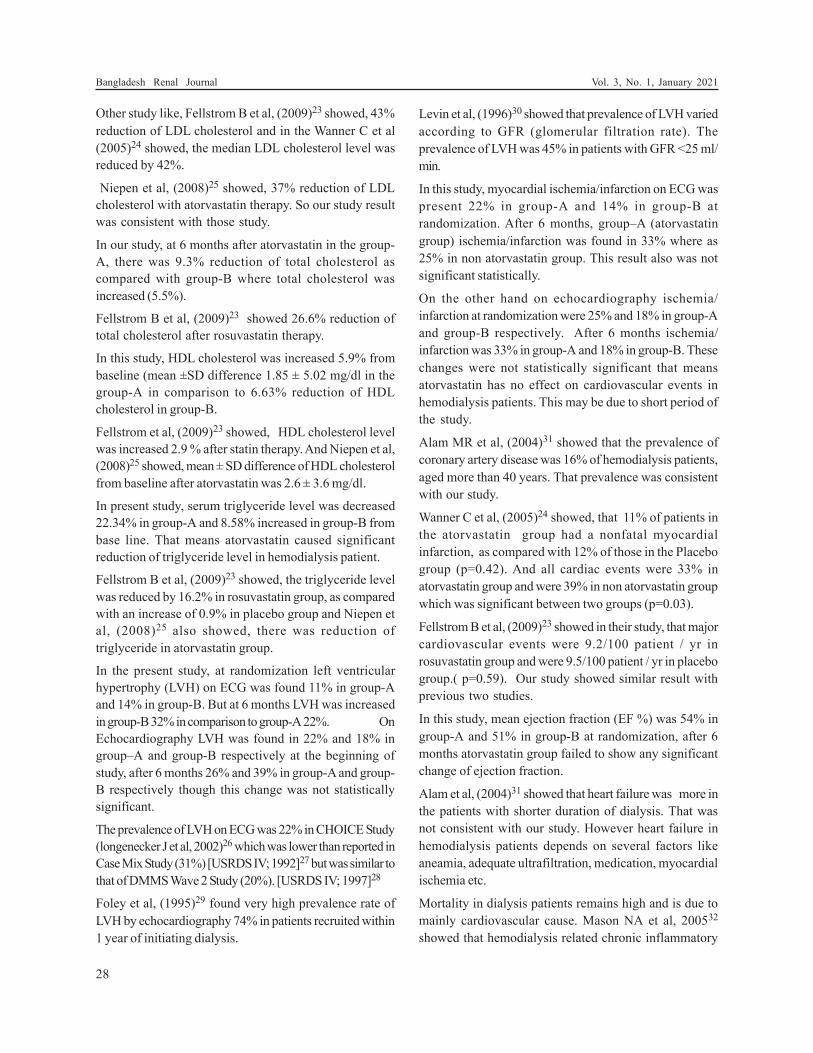
Other study like, Fellstrom B et al, (2009)23 showed, 43%
reduction of LDL cholesterol and in the Wanner C et al
(2005)24 showed, the median LDL cholesterol level was
reduced by 42%.
Niepen et al, (2008)25 showed, 37% reduction of LDL
cholesterol with atorvastatin therapy. So our study result
was consistent with those study.
In our study, at 6 months after atorvastatin in the group-
A, there was 9.3% reduction of total cholesterol as
compared with group-B where total cholesterol was
increased (5.5%).
Fellstrom B et al, (2009)23 showed 26.6% reduction of
total cholesterol after rosuvastatin therapy.
In this study, HDL cholesterol was increased 5.9% from
baseline (mean ±SD difference 1.85 ± 5.02 mg/dl in the
group-A in comparison to 6.63% reduction of HDL
cholesterol in group-B.
Fellstrom et al, (2009)23 showed, HDL cholesterol level
was increased 2.9 % after statin therapy. And Niepen et al,
(2008)25 showed, mean ± SD difference of HDL cholesterol
from baseline after atorvastatin was 2.6 ± 3.6 mg/dl.
In present study, serum triglyceride level was decreased
22.34% in group-A and 8.58% increased in group-B from
base line. That means atorvastatin caused significant
reduction of triglyceride level in hemodialysis patient.
Fellstrom B et al, (2009)23 showed, the triglyceride level
was reduced by 16.2% in rosuvastatin group, as compared
with an increase of 0.9% in placebo group and Niepen et
al, (2008)25 also showed, there was reduction of
triglyceride in atorvastatin group.
In the present study, at randomization left ventricular
hypertrophy (LVH) on ECG was found 11% in group-A
and 14% in group-B. But at 6 months LVH was increased
in group-B 32% in comparison to group-A 22%. On
Echocardiography LVH was found in 22% and 18% in
group–A and group-B respectively at the beginning of
study, after 6 months 26% and 39% in group-A and group-
B respectively though this change was not statistically
significant.
The prevalence of LVH on ECG was 22% in CHOICE Study
(longenecker J et al, 2002)26 which was lower than reported in
Case Mix Study (31%) [USRDS IV; 1992]27 but was similar to
that of DMMS Wave 2 Study (20%). [USRDS IV; 1997]28
Foley et al, (1995)29 found very high prevalence rate of
LVH by echocardiography 74% in patients recruited within
1 year of initiating dialysis.
Levin et al, (1996)30 showed that prevalence of LVH varied
according to GFR (glomerular filtration rate). The
prevalence of LVH was 45% in patients with GFR <25 ml/
min.
In this study, myocardial ischemia/infarction on ECG was
present 22% in group-A and 14% in group-B at
randomization. After 6 months, group–A (atorvastatin
group) ischemia/infarction was found in 33% where as
25% in non atorvastatin group. This result also was not
significant statistically.
On the other hand on echocardiography ischemia/
infarction at randomization were 25% and 18% in group-A
and group-B respectively. After 6 months ischemia/
infarction was 33% in group-A and 18% in group-B. These
changes were not statistically significant that means
atorvastatin has no effect on cardiovascular events in
hemodialysis patients. This may be due to short period of
the study.
Alam MR et al, (2004)31 showed that the prevalence of
coronary artery disease was 16% of hemodialysis patients,
aged more than 40 years. That prevalence was consistent
with our study.
Wanner C et al, (2005)24 showed, that 11% of patients in
the atorvastatin group had a nonfatal myocardial
infarction, as compared with 12% of those in the Placebo
group (p=0.42). And all cardiac events were 33% in
atorvastatin group and were 39% in non atorvastatin group
which was significant between two groups (p=0.03).
Fellstrom B et al, (2009)23 showed in their study, that major
cardiovascular events were 9.2/100 patient / yr in
rosuvastatin group and were 9.5/100 patient / yr in placebo
group.( p=0.59). Our study showed similar result with
previous two studies.
In this study, mean ejection fraction (EF %) was 54% in
group-A and 51% in group-B at randomization, after 6
months atorvastatin group failed to show any significant
change of ejection fraction.
Alam et al, (2004)31 showed that heart failure was more in
the patients with shorter duration of dialysis. That was
not consistent with our study. However heart failure in
hemodialysis patients depends on several factors like
aneamia, adequate ultrafiltration, medication, myocardial
ischemia etc.
Mortality in dialysis patients remains high and is due to
mainly cardiovascular cause. Mason NA et al, 200532
showed that hemodialysis related chronic inflammatory
28
Bangladesh Renal Journal Vol. 3, No. 1, January 2021
process plays the central role in accelerated atherosclerosis
and cardiovascular mortality and statins play an important
role in reducing all cause and cardiovascular mortality
besides having an adequate safety profile, making them
the first choice treatment of dyslipidemia in dialysis
patients. Likewise statins are also known for their ability
to reduce inflammatory markers, CRP and LDL cholesterol.
For these reason in some studies, statin was used even in
very low level of LDL cholesterol to get other pleitrophic
effect like mean LDL 77±16.4 mg/dl (Niepen, 2008)25 and
100±35mg/dl (Fellstrom, 2009).23 In this study, decrease of
cardiovascular events was also expected but was not
achieved, may be due to short duration of study period.
In present study, baseline SGPT was similar in both groups
and after 6 months there was slight increase of SGPT
16.13% in atorvastatin group as compared with 8.39% in
non atorvastatin group. That was not statistically
significant. That means atorvastatin did not cause
significant increase of SGPT in dialysis patients.
Niepen et al,(2008)25 showed, that SGPT level was
increased by 14% in patients with statin therapy which
was expected to occur during treatment with statin though
insufficient to cause any hepatic dysfunction.
Fellstrom B et al, (2009)23 showed that SGPT level was
increased >4 times upper limit of normal range in 0.4% of
patients in both rosuvastatin and placebo groups.
(p=0.75). Wanner C et at, (2005)24 also showed that there
was no serious adverse events, specially any hepatic
dysfunction.
Summary and Conclusion:
In this prospective clinical study carried out in the
department of nephrology in BSMMU, 55 patients of ESRD
undergoing maintenance hemodialysis participated
voluntarily.
The study population was divided randomly into group-
A (atorvastatin was prescribed) and group-B (without
atorvastatin). Baseline data were recorded accordingly.
The two groups of patients were well matched in respect
to baseline characteristics, history of risk factors and
dialysis duration and session. Mean age of study
population was about 48 years, mean BMI was 21 kg/m2
mean duration of dialysis was about 14 months.
After giving atorvastatin (10 mg/day), LDL cholesterol
was reduced by 18.79% but increased in those where not
given atorvastatin. This change was highly significant
(p<0.001). In the same manner the total cholesterol also
reduced by 9.32% in atorvastatin group in comparison to
non atorvastatin group in them it increased by 5.55%.
Another important component of lipid, HDL cholesterol
was increased by 6% in atorvastatin group where was
reduced by 6% in non atorvastatin group.
In this study, atorvastatin reduced triglyceride by 22%
where triglyceride was increased in non atorvastatin group.
All these components of lipid, especially LDL cholesterol,
reduced HDL cholesterol, even triglyceride are highly
atherogenic and are important risk factors for
cardiovascular disease.
Atorvastatin (10mg/day) lowers LDL level by about 19%,
to 87 mg/dl, which is close to the target value of 70mg/dl
recommended by Adult Treatment Panel of National
Cholesterol Education program in person who are at very
high risk of cardiovascular disease. Approximately 50% of
patients with end-stage renal disease (ESRD) die from
cardiovascular events, (Foley RN et al, 1998)29 which
indicates that cardiovascular mortality are 30-times higher
in dialysis patients. And in this study atorvastatin reduced
LDL cholesterol significantly. But a significant reduction
of cardiovascular events was not achieved.
The lack of benefit of statin therapy may be due to short
time duration of the study or cardiovascular disease in
patients undergoing hemodialysis differ from that in other
patients or initiation of lipid lowering therapy in patients
who already have ESRD may come too late into consistent
improvement of the cardiovascular events.
In this study, hepatic dysfunction or other serious adverse
events was not observed.
To get the desired cardiovascular effect by statin therapy
may need long term follow-up study or statin therapy
should be initiated in the early stages of chronic kidney
disease.
Study Limitation:
The present study has number of limitations.
1. This was a single centre study
2. Study included a small number of patients, so
conclusion may not be consistent with similar large
studies
3. Another limitation is short study period, as a longer
follow-up could provide more accurate information
about cardiovascular effect.
29
Effect of Atorvastatin on Lipid and Cardiovascular Events in Patients on Maintenance Hemodialysis M Arshad Ul Azim et al
References
1 National Kidney Foundation. K/DOQI clinical practice
guidelines for chronic kidney disease: 2002. Evaluation,
classification, and stratification. Am J Kidney Dis.;39:S1-
266.
2 Gowdak, L.H., Arantes RL, de Paula FJ, Krieger EM, De
Lima JJ. 2007. Under use of American College of Cardiology/
American Heart Association Guidelines in hemodialysis
patients. Ren Fail; 29(5):559-65
3 Schiffrin, E.L., Lipman ML, Mann JFE. Chronic Kidney
Disease: 2007 Effects on the Cardiovascular System.
Circulation; 116: 85-97.
4 U.S. Renal Data System, USRDS 2002 Annual data report:
Atlas of end-stage renal disease in the United States, National
Institute of Health, National Institute of Diabetes and
Digestive and Kidney Disease,Bethesda,MD, 2002
5 Pennell, P., Leclercq B, Delahunty MI, Walters BA. 2006.
The utility of non-HDL in managing dyslipidemia of stage 5
chronic kidney diseases. Clin Nephrol Nov; 66(5):
336-47.
6 Abrass, C.K. 2006. Lipid metabolism and renal disease.
Contrib Nephrol.; 151:106-21.
7 Castelli, W.P., Doyle TG, Harries CG. 1977. HDL and other
lipids in coronary heart disease; the cooperative lipoprotein
phenotyping study. Circulation; 55:767-772.
8 4S: Scandinavian Simvastatin Survival Study Group. 1994.
Randomised trial of cholesterol lowering in 4444 patients
with coronary heart disease: The Scandinavian Survival Study.
Lancet; 344: 1383–1389.
9 MRC/ BHF Heart Protection Study Collaborative Group.
2002. Randomised placebo-controlled trial of cholesterol-
lowering with simvastatin in 20,536 high-risk individuals.
Lancet; 360: 7–22.
10 Becker, B.N., Himmelfarb, J., Henrich, W.L: 1997.
Reassessing the cardiac risk profile in chronic hemodialysis
patients: A hypothesis on the role of stress and other non-
traditional cardiac risk factors. J Am Soc Nephrol; 8:475–
486.
11 Bellosta, S., Ferri, N., Bernini, F: 2000. Non-lipid-related
effects of statins. Ann Med; 32:164–176.
12 Seliger SL, et al. 2002. HMG-CoA reductase inhibitors are
associated with reduced mortality in ESRD patients. Kidney
Int; 61:297-304
13 Boon, N.A., Colledge, N.R., Waker, B.R., Hunter, J.A.,
Cardiovascular Disease, In: Haslett ER, Boon NA, College
NR (eds), Davidson’s principles and practice of medicine.
Churchill Living Stone, Edin Burgh, Inc. 2006; 582.
14 Hampton, J.R., Abnormalities of P waves, QRS complexes
and T waves. The ECG made easy Churchill Living Stone,
New York-Fifth edition, 1997;123
15 Otto. Ischemic cardiac disease. Text book of clinical
echocardiography, Saunders, fourth edition- 2010; 188
16 O’Connor, Simon. Examination Medicine (The
Examination). Edinburgh: Churchill Livingstone.Page
41(2009)
17 Sarnak MJ, et al. 2003. Kidney disease as a risk factor for
development of cardiovascular disease: a statement from
the American Heart Association Councils on Kidney in
Cardiovascular Disease, High Blood Pressure Research,
Clinical Cardiology, and Epidemiology and Prevention,
Hypertension ;42:1050-65.
18 Esfaye, F., Nawl, N.G., Van, N.M., 2007. Association between
body mass index and blood pressure across three population
in Africa and Asia, Journal of human hypertension ;21:
28-37.
19 Executive Summary of The Third Report of The National
Cholesterol Education Program (NCEP) Expert Panel on
Detection, Evaluation, and Treatment of High Blood
Cholesterol in Adults (Adult Treatment Panel III). JAMA
2001; 285:2486-2497.
20 Morag, N.K., Eran C, Gold B. 2002. ‘High blood triglycerides
are independent risk factors for stroke’, American Heart
Associations, Circulation; 26:6-7.
21 Friedwald, W.T., Levy RI, Fredrickson DS. 1972. Estimation
of the concentration of low-density lipoprotein cholesterol
in plasma without use of preparative ultracentrifuge. Clin
Chem; 18:499-502.
22 Altaf, A., Halim, A., Saif, I. 2007. Assesment of lipid
dysfunction in patients on maintenance hemodialysis.J Ayub
Med Coll Abbottabad; 19(4):32-36.
23 Fellstrom, B., Zannad F, Schmieder R, Holdaas H, Jardine A,
Rose H, Wilpshaar W; AURORA Study Group: 2009.
Rosuvastatin and cardiovascular events in patients undergoing
haemodialysis AURORA study. NEJM; 360:1395-407.
24 Wanner, C., Krane V, März W, et al, for the German Diabetes
and Dialysis Study Group. 2005. Atorvastatin in patients
with type 2 diabetes mellitus undergoing hemodialysis. N
Engl J Med; 353:238-248.
25 Niepen, Juiz de Fora. 2008. Intermittent doses of statin in
hemodialysis patients with spontaneous low LDL cholesterol
levels. Arq. Bras. Cardiol.;90:1-13.
26 Longenecker, J.C., Coresh J, Powe NR, Levey AS, Fink NE,
Martin A, Klag MJ: 1994. Traditional cardiovascular disease
risk factors in dialysis patients compared with the general
population: The CHOICE Study. J Am Soc Nephrol; 13:
1918–1927.
27 United States Renal Data System: Special Study of Case Mix
Severity IV: 1992.Comorbid conditions and correlations with
mortality risk among 3,399 incident hemodialysis patients.
Am J Kidney Dis; 20: 32–38.
28 United States Renal Data System: IV. 1997.The USRDS
Dialysis Morbidity and Mortality Study (DMMS): Wave 2.
United States Renal Data System. Am J Kidney Dis; 30:
S67–S85.
30
Bangladesh Renal Journal Vol. 3, No. 1, January 2021

29 Foley, R.N., Parfrey PS, Harnett JD, Kent GM, Martin CJ,
Murray DC, Barre E: 1995. Clinical and echocardiographic
disease in patients starting end-stage renal disease therapy.
Kidney Int ;47: 186–192.
30 Levin, A., Singer J, Thomson CR, Ross H, Lewis M: 1996.
Prevalent left ventricular hypertrophy in the predialysis
population: identifying opportunities for intervention. Am
J Kidney Dis.; 27: 347-354.
31 Alam, M.R., Khanam, A., Alam, K.S., Muqueet, M.A.,
Islam, S., Rashid, H.U. 2004. Prevalence of co-morbidity
in hemodialysis patients. Bangladesh Renal Journal; 23:56-
60
32 Mason, N.A., Baillie GR, Satayathum S, et al. 2005. HMG-
coenzyme a reductase inhibitor use is associated with mortality
reduction in hemodialysis patients. Am J Kidney Dis; 45:
119-126
31
Effect of Atorvastatin on Lipid and Cardiovascular Events in Patients on Maintenance Hemodialysis M Arshad Ul Azim et al
Introduction:
Amyloidosis refers to a variety of conditions where in
normally soluble proteins become insoluble and are
deposited in the extracellular space of various
organs or tissues, disrupting normal function. It is a rare
disease. The overall incidence in United States is 1 out of
10000 people. Common age group is 60-70 years and male
affects twice than female. (Stephen J et al 2008) The
spectrum of renal symptoms and sign in amyloidosis is
variable such as isolated proteinurea, nephrotic syndrome,
hypertension, hypotension and renal insufficiency.
(Vanderhem &Van Rijswjik; GertzMA 1992) Renal
amyloidosis is confirmed by histopathological examination
of renal tissue.(Laura 2006) Amyloidosis is a rare disease
so we present here this case.
Case Report:
Mrs. Beauty, 38 years old lady non diabetic, non
hypertensive hailing from Rampal, Bagerhat admitted into
Nephrology department, Dhaka Medical College Hospital
on 12.03.2013 through outpatient department with the
complaints of swelling of whole body for six months which
first appeared on the face then legs and became generalized
Case Reports
A Middle Age Women with Amylodosis and
Nephrotic Syndrome – A Case ReportMd. Abdullah Al Mamun1, Md. Bellal Hossain2, Farzana Hafiz3, Sayed Mahbub Murshed4, Ratan Das Gupta5
Abstract:
Amyloidosis is a rare disease. It can affects various organ. Common and important presentation of renal amyloidosis is nephritic
syndrome. Proper history, clinical examination, laboratory investigations including renal biopsy and histopathological
examination is mandatory to diagnose renal amyloidosis. We have experienced a middle aged lady who has developed nephrotic
syndrome as part of renal amyloidosis.
Key Words: Amyloidosis, Nephrotic Syndrome, Renal Biopsy, Congo-Red stain.
During this period her urine volume & colour was normal.
Patient gives no history of fever, cough. respiratory
distress , chest pain, palpitation, joint pain, skin rash,
morning stiffness, cold intolerance, bowel alteration, sore
throat, jaundice, hematemesis, melaena or taking any
NSAID prior to swelling of body.
She was diagnosed as a case of abdominal TB at initial
period of her illness after admission in a tertiary level
hospital and had taken anti TB drugs (category 1) for 6
months. Her previous hospital records on which basis
anti TB had been started was not available during
admission at nephrology department .
She has two sons and two daughters. All of them are in
sound health. Both of her parents are alive and with good
health.
On examination- she was puffy, mildly anaemic, moderately
edematous, non icteric, pulse 96 beats/min, blood pressure
110/70 mm of Hg, JVP- not raised. Respiratory rate 14/min.
Breath sound vesicular . Liver was palpable which was
about 2 cm, firm in consistency, non tender, smooth
surface, upper border of liver dullness was right 5th
intercostal space . Conscious level was normal. All cranial
1. Assistant Registrar, Shaheed Suhrawardy Medical College Hospital
2. Medical Officer, mymensingh Medical College Hospital
3. Specialist, Square Hospital, Dhaka.
4. Assistant Professor, Shaheed Suhrawardy Medical College.
5. Associate professor and Head, Department of Nephrology, Shaheed Suhrawardy Medical College.
Address of correspondence : Dr. Md. Abdullah Al Mamun, Assistant Registrar, Shaheed Suhrawardy Medical College Hospital
(Bang. Renal J. 2021; 3(1): 32-35)
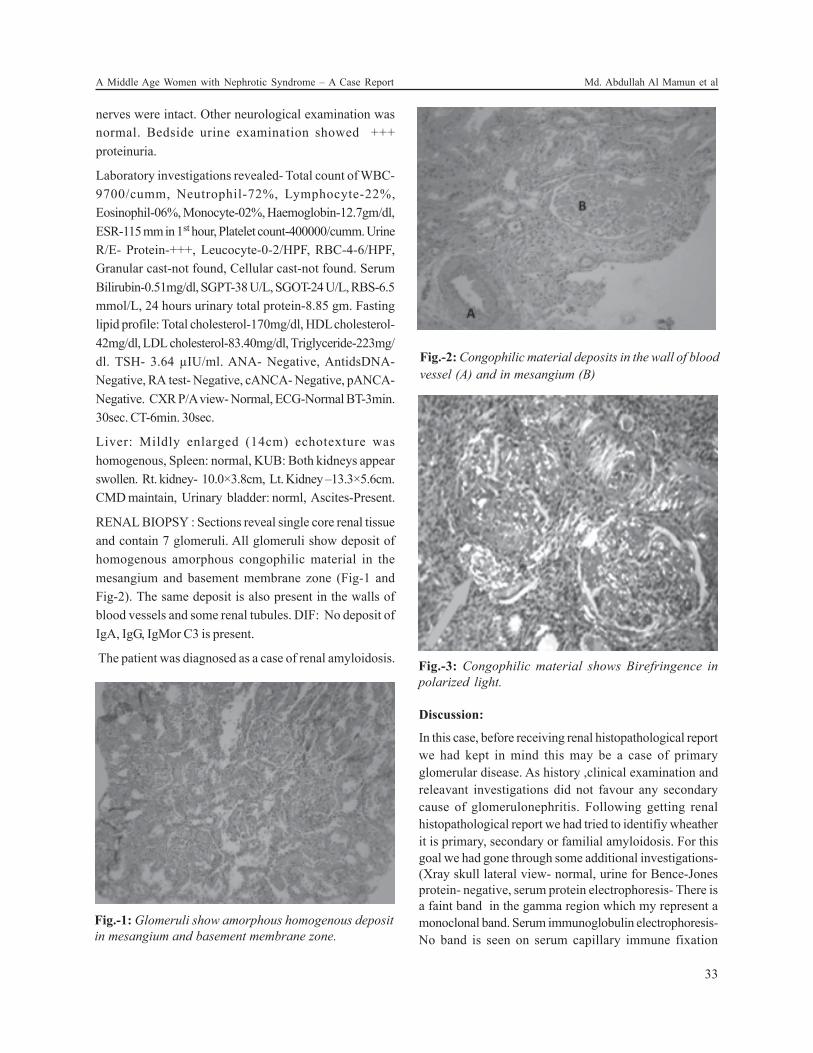
nerves were intact. Other neurological examination was
normal. Bedside urine examination showed +++
proteinuria.
Laboratory investigations revealed- Total count of WBC-
9700/cumm, Neutrophil-72%, Lymphocyte-22%,
Eosinophil-06%, Monocyte-02%, Haemoglobin-12.7gm/dl,
ESR-115 mm in 1st hour, Platelet count-400000/cumm. Urine
R/E- Protein-+++, Leucocyte-0-2/HPF, RBC-4-6/HPF,
Granular cast-not found, Cellular cast-not found. Serum
Bilirubin-0.51mg/dl, SGPT-38 U/L, SGOT-24 U/L, RBS-6.5
mmol/L, 24 hours urinary total protein-8.85 gm. Fasting
lipid profile: Total cholesterol-170mg/dl, HDL cholesterol-
42mg/dl, LDL cholesterol-83.40mg/dl, Triglyceride-223mg/
dl. TSH- 3.64 µIU/ml. ANA- Negative, AntidsDNA-
Negative, RA test- Negative, cANCA- Negative, pANCA-
Negative. CXR P/A view- Normal, ECG-Normal BT-3min.
30sec. CT-6min. 30sec.
Liver: Mildly enlarged (14cm) echotexture was
homogenous, Spleen: normal, KUB: Both kidneys appear
swollen. Rt. kidney- 10.0×3.8cm, Lt. Kidney –13.3×5.6cm.
CMD maintain, Urinary bladder: norml, Ascites-Present.
RENAL BIOPSY : Sections reveal single core renal tissue
and contain 7 glomeruli. All glomeruli show deposit of
homogenous amorphous congophilic material in the
mesangium and basement membrane zone (Fig-1 and
Fig-2). The same deposit is also present in the walls of
blood vessels and some renal tubules. DIF: No deposit of
IgA, IgG, IgMor C3 is present.
The patient was diagnosed as a case of renal amyloidosis.
Discussion:
In this case, before receiving renal histopathological report
we had kept in mind this may be a case of primary
glomerular disease. As history ,clinical examination and
releavant investigations did not favour any secondary
cause of glomerulonephritis. Following getting renal
histopathological report we had tried to identifiy wheather
it is primary, secondary or familial amyloidosis. For this
goal we had gone through some additional investigations-
(Xray skull lateral view- normal, urine for Bence-Jones
protein- negative, serum protein electrophoresis- There is
a faint band in the gamma region which my represent a
monoclonal band. Serum immunoglobulin electrophoresis-
No band is seen on serum capillary immune fixation
Fig.-1: Glomeruli show amorphous homogenous deposit
in mesangium and basement membrane zone.
Fig.-2: Congophilic material deposits in the wall of blood
vessel (A) and in mesangium (B)
Fig.-3: Congophilic material shows Birefringence in
polarized light.
33
A Middle Age Women with Nephrotic Syndrome – A Case Report Md. Abdullah Al Mamun et al
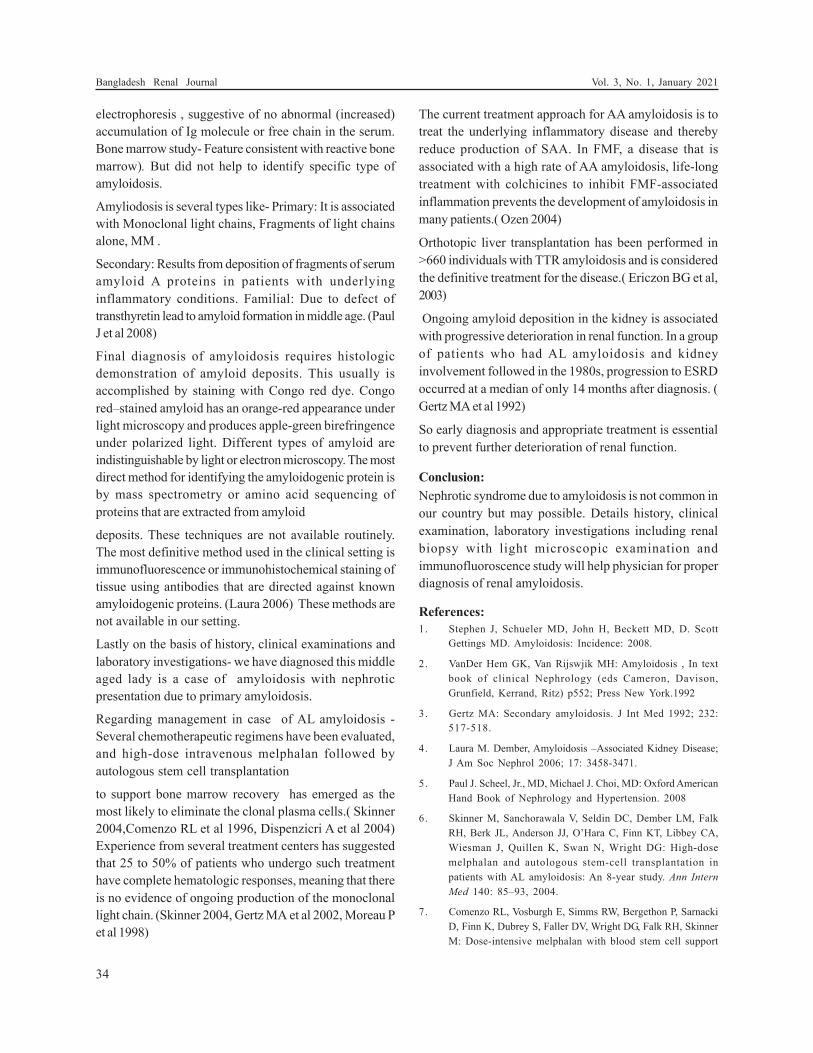
electrophoresis , suggestive of no abnormal (increased)
accumulation of Ig molecule or free chain in the serum.
Bone marrow study- Feature consistent with reactive bone
marrow). But did not help to identify specific type of
amyloidosis.
Amyliodosis is several types like- Primary: It is associated
with Monoclonal light chains, Fragments of light chains
alone, MM .
Secondary: Results from deposition of fragments of serum
amyloid A proteins in patients with underlying
inflammatory conditions. Familial: Due to defect of
transthyretin lead to amyloid formation in middle age. (Paul
J et al 2008)
Final diagnosis of amyloidosis requires histologic
demonstration of amyloid deposits. This usually is
accomplished by staining with Congo red dye. Congo
red–stained amyloid has an orange-red appearance under
light microscopy and produces apple-green birefringence
under polarized light. Different types of amyloid are
indistinguishable by light or electron microscopy. The most
direct method for identifying the amyloidogenic protein is
by mass spectrometry or amino acid sequencing of
proteins that are extracted from amyloid
deposits. These techniques are not available routinely.
The most definitive method used in the clinical setting is
immunofluorescence or immunohistochemical staining of
tissue using antibodies that are directed against known
amyloidogenic proteins. (Laura 2006) These methods are
not available in our setting.
Lastly on the basis of history, clinical examinations and
laboratory investigations- we have diagnosed this middle
aged lady is a case of amyloidosis with nephrotic
presentation due to primary amyloidosis.
Regarding management in case of AL amyloidosis -
Several chemotherapeutic regimens have been evaluated,
and high-dose intravenous melphalan followed by
autologous stem cell transplantation
to support bone marrow recovery has emerged as the
most likely to eliminate the clonal plasma cells.( Skinner
2004,Comenzo RL et al 1996, Dispenzicri A et al 2004)
Experience from several treatment centers has suggested
that 25 to 50% of patients who undergo such treatment
have complete hematologic responses, meaning that there
is no evidence of ongoing production of the monoclonal
light chain. (Skinner 2004, Gertz MA et al 2002, Moreau P
et al 1998)
Orthotopic liver transplantation has been performed in
>660 individuals with TTR amyloidosis and is considered
the definitive treatment for the disease.( Ericzon BG et al,
2003)
Ongoing amyloid deposition in the kidney is associated
with progressive deterioration in renal function. In a group
of patients who had AL amyloidosis and kidney
involvement followed in the 1980s, progression to ESRD
occurred at a median of only 14 months after diagnosis. (
Gertz MA et al 1992)
So early diagnosis and appropriate treatment is essential
to prevent further deterioration of renal function.
Conclusion:
Nephrotic syndrome due to amyloidosis is not common in
our country but may possible. Details history, clinical
examination, laboratory investigations including renal
biopsy with light microscopic examination and
immunofluoroscence study will help physician for proper
diagnosis of renal amyloidosis.
References:
1. Stephen J, Schueler MD, John H, Beckett MD, D. Scott
Gettings MD. Amyloidosis: Incidence: 2008.
2. VanDer Hem GK, Van Rijswjik MH: Amyloidosis , In text
book of clinical Nephrology (eds Cameron, Davison,
Grunfield, Kerrand, Ritz) p552; Press New York.1992
3. Gertz MA: Secondary amyloidosis. J Int Med 1992; 232:
517-518.
4. Laura M. Dember, Amyloidosis –Associated Kidney Disease;
J Am Soc Nephrol 2006; 17: 3458-3471.
5. Paul J. Scheel, Jr., MD, Michael J. Choi, MD: Oxford American
Hand Book of Nephrology and Hypertension. 2008
6. Skinner M, Sanchorawala V, Seldin DC, Dember LM, Falk
RH, Berk JL, Anderson JJ, O’Hara C, Finn KT, Libbey CA,
Wiesman J, Quillen K, Swan N, Wright DG: High-dose
melphalan and autologous stem-cell transplantation in
patients with AL amyloidosis: An 8-year study. Ann Intern
Med 140: 85–93, 2004.
7. Comenzo RL, Vosburgh E, Simms RW, Bergethon P, Sarnacki
D, Finn K, Dubrey S, Faller DV, Wright DG, Falk RH, Skinner
M: Dose-intensive melphalan with blood stem cell support
34
Bangladesh Renal Journal Vol. 3, No. 1, January 2021
The current treatment approach for AA amyloidosis is to
treat the underlying inflammatory disease and thereby
reduce production of SAA. In FMF, a disease that is
associated with a high rate of AA amyloidosis, life-long
treatment with colchicines to inhibit FMF-associated
inflammation prevents the development of amyloidosis in
many patients.( Ozen 2004)
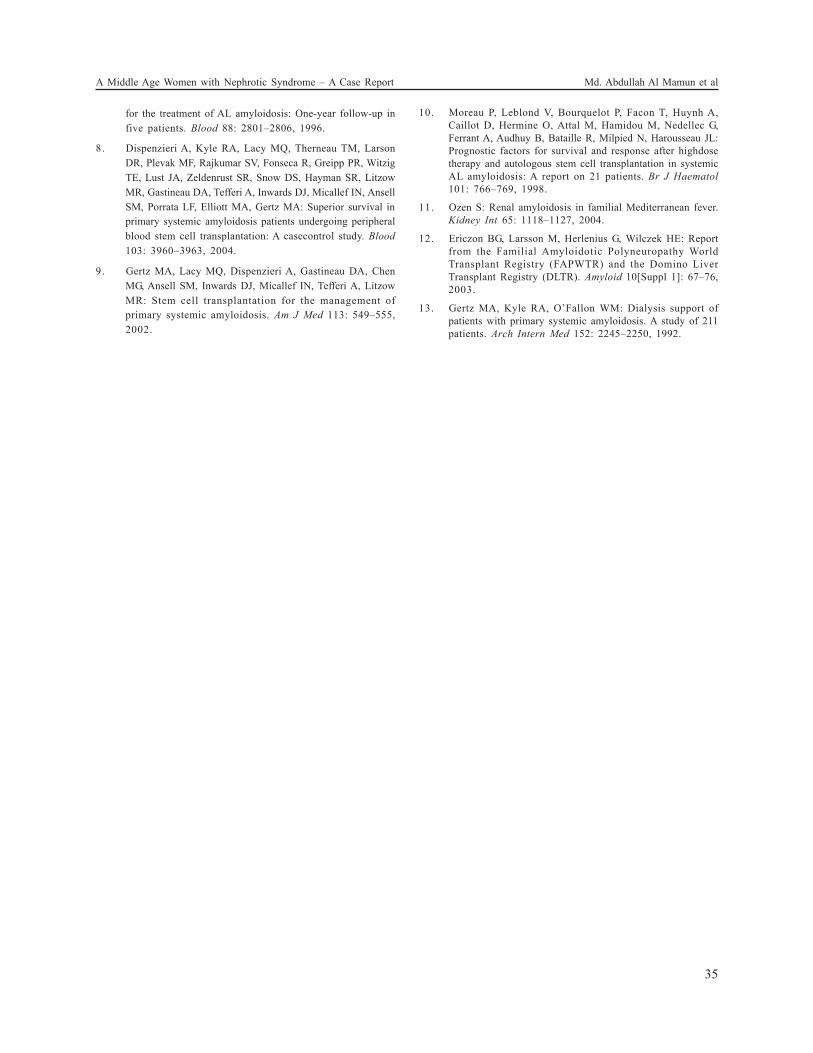
for the treatment of AL amyloidosis: One-year follow-up in
five patients. Blood 88: 2801–2806, 1996.
8. Dispenzieri A, Kyle RA, Lacy MQ, Therneau TM, Larson
DR, Plevak MF, Rajkumar SV, Fonseca R, Greipp PR, Witzig
TE, Lust JA, Zeldenrust SR, Snow DS, Hayman SR, Litzow
MR, Gastineau DA, Tefferi A, Inwards DJ, Micallef IN, Ansell
SM, Porrata LF, Elliott MA, Gertz MA: Superior survival in
primary systemic amyloidosis patients undergoing peripheral
blood stem cell transplantation: A casecontrol study. Blood
103: 3960–3963, 2004.
9. Gertz MA, Lacy MQ, Dispenzieri A, Gastineau DA, Chen
MG, Ansell SM, Inwards DJ, Micallef IN, Tefferi A, Litzow
MR: Stem cell transplantation for the management of
primary systemic amyloidosis. Am J Med 113: 549–555,
2002.
10. Moreau P, Leblond V, Bourquelot P, Facon T, Huynh A,
Caillot D, Hermine O, Attal M, Hamidou M, Nedellec G,
Ferrant A, Audhuy B, Bataille R, Milpied N, Harousseau JL:
Prognostic factors for survival and response after highdose
therapy and autologous stem cell transplantation in systemic
AL amyloidosis: A report on 21 patients. Br J Haematol
101: 766–769, 1998.
11. Ozen S: Renal amyloidosis in familial Mediterranean fever.
Kidney Int 65: 1118–1127, 2004.
12. Ericzon BG, Larsson M, Herlenius G, Wilczek HE: Report
from the Familial Amyloidotic Polyneuropathy World
Transplant Registry (FAPWTR) and the Domino Liver
Transplant Registry (DLTR). Amyloid 10[Suppl 1]: 67–76,
2003.
13. Gertz MA, Kyle RA, O’Fallon WM: Dialysis support of
patients with primary systemic amyloidosis. A study of 211
patients. Arch Intern Med 152: 2245–2250, 1992.
35
A Middle Age Women with Nephrotic Syndrome – A Case Report Md. Abdullah Al Mamun et al
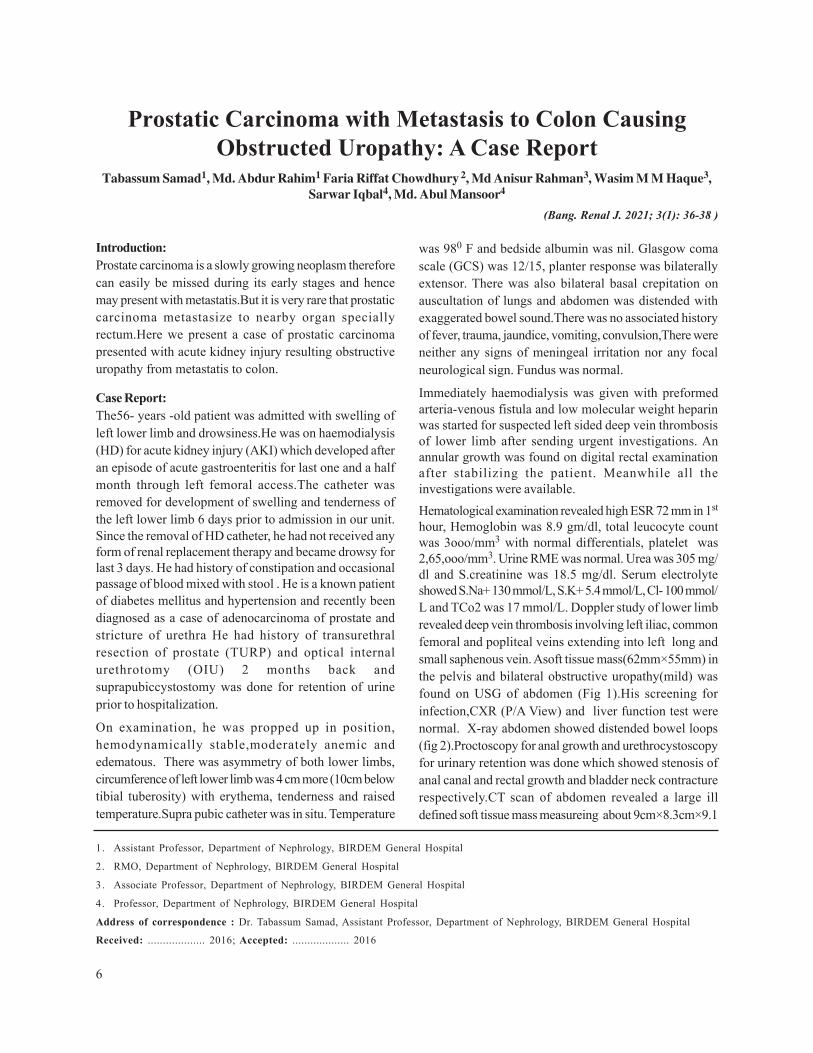
Prostatic Carcinoma with Metastasis to Colon Causing
Obstructed Uropathy: A Case ReportTabassum Samad1, Md. Abdur Rahim1 Faria Riffat Chowdhury 2, Md Anisur Rahman3, Wasim M M Haque3,
Sarwar Iqbal4, Md. Abul Mansoor4
1. Assistant Professor, Department of Nephrology, BIRDEM General Hospital
2. RMO, Department of Nephrology, BIRDEM General Hospital
3. Associate Professor, Department of Nephrology, BIRDEM General Hospital
4. Professor, Department of Nephrology, BIRDEM General Hospital
Address of correspondence : Dr. Tabassum Samad, Assistant Professor, Department of Nephrology, BIRDEM General Hospital
Received: ................... 2016; Accepted: ................... 2016
Introduction:
Prostate carcinoma is a slowly growing neoplasm therefore
can easily be missed during its early stages and hence
may present with metastatis.But it is very rare that prostatic
carcinoma metastasize to nearby organ specially
rectum.Here we present a case of prostatic carcinoma
presented with acute kidney injury resulting obstructive
uropathy from metastatis to colon.
Case Report:
The56- years -old patient was admitted with swelling of
left lower limb and drowsiness.He was on haemodialysis
(HD) for acute kidney injury (AKI) which developed after
an episode of acute gastroenteritis for last one and a half
month through left femoral access.The catheter was
removed for development of swelling and tenderness of
the left lower limb 6 days prior to admission in our unit.
Since the removal of HD catheter, he had not received any
form of renal replacement therapy and became drowsy for
last 3 days. He had history of constipation and occasional
passage of blood mixed with stool . He is a known patient
of diabetes mellitus and hypertension and recently been
diagnosed as a case of adenocarcinoma of prostate and
stricture of urethra He had history of transurethral
resection of prostate (TURP) and optical internal
urethrotomy (OIU) 2 months back and
suprapubiccystostomy was done for retention of urine
prior to hospitalization.
On examination, he was propped up in position,
hemodynamically stable,moderately anemic and
edematous. There was asymmetry of both lower limbs,
circumference of left lower limb was 4 cm more (10cm below
tibial tuberosity) with erythema, tenderness and raised
temperature.Supra pubic catheter was in situ. Temperature
was 980 F and bedside albumin was nil. Glasgow coma
scale (GCS) was 12/15, planter response was bilaterally
extensor. There was also bilateral basal crepitation on
auscultation of lungs and abdomen was distended with
exaggerated bowel sound.There was no associated history
of fever, trauma, jaundice, vomiting, convulsion,There were
neither any signs of meningeal irritation nor any focal
neurological sign. Fundus was normal.
Immediately haemodialysis was given with preformed
arteria-venous fistula and low molecular weight heparin
was started for suspected left sided deep vein thrombosis
of lower limb after sending urgent investigations. An
annular growth was found on digital rectal examination
after stabilizing the patient. Meanwhile all the
investigations were available.
Hematological examination revealed high ESR 72 mm in 1st
hour, Hemoglobin was 8.9 gm/dl, total leucocyte count
was 3ooo/mm3 with normal differentials, platelet was
2,65,ooo/mm3. Urine RME was normal. Urea was 305 mg/
dl and S.creatinine was 18.5 mg/dl. Serum electrolyte
showed S.Na+ 130 mmol/L, S.K+ 5.4 mmol/L, Cl- 100 mmol/
L and TCo2 was 17 mmol/L. Doppler study of lower limb
revealed deep vein thrombosis involving left iliac, common
femoral and popliteal veins extending into left long and
small saphenous vein. Asoft tissue mass(62mm×55mm) in
the pelvis and bilateral obstructive uropathy(mild) was
found on USG of abdomen (Fig 1).His screening for
infection,CXR (P/A View) and liver function test were
normal. X-ray abdomen showed distended bowel loops
(fig 2).Proctoscopy for anal growth and urethrocystoscopy
for urinary retention was done which showed stenosis of
anal canal and rectal growth and bladder neck contracture
respectively.CT scan of abdomen revealed a large ill
defined soft tissue mass measureing about 9cm×8.3cm×9.1
6
(Bang. Renal J. 2021; 3(1): 36-38 )
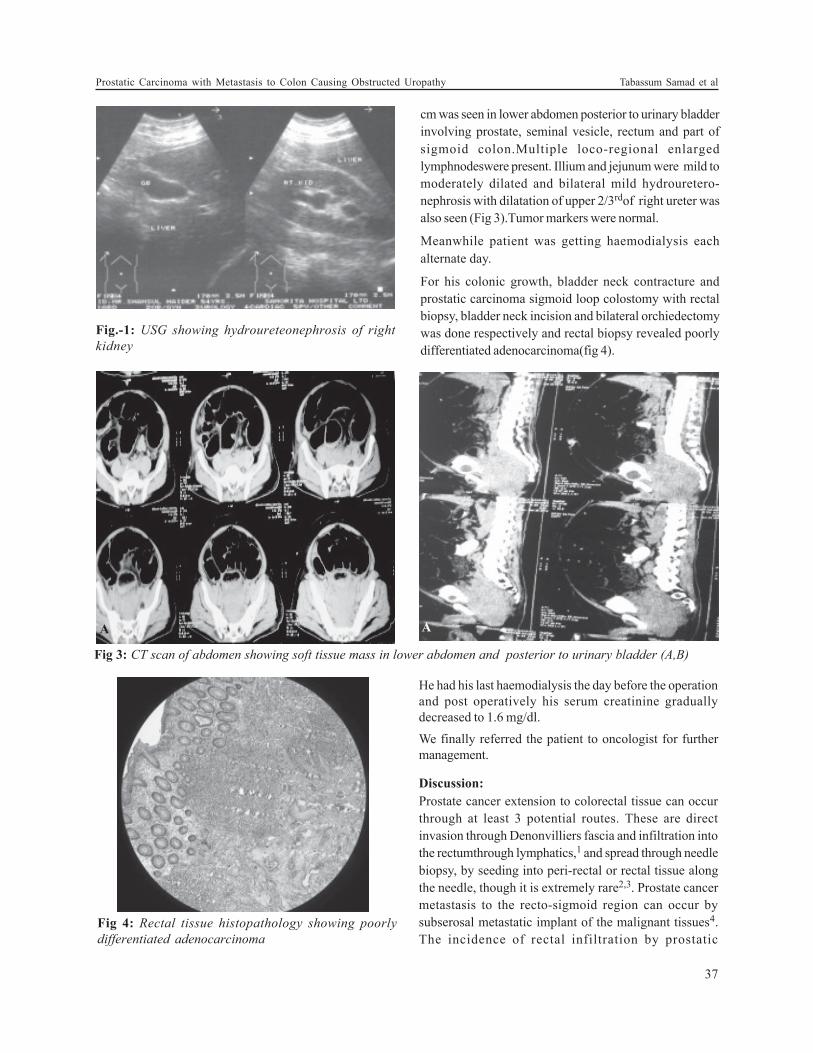
Fig.-1: USG showing hydroureteonephrosis of right
kidney
cm was seen in lower abdomen posterior to urinary bladder
involving prostate, seminal vesicle, rectum and part of
sigmoid colon.Multiple loco-regional enlarged
lymphnodeswere present. Illium and jejunum were mild to
moderately dilated and bilateral mild hydrouretero-
nephrosis with dilatation of upper 2/3rdof right ureter was
also seen (Fig 3).Tumor markers were normal.
Meanwhile patient was getting haemodialysis each
alternate day.
For his colonic growth, bladder neck contracture and
prostatic carcinoma sigmoid loop colostomy with rectal
biopsy, bladder neck incision and bilateral orchiedectomy
was done respectively and rectal biopsy revealed poorly
differentiated adenocarcinoma(fig 4).
Fig 3: CT scan of abdomen showing soft tissue mass in lower abdomen and posterior to urinary bladder (A,B)
Fig 4: Rectal tissue histopathology showing poorly
differentiated adenocarcinoma
A A
He had his last haemodialysis the day before the operation
and post operatively his serum creatinine gradually
decreased to 1.6 mg/dl.
We finally referred the patient to oncologist for further
management.
Discussion:
Prostate cancer extension to colorectal tissue can occur
through at least 3 potential routes. These are direct
invasion through Denonvilliers fascia and infiltration into
the rectumthrough lymphatics,1 and spread through needle
biopsy, by seeding into peri-rectal or rectal tissue along
the needle, though it is extremely rare2,3. Prostate cancer
metastasis to the recto-sigmoid region can occur by
subserosal metastatic implant of the malignant tissues4.
The incidence of rectal infiltration by prostatic
37
Prostatic Carcinoma with Metastasis to Colon Causing Obstructed Uropathy Tabassum Samad et al
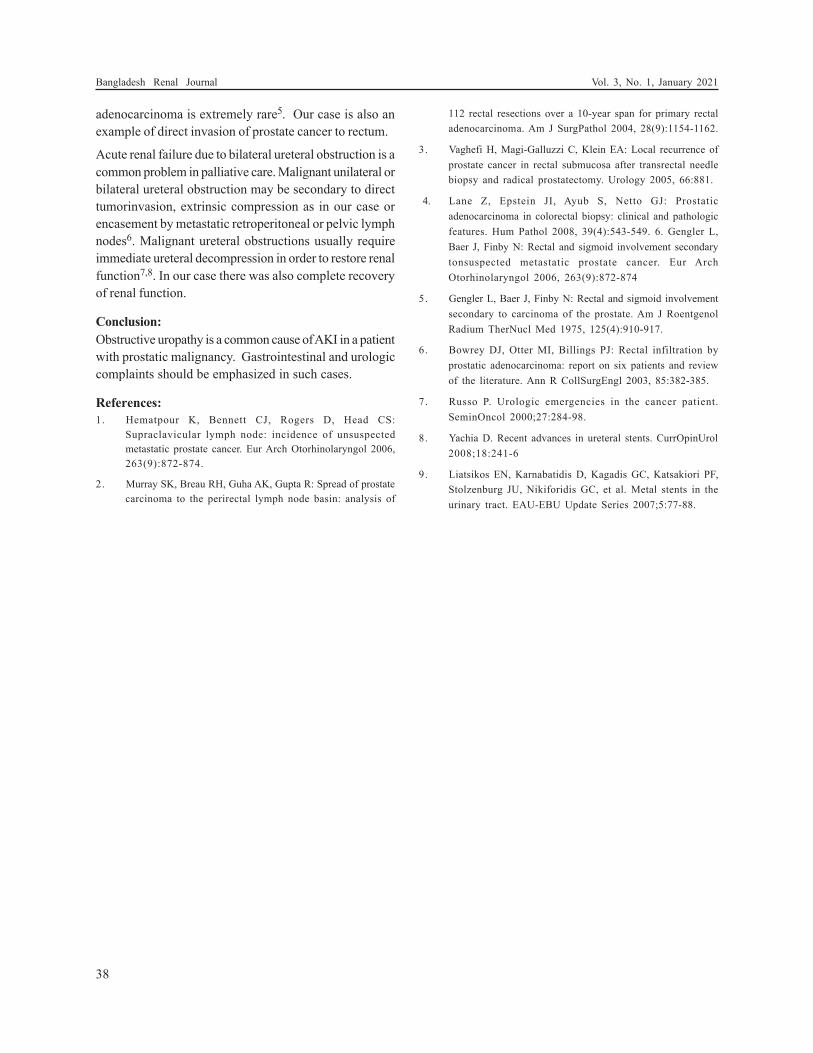
adenocarcinoma is extremely rare5. Our case is also an
example of direct invasion of prostate cancer to rectum.
Acute renal failure due to bilateral ureteral obstruction is a
common problem in palliative care. Malignant unilateral or
bilateral ureteral obstruction may be secondary to direct
tumorinvasion, extrinsic compression as in our case or
encasement by metastatic retroperitoneal or pelvic lymph
nodes6. Malignant ureteral obstructions usually require
immediate ureteral decompression in order to restore renal
function7,8. In our case there was also complete recovery
of renal function.
Conclusion:
Obstructive uropathy is a common cause of AKI in a patient
with prostatic malignancy. Gastrointestinal and urologic
complaints should be emphasized in such cases.
References:
1. Hematpour K, Bennett CJ, Rogers D, Head CS:
Supraclavicular lymph node: incidence of unsuspected
metastatic prostate cancer. Eur Arch Otorhinolaryngol 2006,
263(9):872-874.
2. Murray SK, Breau RH, Guha AK, Gupta R: Spread of prostate
carcinoma to the perirectal lymph node basin: analysis of
112 rectal resections over a 10-year span for primary rectal
adenocarcinoma. Am J SurgPathol 2004, 28(9):1154-1162.
3. Vaghefi H, Magi-Galluzzi C, Klein EA: Local recurrence of
prostate cancer in rectal submucosa after transrectal needle
biopsy and radical prostatectomy. Urology 2005, 66:881.
4. Lane Z, Epstein JI, Ayub S, Netto GJ: Prostatic
adenocarcinoma in colorectal biopsy: clinical and pathologic
features. Hum Pathol 2008, 39(4):543-549. 6. Gengler L,
Baer J, Finby N: Rectal and sigmoid involvement secondary
tonsuspected metastatic prostate cancer. Eur Arch
Otorhinolaryngol 2006, 263(9):872-874
5. Gengler L, Baer J, Finby N: Rectal and sigmoid involvement
secondary to carcinoma of the prostate. Am J Roentgenol
Radium TherNucl Med 1975, 125(4):910-917.
6. Bowrey DJ, Otter MI, Billings PJ: Rectal infiltration by
prostatic adenocarcinoma: report on six patients and review
of the literature. Ann R CollSurgEngl 2003, 85:382-385.
7. Russo P. Urologic emergencies in the cancer patient.
SeminOncol 2000;27:284-98.
8. Yachia D. Recent advances in ureteral stents. CurrOpinUrol
2008;18:241-6
9. Liatsikos EN, Karnabatidis D, Kagadis GC, Katsakiori PF,
Stolzenburg JU, Nikiforidis GC, et al. Metal stents in the
urinary tract. EAU-EBU Update Series 2007;5:77-88.
38
Bangladesh Renal Journal Vol. 3, No. 1, January 2021
INSTRUCTION FOR AUTHORS
Renal Association Journal appears twice in a year and it
publishes original articles, review articles, clinical
communications, recent advances in renal diseases and
letters to the editors. The editors reserve the right to select
from submitted manuscripts and the right of stylistic
changes or abridgements. The manuscripts may not be
offered elsewhere for printing and publication; following
acceptance, the publisher acquires all copywright.
MANUSCRIPTS
Only scientific papers written in English will be accepted.
Restriction to the essential is recommended. Original
papers should normally not exceed 16 type- written pages
including tables, illustration and references. The
arrangement of the paper should include summary,
introduction materials and methods, results and
discussion. Each section being clearly marked. The
manuscripts must be type-written on a white paper, on
one side of the sheet only and double spaced on
consecutively numbered pages. Figures and illustrations,
tables. captions, references, summary (15-20) lines and
acknowledgement are to be submitted on separate paper.
The caption should be brief and should not represent a
duplication of information provided in the text.
STYLE
Abbreviations and symbols of chemical terms must be in
conformity with the regulation as published in J. Biol.
Chem. 241-527, 1966. Spelling should conform to chambers
twentieth century dictionary. Drugs should be spelt out
when first used in the text. Scientific measurements should
be given in SL. units, Followed, in the text by traditional
units in parentheses.
Any statistical method used should be detailed in the
method section of the paper.
CITATION
The authors name should be listed in the text with year,
examples (Merrill, 1965, Gabrel and Margan, 1976) For 3 or
more authors (Oreagan et al. 1979).
REFERENCES
References should be limited. Only paper quoted in the
text are to be listed in the bibliography. The references
should be numbered consecutively as it appear in text and
listed at the end of the article as in index Medicus.
Examples :
I. PAPERS PUBLISHED IN JOURNALS
Patel R, Mickey MR and Tersaki PI : Leucocyte
antigens and disease. Association of HLA A2 and
chronic glomerulonephritis. Br Med J 1969; 2 : 424-
426.
II. ARTICLE IN BOOKS
Peters DK, and Lechmann PJ : The complement
system in renal disease, In; Renal diseases (ED) DAK
Black and NF Jones Oxford. Blackwell, 1976, P-169-
384.
III. BOOKS
Grindley MF: Manual of histologic and special
staining Nephrologic, Elammarion, Paris, 1965.
ABBREVIATIONS
Angstrom A
body surface area BSA
body weight body wt.
centimeter cm
celius C
complement components C1,C2,C3
Correlation coefficient r
creatinine clearance Ccr.
curie (s) Ci
Equivalents Eq
Fahrenheit F
BANGLADESH RENAL JOURNAL(A Journal of continuing education in kidney diseases)
Glomerular fitration rate GFR
gram (s) g
Grams per cent g/100mi
half-time tf1/2
hour (s) hr
inch inch
International Unit (s) IU
Intramuscular im.
intraperioneal i.p.
intravenous i.v.
inulin clearance Cln
Kilogram (s) Kg
liter (s) L
meter (s) or milli m
microns (s) or micro µ
milligram (s) per cent mg/100ml
minute (s) min
molar M
mole (s) mole (s)
Molecular weight molwt
nanogram (s) (millimicrogram) ng
nanoliter (s) (millimicroliter) nl
normal (concentration) N
not significant NS
optical density OD
osmole (s) Osm
probability P
second (s) sec
standard deviation SD
standard error SE
standard error of the mean SEM
ultraviolet UV
unit (s) U
volt V
MANUSCRIPTS SHOULD BE SUBMITTED
Address : Editorial Office, Room-407, Block-C,
Bangabandhu Sheikh Mujib Medical University,
Dhaka-1000, Bangladesh
E-mail: [email protected]
Web: www.brabd.org
40
Bangladesh Renal Journal Vol. 3, No. 1, January 2021