Embed Size (px)
Citation preview

1
The World BankThe World Bank’’s Energy Week 2004s Energy Week 20041212--18 March 2004, Washington DC, USA18 March 2004, Washington DC, USA
Bangladesh Power Sector : Bangladesh Power Sector : Present Status & Future Development PlansPresent Status & Future Development Plans
Presented by :S.M. Shamsul AlamSecretary, Power DivisionSecretary, Power Division
Ministry of Power, Energy & Mineral Resources Ministry of Power, Energy & Mineral Resources Government of the People’s Republic of Bangladesh

2
Presentation OutlinePresentation Outline
Power Sector at a glanceGovernment’s Vision & Power Sector PolicyPresent Structure of Power SectorReform & Restructuring : Measures UndertakenFuture Reform ProgramFuture Development PlanSupport from Development Partners

3
Power Sector at a glancePower Sector at a glance(As of June 2003)(As of June 2003)
GenerationGeneration
Maximum Available Generation : 3,622 MWBPDB : 2,375 MW (66%)IPP : 1,247 MW (34%)
TransmissionTransmissionTransmission line (230 kV & 132 kV lines) : 3,859 KmGrid s/s Capacity (132/33kV) : 6,995 MVA

4
Power Sector at a glance Power Sector at a glance (contd.)(contd.)
DistributionDistribution
Distribution line (33 kV, 11 kV & 0.4 kV) : 2,09,932 km
Total no. of Consumers : 7.1 million
Total no. of Village Electrified : 41,814
Access to Electricity : 32%
Per Capita Generation : 144 kWh
System Loss (T&D) : 25.69%

5
To make electricity available for all by 2020To ensure reliable and quality supply of electricityTo provide electricity at a reasonable and affordable price
Powers SectorPowers Sector’’s Visions Vision
6
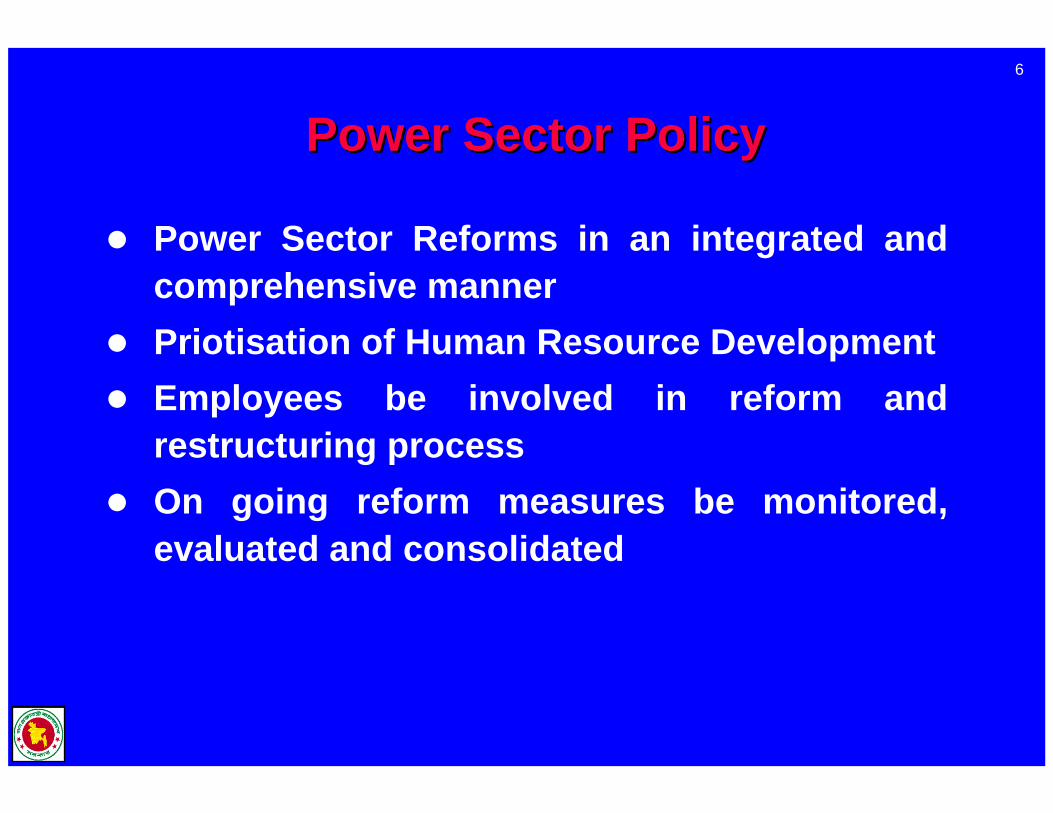
Power Sector Reforms in an integrated and comprehensive mannerPriotisation of Human Resource Development Employees be involved in reform and restructuring processOn going reform measures be monitored, evaluated and consolidated
Power Sector PolicyPower Sector Policy

7
Vertical separation according to functional areaCorporatization and commercialization Independent Energy Regulatory Commission Private Sector Participation
Power Sector Policy Power Sector Policy (contd.)(contd.)
8
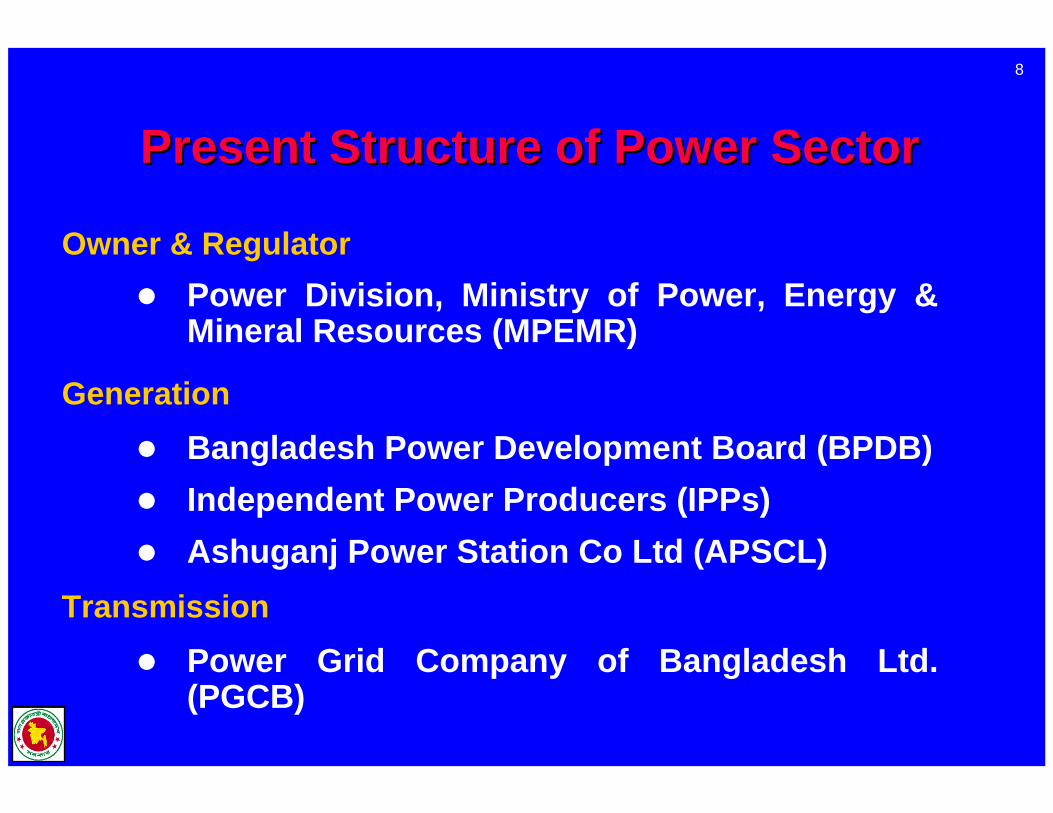
Present Structure of Power SectorPresent Structure of Power Sector
Owner & RegulatorPower Division, Ministry of Power, Energy & Mineral Resources (MPEMR)
Generation Bangladesh Power Development Board (BPDB)Independent Power Producers (IPPs)Ashuganj Power Station Co Ltd (APSCL)
Transmission Power Grid Company of Bangladesh Ltd. (PGCB)

9
Present Structure of Power Sector Present Structure of Power Sector (Contd.)(Contd.)
DistributionBangladesh Power Development Board (BPDB)Rural Electrification Board (REB)Dhaka Electricity Supply Authority (DESA)Dhaka Electric Supply Company Ltd. (DESCO)West Zone Power Distribution Co Ltd. (WZPDCL)

10
Power DivisionMPEMR
BPDB
REBDESABPDB
PGCB
IPP
DESCO
Power Cell/PMUEA&CEI
PBSs
Generation
Transmission
Distribution
Bangladesh Power Sector : Bangladesh Power Sector : Present StructurePresent Structure

11
Reform & Restructuring : Measures UndertakenReform & Restructuring : Measures UndertakenGOB undertaken Reform and Restructuring Measures to overcome constraint for development
Dhaka Electric Supply Authority (DESA) created in 1991 as part of unbundling process
Dhaka Electric Supply Company Limited (DESCO) was established in 1996 under DESA area.

12
Power Grid Company of Bangladesh Ltd. (PGCB) created in 1996Corporatization of Ashuganj Power Station implemented“West Zone Power Distribution Company”takenover distribution business of BPDB’s west zone and has started functioning
Reform & Restructuring : Reform & Restructuring : Measures Undertaken Measures Undertaken (Contd.)(Contd.)

13
Remote Area Power Supply System (RAPPS) program has been taken to provide electricity to the remote area (facilitated by Infrastructure Investment Facilitation Centre- IIFC).
Reform & Restructuring : Reform & Restructuring : Measures Undertaken Measures Undertaken (Contd.)(Contd.)

14
Under the “Private Sector Power Generation Policy” developed and adopted in 1996, about 1290 MW IPP power contracted and in operation and 1480 MW is under implementationStructured solicitation process helped Bangladesh in getting competitive power tariff
Reform & Restructuring : Reform & Restructuring : Measures Undertaken Measures Undertaken (Contd.)(Contd.)
15
“Energy Regulatory Commission Act 2003”passed in the Parliament in March 2003.Establishment of Energy Regulatory Commission is under processSupport service for the Commission under a TA project in process
Reform & Restructuring : Reform & Restructuring : Measures Undertaken Measures Undertaken (Contd.)(Contd.)

16
The extent of load shedding reduced considerably due to remarkable progress achieved
Results of Management Improvement & ReformsResults of Management Improvement & Reforms
Electrification of new villages brought a large number of rural people under electricity facility
1042 930767
400600
8001000
1200
2000-01 2001-02 2002-03
Hou
rs

17
Transmission & Distribution Loss in Transmission & Distribution Loss in last three yearslast three years
27.97%
25.69%
28.43%
2000-01 2001-02 2002-03
Syst
em L
oss

18
Collection Collection -- Import RatioImport Ratio
Commercial performance has been improved. To sustain this improvement regular monitoring is going on.
65.5977.0275.07
56.33
74.8578.86 81.76
65.3
74.2480.81 80.93
70
30405060708090
BPDB REB DESA DESCO
In %
2000-01 2001-02 2002-03

19
Comparative Statement of last three years fund Comparative Statement of last three years fund allocation and expenditure of the development projects allocation and expenditure of the development projects
396.44323.37359.32 324.75
398.64311.36
0
100
200
300
400
500
2000-01 2001-02 2002-03
Mill
ion
US$
Allocation Expenditure

20
Comparative Statement of fund allocation in the Comparative Statement of fund allocation in the generation, transmission & distribution subgeneration, transmission & distribution sub--sectorsector
In general investment is required 50% for generation, 15% for transmission & 35% for distribution sub-sector. From the above graph it seen that comparatively less amount of investment is made in the generation sub-sector. For reliable and uninterrupted power supply balance development is required for the power sector and hence it is essential to increase the investment in the generation sub-sector.
23%
18%
59%
Generation Transmission Distribution

21
Future Reform ProgramFuture Reform ProgramGenerationGeneration
Bangladesh Power Development Board (BPDB) be converted into a holding company under companies Act
The existing generating stations of BPDB be converted into a number of corporatized entity under BPDB holding companyDirect Foreign Investment will be encouraged
New power plants be setup under Joint Venture, Commercial Bank loan, Own financing and fund collection from Stock Exchange alongside IPPs.

22
Future Reform Program Future Reform Program (contd.)(contd.)
TransmissionTransmission
PGCB will remain responsible for transmission business in the whole of Bangladesh
DistributionDistributionBPDB distribution segment be converted into a number of subsidiary companies under BPDB Holding CompanyDESA be converted into a corporatized entityPalli Bidyut Samities will mainly continue its business in the distribution areas but at the same time will have their own generation to meet growing demand under Rural Electrification Board
23
Future Reform Program Future Reform Program (contd.)(contd.)
Industry & Market StructureIndustry & Market StructurePower Sector will be fully restructured and commercialized
Market imperfection will be removed
Fully competitive market will be established
Multiple/Copetitive pool market structure will be established

24
Future Reform Program Future Reform Program (contd.)(contd.)
Industry & Market StructureIndustry & Market Structure (contd.)(contd.)Private sector participation will be dominant
Utilities will be self-sustained
ERC will be fully functional and establish a competitive power market
An Independent System Operator (ISO) will be established for economic/merit order dispatch of electricity

25
Future Development PlanFuture Development Plan
Based on techno economic analysis and least cost option
Includes balanced development in generation, transmission and distribution system to achieve desired level of reliability of supply
Short Term (upto 2007), Medium Term (upto 2012) and Long Term (upto 2020) Development Plan prepared
Within Short Term Plan, priority projects for immediate donor assistance also prepared

26
Future Development Plan at a glanceFuture Development Plan at a glance
Description 2003 2007 2012 2020
1. Installed Capacity (MW) 4710 6716 9840 17500
2. Peak Demand (MW) 3622 5368 7887 14600
3. Net Generation (MkWh) 18458 26651 39157 79250
4. Transmission Line (km) 3859 5966 9281 139215. Grid Substation Capacity
230/132 kV (MVA) 3700 7270 12520 21284132/33 kV (MVA) 6995 9162 12719 19078

27
Future Development PlanFuture Development Plan at a glance (Cont.)at a glance (Cont.)
Description 2003 2007 2012 2020
6. Distribution Line (km) 209932 266962 346173 519259
7. Nos of Consumers (ml) 7.1 9.0 12.5 24.30
8. No. of Village Electrified 41814 51900 63400 84000
9. Per Capita Generation (kWh) 144 190 260 470
10. Access to Electricity 32% 47% 65% 100%
11. Investment Requirement - 3.60 4.50 7.00(bl US$) (2004-07) ( 2008-12) (2013-20)

28
Generation sub-sector
About 3,000 MW capacity to be added
Public Sector - 2000 MW
Private Sector - 1000 MW
About 1.6 billion US$ requiredPrivate Sector - 0.5 billion US$ Development Partners - 0.7 billion US$Govt. & Utilities - 0.4 billion US$
Support from Development Partners : Support from Development Partners : Short Term (Short Term (upto upto 2007)2007)

29
Transmission sub-sectorAbout 2,000 KM transmission line to be constructedAbout 0.8 billion US$ required out of which
Foreign part - 0.6 billion US$Local part - 0.2 billion US$
Distribution sub-sectorAbout 60,000 KM distribution line to be constructed
About 1.2 billion US$ required out of which
Foreign part - 0.75 billion US$ Local part - 0.45 billion US$
Support from Development Partners : Support from Development Partners : Short Term (Short Term (uptoupto 2007) (Contd.)2007) (Contd.)

30
Electricity demandPeak demand--7,900 MW
Generation capacity to be added (from 2008-2012)Installed capacity--9,850 MW
Capacity to be added--3,210 MW
Transmission capacity to be added (from 2008 to 2012)Transmission line :3,300 Km
Grid sub-station capacity(132/33 kV):3,560 MVA
About 79,000 Km Distribution Lineto be Constructed (from 2008 to 2012)
Support from Development Partners : Support from Development Partners : Mid Term Mid Term (upto 2012)(upto 2012)

31
Support from Development Partners : Support from Development Partners : Mid Term Mid Term ((uptoupto 2012) (contd.)2012) (contd.)
Total additional investment requirement--US$4.5 b
Investment allocation
Generation--US$2.2 b
Transmission--US$0.8 b
Distribution--US$1.5 b
Expected sources of financing
Private sector--2.5 b
Development Partners--1.2 b
GOB & other sources--0.8 b

32
Support from Development Partners : Support from Development Partners : Long Term Long Term (upto 2020)(upto 2020)
Electricity demand (from 2013-2020)Peak demand--14,600 MW
Installed capacity--17,500 MW
Capacity to be added--7,000 MW
Adequate addition of transmission & distribution system to be developed

33
Support from Development Partners : Support from Development Partners : Long Term Long Term ((uptoupto 2020)(contd.)2020)(contd.)
Total investment requirement--US$7.0 b
Expected sources of financingPrivate sector--4.0 b
Government of Bangladesh--1.0 b
Development Partners--2.0 b
Investment allocationGeneration--3.2 b
Transmission--1.3 b
Distribution--2.5 b

34
It is expected that the strategies adopted by the Government for power sector development, immediate support of the Development Partners and active participation of the Private Sector all together would realize the vision of the Government with regard to Power Sector Development.

35
RE Program RE Program in in
BangladeshBangladesh

36
EMERGENCE OF RE PROGRAMEMERGENCE OF RE PROGRAM
Electricity Access – Constitutional RightPower Development Board (PDB) – Earlier sole agency for electrification in country.Recognized Need – Electrify rural area to improved socio-economic condition of rural people & agricultural production.Feasibility study (USAID – Funded) - 1976

37
ESTABLISHMENT OF RURAL ESTABLISHMENT OF RURAL ELECTRIFICATION BOARD (REB)ELECTRIFICATION BOARD (REB)
SHAHEED PRESIDENT ZIAUR RAHMAN ESTABLISHED REB IN 1977 THROUGH A PRESIDENTIAL ORDINANCE.
REB WORKS UNDER THE POWER DIVISION OF THE MINSTRY OF POWER, ENERGY & MINERAL RESOURCES.

38
COMPOSITION OF THE BOARD COMPOSITION OF THE BOARD
THE BOARD CONSISTS OF A CHAIRMAN AND FOUR FULL TIME MEMBERS.IN ADDITION THERE ARE FOUR PART TIME MEMBERS WHO ATTEND BOARD MEETINGS PART TIME MEMBERS KEEP LIASION WITH THEIR RESPECTIVE ORGANIZATION.PART TIME MEMBERS ARE FROM:-- BANGLADESH POWER DEVELOPMENT BOARD (BPDB)- BANGLADESH AGRICULTURAL DEVELOPMENT CORPORTION (BADC).- BANGLADESH SMALL AND COTTAGE INDUSTRIES RPORATION(BSCIC).- BANGLADESH RURAL DEVELOPMENT BOARD (BRDB).THE BOARD IS A BODY CORPORATE WITH PERPETUAL SUCCESSION.THE CHAIRMAN AND FOUR FULL TIME MEMBERS ARE APPOINTED BY THE GOVT.
39
FUNCTIONS OF REBOrganization & formation of PBSs.
Nomination of members of first board of Director of PBSs.
Arrange fund for lending to PBSs.
Construct distribution networks and sub-stations to hand-over to PBSs for operation and maintenance.
Set standards for all activities, materials and construction administration.
Contd.

40
FUNCTIONS OF REBFUNCTIONS OF REB
Provide technical assistance in operation & maintenance of PBSs.
Assist PBSs in its tariff fixation study.
Assist PBSs for selection of employees/officers.
Provide training to PBS employees & officers.
Set annual targets in key performance area of PBS.
Contd.

41
FUNCTIONS OF PBSFUNCTIONS OF PBS
Consumer connection .Sub-station & line maintenance.Consumer complain handling.Decide on line extension.Motivate people.Purchase & sale of electricity.Tariff setting in consultation with REB.

42
REBREB--PBS RELATIONSHIPPBS RELATIONSHIP
REB develops PBSs, provide loan for PBS plant construction, construct line & sub-stations and hand over those to PBS for operation.
REB advise, guide & assist PBS in all maters, protects PBS from all adversaries.
REB set agreed performance standards & targets for PBS and intervenes when PBS fails to attain.
Contd.

43
REBREB--PBS RELATIONSHIPPBS RELATIONSHIP
PBS Purchase & sale power, payback REB loan, make diligent effort to attain performance target agreed with REB.
PBS mobilize public opinion to protect interest of rural consumers & PBS.
Educate people in safe & productive used of electricity.

44ACHIEVEMENTACHIEVEMENT(December, 2003)(December, 2003)
No. of PBS - 67 Nos.Upazilas Covered - 433 Nos.Planned to Cover Upazila - 25 Nos.No. of Electrified Village - 39,664 Nos.Line Constructed - 1,64,361 Kms.Total Consumer - 50,77,365 Nos.
Domestic : 42,76,281 Nos.Commercial : 5,76,842 Nos.Industry : 90,921 Nos.Irrigation : 1,21,715 Nos.Others : 11,606 Nos.
Bill Collection - 98.01%System Loss - 15.14%Peak Demand - 1200 MW

45
Consumers Connected since inception to the last FY25
972
6812
6
1084
91
1538
21
1969
26
2693
08
3253
38
3961
15
4955
65
6103
30
7089
62
7984
41
9305
99
1174
571
1398
926
1661
510
2005
380
2379
202
2891
647
3395
721 40
5836
2 4708
488
0
500000
1000000
1500000
2000000
2500000
3000000
3500000
4000000
4500000
5000000
1981
-82
1982
-83
1983
-84
1984
-85
1985
-86
1986
-87
1987
-88
1988
-89
1989
-90
1990
-91
1991
-92
1992
-93
1993
-94
1994
-95
1995
-96
1996
-97
1997
-98
1998
-99
1999
-00
2000
-01
2001
-02
2002
-03
Financial Year
No.
of C
onsu
mer
s(C
umul
ativ
e)

46System Loss since Inception to the last FY
28.8
222
.62
21.1
8
20.6
1
21.6
3
20.2
3
19.1
6
18.3
3
16.8
2
16.2
7
15.7
2
15.5
9
15.4
5
15.0
4
15.1
715
.82
16.8
0 18.8
1
16.2
4
18.0
8
16.6
1
17.3
3
5
10
15
20
25
30
3519
81-8
2
1982
-83
1983
-84
1984
-85
1985
-86
1986
-87
1987
-88
1988
-89
1989
-90
1990
-91
1991
-92
1992
-93
1993
-94
1994
-95
1995
-96
1996
-97
1997
-98
1998
-99
1999
-00
2000
-01
2001
-02
2002
-03
(Financial Year)
(%)
System loss of 60 PBSs is only 14.01%. Due to recent taken-over of huge lines & consumers from PDB/DESA, system loss of the remaining 7 PBSs (Munshigonj PBS, Narsingdi PBS-1, Narsingdi PBS–2, Manikgonj PBS,Brahmanbaria PBS, Mymensingh PBS–2 and Dhaka PBS–2) is 22.52%.

47
Bill Collection since Inception to the last FY
97.909896979695 9498959997.4998.27
93.3999.79
99.8699.01
99.7697
101
50556065707580859095
100105110115120
1984
-85
1985
-86
1986
-87
1987
-88
1988
-89
1989
-90
1990
-91
1991
-92
1992
-93
1993
-94
1994
-95
1995
-96
1996
-97
1997
-98
1998
-99
1999
-00
2000
-01
2001
-02
2002
-03
(Financial Year)
(%)

48
Line Constructed since inception to the last FY
138
2315 2622
1965
2040 24
15
4635
4665 5030
4202
5327
5039
3528
5198
7280
8803 97
49 1017
6
1046
7
9505
1140
8 1298
9 1462
1
1600
2
100110021003100410051006100710081009100
1010011100121001310014100151001610017100
1979
-80
1980
-81
1981
-82
1982
-83
1983
-84
1984
-85
1985
-86
1986
-87
1987
-88
1988
-89
1989
-90
1990
-91
1991
-92
1992
-93
1993
-94
1994
-95
1995
-96
1996
-97
1997
-98
1998
-99
1999
-00
2000
-01
2001
-02
2002
-03
Financial Year
Line
Con
stru
cted
(km
)

49
Donor Contribution in RE ProgrammeTotal Foreign Assistance so far Received by REB = 1250.27 Million US$
210.
96
123.
73
92.5
8
79.9
8
74.7
1
58.0
0
49.7
0
29.2
1
25.5
0
23.6
0
23.0
2
20.0
0
19.0
0
5.73
1.08
413.
47
0.00
50.00
100.00
150.00
200.00
250.00
300.00
350.00
400.00
450.00
500.00ID
A
USA
ID
ADB JBIC
KFA
ED
Neth
erla
nds
CIDA
NORA
D
IDB
SFD
OPE
C
FINL
AND
S
Chin
a Ba
rter
JDRG
SAUD
I Gov
t.
FRA
NCE
Name of Donor
Mill
ion
US$

50
TOTAL INVESTMENTTOTAL INVESTMENT(Million Taka)(Million Taka)
L.C. 36570.00F.E. 28730.00 (Eq.1200 US$ million)
Total 65300.00 (Eq.3000 US$ million)

51
World Bank assistance (Running)World Bank assistance (Running)Rural Electrification and Rural Electrification and
Renewable Energy Development ProjectRenewable Energy Development Project
Project Data :
a) Loans/Credits Amount (US$) : IDA 190.98 Million + GEF 8.2 Million
b) Project Implementation Period : FY 2003-2008
Financial Plan (Milion US$ )
(a) GOB(b) IDA(c) Local Communities(d) GEF
Total
:::::
Local Foreign Total
92.34 0.00 92.3412.61 178.37 190.986.78 0.00 6.781.20 7.00 8.20
112.93 185.37 298.30

52
World Bank assistance (Running)World Bank assistance (Running)Rural Electrification and Rural Electrification and
Renewable Energy Development ProjectRenewable Energy Development Project
Indicators At Start At Mid-Term At Completion
New Consumer 0 300000 500000
New Distribution Line 0 4000 10000
System in Loss in handed over areas
50% 18% 16%
No. of PBS financial viability
15 PBSs 25 PBSs 40-45 PBSs
Institution of Solar Home System
100 4000 14000
Project Output :

53
Problems & ChallengesProblems & Challenges
1. Cost Consideration 2. Revenue Per KM. 3. Accessibility 4. Poor Consumer Mix5. Need Capital

54
THANK YOUTHANK YOU

SCALINGSCALING UP ENERGY UP ENERGY ACCESSACCESS
ChallengesChallenges and Possible Solutions: and Possible Solutions: The Ghanaian PerspectiveThe Ghanaian Perspective
ByByFrancis GbeddyFrancis Gbeddy

Presentation OutlinePresentation Outline
IntroductionIntroductionChallengesChallengesSolutions & InterventionsSolutions & InterventionsConcluding StatementConcluding Statement
IntroductionIntroduction
Access to modern energy means making Access to modern energy means making energy available at energy available at prices that are prices that are affordableaffordable (i.e. prices low enough for the (i.e. prices low enough for the poorest) and poorest) and at the same time at the same time sustainablesustainable (i.e. prices that service (i.e. prices that service providers can recover operational costs and providers can recover operational costs and also maintain and develop the service to also maintain and develop the service to keep it going).keep it going).

ChallengesChallenges
Availability of Energy ResourcesAvailability of Energy Resources::Ghana is endowed with abundant energy Ghana is endowed with abundant energy resources in various forms such as resources in various forms such as biomass, solar, wind and hydro. biomass, solar, wind and hydro.
Population: Population: About 70% of GhanaAbout 70% of Ghana’’s population is rural, s population is rural, scattered over a land area of about scattered over a land area of about 230,000 square kilometers. 230,000 square kilometers.

ChallengesChallengesPoverty Rate/Affordability:Poverty Rate/Affordability:The poverty rate in the country is very high and The poverty rate in the country is very high and this raises very serious implications for this raises very serious implications for affordability visaffordability vis--àà--vis the concerns for adopting vis the concerns for adopting sustainable interventions.sustainable interventions.
Scarcity of Financial Resources:Scarcity of Financial Resources:Massive financial resources are required for Massive financial resources are required for scaling up energy access. But this is scarce in a scaling up energy access. But this is scarce in a HIPC country like Ghana.HIPC country like Ghana.

ChallengesChallenges
Government Commitment:Government Commitment:GovernmentGovernment’’s will and commitment to s will and commitment to prioritize energy sector projects and prioritize energy sector projects and allocate resources for implementation is allocate resources for implementation is very critical for any program designed very critical for any program designed towards scaling up energy access to the towards scaling up energy access to the rural poor to be successful.rural poor to be successful.

ChallengesChallenges
Sector Reforms:Sector Reforms:Energy Sector reforms embarked upon by Energy Sector reforms embarked upon by several governments in the last decade have several governments in the last decade have essentially focused on utility efficiency essentially focused on utility efficiency improvements, infrastructure divesture and improvements, infrastructure divesture and promotion of competition in the global energy promotion of competition in the global energy market. market. The issue of scaling up energy The issue of scaling up energy access did not feature in most energy sector access did not feature in most energy sector reform strategiesreform strategies. .

ChallengesChallenges
Key Objectives of GhanaKey Objectives of Ghana’’s Power Sector Reforms Power Sector ReformCreate conditions to attract significant private Create conditions to attract significant private sector investment in the various segments of the sector investment in the various segments of the electricity supply chain; electricity supply chain; Remove the monopolistic and centralized structure Remove the monopolistic and centralized structure of power utilities and move towards creation of of power utilities and move towards creation of contestable power markets;contestable power markets;Promote transparency in the regulation of power Promote transparency in the regulation of power utilities to allow for fare competition;utilities to allow for fare competition;Increase public utility management accountability.Increase public utility management accountability.

ChallengesChallenges
The need for The need for ““Scaling up energy accessScaling up energy access””came up as an aftercame up as an after--thought in the late thought in the late nineties; but then recommendations for nineties; but then recommendations for creating an entity to be solely responsible creating an entity to be solely responsible for rural energy access did not receive for rural energy access did not receive government consent. government consent.

Solutions & InterventionsSolutions & Interventions
Open up to alternative technological choices Open up to alternative technological choices and settle for the least cost optionand settle for the least cost option; ; then the then the affordability problem can be effectively affordability problem can be effectively tackledtackled. For example, use of decentralized . For example, use of decentralized offoff--grid solar PV systems used to provide grid solar PV systems used to provide electricity services in remote areas of electricity services in remote areas of northern Ghana under the RESPRO and northern Ghana under the RESPRO and REDP projects.REDP projects.

Solutions & InterventionsSolutions & Interventions
Design sustainable rural energy access Design sustainable rural energy access schemes aimed at accelerating economic schemes aimed at accelerating economic growthgrowth to enhance the economic status of to enhance the economic status of beneficiaries. beneficiaries.
Solutions & InterventionsSolutions & Interventions
Features of successful REA programs:Features of successful REA programs:-- income generation activities;income generation activities;-- productive uses of the energy;productive uses of the energy;-- interventions for improved quality of life interventions for improved quality of life (e.g. health, education, clean water etc.)(e.g. health, education, clean water etc.)-- integrated rural development initiatives to integrated rural development initiatives to create jobs, improved communication create jobs, improved communication and and improved physical access to rural areasimproved physical access to rural areas..

Solutions & InterventionsSolutions & Interventions
Key Institutional Issues Include:Key Institutional Issues Include:Establish an entity responsible solely for Establish an entity responsible solely for implementing rural energy access programs;implementing rural energy access programs;
Clearly define governmentClearly define government’’s role as well as s role as well as those of all the other relevant agencies to those of all the other relevant agencies to avoid duplication & interference;avoid duplication & interference;

Solutions & InterventionsSolutions & Interventions
Key Institutional Issues Include:Key Institutional Issues Include:Involve private rural energy service Involve private rural energy service companies if feasible, keeping in mind companies if feasible, keeping in mind affordability;affordability;Subsidies are necessary; but design Subsidies are necessary; but design transparent subsidy mechanisms for transparent subsidy mechanisms for benefits to reach the targeted group.benefits to reach the targeted group.

Concluding StatementConcluding Statement
Energy reform efforts and strategies Energy reform efforts and strategies should give more focus to the rural should give more focus to the rural energy access problem;energy access problem; because the rural because the rural energy access problem affects a larger energy access problem affects a larger proportion (>65%) of the population in the proportion (>65%) of the population in the Africa region.Africa region. A more holistic approach to A more holistic approach to energy sector reforms is required. energy sector reforms is required. Just Just targeting the targeting the ““biggerbigger”” goals is not goals is not enoughenough..

Concluding StatementConcluding Statement
Rural Energy Access focus for Rural Energy Access focus for Energy Reforms:Energy Reforms:
Establish an entity backed by legislation to Establish an entity backed by legislation to focus solely on rural energy access.focus solely on rural energy access.
Establish a rural energy access fund backed Establish a rural energy access fund backed by legislation to provide adequate financial by legislation to provide adequate financial resources.resources.

Concluding StatementConcluding Statement
Rural Energy Access focus forRural Energy Access focus forEnergy Reforms:Energy Reforms:
Develop funding and accounting mechanisms to Develop funding and accounting mechanisms to ““ring fencering fence”” financing for rural access from routine financing for rural access from routine utility commercial operations. utility commercial operations. Move away from providing temporal solutions to Move away from providing temporal solutions to utility problems (e.g. management contracts) and utility problems (e.g. management contracts) and focus on establishing longfocus on establishing long--term viable public term viable public utilities (strategic investor participation). utilities (strategic investor participation).

1
World Bank Conference “Energy Week 2004”Washington D.C., USA
(8-12 March, 2004)
R.V. SHAHISECRETARY
MINISTRY OF POWERGOVERNMENT OF INDIA 10th March, 2004
Enhancing Electricity Access in Rural India

2
“Following a decade of energy sector reforms in many developing countries, people are increasingly beginning to question the extent to which these reforms have benefited the poor.
This question has proved difficult to answer, in part because of the absence of a framework for thinking about the issue, and in part because of a shortage of suitable data.
Yet ensuring that energy sector interventions are designed in such a way as to benefit the most vulnerable in society is important from the perspective of social equity and also because this is likely to affect the social acceptability -and hence the ultimate sustainability - of reforms.”
- World Bank publication (2003) “Infrastructure for Poor People”

3
15.6 34.883.5
130.5
238
559
1950 1960 1970 1980 1990 2002
Per Capita Consumption of Electricity in India
(kwh/ year)Growth pattern over years
3

4
1,700 4,60013,000
28,000
66,000
110,000
1950 1960 1970 1980 1990 2003
Generating Capacity - Growth over years
Installed capacity around end of the period (MW)
4
5
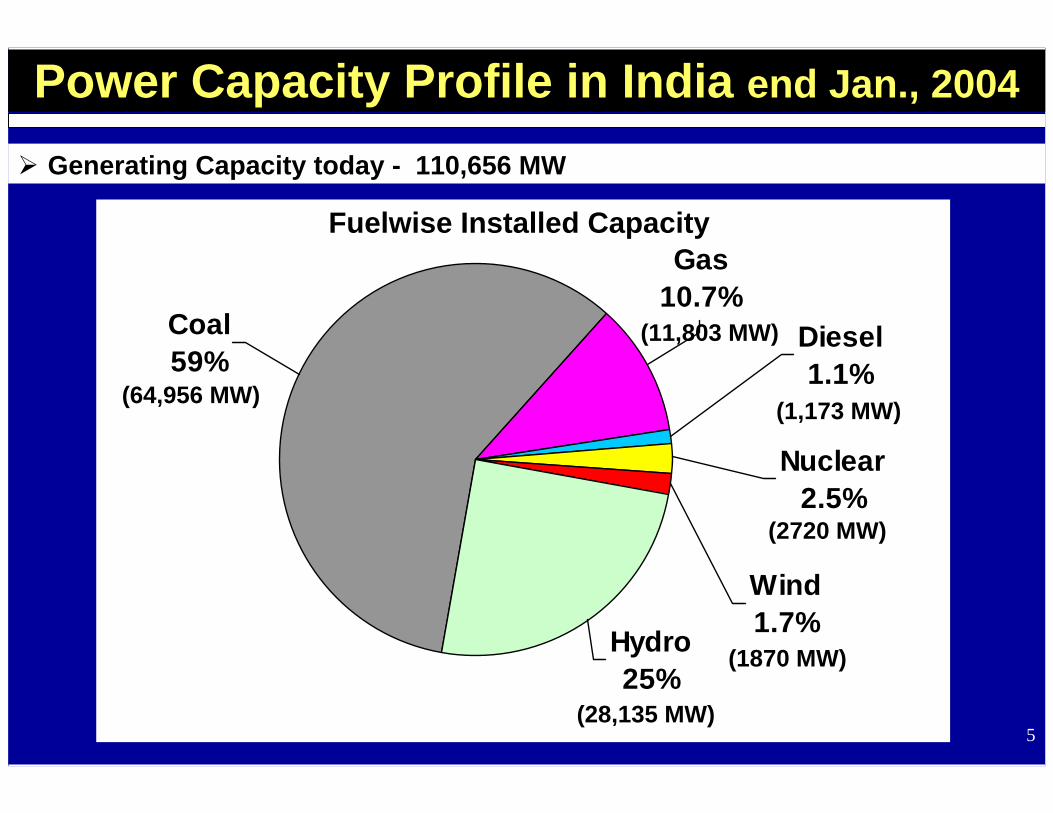
Generating Capacity today - 110,656 MW
Hydro 25%
Diesel 1.1%
Gas 10.7%
Coal 59%
Wind 1.7%
Nuclear 2.5%
Fuelwise Installed Capacity
(64,956 MW)
(11,803 MW)
(2720 MW)
(1,173 MW)
(1870 MW)
(28,135 MW)
Power Capacity Profile in India end Jan., 2004

6
Generating Capacity today - 110,656 MW
Central Sector
31%
State Sector 58%
Private Sector
11%
(64,476 MW)
(34,500 MW)
(11,680 MW)
Sectorwise Installed Capacity
Power Capacity Profile in India end Jan., 2004

7
Rural Electrification
Eight States have achieved 100% village electrification
- Andhra Pradesh, Goa, Haryana, Maharashtra, Kerala, Punjab, Tamil Nadu and Nagaland
These States constitute 18% of villages in the country
Out of estimated 586,000 villages about 120,000 remain to be electrified
7
8
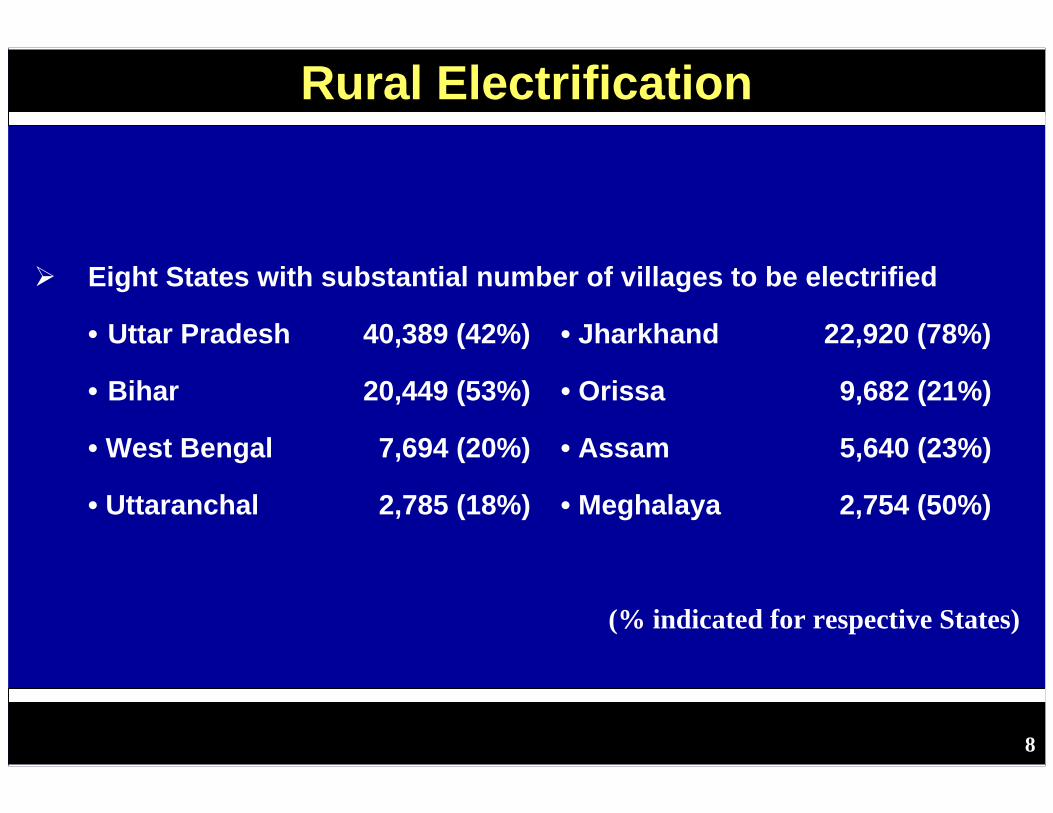
Rural Electrification
Eight States with substantial number of villages to be electrified
• Uttar Pradesh 40,389 (42%) • Jharkhand 22,920 (78%)
• Bihar 20,449 (53%) • Orissa 9,682 (21%)
• West Bengal 7,694 (20%) • Assam 5,640 (23%)
• Uttaranchal 2,785 (18%) • Meghalaya 2,754 (50%)
(% indicated for respective States)
8

9
Overall electrification in the country :Total no. of Households 138.27 million Households electrified 60.18 million (43.5%)Households yet to be electrified 78.09 million (56.5%)
Six States with more than 75% of households electrifiedHimachal Pradesh 94.5% (1,036,969)Goa 92% (130,105)Punjab 90.5% (2,482,925)Haryana 80.5% (1,926,814)Jammu & Kashmir 75% (868,341)Sikkim 75% (68,808)
States in this category constitute about 6% of country’s total rural households
Rural Households Electrification
9

10
States with 80% or more households yet to be electrified
Bihar 95% (12,010,504)
Jharkhand 90% (3,422,425)
Assam 83.5% (3,522,331)
Orissa 80.6% (6,651,135)
Uttar Pradesh 80% (16,505,786)
West Bengal 79.7% (8,899,353)
Total 51,011,534
States in this category constitute 43% of country’s total rural households
Rural Households Electrification
10

11
Mission Power availability for All by 2012Electrify all Villages by 2007Electricity access to all Households by 2012
Policy InitiativesElectricity Act 2003 to develop the electricity market structurefor meeting the challenge
ProgrammesLarge Capacity addition Expansion of National GridDistribution System strengthening Massive Rural Electrification Energy Conservation
Government’s programmes to address the challenge
11

12
The Target - Power for all by year 2012
507 545 719 975
Mar.'01(act.)
Mar.'02(act.)
Mar.'07(est.)
Mar.'12(est.)
157,107115,705
81,49278,037
Peak requirement
in MW
Energy requirement
in BU
By the year 2012, India’s peak demand would be 157,107 MW with energy requirement of 975 BU.
To meet the requirement, 212,000 MW of generating capacity would be required : thus another 100,000 MW in next eight years

13
CAPACITY ADDITIONInstalled capacity today - 110,656 MWInstalled Capacity targeted by end of FY 2007 - 145,000 MW
# Capacity addition of 41,000 MW targeted during Xth Plan period (2002-07)• 5,907 MW already Commissioned • 25,000 MW under Execution and balance is under award
Installed capacity targeted by end of FY 2012 - 212,000 MW# Capacity to be added during next Plan period(2007-12) ~ 65,000 MW
• Advance action taken - More than 40,000 MW likely to be taken up for execution in next three years
Focus on Renovation & Modernization # 74 schemes in Hydro to accrue benefit of 8,675 MU# 92 units in Thermal to accrue benefit of 21,000 MU/ yr.
• Accelerated Generation & Supply Programme (AG&SP) provides 3% subsidised loan
Programmes to meet the target
13

14
Hydro Init iat ive
R anking St ud y
Tent at ive po t ent ialPotential assessed
845 Schemes
Ranking Study of unharnessed
399 schemes
Hydro Initiative162 schemes 50,000 MW
107,000 MW
150,000 MW
50,000 MW Hydro initiativeThe elimination process :
Preliminary Feasibility Reports (PFRs) received for 98 schemes covering more than 30,000 MW
14

15
Shelf of Feasibility Report for setting up of Thermal plants with
inputs / statutory clearances in place
- Studies underway for identification of Plant locations
• Expansion of Existing stations
• Pit head stations
• Coastal sites
• Along gas pipelines
• Load Centre locations
100,000 MW Thermal initiative
15

16
Setting up of National Grid
23,500
8,0004,950
30,000
March '02 Dec.'03 March '07 March '12
Cumulative Inter Regional Transfer Capability (MW)
Programmes to meet the target
16

17
Distribution ReformsThree Dimensional Challenge• Governance• Technology Upgradation• Tariff Rationalisation
Distribution Reforms aimed atSystem upgradationLoss reduction : Aggregate Technical & Commercial losses
(at present 40-50%)Theft controlConsumer orientationCommercializationDecentralized distributed generation and supply for rural areas Introducing competitionI.T. to replace human interfaces
Programmes to meet the target
Contd. ….. 17

18
APDRP, a strong instrument for effecting improvement & reforms in sub-transmission & distribution
# APDRP has two components : Technical & hardware improvement
: Cash assistance linked to reduction in commercial losses
Turnaround plan for State Utilities
AT&C losses in majority of identified circles have started exhibiting reduction
Anti theft legislation enacted in six States
Reorganization of Power Utilities as per Electricity Act, 2003
Regulatory Commissions in place in 22 States
ACCELERATED POWER DEVELOPMENT & REFORM PROGRAMME (APDRP)
18

19
-293
.6
-72.
4
-456
.4
-273
.3
-246
.8
-97.
5
-157
.77
-245
.1 -112
.93
-188
.2
-45
-272
.2
-187
-25.
5
-64.
76
-129
.11
-206
.2
-184
.6 -93.
4
-517
.4
-10.
65
-171
.28
-5.2
2
-91.
53
A.P
.
Ass
am
Guj
arat
M.P
.
Mah
aras
htra
Har
yana
Raj
asth
an
Tam
il N
adu
U.P
.
H.P
.
Wes
t Ben
gal
Ker
ala
2000-01 2002-03
Projected Financial losses reported by States (unaudited) (Rs. in million)
APDRP : OUTCOME ON LOSS REDUCTION
19
Number of States reported loss reduction - 12
Loss reduction reported - US$ 2400 million

20
Corporatization
Privatization
Business Plan
Multi year tariff
Efficiency Improvement Path
Transition period financial support essential
TURN AROUND OF STATE UTILITIES
20

21
Potential of 23,700 MW assessed by end of FY 2012The Thrust Areas :Industry specific Task Forces constituted in Cement, Pulp & paper, Textile, Fertilizer, Chlor - Alkali and Aluminum industries These industries notified as designated consumersEnergy ManagersEnergy AuditorsRecording and publication of best practices (sectorwise) under implementation
Energy Conservation
Programmes to meet the target
21

22
Schemes for implementing Rural Electrification
Pradhan Mantri Gramodaya Yojana scheme for integrated
development of rural areas : Primary health, Education, Drinking water,
Rural Shelter, Nutrition and Rural Electrification
• States have the flexibility for sectorwise allocations
• Component of grant of 30% to even 90% for special category States
Kutir Jyoti programme for extending single point connections to the
households of rural families “Below Poverty Line”
• One time cost by way of 100% grant
Rural Electrification
Programmes to meet the target
22

23
Schemes for implementing Rural …. (contd. …)“Accelerated Rural Electrification Programme” covers electrification ofun-electrified villages & households• Provides for interest subsidy of 4%Minimum Needs Programme cover electrification of un-electrified villages with priority to least covered villages• Provision of 100% loan for the schemesRural Electricity Supply Technology Mission established to accelerate electrification of all villages and households through- Cost effective Technology options - Innovative Financing- Grass root Institutional arrangements
23

24
Accelerated Electrification of 100,000 villages & 10,000,000 households
Scope of the scheme
• Connectivity through : Grid extension
: Standalone distributed generation system based
on conventional & non conventional sources.
• Time frame : Implementation within two years
• Eligibility for execution : State Utilities / Non Governmental Organizations /
Panchayats / Institutions / Local bodies /
Franchisees/ Individuals (referred as Service
Providers)
24

25
Funding of the scheme
: Through Financial Institutions / Commercial Banks
• Micro financing at grass root level
# Funding mode : Loans / capital subsidies disbursal by FIs directly to
beneficiaries/ implementing agencies.
: Subsidies sanctioned by these FIs to be
reimbursed by the Government.
# Funding issues : Delivery price of power would be high unless
• Capital cost is subsidized
• Long term and less expensive funds are made
available
25

26
• Objective : Competition, Protection of Consumers interests & Power for all Areas
Creates liberal framework for power developmentCreates competitive environmentFacilitates private investmentDelicenses generation except for hydro : Captive free from
controlsRural Areas : Stand alone Generation and
Distribution delicencedMultiple licensing in DistributionStringent provisions for controlling theft of electricityFocus on revenue recovery in cases of unauthorized use of electricity
Electricity Act, 2003
Contd. ….. 26

27
Obliges States to restructure Electricity Boards
Mandates creation of Regulatory Commissions
• Retail tariff to be determined by regulatory commissions
Open access in Transmission from outset
Open access in Distribution to be allowed by SERCs in phases
Gradual phasing out of cross subsidies
Trading distinct activity permitted with licensing
27

28
Power Sector Reforms in India aim at :• Financial revival of the power sector • Wiping out the demand - supply mismatch• Power for All by 2012• Massive extension of electricity access in rural areas
The issues being addressed :• Transition period financial support for turnaround of State
owned Utilities • Long term and less expensive funds for Rural Electrification
Conclusions
28

29
Thank you
29

1
Rural Electrification in Vietnam
2
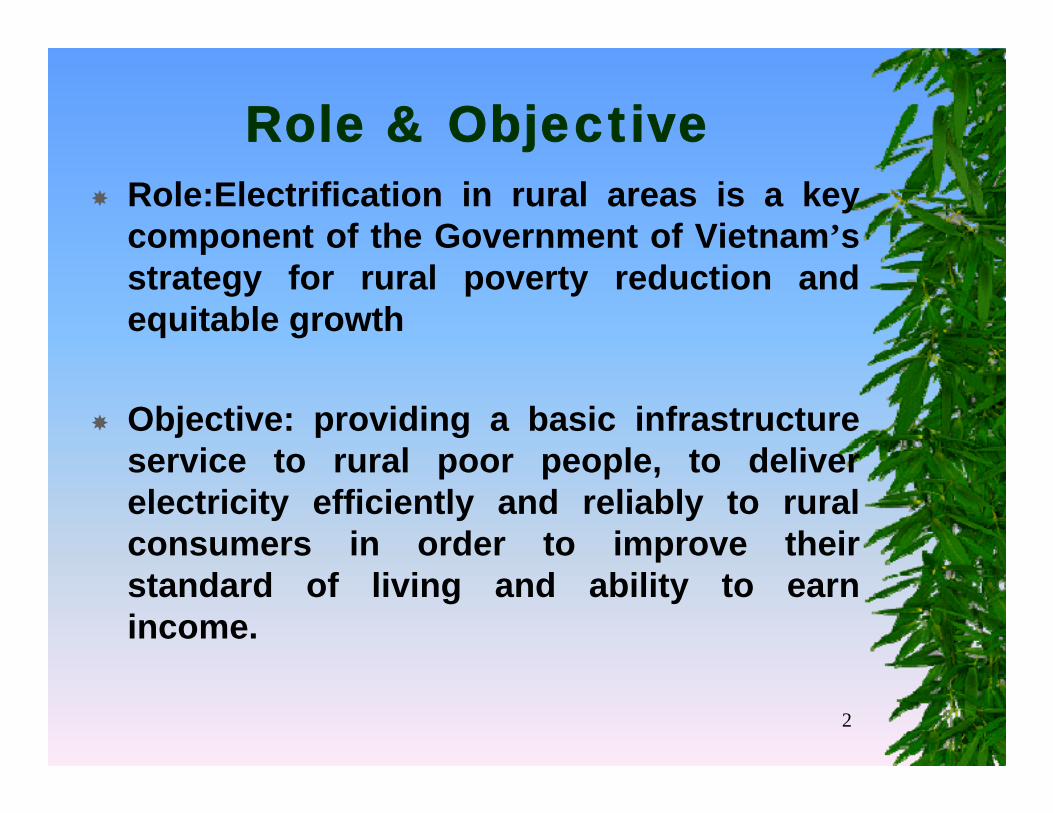
Role & ObjectiveRole:Electrification in rural areas is a key component of the Government of Vietnam’s strategy for rural poverty reduction and equitable growth
Objective: providing a basic infrastructure service to rural poor people, to deliver electricity efficiently and reliably to rural consumers in order to improve their standard of living and ability to earn income.

3
1. Rural network is infrastructure invested with the joint contributions of government, people, and locality to diversify investment method and management of power supply.
2. RE should be undertaken gradually in line with available financial resources. The provision and allocation of RE investment, maintenance service, power supply must ensure financially prudent the levels of borrowing and internal cash generation.
Gov.. Policy in Rural electrification

4
3.Maximize the involvement of local authorities, local community and local investors for investing, managing and operating rural electricity networks.
4.The costs of investment, operations, maintenance of rural electrification network should be financially recovered from electricity sales.
Gov. Policy in Rural electrification

5
5.Electricity supply for rural consumers considered as a business commercial service.
6. Subsidies should be transparent and applied only for those areas when it is deemed to be socially necessary and consistent with the objective of ensuring equitable development
Gov. Policy in Rural electrification

6
RE includes the extension of power grid and upgrading the existing rural power system. Rural electricity supply will be based on both grid-based and off-grid systems.Economic investment: Set-up criteria for selection and evaluation RE Projects. Develop a model for economic appraisal of the project communesLeast costs investment: set-up technical specification for rural electrification project
Key implementation principles

7
Cost sharing• Medium transmission lines and
transformers are invested and managed by EVN.
• Low voltage lines invested by the local Gov. fund.
• Branchments from low voltage lines to the power consumption places are invested by the consumer (households)
Key implementation principles

8
Maximize the local management• Issues license for electricity activities to
organizations, individuals operating in the distribution and supply in rural areas
Mountainous, island, remote and specially difficult areas that are unable to connect to the national power grid, or it is not economical for connecting to the national power grid shall be supply by off-grid power sources such as small hydro, diesel, solar power and other renewable energy with financial support from the government.
Key implementation principles

9
Achievement RE
In 1996Rural population without electricity 30 millionRural Households have electricity 6 millionCommunes without electricity 4000Consumption 6% of total national consumption

10
Achievement RE
In 2003Rural population without electricity 12 millionRural Households have electricity 10.1 millionCommunes without electricity 660Rural consumption: 25% of total national consumption

11
Rural Electrification in Vietnam
62.2
72.875.1
77.882.0
84.9
89.892.7
50.7
61.3 62.5
69.773.0
77.481.0
83.5
50.0
60.0
70.0
80.0
90.0
100.0
1996 1997 1998 1999 2000 2001 2002 2003
Commune Household

12
Targets for 2010
More than 95 % rural households have electricity.100% communes electrified

13
ISSUES IN RURAL GRIDS TODAY
Inadequate of ManagementLimited sources of finance Lack of investment for repair and maintenanceNeed for capital for expansion to meet growing demandsDifficulty in attracting private finance High tariffs to end-usersHeavy operating subsidies

14
ISSUES IN RURAL GRIDS TODAY
High technical losses ( 20-30%)• Long distribution lines,inadequate
conductors, substation capacity/location
Non technical losses• faulty meters, unbilled consumption
Poor supply quality and safetyMany poor not served

15
Requirements for the Further sustainable development RE
1. Create Legal&effective management structureThree basic legal models
Rural Electricity CooperativesJoint stock companyLeasing
2. Promote Incentives to mobilize finance from different sources.
3. Reduce technical and non technical losses Improve supply quality and safety: Design
16
Requirements for the Further sustainable development RE
4. Realistic prices for financial sustainability and growth. All entities who delivers electricity service to rural consumers should have an adequate financial incentives to continue in business and maintain an acceptable level of service.
5. Local management with adequate training to enable local staff to have sufficient technical and financial competence
6.Incentives for efficiency: Separate and independent accounting systems to achieve efficiency and transparency

17
Lessons learned from Rural Energy Project funded by WB
1.Strictly follow key implementation principles of Rural electrification
2. Accurate preparation for all necessary condition and steps of implementationObtain agreement with key stakeholders on basic principles underlying the operation; Provide for extensive participation with key stakeholders in project concept design; Require explicit written commitments from householders, local authorities and provincial governments;

18
Lessons learned from Rural Energy Project funded by WB
Design for local operation and management of system on completion Planning for speedy project execution designand local contracting;
Standardize the procedures, developed a common set of NCB &ICB bidding documents, a project implementation manual defining clearly who to do what and when.

19
Results from Rural Energy Project funded by WB
•750 communes connected from Dec. 2000 to Dec. 2003,remain 150 communes will be connected by end of 2004, providing electricity to 700,000.0 rural households with ~3.5 millions people•Local management are applying in the project communes, in form of Agents, JSC•A decentralized system of RE project implementation has been created• Implementing Procedures and technical specification applied in the Rural energy project becomes a standard and guidance for all other projects of the Rural Electrification Program
20
Next steps Connect the remaining communes connectible to the national gridsSupply energy to the isolated and remote communes by off-grid network using renewable energy Rehabilitate about 5000 existing communes networks that invested 15-20 years agoImprove management, O &M system in rural areas