Embed Size (px)
Citation preview

Bangladesh Economyin FY2008-09
Bangladesh Economyin FY2008-09
Centre for Policy Dialogue (CPD)
A report prepared by the CPD under the ProgrammeIndependent Review of Bangladesh's Development (IRBD)
An Interim Review of Macroeconomic Performance
Published in June 2009 by
Centre for Policy Dialogue (CPD)
House No. 40/C, Road No. 11 (new)
Dhaka 1209, Bangladesh
Telephone (8802) 8124770, 9141703, 9141734
Fax: (8802) 8130951
E-mail [email protected]
Website www.cpd.org.bd
© Centre for Policy Dialogue (CPD) 2009
The Centre for Policy Dialogue (CPD), established in 1993, is mandated by its Deed of Trust to service the growing demand
originating from the emerging civil society of Bangladesh, for a more participatory and accountable development process. CPD
seeks to address this felt need through organisation of multistakeholder consultations and dialogues, by conducting research on
issues of critical national and regional interests, through dissemination of knowledge and information on key development
issues, and by influencing the policymaking process in the country. At the core of CPD’s activities lies its dialogue programme.
The dialogues are designed to provide a forum for constructive engagement and discussion on key relevant issues, and to come
up with specific recommendations to redefine the policies and for ensuring their effective implementation. The
recommendations are then placed before current and prospective policymakers of the country as inputs to the decision making
process. CPD’s flagship research activity is the preparation of an annual Independent Review of Bangladesh's Development (IRBD).
Other CPD programmes include Trade Related Research and Policy Development (TRRPD), Investment Promotion and Enterprise
Development, Agriculture and Rural Development, Ecosystem and Environmental Studies, Human Resource Development, Gender Issues and
Social Protection, and Governance and Policy Reforms. CPD actively networks with other institutions within and outside Bangladesh
which have similar interests and also regularly participates in various regional and international fora where interests and
concerns of developing and least developed countries are discussed. CPD’s current publication list includes more than 350
titles including Books, Monographs, Occasional Papers, Dialogue Reports and Policy Briefs. CPD outputs are available for sale
at the Centre and also in selected bookstores in Bangladesh. CPD publications and other relevant information are also regularly
posted on CPD’s website www.cpd.org.bd
The CPD-IRBD team alone remains responsible for the analyses and interpretations presented in this report.
ISBN 978 984 33 0397 4
Cover and graphic design by
Avra Bhattacharjee
Typesetting and page lay-out
Fazley Rabbi Shakil
Price : Tk 230
Printed atEnrich Printers41/5 Purana Paltan, Dhaka 1000

CPD IRBD Team
Professor Mustafizur Rahman, Executive Director, CPD and Dr Debapriya Bhattacharya, Distinguished
Fellow, CPD were in overall charge of preparing this report as team leaders.
Lead contributions were obtained from Dr Uttam Deb, Head, Research Division; Dr Fahmida Khatun,
Additional Director, Research; Dr Khondaker Golam Moazzem, Senior Research Fellow; Anisatul Fatema
Yousuf, Director (Dialogue & Communication); Kazi Mahmudur Rahman, Senior Research Associate; Syed
Saifuddin Hossain, Senior Research Associate; Ashiq Iqbal, Senior Research Associate; Towfiqul Islam
Khan, Senior Research Associate; and Asif Anwar, Senior Research Associate.
Competent research assistance was received from Nafisa Khaled, Senior Research Associate; Suparna
Hasan, Senior Research Associate; Hasanuzzaman, Research Associate; Subir Kanti Bairagi, Research
Associate; Tariqur Rahman, Research Associate; Muhammad Al Amin, Research Associate; Tapas Kumar
Paul, Research Associate; Ashiqun Nabi, Research Associate; Sharmin Chowdhury, Research Associate;
Nusrat Jahan, Research Associate; Rumana Islam, Programme Associate, Nahita Nishmin, Programme
Associate, Kishore Kumer Basak, Programme Associate; and Shouro Dasgupta, Intern.
State of the Bangladesh Economy in FY202008-2009iii

Acknowledgements
The IRBD team members would like to register their deep gratitude to Professor Rehman Sobhan,
Chairman, CPD for his guidance and advice in preparing this report. The team would like to sincerely
appreciate the feedbacks and insights received from participants of the Expert Group Meeting organised
by the CPD on 6 June 2009 where an earlier draft of the paper was presented and discussed (list of
participants is Annexed). The team would also like to put on record their appreciation of the cooperation
it has received from various institutions, organisations and individuals in accessing relevant data and
information for the IRBD report.
Anisatul Fatema Yousuf, Director, CPD and colleagues at CPD's Dialogue and Communication Division and
the Administration Division of the CPD, have provided assistance in organising various meetings and
dialogues and in publication of this volume. The IRBD team members would like to acknowledge their
extremely helpful support. Avra Bhattacharjee, Senior Documentation and Publication Officer, CPD has
designed the cover of this report. His contribution was instrumental in bringing out this publication
within a very short time and in such a presentable format. Contribution of Meftaur Rahman, Chief
Publication Officer, BIDS who proof-read the paper, is also highly appreciated. The team would also like
to acknowledge the hard work put in by A H M Ashrafuzzaman, Senior System Analyst and Hamidul
Hoque Mondal, Senior Administrative Associate, CPD in preparing this manuscript for publication.
State of the Bangladesh Economy in FY202008-2009 iv
Contents
List of Tables vi
List of Figures vii
List of Acronyms viii
1. Introduction 1
2. Growth, Savings and Investment 2
3. Public Finance 6
4. Monetary Sector 12
5. Real Sector 16
6. Performance of the External Sector 26
7. Social Sector 31
8. Concluding Remarks 34
Annex 36
List of Tables
Table 1 Projected Fiscal Structure for FY2008-09 and FY2009-10 11
Table 2 Changes (%) of Monetary Sector Variables 14
Table 3 Food Import in FY2007-08 and FY2008-09 17
Table 4 Estimated per Acre Production Cost of Boro Rice in Bangladesh During the April-June 2009 Harvesting Season 18
Table 5 Status of SOEs to be Privatised 23
Table 6 Quarterly Export Growth of Bangladesh's Major Commodities (FY2008-09 vs FY2007-08, Jul - Mar) 26
Table 7 Falling Purchasing Power of Exports 28
Table 8 Disbursement of Grants and Loans, and Payments Made 30
Table 9 Sector wise ADP Allocation and Expenditure till March 2009 31
State of the Bangladesh Economy in FY202008-2009 vi
List of Figures
Figure 1 GDP Growth in Asian Countries 3
Figure 2 Sources of Incremental Growth 4
Figure 3 Savings Rate as Percentage of GDP 4
Figure 4 Investment as Percentage of GDP 5
Figure 5 Growth in NBR Revenue Collection During July-April (FY2007-08 and FY2008-09) 6
Figure 6 Performance of ADP During July-April (FY2005-06 To FY2008-09) 8
Figure 7 Reported Problems by Various Ministries 9
Figure 8 Components of Deficit Financing in FY2007-08 and FY2008-09 10
Figure 9 Growth Rate of Money Supply and Domestic Credit
Figure 10 Trends in Excess Liquidity 13
Figure 11 Movements of BDT (July 2008 - April 2009) 15
Figure 12 Real and Nominal Effective Exchange Rates (BDT with respect to USD) (July 2006 - March 2009) 15
Figure 13 Estimated Production of Foodgrains in FY2008-09 16
Figure 14 International Price of Fertilisers (Urea, DAP, TSP & MoP): July 2006 to April 2009 17
Figure 15 International Price of Whole Cream Milk Powder: July 2006 to May 2009 19
Figure 16 Production Growth in Selected Products (July-February, FY2007-08 and FY2008-09) 20
Figure 17 Changes in Advances in Services Industries 21
Figure 18 Foreign Investment in Bangladesh 21
Figure 19 Comparison of P/E Ratio 22
Figure 20 Installed Capacity, Generation of Electricity, Demand for Power and Demand-Supply Gap 24
Figure 21 Stock Price Index of Some Global Retail Stores 27
Figure 22 FOREX Reserves and Equivalent Months of Import 29
State of the Bangladesh Economy in FY202008-2009vii

Acronyms
State of the Bangladesh Economy in FY202008-2009 viii
ADB Asian Development Bank
ADP Annual Development Programme
BBS Bangladesh Bureau of Statistics
BDT Bangladesh Taka
BMET Bureau of Manpower, Employment and Training
BoP Balance of payment
BPC Bangladesh Petroleum Corporation
CCs Community Clinics
CGs Community Groups
CRR Cash Reserve Ratio
CTG Caretaker Government
DAE Department of Agriculture Extension
EDF Export Development Fund
EPZs Export prosessing zones
EU European Union
forex Foreign Exchange
GDP Gross Domestic Product
GFRP Global Food Crisis Response Program
HNPSP Health, Nutrition and Population Sector Programme
ICOR Incremental Capital-output Ratio
ILO International Labour Organization
IMF International Monetary Fund
INR Indian Rupee
IOC International Oil Company
IRS Interest Rate Spread
IT Information Technology
KHR Cambodian Riel
LKR Sri Lankan Rupee
MDG Millennium Development Goal
MMSCFD Million Standard Cubic Feet per Day
MoE Ministry of Education
MoHFW Ministry of Health and Family Welfare
MoPME Ministry of Primary and Mass Education
MTMF Medium Term Macroeconomic Framework
MW Mega Watt
State of the Bangladesh Economy in FY202008-2009ix
NBR National Board of Revenue
NEC National Economic Council
NNP National Nutrition Programme
NPL Non-Performance of Loans
PEDP Primary Education Development Programme
PFDS Public Food Distribution System
PMO Prime Minister's Office
PPP Public-Private Partnership
PRSP Poverty Reduction Strategy Paper
RADP Revised Annual Development Programme
REER Real Effective Exchange Rate
RMG Ready-made Garments
ROSC Reaching Out of School Children
RPP Rental Power Plant
SEC Securities and Exchange Commission
SEQAEP Secondary Education Quality and Access Enhancement Project
SLR Statutory Liquidity Ratio
SMEs Small and medium enterprises
SoEs State owned enterprises
TCB Trading Corporation of Bangladesh
TSP Triple Super Phosphate
UD Utilisation Declaration
US United States
VGD Vulnerable Group Development
VGF Vulnerable Group Feeding
VND Vietnamese Dong
WB World Bank
WTO World Trade Organization
INTRODUCTION
State of the Bangladesh Economy in FY2008-091
INTRODUCTION
11
The Budget for FY2009-10, expected to be presented at the session of the Bangladesh Jatyo Sangshad on
11 June 2009, comes in the backdrop of manifold challenges that the Bangladesh economy had to face in
FY2008-09. From the perspective of macroeconomic governance the current fiscal year has been unusual
on a number of counts. While the Caretaker Government (CTG) was in charge of macroeconomic
management during the first two quarters of FY2008-09, the last two quarters were managed under the
stewardship of the newly elected government. This transition in power within one single fiscal year
injected uncertainties both in terms of policy making and policy continuity, as well as with regard to
private sector investment decisions. On a different level, macroeconomic management in FY2008-09 also
became more challenging as a consequence of the high inflationary pressure on the economy during the
first few months of the year. The need to address the adverse impact of the ongoing global economic
crisis over the subsequent period of the fiscal year emerged as a new challenge confronting both the
policymakers and the private sector.
In view of the above mentioned developments, this study presents an analysis of the major
macroeconomic performance indicators of Bangladesh in FY2008-09, identifies positive achievements
and examines some of the emerging disquieting features. In this sense, the report is more of a diagnostic
nature. However, with regard to some of the more urgent challenges and the attendant tasks to be
addressed, the study has also ventured to put forward a number of policy recommendations for
consideration by the policymakers.
As was mentioned, the FY2009-10 budget will inherit an economy that has witnessed considerable
volatility over the preceding year. How has the economy fared in the context of the manifold challenges
that it has faced? How have the major macroeconomic indicators performed? What were the
demonstrated strengths, and which are the emerging problems that need to be tackled in the next year?
These are the questions that are pertinent to understanding the context in which the budget FY2009-10
is being designed and will subsequently be implemented. No doubt that it will answers to these
questions will help identify the areas where focus will need to be placed if high growth, robust
investment and fair distribution are to be achieved in the course of the next subsequent years. Various
sections of the present report attempt to address these questions by examining performance record with
regard to growth, investment and savings scenario, public finance, monetary sector, real economic
sectors, external and social sectors of the economy.
GROWTH, SAVINGS AND INVESTMENT
State of the Bangladesh Economy in FY2008-09 2
GROWTH, SAVINGS AND INVESTMENT
22
2.1 GDP Growth
Preliminary estimates prepared by Bangladesh Bureau of Statistics (BBS) report that, gross domestic
product (GDP) is expected to post a growth of 5.9 per cent during FY2008-09. If this is actually the case,
it would be the lowest GDP growth over the last five years and will be considerably less (0.62 per cent)
than the targeted growth of 6.5 per cent for FY2008-09. However, in view of the ongoing global
recession and in the context of uncertainties in domestic economy for high inflation during the early
months of FY2008-09, investors' low confidence and change of government in January 2009, this
growth rate ought to be considered as respectable. As a matter of fact, adverse factors that informed
macroeconomic performance in FY2008-09 led to considerably lower GDP growth projections of around
5.0 per cent or even lower by many quarters, including the World Bank (WB), the International
Monetary Fund (IMF) and the Asian Development Bank (ADB). However, a bumper crop harvest,
resilience of the service sector, ability to contain deceleration of export growth and sustained high
levels of remittance flow helped the economy to attain a near 6.0 per cent growth rate which is
projected for FY2008-09.
Per capita GDP of Bangladesh was likely to be about USD 621 in FY2008-09, while per capita GNI was USD
690 in FY2008-09. In taka terms (1995-96 constant prices) the projected growth would indicate a per
capita GDP growth of about 4.5 per cent in FY2008-09 over the preceding year; per capita GNI growth
was expected to be higher at 6.7 per cent (mainly thanks to remittance flow). However, it should be
noted here that these averages conceal the fact of worsening income distribution situation in
Bangladesh. An increase in incremental share of farm sector in GDP may have helped contain the rise in
income inequality seen in the past years. Nevertheless, rising inequality continue to remain a serious
problem with regional dimension of the inequality situation exacerbating the problem.
Admittedly, any slowdown of the Bangladesh economy is likely to have a knock-on impact on resource
mobilisation, poverty alleviation and employment creation. The downward revision in the projected GDP
growth for FY2008-09 (from 6.5 to 5.9 per cent) would imply that this would have adverse implications for
the number of people coming out of poverty, other things remaining the same. However, using growth
elasticity of poverty mentioned in the Poverty Reduction Strategy Paper (PRSP) II, a GDP growth of 5.9 per
cent should result in 1.8 million people coming out of poverty in FY2008-09. But, this estimation is based
on PRSP II, and it does not take into cognisance of increase in poverty incidence owing to high inflation of
the recent past. Indeed, a number of studies have indicated either deceleration in the pace of poverty
reduction (WB) on reversal of poverty reduction trends and rise in poverty levels (CPD). Following the
International Labour Organization (ILO) methodology, with 5.9 per cent growth in GDP, the
GROWTH, SAVINGS AND INVESTMENT
State of the Bangladesh Economy in FY2008-093
0
1
2
3
4
5
6
7
8
9
10
Bangladesh India Vietnam
Per
cen
tage
FY2007-08 FY2008-09
Figure 1: GDP Growth in Asian Countries
Source: BBS; Ministry of Finance, India & Ministry of Finance, Vietnam.
1Tangible sectors of the economy include Agricultural Sector (both Agriculture & Forestry and Fisheries), Mining & Quarrying and
Manufacturing. The rest of the sub-sectors are noted as Intangible.
of employment generation during FY2008-09 should be around 2.0 million. The PRSP II projected that,
during FY2009-2011, every year on average 1.8 million people would be added to the labour force.
Relatively high growth of agriculture sector perhaps had a positive impact from labour absorption
perspective; on the other hand, lower than projected GDP growth was likely to have adverse impact on
labour absorption capacity of the economy than would have been otherwise. These conjectures will need
to be tested through more in depth investigation.
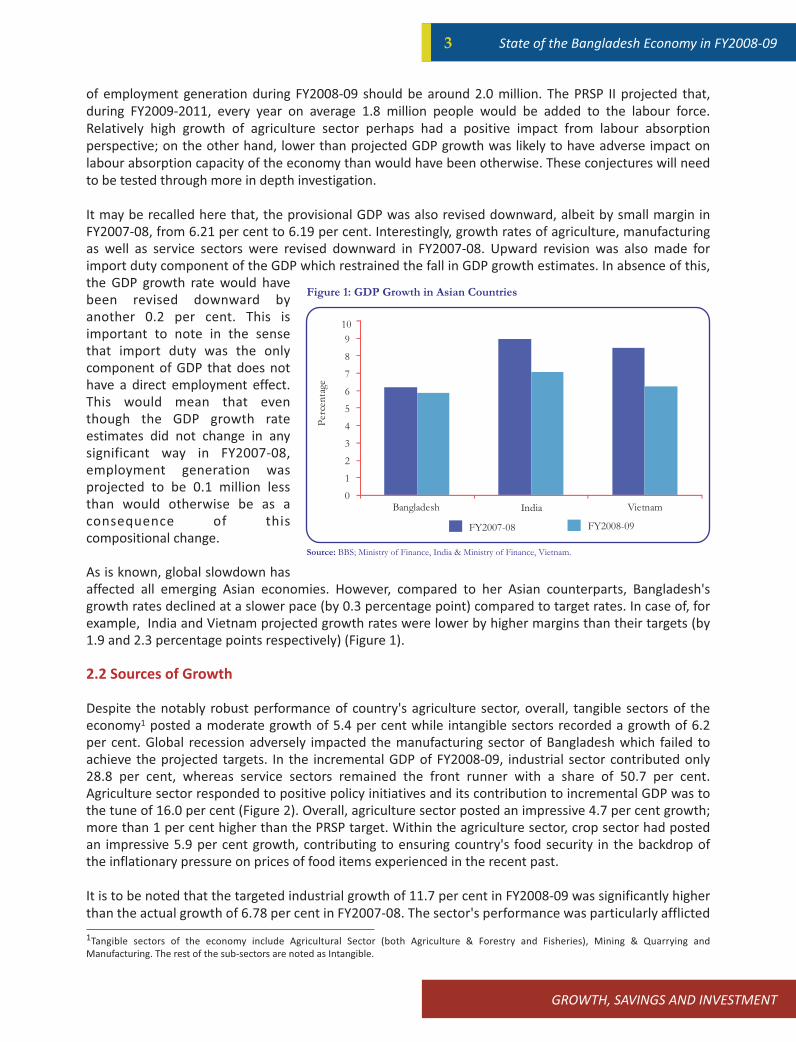
It may be recalled here that, the provisional GDP was also revised downward, albeit by small margin in
FY2007-08, from 6.21 per cent to 6.19 per cent. Interestingly, growth rates of agriculture, manufacturing
as well as service sectors were revised downward in FY2007-08. Upward revision was also made for
import duty component of the GDP which restrained the fall in GDP growth estimates. In absence of this,
the GDP growth rate would have
been revised downward by
another 0.2 per cent. This is
important to note in the sense
that import duty was the only
component of GDP that does not
have a direct employment effect.
This would mean that even
though the GDP growth rate
estimates did not change in any
significant way in FY2007-08,
employment generation was
projected to be 0.1 million less
than would otherwise be as a
consequence of this
compositional change.
As is known, global slowdown has
affected all emerging Asian economies. However, compared to her Asian counterparts, Bangladesh's
growth rates declined at a slower pace (by 0.3 percentage point) compared to target rates. In case of, for
example, India and Vietnam projected growth rates were lower by higher margins than their targets (by
1.9 and 2.3 percentage points respectively) (Figure 1).
2.2 Sources of Growth
Despite the notably robust performance of country's agriculture sector, overall, tangible sectors of the
economy1 posted a moderate growth of 5.4 per cent while intangible sectors recorded a growth of 6.2
per cent. Global recession adversely impacted the manufacturing sector of Bangladesh which failed to
achieve the projected targets. In the incremental GDP of FY2008-09, industrial sector contributed only
28.8 per cent, whereas service sectors remained the front runner with a share of 50.7 per cent.
Agriculture sector responded to positive policy initiatives and its contribution to incremental GDP was to
the tune of 16.0 per cent (Figure 2). Overall, agriculture sector posted an impressive 4.7 per cent growth;
more than 1 per cent higher than the PRSP target. Within the agriculture sector, crop sector had posted
an impressive 5.9 per cent growth, contributing to ensuring country's food security in the backdrop of
the inflationary pressure on prices of food items experienced in the recent past.
It is to be noted that the targeted industrial growth of 11.7 per cent in FY2008-09 was significantly higher
than the actual growth of 6.78 per cent in FY2007-08. The sector's performance was particularly afflicted

GROWTH, SAVINGS AND INVESTMENT
State of the Bangladesh Economy in FY2008-09 4
Agriculture16%
Industry29%
Service50%
Import Duty
5%
Figure 2: Sources of Incremental Growth
Source: CPD-IRBD estimate.
10
15
20
25
30
35
FY
00
FY
01
FY
02
FY
03
FY
04
FY
05
FY
06
FY
07
FY
08
FY
09
% o
f G
DP
Gross National Savings Gross Domestic Savings
Figure 3: Savings Rate as Percentage of GDP
Source: BBS
by domestic uncertainties and the
ongoing economic crisis.
Industrial sector as a whole could
actually manage a growth rate of
5.9 per cent in FY2008-09. Within
the industrial sector, growth rate
of the manufacturing sub-sectors
(contributing 17.2 per cent to the
incremental GDP) experienced
significant slowdown, posting a
growth of 5.9 per cent in FY2008-
09 against 6.8 per cent in FY2007-
08.
Historically, service sector has
consistently experienced a
moderately high performance,
contributing to its increasing share in GDP. In FY2008-09, service sector recorded a 6.3 per cent growth,
which was lower than the PRSP target of 6.9 per cent. Among the nine sub-sectors of the service sector,
three experienced lower growth performance (wholesale & retail trade; transport & communication;
and financial intermediaries), while for others, growth rates were higher in FY2008-09 compared to
FY2007-08.
2.3 Savings
Stagnating share of domestic savings in the GDP continued to remain unchanged in FY2008-09; rather
domestic savings as a percentage of GDP in Bangladesh somewhat declined from 20.3 per cent in
FY2007-08 to 20.2 per cent in FY2008-09 (Figure 3). Rising prices of essential items in the first half of
FY2008-09, particularly for food items, were perhaps also a contributing factor.
In contrast, inspired by successive high growth in remittance inflow, national savings rates have
registered higher growth in recent times. Share of national savings as percentage of GDP increased
further in FY2008-09, to reach 32.4 per cent of GDP, as against 30.2 per cent in FY2007-08, registering a
remarkable rise to the tune of
2.2 per cent of GDP. It is to be
noted that, the gap between
national and domestic savings in
Bangladesh has been rising in a
consistent manner over the
recent past. This gap primarily
originates from lack of
investment demand and limited
scope to channel remittances
towards investment. A
continuation of this trend may
result in further deterioration in
income distribution, since
remittance, whilst poverty
alleviating, has also been found
to be inequalising.
GROWTH, SAVINGS AND INVESTMENT
State of the Bangladesh Economy in FY2008-095
FY
06
FY
07
FY
08
FY
09
0
5
10
15
20
25
30
FY
00
FY
01
FY
02
FY
03
FY
04
FY
05
% o
f G
DP
Figure 4: Investment as Percentage of GDP
Source: BBS
Private Investment
Public Investment
Gross Investment
2.4 Investment
In absolute terms, gross capital formation in FY2008-09 would be Tk 148,840 crore in nominal terms (Tk
92,002 crore at constant prices). Growth of gross capital formation made some progress, posting 5.7 per
cent in FY2008-09 compared to only 1.8 per cent in FY2007-08. However, this is lower than the general
trend which hovers between eight and nine per cent. Investment has suffered from both lack of
infrastructure and continuing uncertainty in recent times. Ongoing recession also has had an adverse
impact on investors' confidence.
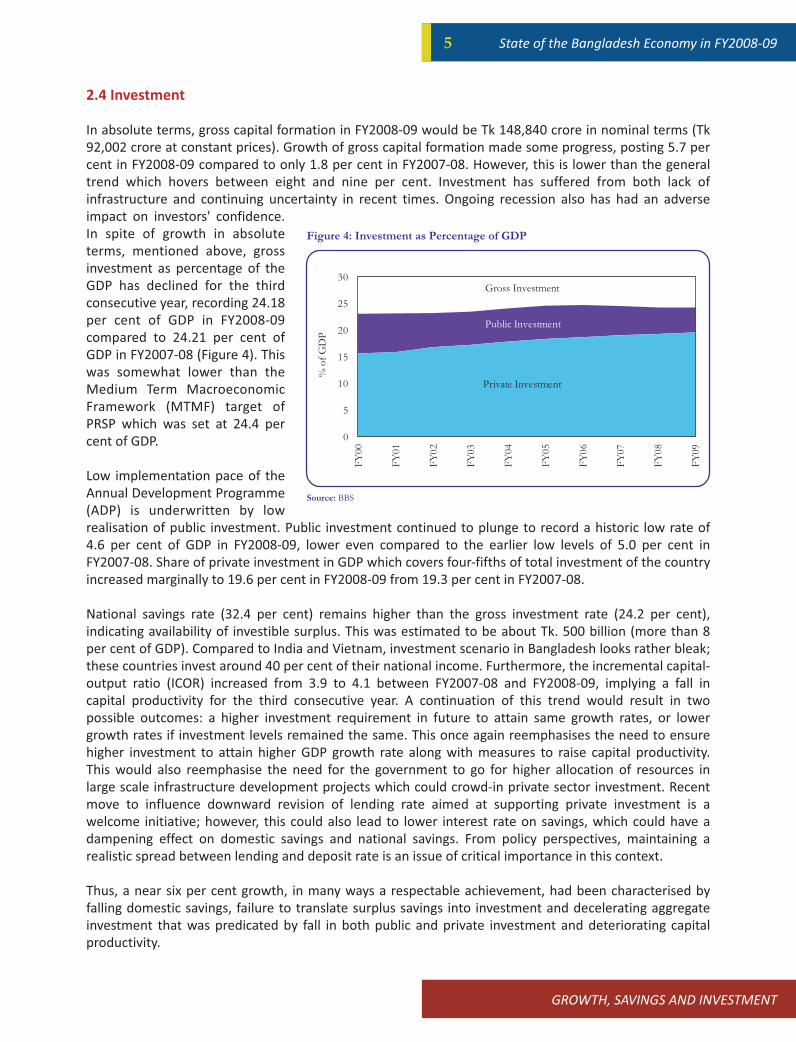
In spite of growth in absolute
terms, mentioned above, gross
investment as percentage of the
GDP has declined for the third
consecutive year, recording 24.18
per cent of GDP in FY2008-09
compared to 24.21 per cent of
GDP in FY2007-08 (Figure 4). This
was somewhat lower than the
Medium Term Macroeconomic
Framework (MTMF) target of
PRSP which was set at 24.4 per
cent of GDP.
Low implementation pace of the
Annual Development Programme
(ADP) is underwritten by low
realisation of public investment. Public investment continued to plunge to record a historic low rate of
4.6 per cent of GDP in FY2008-09, lower even compared to the earlier low levels of 5.0 per cent in
FY2007-08. Share of private investment in GDP which covers four-fifths of total investment of the country
increased marginally to 19.6 per cent in FY2008-09 from 19.3 per cent in FY2007-08.
National savings rate (32.4 per cent) remains higher than the gross investment rate (24.2 per cent),
indicating availability of investible surplus. This was estimated to be about Tk. 500 billion (more than 8
per cent of GDP). Compared to India and Vietnam, investment scenario in Bangladesh looks rather bleak;
these countries invest around 40 per cent of their national income. Furthermore, the incremental capital-
output ratio (ICOR) increased from 3.9 to 4.1 between FY2007-08 and FY2008-09, implying a fall in
capital productivity for the third consecutive year. A continuation of this trend would result in two
possible outcomes: a higher investment requirement in future to attain same growth rates, or lower
growth rates if investment levels remained the same. This once again reemphasises the need to ensure
higher investment to attain higher GDP growth rate along with measures to raise capital productivity.
This would also reemphasise the need for the government to go for higher allocation of resources in
large scale infrastructure development projects which could crowd-in private sector investment. Recent
move to influence downward revision of lending rate aimed at supporting private investment is a
welcome initiative; however, this could also lead to lower interest rate on savings, which could have a
dampening effect on domestic savings and national savings. From policy perspectives, maintaining a
realistic spread between lending and deposit rate is an issue of critical importance in this context.
Thus, a near six per cent growth, in many ways a respectable achievement, had been characterised by
falling domestic savings, failure to translate surplus savings into investment and decelerating aggregate
investment that was predicated by fall in both public and private investment and deteriorating capital
productivity.

PUBLIC FINANCE
State of the Bangladesh Economy in FY2008-09 6
PUBLIC FINANCE
3
Figure 5: Growth in NBR Revenue Collection During July-April (FY2007-08 and FY2008-09)
Source: National Board of Revenue (NBR).
-100
-80
-60
-40
-20
0
20
40
60
Imp
ort
Du
ty
VA
T I
mp
ort
Su
pp
Im
po
rt
Imp
ort
To
tal
Exci
se D
uty
VA
T L
oca
l
Su
pp
Lo
cal
Tu
rn O
ver
Tax
Lo
cal T
ota
l
Inco
me
Tax
Tra
vel T
ax
Oth
ers
To
tal D
irec
t T
ax
Gra
nd
To
tal
Gro
wth
Growth FY2007-08 (Jul-Aprl) Growth FY2008-09 (Jul-Aprl)
3.1 Revenue Mobilisation
Attaining 19.2 per cent revenue growth in FY2008-09 was always going to be difficult in the backdrop of
the high benchmark growth of 20.0 per cent in FY2007-08. This task was made even more challenging by
the need to reduce duties on many (food) items when prices were on the rise and as a consequence of
the ongoing global economic crisis which resulted in decline of duties on imports owing to the fall in
global commodity prices.
NBR Collection
The total revenue target for FY2008-09 was set at Tk 69,338 crore. Over 78 per cent of this amount (Tk
54,500 crore) was expected to come from the National Board of Revenue (NBR) sources. During the first
ten months of the fiscal year (July-
April), Tk 39,959.4 crore was
generated by the NBR, i.e. till now
73.3 per cent of the annual target
has been achieved. This also
implies a 12.7 per cent growth
achieved over the NBR revenue
collection during the matching
period of FY2007-08, which was
lower than the annual growth
target of 14.9 per cent (Figure 5).
Lower than projected growth
rates posted for NBR revenue
collection was primarily due to
significantly lower growth of
collection of import duty (2.3 per
cent growth achieved against the
annual growth target of 13.1 per cent) and supplementary duty at local stage (2.6 per cent growth during
July-April against the annual growth target of 23.6 per cent).
Revenue losses on these accounts mentioned above has been compensated, to some extent, by high
growth of income tax collection of 20.4 per cent, which was significantly higher than the targeted growth
of 11.1 per cent.
PUBLIC FINANCE
State of the Bangladesh Economy in FY2008-097
2Direct tax includes income tax, travel tax, land tax and some other taxes.
Non-NBR Tax and Non-Tax Revenue
Available data on non-NBR tax and non-tax revenue for the first eight months of the current fiscal year
indicate encouraging growth performance. Despite a negative growth target (-1.0 per cent) set in the
original budget, non-NBR tax collection posted 19.0 per cent growth during July-February period over
the corresponding period of the previous fiscal year. Non-tax revenue collection also recorded an
impressive growth of 15.3 per cent during this period which, however, was lower than the targeted
growth of 24.5 per cent.
Aggregate Revenue Outcome
It is estimated that, given the current growth rates, NBR may fall short of its target by about Tk 910 crore,
non-NBR tax revenue collection in FY2008-09 may surpass target by Tk 470 crore, while non-tax revenue
collection may experience a shortfall of Tk 930 crore. At the aggregate level, total revenue collection in
FY2008-09 may fall short of its target by about Tk 1,370 crore, which would be equivalent to about 2 per
cent of the total revenue target.
Overall, revenue growth performance during FY2008-09 reveals some positive developments in terms of
compositional change in the revenue structure of Bangladesh. Estimated revenue structure of FY2008-09
may result in 21.4 per cent share of direct tax2 in total revenue, backed by high growth in income tax
collection. In the previous fiscal year, share of direct tax was 21.0 per cent. As is known, direct tax is
generally recognised to be progressive (since it is mean-tested), while indirect tax has the propensity to
be regressive. Raising the share of direct taxes in the total revenue must be seen as a major goal by the
concerned authorities.
It is to be noted that revenue earnings from "undisclosed legal income" allowed for the past several
years, have been on the decline in recent years. Total revenue earnings from this provision amounted to
Tk 105 crore in FY2008-09 which was Tk 803 crore in the previous year. Number of people availing this
facility has also come down in FY2008-09 to 14,216 from 42,000 in the previous year. This would indicate
that the nature of this type of provision is such that its continuation over successive years tends to
reduce incremental revenue earnings. While compulsions of resource mobilisation to combat negative
impacts of global economic crisis may justify the continuation of the facility in FY2009-10 (with penalty
rates), the government may consider revisiting the policy subsequently. It needs to be recognised and
appreciated that this type of provisions create disincentive for honest taxpayers.
4.2 Revenue Expenditure
Revenue expenditure data for the first eight months of FY2008-09 indicates a deceleration in expenditure
growth. A 15.0 per cent rise was recorded in this respect over the corresponding period of FY2007-08
(July-February) as against the target of 19.5 per cent annual growth of the same in FY2008-09 budget.
Three major heads of revenue expenditure - "pay and allowances", "interest payments" and "subsidies
and transfers" - constituted 78 per cent of the total revenue expenditure budget of FY2008-09. Interest
payments posted a moderately high growth of 12.5 per cent during the July-February period. This high
growth was recorded on top of the significantly high growth of 36.2 per cent that was recorded during
the comparable period of FY2007-08 (over FY2006-07). Additionally, this growth was significantly higher
than the target growth of less than one per cent set for FY2008-09. Subsidies and transfers, on the other
hand, recorded high growth of 23.7 per cent in FY2008-09 (July-February). It is to be noted that subsidies
in the revenue expenditure classification do not cover subsidies for Bangladesh Petroleum Corporation
PUBLIC FINANCE
State of the Bangladesh Economy in FY2008-09 8
(BPC), fertiliser and other major subsidy categories, majority of which is expected to fall considerably
compared to the respective budgetary allocations owing to the falling global commodity prices. With
moderate to high growth rates on account of interest payments and subsidies and transfers, lower than
targeted revenue expenditure growth was mostly due to lower growth in pay and allowances, recording
only 7.7 per cent rise against the target of 24.2 per cent. This may have happened because government
employees (e.g. doctors and nurses, school and college teachers) were not recruited as planned.
Among other heads of revenue expenditure, goods and services and acquisition of assets and works
recorded high growth rates (17.9 per cent and 77.4 per cent respectively) during the July-February period of
FY2008-09. Expenditure on account of block allocations, however, declined significantly by (-) 45.8 per cent.
Since the budget for FY2008-09 estimated subsidy demands based on June 2008 prices, which were at
significantly high levels, significant amount of savings is likely to result on account of lower subsidy
payments. BPC subsidy demand for FY2008-09 may end up to be around Tk 1,000 crore, for which an
allocation of Tk 6,106 crore was kept in the original budget. While significant savings on fertiliser subsidy
is also a possibility, full benefits of lower fertiliser prices in the international market could not be
harnessed as most of the imports were made during the initial two quarters of FY2008-09 when prices
were much higher compared to the current levels.
3.3 Annual Development Programme (ADP)
Historical trend of low ADP implementation further deteriorated in FY2007-08; actual spending as a
percentage of the original allocation stood at 69.8 per cent in FY2007-08 compared to the 86.1 per cent
average implementation record of the preceding 10 years. In FY2007-08 actual ADP expenditure stood at
3.4 per cent of GDP which was the lowest in history of ADP implementation in Bangladesh.
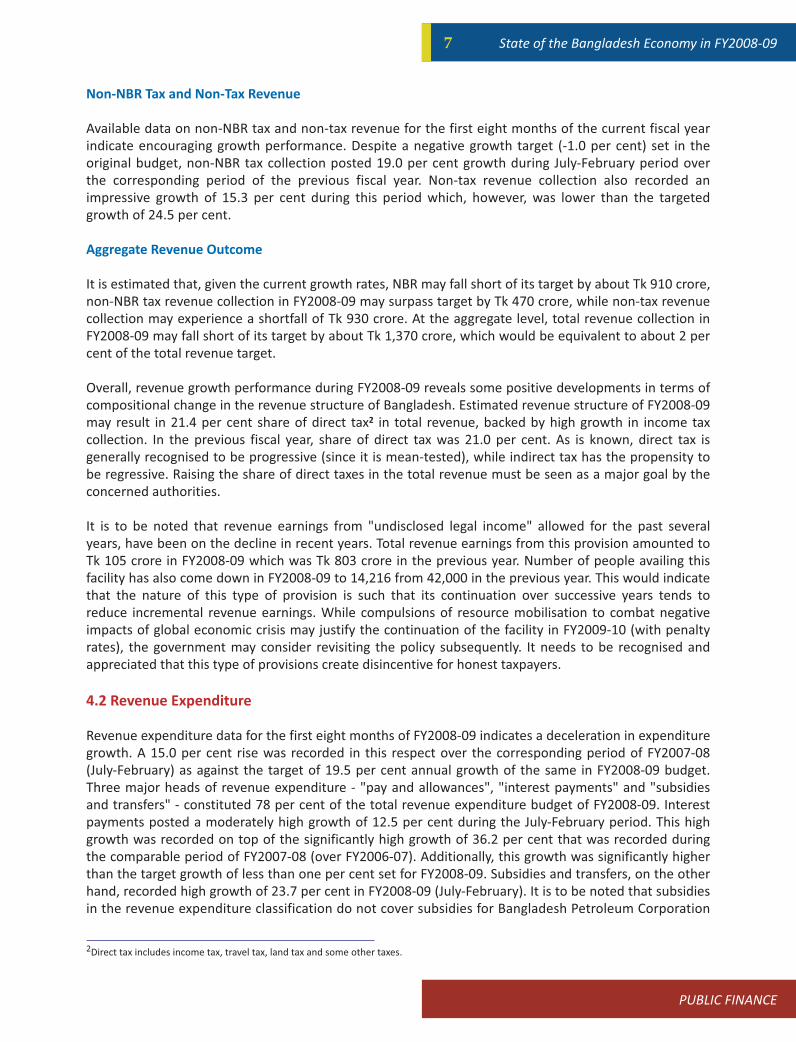
Project fund utilisation rate for the first ten months of FY2008-09 was only around 46.3 per cent of the
original ADP (compared to 46.7 per cent in FY2007-08) (Figure 6). ADP expenditure record shows that,
against original allocation of Tk 25,600 crore, only about Tk 11,856 crore could be spent by the involved
agencies till April 2009.
The top five ministries/divisions (in descending order of allocations) received 64.2 per cent of the total
ADP allocation. Among these, Ministry of Communication and Power Division utilised the least amount
of allocation, 25 per cent and 44
per cent respectively, in the first
ten months of the fiscal year. It
must be noted that Power
Division was given high priority
in the ADP in consideration of
the deteriorating electricity
supply situation in the country.
The 16 ministries which were
stipulated to develop their own
budgets under the Medium
Term Budgetary Framework
(MTBF) initiative had an average
expenditure of 48.4 per cent.
This was almost identical to the
average utilisation rate of 48.1
49
59
76
4448
83
47
56
79
46
62
78
0
10
20
30
40
50
60
70
80
90
Exp. as % of Allocation Tk Rel as % of Allocation Exp as % of Tk Released
per
cen
t
FY2005-06 FY2006-07 FY2007-08 FY2008-09
Figure 6: Performance of ADP During July-April (FY2005-06 To FY2008-09)
Source: Implementation Monitoring and Evaluation Division (IMED).
PUBLIC FINANCE
State of the Bangladesh Economy in FY2008-099
02468
101214
Del
ay in
Fu
nd
Rel
ease
Del
ay in
Lan
d P
rocu
rem
ent
Allo
cati
on
is L
ess
than
Req
uir
ed
Del
ay in
Ten
der
Pro
cess
Lac
k o
f M
anp
ow
er
Del
ay in
Bill
ing/
Pay
men
ts
Leg
al P
rob
lem
s
Lac
k o
f Sy
nc
wit
h D
on
oro
s
Dle
ay in
Pro
ject
Ap
pro
val
Del
ay in
Ap
po
inti
ng
Co
nsu
ltan
ts
Del
ay in
Pro
ject
Am
endm
men
t
Del
ay in
Pro
cure
men
t
Po
or
Pla
nn
ing
Lac
k o
f D
ecis
ion
Mak
ing
Cap
acit
y
Oth
ers
Per
cen
tage
Figure 7: Reported Problems by Various Ministries
Source: IMED Implementation Progress Report (FY2008-09)
per cent by all ministries. This should be considered a cause for concern. Thus, the idea that giving
more power with regard to investment decisions to ministries would result in higher and better rate of
fund utilization has not actually proved to be the case. Ironically, IMED, which has been charged with
monitoring and evaluation of the ADP, has utilised only 29 per cent of its allocation in the first ten
months.
In view of low progress in project implementation by various ministries, the National Economic Council
(NEC) recently has revised the ADP downward to Tk. 23,000 crore for FY2008-09, a reduction of around
10 percent. The RADP targets stipulate that, of the total expenditure 55.7 per cent is to be financed from
domestic resources, while the rest (44.4 per cent) would be financed by foreign resources. In the original
ADP, foreign resources were set to fund 47 per cent of the total requirement. Low disbursement of
project aid owing to sluggish pace of implementation so far might have forced the ADP to be revised,
with lower share of foreign funding. Utilisation of project aid stood rather low at 43.5 per cent during
July-April period, which was even lower than the rate of project aid utilisation of 50.7 per cent during the
corresponding period of FY2007-08.
It appears that the quality of implementation will continue to suffer as agencies and ministries, following
the usual trend, rush to spend respective allocations in the last two months of the fiscal year, which often
results in poor project outcomes. It is reckoned that in the end, ADP spending may turn out to be around
Tk 19,500 crore (about Tk 6,000 crore less than the original ADP), which would bring the ADP-GDP ratio
down to a new historical low level of 3.2 per cent.
As it appears, the government has decided on an ADP of Tk 30,500 crore for FY2009-10. The new ADP,
which will be 19.2 per cent bigger than the original ADP of FY2008-09 and 32.6 per cent higher than the
revised one, allocates the highest amount to agriculture (19 per cent) followed by transport, energy and
power and education (15 per
cent, 14 per cent and 13 per cent
respectively). The proposed ADP
will perhaps be about 50 per
cent higher than what will be
actually implemented in FY2008-
09. Such a significant scaling up
planned expenditure will require
quite considerable enhancement
of government capacities, in
absence of which the pace of
implementation will come down
further.
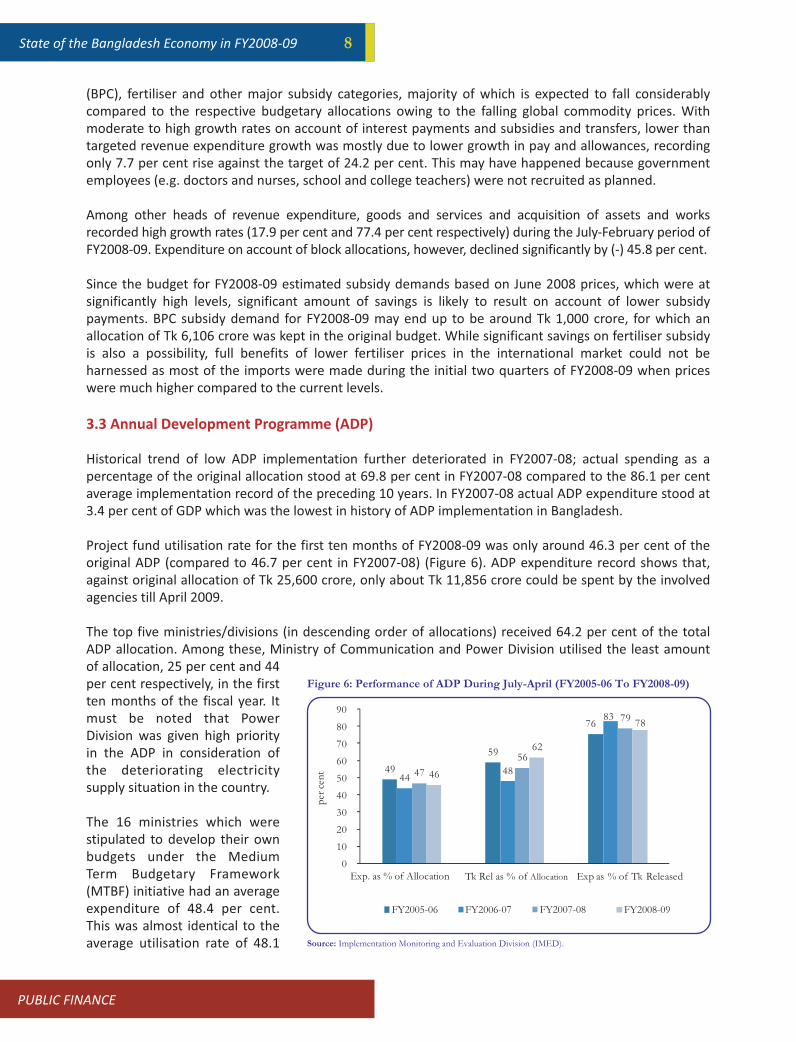
According to the IMED
Implementation Progress Report
(FY2008-09), major difficulties
faced in implementation of the
ADP as reported by the ministries relate to delay in tender processing, delay in land procurement, delays
caused by project amendment and delay in fund release. Twenty five ministries whose implementation
rate was less than the national average rate of 41 per cent were assessed by the IMED to identify major
causes of slow implementation. Figure 7 provides information on frequency distribution of major causes
of delay in project implementation. It has been mentioned by several quarters that the current
procurement law may need to be amended to address the delay in procurement which has been seen as
INTRODUCTION
State of the Bangladesh Economy in FY2008-09 10
Jul-Feb FY2007-08 Jul-Feb FY2008-09
Tk 2780.6, 17%
Tk 12305.7, 74%
Tk 1582.2, 9%
Net Foreign Financing Non-Bank Borrowing
Bank Borrowing
Net Foreign Financing Non-Bank Borrowing
Bank Borrowing
Tk 1063.5, 10%
Tk 1919.2, 18%
Tk 7857, 72%
Figure 8: Components of Deficit Financing in FY2007-08 and FY2008-09
Source: Ministry of Finance (MoF), GoB.
a major constrain in ensuring speedy utilisation of ADP fund. Whilst some changes in some aspects of the
law may be called for, this is no way should made at the cost of transparency and accountability in
utilisation of public resources.
The government will need to put an all out effort to remove these obstacles to attain the ambitious
targets in FY2009-10, since historically ADP implementation had never crossed the Tk 20,000 crore mark
(highest ever implementation was of Tk 19,472 crore in FY2005-06).
3.4 Budget Deficit and Financing
It has been the general experience in Bangladesh over the past years that deficit situation at the end of
fiscal year tended to benefit from lower implementation of the ADP. While this has been true for FY2008-
09 as well, this time around lower revenue expenditure and much lower subsidy expenditure helped to
attain a measure of comfort. Although shortages in revenue collection and stimulus package of Tk 3,424
crore announced recently may reduce the gains, to some extent, significant savings on the above
mentioned accounts is likely to result in lower deficit-GDP ratio (about 3.5 per cent) compared to what
was estimated in the original budget (at 5.0 per cent).
Available information on current status of budget deficit matches the aforesaid projections. During July-
February of FY2008-09 total deficit stood at Tk 10,959.1 crore, which indicates a decline of (-) 34.3 per
cent compared to the deficit of the same period in the previous year. In view of the 15 per cent positive
growth target of the budget in terms of deficits for FY2008-09, such lower actual levels of deficit would
allow the government to accommodate the stimulus package without much difficulty from the
perspective of fiscal management.
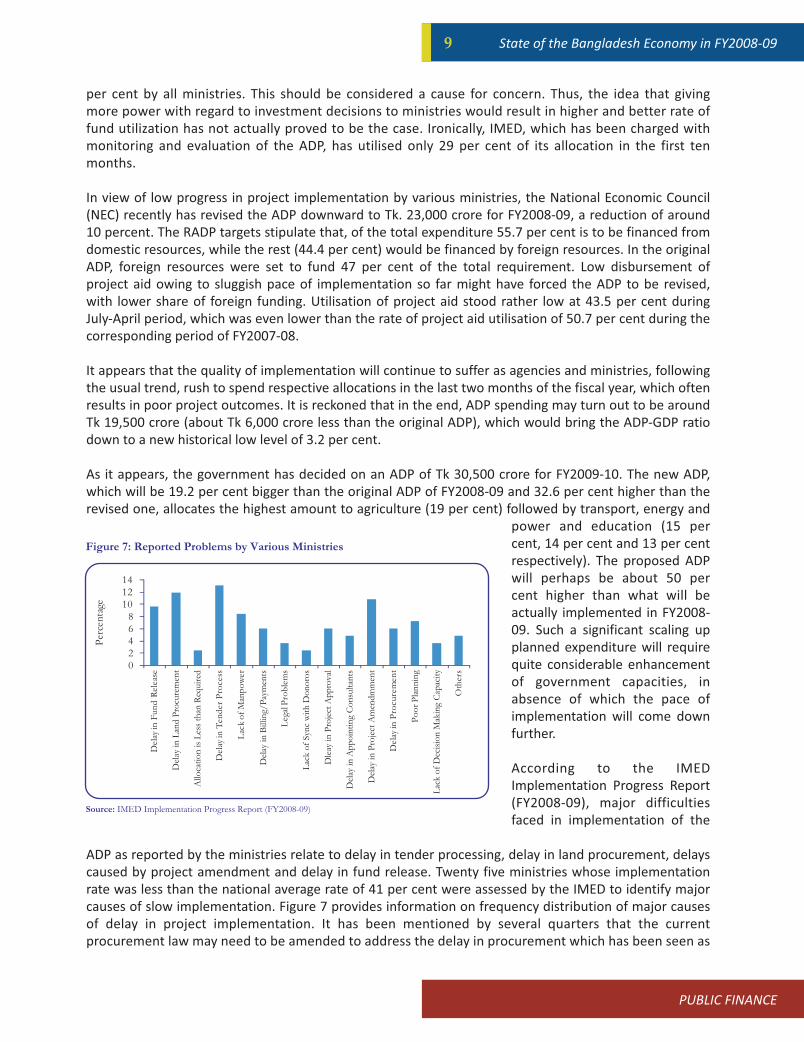
However, budget for FY2008-09 estimated 44.4 per cent of the projected deficit to be financed from net
foreign support. The attendant record has not been encouraging so far. Only 9.7 per cent of the current
level of deficit has been met by foreign financing component. Net foreign financing amounted to Tk
1,063 crore during July-February period, indicating a significant fall of (-) 61.8 per cent compared to July-
February figure of FY2007-08 (Figure 8). This also indicates that only 7.8 per cent of the net foreign
financing target has been materialised during the first eight months of the current fiscal year.
PUBLIC FINANCE
PUBLIC FINANCE
State of the Bangladesh Economy in FY2008-0911
Table 1: Projected Fiscal Structure for FY2008-09 and FY2009-10
* Figures in parenthesis indicate differences between original budget and projections for FY2008-09 as
percentage of the original budget.
FY2008-09 FY2008-09 Difference* FY2009-10 % Change
(Budget) (Projected) (Projected) in FY2009-10
GDP at current price 6,13,111 6,14,943 (+) 1832 6,77,733 10.2
(+0.3%)
Revenue Earnings 69,338 67,964 (-) 1374 78,200 15.1
(-2%)
as % of GDP 11.31 11.05 (-) 0.26 11.5 0.5
Revenue Expenditure 61,469 59,171 (-) 2298 79,139 29.0
(-3.7%)
as % of GDP 10.03 9.62 (-) 0.40 11.7 2.1
ADP 25,600 19,600 (-) 6000 30,500 55.6
(-23.4%)
as % of GDP 4.18 3.19 (-) 0.99 4.5 1.3
Total Budget 99,962 89,544 (-) 10418 1,16,639 30.3
(-10.4%)
as % of GDP 16.30 15.2 (-) 1.11 17.2 2.0
Deficit 30,580 21580 (-) 9000 38,439 78.1
(-29.4%)
as % of GDP 4.99 3.51 (-) 1.48 5.7 2.2
Domestic financing during July-February period of FY2008-09 also declined by (-) 28.8 per cent: total
bank and non-bank borrowing amounted to Tk 9,895.6 crore. It is to be noted that the government has
increasingly gone for non-bank borrowing as against bank borrowing. In the background of significant
overall decline in deficit, non-bank borrowing during July-February period has posted a positive growth
of 21.3 per cent, while bank borrowing declined by (-) 36.2 per cent.
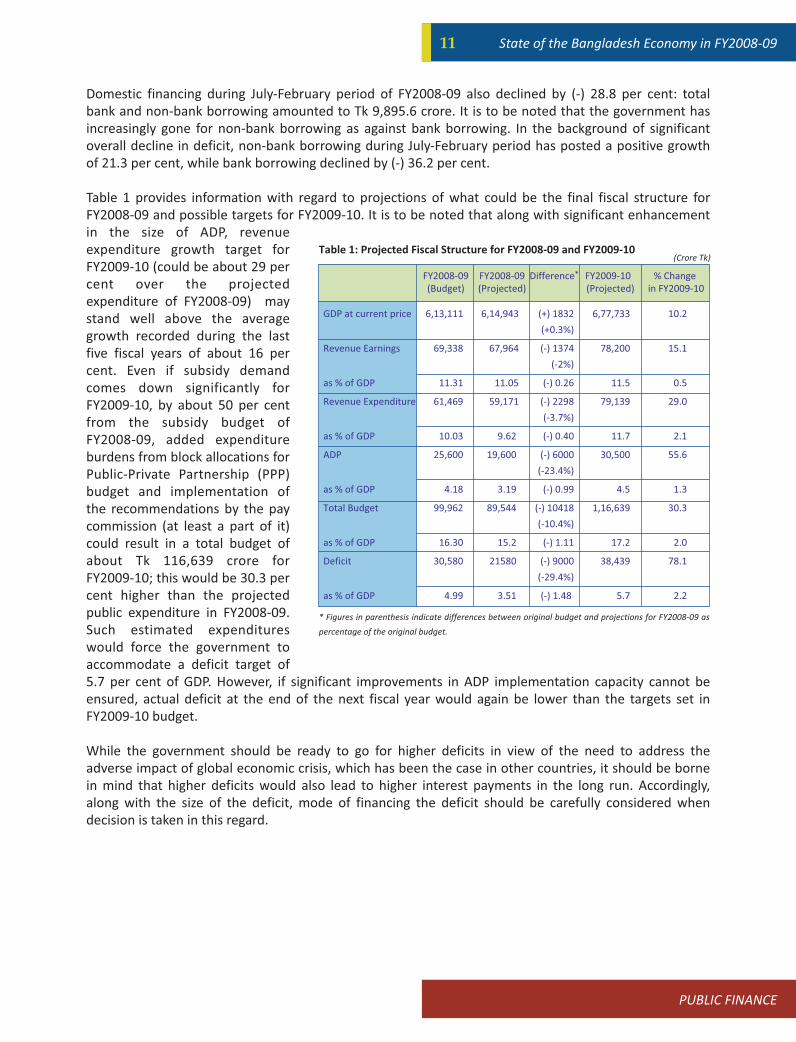
Table 1 provides information with regard to projections of what could be the final fiscal structure for
FY2008-09 and possible targets for FY2009-10. It is to be noted that along with significant enhancement
in the size of ADP, revenue
expenditure growth target for
FY2009-10 (could be about 29 per
cent over the projected
expenditure of FY2008-09) may
stand well above the average
growth recorded during the last
five fiscal years of about 16 per
cent. Even if subsidy demand
comes down significantly for
FY2009-10, by about 50 per cent
from the subsidy budget of
FY2008-09, added expenditure
burdens from block allocations for
Public-Private Partnership (PPP)
budget and implementation of
the recommendations by the pay
commission (at least a part of it)
could result in a total budget of
about Tk 116,639 crore for
FY2009-10; this would be 30.3 per
cent higher than the projected
public expenditure in FY2008-09.
Such estimated expenditures
would force the government to
accommodate a deficit target of
5.7 per cent of GDP. However, if significant improvements in ADP implementation capacity cannot be
ensured, actual deficit at the end of the next fiscal year would again be lower than the targets set in
FY2009-10 budget.
While the government should be ready to go for higher deficits in view of the need to address the
adverse impact of global economic crisis, which has been the case in other countries, it should be borne
in mind that higher deficits would also lead to higher interest payments in the long run. Accordingly,
along with the size of the deficit, mode of financing the deficit should be carefully considered when
decision is taken in this regard.
(Crore Tk)
State of the Bangladesh Economy in FY2008-09 12
MONETARY SECTOR
44
Though the rate of inflation has been showing a benign trend in recent times, underwritten largely by
falling commodity prices in the global market, keeping the growth momentum on track in view of the
global economic meltdown continues to remain a daunting task for the policymakers. In order to tackle
this, monetary policy will need to focus mainly on three major areas. First, ensuring higher credit to the
productive sectors; second, managing the interest rate in a manner that is able to maintain real
interests rates stable for both lenders and depositors; third, balance the apparently conflicting interests
of exporters and importers through prudent management of the exchange rate regime. In addition to
these, efforts have to be made to keep the inflation rate contained to avoid erosion of income and
contraction of purchasing power of the common people. Monetary policy measures using various tools
such as Repo, Reverse Repo, Cash Reserve Ratio (CRR) and Statutory Liquidity Ratio (SLR) have to be
undertaken in a prudent manner to facilitate growth.
Some of the emerging trends in the monetary sector relating to the period under discussion are
highlighted below.
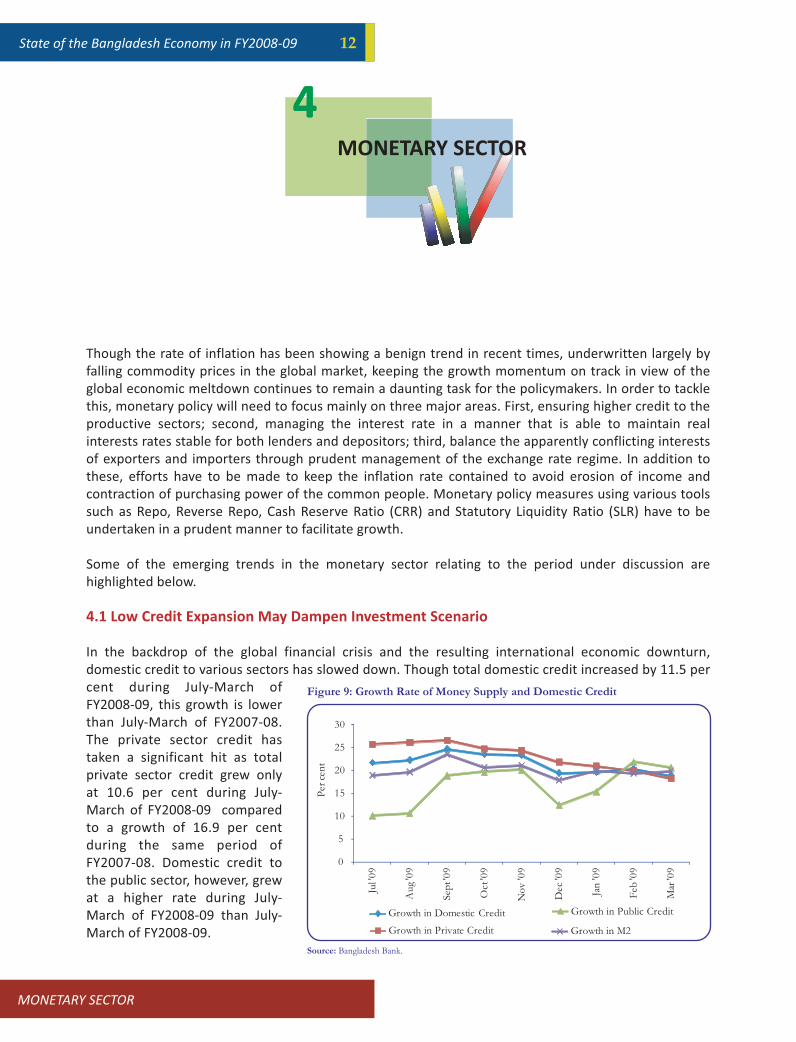
4.1 Low Credit Expansion May Dampen Investment Scenario
In the backdrop of the global financial crisis and the resulting international economic downturn,
domestic credit to various sectors has slowed down. Though total domestic credit increased by 11.5 per
cent during July-March of
FY2008-09, this growth is lower
than July-March of FY2007-08.
The private sector credit has
taken a significant hit as total
private sector credit grew only
at 10.6 per cent during July-
March of FY2008-09 compared
to a growth of 16.9 per cent
during the same period of
FY2007-08. Domestic credit to
the public sector, however, grew
at a higher rate during July-
March of FY2008-09 than July-
March of FY2008-09.
0
5
10
15
20
25
30
Jul '
09
Au
g '0
9
Sep
t '0
9
Oct
'09
No
v '0
9
Dec
'09
Jan
'09
Feb
'09
Mar
'09
Per
cen
t
Growth in Domestic Credit
Growth in Private Credit
Growth in Public Credit
Growth in M2
Figure 9: Growth Rate of Money Supply and Domestic Credit
Source: Bangladesh Bank.
MONETARY SECTOR
MONETARY SECTOR
State of the Bangladesh Economy in FY2008-0913
In terms of sectoral credit disbursement, agriculture sector posted a positive but lower growth (14.8 per
cent for July-April in FY2008-09 against 56.7 per cent during July-April of FY2007-08). Industry sector,
however, had experienced a major downturn as disbursement of term loan declined by 9.6 per cent
during July-March of FY2008-09 compared to July-March of FY2007-08 (when growth was 23.5 per cent)
though disbursement of working
capital increased marginally by
15.5 per cent over the same
period compared to 14.3 per
cent at the end of March 2008.
Such low demand for industrial
term loan will have a major
setback on the industrial
development of the country
during the current fiscal year. The
global financial crisis coupled
with lack of infrastructural
support, particularly lack of
adequate power supply have
contributed to this decline in
industrial term loan.
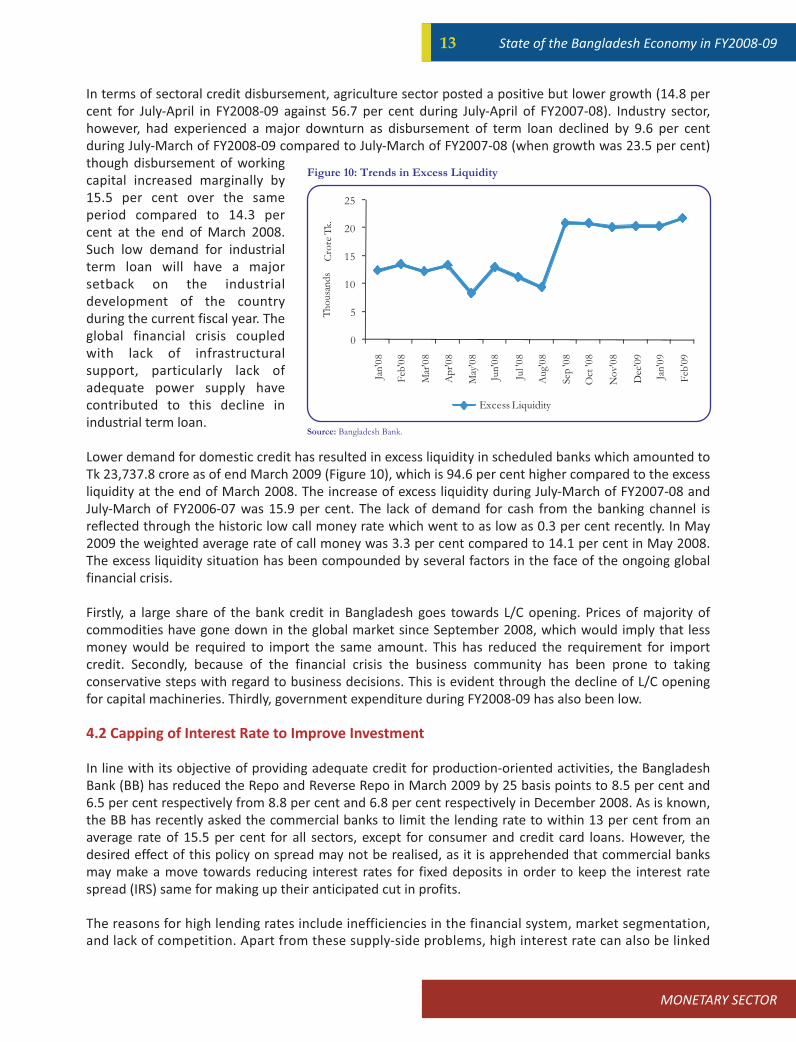
Lower demand for domestic credit has resulted in excess liquidity in scheduled banks which amounted to
Tk 23,737.8 crore as of end March 2009 (Figure 10), which is 94.6 per cent higher compared to the excess
liquidity at the end of March 2008. The increase of excess liquidity during July-March of FY2007-08 and
July-March of FY2006-07 was 15.9 per cent. The lack of demand for cash from the banking channel is
reflected through the historic low call money rate which went to as low as 0.3 per cent recently. In May
2009 the weighted average rate of call money was 3.3 per cent compared to 14.1 per cent in May 2008.
The excess liquidity situation has been compounded by several factors in the face of the ongoing global
financial crisis.
Firstly, a large share of the bank credit in Bangladesh goes towards L/C opening. Prices of majority of
commodities have gone down in the global market since September 2008, which would imply that less
money would be required to import the same amount. This has reduced the requirement for import
credit. Secondly, because of the financial crisis the business community has been prone to taking
conservative steps with regard to business decisions. This is evident through the decline of L/C opening
for capital machineries. Thirdly, government expenditure during FY2008-09 has also been low.
4.2 Capping of Interest Rate to Improve Investment
In line with its objective of providing adequate credit for production-oriented activities, the Bangladesh
Bank (BB) has reduced the Repo and Reverse Repo in March 2009 by 25 basis points to 8.5 per cent and
6.5 per cent respectively from 8.8 per cent and 6.8 per cent respectively in December 2008. As is known,
the BB has recently asked the commercial banks to limit the lending rate to within 13 per cent from an
average rate of 15.5 per cent for all sectors, except for consumer and credit card loans. However, the
desired effect of this policy on spread may not be realised, as it is apprehended that commercial banks
may make a move towards reducing interest rates for fixed deposits in order to keep the interest rate
spread (IRS) same for making up their anticipated cut in profits.
The reasons for high lending rates include inefficiencies in the financial system, market segmentation,
and lack of competition. Apart from these supply-side problems, high interest rate can also be linked
0
5
10
15
20
25
Jan
'08
Mar
'08
Ap
r'0
8
Feb
'08
Feb
'09
Dec
'09
May
'08
Jul '
08
Sep
'08
No
v'0
8
Oct
'08
Aug'
08
Jun
'08
Jan
'09
Cro
re T
k.T
ho
usa
nd
s
Excess Liquidity
Figure 10: Trends in Excess Liquidity
Source: Bangladesh Bank.
INTRODUCTION
State of the Bangladesh Economy in FY2008-09 14
3CPD (2007). State of the Bangladesh Economy in FY2005-06 and Outlook for FY2006-07, Centre for Policy Dialogue, January 2007.
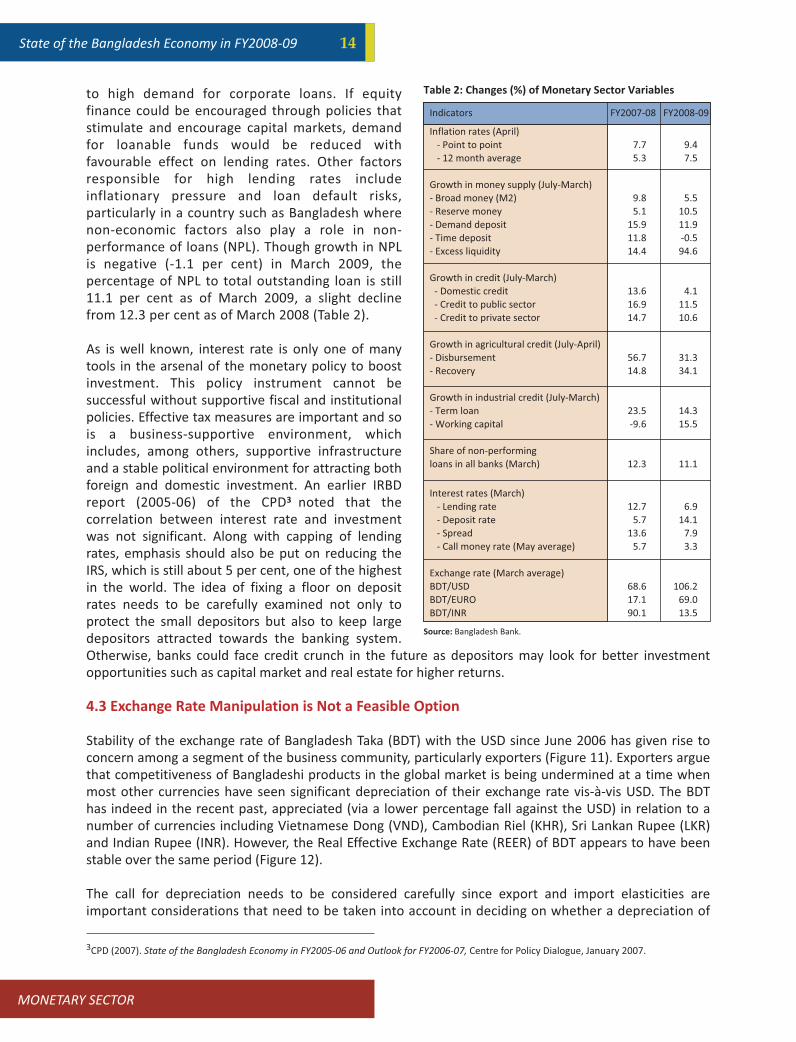
Indicators FY2007-08 FY2008-09
Inflation rates (April)
- Point to point 7.7 9.4
- 12 month average 5.3 7.5
Growth in money supply (July-March)
- Broad money (M2) 9.8 5.5
- Reserve money 5.1 10.5
- Demand deposit 15.9 11.9
- Time deposit 11.8 -0.5
- Excess liquidity 14.4 94.6
Growth in credit (July-March)
- Domestic credit 13.6 4.1
- Credit to public sector 16.9 11.5
- Credit to private sector 14.7 10.6
Growth in agricultural credit (July-April)
- Disbursement 56.7 31.3
- Recovery 14.8 34.1
Growth in industrial credit (July-March)
- Term loan 23.5 14.3
- Working capital -9.6 15.5
Share of non-performing
loans in all banks (March) 12.3 11.1
Interest rates (March)
- Lending rate 12.7 6.9
- Deposit rate 5.7 14.1
- Spread 13.6 7.9
- Call money rate (May average) 5.7 3.3
Exchange rate (March average)
BDT/USD 68.6 106.2
BDT/EURO 17.1 69.0
BDT/INR 90.1 13.5
Table 2: Changes (%) of Monetary Sector Variables
Source: Bangladesh Bank.
to high demand for corporate loans. If equity
finance could be encouraged through policies that
stimulate and encourage capital markets, demand
for loanable funds would be reduced with
favourable effect on lending rates. Other factors
responsible for high lending rates include
inflationary pressure and loan default risks,
particularly in a country such as Bangladesh where
non-economic factors also play a role in non-
performance of loans (NPL). Though growth in NPL
is negative (-1.1 per cent) in March 2009, the
percentage of NPL to total outstanding loan is still
11.1 per cent as of March 2009, a slight decline
from 12.3 per cent as of March 2008 (Table 2).
As is well known, interest rate is only one of many
tools in the arsenal of the monetary policy to boost
investment. This policy instrument cannot be
successful without supportive fiscal and institutional
policies. Effective tax measures are important and so
is a business-supportive environment, which
includes, among others, supportive infrastructure
and a stable political environment for attracting both
foreign and domestic investment. An earlier IRBD
report (2005-06) of the CPD3 noted that the
correlation between interest rate and investment
was not significant. Along with capping of lending
rates, emphasis should also be put on reducing the
IRS, which is still about 5 per cent, one of the highest
in the world. The idea of fixing a floor on deposit
rates needs to be carefully examined not only to
protect the small depositors but also to keep large
depositors attracted towards the banking system.
Otherwise, banks could face credit crunch in the future as depositors may look for better investment
opportunities such as capital market and real estate for higher returns.
4.3 Exchange Rate Manipulation is Not a Feasible Option
Stability of the exchange rate of Bangladesh Taka (BDT) with the USD since June 2006 has given rise to
concern among a segment of the business community, particularly exporters (Figure 11). Exporters argue
that competitiveness of Bangladeshi products in the global market is being undermined at a time when
most other currencies have seen significant depreciation of their exchange rate vis-à-vis USD. The BDT
has indeed in the recent past, appreciated (via a lower percentage fall against the USD) in relation to a
number of currencies including Vietnamese Dong (VND), Cambodian Riel (KHR), Sri Lankan Rupee (LKR)
and Indian Rupee (INR). However, the Real Effective Exchange Rate (REER) of BDT appears to have been
stable over the same period (Figure 12).
The call for depreciation needs to be considered carefully since export and import elasticities are
important considerations that need to be taken into account in deciding on whether a depreciation of
MONETARY SECTOR

MONETARY SECTOR
State of the Bangladesh Economy in FY2008-0915
4Razzaque, Abdur, "The Small Country Assumption, Econometric Estimates and Policy Making: A Reassessment with Bangladesh's RMG Exports
to the European Union," The Bangladesh Development Studies, Volume XXX, March-June 2004, Number 1&2, Dhaka.
5Panagariya, A., Shah, S. and Mishra, D. Demand Elasticities in International Trade: Are they Really Low? World Bank 1996, Washington DC.
BDT will actually have positive
overall impact on trade and
current account balance.
Research has also shown that
Bangladesh's imports exhibit
higher price elasticity than
exports.4 Hence, as a result of
depreciation of the BDT, ceteris
paribus, imports would fall but
exports may not register
comparable rise.5 It would appear
that, instead of pursuing policies
that would lead to depreciation of
the BDT, other policies, that
including fiscal and monetary
measures that stimulate export-
oriented activities and enhance
their competitiveness, should be
given more emphasis by the
policy makers. This could be in
addition to what has already been
announced by the government in
April 2009 in its stimulus package
of Tk 3,424 crore, which includes
extension of payback period of
bank loan from 90 to 120 days for
the exporters, and increase the
amount of borrowing from USD 1
million to USD1.5 million from the
Export Development Fund (EDF).
4.4 Future Monetary Policy
Stance
The overall outlook for the monetary sector looks gloomy as monetary aggregates do not bode well for
the health of the banking sector and the economy. In view of a slowdown in investment scenario as
evident, particularly from low credit flow to the productive sectors including agriculture and industry,
and high excess liquidity in the banking system, a moderate expansionary monetary policy may be
pursued, as low inflation rate appears to have given a leeway at the moment. However, global
commodity and fuel prices are expected to rise as the large economies are preparing for a kick start in
the coming months when some of the benefits of huge stimulus package will begin to show up in the
horizon. Therefore, future monetary policy stance should strive to be maintain price stability, improve
the observed slowdown in economic activities, and promote growth through making all out efforts to
utilise the idle money in the financial channels by way of making bank loans less costlier, and constant
monitoring of the growth of money supply and movements of the exchange rates.
Figure 11: Movements of BDT (July 2008 - April 2009)
Source: Bangladesh Bank.
12
12.5
13
13.5
14
14.5
15
15.5
16
16.5
0
20
40
60
80
100
120
July
'08
Au
g'0
8
Sep
t'08
Oct
'08
No
v'0
8
Dec
'08
Jan
'09
Feb
'09
Mar
'09
Ap
r'0
9
Tk/
INR
Tk/
USD
or
Tk/
EU
RO
Tk/USD Tk/EURO (Tk/INR)*10
Figure 12: Real and Nominal Effective Exchange Rates (BDT with respect to USD) (July 2006 - March 2009)
Source: Bangladesh Bank.
4550556065707580859095
100
Jul'0
6
Sep
'06
No
v'0
6
Jan
'07
Mar
'07
May
'07
Jul'0
7
Sep
'07
No
v'0
7
Jan
'08
Mar
'08
May
'08
Jul'0
8
Sep
'08
No
v'0
8
Jan
'09
Mar
'09
exch
ange
rat
e
Real Effective Exchange Rate Index Nominal Effective Exchange Rate Index
Nominal Exchange Rate Corresponding ExchangeRate According to REER
State of the Bangladesh Economy in FY2008-09 16
REAL SECTOR
5
5.1 AGRICULTURE
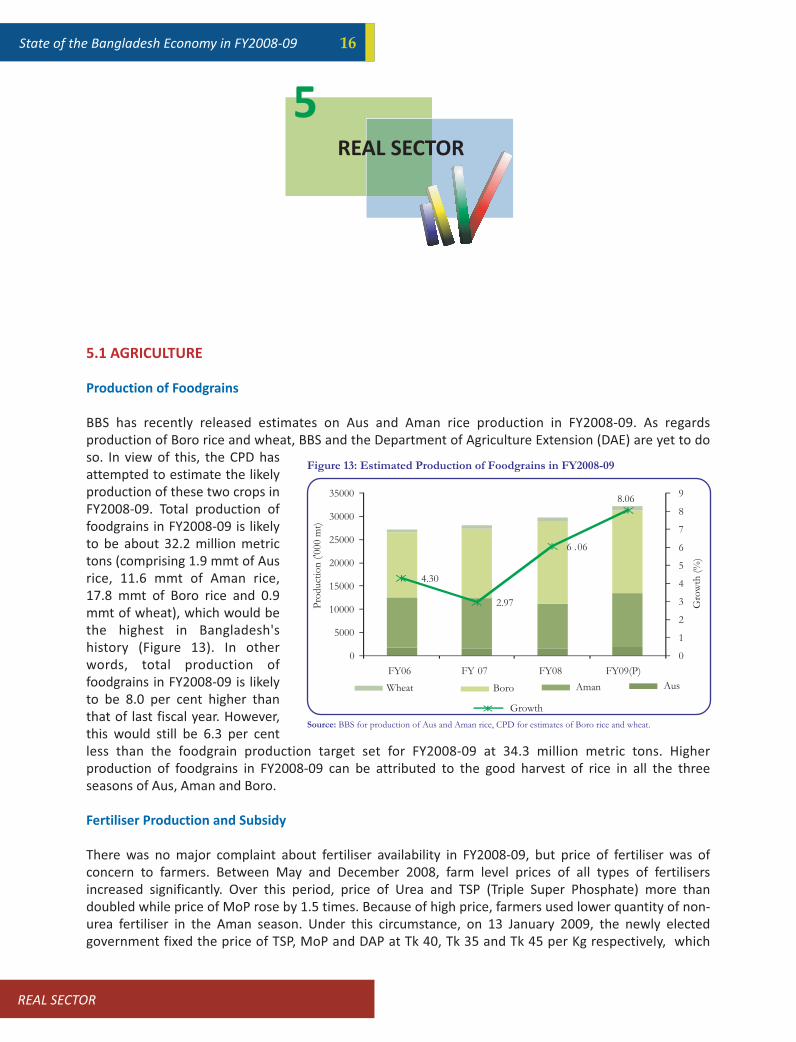
Production of Foodgrains
BBS has recently released estimates on Aus and Aman rice production in FY2008-09. As regards
production of Boro rice and wheat, BBS and the Department of Agriculture Extension (DAE) are yet to do
so. In view of this, the CPD has
attempted to estimate the likely
production of these two crops in
FY2008-09. Total production of
foodgrains in FY2008-09 is likely
to be about 32.2 million metric
tons (comprising 1.9 mmt of Aus
rice, 11.6 mmt of Aman rice,
17.8 mmt of Boro rice and 0.9
mmt of wheat), which would be
the highest in Bangladesh's
history (Figure 13). In other
words, total production of
foodgrains in FY2008-09 is likely
to be 8.0 per cent higher than
that of last fiscal year. However,
this would still be 6.3 per cent
less than the foodgrain production target set for FY2008-09 at 34.3 million metric tons. Higher
production of foodgrains in FY2008-09 can be attributed to the good harvest of rice in all the three
seasons of Aus, Aman and Boro.
Fertiliser Production and Subsidy
There was no major complaint about fertiliser availability in FY2008-09, but price of fertiliser was of
concern to farmers. Between May and December 2008, farm level prices of all types of fertilisers
increased significantly. Over this period, price of Urea and TSP (Triple Super Phosphate) more than
doubled while price of MoP rose by 1.5 times. Because of high price, farmers used lower quantity of non-
urea fertiliser in the Aman season. Under this circumstance, on 13 January 2009, the newly elected
government fixed the price of TSP, MoP and DAP at Tk 40, Tk 35 and Tk 45 per Kg respectively, which
4.30
2.97
6 .06
8.06
0
1
2
3
4
5
Pro
duct
ion
('0
00 m
t)
Gro
wth
(%
)
6
7
8
9
0
5000
10000
15000
20000
25000
30000
35000
FY06 FY 07 FY08 FY09(P)
Wheat Boro Aman Aus
Growth
Figure 13: Estimated Production of Foodgrains in FY2008-09
Source: BBS for production of Aus and Aman rice, CPD for estimates of Boro rice and wheat.
REAL SECTOR
REAL SECTOR
State of the Bangladesh Economy in FY2008-0917
0
200
400
600
800
1000
1200
1400
Jul
Au
g
Se
p
Oc
t
No
v
De
c
Jan
Fe
b
Ma
r
Ap
r
Ma
y
Jun
Jul
Au
g
Se
p
Oc
t
No
v
De
cJa
n
Fe
b
Ma
r
Ap
r
Ma
y
Jun
Jul
Au
g
Se
p
Oc
t
No
v
De
c
Jan
Fe
b
Ma
r
Ap
r
2006
Pri
ce (
US
D/t
on
)
2007 2008 2009
Urea DAP TSP MoP
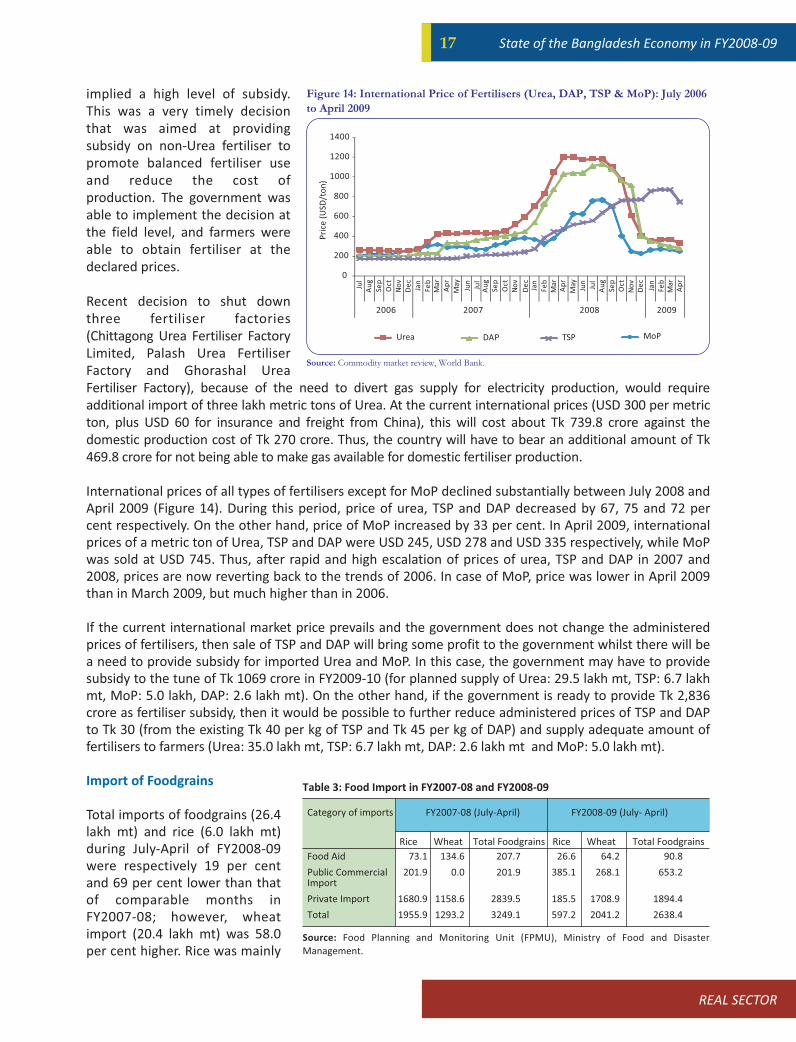
Figure 14: International Price of Fertilisers (Urea, DAP, TSP & MoP): July 2006 to April 2009
Source: Commodity market review, World Bank.
Category of imports FY2007-08 (July-April) FY2008-09 (July- April)
Rice Wheat Total Foodgrains Rice Wheat Total Foodgrains
Food Aid 73.1 134.6 207.7 26.6 64.2 90.8
Public Commercial 201.9 0.0 201.9 385.1 268.1 653.2Import
Private Import 1680.9 1158.6 2839.5 185.5 1708.9 1894.4
Total 1955.9 1293.2 3249.1 597.2 2041.2 2638.4
Table 3: Food Import in FY2007-08 and FY2008-09
Source: Food Planning and Monitoring Unit (FPMU), Ministry of Food and Disaster
Management.
implied a high level of subsidy.
This was a very timely decision
that was aimed at providing
subsidy on non-Urea fertiliser to
promote balanced fertiliser use
and reduce the cost of
production. The government was
able to implement the decision at
the field level, and farmers were
able to obtain fertiliser at the
declared prices.
Recent decision to shut down
three fertiliser factories
(Chittagong Urea Fertiliser Factory
Limited, Palash Urea Fertiliser
Factory and Ghorashal Urea
Fertiliser Factory), because of the need to divert gas supply for electricity production, would require
additional import of three lakh metric tons of Urea. At the current international prices (USD 300 per metric
ton, plus USD 60 for insurance and freight from China), this will cost about Tk 739.8 crore against the
domestic production cost of Tk 270 crore. Thus, the country will have to bear an additional amount of Tk
469.8 crore for not being able to make gas available for domestic fertiliser production.
International prices of all types of fertilisers except for MoP declined substantially between July 2008 and
April 2009 (Figure 14). During this period, price of urea, TSP and DAP decreased by 67, 75 and 72 per
cent respectively. On the other hand, price of MoP increased by 33 per cent. In April 2009, international
prices of a metric ton of Urea, TSP and DAP were USD 245, USD 278 and USD 335 respectively, while MoP
was sold at USD 745. Thus, after rapid and high escalation of prices of urea, TSP and DAP in 2007 and
2008, prices are now reverting back to the trends of 2006. In case of MoP, price was lower in April 2009
than in March 2009, but much higher than in 2006.
If the current international market price prevails and the government does not change the administered
prices of fertilisers, then sale of TSP and DAP will bring some profit to the government whilst there will be
a need to provide subsidy for imported Urea and MoP. In this case, the government may have to provide
subsidy to the tune of Tk 1069 crore in FY2009-10 (for planned supply of Urea: 29.5 lakh mt, TSP: 6.7 lakh
mt, MoP: 5.0 lakh, DAP: 2.6 lakh mt). On the other hand, if the government is ready to provide Tk 2,836
crore as fertiliser subsidy, then it would be possible to further reduce administered prices of TSP and DAP
to Tk 30 (from the existing Tk 40 per kg of TSP and Tk 45 per kg of DAP) and supply adequate amount of
fertilisers to farmers (Urea: 35.0 lakh mt, TSP: 6.7 lakh mt, DAP: 2.6 lakh mt and MoP: 5.0 lakh mt).
Import of Foodgrains
Total imports of foodgrains (26.4
lakh mt) and rice (6.0 lakh mt)
during July-April of FY2008-09
were respectively 19 per cent
and 69 per cent lower than that
of comparable months in
FY2007-08; however, wheat
import (20.4 lakh mt) was 58.0
per cent higher. Rice was mainly

State of the Bangladesh Economy in FY2008-09 18
HYV Boro Rice (2008-09) Hybrid Boro Rice (2008-09)
Input use Diesel Electricity Diesel Electricity
irrigated (Tk) driven (Tk) irrigated (Tk) driven (Tk)
Seed 600.0 600.0 1,320.0 1,320.0
Fertiliser 4,308.0 4,308.0 5,225.0 5,225.0
Manure 400.0 400.0 400.0 400.0
Pesticide 500.0 500.0 860.0 860.0
Human labour 10,600.0 10,600.0 11,720.0 11,720.0
Land cultivation (bullock/PT) 1,800.0 1,800.0 1,800.0 1,800.0
Irrigation 4,000.0 2,000.0 4,000.0 2,000.0
Interest on operating capital 1,110.4 1,010.4 1,266.3 1,166.3
Land rent 6,000.0 6,000.0 6,000.0 6,000.0
Total cost (Tk/acre) 29,318.4 27,218.4 32,591.3 30,491.3
Production cost of Paddy (Tk/kg) 12.8 11.8 12.5 11.7
Yield (Kg/acre) 2300.0 2300.0 2600.0 2600.0
Production cost of Rice (Tk/kg) 20.5 19.1 20.2 19.0
Table 4: Estimated per Acre Production Cost of Boro Rice in Bangladesh During the
April-June 2009 Harvesting Season
Note: The conversion rate of paddy to rice was calculated at 1 kg paddy = 0.65 kg rice and milling cost (including
parboiling) was calculated @0.60 Tk/kg.
Source: CPD Field Survey, 2009.
imported by the public sector whilst about 84 per cent of the wheat import was done by the private
sector (Table 3).
Procurement of Boro Rice
The government has started procurement of Boro rice on 1 May 2009 and it will continue till the end of
September 2009. Procurement price of paddy is fixed at Tk 14/kg and rice at Tk 22/kg with a
procurement target of 12 lakh mt of rice (comprising 11 lakh mt of rice and 1.5 lakh mt of paddy).
However, progress so far has been rather very slow (only about 203 thousand mt of rice and about 23
thousand mt of paddy until May 30, 2009).
In mid-May, a team of CPD researchers visited selected areas of Bogra, Mymensingh, Naogaon and
Rangpur. The team discussed with relevant stakeholders including farmers, traders, millers, food
procurement officers. Major findings of the field visit are: (i) estimated cost of per kg production of Boro
rice varied between Tk 11.7 and Tk 12.8, depending on type of the Boro paddy (Hybrid or HYV) and
method of irrigation (electricity-operated or diesel-operated). Cost of production was higher for diesel-
irrigated Boro rice compared
to electricity-irrigated Boro
rice. Estimated weighted
average cost of production
of Boro paddy was Tk
12.5/kg and Boro rice was
Tk 20.14/kg. (Table 4); (ii)
farmers were selling wet
paddy to the traders. In
terms of dry paddy
equivalent, farmers were
obtaining Tk 10.0 to Tk 11.7
per kg by selling hybrid
paddy, Tk 11.7 to Tk 12.5
per kg for BR28 paddy and
Tk 14.1 per kg for BR29
paddy; (iii) average price of
coarse paddy (Tk 10.9 per
kg) at the farm level which is
lower than average
production cost of paddy (Tk
12.5 per kg); (iv) at the
current market price farmers were losing about Tk 1,000 - Tk 1,200 per bigha (33 decimal). The ban on
export of rice for the next six months effective from May 22, 2009 is likely to work against the farmers'
interests through lowering in rice price. The government must strengthen its rice procurement
programme to safeguard the interests of the rice farmers. Government should devise a mechanism to
purchase paddy directly from farmers, and from the Hats and Bazaars. An upward revision of
procurement target to the tune of 20 lakh metric tons will be required to have any significant influence
on prices at the farm level. To expand current storage facility of foodgrains, the government should
immediately use underutilised storage facility of BADC and create new storage facilities in FY2009-10. In
addition, import duty at the rate of 15 per cent may be imposed on rice to discourage import of rice.
In view of the gaps between the procurement price and the price received by farmers, there is a renewed
need to identify institutional mechanisms so that direct procurements can be made at farm gate.
Whether farmers could be co-owners of rice mills through cooperatives so that they could be in a
REAL SECTOR

REAL SECTOR
State of the Bangladesh Economy in FY2008-0919
500
1000
1500
2000
2500
3000
3500
4000
4500
5000
5500Ju
l'06
Sep
'06
No
v'06
Jan
'07
Mar
'07
May
'07
Jul'0
7
Sep
'07
No
v'07
Jan
'08
Mar
'08
May
'08
Jul'0
8
Sep
'08
No
v'08
Jan
'09
Mar
'09
May
'09
US
D/
ton
International 26% Whole Milk Powder Price (Oceania)
Figure 15: International Price of Whole Cream Milk Powder: July 2006 to May 2009
Source: International Dairy Market News Reports, USDA.
position to reap the benefits of procurement by the government from mills, is one area which needs to
be explored further. Perhaps this could be another area of public private partnership. Modalities aimed
at closer involvement of local government institutions could be another possible avenue. In a nut shell,
since the issue of the gap between procurement price and farm gate price is likely to be a recurring
problem in the years ahead as well, perhaps time has come to explore possible avenues to address this
issue through broad based consultations between government and all relevant stakeholders.
Fall in International Price of Milk Powder and Its Impact on Bangladeshi Milk Producers
International price of milk powder decreased significantly in recent months which have had an adverse
impact on domestic milk producers. During first three months (January-March) of 2009, average price of
milk powder declined by 33 per cent (from USD 4,586 to USD 3,065 per metric ton) against comparable
months of 2008 (Figure 15). As a
consequence, Bangladesh's
import of milk powders
(HS040210 (Milk powder, not
exceeding 1.5 per cent fat) and
HS040221 (Milk and cream in
powder forms >1.5 per cent fat)
increased to USD 20.995 million
(2.3 times of import in
comparable months of 2008). In
quantity terms, this would be
about 3.5 times of the imports
during comparable months of
2008. Sudden and high import at
low prices has created problem
for domestic milk producers and
companies. In mid-May 2009, a
CPD team visited Sirajgonj area
and held discussion with dairy
farmers, feed sellers, Milk Vita and other company officials. Major findings are: (i) farmers enjoyed good
business in 2007 and 2008 due to high demand for liquid milk originating from high international price
and melamine scare; however, they are currently facing difficulties due to lack of demand for their milk;
(ii) demand for milk by consumers and sweetmeat industry has declined due to availability of low cost
milk powder; (iii) companies have reduced both quantity and price of purchase (Tk 4 to 6 per litre) of
milk; and (iv) feed cost in March-April 2009, against comparable months of 2008, has decreased by
about 15 per cent. Some options to support the milk producers and milk industry under the current
circumstances are: (i) withdrawal of existing 15 per cent VAT on production of milk powder; (ii) review of
import duty on milk powder to make a balance between producer and consumer interests; (iii) better
technical support to farmers through Livestock Department by appointing higher number of livestock
officers (veterinarians and animal husbandry specialists) in intensive milk production areas; and (iv)
supply of medicines and vaccines at a subsidised rate.
By any measure, performance of agriculture sector in FY2008-09 has been quite impressive. Production
of rice and foodgrains reached new record levels. However, the price that farmers received for Boro was
even below their cost of production. On the other hand, significant decrease in international price of milk
powder created an adverse impact on local dairy producers and milk processing companies. Thus, major
challenge for the next year will be to sustain the current momentum of high growth in agriculture,
particularly in rice production, and more importantly, there will be a need to provide incentives for
farmers to go for higher production.
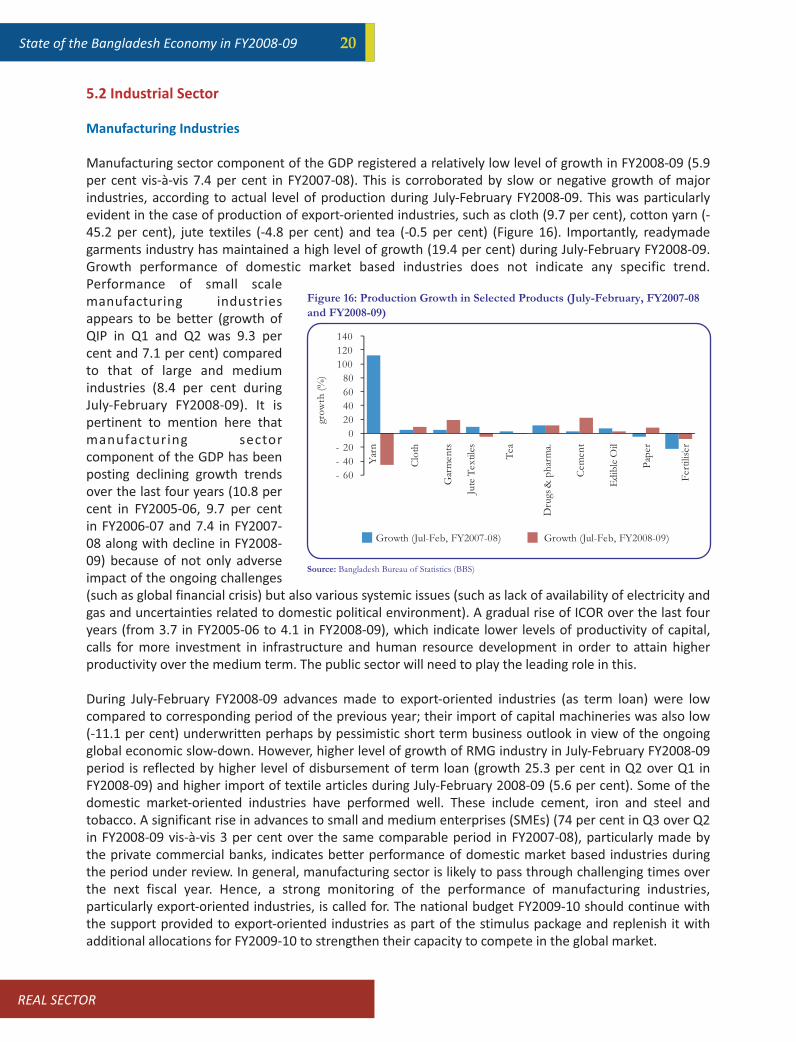
State of the Bangladesh Economy in FY2008-09 20
-
Tea
Dru
gs &
ph
arm
a.
Cem
ent
Ed
ible
Oil
Pap
er
Fer
tilis
er
Figure 16: Production Growth in Selected Products (July-February, FY2007-08 and FY2008-09)
Source: Bangladesh Bureau of Statistics (BBS)
- 60
- 40
- 20
0
20
40
60
80
100
120
140
Yar
n
Clo
th
Gar
men
ts
Jute
Tex
tile
s
gro
wth
(%
)
Growth (Jul-Feb, FY2007-08) Growth (Jul-Feb, FY2008-09)
5.2 Industrial Sector
Manufacturing Industries
Manufacturing sector component of the GDP registered a relatively low level of growth in FY2008-09 (5.9
per cent vis-à-vis 7.4 per cent in FY2007-08). This is corroborated by slow or negative growth of major
industries, according to actual level of production during July-February FY2008-09. This was particularly
evident in the case of production of export-oriented industries, such as cloth (9.7 per cent), cotton yarn (-
45.2 per cent), jute textiles (-4.8 per cent) and tea (-0.5 per cent) (Figure 16). Importantly, readymade
garments industry has maintained a high level of growth (19.4 per cent) during July-February FY2008-09.
Growth performance of domestic market based industries does not indicate any specific trend.
Performance of small scale
manufacturing industries
appears to be better (growth of
QIP in Q1 and Q2 was 9.3 per
cent and 7.1 per cent) compared
to that of large and medium
industries (8.4 per cent during
July-February FY2008-09). It is
pertinent to mention here that
manufacturing sector
component of the GDP has been
posting declining growth trends
over the last four years (10.8 per
cent in FY2005-06, 9.7 per cent
in FY2006-07 and 7.4 in FY2007-
08 along with decline in FY2008-
09) because of not only adverse
impact of the ongoing challenges
(such as global financial crisis) but also various systemic issues (such as lack of availability of electricity and
gas and uncertainties related to domestic political environment). A gradual rise of ICOR over the last four
years (from 3.7 in FY2005-06 to 4.1 in FY2008-09), which indicate lower levels of productivity of capital,
calls for more investment in infrastructure and human resource development in order to attain higher
productivity over the medium term. The public sector will need to play the leading role in this.
During July-February FY2008-09 advances made to export-oriented industries (as term loan) were low
compared to corresponding period of the previous year; their import of capital machineries was also low
(-11.1 per cent) underwritten perhaps by pessimistic short term business outlook in view of the ongoing
global economic slow-down. However, higher level of growth of RMG industry in July-February FY2008-09
period is reflected by higher level of disbursement of term loan (growth 25.3 per cent in Q2 over Q1 in
FY2008-09) and higher import of textile articles during July-February 2008-09 (5.6 per cent). Some of the
domestic market-oriented industries have performed well. These include cement, iron and steel and
tobacco. A significant rise in advances to small and medium enterprises (SMEs) (74 per cent in Q3 over Q2
in FY2008-09 vis-à-vis 3 per cent over the same comparable period in FY2007-08), particularly made by
the private commercial banks, indicates better performance of domestic market based industries during
the period under review. In general, manufacturing sector is likely to pass through challenging times over
the next fiscal year. Hence, a strong monitoring of the performance of manufacturing industries,
particularly export-oriented industries, is called for. The national budget FY2009-10 should continue with
the support provided to export-oriented industries as part of the stimulus package and replenish it with
additional allocations for FY2009-10 to strengthen their capacity to compete in the global market.
REAL SECTOR

REAL SECTOR
State of the Bangladesh Economy in FY2008-0921
-30
-20
-10
0
10
20
30
40
All
Ser
vice
s
Am
use
men
t
Ho
spital
, C
linic
IT S
ervi
ces
Co
uri
er S
ervi
ces
Ho
tel &
Res
tau
ren
ts
Co
ld S
tora
ge
Tra
vel A
gen
cy
Ph
oto
Stu
dio
Bea
uty
Par
lar
Oth
er S
ervi
ces
% change in FY2008-09 (Q2-Q1) % change in FY2007-08 (Q2-Q1)
Figure 17: Changes in Advances in Services IndustriesFigure 17: Changes in Advances in Services Industries
Source: Bangladesh Bank
-200
0
200
400
600
800
1000
FY2005-06 FY 2006-07 FY2007-08 FY2008-09
(July-February)
mill
ion
US$
Foreign Direct Investment (net) Portfolio Investment (net) Total
Figure 18: Foreign Investment in Bangladesh
Source: Bangladesh Bank
Services Industries
Services industries, as in many other developing countries, demonstrated some resilience in spite of the
economic slow-down. The sector is likely to achieve a growth of 6.3 per cent in FY2008-09 which was
only marginally low compared to
that of FY2007-08 (6.49 per
cent). The sector received higher
levels of advances (other than
working capital) during Q2 over
Q1 in FY2008-09 (by about 10.1
per cent) though working capital
disbursed to their sector was
lower over the same period
(growth -1.8 per cent) (Figure
17). It would appear that most of
the service industries, being
mostly of domestic market-
oriented nature, have performed
well (such as hospital,
entertainment, hotel and
restaurants); however,
performance record of some of
the other industries was rather unsatisfactory, including that of information technology (IT), travel and
tourism, possibly because of their business linkages with the global market.
CPD carried out a rapid perception survey among 90 leading entrepreneurs during February-April 2009 to
appreciate and assess possible impact of global financial crisis on Bangladesh economy, particularly on
production, investment and employment, during 2009. About 49.3 per cent respondents were concerned
about the negative impact of the global economic crisis in 2009 (36 per cent remained undecided); only
about 14.7 per cent felt that business situation would improve in 2009. A large number of entrepreneurs
have taken various cost cutting measures in view of the adverse impact of the crisis. These included
increasing of working hours, reduction of fringe benefits, reduction of firm's capacity utilisation or even
closing down of some production units. Retrenchment of workers was not evident as per the information
provided by the respondents. However, a large proportion of sample entrepreneurs indicated that if the
demand for their outputs
declined further, they would go
for such measures. Thus, any
slump in demand could have
visible adverse consequences for
the domestic labour market.
Foreign Direct Investment
In the backdrop of negative
growth in the global flow of FDI
in FY2007-08 (-28.0 per cent),
which is expected to decline
further in FY2008-09,
improvement in FDI flow to
Bangladesh in FY2008-09 is of
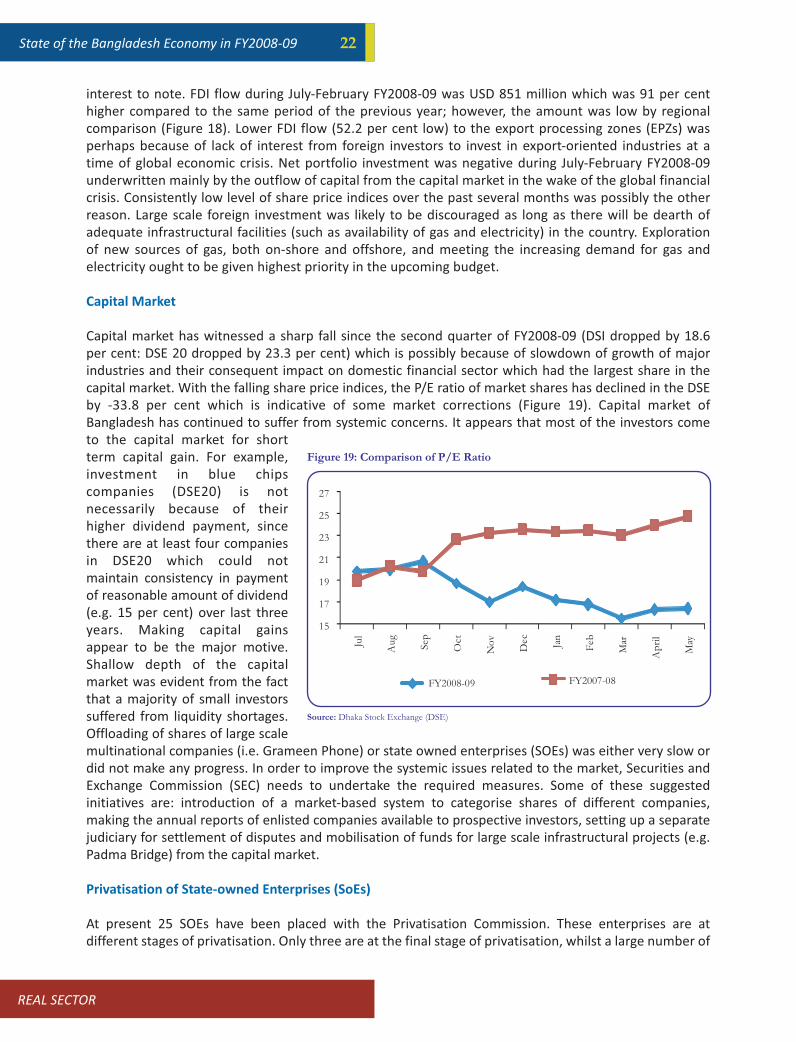
State of the Bangladesh Economy in FY2008-09 22
15
17
19
21
23
25
27
Jul
Au
g
Sep
Oct
No
v
Dec Jan
Feb
Mar
Ap
ril
May
FY2008-09 FY2007-08
Figure 19: Comparison of P/E Ratio
Source: Dhaka Stock Exchange (DSE)
interest to note. FDI flow during July-February FY2008-09 was USD 851 million which was 91 per cent
higher compared to the same period of the previous year; however, the amount was low by regional
comparison (Figure 18). Lower FDI flow (52.2 per cent low) to the export processing zones (EPZs) was
perhaps because of lack of interest from foreign investors to invest in export-oriented industries at a
time of global economic crisis. Net portfolio investment was negative during July-February FY2008-09
underwritten mainly by the outflow of capital from the capital market in the wake of the global financial
crisis. Consistently low level of share price indices over the past several months was possibly the other
reason. Large scale foreign investment was likely to be discouraged as long as there will be dearth of
adequate infrastructural facilities (such as availability of gas and electricity) in the country. Exploration
of new sources of gas, both on-shore and offshore, and meeting the increasing demand for gas and
electricity ought to be given highest priority in the upcoming budget.
Capital Market
Capital market has witnessed a sharp fall since the second quarter of FY2008-09 (DSI dropped by 18.6
per cent: DSE 20 dropped by 23.3 per cent) which is possibly because of slowdown of growth of major
industries and their consequent impact on domestic financial sector which had the largest share in the
capital market. With the falling share price indices, the P/E ratio of market shares has declined in the DSE
by -33.8 per cent which is indicative of some market corrections (Figure 19). Capital market of
Bangladesh has continued to suffer from systemic concerns. It appears that most of the investors come
to the capital market for short
term capital gain. For example,
investment in blue chips
companies (DSE20) is not
necessarily because of their
higher dividend payment, since
there are at least four companies
in DSE20 which could not
maintain consistency in payment
of reasonable amount of dividend
(e.g. 15 per cent) over last three
years. Making capital gains
appear to be the major motive.
Shallow depth of the capital
market was evident from the fact
that a majority of small investors
suffered from liquidity shortages.
Offloading of shares of large scale
multinational companies (i.e. Grameen Phone) or state owned enterprises (SOEs) was either very slow or
did not make any progress. In order to improve the systemic issues related to the market, Securities and
Exchange Commission (SEC) needs to undertake the required measures. Some of these suggested
initiatives are: introduction of a market-based system to categorise shares of different companies,
making the annual reports of enlisted companies available to prospective investors, setting up a separate
judiciary for settlement of disputes and mobilisation of funds for large scale infrastructural projects (e.g.
Padma Bridge) from the capital market.
Privatisation of State-owned Enterprises (SoEs)
At present 25 SOEs have been placed with the Privatisation Commission. These enterprises are at
different stages of privatisation. Only three are at the final stage of privatisation, whilst a large number of
REAL SECTOR

REAL SECTOR
State of the Bangladesh Economy in FY2008-0923
the remaining enterprises are at early stages of privatisation: in the case of 14 enterprises, preparatory
work is being carried out before these enterprises could be placed for bidding/open tender; another 7
enterprises are at the stage of valuation of assets; only one enterprise was at the biding/open tender
stage while another two are at final
stage of privatisation (Table 5).
Among the nine textiles and
handloom enterprises, four are at
the initial stage of privatisation;
however, government has recently
decided not to privatise two of
those. Two of the enterprises have
problems in valuation of assets,
while one is facing litigation
problems regarding the land of the
mill and the other one is
constrained by debt-related
problem. Privatisation Commission
has decided to include another 12
SOEs for privatisation; most of
these are textile and jute mills. As per the particulars of SOEs to be privatised, all liabilities of these SOEs
will be borne by the government which was expected to encourage private entrepreneurs to come
forward. However, it was not clear as to how the significant debt burden this will entail will be absorbed
by the government. It is important to mention here that government policy stance, particularly as
mentioned in the Draft Industrial Policy 2009 (IP 2009), had some ambiguity with regard to the policy to
be pursued in respect of privatisation. This policy stance was not in line with other related policy
documents including Privatisation Act 2000 and Jute Policy 2005. The draft IP 2009 should be in
consonance with the government's overall policy stance with regard to privatisation and should make
clear government's position as regards restructuring of the public sector enterprises. The idea of
enhancing public-private partnership with regard to operating and managing the SOEs, whilst welcome,
needs to be spelt out in a more detailed and definitive fashion.
5.3 ENERGY AND INFRASTRUCTURE
Electricity Generation
The newly elected Government came to the power on January 08, 2009 with benchmark demand of
electricity of around 4,100 Mega Watt (MW) against a generation of 3,860.6 MW. Up to April 2009,
301.4 MW (maximum) electricity was added to the national grid (through Rental Power Plant (RPP),
overhauling and closed down of fertiliser factory). Between January 2007 and December 2008, capacity
of electricity generation increased to 782 MW (27.1 per cent growth), of which 324 MW was added as
new generation and the rest 458 MW came from overhauling of the existing power plants. In January
2009, demand-supply gap was 575.2 MW (maximum) which further escalated to 915 and 1134.1 MW in
February and March 2009 respectively. Average load shedding from January to March 2009 was 381.5
MW. From the Figure 20, it is seen that the demand-supply gap is gradually on the rise. In FY1994-95,
the gap was only 68 MW which has reached 1,904 MW (in May 2009) in FY2008-09. Electricity
generation as percentage of installed capacity registered highest growth (78 per cent) during the CTG,
thanks to better maintenance and management improvement.
Power projects awarded in the past, up until now, are expected to generate 4,069 MW by 2014, whereas
the new AL government has planned to generate 3,325 MW (with a 400 MW immediate fuel based RPP)
Source: The Privatisation Commission, GoB.
Different
categories of
enterprises
Sugar
Textile and
Handloom
Chemical
Timber
Jute
Engineering
Tea
Total
number of
mills
1
9
6
4
3
2
-
Finalisation
of SOEs list
by
Government
-
4
4
3
2
1
-
Valuation of
SOEs by
enlisted
-
2
2
1
1
1
Invitation
of open
bid/tender
-
1
-
-
-
-
-
Final Stage of
privatisation
1
1
-
1
-
-
-
Table 5: Status of SOEs to be Privatised
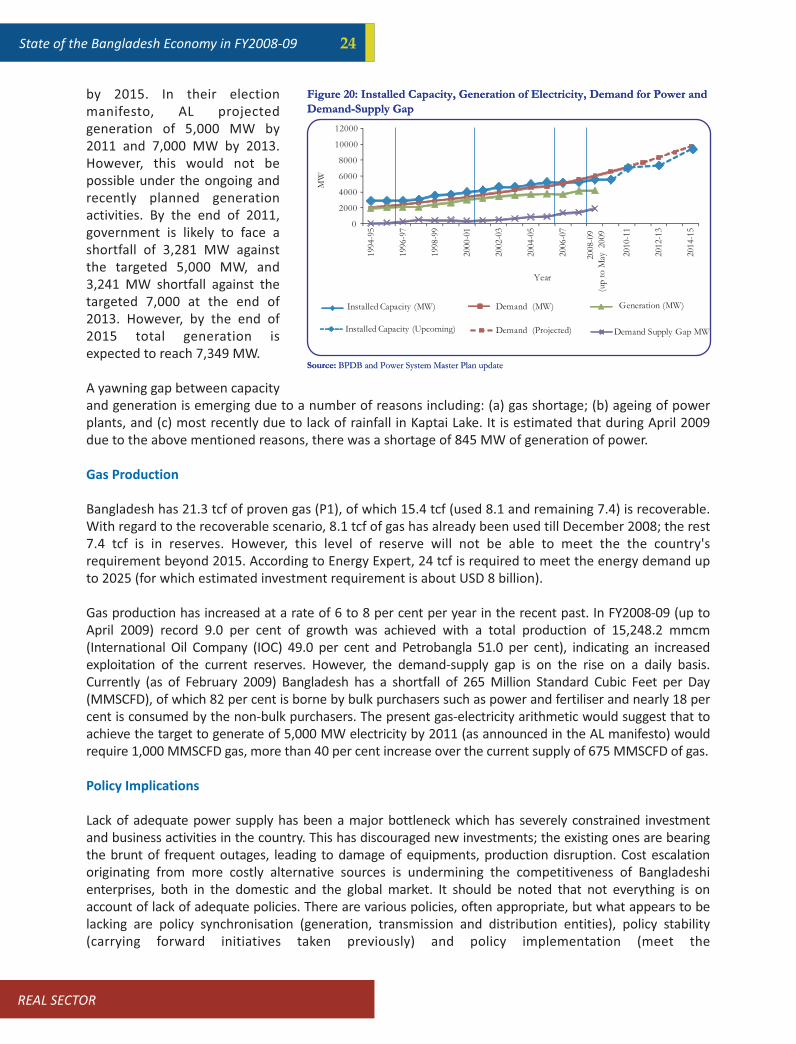
State of the Bangladesh Economy in FY2008-09 24
by 2015. In their election
manifesto, AL projected
generation of 5,000 MW by
2011 and 7,000 MW by 2013.
However, this would not be
possible under the ongoing and
recently planned generation
activities. By the end of 2011,
government is likely to face a
shortfall of 3,281 MW against
the targeted 5,000 MW, and
3,241 MW shortfall against the
targeted 7,000 at the end of
2013. However, by the end of
2015 total generation is
expected to reach 7,349 MW.
A yawning gap between capacity
and generation is emerging due to a number of reasons including: (a) gas shortage; (b) ageing of power
plants, and (c) most recently due to lack of rainfall in Kaptai Lake. It is estimated that during April 2009
due to the above mentioned reasons, there was a shortage of 845 MW of generation of power.
Gas Production
Bangladesh has 21.3 tcf of proven gas (P1), of which 15.4 tcf (used 8.1 and remaining 7.4) is recoverable.
With regard to the recoverable scenario, 8.1 tcf of gas has already been used till December 2008; the rest
7.4 tcf is in reserves. However, this level of reserve will not be able to meet the the country's
requirement beyond 2015. According to Energy Expert, 24 tcf is required to meet the energy demand up
to 2025 (for which estimated investment requirement is about USD 8 billion).
Gas production has increased at a rate of 6 to 8 per cent per year in the recent past. In FY2008-09 (up to
April 2009) record 9.0 per cent of growth was achieved with a total production of 15,248.2 mmcm
(International Oil Company (IOC) 49.0 per cent and Petrobangla 51.0 per cent), indicating an increased
exploitation of the current reserves. However, the demand-supply gap is on the rise on a daily basis.
Currently (as of February 2009) Bangladesh has a shortfall of 265 Million Standard Cubic Feet per Day
(MMSCFD), of which 82 per cent is borne by bulk purchasers such as power and fertiliser and nearly 18 per
cent is consumed by the non-bulk purchasers. The present gas-electricity arithmetic would suggest that to
achieve the target to generate of 5,000 MW electricity by 2011 (as announced in the AL manifesto) would
require 1,000 MMSCFD gas, more than 40 per cent increase over the current supply of 675 MMSCFD of gas.
Policy Implications
Lack of adequate power supply has been a major bottleneck which has severely constrained investment
and business activities in the country. This has discouraged new investments; the existing ones are bearing
the brunt of frequent outages, leading to damage of equipments, production disruption. Cost escalation
originating from more costly alternative sources is undermining the competitiveness of Bangladeshi
enterprises, both in the domestic and the global market. It should be noted that not everything is on
account of lack of adequate policies. There are various policies, often appropriate, but what appears to be
lacking are policy synchronisation (generation, transmission and distribution entities), policy stability
(carrying forward initiatives taken previously) and policy implementation (meet the
Figure 20: Installed Capacity, Generation of Electricity, Demand for Power and Demand-Supply GapFigure 20: Installed Capacity, Generation of Electricity, Demand for Power and Demand-Supply Gap
Source: BPDB and Power System Master Plan updateSource: BPDB and Power System Master Plan update
0
2000
4000
6000
8000
10000
12000
1994
-95
1996
-97
1998
-99
2000
-01
2002
-03
2004
-05
2006
-07
2008
-09
(up t
o M
ay 20
09
2010
-11
2012
-13
2014
-15
MW
Year
Installed Capacity (MW)
Installed Capacity (Upcoming)
Demand (MW)
Demand (Projected)
Generation (MW)
Demand Supply Gap MW
REAL SECTOR

REAL SECTOR
State of the Bangladesh Economy in FY2008-0925
the targeted commissioning date). Realising targets of the government and adding the required new
generation capacities will critically hinge on setting up transparent processes and subjecting politically
inclined businessmen to play by the rules of the game. Energy sector should not be seen as a source of
raising finances for political parties or building up private fortunes through illegal means. Rather the
sector should be treated as the singlemost important area to stimulate productive activities in the
economy and all initiatives should be speedily implemented in an environment of transparency,
accountability and good governance.
Some of the suggested initiatives are:
� There is no alternative to going for new capacities to generate electricity. Initiative is needed on an
urgent basis to settle the dispute over the Fenchuganj 90 MW CCPP (waiting for generation since
January 2009) with the NBR and Chinese counterparts.
� Government has recently (May 2009) planned to set up a number of power plants (5) under PPP,
which is a welcome move. However, transparency is needed with respect to institutional and
procedural requirements in this regard.
� Limited gas reserves of the country calls for rational policies covering both inter-temporal choice of
gas production and allocation among various uses. There is no time left for a comprehensive coal
policy to be adopted by the government which would give clear indication as to how the government
would like to develop the sector in the short and medium term and what would be the rules of game
for the private sector. Diversification of fuel-mix for power generation appears to be a necessity in
view of the present reserve situation with regard to gas. Initiatives to set up a number of liquid fuel
based co-generation power plants is a praiseworthy move of the government in this context.
� Given the increasing investment needs of the country, an improvement in implementation capacity
was called for this year, rather than a reduction in the size of ADP. Till March 2009, only 39 per cent
and a meagre 9 per cent of total ADP allocation, respectively for power and energy and mineral
resources, could be utilised. This must be seen as quite frustrating in view of the current power
availability scenario and the increasing demand for power.
� A coordinated and strengthened effort is required with regard to gas exploration; resolution of
territorial issues with Myanmar and India over offshore gas blocks should be given priority so that
exploration could be initiated in as early a date as possible.
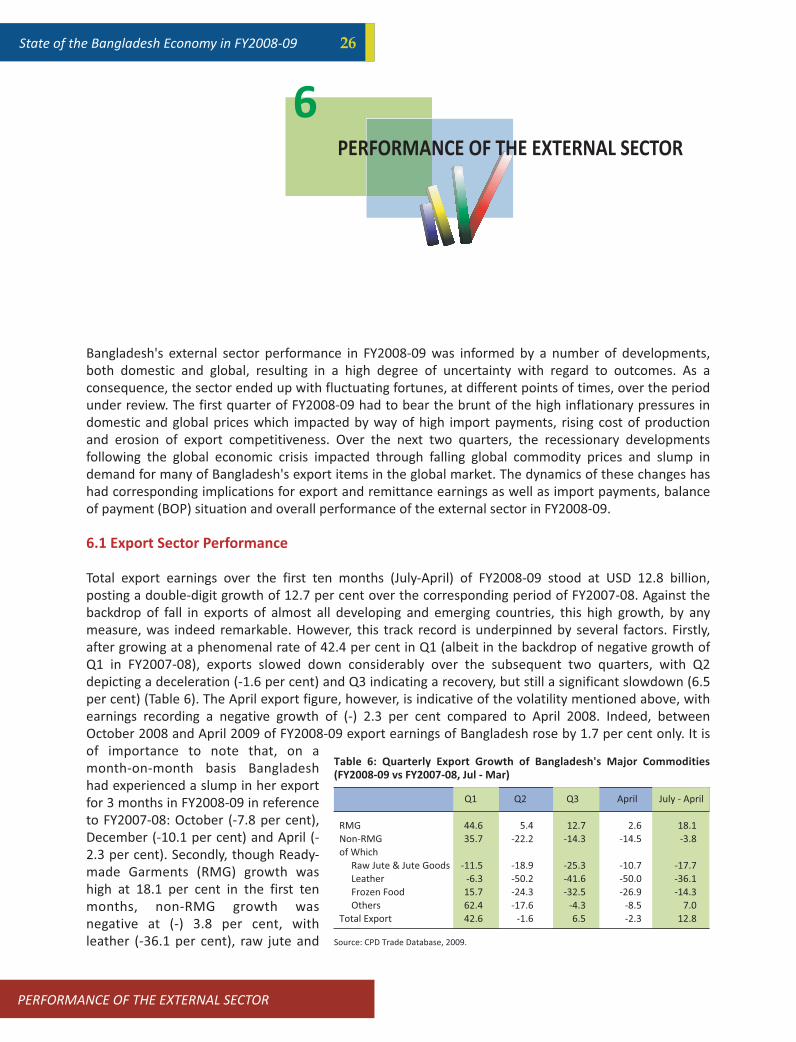
State of the Bangladesh Economy in FY2008-09 26
PERFORMANCE OF THE EXTERNAL SECTOR
6
Table 6: Quarterly Export Growth of Bangladesh's Major Commodities
(FY2008-09 vs FY2007-08, Jul - Mar)
Source: CPD Trade Database, 2009.
Q1 Q2 Q3 April July - April
RMG 44.6 5.4 12.7 2.6 18.1
Non-RMG 35.7 -22.2 -14.3 -14.5 -3.8
of Which
Raw Jute & Jute Goods -11.5 -18.9 -25.3 -10.7 -17.7
Leather -6.3 -50.2 -41.6 -50.0 -36.1
Frozen Food 15.7 -24.3 -32.5 -26.9 -14.3
Others 62.4 -17.6 -4.3 -8.5 7.0
Total Export 42.6 -1.6 6.5 -2.3 12.8
Bangladesh's external sector performance in FY2008-09 was informed by a number of developments,
both domestic and global, resulting in a high degree of uncertainty with regard to outcomes. As a
consequence, the sector ended up with fluctuating fortunes, at different points of times, over the period
under review. The first quarter of FY2008-09 had to bear the brunt of the high inflationary pressures in
domestic and global prices which impacted by way of high import payments, rising cost of production
and erosion of export competitiveness. Over the next two quarters, the recessionary developments
following the global economic crisis impacted through falling global commodity prices and slump in
demand for many of Bangladesh's export items in the global market. The dynamics of these changes has
had corresponding implications for export and remittance earnings as well as import payments, balance
of payment (BOP) situation and overall performance of the external sector in FY2008-09.
6.1 Export Sector Performance
Total export earnings over the first ten months (July-April) of FY2008-09 stood at USD 12.8 billion,
posting a double-digit growth of 12.7 per cent over the corresponding period of FY2007-08. Against the
backdrop of fall in exports of almost all developing and emerging countries, this high growth, by any
measure, was indeed remarkable. However, this track record is underpinned by several factors. Firstly,
after growing at a phenomenal rate of 42.4 per cent in Q1 (albeit in the backdrop of negative growth of
Q1 in FY2007-08), exports slowed down considerably over the subsequent two quarters, with Q2
depicting a deceleration (-1.6 per cent) and Q3 indicating a recovery, but still a significant slowdown (6.5
per cent) (Table 6). The April export figure, however, is indicative of the volatility mentioned above, with
earnings recording a negative growth of (-) 2.3 per cent compared to April 2008. Indeed, between
October 2008 and April 2009 of FY2008-09 export earnings of Bangladesh rose by 1.7 per cent only. It is
of importance to note that, on a
month-on-month basis Bangladesh
had experienced a slump in her export
for 3 months in FY2008-09 in reference
to FY2007-08: October (-7.8 per cent),
December (-10.1 per cent) and April (-
2.3 per cent). Secondly, though Ready-
made Garments (RMG) growth was
high at 18.1 per cent in the first ten
months, non-RMG growth was
negative at (-) 3.8 per cent, with
leather (-36.1 per cent), raw jute and
PERFORMANCE OF THE EXTERNAL SECTOR
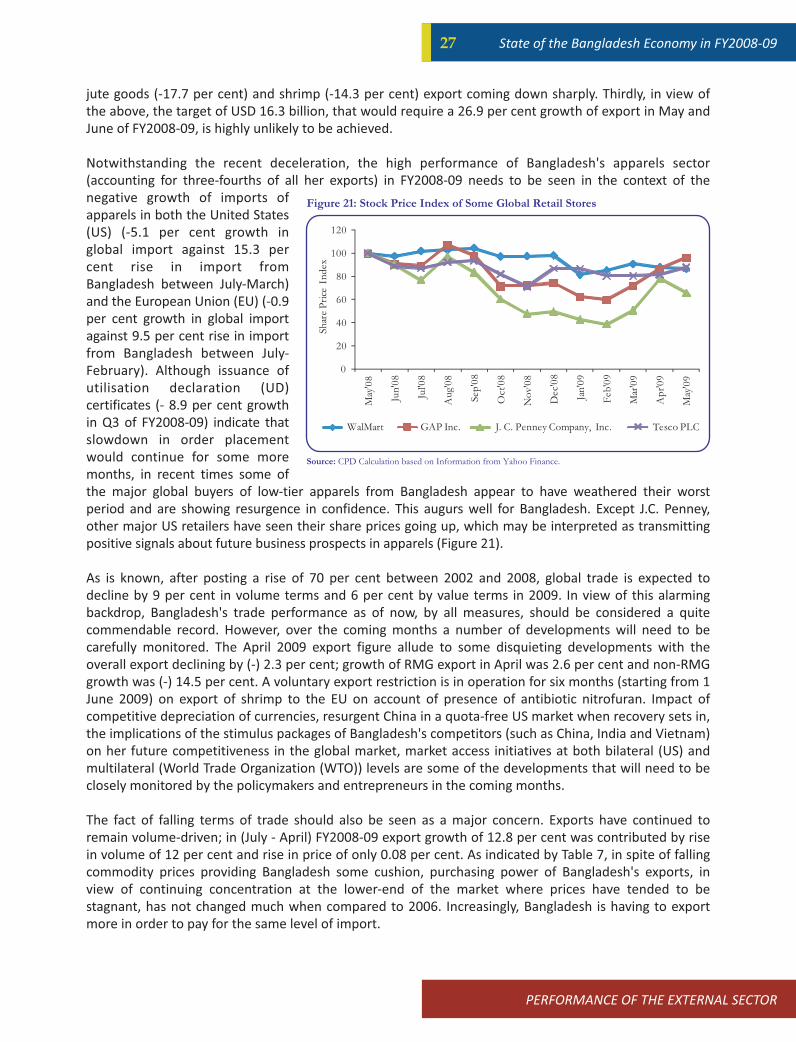
PERFORMANCE OF THE EXTERNAL SECTOR
State of the Bangladesh Economy in FY2008-0927
0
20
40
60
80
100
120
May
'08
Jun
'08
Jul'0
8
Au
g'0
8
Sep
'08
Oct
'08
No
v'0
8
Dec
'08
Jan
'09
Feb
'09
Mar
'09
Ap
r'0
9
May
'09
Shar
e P
rice
In
dex
WalMart GAP Inc. J. C. Penney Company, Inc. Tesco PLC
Figure 21: Stock Price Index of Some Global Retail Stores
Source: CPD Calculation based on Information from Yahoo Finance.
jute goods (-17.7 per cent) and shrimp (-14.3 per cent) export coming down sharply. Thirdly, in view of
the above, the target of USD 16.3 billion, that would require a 26.9 per cent growth of export in May and
June of FY2008-09, is highly unlikely to be achieved.
Notwithstanding the recent deceleration, the high performance of Bangladesh's apparels sector
(accounting for three-fourths of all her exports) in FY2008-09 needs to be seen in the context of the
negative growth of imports of
apparels in both the United States
(US) (-5.1 per cent growth in
global import against 15.3 per
cent rise in import from
Bangladesh between July-March)
and the European Union (EU) (-0.9
per cent growth in global import
against 9.5 per cent rise in import
from Bangladesh between July-
February). Although issuance of
utilisation declaration (UD)
certificates (- 8.9 per cent growth
in Q3 of FY2008-09) indicate that
slowdown in order placement
would continue for some more
months, in recent times some of
the major global buyers of low-tier apparels from Bangladesh appear to have weathered their worst
period and are showing resurgence in confidence. This augurs well for Bangladesh. Except J.C. Penney,
other major US retailers have seen their share prices going up, which may be interpreted as transmitting
positive signals about future business prospects in apparels (Figure 21).
As is known, after posting a rise of 70 per cent between 2002 and 2008, global trade is expected to
decline by 9 per cent in volume terms and 6 per cent by value terms in 2009. In view of this alarming
backdrop, Bangladesh's trade performance as of now, by all measures, should be considered a quite
commendable record. However, over the coming months a number of developments will need to be
carefully monitored. The April 2009 export figure allude to some disquieting developments with the
overall export declining by (-) 2.3 per cent; growth of RMG export in April was 2.6 per cent and non-RMG
growth was (-) 14.5 per cent. A voluntary export restriction is in operation for six months (starting from 1
June 2009) on export of shrimp to the EU on account of presence of antibiotic nitrofuran. Impact of
competitive depreciation of currencies, resurgent China in a quota-free US market when recovery sets in,
the implications of the stimulus packages of Bangladesh's competitors (such as China, India and Vietnam)
on her future competitiveness in the global market, market access initiatives at both bilateral (US) and
multilateral (World Trade Organization (WTO)) levels are some of the developments that will need to be
closely monitored by the policymakers and entrepreneurs in the coming months.
The fact of falling terms of trade should also be seen as a major concern. Exports have continued to
remain volume-driven; in (July - April) FY2008-09 export growth of 12.8 per cent was contributed by rise
in volume of 12 per cent and rise in price of only 0.08 per cent. As indicated by Table 7, in spite of falling
commodity prices providing Bangladesh some cushion, purchasing power of Bangladesh's exports, in
view of continuing concentration at the lower-end of the market where prices have tended to be
stagnant, has not changed much when compared to 2006. Increasingly, Bangladesh is having to export
more in order to pay for the same level of import.

State of the Bangladesh Economy in FY2008-09 28
Dozens of RMG Rise (in Rise (in Tons of Jute Goods Rise (in Rise (in
times) b/a times) c/a times) e/d times) f/d
2006 2008 2009 2006 2008 2009
(Avg) (a) (Avg) (b) (Apr) (c) (Avg) (d) (Avg) (e) (Apr) (f)
1 barrel of Oil (Fuel) 2.3 3.4 2.3 1.5 1.0 0.1 0.2 0.1 1.5 1.0
1 ton of rice 11.0 23.2 21.9 2.1 2.0 0.5 1.1 1.0 2.2 2.0
1 ton of wheat 7.1 11.3 8.3 1.6 1.2 0.3 0.6 0.4 1.7 1.2
1 MT Soyabean Oil 21.2 39.1 26.3 1.8 1.2 1.0 1.9 1.3 1.9 1.2
Table 7: Falling Purchasing Power of Exports
Source: CPD Trade Database, 2009.
6.2 Import Sector Performance
Inspite of the falling global commodity prices, import payments rose by 12.4 per cent over the July-
March, FY2008-09 period compared to the corresponding period of FY2008, in value terms. If non-food,
non-oil imports are considered, the rise would be 17.2 per cent. Since prices of many imported items
have been posting a declining trend in recent times, the growth in volume terms, in many instances, may
have indeed been higher. However, since there is no indication of fall in its prices in the global market,
the negative growth of import payments for capital machineries, at (-) 12.1 per cent, should be seen as a
concern; this is further substantiated by matching L/C openings for capital machineries (-31.5 per cent
growth). In addition, the rising price of oil (which has started to rise after having bottomed at about USD
40/barrel and now stands at about USD 68/barrel) could also push up the import bill in the coming
months, as is indicated particularly by the movement of oil prices in futures market. Relatively high
growth of raw materials and intermediate inputs such as raw cotton (11.6 per cent), yarn (23.9 per cent)
and iron, steel and base metals (35.3 per cent), in contrast to negative growth of capital machineries
possibly indicates higher capacity utilisation rather than investment in new ventures.
6.3 Remittance Flow
As has been noted in earlier recessions as well, remittance flows tend to be more resilient than exports.
Notwithstanding this, a number of developing countries have experienced fall in remittance flows.
However, Bangladesh is an outlier even here with a robust rise of 22.4 per cent in remittance flows
between July-May of FY2008-09 compared to the corresponding period of FY2007-08. Lower cost of
transfer of remittance (a 50 per cent fall in recent times), rising share of skilled migrant labour and
facilitation for sending remittance home (inducing switch from informal to formal thanks to collaboration
between banks and local agents), also may have contributed to this growth. Remittance flow from
developing countries of Middle East has been high, whilst those from Eurozone countries indicate some
fall underpinned by impact of economic crisis and the consequent pressure on their respective labour
markets. Indeed, number of workers leaving abroad between July and March of FY2008-09 shows a
sharp drop of 36 per cent (from 728 thousand to 537 thousand). Whilst the flow versus stock side of the
story could, to some extent, explain the rise in remittance flow inspite of lower number of people going
abroad, this was likely to put more pressure on domestic labour market and will likely result in reduced
rise in remittance flow in near future. According to Bureau of Manpower, Employment and Training
(BMET), 28 thousand workers have returned home during the first quarter of 2009. This number, in all
likelihood, was an underestimate. The stimulus package announced by the government does not have
any targeted support scheme for terminal returnees. There ought to be appropriate initiatives on the
part of the government in support of the returnee migrants through credit support to start new
businesses and also settlement support (possibly with some help from the Expatriate Welfare Fund).
PERFORMANCE OF THE EXTERNAL SECTOR

PERFORMANCE OF THE EXTERNAL SECTOR
State of the Bangladesh Economy in FY2008-0929
0
0.5
1
1.5
2
2.5
3
3.5
4
0
1000
2000
3000
4000
5000
6000
7000
FY2002 FY2003 FY2004 FY2005 FY2006 FY2007 FY2008 FY2009
(19 May)
Mo
nth
s
Mill
ion
USD
FOREX Reserves Equivalent Months of Import
Figure 22: FOREX Reserves and Equivalent Months of Import
Source: CPD Trade Database, 2009.
6.4 Balance of Payment
Bangladesh's current account balance for the first eight months, as distinct from many other developing
countries, has indeed improved (from USD 299 million to USD 816 million) compared to the
corresponding period of FY2007-08. This was underwritten by robust exports and remittance earnings
(combinedly by 16.3 per cent), and slowdown in import payments (12.4 per cent). Although the deficit in
the trade balance was higher, at (-) USD 3,560 million compared to (-) USD 3,087 million, significantly
high private transfers has contributed to the aforesaid improvement in the current account balance.
Indeed, the overall balance improved from USD 310 million to USD 773 million over the same period. As
imports pick up and exports slow down, the balances are likely to come under pressure in near future.
6.5 Foreign Exchange Reserves
Foreign exchange reserves have been replenished by buoyant growth in remittance flow to the country,
coupled with impressive growth in export earnings. Foreign exchange (forex) reserves stood at USD
6,410.3 million (on 19 May 2009)
which was higher by 21.3 per
cent when compared against the
corresponding month of FY2007-
08. Figure 22 depicts the growth
in forex reserves and its
equivalence in terms of months
of import. At 3.3 months, this
was somewhat higher than the
generally accepted reserve
requirements of three months.
This cushion, crucial in terms of
keeping a stable exchange rate,
providing capacity to underwrite
the import and meeting debt-
servicing liabilities, will be crucial
to maintaining macroeconomic
stability in the coming period.
Monitoring the changes in the composition of forex reserves and safeguarding the purchasing power of
the reserves will be important.
6.6 Foreign Aid
Latest figures available for FY2008-09 (July-March) indicate that a total amount of USD 1.35 billion was
disbursed in the current fiscal, almost the same as in the last year. Net foreign aid receipts in FY2008-09
stood at USD 732.0 million, somewhat lower than the USD 823.8 million recorded over the
corresponding period of FY2007-08.
It is to be noted that the share of grants in the total disbursed aid has been on the decline in recent
times, indicating the possibility of higher debt-servicing liabilities in future (Table 8). The share of
commercial lending (often at LIBOR plus rates) is also on the rise. In this context, measures aimed at
ensuring timely disbursement, appropriate and effective utilisation of aid and access to aid in the form of
budgetary support will gain increasing importance.

State of the Bangladesh Economy in FY2008-09 30
Table 8: Disbursement of Grants and Loans, and Payments Made
Source: CPD Trade Database, 2009.
Aid Scenario Financing scenario
(Million USD)
Fiscal Years Total Aid Share of Grants Share of Loans Principal Interest Total
(Million USD) % %
FY1985 1269.4 55.4 44.6 106.0 64.0 170.0
FY1994 1558.6 45.6 54.4 263.0 139.0 402.0
FY2006 1365.2 36.7 63.3 502.0 176.0 678.0
FY2007 1630.6 36.2 63.8 540.0 182.0 722.0
FY2008 2061.5 31.9 68.1 586.0 184.0 770.0
FY2009 1356.8 28.0 72.0 411.0 135.8 547.0
(Jul - Mar)
Overall, till now,
B a n g l a d e s h ' s
external sector has
been able to
demonstrate both
resilience and
stability in the face
of formidable
challenges and
uncertainties with
regard to domestic
i n v e s t m e n t
e n v i r o n m e n t ,
volatility in the
global market and the adverse implications of the ongoing financial crisis. As was noted above, a number
of recent developments should be kept in the perspective, though, that could undermine continuity of
this record in the coming months and over the next fiscal year. Firstly, the fact of recent slowdown in the
pace of export growth; secondly, possibility of reversal of the trend of falling global commodity prices;
thirdly, adverse impact of stimulus packages and counter-cyclical policies pursued by Bangladesh's
competitors; and, fourthly, reduced number of workers going abroad and its consequence for domestic
labour market and future remittance flow. A renewed effort at enhancing external sector performance
through appropriate investments, skill upgradation, adequate incentives, productivity enhancements and
product diversification will be called for in view of these emerging developments.
Sustaining the positive current account balance, maintaining stability of BDT's exchange rate and prudent
management of financial flows appear to be critical areas in order to ensure continuity of the current
robust performance of the external sector indicators over the next fiscal year. In view of the performance
of the export sector in April this year and the signals stemming from the global market, the stimulus
package may need to be revisited to identify additional measures and incentives which could be put in
place in support of export-oriented sectors and activities. Bangladesh should also be well prepared to
take advantage of the global recovery once it takes off, perhaps, in early 2010. Towards this end, the
groundwork will have to be initiated well in advance in FY2009-10.
PERFORMANCE OF THE EXTERNAL SECTOR
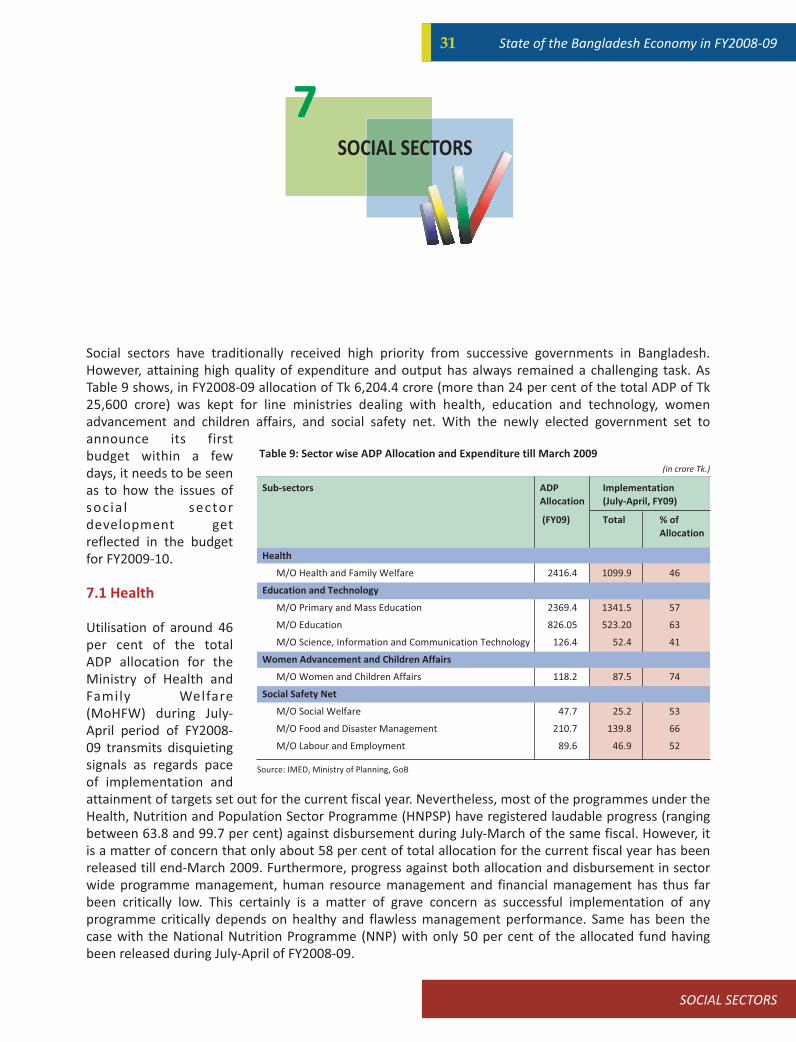
SOCIAL SECTORS
State of the Bangladesh Economy in FY2008-0931
SOCIAL SECTORS
7
Table 9: Sector wise ADP Allocation and Expenditure till March 2009
(in crore Tk.)
Source: IMED, Ministry of Planning, GoB
Sub-sectors ADP Implementation
Allocation (July-April, FY09)
(FY09) Total % of
Allocation
Health
M/O Health and Family Welfare 2416.4 1099.9 46
Education and Technology
M/O Primary and Mass Education 2369.4 1341.5 57
M/O Education 826.05 523.20 63
M/O Science, Information and Communication Technology 126.4 52.4 41
Women Advancement and Children Affairs
M/O Women and Children Affairs 118.2 87.5 74
Social Safety Net
M/O Social Welfare 47.7 25.2 53
M/O Food and Disaster Management 210.7 139.8 66
M/O Labour and Employment 89.6 46.9 52
Social sectors have traditionally received high priority from successive governments in Bangladesh.
However, attaining high quality of expenditure and output has always remained a challenging task. As
Table 9 shows, in FY2008-09 allocation of Tk 6,204.4 crore (more than 24 per cent of the total ADP of Tk
25,600 crore) was kept for line ministries dealing with health, education and technology, women
advancement and children affairs, and social safety net. With the newly elected government set to
announce its first
budget within a few
days, it needs to be seen
as to how the issues of
soc ia l sector
development get
reflected in the budget
for FY2009-10.
7.1 Health
Utilisation of around 46
per cent of the total
ADP allocation for the
Ministry of Health and
Family Welfare
(MoHFW) during July-
April period of FY2008-
09 transmits disquieting
signals as regards pace
of implementation and
attainment of targets set out for the current fiscal year. Nevertheless, most of the programmes under the
Health, Nutrition and Population Sector Programme (HNPSP) have registered laudable progress (ranging
between 63.8 and 99.7 per cent) against disbursement during July-March of the same fiscal. However, it
is a matter of concern that only about 58 per cent of total allocation for the current fiscal year has been
released till end-March 2009. Furthermore, progress against both allocation and disbursement in sector
wide programme management, human resource management and financial management has thus far
been critically low. This certainly is a matter of grave concern as successful implementation of any
programme critically depends on healthy and flawless management performance. Same has been the
case with the National Nutrition Programme (NNP) with only 50 per cent of the allocated fund having
been released during July-April of FY2008-09.
State of the Bangladesh Economy in FY2008-09 32
Community Clinic: Easing Access to Basic Health Care Services
As of April 2009, a total of 10,349 Community Clinics (CCs) have been handed over to the Community
Groups (CGs) out of which 8,464 are in operation. Since the new government came to power, medicine
supply worth Tk 6 crore has been distributed at the district level for the CCs with another consignment
worth Tk 10 crore in the pipeline. Annual budget to the tune of at least Tk 230 crore will be required to
ensure proper functioning of the operational CCs throughout the country. This has to be further
strengthened by deployment of trained health workers and competent assistants, coordination among
the members of the CGs, and regular monitoring and evaluation by relevant government agencies.
The newly elected government will need to play a proactive role in ensuring timely release and
appropriate utilisation of funds not only during the next few months of the current fiscal, but also in the
coming years to create a health system that caters to the needs and priorities of the beneficiary groups.
7.2 Education and Technology
Pace of ADP utilisation by the Ministry of Primary and Mass Education (MoPME) and Ministry of Education
(MoE) during July to April of FY2008-09 stood at only 57 per cent and 63 per cent respectively. Although
Primary Education Development Programme (PEDP) II has registered 69 per cent utilisation against
Revised Annual Development Programme (RADP) during the said period, progress in other programmes
such as Primary Education Stipend Project (Phase II), Reaching Out of School Children (ROSC) and
Secondary Education Quality and Access Enhancement Project (SEQAEP) has been abysmally low.
Efforts need to be geared up for successful implementation of these projects to expedite the journey
towards achieving the Millennium Development Goal (MDG) of ensuring universal primary education for
all children. However, time has come to give more attention to quality aspects of education. Government
should also consider setting up an e-Education cell under the Prime Minister's Office (PMO) to reach the
goal of creating the declared objective of Digital Bangladesh.
7.3 Social Safety Net
Progress with regard to most of the cash allowance programmes for the poor and vulnerable has been
significantly positive during the July-April period of FY2008-09 both in terms of coverage and distribution.
However, particular attention needs to be given to addressing violence against women and ensuring
timely disbursement of allowance for poor lactating mothers as disbursement in both these cases was
only to the tune of 50 per cent of allocation.
Employment Generation Scheme
Anecdotal data and information suggest that the government is expected to allocate Tk 1,500-Tk 2,000
crore in the next fiscal to provide technical and vocational training to 20 thousand unemployed Higher
School Certificate (HSC) graduates and to create employment opportunities for the returnee migrants
who fell victim to early job retrenchment in various countries due to the ongoing global economic crisis.
The government is also planning to initiate a Cash for Work programme instead of the 100-Day
Employment Generation Programme. However, it is not yet clear as to whether allocation for the new
programme will be a stand alone one or a combination of the outstanding amount from the previous
scheme and new allocations in the upcoming budget.
The government should use the New Poverty Map to identify poverty-prone areas where social safety
net programmes need to be further strengthened. Particular attention needs to be given to monga-prone
SOCIAL SECTORS
SOCIAL SECTORS
State of the Bangladesh Economy in FY2008-0933
northern districts and areas that have been hit by cyclone Aila. Government should also continue the
Five Year Guaranteed Employment Scheme of the CTG in addition to the new initiatives. In addition, Fund
for Climate Change (Tk 300 crore) needs to be effectively utilised to ensure support for the potential
climate change refugees.
Public Food Distribution System (PFDS)
Distribution of food grains through both priced and non-priced channels during July-February period of
FY2008-09 has been lower than that of the comparable period of the previous fiscal. Besides,
preparation of lists of beneficiaries for various safety net and allowance programme has often been
found to be biased and influenced by local and national politics. This trend needs to be reversed to raise
the efficacy of PFDS.
Given the present circumstances, both Vulnerable Group Development (VGD) and Vulnerable Group
Feeding (VGF) programmes will need to be expanded and expedited in the coastal areas that have been
badly hit by cyclone Aila. Such efforts may call for further procurement and allocation of food grains by
the government. Bangladesh should also try to get funds from Global Food Crisis Response Program
(GFRP) by World Bank to expand its VGF programmes. Besides, a fresh beneficiary list should be
prepared to support the deserving deprived and disadvantaged people. The government may use the
National ID card to make the system monitorable, simple, speedy and objective.
SOCIAL SECTORS
State of the Bangladesh Economy in FY2008-09 34
Concluding Remarks
8
FY2008-09 was an extraordinary time for Bangladesh. It was a year of democratic transition, volatility in
domestic economy, global financial meltdown and political transition. In this backdrop, the Bangladesh
economy, at aggregate level, performed quite appreciably, with a near-six per cent GDP growth and four
and a half per cent per capita income growth. Bangladesh remained one of the very few low income
countries that was able to record this level of performance in FY2008-09. It speaks of significant resilience
of the Bangladesh economy. Most of the macroeconomic indicators, notwithstanding their structural flaws,
demonstrated overall robustness. Many of the fault lines which afflicted the benchmark of FY2008-09 were
much less pronounced at the end of the fiscal year. Thus, FY2009-10 will kick off on a much sounder basis
compared to the preceding year. However, during this period a number of new issues in addition to the set
of pending issues, will continue to undermine the growth and poverty alleviation prospect of the country.
This is not to say that the new circumstances will not offer any new opportunities.
In the following paragraphs an attempt has been made to highlight some of these challenges to be
addressed and opportunities to be seized by the Bangladesh economy in the context of the upcoming
fiscal year.
Energising Investment
In the backdrop of the deceleration in investment performance in FY2008-09, a renewed effort will need
to be taken in FY2009-10 to improve both the quantitative and the qualitative aspects of the ADP which
is then able to stimulate and crowd-in private sector investment. Towards this, institutional as well as
human resources capacities of relevant agencies of the Government will need to be substantively
strengthened and improved by putting in place adequate resources, capacity-building mechanisms and
incentive structure. Quality of output and monitoring of outcomes will need to be given highest priority
in implementing the ADP. Infrastructure development, particularly in power and energy, will be critical
and, in this context, public-private partnership will need to be given due importance. To stimulate private
sector investment, interest rate policy will play a crucial role and here the Bangladesh Bank will need to
play a leading role to reduce the spread between lending and deposit rates, if need be by pursuing a
proactive policy both in the context of ceiling on lending and also floor on deposit rates. In view of the
constrains in mobilising adequate domestic resources, FDI will need to be encouraged both in
infrastructure and in modern sectors, focusing on both domestic and international markets.
Consolidating Agriculture
Food security, given the experience in FY2008-09, should continue to merit highest priority in FY2009-10.
Here the challenge will be to balance the apparently conflicting interest of consumers and producers. Of
Concluding Remarks
Concluding Remarks
State of the Bangladesh Economy in FY2008-0935
critical importance in this connection will be to stimulate productivity of agriculture through prudent
subsidy policy, incentives to promote adoption of high-yielding varieties and technology adoption and
adaptation. Procurement price should benefit the farmers and appropriate institutional mechanisms will
need to be designed towards this. Timely delivery of fertiliser and wider availability of HYV seeds should
be ensured through appropriate delivery mechanisms. Food storage facilities should be built up and
there should be timely intervention in the market to ensure price stability. Whilst government can not
substitute market, Trading Corporation of Bangladesh (TCB) should be brought into play whenever there
is a strategic need.
Protecting External Sector
The overall robust performance of export sector in FY2008-09 conceals the recent significant
deceleration in export growth. This is perhaps indicative of the lagged nature of impact of the ongoing
global financial crisis on the performance of Bangladesh's external sector. Thus, the performance of
external sector over first half of FY2009-10 will need to be closely monitored. This will require speedy
steps to address the negative fall outs of the crisis with regard to markets of both goods and services
export of Bangladesh. The stimulus package, already announced, should be further consolidated by
taking cognisance of the recent developments. Workers returning from abroad due to the global financial
crisis should be extended the required help in terms of access to credit as well as safety net programmes,
and appropriate support services should be placed for them in due earnest. Bangladesh will also need to
further strengthen efforts towards market and product diversification so that once recovery of the global
economy sets in, her exporters of goods and services are well-positioned to take advantage of the global
recovery. The interest shown by Japanese importers of apparels, the great promise of the export-
oriented ship building industry, export prospects in the regional markets are just a few areas that are
indicative of the prospects in this context.
Strengthening Public Finance
In FY2009-10 emphasis will need to be given to strengthening the capacity of revenue mobilisation
authorities, particularly in the area of generating direct taxes. Since the size of deficits is likely to be
higher in FY2009-10, its financing will need to be done in a prudent manner. Of critical importance will be
to ensure that financing of deficit is non-inflationary and is done through budgetary support from the aid
component as much as possible.
Reviving Development Administration
As regards injecting momentum in development administration, the focus should be on continuation and
consolidation of the reforms undertaken in the recent past to raise the efficacy of governance.
Strengthening of local governments and bringing them under the ambit of budgetary process, by
ensuring their broader participation in designing, implementing, and monitoring of the developmental
works will be critically important. Private sector's interest in PPP will need to be ensured through
appropriate institutional support and incentives. A PPP act may need to be enacted towards this.
Relationship with NGOs, to ensure broader partnership and effective delivery of services in such areas as
health and education, should be strengthened by taking an enlightened view with regard to such
partnership and collaboration.
In the backdrop of high public expectations on delivery of electoral promises and with the lurking
apprehensions that Bangladesh may be increasingly affected by the continuing global crisis, economic
management will be a challenging task in FY2009-10. Adequate addressing of the attendant challenges will
entail design of a set of appropriate budgetary measures, but much more on the efficacy of their delivery. And
such delivery will need, in the coming days more than ever before, a coherent, coordinated and committed
participation of the total government machinery and all other development actors and stakeholders.
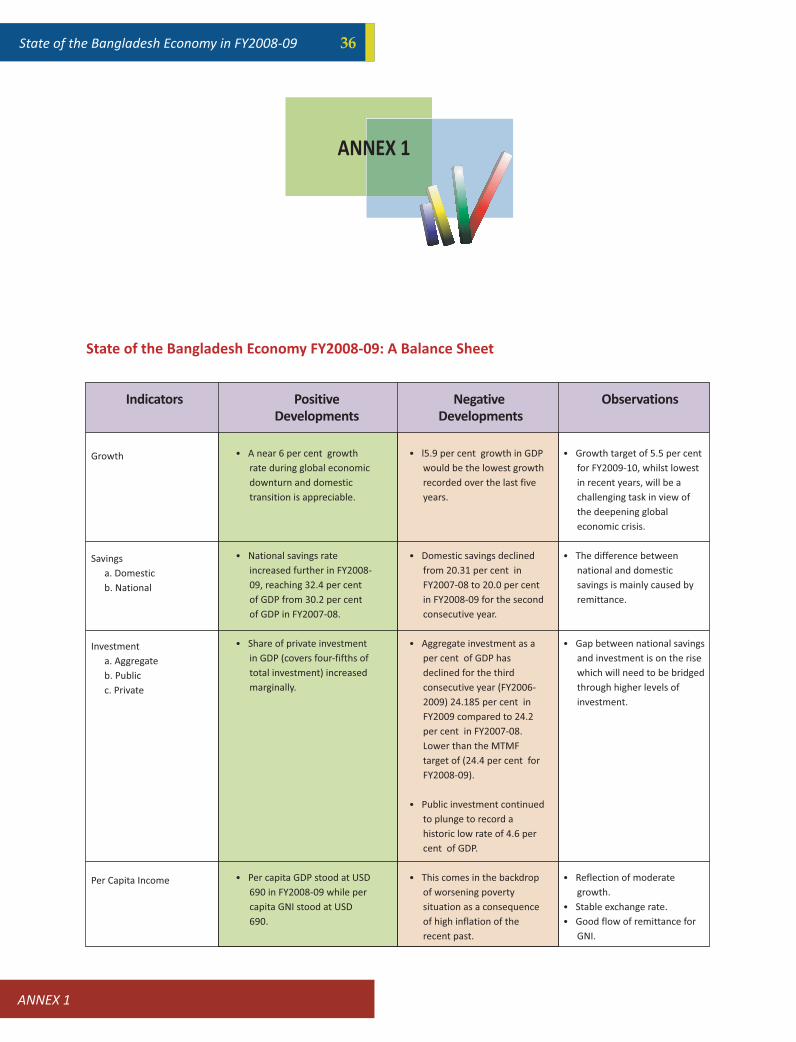
State of the Bangladesh Economy in FY2008-09 36
ANNEX 1
State of the Bangladesh Economy FY2008-09: A Balance Sheet
Growth
Savings
a. Domestic
b. National
Investment
a. Aggregate
b. Public
c. Private
Per Capita Income
� A near 6 per cent growth
rate during global economic
downturn and domestic
transition is appreciable.
� National savings rate
increased further in FY2008-
09, reaching 32.4 per cent
of GDP from 30.2 per cent
of GDP in FY2007-08.
� Share of private investment
in GDP (covers four-fifths of
total investment) increased
marginally.
� Per capita GDP stood at USD
690 in FY2008-09 while per
capita GNI stood at USD
690.
� l5.9 per cent growth in GDP
would be the lowest growth
recorded over the last five
years.
� Domestic savings declined
from 20.31 per cent in
FY2007-08 to 20.0 per cent
in FY2008-09 for the second
consecutive year.
� Aggregate investment as a
per cent of GDP has
declined for the third
consecutive year (FY2006-
2009) 24.185 per cent in
FY2009 compared to 24.2
per cent in FY2007-08.
Lower than the MTMF
target of (24.4 per cent for
FY2008-09).
� Public investment continued
to plunge to record a
historic low rate of 4.6 per
cent of GDP.
� This comes in the backdrop
of worsening poverty
situation as a consequence
of high inflation of the
recent past.
� Growth target of 5.5 per cent
for FY2009-10, whilst lowest
in recent years, will be a
challenging task in view of
the deepening global
economic crisis.
� The difference between
national and domestic
savings is mainly caused by
remittance.
� Gap between national savings
and investment is on the rise
which will need to be bridged
through higher levels of
investment.
� Reflection of moderate
growth.
� Stable exchange rate.
� Good flow of remittance for
GNI.
Indicators Positive
Developments
Negative
Developments
Observations
ANNEX 1
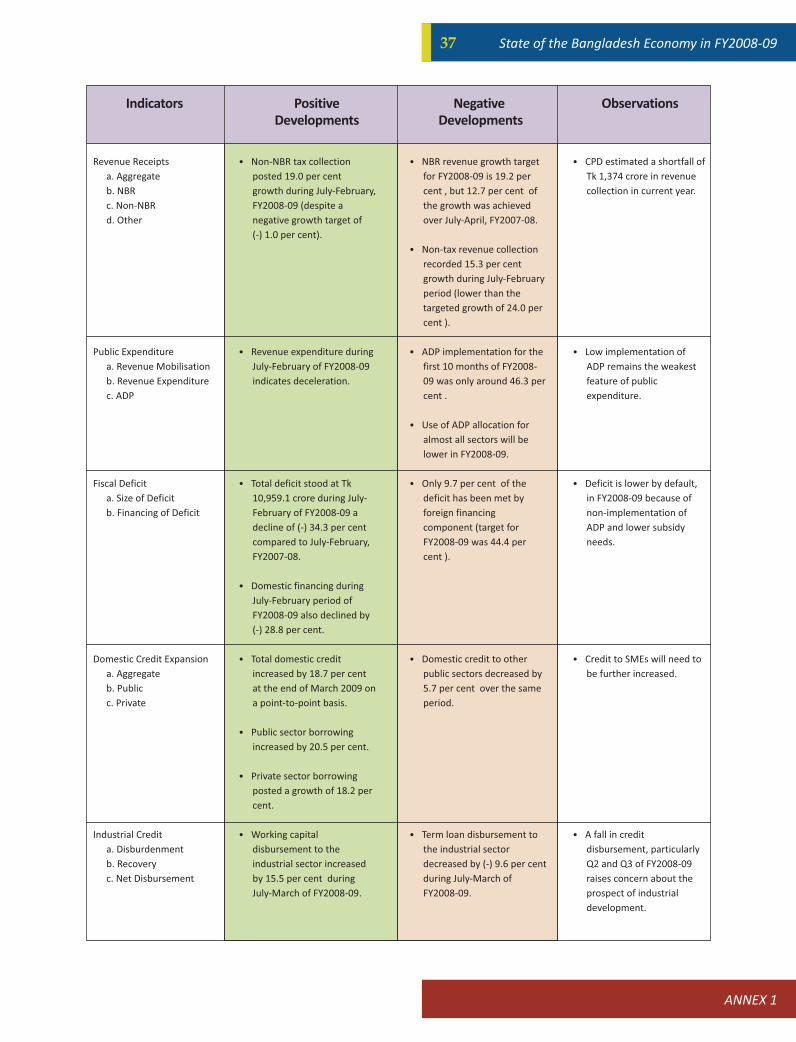
ANNEX 1
State of the Bangladesh Economy in FY2008-0937
Revenue Receipts
a. Aggregate
b. NBR
c. Non-NBR
d. Other
Public Expenditure
a. Revenue Mobilisation
b. Revenue Expenditure
c. ADP
Fiscal Deficit
a. Size of Deficit
b. Financing of Deficit
Domestic Credit Expansion
a. Aggregate
b. Public
c. Private
Industrial Credit
a. Disburdenment
b. Recovery
c. Net Disbursement
� Non-NBR tax collection
posted 19.0 per cent
growth during July-February,
FY2008-09 (despite a
negative growth target of
(-) 1.0 per cent).
� Revenue expenditure during
July-February of FY2008-09
indicates deceleration.
� Total deficit stood at Tk
10,959.1 crore during July-
February of FY2008-09 a
decline of (-) 34.3 per cent
compared to July-February,
FY2007-08.
� Domestic financing during
July-February period of
FY2008-09 also declined by
(-) 28.8 per cent.
� Total domestic credit
increased by 18.7 per cent
at the end of March 2009 on
a point-to-point basis.
� Public sector borrowing
increased by 20.5 per cent.
� Private sector borrowing
posted a growth of 18.2 per
cent.
� Working capital
disbursement to the
industrial sector increased
by 15.5 per cent during
July-March of FY2008-09.
� NBR revenue growth target
for FY2008-09 is 19.2 per
cent , but 12.7 per cent of
the growth was achieved
over July-April, FY2007-08.
� Non-tax revenue collection
recorded 15.3 per cent
growth during July-February
period (lower than the
targeted growth of 24.0 per
cent ).
� ADP implementation for the
first 10 months of FY2008-
09 was only around 46.3 per
cent .
� Use of ADP allocation for
almost all sectors will be
lower in FY2008-09.
� Only 9.7 per cent of the
deficit has been met by
foreign financing
component (target for
FY2008-09 was 44.4 per
cent ).
� Domestic credit to other
public sectors decreased by
5.7 per cent over the same
period.
� Term loan disbursement to
the industrial sector
decreased by (-) 9.6 per cent
during July-March of
FY2008-09.
� CPD estimated a shortfall of
Tk 1,374 crore in revenue
collection in current year.
� Low implementation of
ADP remains the weakest
feature of public
expenditure.
� Deficit is lower by default,
in FY2008-09 because of
non-implementation of
ADP and lower subsidy
needs.
� Credit to SMEs will need to
be further increased.
� A fall in credit
disbursement, particularly
Q2 and Q3 of FY2008-09
raises concern about the
prospect of industrial
development.
Indicators Positive
Developments
Negative
Developments
Observations
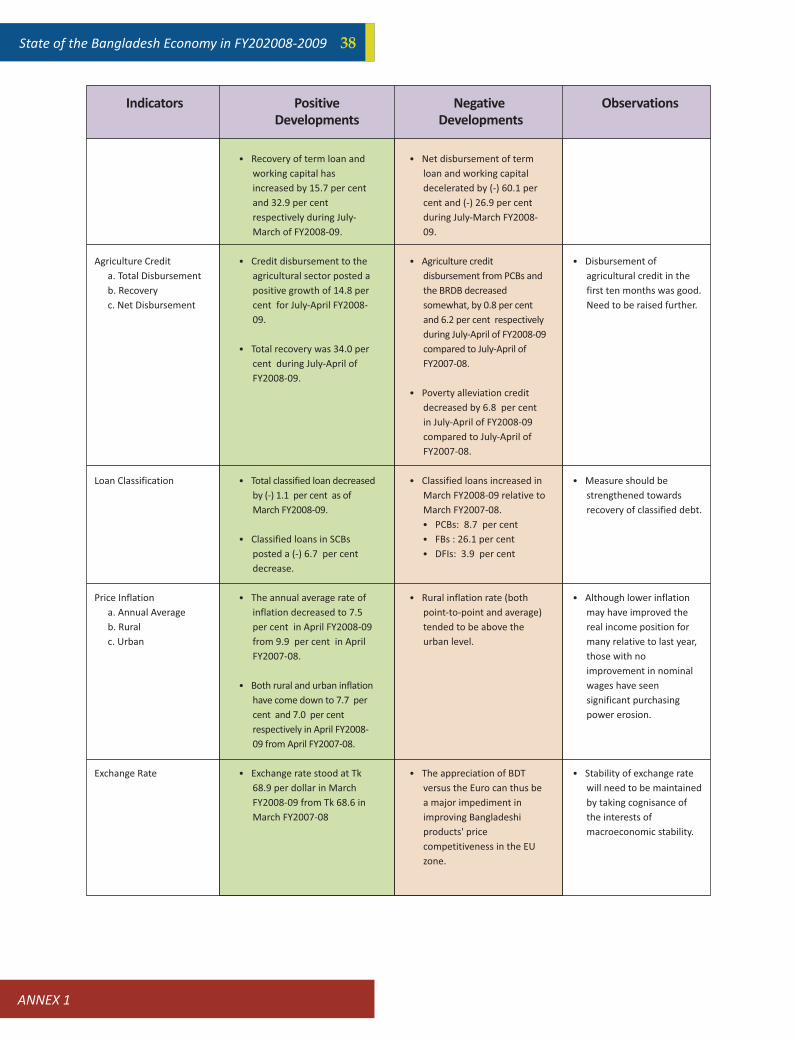
State of the Bangladesh Economy in FY202008-2009 38
Agriculture Credit
a. Total Disbursement
b. Recovery
c. Net Disbursement
Loan Classification
Price Inflation
a. Annual Average
b. Rural
c. Urban
Exchange Rate
� Recovery of term loan and
working capital has
increased by 15.7 per cent
and 32.9 per cent
respectively during July-
March of FY2008-09.
� Credit disbursement to the
agricultural sector posted a
positive growth of 14.8 per
cent for July-April FY2008-
09.
� Total recovery was 34.0 per
cent during July-April of
FY2008-09.
� Total classified loan decreased
by (-) 1.1 per cent as of
March FY2008-09.
� Classified loans in SCBs
posted a (-) 6.7 per cent
decrease.
� The annual average rate of
inflation decreased to 7.5
per cent in April FY2008-09
from 9.9 per cent in April
FY2007-08.
� Both rural and urban inflation
have come down to 7.7 per
cent and 7.0 per cent
respectively in April FY2008-
09 from April FY2007-08.
� Exchange rate stood at Tk
68.9 per dollar in March
FY2008-09 from Tk 68.6 in
March FY2007-08
� Net disbursement of term
loan and working capital
decelerated by (-) 60.1 per
cent and (-) 26.9 per cent
during July-March FY2008-
09.
� Agriculture credit
disbursement from PCBs and
the BRDB decreased
somewhat, by 0.8 per cent
and 6.2 per cent respectively
during July-April of FY2008-09
compared to July-April of
FY2007-08.
� Poverty alleviation credit
decreased by 6.8 per cent
in July-April of FY2008-09
compared to July-April of
FY2007-08.
� Classified loans increased in
March FY2008-09 relative to
March FY2007-08.
� PCBs: 8.7 per cent
� FBs : 26.1 per cent
� DFIs: 3.9 per cent
� Rural inflation rate (both
point-to-point and average)
tended to be above the
urban level.
� The appreciation of BDT
versus the Euro can thus be
a major impediment in
improving Bangladeshi
products' price
competitiveness in the EU
zone.
� Disbursement of
agricultural credit in the
first ten months was good.
Need to be raised further.
� Measure should be
strengthened towards
recovery of classified debt.
� Although lower inflation
may have improved the
real income position for
many relative to last year,
those with no
improvement in nominal
wages have seen
significant purchasing
power erosion.
� Stability of exchange rate
will need to be maintained
by taking cognisance of
the interests of
macroeconomic stability.
Indicators Positive
Developments
Negative
Developments
Observations
ANNEX 1
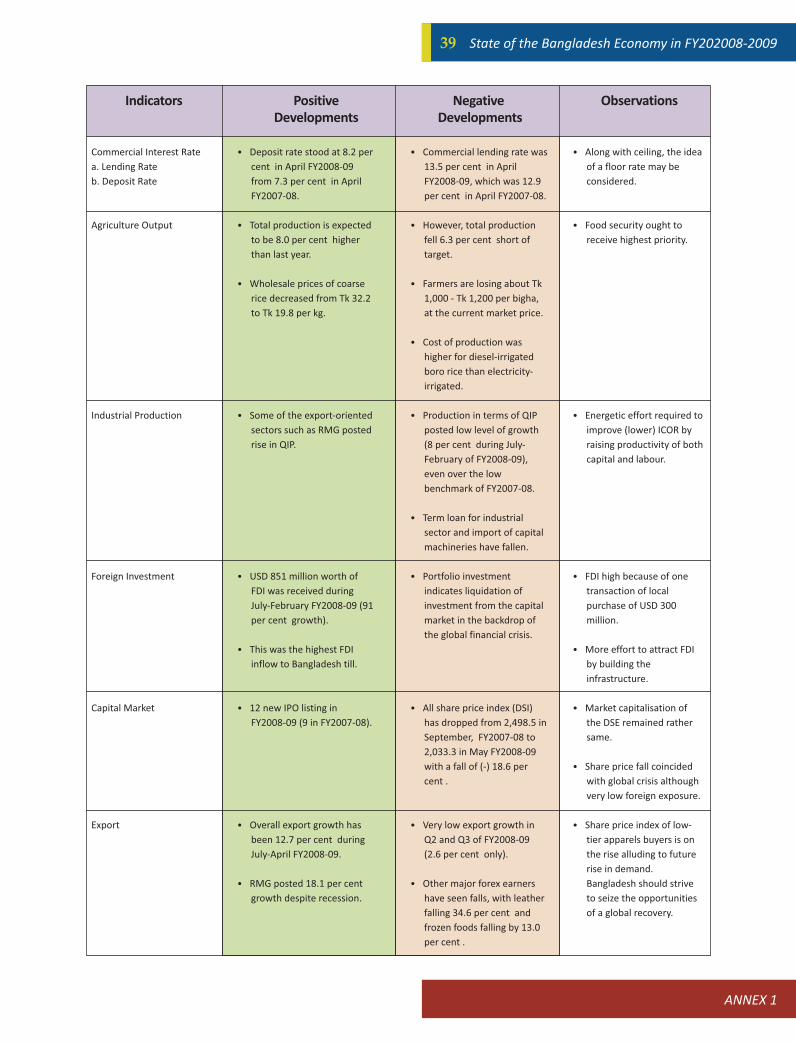
ANNEX 1
State of the Bangladesh Economy in FY202008-200939
Commercial Interest Rate
a. Lending Rate
b. Deposit Rate
Agriculture Output
Industrial Production
Foreign Investment
Capital Market
Export
� Deposit rate stood at 8.2 per
cent in April FY2008-09
from 7.3 per cent in April
FY2007-08.
� Total production is expected
to be 8.0 per cent higher
than last year.
� Wholesale prices of coarse
rice decreased from Tk 32.2
to Tk 19.8 per kg.
� Some of the export-oriented
sectors such as RMG posted
rise in QIP.
� USD 851 million worth of
FDI was received during
July-February FY2008-09 (91
per cent growth).
� This was the highest FDI
inflow to Bangladesh till.
� 12 new IPO listing in
FY2008-09 (9 in FY2007-08).
� Overall export growth has
been 12.7 per cent during
July-April FY2008-09.
� RMG posted 18.1 per cent
growth despite recession.
� Commercial lending rate was
13.5 per cent in April
FY2008-09, which was 12.9
per cent in April FY2007-08.
� However, total production
fell 6.3 per cent short of
target.
� Farmers are losing about Tk
1,000 - Tk 1,200 per bigha,
at the current market price.
� Cost of production was
higher for diesel-irrigated
boro rice than electricity-
irrigated.
� Production in terms of QIP
posted low level of growth
(8 per cent during July-
February of FY2008-09),
even over the low
benchmark of FY2007-08.
� Term loan for industrial
sector and import of capital
machineries have fallen.
� Portfolio investment
indicates liquidation of
investment from the capital
market in the backdrop of
the global financial crisis.
� All share price index (DSI)
has dropped from 2,498.5 in
September, FY2007-08 to
2,033.3 in May FY2008-09
with a fall of (-) 18.6 per
cent .
� Very low export growth in
Q2 and Q3 of FY2008-09
(2.6 per cent only).
� Other major forex earners
have seen falls, with leather
falling 34.6 per cent and
frozen foods falling by 13.0
per cent .
� Along with ceiling, the idea
of a floor rate may be
considered.
� Food security ought to
receive highest priority.
� Energetic effort required to
improve (lower) ICOR by
raising productivity of both
capital and labour.
� FDI high because of one
transaction of local
purchase of USD 300
million.
� More effort to attract FDI
by building the
infrastructure.
� Market capitalisation of
the DSE remained rather
same.
� Share price fall coincided
with global crisis although
very low foreign exposure.
� Share price index of low-
tier apparels buyers is on
the rise alluding to future
rise in demand.
Bangladesh should strive
to seize the opportunities
of a global recovery.
Indicators Positive
Developments
Negative
Developments
Observations
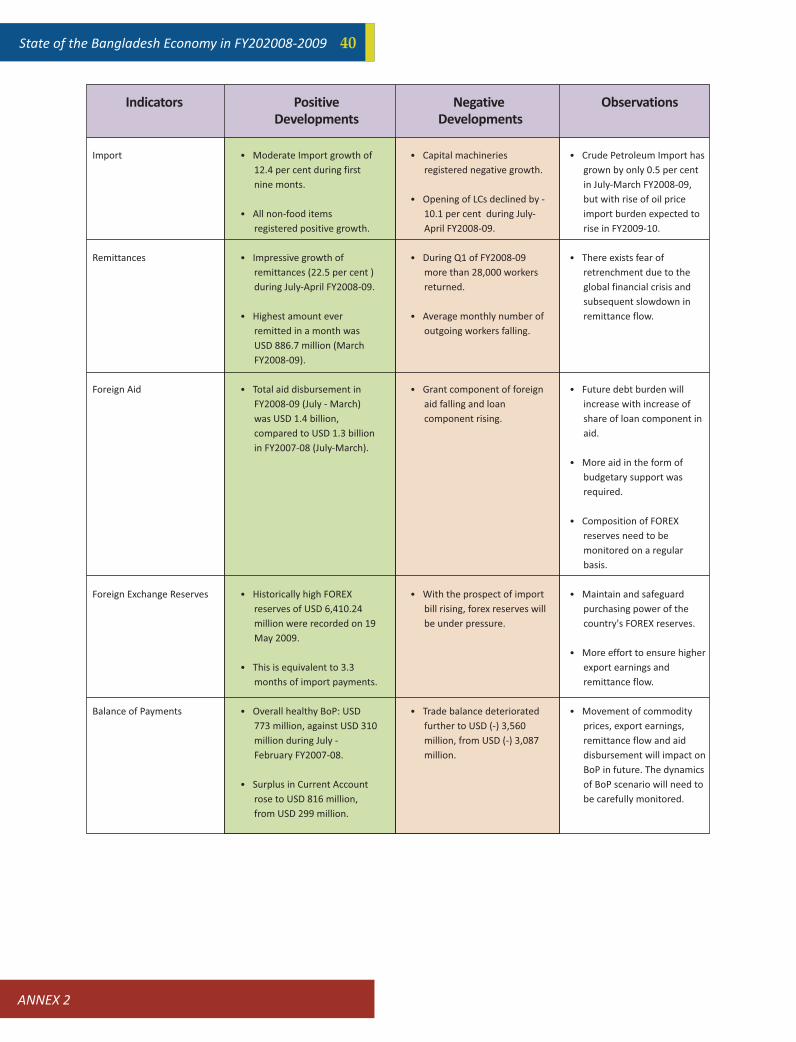
State of the Bangladesh Economy in FY202008-2009 40
Import
Remittances
Foreign Aid
Foreign Exchange Reserves
Balance of Payments
� Moderate Import growth of
12.4 per cent during first
nine monts.
� All non-food items
registered positive growth.
� Impressive growth of
remittances (22.5 per cent )
during July-April FY2008-09.
� Highest amount ever
remitted in a month was
USD 886.7 million (March
FY2008-09).
� Total aid disbursement in
FY2008-09 (July - March)
was USD 1.4 billion,
compared to USD 1.3 billion
in FY2007-08 (July-March).
� Historically high FOREX
reserves of USD 6,410.24
million were recorded on 19
May 2009.
� This is equivalent to 3.3
months of import payments.
� Overall healthy BoP: USD
773 million, against USD 310
million during July -
February FY2007-08.
� Surplus in Current Account
rose to USD 816 million,
from USD 299 million.
� Capital machineries
registered negative growth.
� Opening of LCs declined by -
10.1 per cent during July-
April FY2008-09.
� During Q1 of FY2008-09
more than 28,000 workers
returned.
� Average monthly number of
outgoing workers falling.
� Grant component of foreign
aid falling and loan
component rising.
� With the prospect of import
bill rising, forex reserves will
be under pressure.
� Trade balance deteriorated
further to USD (-) 3,560
million, from USD (-) 3,087
million.
� Crude Petroleum Import has
grown by only 0.5 per cent
in July-March FY2008-09,
but with rise of oil price
import burden expected to
rise in FY2009-10.
� There exists fear of
retrenchment due to the
global financial crisis and
subsequent slowdown in
remittance flow.
� Future debt burden will
increase with increase of
share of loan component in
aid.
� More aid in the form of
budgetary support was
required.
� Composition of FOREX
reserves need to be
monitored on a regular
basis.
� Maintain and safeguard
purchasing power of the
country's FOREX reserves.
� More effort to ensure higher
export earnings and
remittance flow.
� Movement of commodity
prices, export earnings,
remittance flow and aid
disbursement will impact on
BoP in future. The dynamics
of BoP scenario will need to
be carefully monitored.
Indicators Positive
Developments
Negative
Developments
Observations
ANNEX 2
ANNEX 1
State of the Bangladesh Economy in FY202008-200941
ANNEX 2
Expert Group Consultation MeetingHeld on 3 June 2009 at the CPD Dialogue Room
List of Participants (in alphabetical order)
Dr Quazi Mesbahuddin Ahmed
Managing Director
PKSF
Dr M Asaduzzaman
Research Director
Bangladesh Institute of Development Studies
Mr Siddiqur Rahman Choudhury
Chairman, Agrani Bank and
Former Secretary, Finance Division
Dr Mohammed Farashuddin
Former Governor, Bangladesh Bank and
Director, Board of Trustees, East West University
Professor Ismail Hussain
Department of Economics
Jahangirnagar University
Dr A B Mirza Azizul Islam
Former Advisor to the Caretaker Government
Ministries of Finance and Planning
Mr A F M Shariful Islam
Chief Executive Officer
Dhaka Stock Exchange Ltd.
Dr Mustafa K Mujeri
Director General
Bangladesh Institute of Development Studies
Dr Rushidan Islam Rahman
Research Director
Bangladesh Institute of Development Studies
Dr Quazi Shahabuddin
Former Director General
Bangladesh Institute of Development Studies