Embed Size (px)
Citation preview
ASIAN DEVELOPMENT BANK
BANGLADESHCONSOLIDATING EXPORT-LED GROWTH
COUNTRY DIAGNOSTIC STUDY

ASIAN DEVELOPMENT BANK
BANGLADESHCONSOLIDATING EXPORT-LED GROWTH
COUNTRY DIAGNOSTIC STUDY
Creative Commons Attribution 3.0 IGO license (CC BY 3.0 IGO)
© 2016 Asian Development Bank6 ADB Avenue, Mandaluyong City, 1550 Metro Manila, PhilippinesTel +63 2 632 4444; Fax +63 2 636 2444www.adb.org
Some rights reserved. Published in 2016. Printed in the Philippines.
ISBN 978-92-9257-555-7 (Print), 978-92-9257-556-4 (e-ISBN)Publication Stock No. RPT168366-2
Cataloging-In-Publication Data
Asian Development Bank. Bangladesh: Consolidating export-led growth.Mandaluyong City, Philippines: Asian Development Bank, 2015.
1. Economic development. 2. Bangladesh. I. Asian Development Bank.
The views expressed in this publication are those of the authors and do not necessarily reflect the views and policies of the Asian Development Bank (ADB) or its Board of Governors or the governments they represent.
ADB does not guarantee the accuracy of the data included in this publication and accepts no responsibility for any consequence of their use. The mention of specific companies or products of manufacturers does not imply that they are endorsed or recommended by ADB in preference to others of a similar nature that are not mentioned.
By making any designation of or reference to a particular territory or geographic area, or by using the term “country” in this document, ADB does not intend to make any judgments as to the legal or other status of any territory or area.
This work is available under the Creative Commons Attribution 3.0 IGO license (CC BY 3.0 IGO) https://creativecommons.org/licenses/by/3.0/igo/. By using the content of this publication, you agree to be bound by the terms of this license.
This CC license does not apply to non-ADB copyright materials in this publication. If the material is attributed to another source, please contact the copyright owner or publisher of that source for permission to reproduce it. ADB cannot be held liable for any claims that arise as a result of your use of the material.
Attribution—You should always acknowledge ADB as the source using the following format:[Author]. [Year of publication]. [Title of the work in italics]. [City of publication]: [Publisher]. © ADB. [URL or DOI]
[license].
Translations—Any translations you create should carry the following disclaimer:Originally published by ADB in English under the title [title in italics]. © ADB. [URL or DOI] [license]. The quality
of the translation and its coherence with the original text is the sole responsibility of the translator. The English original of this work is the only official version.
Adaptations—Any adaptations you create should carry the following disclaimer:This is an adaptation of an original work titled [title in italics]. © ADB. [URL or DOI][license]. The views expressed
here are those of the authors and do not necessarily reflect the views and policies of ADB or its Board of Governors or the governments they represent. ADB does not endorse this work or guarantee the accuracy of the data included in this publication and accepts no responsibility for any consequence of their use.
Please contact [email protected] if you have questions or comments with respect to content, or if you wish to obtain copyright permission for your intended use that does not fall within these terms, or for permission to use the ADB logo.
Notes:In this publication, “$” refers to US dollars, unless otherwise stated.ADB recognizes “China” as the People’s Republic of China.
All photos are from ADB.
iii
Boxes, Figures, and Tables vAbbreviations ixWeights and Measures xPreface xiAcknowledgments xiiBangladesh Fast Facts xiiiHighlights xiv1. Growth and Investment in Perspective: An Analysis of Trends 1 1.1 Introduction 1 1.2 Economic Reforms 2 1.3 Growth by Sources and Uses 7 1.4 The Output Gap and Source of Growth 9 1.5 The External Sector 12 1.6 Fiscal Policy and Inflation 13 1.7 Foreign Direct Investment 14 1.8 Poverty and Human Development 15 Appendix 1.1: Addressing Climate Change Challenges and Adaptive Delta Management 172. A Diagnosis of Critical Constraints to Growth 19 2.1 Introduction 19 2.2 Is High Cost of Finance a Constraint? 19 2.2.1 Trends and Issues in the Financial Sector 19 2.2.2 Financing Larger Projects and Enhancing Long-Term Savings 24 2.2.3 Could Access to External Finance Be the Problem? 24 2.3 Are Low Returns to Economic Activity a Critical Constraint? 25 2.3.1 Are Poor Geography, Agricultural Land Use, and Water Use Constraints? 25 2.3.2 Is Low Human Capital a Constraint? 27 2.3.3 Are Low Quantities of Physical Capital a Constraint? 27 2.4 Is Low Appropriability for Investors a Constraint? 32 2.4.1 Are Governance-Related Issues Critical Constraints to Sustained Growth? 32 2.4.2 How Much Are Macroeconomic Risks a Critical Constraint? 36 2.5 Is Insufficient Self-Discovery and Coordination a Constraint to Growth? 37 2.5.1 Has the Non-Garment Sector Been Given a Chance to Succeed? 37 2.5.2 Has Technology Been Used to Increase Coordination Externalities? 37 2.6 Conclusions 39 Appendix 2.1: Addressing Transport Demand Management in Dhaka: The Foundation of Sustainable Urban Living 403. Raising Living Standards for All: Maintaining and Propelling Inclusive Growth 45 3.1 Introduction 45 3.2 Poverty and Inequality 46 3.3 Health and Human Capital 48 3.3.1 Health 48 3.3.2 Education 53 3.3.3 Technical and Vocational Education and Training 55 3.4 Labor Force Characteristics and Employment Opportunities 57 3.5 Leveling the Playing Field 60
Contents
iv
3.5.1 Access to Infrastructure 60 3.5.2 Land Distribution 64 3.5.3 Access to Credit and Microfinance 65 3.6 Social Protection 69 3.7 Conclusions 72 Appendix 3.1: The Bangladesh Pension System: A Must-Have 734. The Energy Challenge: A Critical Constraint to Growth 81 4.1 Introduction 81 4.2 Overview of the Power Sector 82 4.2.1 How Did This Problem Come About? 83 4.2.2 The Government Plan 84 4.3 Demand-Side: Energy Consumption Needs 86 4.3.1 Power Demand Forecasts under the Power Sector Master Plan 88 4.4 The Genesis of the Supply-Demand Gap 88 4.4.1 Natural Gas Supply and Use and its Economic Importance in the Economy 88 4.4.2 Domestic Coal 93 4.5 Challenges and Options for Tackling Them 93 4.5.1 Rationalize Energy Pricing, Subsidies, and Power Tariffs 94 4.5.2 Mandate Energy Conservation and Energy Efficiency Programs 96 4.5.3 Attract Investment in Exploration and Infrastructure 97 4.5.4 Accelerate Reforms in the Regulation of Electricity Generation and Distribution to Attract Investment 98 4.5.5 Embrace Regional Electricity Trading Markets 101 4.6 Conclusions and Policy Recommendations 1085. Economic Diversification for Sustained Growth: Does Bangladesh Need to Switch Gears? 110 5.1 Introduction 110 5.1.1 The Ready-Made Garment Sector in Bangladesh: Huge Success but Challenges Ahead 111 5.1.2 Advantages of the Textile and Garments Industry 112 5.1.3 Garment Sector’s Place in the Global Economy and the Fashion Industry 115 5.1.4 RMG Operations in the Global Apparel Value Chain Context 117 5.1.5 Measuring Comparative Costs 120 5.2 Economic Diversification and Agglomeration 127 5.2.1 Is lack of Diversification and Concentration in RMG a Problem for Bangladesh? 128 5.2.2 Exports Don’t Explain Everything 129 5.3 Linking Goods and Services 131 5.3.1 Input-Output Linkages and Agglomeration 132 5.3.2 Capital and Labor in the Productive Economy 133 5.3.3 Use of Capital and Skilled Labor and Insertion into Global Value Chains 134 5.4 The Role of Current Policies in Diversification 139 5.4.1 Background on the Trade Regime 140 5.4.2 Implications for Resource Allocation: Effective Rates of Protection 141 5.5 Conclusions, Recommendations, and Policy Options 142 5.5.1 Main Recommendations 143 Appendix 5.1: Bangladesh Indicators of Productivity, Linkages, and Competitiveness by Sectors 146 Appendix 5.2: Indicators of Revealed Comparative Advantage 148 Appendix 5.3: Input-Output Linkages and the Export Potential of an Economic Sector 149 Appendix 5.4: How Linked is Bangladesh to Global Production Chains? 1656. Conclusions and Policy Recommendations 168 6.1 Conclusions 168 6.2 Policy Challenges and Information Requirements 169 6.3 Productive Development Policies: Structuring Ideas for Intervention 172References 176
Contents
v
Boxes 1.1 The Recent Five-Year Plan: Progress and Prospects 42.1 Growth Diagnostic Framework: Conceptually Identifying Binding Constraints to Growth 202.2 Governance, Access to Land, and Investment Uncertainty 343.1 Rangpur—Distinct Features of a Lagging Region 483.2 What is the Probability of Being Poor in Bangladesh? 584.1 Renewable Energy 924.2 Power Sector Institutional Structure, Legal, and Regulatory Framework 994.3 Lessons from Other Regions’ Experiences 1035.1 Bangladesh Special Economic Zones 1135.2 Made in Bangladesh and the Pulse of Consumer Demand 1205.3 Bangladesh Leather Industry: Prospects and Issues 1365.4 Bangladesh Pharmaceutical Industry: Prospects and Issues 137
Figures 1.1 Bangladesh’s Population and Projection, 2015 and 2050 21.2 Bangladesh GDP, 1973–2014 31.3 Per Capita GDP of South Asian Countries, 1985–2014 71.4 Growth Rates of GDP, Manufacturing, and Other Sectors, 1980–2015 81.5 GDP by Expenditure Components in South Asia, 2014 91.6 Bangladesh: Weather-Related Disasters and Potential Output Gap, 1988–2014 101.7 Bangladesh Contributions to Growth, 1980–2013 111.8 Bangladesh and Selected Countries Contribution to Growth, 2006–2013 111.9 Fiscal Indicators, 2006–2014 131.10 Inflation, 1991–2015 141.11 Foreign Direct Investment, 1997-2014 141.12 Foreign Direct Investment and Net Inflows, 1990–2013 15A.1.1 Average Annual Reported Economic Losses and Deaths from Disasters, 1995–2014 172.1 Global Competitiveness and Financial Development 212.2 Firms’ Use of Financial Services, 2013 222.3 Value of Collateral Needed for a Loan in Bangladesh, 2013 232.4 Total Public Debt, 2006–2015 252.5 Most Problematic Factors for Doing Business in Bangladesh, 2015 282.6 South Asia Governance Indicators, 2014 332.7 Bangladesh’s Governance Indicators, 1996–2014 332.8 Foreign Reserves, 2010–2017 362.9 Growth in Private Sector Credit, January 2011–November 2015 36
Boxes, Figures, and Tables
vi
Boxes, Figures, and Tables
2.10 Internet Use in Bangladesh and Comparators, 2000–2014 38A2.1 Complications that a Well-Designed Congestion Pricing Scheme Must Address 433.1 Public Health Expenditure in Bangladesh, 1995–2013 493.2 Public Health Expenditure in South Asian Countries, 2012 493.3 Pregnant Women Receiving Antenatal Care in South Asian Countries 513.4 Births Attended by a Medically Trained Provider, 2011 513.5 Education Expenditure, 2000–2014 533.6 Spending on Education, Selected South Asian Countries, 2014 533.7 Trends in Primary Net Enrollment Ratio, 1990–2014 543.8 Retention Rate in Primary Schools by Sex, 2005–2014 543.9 TVET Student Numbers, 2000–2014 563.10 Access to Improved Water Sources in Selected South Asian Countries, 2015 603.11 Distribution of Household Drinking Water Sources, 1998–2011 613.12 Share of Population with Access to Improved Sanitation Facility, 2010 613.13 Distribution of Toilet Facilities, 1997–2011 623.14 Population with Access to Electricity, 2010 633.15 Arable Lands, 1961–2013 643.16 Rural Household by Size of Land Owned, 2000–2010 653.17 Sources of Funds of NGO-MFIs in Bangladesh, 2009–2014 663.18 Total Assets and Number of Active Borrowers, 2005–2014 673.19 Household Access to MFI Deposit and Loan Products, 2010 683.20 Social Protection and Welfare Expenditure in Bangladesh, 2000–2014 703.21 Dependency Ratios, 1950–2050 70A3.1 Beneficiaries of Social Security Programs of Bangladesh, by Location 74A3.2 Projected Cost of Programs under the National Social Security Strategy 75A3.3 Coverage Rate of the Proposed NSSS across Consumption Deciles 76A3.4 Coverage Rate of Social Pension by Eligibility Mechanism 764.1 Energy Use and GDP 834.2 Electricity Intensities by Sector, 2003-2013 864.3 Trends of Total Electricity Consumption, Real GDP, and Investment , 1981-2012 874.4 Power Demand Forecast, 2010–2030 884.5 Natural Gas Demand and Supply Balance, 2010–2029 894.6 Sector-Wise Gas Demand Projection to 2030 924.7 Budgetary Support for Electricity 944.8 International Gas Price, 2000–2015 984.9 Bangladesh and International Natural Gas Demand, 2011–2035 98 4.10 Regional Power Trade: Possibilities 1075.1 Bangladesh Exports of Clothing Products, 1995–2014 1125.2 Apparel Market Size by Region, 2012 and 2025 1165.3 RMG Exports in Selected Countries, 1995–2014 1165.4 Share of Compensation per Employment Category 1175.5 Curve of Value-Added Stages in the Segmented Apparel Global Value Chain 1175.6 Process Flow in Garment Manufacturing: Made in Bangladesh 1205.7 Traditional and New Measures of Comparative Advantage 1275.8 Export Concentration Ratio of Selected RMG-Producing Countries 1285.9 Export Growth of Intermediate Goods 1405.10 Average NPR on Import Categories, FY2000–2013 141A5.3.1 Dot Plot of Input-Output Technical Coefficients Matrix or Matrix of Direct Requirements 1526.1 A Typology of Productive Development Policy Interventions and Examples 1726.2 Some Ideas for Rethinking Development Policies in Bangladesh 174
vii
Tables 1.1 Broad Socioeconomic Indicators of Bangladesh, 1985–2014 71.2 GDP by Sector and Sectoral Contribution to GDP Growth, 1973–2015 81.3 Average Shares in GDP and Contribution to GDP Growth by Expenditure Components, 1973–2015 91.4 Human Development Index, 2014 15A1.1 Climate Change Impact on Various Economic Sectors 182.1 Geographic Access to Financial Services, 2005 and 2014 222.2 Literacy Rates of Bangladesh and Selected Benchmark Countries 272.3 House-Rent Indexes of Private Residential Houses 292.4 Logistics Performance Index, 2014 302.5 Quality of Ground Transport Infrastructure, 2015 302.6 Intermodal Comparison of Transport Networks’ Productivity 302.7 Trading Across Borders 312.8 ICT Subscriptions, 2000–2014 382.9 Households Owning ICT Facilities, 2005 and 2010 382.10 Constraints to Private Investment and Long-Term Growth 39A2.1 Share of Vehicles and of Passengers in Dhaka by Transportation Mode 40A2.2 Summary of Marginal External Costs of Road Transport in Dhaka 413.1 Progress in Selected Social Indicators 463.2 Poverty Headcount Rates, 2000–2010 463.3 Coefficient of Expenditure Gini, 2000–2010 473.4 Latest Expenditure Gini in South Asia 473.5 Poverty Headcount Rates across Bangladesh, 2005 and 2010 473.6 Health Outcomes of Bangladesh, 1990–2015 493.7 Health Outcomes of South Asian Countries, Latest Figures 503.8 Health Workers in South Asian Countries 523.9 Nutritional Status of Children, 2010 523.10 MDG 2—Achieve Universal Primary Education, Selected South Asian Countries 543.11 Share of Vocational Students to Secondary Students, 2000 and Latest 56 3.12 Annual Growth of Labor Force 57 3.13 Average Monthly Wages, 2013 58 3.14 Distribution of Migrant Workers by Education and Division, 2013 58 3.15 Social Security Schemes in Bangladesh by Life Cycle Stage 70 3.16 Social Protection Expenditure, Beneficiaries and Reference Population, 2009 71 3.17 Coverage of Selected Social Safety Net Programs, 2005 and 2010 71 3.18 Summary of Diagnosis of Constraints to Inclusive Growth and Poverty Reduction 72 A3.1 Old-Age Pensions in South and Southeast Asia 74 A3.2 Cost of Universal Old-Age Pensions in Selected Lower-Middle-Income Countries 77 A3.3 Types of Mandatory Old-Age Security Programs in Selected Asian Countries 79 4.1 Key Energy Statistics, Latest Year 82 4.2 Energy and Electricity Indicators, South Asian Countries, Latest Years 83 4.3 Plants Commissioned during 2009–2013 844.4 Planned Annual Additions to the Generation Program, 2014–2018 844.5 Elasticity between Per Capita Gross National Income and Electricity Consumption, 1991–2010 874.6 Reserve to Production (Supply) Projection of Natural Gas Assuming 7% Demand Growth 894.7 Potential/Unexploited Gas Resource 904.8 Production Volume and Shares in 2013 904.9 Summary of Electricity Tariff Rates across South Asian Countries, mid-2015 954.10 Sixth 5-Year Plan Energy Conservation Initiatives 96
Boxes, Figures, and Tables
viii
Boxes, Figures, and Tables
4.11 Complementarities of Resources and Available Interconnections in South Asia 1025.1 Thrust Sectors 1105.2 Bangladesh RCA Estimates 1235.3 RCAs for the Top-Six RMG Products, 2013 1245.4 RCA for RMG Sector, 2005–2013 1245.5 RCA Comparisons for Non-RMG Exports with Benchmark Countries, 2013 1255.6 Export Price Gap between Bangladesh and Comparators in the EU and US Markets, 2014 1265.7 Index of Agglomeration by Economic Blocks for Bangladesh and Comparators 1335.8 Recent Trend in Nominal Protection 1405.9 Range of ERPs and Average ERPs, 2012 142A5.3.1 Participation in Production: Share of Active Sectors by Type of Economic Activity, Bangladesh and Comparator Countries 164A5.4.1 Decomposed Effect of a $1 Million Increase in Final Demand of Products of Various Sectors Produced in Bangladesh 1676.1 Constraints to Private Investment and Long-Term Growth 169
ix
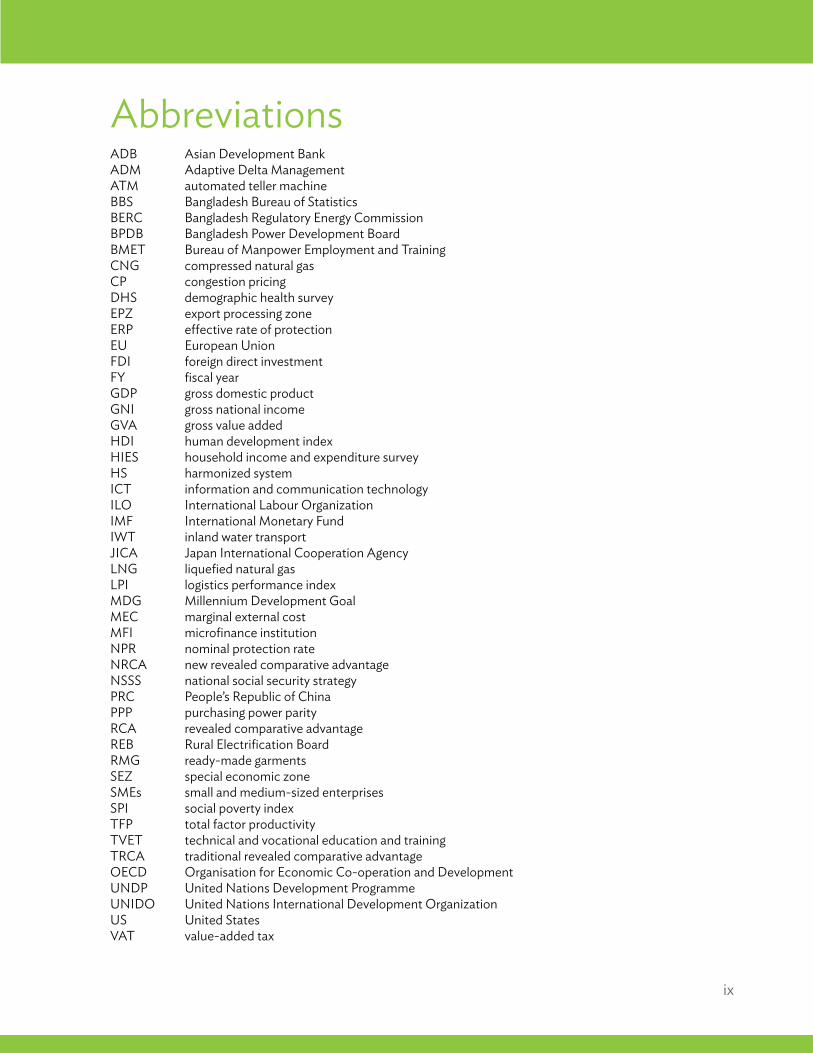
AbbreviationsADB Asian Development BankADM Adaptive Delta ManagementATM automated teller machineBBS Bangladesh Bureau of StatisticsBERC Bangladesh Regulatory Energy CommissionBPDB Bangladesh Power Development BoardBMET Bureau of Manpower Employment and TrainingCNG compressed natural gasCP congestion pricingDHS demographic health surveyEPZ export processing zoneERP effective rate of protectionEU European UnionFDI foreign direct investmentFY fiscal yearGDP gross domestic productGNI gross national incomeGVA gross value addedHDI human development indexHIES household income and expenditure surveyHS harmonized systemICT information and communication technologyILO International Labour OrganizationIMF International Monetary FundIWT inland water transportJICA Japan International Cooperation AgencyLNG liquefied natural gasLPI logistics performance indexMDG Millennium Development Goal MEC marginal external costMFI microfinance institutionNPR nominal protection rateNRCA new revealed comparative advantageNSSS national social security strategyPRC People’s Republic of ChinaPPP purchasing power parityRCA revealed comparative advantageREB Rural Electrification BoardRMG ready-made garmentsSEZ special economic zoneSMEs small and medium-sized enterprisesSPI social poverty indexTFP total factor productivityTVET technical and vocational education and trainingTRCA traditional revealed comparative advantageOECD Organisation for Economic Co-operation and DevelopmentUNDP United Nations Development ProgrammeUNIDO United Nations International Development OrganizationUS United StatesVAT value-added tax
x
Weights and Measuresckt. km circuit kilometerGJ gigajouleGWh gigawatt-hourha hectarekg kilogramkm kilometerktoe kilotonne of oil equivalentkV kilovoltkWh kilowatt-hourmmcfd million cubic feet of gas a dayMW megawattTCF trillion cubic feet
xi
PrefaceBuilding on strong export growth and higher remittances, Bangladesh has successfully transformed its economic structure since the 1980s, graduating to middle-income status as average annual growth remained strong at 5%–6%. More importantly, this growth has been inclusive; poverty has declined markedly; employment has increased; and access to better health, education, and basic infrastructure widened substantially.
Nonetheless, the country’s ambitious goal to become an upper-middle-income country by 2021, as part of Vision 2021, will require even stronger annual growth of 7.5%–8%. And the conditions that fueled recent high growth may be changing, while new challenges are emerging as Bangladesh passes important development milestones.
This Country Diagnostics Study finds that the most critical constraints to productive growth are (i) insufficient supply of reliable energy, (ii) policies that indirectly stunt the development of economic activities unrelated to ready-made garment exports, and (iii) insufficient security about property and land rights due in part to inadequate registry systems. If policies are designed to urgently tackle these constraints, Bangladesh will be free to harness its full potential for even more inclusive and sustainable growth.
A new strategy is therefore needed that fosters a level playing field across productive sectors. New activities need to develop. There should be less reliance on only one export-oriented low-cost manufacturing sector, the typical economic growth model of countries in the first phases of development. Such a strategy will need a greater focus on higher and technical and vocational education to raise skills, more and better energy and transport infrastructure, and a more responsive public sector that raises tax revenues by broadening the base. It will require a state that embraces technology (for example, by increasing access to the internet, cell phone banking, biometric identification techniques); a state that fosters transparency through the production of more and better data, and develops digital property registries; and a state that supports the search for new export markets and for private investors in all sectors.
Ultimately, progress on economic development will be measured through solid improvements in all areas identified as barriers. The good news for Bangladesh is that it has resilience, innovation in some areas, a large and growing domestic consumer market, and demographics still favorable to raising medium-term productivity. On the other hand, challenges at this stage of development have changed, as growth depends less on higher labor force participation and transition from traditional agriculture to manufacturing and more on the strengthening of institutions.
The report benefited from close collaboration with the Economics Relations Division of Bangladesh’s Ministry of Finance. The study got under way in January 2015 as the Asian Development Bank (ADB) and the government jointly hosted an inception workshop in Dhaka to establish the main themes, followed by a midterm workshop in August 2015 with experts to discuss preliminary findings.
Comments received by participants were invaluable and helped to strengthen the main points of the study. The team also benefited from various meetings and comments from technical offices in the government, particularly the General Economic Division of the Ministry of Planning. As noted in the study, the background work prepared for the Seventh Five-Year Plan, as well as the final report and the Bangladesh Development Forum, provided critical background and many of the conclusions are consistent with the thrust of the Seventh Five-Year Plan.
We hope that this study will help realize the government’s broader development goals and assist in the design, sequencing, and implementation of the tremendously complex and ambitious reform program. The ADB fully supports Bangladesh in achieving its development goals and looks forward to continuing a productive dialogue.
Shang-Jin WeiChief Economist and Director GeneralEconomic Research and Regional Cooperation DepartmentAsian Development Bank
xii
Acknowledgments
The Bangladesh country diagnostic study was conducted under the regional technical assistance project (RETA) 8266, Country Diagnostics Studies in Selected Developing Member Countries, which was approved by the Asian Development Bank (ADB) on 16 November 2012. The study is intended to help strengthen the planning capacities of ADB developing member countries through the use of diagnostic capacities.
The study was undertaken by a team from the Economic Analysis and Operational Support Division (EREA) of ADB’s Economic Research and Regional Cooperation Department (ERCD) under the overall supervision and guidance of Cyn Young Park, later succeeded by Edimon Ginting, director, EREA. The study was carried out in collaboration with ADB’s Bangladesh Resident Mission headed by Country Director Kazuhiko Higuchi, in particular Md. Golam Mortaza, Mohammad Parvez Imdad, and Shamsur Rahman; as well as the South Asia Regional Department.
The report was prepared by Valerie Mercer-Blackman (Chapters 1, 2, 4, 5, and 6) with substantial contributions by Amador Foronda (Chapter 1), Concepcion Latoja (Chapters 2 and 5), and Lotis Quiao (Chapter 4). Paulo Halili, Regina Baroma, and Sakiko Tanaka prepared Chapter 3. The study benefited from background papers prepared by a team of experts consisting of Jeffrey Major (Appendix 2.1), Concepcion Latoja (Appendix 3.1), Ahsan Mansur (Chapter 4), and Mahinthan Joseph Mariasingham and Zaidi Sattar (Chapter 5). Research support was provided by Jasmin Sibal (Chapter 1), Lotis Quiao and Erik Eleazar (Chapter 2), Concepcion Latoja, and Marymell Martillan (Chapter 3), and Amador Foronda (Chapter 5). Overall coordination assistance was provided by Jasmin Sibal and Lilibeth Poot. Eric Van Zant edited the report, Jemma Macfadyen provided copyediting, and Michael Cortes did the layout, cover design, and typesetting. Ricasol Cruz-Calaluan, Maria Melissa Gregorio dela Paz, and Amanda Isabel Mamon provided administrative and secretarial support.
The study benefited from a series of consultations and workshops with key government ministries of Bangladesh, the private sector, development partners, and research institutions on the approach and findings. The study team is grateful for the support provided by the Government of Bangladesh in this process. The following ministries and agencies provided essential inputs during consultations and workshops conducted in 2015: the Ministry of Finance, in particular Saifuddin Ahmed and Begum Fatima Yasmin (both joint secretaries of the Economic Relations Division); Bangladesh Bank; Ministries of Labour and Employment; Ministry of Health and Family Welfare; Ministry of Education; Ministry of Energy and Mines; Ministry of Planning’s General Economics Division; Bangladesh Bureau of Statistics; Bangladesh Export Promotion Bureau; and the Bangladesh Urban Primary Health Care Services Delivery Project.
The study also benefited greatly from meetings with the International Labour Organization, the Bangladesh Institute of Development Studies, the Department for International Development of the United Kingdom, the World Health Organization, the Centre for Policy Dialogue, the Bangladesh Garment Manufacturers and Exporters Association, Knit Asia Ltd., and the Foreign Investors’ Chamber of Commerce and Industry. The study also received invaluable comments from Jesus Felipe (ADB), Sadiq Ahmad and Kurshid Allam (Policy Research Institute), Priyantha Wijayatunga (ADB), Herath Gunatilake (ADB), Thomas Farole (World Bank), Tamaoki Wanatabe (JICA), and Selim Raihan (University of Dhaka).
The study team also thanks ADB colleagues from the South Asia Department and from other ADB departments for review and feedback, as well as for their support on the study, including: Sekhar Bonu, Hans Carlsson, Soon Chan Hong, Mukhtor Khamudkhanov, Masato Nakane, Markus Roesner, Syed Shah, Eisuke Tajima, Randall Jones, Len George, Eleonora Windisch, Kee Yung Nam, Rudi Van Dael, Julieta Magallanes, and Mohammad Nazrul Islam. Assistance in the field was provided by Barun Dey, M.K. Barua, and Ruby Sarcar. In addition, support from ADB’s Bangladesh Resident Mission was crucial in fostering collaboration with the government and other stakeholders.
xiv
Highlights
Bangladesh has transformed its economic structure over the last 2 decades, reaping the benefits of investment in the ready-made garments (RMG) sector and overcoming challenges such as the global financial crisis and the removal of preferential markets with the expiry of the Multi-Fiber Agreement in 2005. In 2015, the economy “graduated” to middle-income status under the World Bank classification, and average growth of 5%–6% over the previous decade helped to reduce sharply the number of people living below the poverty line and to substantially increase education of the population.
Challenges remain, nonetheless, and continued development requires more effort, coordination, and strengthening of the institutional framework. This study argues that some of the policies that allowed the country to grow and prosper in the last few years will become less effective, and the economy will need to “switch gears” to consolidate the growth momentum over the medium term. In some areas, the country has shown ingenuity—for example, in the proliferation of microcredit. This will continue to serve it well as it quickly adopts technology and “catches up” with its neighbors. In other areas, important changes in policies and institutional mechanisms are needed to ensure that the public sector can finance infrastructure services to support long-term growth.
The study performs an overall diagnostic of economic development in Bangladesh, specifically, by assessing the causes of and constraints to current and future inclusive and sustainable growth. Three critical constraints are identified. Two of these—an insufficient supply of reliable energy and a lack of economic diversification—are analyzed in greater depth in Chapters 4 and 5 of the study, respectively. The third critical constraint relates to uncertain property rights, but this issue is discussed in the broader context of governance in Chapter 2. Here are some of the key themes discussed in the study.
Economic growth rate has been high, but quality investments are needed going forward.
Bangladesh has been able to reach its economic growth potential over the 10 years leading up to 2015. Underlying this success has been the reduction in the population growth rate and the dependency ratio and a decline in the volatility of output. The movement of surplus labor from the primary sector into more productive manufacturing activities characterized the structural transformation of the economy. External inflows have soared, spurred by exports of garments and remittance inflows. Much of the successful outcomes were the result of a deliberate strategy by successive governments to promote industry in the context of the government’s ambitious 5-year plans. Improved fiscal and external macroeconomic stability have helped to sustain growth. Nonetheless, foreign direct investment, at around 1% of GDP, is low compared with other countries at similar levels of development. Also, the country’s high vulnerability to climate change-related damages continues to affect economic activity through setbacks and damages to the capital stock.
xv
Highlights
Lack of energy infrastructure, uncertainties in property ownership and lack of self-discovery in non-RMG sectors are significant barriers for private investment.
The study applies the growth diagnostics methodology based on Hausmann, Rodrik, and Velasco (2005) to identify the main barriers to growth using similar countries as comparators. Insufficient or inadequate growth-promoting ingredients—such as access and cost of finance, geography, transport and energy infrastructure, education and skills of the workforce, macroeconomic stability, governance and coordination externalities—can deter private investment.
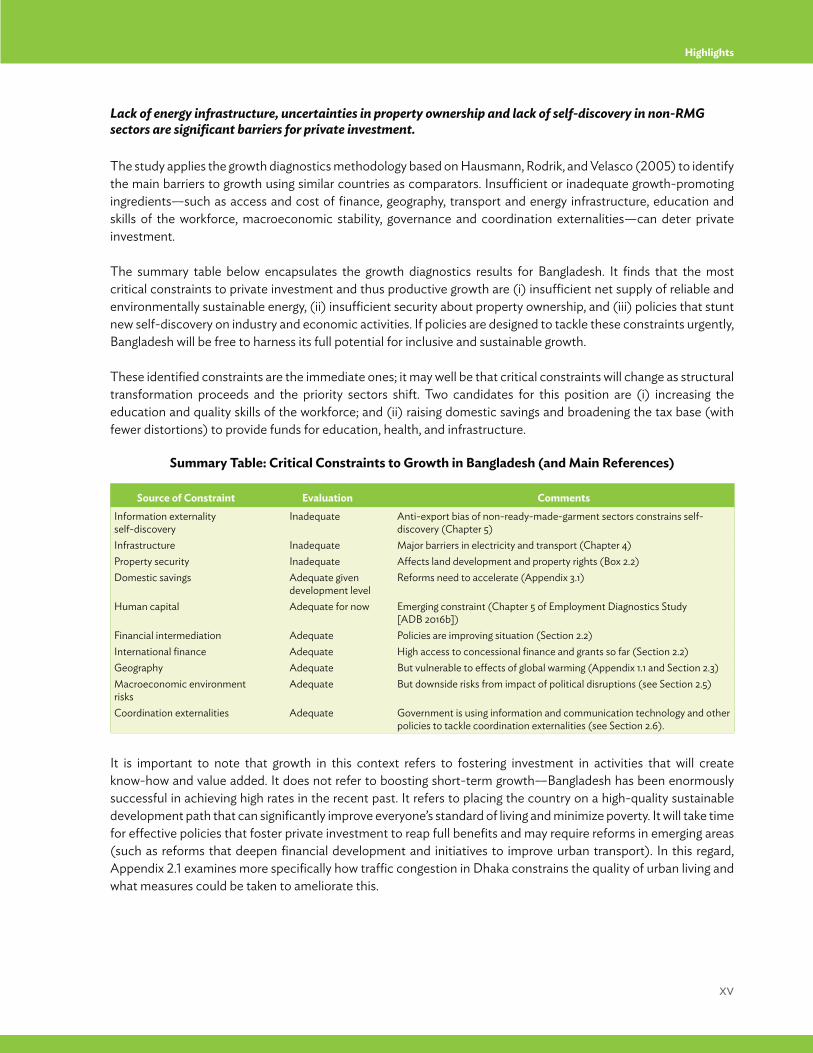
The summary table below encapsulates the growth diagnostics results for Bangladesh. It finds that the most critical constraints to private investment and thus productive growth are (i) insufficient net supply of reliable and environmentally sustainable energy, (ii) insufficient security about property ownership, and (iii) policies that stunt new self-discovery on industry and economic activities. If policies are designed to tackle these constraints urgently, Bangladesh will be free to harness its full potential for inclusive and sustainable growth.
These identified constraints are the immediate ones; it may well be that critical constraints will change as structural transformation proceeds and the priority sectors shift. Two candidates for this position are (i) increasing the education and quality skills of the workforce; and (ii) raising domestic savings and broadening the tax base (with fewer distortions) to provide funds for education, health, and infrastructure.
Summary Table: Critical Constraints to Growth in Bangladesh (and Main References)
It is important to note that growth in this context refers to fostering investment in activities that will create know-how and value added. It does not refer to boosting short-term growth—Bangladesh has been enormously successful in achieving high rates in the recent past. It refers to placing the country on a high-quality sustainable development path that can significantly improve everyone’s standard of living and minimize poverty. It will take time for effective policies that foster private investment to reap full benefits and may require reforms in emerging areas (such as reforms that deepen financial development and initiatives to improve urban transport). In this regard, Appendix 2.1 examines more specifically how traffic congestion in Dhaka constrains the quality of urban living and what measures could be taken to ameliorate this.
Source of Constraint Evaluation CommentsInformation externality self-discovery
Inadequate Anti-export bias of non-ready-made-garment sectors constrains self-discovery (Chapter 5)
Infrastructure Inadequate Major barriers in electricity and transport (Chapter 4)Property security Inadequate Affects land development and property rights (Box 2.2)Domestic savings Adequate given
development levelReforms need to accelerate (Appendix 3.1)
Human capital Adequate for now Emerging constraint (Chapter 5 of Employment Diagnostics Study [ADB 2016b])
Financial intermediation Adequate Policies are improving situation (Section 2.2)International finance Adequate High access to concessional finance and grants so far (Section 2.2)Geography Adequate But vulnerable to effects of global warming (Appendix 1.1 and Section 2.3)Macroeconomic environment risks
Adequate But downside risks from impact of political disruptions (see Section 2.5)
Coordination externalities Adequate Government is using information and communication technology and other policies to tackle coordination externalities (see Section 2.6).
xvi
Highlights
Economic growth has been inclusive: poverty has declined; the provision of health, education, and basic infrastructure has improved; and financial inclusion has thrived.
Greater equality of opportunity is the main pillar of a high-quality development path. Despite considerable challenges, the government has managed to successfully implement many programs in the areas of basic needs. The poverty rate (the population living under the national poverty line) has fallen from 48.9% in 2000 to 31.5% in 2010. However, the study finds that the decline of poverty was not evenly distributed across Bangladesh’s seven divisions. The study also analyzes whether growth has also come with equal and quality access to basic social services (health and education). Despite the progress in health outcomes overall, access to basic health and sanitation services are still limited for the poorest quintile families. And the labor force is still largely unskilled (employment is touched briefly in this study in the context of inclusiveness, given the more detailed discussion in ADB [2016b]). Chapter 3 also highlights how access to basic infrastructure and productive assets in Bangladesh is limited, in particular for the poorest quintile families.
The study also analyzes the development of and access to microfinance institutes. It finds that microfinance has been largely inclusive. Two institutions have taken on a leading role in propelling microcredit: Bangladesh Bank and the Microcredit Regulatory Authority. Microfinance will continue to be an important source of financing for low-income families, but some groups particularly in agriculture continue to be underserved. Last, the report notes the government’s commitment to improving the social protection landscape, as shown in the recent increase in social spending. The challenge is to increase coverage, as some 64% of poor households still do not have access to social protection.
In the context of social insurance, Appendix 3.1 advocates for the faster development of a national pension system. Because Bangladesh is still a relatively youthful country, setting up the institutions for a lasting pension system will come at a small cost. Moreover, as studies around the world have shown, the ability to save a portion of income is not confined to the rich. Incentive programs to encourage Bangladeshis to open a bank account, use cell phone and biometric technology to make payments and log into the formal network, and finally, save some of their income, will slowly but surely create a long-term pool of funds that can eventually be channeled to finance much-needed investment, including in infrastructure. Bangladesh is well poised for innovation in this area.
Measures to increase long-term energy supply and foster energy conservation are urgently needed. The lack of reliable electricity supply and the impending shortage of natural gas are major binding constraints to economic growth. Firms and the government bypass some of these difficulties by using private generators and establishing export processing zones. But the study notes that unless the energy supply gap can be narrowed across the country, economic growth will not match its potential. A combination of highly subsidized fuel and electricity prices for consumers coupled with difficulties for the private sector to enter the electricity and oil and gas industries led to inadequate supplies. The impact on aggregate economic activity is already palpable. The study considers the supply-demand balance under current policies, as well as the policies available to increase supply and maintain sustainable demand growth through greater efficiency.
An analysis of the most recent 5-year plans of the Government of Bangladesh suggests that policy makers are well aware of the energy challenge, particularly the need to ramp up supply. This study emphasizes three key areas, which should be part of the solution. First, electricity and fuel subsidies should be reduced and combined with programs that promote energy conservation and energy efficiency. Second, private investment in electricity generation and oil and gas exploration should be promoted. Third, the government has to push harder for development of the South Asian regional electricity market.
xvii
Highlights
The success of the RMG sector has inadvertently come at the expense of poor growth and limited prospects for diversifying into other sectors.
The RMG sector in Bangladesh was initiated in the late 1970s with nine export-oriented garment manufacturing firms earning less than a million dollars a year. By 2015, it was the second-largest garment exporter in the world behind the People’s Republic of China, with continued prospects for growth. At the same time, some sectors considered promising in earlier days, such as leather products and shipbuilding, have not taken off despite substantial potential. Having a relative comparative advantage in just a few exports would be acceptable if other diverse sectors and services that cater to domestic consumers developed in parallel. Unfortunately, quite the opposite development is occurring in Bangladesh, at least since 2000. The study looks more closely at the development of the RMG sector in the context of expanding productive activity through global value chains, as well as through potential links to other domestic sectors.
We argue that the RMG sector has limited potential to expand the economy in its current state, because it relies solely on the comparative cost advantage that comes from excess labor supply and government incentives such as tax waivers. If that cost advantage were to change, Bangladesh would not currently be diversified enough to compensate with other exports. Moreover, in recent years the demand trends of the “fast fashion” industry have made it more challenging for Bangladesh to move up the fashion industry value chain (see Box 5.2).
The study’s estimates confirm the large comparative cost advantage of Bangladesh’s RMG relative to other garment producers, given trends in global demand. It then uses the input-output tables and measures of revealed comparative advantage to analyze the relationship between economic diversification, sector-level linkages, and structural transformation. The results show that over the last 10 years, the domestic economy has become more concentrated in a few sectors. This is in contrast to other Asian countries, such as the People’s Republic of China and Viet Nam, which have leveraged their beginnings in basic manufacturing to link to other sectors, including business services that increase the productivity of manufacturing exports, even though goods in those sectors themselves are not exported.
The RMG production model based solely on low-cost labor may limit innovation and the country’s ability to link to the global fashion industry value chain. However, lateral links to other areas of manufacturing and services seem more promising if policies changed. Despite an increase in capital investment in RMG, net foreign direct investment remains relatively low, and is concentrated in banking, telecommunications, oil and gas, and RMG. Policies have to foster production processes that will allow production to thrive and move into other areas in which the country has shown important capabilities selling in the domestic market. Bangladesh could also expand into activities such as the maintenance and repair of machinery and light engineering. While it is impossible to predict where the country will eventually expand, it is clear that on-the-job training to expand skills, with a steady increase in the quality of basic secondary education, will be paramount if the country wants to develop faster.
In addition, the anti-export bias faced by non-RMG sectors limits competition and product diversification.
Two case studies are presented as illustrations of the challenges non-RMG sectors face in expanding their business: leather processing and pharmaceuticals. Policy makers have pitched both sectors as promising, but problems, including some that could be addressed through policies, have prevented their full development.
Chapter 5 concludes that the incentives and tariff structure faced by non-RMG sectors explain in large part their inability to penetrate the export markets. Effective tariff protection rates on non-RMG final goods have stunted their exports by providing an environment where other sectors can become complacent producing for the domestic
xviii
Highlights
market due to the protection of final goods. Bangladesh has not been able to increase its links to global value chains as shown in a demand decomposition analysis. Instead, exports of intermediate goods began to decline since 2014. The implications of this chapter are that the policies that so heavily promote the RMG sector have reached their useful life. Instead, it is possible that they are creating rents for the very large RMG companies that enjoy a mostly tax-free environment under the special economic zones.
Policies need to enhance opportunities for all.
The concluding chapter of the study presents a broad policy framework which takes into account the interactions of all the ideas that have emerged. The recommendations suggest the need for a rethink of strategy for industrial policy.
One broad recommendation is to alter the tax regime to eliminate special exemptions and reduce tax distortions across sectors. Bangladesh is in dire need of more spending on basic health and education, but with one of the lowest tax-to-GDP ratios in the world, it will be unable to meet such basic expenditure. Successful sectors should be expected to contribute to some of the infrastructure they use, including through participation in public–private partnerships. More importantly, policies need to ensure that there are mechanisms for growth to continue to be inclusive. The emphasis should be on promoting good jobs (see ADB 2016b) and on reallocating expenditure toward infrastructure and education, as envisioned in the Five-Year Plan.
Finally, a policy framework to enable self-discovery of economic activity is recommended.
Rather than identifying thrust sectors and targeting a specific share of industry to GDP, policy makers have to find better horizontal interventions (those that cut across sectors without “picking winners”), as well as dealing with the issues that deter foreign direct investment. These are well identified in various surveys through the World Economic Forum’s “Global Competitiveness Indicators.” Paramount among these issues is the need to improve certainty about property ownership by tackling related governance issues (discussed in Box 2.2), strengthening registration systems of land ownership, and making drastic improvements in urban planning and development. Indeed, one of the greatest deterrents of foreign investment in Bangladesh is the expected poor quality of life in urban areas.
The amazing growth of RMG exports attests, not so much to the ability of Bangladeshis to produce garments well, but more to their ability to move ahead with resilience amid enormous challenges. This is where Bangladesh’s true comparative advantage lies.
1
Growth and Investment in Perspective: An Analysis of Trends
Chapter 1Growth and Investment in
Perspective: An Analysis of Trends
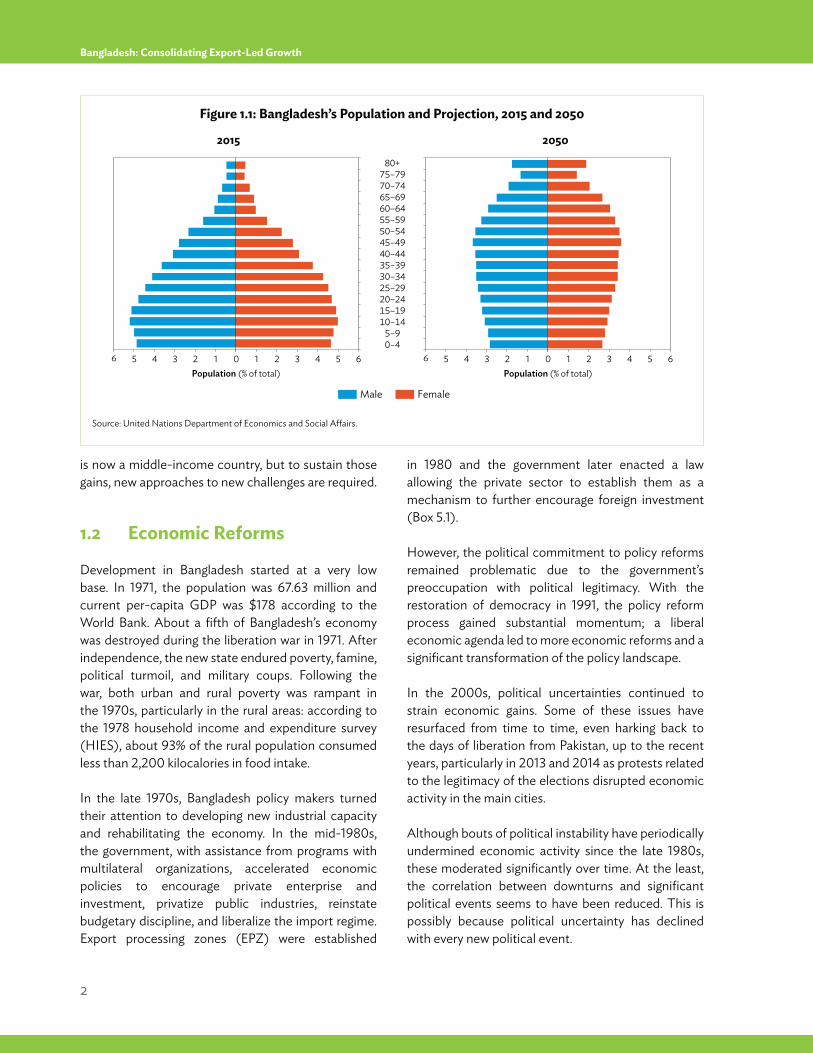
state countries. In spite of a seemingly unfavorable socioeconomic environment, family planning programs achieved remarkable success in lowering fertility from the mid-1970s to the mid-1990s. Population growth decelerated from a high of 2.9% in 1979 to 2.0% in 1999 and to 1.0% in 2009. Much of this came from the so-called demographic dividend, as the dependency ratio fell rapidly. The starting point was from a low base in which gains across a generation could be high. The demographic dividend is illustrated in the 2015 demographic profile by age and gender, in which 29.4% (47 million) of the population is below 15. This segment of the population will enter the workforce in the period 2020–2050 (Figure 1.1).
As fertility declines, and amid high primary school enrollment, the broad challenge now is to design policies and institutions that set the stage for growth, better and higher education, and foster long-term savings and productive investments. According to the World Bank definition of income strata, Bangladesh
1.1 Introduction
Bangladesh has come a long way since independence in 1971. Over the past 45 years, it has grown 4.7% per year on average, rising from extreme poverty and political instability in its early years through steady improvement: potential gross domestic product (GDP) growth increased almost one percentage point in every decade. Moreover, economic growth was inclusive in that it generated employment, particularly for the low skilled and for women, and went hand in hand with large improvements in health and education. Average life expectancy soared from 47 years to 71 years in the period, while enrollment in primary education for children ages 6–10 is now almost universal.
Decelerating population growth also contributed to higher income per worker. In the mid-1970s, GDP per capita grew only 1.0% as authorities tried to contain population growth amid meager economic gains.1 Bangladesh is the world’s eighth-most populous country with over 159 million people2 and among the most densely populated, excluding city-____________________1 The sense of urgency was amply expressed in the First Five-Year Plan statement: “No civilized measure would be too drastic to keep the population of Bangladesh
on the smaller side of 15 crores for the sheer ecological viability of the nation.” Planning Commission 1974 as cited by Khan and Khan 2010. 2 World Bank. World Development Indicators. http://data.worldbank.org/data-catalog/world-development-indicators (accessed January 2016).
2
Bangladesh: Consolidating Export-Led Growth
is now a middle-income country, but to sustain those gains, new approaches to new challenges are required.
1.2 Economic Reforms
Development in Bangladesh started at a very low base. In 1971, the population was 67.63 million and current per-capita GDP was $178 according to the World Bank. About a fifth of Bangladesh’s economy was destroyed during the liberation war in 1971. After independence, the new state endured poverty, famine, political turmoil, and military coups. Following the war, both urban and rural poverty was rampant in the 1970s, particularly in the rural areas: according to the 1978 household income and expenditure survey (HIES), about 93% of the rural population consumed less than 2,200 kilocalories in food intake.
In the late 1970s, Bangladesh policy makers turned their attention to developing new industrial capacity and rehabilitating the economy. In the mid-1980s, the government, with assistance from programs with multilateral organizations, accelerated economic policies to encourage private enterprise and investment, privatize public industries, reinstate budgetary discipline, and liberalize the import regime. Export processing zones (EPZ) were established
in 1980 and the government later enacted a law allowing the private sector to establish them as a mechanism to further encourage foreign investment (Box 5.1).
However, the political commitment to policy reforms remained problematic due to the government’s preoccupation with political legitimacy. With the restoration of democracy in 1991, the policy reform process gained substantial momentum; a liberal economic agenda led to more economic reforms and a significant transformation of the policy landscape.
In the 2000s, political uncertainties continued to strain economic gains. Some of these issues have resurfaced from time to time, even harking back to the days of liberation from Pakistan, up to the recent years, particularly in 2013 and 2014 as protests related to the legitimacy of the elections disrupted economic activity in the main cities.
Although bouts of political instability have periodically undermined economic activity since the late 1980s, these moderated significantly over time. At the least, the correlation between downturns and significant political events seems to have been reduced. This is possibly because political uncertainty has declined with every new political event.
Figure 1.1: Bangladesh’s Population and Projection, 2015 and 2050
Source: United Nations Department of Economics and Social Affairs.
6 5 4 3 2 1 0 1 2 3 4 5 6
20–24
10–14
0–4
60–6465–69
55–59
45–49
35–39
25–29
15–19
5–9
50–54
40–44
30–34
70–7475–79
80+
6 5 4 3 2 1 0 1 2 3 4 5 6
Male
Population (% of total) Population (% of total)
Female
2015 2050
3
Growth and Investment in Perspective: An Analysis of Trends
The Five-Year Plans have guided development priorities with increasingly sophisticated design and implementation. The 2016–2020 plan is the seventh plan; it updates and extends the targets of the 2011–2015 plan, but with greater innovation, by setting up a results-based framework.
More recently, a consistent set of targets of the most important indicators and objectives was established, firmly based on the sectoral and theme-based research manifested in 28 background papers. The premise is that the main long-term challenges have changed little in 5 years. Continuing on these established fronts while deepening reforms is likely to lead to a better outcome. Box 1.1 discusses progress under the 6th Five-Year Plan, which ended in 2015, and explains the most salient features of the new one.
The data point to the enormous success in 2000–2015. A combination of very high export growth, growth of remittances from 4% to 8% of GDP by 2015, rural–urban migration leading to more productive jobs, higher labor force participation among women, greater access to drinking water and electricity, and the availability of microfinance pulled many out of poverty: the poverty headcount declined by 17.4
percentage points from 2000 to 2010 (Table 1.1). Nonetheless, the ambitious goal to become an upper-middle income country by 2021, as part of Vision 2021 will be challenging. Per capita GDP would have to increase from $1,212 in 2015 to more than $4,126 in 2020. This will require annual growth of 7.5%–8%, but the conditions that fueled recent high growth may not be the same, because new challenges will come with the passing of real important development milestones.
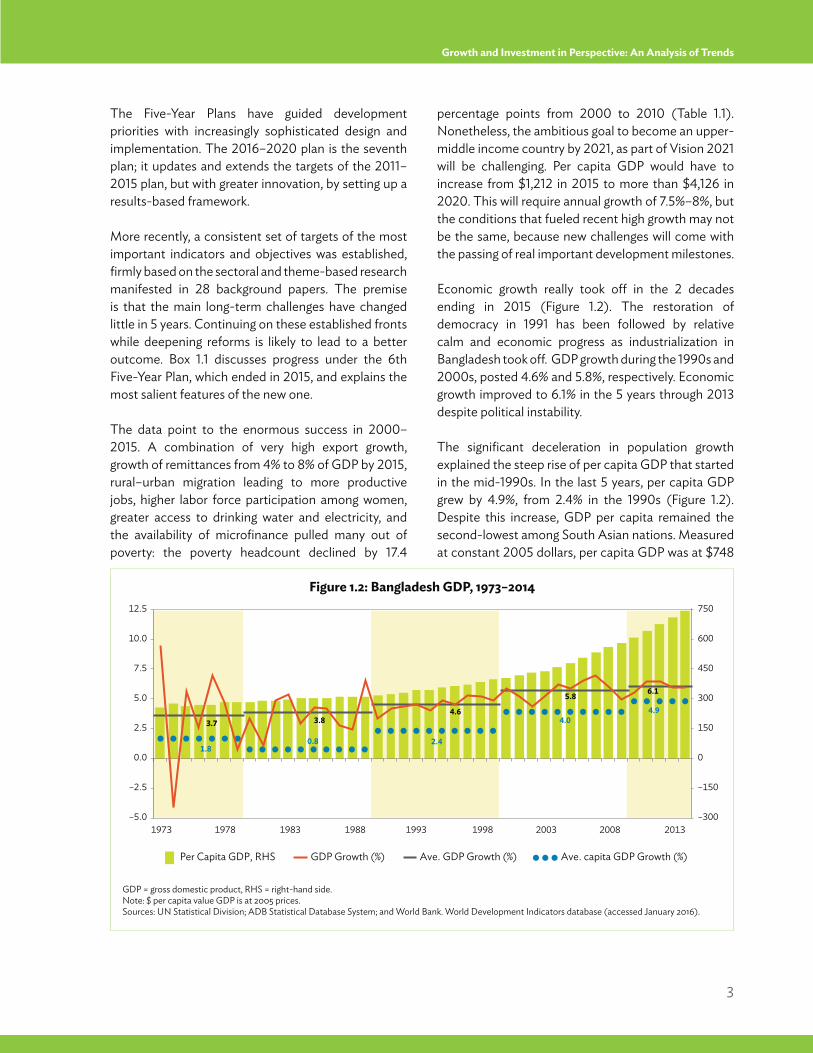
Economic growth really took off in the 2 decades ending in 2015 (Figure 1.2). The restoration of democracy in 1991 has been followed by relative calm and economic progress as industrialization in Bangladesh took off. GDP growth during the 1990s and 2000s, posted 4.6% and 5.8%, respectively. Economic growth improved to 6.1% in the 5 years through 2013 despite political instability.
The significant deceleration in population growth explained the steep rise of per capita GDP that started in the mid-1990s. In the last 5 years, per capita GDP grew by 4.9%, from 2.4% in the 1990s (Figure 1.2). Despite this increase, GDP per capita remained the second-lowest among South Asian nations. Measured at constant 2005 dollars, per capita GDP was at $748
Figure 1.2: Bangladesh GDP, 1973–2014
GDP = gross domestic product, RHS = right-hand side.Note: $ per capita value GDP is at 2005 prices.Sources: UN Statistical Division; ADB Statistical Database System; and World Bank. World Development Indicators database (accessed January 2016).
3.7 3.84.6
5.8 6.1
1.8 0.8 2.4
4.04.9
Per Capita GDP, RHS GDP Growth (%)
–5.0
0.0
10.0
7.5
5.0
2.5
–2.5
12.5
–300
0
600
450
300
150
–150
750
1973 1978 1983 1988 1993 1998 2003 2008 2013
Ave. GDP Growth (%) Ave. capita GDP Growth (%)
4
Bangladesh: Consolidating Export-Led Growth
Box 1.1: The Recent Five-Year Plan: Progress and Prospects
Five-year development plans started in Bangladesh in 1973 to set a course for the private sector. The plans are characterized as “essentially indicative and strategic in nature.” In 2008, the government conceived Vision 2021, which would be implemented through two medium-term development plans between 2011 and 2020, the second mostly an update of the first. According to the 2011-2015 Sixth Five-Year Plan, “Ensuring a proper balance between providing incentives to private sector and instituting regulatory policies for safeguarding public interests will be a major guiding principle of the policy and institutional framework of the Sixth and the Seventh plans.”
The growth process would set the basis for more employment opportunities in the manufacturing and organized service sectors and allow a transfer of many workers engaged in low productive employment in agriculture and informal services sector of the economy to these higher income jobs. Both large and small enterprises would be expected to contribute to growth. Emphasis would be placed on diversification into products dependent on imported contents, but employing a large labor force. Examples of such activities include furniture, toys, footwear, and consumer durables.
The government has taken full ownership of the Seventh (2016–2020) Five-Year Plan, borrowing extensive research from different areas. The document itself was the synthesis of 28 background studies commissioned by the General Economics Division of the Ministry of Planning. Its innovation is in the results-based framework developed with target indicators in all areas and linked to a medium-term macroeconomic framework with a newly created set of Sustainable Development Goals fully incorporated into the targets.
The philosophy of the Seventh Five-Year Plan, entitled “Accelerating Growth, Empowering Every Citizen,” gives priority to ways of enhancing so-called job-creating GDP. Emphasis is placed on improving the growth drivers and on policies, institutions, and programs that will support the lowering of income inequality and empower citizens. Importance is also placed on ameliorating the challenges of lagging regions. The human development and social protection strategies underlying the Five-Year Plan place a particular focus on gender and social inclusion. The plan also mentions improving the environment and good governance and increases the emphasis on improving investment in favor of infrastructure and manufacturing. Other general goals include improving the efficiency of the financial sector, improving the investment climate, managing land constraints, and addressing the skills challenge facing industry. The planned goals and targets under the Seventh Five-Year Plan are set out below.
Nonetheless, overambitious targets may pose challenges. First, for policies, little change is made in direction and strategy. The Plan sets forth an expectation that growth would accelerate to 8% a year over the next 5 years (from 6% in the previous 5 years). This would require private investment to rise from the 21% seen in 2014 to 28% in 2020. The Plan also proposes a threefold growth of foreign direct investment (from 1% of GDP with 3% of GDP). The key growth driver will be industry, which would need to reach 11% annual growth (compared with 8% at present). These goals are consistent but would require an unusually long period of political and economic stability. Another objective is to reduce extreme poverty to 8% in 2020 and to almost eradicate poverty by 2030. Reaching this goal would require a significant revamping of the conditional cash transfer program. The household survey will be used to identify the poor, and biometric identification cards will be provided to all, which through mobile phone banking can digitize the process. Finally, given the results-based framework used, monitoring and evaluation of the plan’s implementation will become paramount.
continued on next page
5
Growth and Investment in Perspective: An Analysis of Trends
Plan Goals and Targets Under the Seventh Five-Year Plan
A. Income and Poverty Attaining average real gross domestic product (GDP) growth rate of 7.4% per year over the plan period. Reduction in the headcount poverty ratio by 6.2 percentage points. Reduction in extreme poverty by about 4.0 percentage points. Creating good jobs for the large pool of underemployed and new labor force entrants by increasing the share of employment in the manufacturing sector from 15% to 20%.
B. Sector Development Significant growth of the agriculture, industry, and service sectors. Increase the contribution of the manufacturing sector to 21% of GDP by fiscal year (FY) 2020. Substantial improvement of exports to $54.1 billion by FY2020. Achieving a trade–GDP ratio of 50% by FY2020.
C. Macroeconomic Development Total revenue to be raised from 10.7% of GDP to 16.1% by FY2020.
Maintain the current fiscal deficit of 5% of GDP. Government spending to be increased to 21.1% of GDP by FY2020. Foreign direct investment to be increased substantially to $9.6 billion by FY2020.
D. Urban Development Access to improved water source will be ensured for all urban dwellers. Coverage of drainage system to be expanded to 80%. Ensure sustainable urban development that supports increased productivity, investment, and employment.
E. Human Resource Development (education, health, and population) Achieving 100% net enrollment rate for primary and secondary education. Percentage of cohort reaching grade 5 to be increased to 100% from the current 80%.
Under-5 mortality rate to be reduced to 37 per 1,000 live births. Maternal mortality ratio to be reduced to 105 per 100,000 live births.
Immunization, measles (by percent of children under 12 months) to be increased to 100%. Births attended by skilled health staff to be increased to 65%. Reduction of total fertility rate to 2.0. Increasing contraceptive prevalence rate to 75%.
F. Water and Sanitation Safe drinking water to be made available for all urban population.
Safe drinking water to be made available for all rural population. Proportion of urban population with access to sanitary latrines to be increased to 100%.
Proportion of rural population with access to sanitary latrines to be raised to 90%.
Box 1.1 continued
continued on next page
6
Bangladesh: Consolidating Export-Led Growth
Box 1.1 continued
G. Energy and Infrastructure Installed generation capacity of electricity to be increased to 23,000 megawatts by 2020.
Increase per capita energy consumption from 371 kilowatt-hours (kWh) to 514 kWh. Electricity coverage to be increased to 96%. Reduce system loss from 13% to 9%.
Construction of 6.15-kilometer long Padma Multipurpose Bridge at Mawa-Janjira. Construction of about 26-kilometer long Dhaka Elevated Expressway. Improve the multimodal transport network with a significant increase in the share of rail and waterway traffic. Reduce urban traffic congestion, with focus on Dhaka and Chittagong metropolitan areas. Reduce road accidents.
H. Gender Equality, Income Inequality, and Social Protection Female-to-male ratio in tertiary education to be raised from current 70% to 100%. The ratio of literate female to male for age group 20–24 to be raised to 100% from the current 86%. Encourage female enrollment in technical and vocational education. Reduce or maintain the current income inequality of 0.45. Spending on social protection as a share of GDP to be increased to 2.3% of GDP.
I. Environmental Sustainability Increase productive forest coverage to 20%. Improve air quality in Dhaka and other large cities and enact Clean Air Act. Promote zero discharge of industrial effluents. Urban wetlands are restored and protected in line with Wetland Conservation Act. At least 15% of the wetland in peak dry season is protected as aquatic sanctuary.
500-meter-wide permanent green belt established and protected along the coast. Eco-tourism promoted at least in 20 protected areas and Ecological Critical Areas. Land zoning for sustainable land/water use completed. Environmental, climate change, and disaster risk reduction considerations are integrated into project design, budgetary
allocations, and implementation process. Canals and natural water flows of Dhaka and other major cities restored.
J. Information and Communication Technology Development Spending on research and development to constitute 1% of GDP. Increase proportion of primary government schools with a computer laboratory.
Improve telephone density to 100%. Expansion of broad band coverage to 35%.
Increase earnings from information and communication technology, travel, and tourism from $1.5 billion to $6 billion.
Note: Fiscal year 2015 goes from 1 July 2015 to 30 June 2016.Source: Planning Commission.
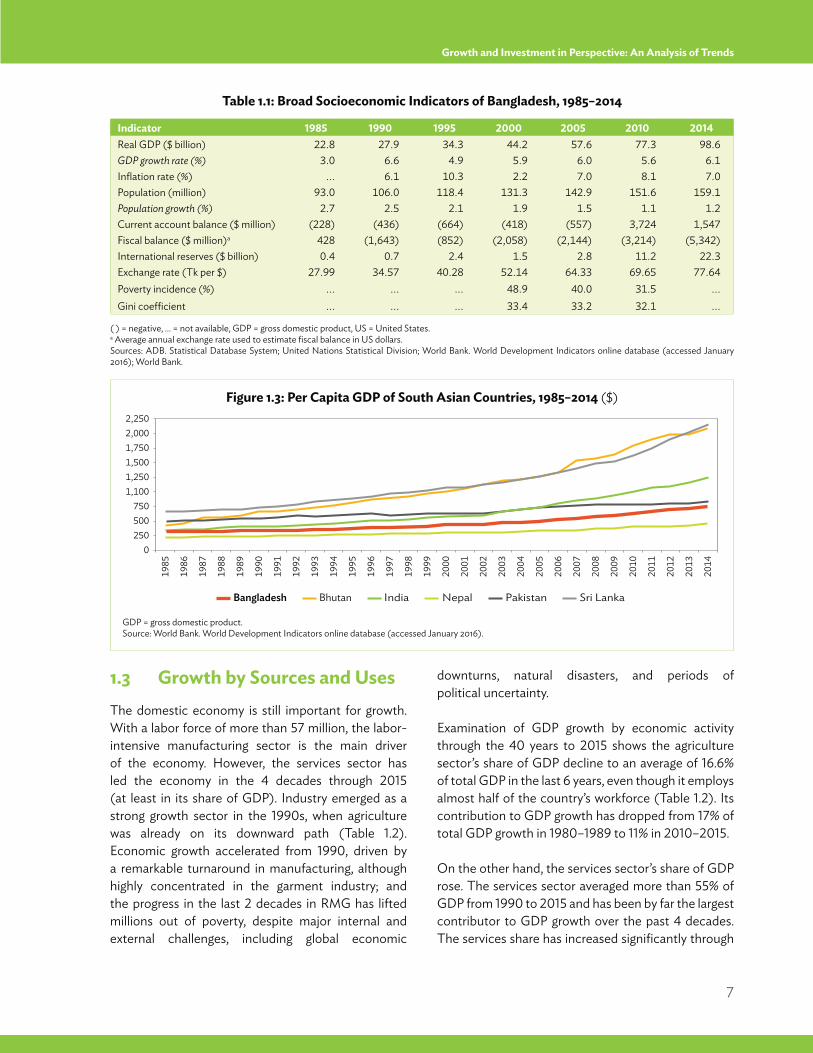
in 2014, higher only than Nepal’s $426. Compared with other countries in the region, Bangladesh started as the one of the poorest in 1985 but has caught up very quickly, while Pakistan’s per-capita
growth has stagnated somewhat. Still, Bhutan, India, and Sri Lanka have been able to take bigger strides (Figure 1.3).
7
Growth and Investment in Perspective: An Analysis of Trends
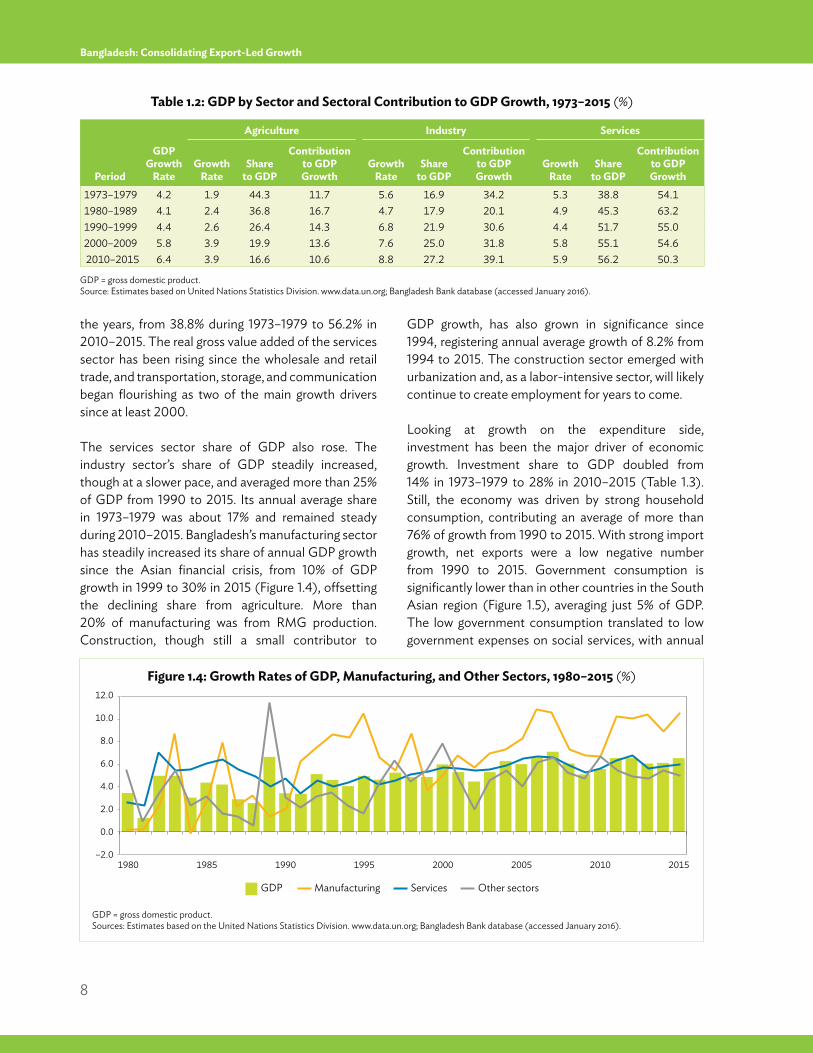
1.3 Growth by Sources and UsesThe domestic economy is still important for growth. With a labor force of more than 57 million, the labor-intensive manufacturing sector is the main driver of the economy. However, the services sector has led the economy in the 4 decades through 2015 (at least in its share of GDP). Industry emerged as a strong growth sector in the 1990s, when agriculture was already on its downward path (Table 1.2). Economic growth accelerated from 1990, driven by a remarkable turnaround in manufacturing, although highly concentrated in the garment industry; and the progress in the last 2 decades in RMG has lifted millions out of poverty, despite major internal and external challenges, including global economic
Figure 1.3: Per Capita GDP of South Asian Countries, 1985–2014 ($)
GDP = gross domestic product. Source: World Bank. World Development Indicators online database (accessed January 2016).
IndiaBangladesh Bhutan
0
2,250
1,7501,5001,2501,100
750500250
2,000
Nepal Pakistan Sri Lanka
1985
1995
1986
1987
1989
1990
1991
1992
1993
1994
1988
1996
1997
1999
2000
2010
2011
2012
2013
2014
1998
2005
2001
2002
2003
2004
2006
2007
2009
2008
Table 1.1: Broad Socioeconomic Indicators of Bangladesh, 1985–2014
( ) = negative, … = not available, GDP = gross domestic product, US = United States.a Average annual exchange rate used to estimate fiscal balance in US dollars.Sources: ADB. Statistical Database System; United Nations Statistical Division; World Bank. World Development Indicators online database (accessed January 2016); World Bank.
Indicator 1985 1990 1995 2000 2005 2010 2014Real GDP ($ billion) 22.8 27.9 34.3 44.2 57.6 77.3 98.6GDP growth rate (%) 3.0 6.6 4.9 5.9 6.0 5.6 6.1Inflation rate (%) ... 6.1 10.3 2.2 7.0 8.1 7.0Population (million) 93.0 106.0 118.4 131.3 142.9 151.6 159.1Population growth (%) 2.7 2.5 2.1 1.9 1.5 1.1 1.2Current account balance ($ million) (228) (436) (664) (418) (557) 3,724 1,547Fiscal balance ($ million)a 428 (1,643) (852) (2,058) (2,144) (3,214) (5,342)International reserves ($ billion) 0.4 0.7 2.4 1.5 2.8 11.2 22.3Exchange rate (Tk per $) 27.99 34.57 40.28 52.14 64.33 69.65 77.64Poverty incidence (%) ... ... ... 48.9 40.0 31.5 ...Gini coefficient ... ... ... 33.4 33.2 32.1 ...
downturns, natural disasters, and periods of political uncertainty.
Examination of GDP growth by economic activity through the 40 years to 2015 shows the agriculture sector’s share of GDP decline to an average of 16.6% of total GDP in the last 6 years, even though it employs almost half of the country’s workforce (Table 1.2). Its contribution to GDP growth has dropped from 17% of total GDP growth in 1980–1989 to 11% in 2010–2015.
On the other hand, the services sector’s share of GDP rose. The services sector averaged more than 55% of GDP from 1990 to 2015 and has been by far the largest contributor to GDP growth over the past 4 decades. The services share has increased significantly through
8
Bangladesh: Consolidating Export-Led Growth
Figure 1.4: Growth Rates of GDP, Manufacturing, and Other Sectors, 1980–2015 (%)
GDP = gross domestic product.Sources: Estimates based on the United Nations Statistics Division. www.data.un.org; Bangladesh Bank database (accessed January 2016).
GDP Manufacturing
–2.0
0.0
4.0
2.0
6.0
8.0
10.0
12.0
1980 1985 1990 1995 2000 2005 2010 2015
Other sectorsServices
the years, from 38.8% during 1973–1979 to 56.2% in 2010–2015. The real gross value added of the services sector has been rising since the wholesale and retail trade, and transportation, storage, and communication began flourishing as two of the main growth drivers since at least 2000. The services sector share of GDP also rose. The industry sector’s share of GDP steadily increased, though at a slower pace, and averaged more than 25% of GDP from 1990 to 2015. Its annual average share in 1973–1979 was about 17% and remained steady during 2010–2015. Bangladesh’s manufacturing sector has steadily increased its share of annual GDP growth since the Asian financial crisis, from 10% of GDP growth in 1999 to 30% in 2015 (Figure 1.4), offsetting the declining share from agriculture. More than 20% of manufacturing was from RMG production. Construction, though still a small contributor to
GDP growth, has also grown in significance since 1994, registering annual average growth of 8.2% from 1994 to 2015. The construction sector emerged with urbanization and, as a labor-intensive sector, will likely continue to create employment for years to come.
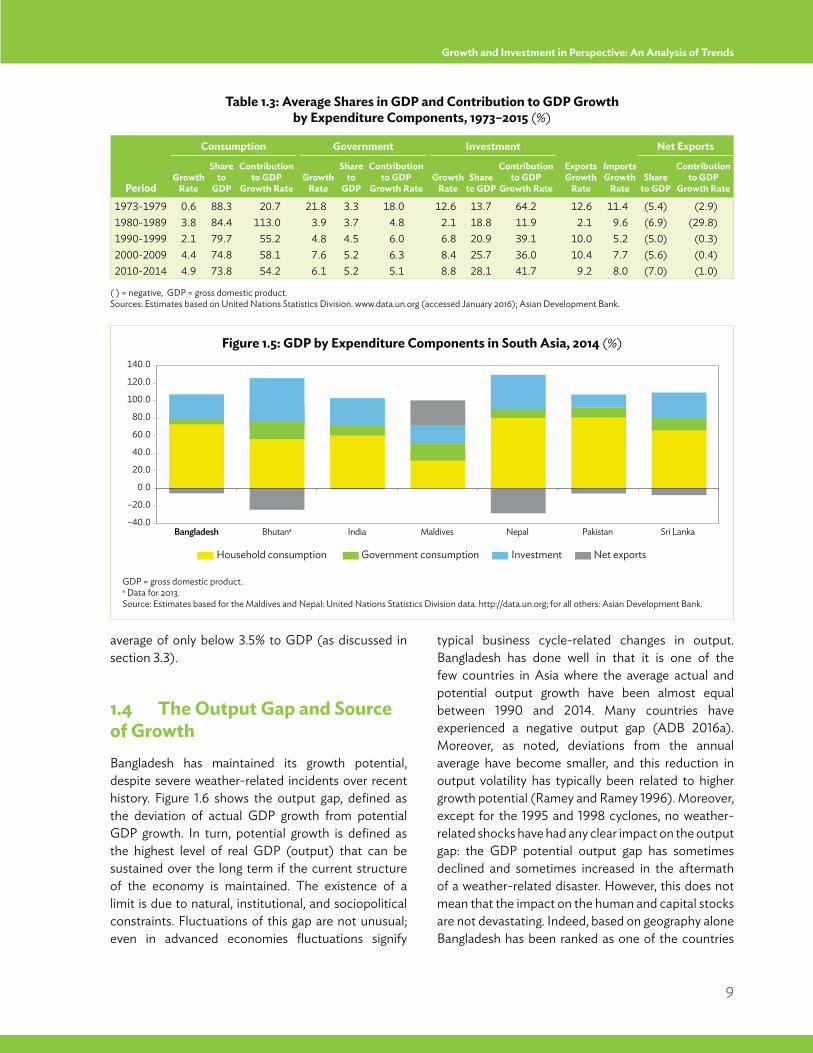
Looking at growth on the expenditure side, investment has been the major driver of economic growth. Investment share to GDP doubled from 14% in 1973–1979 to 28% in 2010–2015 (Table 1.3). Still, the economy was driven by strong household consumption, contributing an average of more than 76% of growth from 1990 to 2015. With strong import growth, net exports were a low negative number from 1990 to 2015. Government consumption is significantly lower than in other countries in the South Asian region (Figure 1.5), averaging just 5% of GDP. The low government consumption translated to low government expenses on social services, with annual
Period
GDPGrowth
Rate
Agriculture Industry Services
GrowthRate
Shareto GDP
Contributionto GDPGrowth
GrowthRate
Shareto GDP
Contributionto GDPGrowth
GrowthRate
Shareto GDP
Contributionto GDPGrowth
1973–1979 4.2 1.9 44.3 11.7 5.6 16.9 34.2 5.3 38.8 54.1 1980–1989 4.1 2.4 36.8 16.7 4.7 17.9 20.1 4.9 45.3 63.2 1990–1999 4.4 2.6 26.4 14.3 6.8 21.9 30.6 4.4 51.7 55.0 2000–2009 5.8 3.9 19.9 13.6 7.6 25.0 31.8 5.8 55.1 54.6 2010–2015 6.4 3.9 16.6 10.6 8.8 27.2 39.1 5.9 56.2 50.3
Table 1.2: GDP by Sector and Sectoral Contribution to GDP Growth, 1973–2015 (%)
GDP = gross domestic product. Source: Estimates based on United Nations Statistics Division. www.data.un.org; Bangladesh Bank database (accessed January 2016).
9
Growth and Investment in Perspective: An Analysis of Trends
average of only below 3.5% to GDP (as discussed in section 3.3).
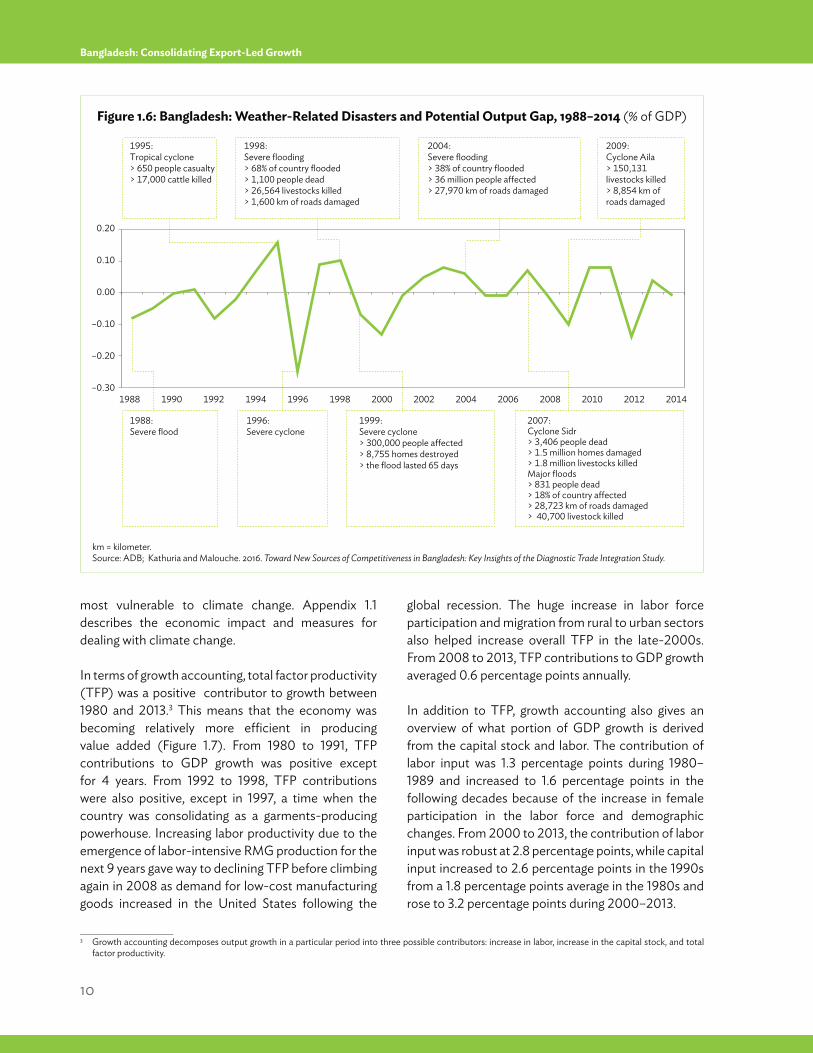
1.4 The Output Gap and Source of Growth Bangladesh has maintained its growth potential, despite severe weather-related incidents over recent history. Figure 1.6 shows the output gap, defined as the deviation of actual GDP growth from potential GDP growth. In turn, potential growth is defined as the highest level of real GDP (output) that can be sustained over the long term if the current structure of the economy is maintained. The existence of a limit is due to natural, institutional, and sociopolitical constraints. Fluctuations of this gap are not unusual; even in advanced economies fluctuations signify
typical business cycle-related changes in output. Bangladesh has done well in that it is one of the few countries in Asia where the average actual and potential output growth have been almost equal between 1990 and 2014. Many countries have experienced a negative output gap (ADB 2016a). Moreover, as noted, deviations from the annual average have become smaller, and this reduction in output volatility has typically been related to higher growth potential (Ramey and Ramey 1996). Moreover, except for the 1995 and 1998 cyclones, no weather-related shocks have had any clear impact on the output gap: the GDP potential output gap has sometimes declined and sometimes increased in the aftermath of a weather-related disaster. However, this does not mean that the impact on the human and capital stocks are not devastating. Indeed, based on geography alone Bangladesh has been ranked as one of the countries
Table 1.3: Average Shares in GDP and Contribution to GDP Growthby Expenditure Components, 1973–2015 (%)
( ) = negative, GDP = gross domestic product.Sources: Estimates based on United Nations Statistics Division. www.data.un.org (accessed January 2016); Asian Development Bank.
Figure 1.5: GDP by Expenditure Components in South Asia, 2014 (%)
GDP = gross domestic product.a Data for 2013.Source: Estimates based for the Maldives and Nepal: United Nations Statistics Division data. http://data.un.org; for all others: Asian Development Bank.
Period
Consumption Government Investment Net Exports
GrowthRate
Shareto
GDP
Contributionto GDP
Growth RateGrowth
Rate
Shareto
GDP
Contributionto GDP
Growth RateGrowth
RateShare
to GDP
Contributionto GDP
Growth Rate
ExportsGrowth
Rate
ImportsGrowth
RateShare
to GDP
Contributionto GDP
Growth Rate
1973-1979 0.6 88.3 20.7 21.8 3.3 18.0 12.6 13.7 64.2 12.6 11.4 (5.4) (2.9) 1980-1989 3.8 84.4 113.0 3.9 3.7 4.8 2.1 18.8 11.9 2.1 9.6 (6.9) (29.8) 1990-1999 2.1 79.7 55.2 4.8 4.5 6.0 6.8 20.9 39.1 10.0 5.2 (5.0) (0.3) 2000-2009 4.4 74.8 58.1 7.6 5.2 6.3 8.4 25.7 36.0 10.4 7.7 (5.6) (0.4) 2010-2014 4.9 73.8 54.2 6.1 5.2 5.1 8.8 28.1 41.7 9.2 8.0 (7.0) (1.0)
Investment Net exportsHousehold consumption Government consumption
–40.0
–20.0
100.0
80.0
60.0
40.0
20.0
0.0
120.0
140.0
Bangladesh Bhutana India Maldives Nepal Pakistan Sri Lanka
10
Bangladesh: Consolidating Export-Led Growth
most vulnerable to climate change. Appendix 1.1 describes the economic impact and measures for dealing with climate change.
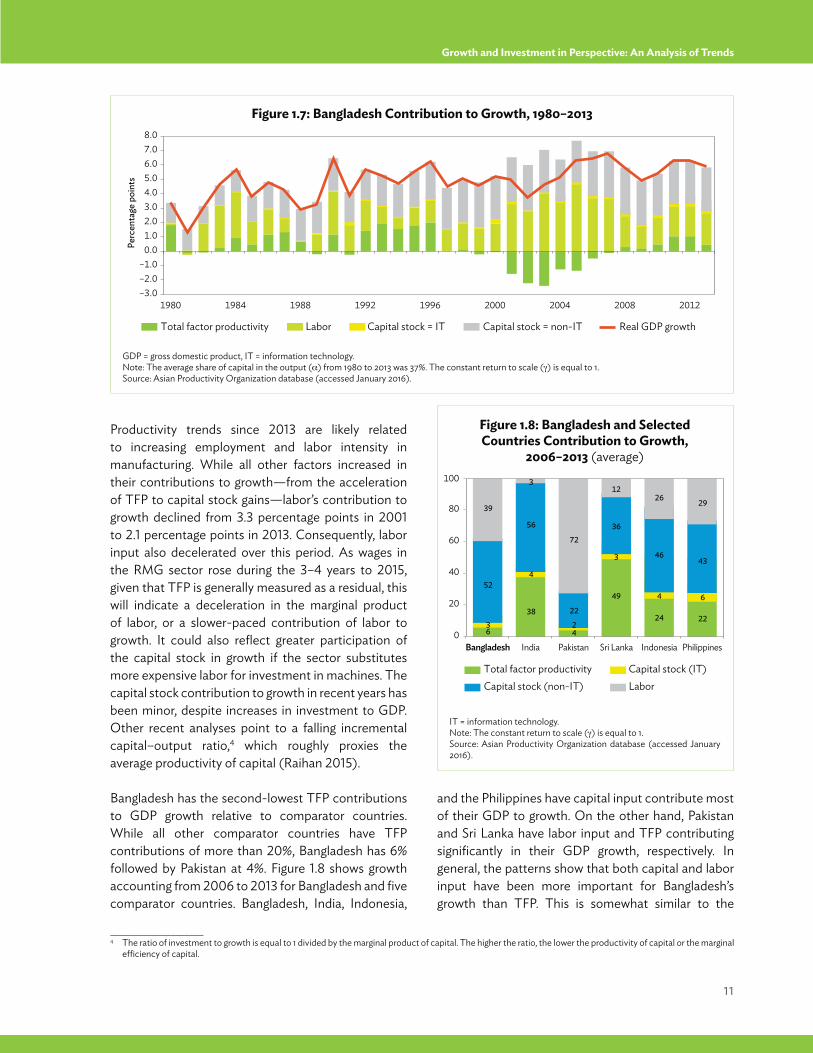
In terms of growth accounting, total factor productivity (TFP) was a positive contributor to growth between 1980 and 2013.3 This means that the economy was becoming relatively more efficient in producing value added (Figure 1.7). From 1980 to 1991, TFP contributions to GDP growth was positive except for 4 years. From 1992 to 1998, TFP contributions were also positive, except in 1997, a time when the country was consolidating as a garments-producing powerhouse. Increasing labor productivity due to the emergence of labor-intensive RMG production for the next 9 years gave way to declining TFP before climbing again in 2008 as demand for low-cost manufacturing goods increased in the United States following the
global recession. The huge increase in labor force participation and migration from rural to urban sectors also helped increase overall TFP in the late-2000s. From 2008 to 2013, TFP contributions to GDP growth averaged 0.6 percentage points annually.
In addition to TFP, growth accounting also gives an overview of what portion of GDP growth is derived from the capital stock and labor. The contribution of labor input was 1.3 percentage points during 1980–1989 and increased to 1.6 percentage points in the following decades because of the increase in female participation in the labor force and demographic changes. From 2000 to 2013, the contribution of labor input was robust at 2.8 percentage points, while capital input increased to 2.6 percentage points in the 1990s from a 1.8 percentage points average in the 1980s and rose to 3.2 percentage points during 2000–2013.
____________________3 Growth accounting decomposes output growth in a particular period into three possible contributors: increase in labor, increase in the capital stock, and total
factor productivity.
Figure 1.6: Bangladesh: Weather-Related Disasters and Potential Output Gap, 1988–2014 (% of GDP)
km = kilometer.Source: ADB; Kathuria and Malouche. 2016. Toward New Sources of Competitiveness in Bangladesh: Key Insights of the Diagnostic Trade Integration Study.
1995:Tropical cyclone> 650 people casualty> 17,000 cattle killed
1988:Severe flood
1999:Severe cyclone> 300,000 people affected> 8,755 homes destroyed> the flood lasted 65 days
2007:Cyclone Sidr> 3,406 people dead> 1.5 million homes damaged> 1.8 million livestocks killedMajor floods> 831 people dead> 18% of country affected> 28,723 km of roads damaged> 40,700 livestock killed
1996:Severe cyclone
1998:Severe flooding> 68% of country flooded> 1,100 people dead> 26,564 livestocks killed> 1,600 km of roads damaged
2004:Severe flooding> 38% of country flooded> 36 million people affected> 27,970 km of roads damaged
2009:Cyclone Aila> 150,131 livestocks killed> 8,854 km of roads damaged
–0.30
–0.20
–0.10
0.00
0.10
0.20
1988 1990 1992 1994 1996 1998 2000 2002 2004 2006 2008 2010 2012 2014
11
Growth and Investment in Perspective: An Analysis of Trends
Productivity trends since 2013 are likely related to increasing employment and labor intensity in manufacturing. While all other factors increased in their contributions to growth—from the acceleration of TFP to capital stock gains—labor’s contribution to growth declined from 3.3 percentage points in 2001 to 2.1 percentage points in 2013. Consequently, labor input also decelerated over this period. As wages in the RMG sector rose during the 3–4 years to 2015, given that TFP is generally measured as a residual, this will indicate a deceleration in the marginal product of labor, or a slower-paced contribution of labor to growth. It could also reflect greater participation of the capital stock in growth if the sector substitutes more expensive labor for investment in machines. The capital stock contribution to growth in recent years has been minor, despite increases in investment to GDP. Other recent analyses point to a falling incremental capital–output ratio,4 which roughly proxies the average productivity of capital (Raihan 2015).
Bangladesh has the second-lowest TFP contributions to GDP growth relative to comparator countries. While all other comparator countries have TFP contributions of more than 20%, Bangladesh has 6% followed by Pakistan at 4%. Figure 1.8 shows growth accounting from 2006 to 2013 for Bangladesh and five comparator countries. Bangladesh, India, Indonesia,
and the Philippines have capital input contribute most of their GDP to growth. On the other hand, Pakistan and Sri Lanka have labor input and TFP contributing significantly in their GDP growth, respectively. In general, the patterns show that both capital and labor input have been more important for Bangladesh’s growth than TFP. This is somewhat similar to the
____________________4 The ratio of investment to growth is equal to 1 divided by the marginal product of capital. The higher the ratio, the lower the productivity of capital or the marginal
efficiency of capital.
Figure 1.7: Bangladesh Contribution to Growth, 1980–2013
GDP = gross domestic product, IT = information technology.Note: The average share of capital in the output ( ) from 1980 to 2013 was 37%. The constant return to scale ( ) is equal to 1.Source: Asian Productivity Organization database (accessed January 2016).
Capital stock = non-IT Real GDP growthTotal factor productivity Labor Capital stock = IT
–3.0
–1.0–2.0
6.05.04.03.02.01.00.0
7.08.0
1980 1984 1988 1992 1996 2000 2004 2008 2012
Perc
enta
ge p
oint
s
Capital stock (non-IT) LaborTotal factor productivity Capital stock (IT)
0
60
40
20
80
100
Bangladesh India Pakistan Sri Lanka Indonesia Philippines
39
52
63
12
36
49
3
26
46
24
4
29
43
22
6
72
22
42
3
56
38
4
Figure 1.8: Bangladesh and Selected Countries Contribution to Growth,
2006–2013 (average)
IT = information technology.Note: The constant return to scale ( ) is equal to 1. Source: Asian Productivity Organization database (accessed January 2016).
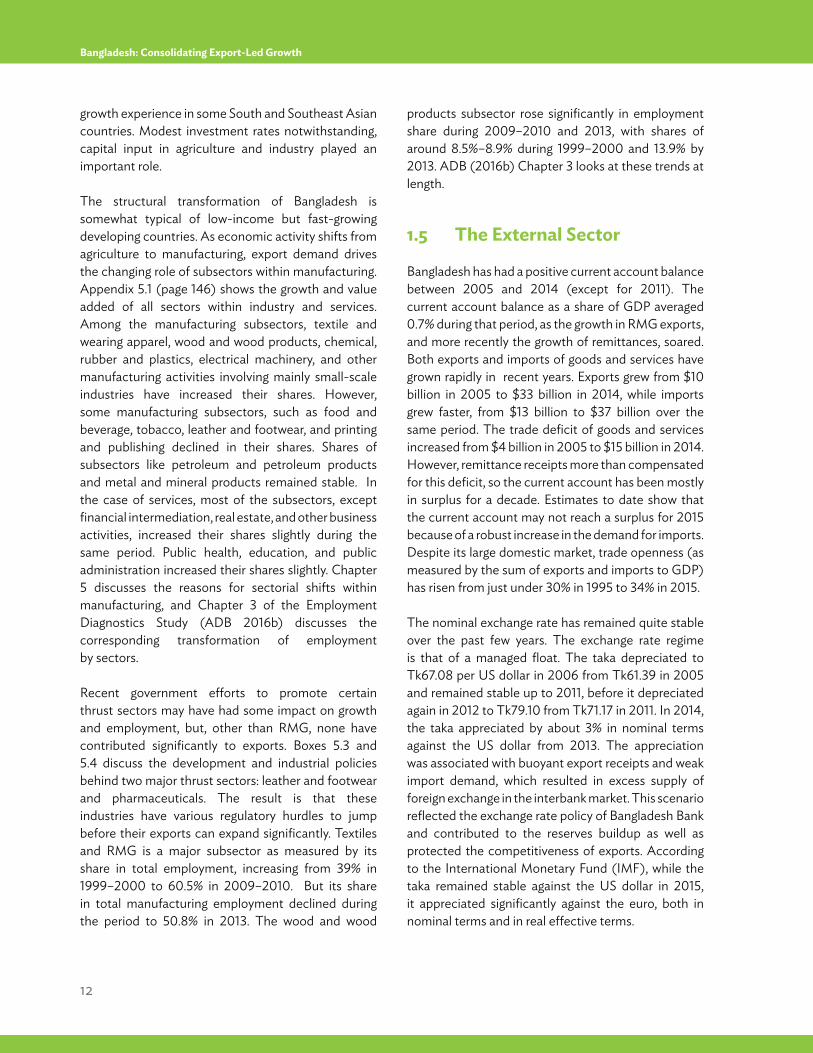
12
Bangladesh: Consolidating Export-Led Growth
growth experience in some South and Southeast Asian countries. Modest investment rates notwithstanding, capital input in agriculture and industry played an important role.
The structural transformation of Bangladesh is somewhat typical of low-income but fast-growing developing countries. As economic activity shifts from agriculture to manufacturing, export demand drives the changing role of subsectors within manufacturing. Appendix 5.1 (page 146) shows the growth and value added of all sectors within industry and services. Among the manufacturing subsectors, textile and wearing apparel, wood and wood products, chemical, rubber and plastics, electrical machinery, and other manufacturing activities involving mainly small-scale industries have increased their shares. However, some manufacturing subsectors, such as food and beverage, tobacco, leather and footwear, and printing and publishing declined in their shares. Shares of subsectors like petroleum and petroleum products and metal and mineral products remained stable. In the case of services, most of the subsectors, except financial intermediation, real estate, and other business activities, increased their shares slightly during the same period. Public health, education, and public administration increased their shares slightly. Chapter 5 discusses the reasons for sectorial shifts within manufacturing, and Chapter 3 of the Employment Diagnostics Study (ADB 2016b) discusses the corresponding transformation of employment by sectors.
Recent government efforts to promote certain thrust sectors may have had some impact on growth and employment, but, other than RMG, none have contributed significantly to exports. Boxes 5.3 and 5.4 discuss the development and industrial policies behind two major thrust sectors: leather and footwear and pharmaceuticals. The result is that these industries have various regulatory hurdles to jump before their exports can expand significantly. Textiles and RMG is a major subsector as measured by its share in total employment, increasing from 39% in 1999–2000 to 60.5% in 2009–2010. But its share in total manufacturing employment declined during the period to 50.8% in 2013. The wood and wood
products subsector rose significantly in employment share during 2009–2010 and 2013, with shares of around 8.5%–8.9% during 1999–2000 and 13.9% by 2013. ADB (2016b) Chapter 3 looks at these trends at length.
1.5 The External Sector
Bangladesh has had a positive current account balance between 2005 and 2014 (except for 2011). The current account balance as a share of GDP averaged 0.7% during that period, as the growth in RMG exports, and more recently the growth of remittances, soared. Both exports and imports of goods and services have grown rapidly in recent years. Exports grew from $10 billion in 2005 to $33 billion in 2014, while imports grew faster, from $13 billion to $37 billion over the same period. The trade deficit of goods and services increased from $4 billion in 2005 to $15 billion in 2014. However, remittance receipts more than compensated for this deficit, so the current account has been mostly in surplus for a decade. Estimates to date show that the current account may not reach a surplus for 2015 because of a robust increase in the demand for imports. Despite its large domestic market, trade openness (as measured by the sum of exports and imports to GDP) has risen from just under 30% in 1995 to 34% in 2015.
The nominal exchange rate has remained quite stable over the past few years. The exchange rate regime is that of a managed float. The taka depreciated to Tk67.08 per US dollar in 2006 from Tk61.39 in 2005 and remained stable up to 2011, before it depreciated again in 2012 to Tk79.10 from Tk71.17 in 2011. In 2014, the taka appreciated by about 3% in nominal terms against the US dollar from 2013. The appreciation was associated with buoyant export receipts and weak import demand, which resulted in excess supply of foreign exchange in the interbank market. This scenario reflected the exchange rate policy of Bangladesh Bank and contributed to the reserves buildup as well as protected the competitiveness of exports. According to the International Monetary Fund (IMF), while the taka remained stable against the US dollar in 2015, it appreciated significantly against the euro, both in nominal terms and in real effective terms.
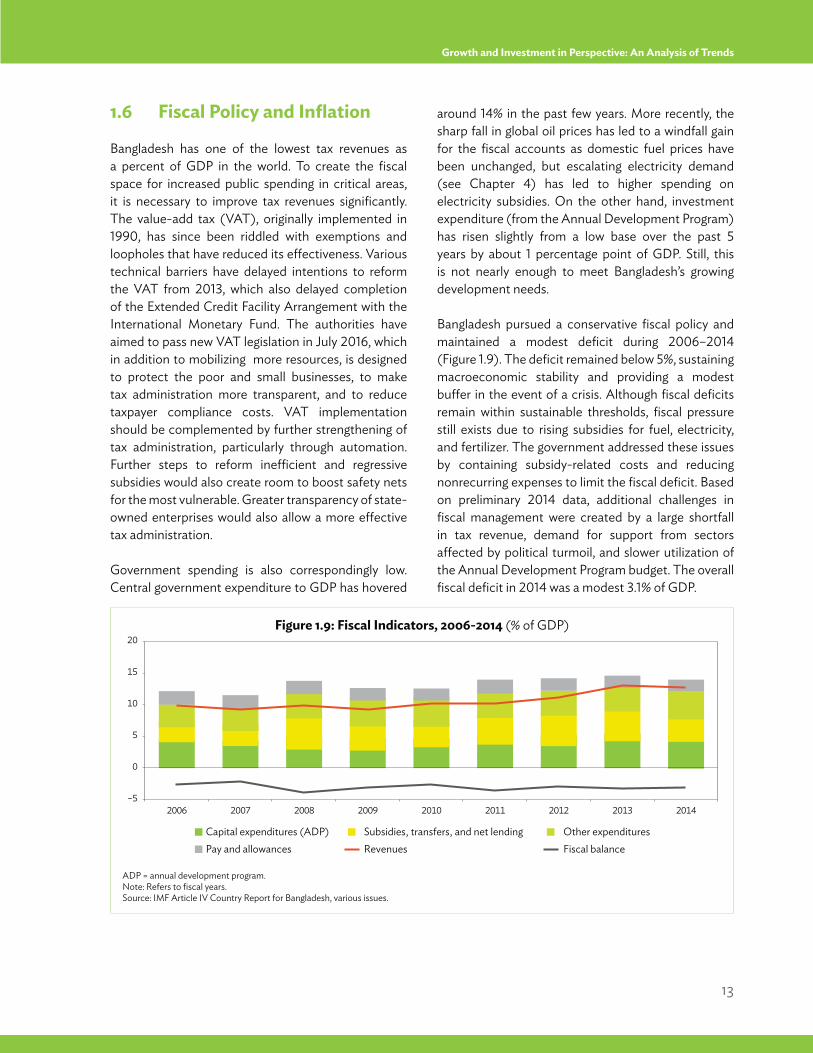
13
Growth and Investment in Perspective: An Analysis of Trends
1.6 Fiscal Policy and Inflation
Bangladesh has one of the lowest tax revenues as a percent of GDP in the world. To create the fiscal space for increased public spending in critical areas, it is necessary to improve tax revenues significantly. The value-add tax (VAT), originally implemented in 1990, has since been riddled with exemptions and loopholes that have reduced its effectiveness. Various technical barriers have delayed intentions to reform the VAT from 2013, which also delayed completion of the Extended Credit Facility Arrangement with the International Monetary Fund. The authorities have aimed to pass new VAT legislation in July 2016, which in addition to mobilizing more resources, is designed to protect the poor and small businesses, to make tax administration more transparent, and to reduce taxpayer compliance costs. VAT implementation should be complemented by further strengthening of tax administration, particularly through automation. Further steps to reform inefficient and regressive subsidies would also create room to boost safety nets for the most vulnerable. Greater transparency of state-owned enterprises would also allow a more effective tax administration.
Government spending is also correspondingly low. Central government expenditure to GDP has hovered
around 14% in the past few years. More recently, the sharp fall in global oil prices has led to a windfall gain for the fiscal accounts as domestic fuel prices have been unchanged, but escalating electricity demand (see Chapter 4) has led to higher spending on electricity subsidies. On the other hand, investment expenditure (from the Annual Development Program) has risen slightly from a low base over the past 5 years by about 1 percentage point of GDP. Still, this is not nearly enough to meet Bangladesh’s growing development needs.
Bangladesh pursued a conservative fiscal policy and maintained a modest deficit during 2006–2014 (Figure 1.9). The deficit remained below 5%, sustaining macroeconomic stability and providing a modest buffer in the event of a crisis. Although fiscal deficits remain within sustainable thresholds, fiscal pressure still exists due to rising subsidies for fuel, electricity, and fertilizer. The government addressed these issues by containing subsidy-related costs and reducing nonrecurring expenses to limit the fiscal deficit. Based on preliminary 2014 data, additional challenges in fiscal management were created by a large shortfall in tax revenue, demand for support from sectors affected by political turmoil, and slower utilization of the Annual Development Program budget. The overall fiscal deficit in 2014 was a modest 3.1% of GDP.
Figure 1.9: Fiscal Indicators, 2006-2014 (% of GDP)
ADP = annual development program.Note: Refers to fiscal years.Source: IMF Article IV Country Report for Bangladesh, various issues.
Capital expenditures (ADP) Subsidies, transfers, and net lending Other expendituresPay and allowances Revenues
–5
10
5
0
15
20
2006 2007 2008 2009 2010 2011 2012 2013 2014
Fiscal balance
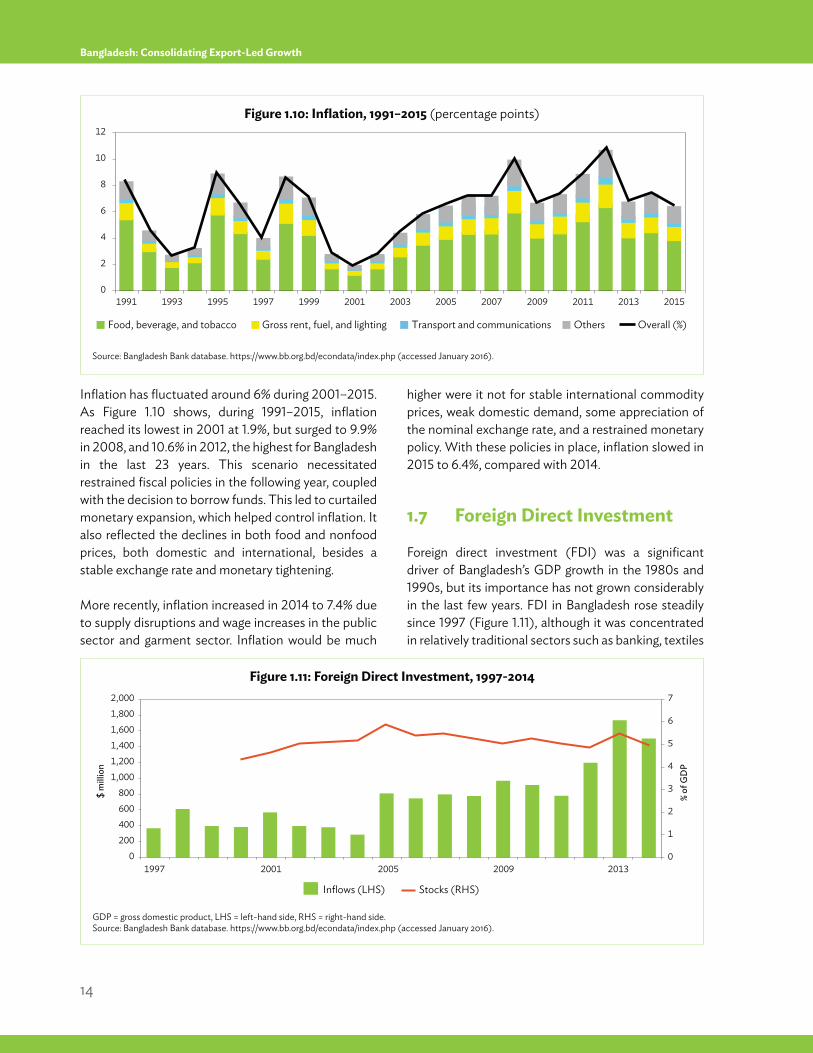
14
Bangladesh: Consolidating Export-Led Growth
Inflation has fluctuated around 6% during 2001–2015.As Figure 1.10 shows, during 1991–2015, inflation reached its lowest in 2001 at 1.9%, but surged to 9.9% in 2008, and 10.6% in 2012, the highest for Bangladesh in the last 23 years. This scenario necessitated restrained fiscal policies in the following year, coupled with the decision to borrow funds. This led to curtailed monetary expansion, which helped control inflation. It also reflected the declines in both food and nonfood prices, both domestic and international, besides a stable exchange rate and monetary tightening.
More recently, inflation increased in 2014 to 7.4% due to supply disruptions and wage increases in the public sector and garment sector. Inflation would be much
higher were it not for stable international commodity prices, weak domestic demand, some appreciation of the nominal exchange rate, and a restrained monetary policy. With these policies in place, inflation slowed in 2015 to 6.4%, compared with 2014.
1.7 Foreign Direct Investment
Foreign direct investment (FDI) was a significant driver of Bangladesh’s GDP growth in the 1980s and 1990s, but its importance has not grown considerably in the last few years. FDI in Bangladesh rose steadily since 1997 (Figure 1.11), although it was concentrated in relatively traditional sectors such as banking, textiles
Figure 1.10: Inflation, 1991–2015 (percentage points)
Source: Bangladesh Bank database. https://www.bb.org.bd/econdata/index.php (accessed January 2016).
Inflows (LHS) Stocks (RHS)
0
1,2001,000
800600400200
1,4001,6001,8002,000
$ m
illio
n
% o
f GD
P7
6
5
4
3
2
1
01997 2001 2005 2009 2013
Figure 1.11: Foreign Direct Investment, 1997-2014
GDP = gross domestic product, LHS = left-hand side, RHS = right-hand side.Source: Bangladesh Bank database. https://www.bb.org.bd/econdata/index.php (accessed January 2016).
Others Overall (%)Food, beverage, and tobacco Gross rent, fuel, and lighting Transport and communications
0
8
6
4
2
10
12
1991 1993 1995 1997 1999 2001 2003 2005 2007 2009 2011 2013 2015
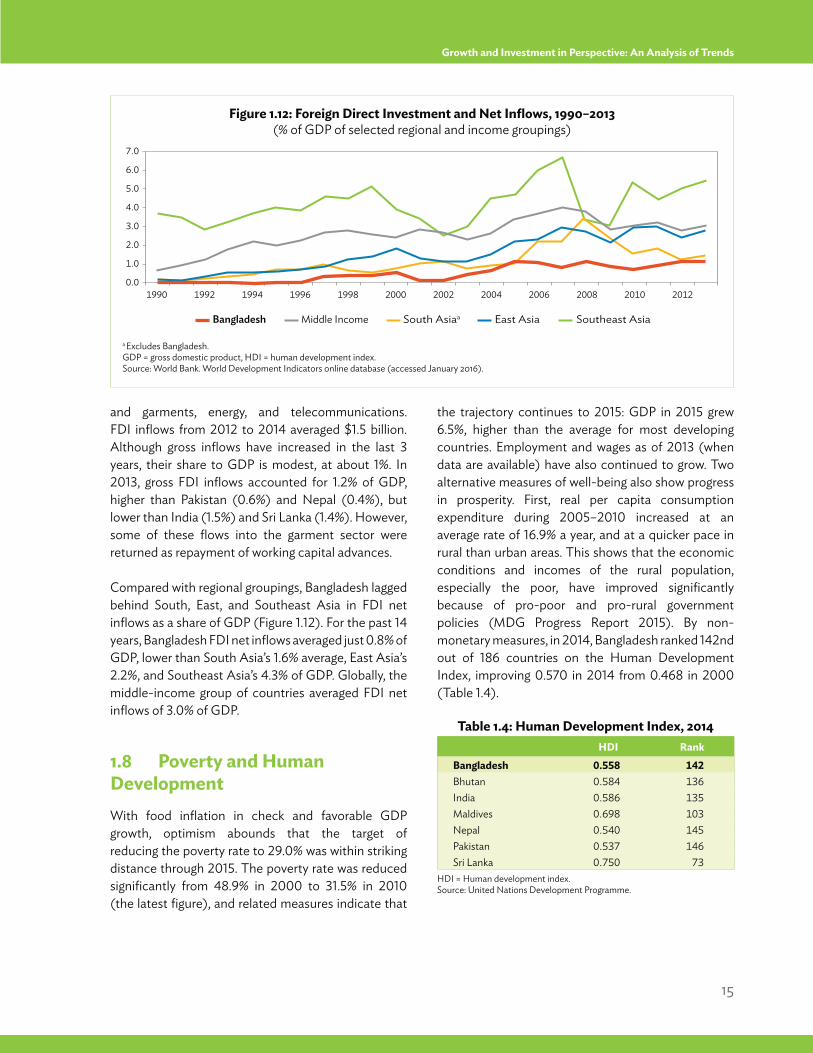
15
Growth and Investment in Perspective: An Analysis of Trends
and garments, energy, and telecommunications. FDI inflows from 2012 to 2014 averaged $1.5 billion. Although gross inflows have increased in the last 3 years, their share to GDP is modest, at about 1%. In 2013, gross FDI inflows accounted for 1.2% of GDP, higher than Pakistan (0.6%) and Nepal (0.4%), but lower than India (1.5%) and Sri Lanka (1.4%). However, some of these flows into the garment sector were returned as repayment of working capital advances.
Compared with regional groupings, Bangladesh lagged behind South, East, and Southeast Asia in FDI net inflows as a share of GDP (Figure 1.12). For the past 14 years, Bangladesh FDI net inflows averaged just 0.8% of GDP, lower than South Asia’s 1.6% average, East Asia’s 2.2%, and Southeast Asia’s 4.3% of GDP. Globally, the middle-income group of countries averaged FDI net inflows of 3.0% of GDP.
1.8 Poverty and Human DevelopmentWith food inflation in check and favorable GDP growth, optimism abounds that the target of reducing the poverty rate to 29.0% was within striking distance through 2015. The poverty rate was reduced significantly from 48.9% in 2000 to 31.5% in 2010 (the latest figure), and related measures indicate that
the trajectory continues to 2015: GDP in 2015 grew 6.5%, higher than the average for most developing countries. Employment and wages as of 2013 (when data are available) have also continued to grow. Two alternative measures of well-being also show progress in prosperity. First, real per capita consumption expenditure during 2005–2010 increased at an average rate of 16.9% a year, and at a quicker pace in rural than urban areas. This shows that the economic conditions and incomes of the rural population, especially the poor, have improved significantly because of pro-poor and pro-rural government policies (MDG Progress Report 2015). By non-monetary measures, in 2014, Bangladesh ranked 142nd out of 186 countries on the Human Development Index, improving 0.570 in 2014 from 0.468 in 2000 (Table 1.4).
Table 1.4: Human Development Index, 2014HDI Rank
Bangladesh 0.558 142Bhutan 0.584 136India 0.586 135Maldives 0.698 103Nepal 0.540 145Pakistan 0.537 146Sri Lanka 0.750 73
HDI = Human development index.Source: United Nations Development Programme.
Figure 1.12: Foreign Direct Investment and Net Inflows, 1990–2013 (% of GDP of selected regional and income groupings)
a Excludes Bangladesh. GDP = gross domestic product, HDI = human development index.Source: World Bank. World Development Indicators online database (accessed January 2016).
South AsiaaBangladesh Middle Income
0.0
7.0
5.0
4.0
3.0
2.0
1.0
6.0
East Asia Southeast Asia
19961990 1992 1994 1998 2000 2002 2004 2006 2008 2010 2012
16
Bangladesh: Consolidating Export-Led Growth
The Human Development Index and other indicators of well-being show development progress, but opportunities for better jobs will be key to success. With 2 million people joining the labor force every year, growth in manufacturing will remain critical for employment generation and moving workers away from low-productivity sectors and the informal economy. The employment transformation that has gone hand in hand with growth and investment is analyzed at length in Chapter 2 of the 2016 Employment Diagnostics Study for Bangladesh (ADB 2016b). Chapter 2 discusses the potential constraints to productivity in the decades to come in more detail, and the areas policy makers should focus on to ensure that the economy advances.
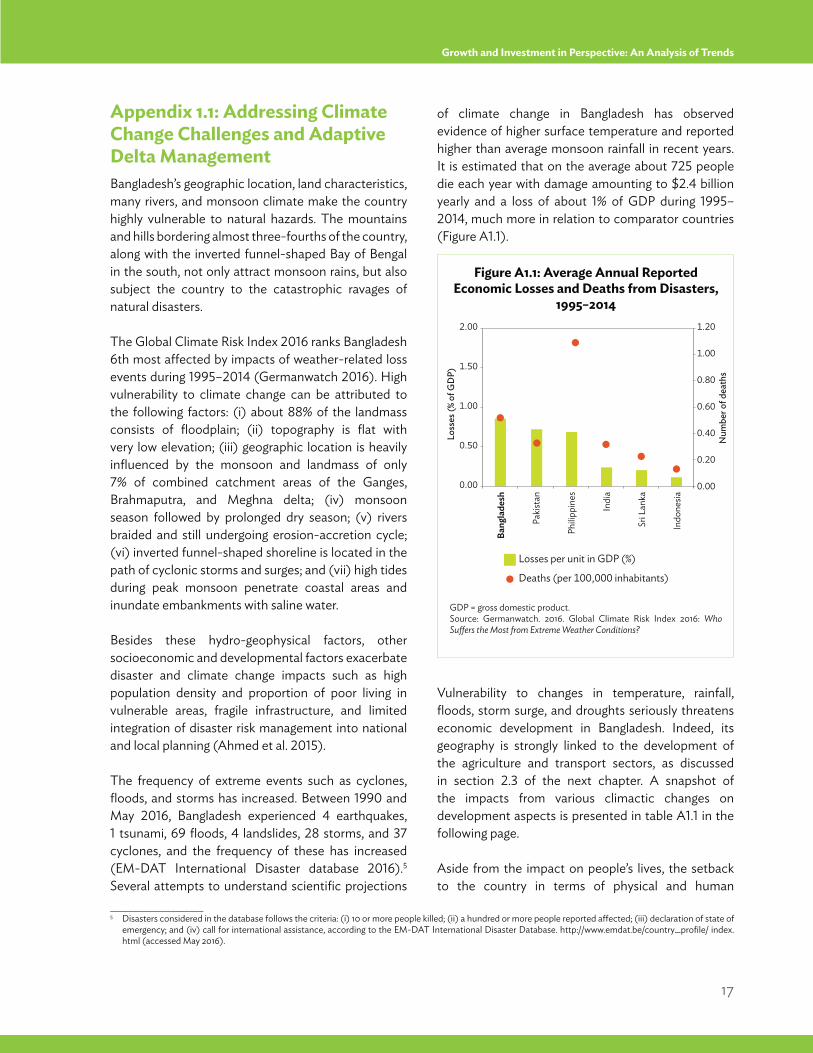
17
Growth and Investment in Perspective: An Analysis of Trends
Appendix 1.1: Addressing Climate Change Challenges and Adaptive Delta ManagementBangladesh’s geographic location, land characteristics, many rivers, and monsoon climate make the country highly vulnerable to natural hazards. The mountains and hills bordering almost three-fourths of the country, along with the inverted funnel-shaped Bay of Bengal in the south, not only attract monsoon rains, but also subject the country to the catastrophic ravages of natural disasters. The Global Climate Risk Index 2016 ranks Bangladesh 6th most affected by impacts of weather-related loss events during 1995–2014 (Germanwatch 2016). High vulnerability to climate change can be attributed to the following factors: (i) about 88% of the landmass consists of floodplain; (ii) topography is flat with very low elevation; (iii) geographic location is heavily influenced by the monsoon and landmass of only 7% of combined catchment areas of the Ganges, Brahmaputra, and Meghna delta; (iv) monsoon season followed by prolonged dry season; (v) rivers braided and still undergoing erosion-accretion cycle; (vi) inverted funnel-shaped shoreline is located in the path of cyclonic storms and surges; and (vii) high tides during peak monsoon penetrate coastal areas and inundate embankments with saline water.
Besides these hydro-geophysical factors, other socioeconomic and developmental factors exacerbate disaster and climate change impacts such as high population density and proportion of poor living in vulnerable areas, fragile infrastructure, and limited integration of disaster risk management into national and local planning (Ahmed et al. 2015).
The frequency of extreme events such as cyclones, floods, and storms has increased. Between 1990 and May 2016, Bangladesh experienced 4 earthquakes, 1 tsunami, 69 floods, 4 landslides, 28 storms, and 37 cyclones, and the frequency of these has increased (EM-DAT International Disaster database 2016).5 Several attempts to understand scientific projections
of climate change in Bangladesh has observed evidence of higher surface temperature and reported higher than average monsoon rainfall in recent years. It is estimated that on the average about 725 people die each year with damage amounting to $2.4 billion yearly and a loss of about 1% of GDP during 1995–2014, much more in relation to comparator countries (Figure A1.1).
Vulnerability to changes in temperature, rainfall, floods, storm surge, and droughts seriously threatens economic development in Bangladesh. Indeed, its geography is strongly linked to the development of the agriculture and transport sectors, as discussed in section 2.3 of the next chapter. A snapshot of the impacts from various climactic changes on development aspects is presented in table A1.1 in the following page.
Aside from the impact on people’s lives, the setback to the country in terms of physical and human
____________________5 Disasters considered in the database follows the criteria: (i) 10 or more people killed; (ii) a hundred or more people reported affected; (iii) declaration of state of
emergency; and (iv) call for international assistance, according to the EM-DAT International Disaster Database. http://www.emdat.be/country_profile/ index.html (accessed May 2016).
Figure A1.1: Average Annual Reported Economic Losses and Deaths from Disasters,
1995–2014
GDP = gross domestic product.Source: Germanwatch. 2016. Global Climate Risk Index 2016: Who Suffers the Most from Extreme Weather Conditions?
Losses per unit in GDP (%)
Deaths (per 100,000 inhabitants)
0.00
0.50
1.00
1.50
2.00 1.20
1.00
0.80
0.60
0.20
0.40
0.00Ba
ngla
desh
Paki
stan
Philip
pine
s
Indi
a
Sri L
anka
Indo
nesia
Loss
es (%
of G
DP)
Num
ber o
f dea
ths
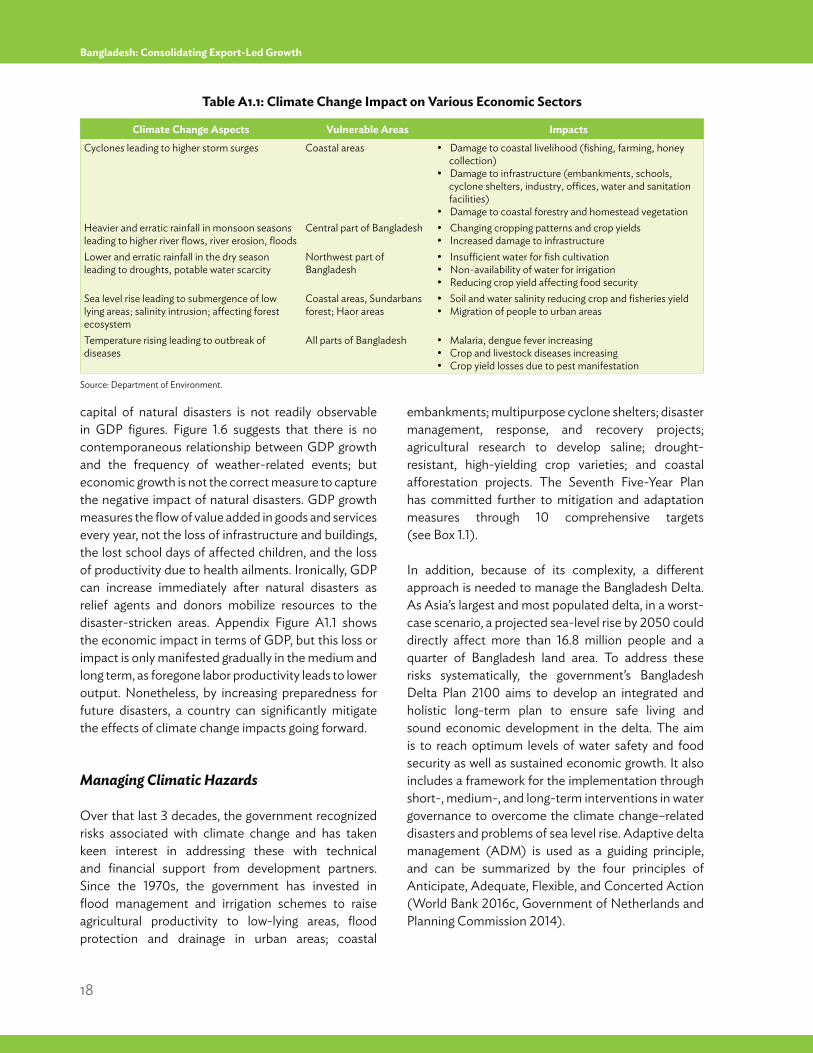
18
Bangladesh: Consolidating Export-Led Growth
capital of natural disasters is not readily observable in GDP figures. Figure 1.6 suggests that there is no contemporaneous relationship between GDP growth and the frequency of weather-related events; but economic growth is not the correct measure to capture the negative impact of natural disasters. GDP growth measures the flow of value added in goods and services every year, not the loss of infrastructure and buildings, the lost school days of affected children, and the loss of productivity due to health ailments. Ironically, GDP can increase immediately after natural disasters as relief agents and donors mobilize resources to the disaster-stricken areas. Appendix Figure A1.1 shows the economic impact in terms of GDP, but this loss or impact is only manifested gradually in the medium and long term, as foregone labor productivity leads to lower output. Nonetheless, by increasing preparedness for future disasters, a country can significantly mitigate the effects of climate change impacts going forward.
Managing Climatic Hazards
Over that last 3 decades, the government recognized risks associated with climate change and has taken keen interest in addressing these with technical and financial support from development partners. Since the 1970s, the government has invested in flood management and irrigation schemes to raise agricultural productivity to low-lying areas, flood protection and drainage in urban areas; coastal
embankments; multipurpose cyclone shelters; disaster management, response, and recovery projects; agricultural research to develop saline; drought-resistant, high-yielding crop varieties; and coastal afforestation projects. The Seventh Five-Year Plan has committed further to mitigation and adaptation measures through 10 comprehensive targets (see Box 1.1).
In addition, because of its complexity, a different approach is needed to manage the Bangladesh Delta. As Asia’s largest and most populated delta, in a worst-case scenario, a projected sea-level rise by 2050 could directly affect more than 16.8 million people and a quarter of Bangladesh land area. To address these risks systematically, the government’s Bangladesh Delta Plan 2100 aims to develop an integrated and holistic long-term plan to ensure safe living and sound economic development in the delta. The aim is to reach optimum levels of water safety and food security as well as sustained economic growth. It also includes a framework for the implementation through short-, medium-, and long-term interventions in water governance to overcome the climate change–related disasters and problems of sea level rise. Adaptive delta management (ADM) is used as a guiding principle, and can be summarized by the four principles of Anticipate, Adequate, Flexible, and Concerted Action (World Bank 2016c, Government of Netherlands and Planning Commission 2014).
Table A1.1: Climate Change Impact on Various Economic Sectors
Source: Department of Environment.
Climate Change Aspects Vulnerable Areas ImpactsCyclones leading to higher storm surges Coastal areas Damage to coastal livelihood (fishing, farming, honey
collection)Damage to infrastructure (embankments, schools, cyclone shelters, industry, offices, water and sanitation facilities)Damage to coastal forestry and homestead vegetation
Heavier and erratic rainfall in monsoon seasons leading to higher river flows, river erosion, floods
Central part of Bangladesh Changing cropping patterns and crop yieldsIncreased damage to infrastructure
Lower and erratic rainfall in the dry season leading to droughts, potable water scarcity
Northwest part of Bangladesh
Insufficient water for fish cultivationNon-availability of water for irrigationReducing crop yield affecting food security
Sea level rise leading to submergence of low lying areas; salinity intrusion; affecting forest ecosystem
Coastal areas, Sundarbans forest; Haor areas
Soil and water salinity reducing crop and fisheries yieldMigration of people to urban areas
Temperature rising leading to outbreak of diseases
All parts of Bangladesh Malaria, dengue fever increasingCrop and livestock diseases increasingCrop yield losses due to pest manifestation
19
A Diagnosis of Critical Constraints to Growth
Chapter 2A Diagnosis of Critical Constraints to Growth
(ii) Compare these constraints to those faced in a meaningful set of benchmark countries.
We analyze all aspects that may hold back private investment: whether high cost of finance in a broad sense or whether investment is discouraged by low returns to economic activity. The methodology and its implementation is discussed in Box 2.1, while each of the sections in the chapter corresponds to a node on the growth diagnostics tree featured in the box.
2.2 Is High Cost of Finance a Constraint? 2.2.1 Trends and issues in the financial sector
Overall, finance is not found to be a critical constraint to growth in Bangladesh. The country’s financial system is broad and adequate for its stage of development and initiatives are in place to develop the capital and financial markets. Since 88% of economic activity is performed under informal arrangements and most of the population is self-employed, the issue of cost of finance is not a “price” issue, but one of access to finance. In this regard, Chapter 3 discusses major innovations and progress in microfinance.
2.1 Introduction
Bangladesh needs to establish a firm footing as a middle-income country if it is to sustain current growth rates. As it does so, its development issues and challenges will change and grow more complex. Indeed, paradoxically, the characteristics that saw growth soar may now become its greatest challenges. Declining fertility rates and dependency ratios, reliance on cheap labor, and rural–urban migration have led to major urbanization problems, with traffic snarls in the metropolitan areas undermining productivity and local governments facing greater demands to help foster safe productive communities. Most importantly, Bangladesh must raise the quality of education and skills for its workers if it is to compete in the global marketplace with higher-value-added products.
This chapter aims to diagnose the greatest current constraints to private sector investment in Bangladesh and sustained growth. Like many countries in developing Asia, the challenges are multifaceted. The chapter uses the Haussmann-Rodrick-Velasco methodology to accomplish the following:
(i) Identify the critical constraints: those that, if not tackled, will make it impossible for Bangladesh to meaningfully increase productivity; and
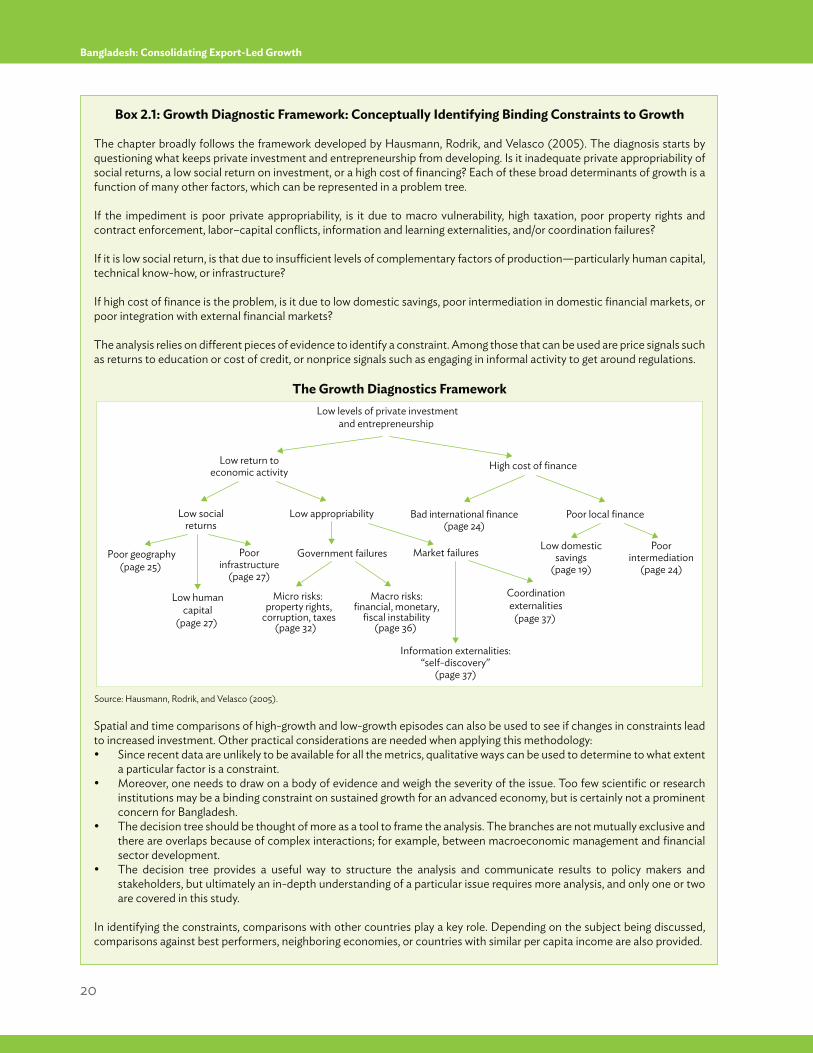
20
Bangladesh: Consolidating Export-Led Growth
Box 2.1: Growth Diagnostic Framework: Conceptually Identifying Binding Constraints to Growth
The chapter broadly follows the framework developed by Hausmann, Rodrik, and Velasco (2005). The diagnosis starts by questioning what keeps private investment and entrepreneurship from developing. Is it inadequate private appropriability of social returns, a low social return on investment, or a high cost of financing? Each of these broad determinants of growth is a function of many other factors, which can be represented in a problem tree.
If the impediment is poor private appropriability, is it due to macro vulnerability, high taxation, poor property rights and contract enforcement, labor–capital conflicts, information and learning externalities, and/or coordination failures?
If it is low social return, is that due to insufficient levels of complementary factors of production—particularly human capital, technical know-how, or infrastructure?
If high cost of finance is the problem, is it due to low domestic savings, poor intermediation in domestic financial markets, or poor integration with external financial markets?
The analysis relies on different pieces of evidence to identify a constraint. Among those that can be used are price signals such as returns to education or cost of credit, or nonprice signals such as engaging in informal activity to get around regulations.
The Growth Diagnostics Framework
Spatial and time comparisons of high-growth and low-growth episodes can also be used to see if changes in constraints lead to increased investment. Other practical considerations are needed when applying this methodology:
Since recent data are unlikely to be available for all the metrics, qualitative ways can be used to determine to what extent a particular factor is a constraint.
Moreover, one needs to draw on a body of evidence and weigh the severity of the issue. Too few scientific or research institutions may be a binding constraint on sustained growth for an advanced economy, but is certainly not a prominent concern for Bangladesh.
The decision tree should be thought of more as a tool to frame the analysis. The branches are not mutually exclusive and there are overlaps because of complex interactions; for example, between macroeconomic management and financial sector development.
The decision tree provides a useful way to structure the analysis and communicate results to policy makers and stakeholders, but ultimately an in-depth understanding of a particular issue requires more analysis, and only one or two are covered in this study.
In identifying the constraints, comparisons with other countries play a key role. Depending on the subject being discussed, comparisons against best performers, neighboring economies, or countries with similar per capita income are also provided.
Low appropriability
Market failures
Coordinationexternalities
(page 37)
Low return to economic activity High cost of finance
Low domestic savings
(page 19)
Poor intermediation
(page 24)
Poor local financeBad international finance(page 24)
Low socialreturns
Information externalities:“self-discovery”
(page 37)
Poor geography(page 25)
Low humancapital
(page 27)
Micro risks: property rights,
corruption, taxes(page 32)
Macro risks:financial, monetary,
fiscal instability(page 36)
Government failures
Low levels of private investmentand entrepreneurship
Poor infrastructure
(page 27)
Source: Hausmann, Rodrik, and Velasco (2005).
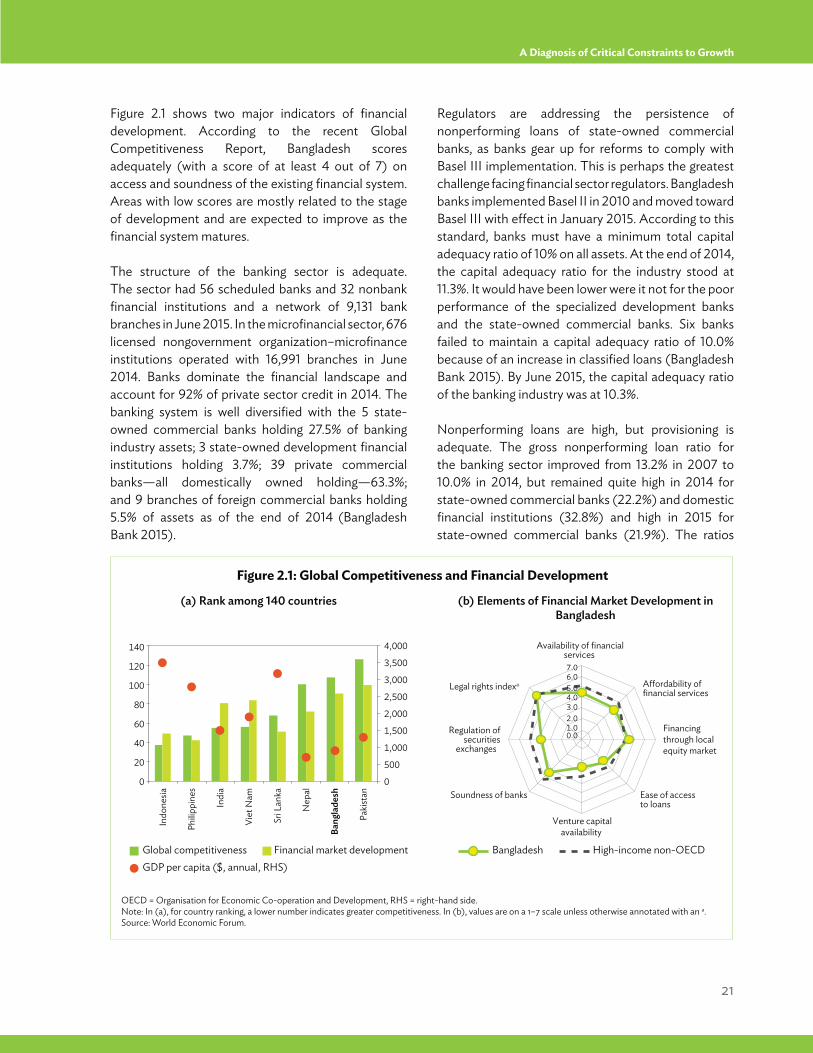
21
A Diagnosis of Critical Constraints to Growth
Figure 2.1 shows two major indicators of financial development. According to the recent Global Competitiveness Report, Bangladesh scores adequately (with a score of at least 4 out of 7) on access and soundness of the existing financial system. Areas with low scores are mostly related to the stage of development and are expected to improve as the financial system matures.
The structure of the banking sector is adequate. The sector had 56 scheduled banks and 32 nonbank financial institutions and a network of 9,131 bank branches in June 2015. In the microfinancial sector, 676 licensed nongovernment organization–microfinance institutions operated with 16,991 branches in June 2014. Banks dominate the financial landscape and account for 92% of private sector credit in 2014. The banking system is well diversified with the 5 state-owned commercial banks holding 27.5% of banking industry assets; 3 state-owned development financial institutions holding 3.7%; 39 private commercial banks—all domestically owned holding—63.3%; and 9 branches of foreign commercial banks holding 5.5% of assets as of the end of 2014 (Bangladesh Bank 2015).
Regulators are addressing the persistence of nonperforming loans of state-owned commercial banks, as banks gear up for reforms to comply with Basel III implementation. This is perhaps the greatest challenge facing financial sector regulators. Bangladesh banks implemented Basel II in 2010 and moved toward Basel III with effect in January 2015. According to this standard, banks must have a minimum total capital adequacy ratio of 10% on all assets. At the end of 2014, the capital adequacy ratio for the industry stood at 11.3%. It would have been lower were it not for the poor performance of the specialized development banks and the state-owned commercial banks. Six banks failed to maintain a capital adequacy ratio of 10.0% because of an increase in classified loans (Bangladesh Bank 2015). By June 2015, the capital adequacy ratio of the banking industry was at 10.3%.
Nonperforming loans are high, but provisioning is adequate. The gross nonperforming loan ratio for the banking sector improved from 13.2% in 2007 to 10.0% in 2014, but remained quite high in 2014 for state-owned commercial banks (22.2%) and domestic financial institutions (32.8%) and high in 2015 for state-owned commercial banks (21.9%). The ratios
Figure 2.1: Global Competitiveness and Financial Development
OECD = Organisation for Economic Co-operation and Development, RHS = right-hand side.Note: In (a), for country ranking, a lower number indicates greater competitiveness. In (b), values are on a 1–7 scale unless otherwise annotated with an a.Source: World Economic Forum.
Indo
nesia
Indi
a
Philip
pine
s
Viet
Nam
Sri L
anka
Bang
lade
sh
Nep
al
Paki
stan
Financial market developmentGlobal competitivenessGDP per capita ($, annual, RHS)
Bangladesh High-income non-OECD
Availability of financialservices
Affordability offinancial services
Financingthrough localequity market
Ease of access to loans
Venture capitalavailability
Soundness of banks
Regulation ofsecurities
exchanges
Legal rights indexa
7.06.05.04.03.02.01.00.0
0
140 4,000
3,500
3,000
2,500
2,000
1,500
1,000
500
0
100
80
60
40
20
120
(a) Rank among 140 countries (b) Elements of Financial Market Development in Bangladesh
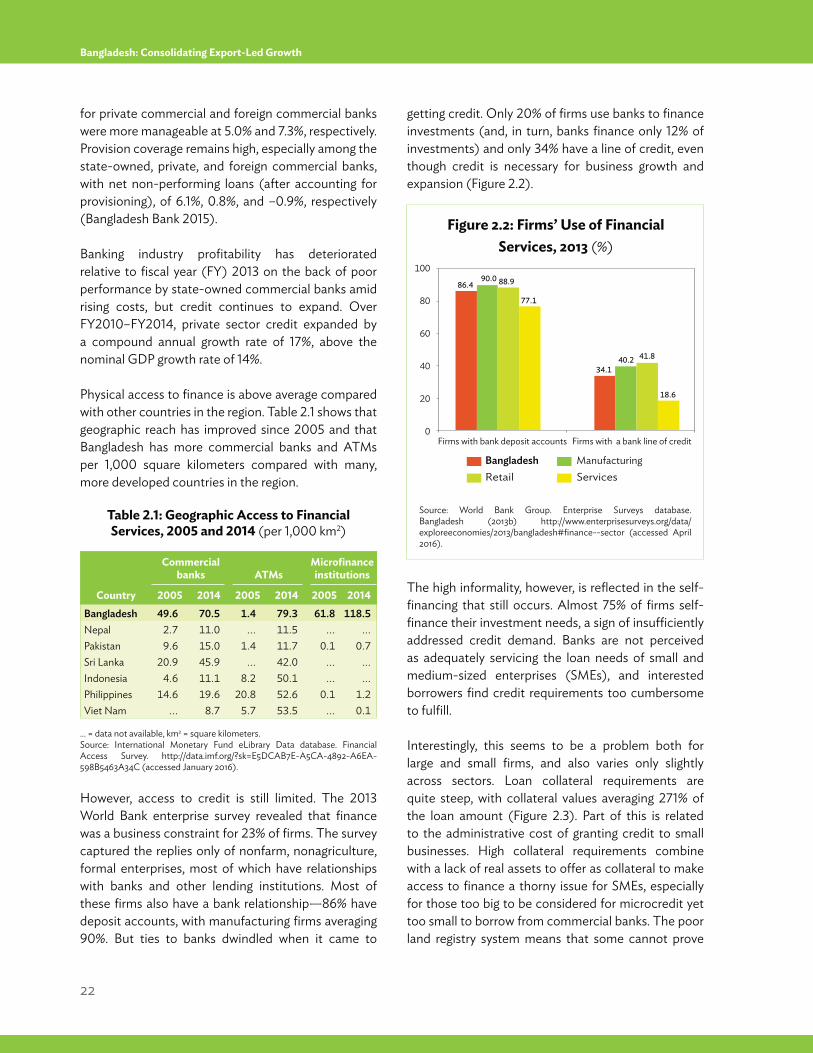
22
Bangladesh: Consolidating Export-Led Growth
for private commercial and foreign commercial banks were more manageable at 5.0% and 7.3%, respectively. Provision coverage remains high, especially among the state-owned, private, and foreign commercial banks, with net non-performing loans (after accounting for provisioning), of 6.1%, 0.8%, and –0.9%, respectively (Bangladesh Bank 2015).
Banking industry profitability has deteriorated relative to fiscal year (FY) 2013 on the back of poor performance by state-owned commercial banks amid rising costs, but credit continues to expand. Over FY2010–FY2014, private sector credit expanded by a compound annual growth rate of 17%, above the nominal GDP growth rate of 14%.
Physical access to finance is above average compared with other countries in the region. Table 2.1 shows that geographic reach has improved since 2005 and that Bangladesh has more commercial banks and ATMs per 1,000 square kilometers compared with many, more developed countries in the region.
However, access to credit is still limited. The 2013 World Bank enterprise survey revealed that finance was a business constraint for 23% of firms. The survey captured the replies only of nonfarm, nonagriculture, formal enterprises, most of which have relationships with banks and other lending institutions. Most of these firms also have a bank relationship—86% have deposit accounts, with manufacturing firms averaging 90%. But ties to banks dwindled when it came to
getting credit. Only 20% of firms use banks to finance investments (and, in turn, banks finance only 12% of investments) and only 34% have a line of credit, even though credit is necessary for business growth and expansion (Figure 2.2).
The high informality, however, is reflected in the self-financing that still occurs. Almost 75% of firms self-finance their investment needs, a sign of insufficiently addressed credit demand. Banks are not perceived as adequately servicing the loan needs of small and medium-sized enterprises (SMEs), and interested borrowers find credit requirements too cumbersome to fulfill.
Interestingly, this seems to be a problem both for large and small firms, and also varies only slightly across sectors. Loan collateral requirements are quite steep, with collateral values averaging 271% of the loan amount (Figure 2.3). Part of this is related to the administrative cost of granting credit to small businesses. High collateral requirements combine with a lack of real assets to offer as collateral to make access to finance a thorny issue for SMEs, especially for those too big to be considered for microcredit yet too small to borrow from commercial banks. The poor land registry system means that some cannot prove
86.4
34.1
90.0
40.2
88.9
41.8
77.1
18.6
0
20
40
60
80
100
Firms with bank deposit accounts Firms with a bank line of credit
ManufacturingRetail ServicesBangladesh
Figure 2.2: Firms’ Use of Financial Services, 2013 (%)
Source: World Bank Group. Enterprise Surveys database.Bangladesh (2013b) http://www.enterprisesurveys.org/data/exploreeconomies/2013/bangladesh#finance--sector (accessed April 2016).
Table 2.1: Geographic Access to Financial Services, 2005 and 2014 (per 1,000 km2)
… = data not available, km2 = square kilometers.Source: International Monetary Fund eLibrary Data database. Financial Access Survey. http://data.imf.org/?sk=E5DCAB7E-A5CA-4892-A6EA-598B5463A34C (accessed January 2016).
Country
Commercial banks ATMs
Microfinance institutions
2005 2014 2005 2014 2005 2014Bangladesh 49.6 70.5 1.4 79.3 61.8 118.5Nepal 2.7 11.0 ... 11.5 ... ...Pakistan 9.6 15.0 1.4 11.7 0.1 0.7Sri Lanka 20.9 45.9 ... 42.0 ... ...Indonesia 4.6 11.1 8.2 50.1 ... ...Philippines 14.6 19.6 20.8 52.6 0.1 1.2Viet Nam ... 8.7 5.7 53.5 ... 0.1
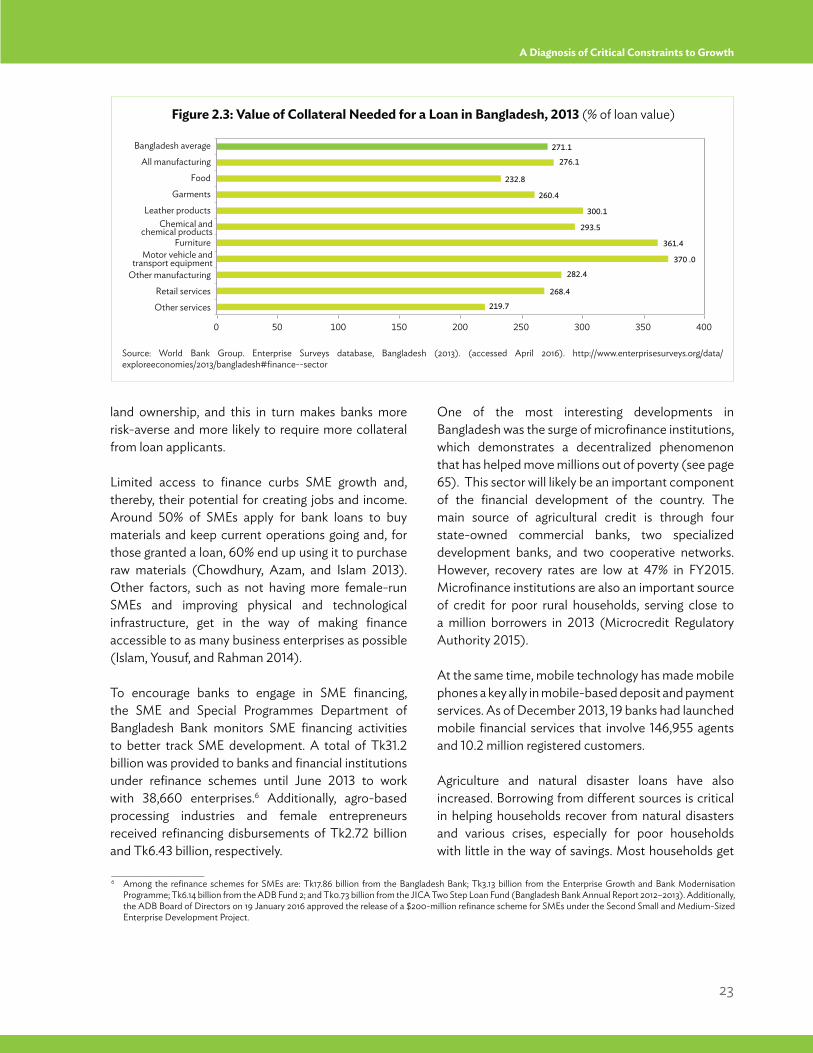
23
A Diagnosis of Critical Constraints to Growth
land ownership, and this in turn makes banks more risk-averse and more likely to require more collateral from loan applicants.
Limited access to finance curbs SME growth and, thereby, their potential for creating jobs and income. Around 50% of SMEs apply for bank loans to buy materials and keep current operations going and, for those granted a loan, 60% end up using it to purchase raw materials (Chowdhury, Azam, and Islam 2013).
Other factors, such as not having more female-run SMEs and improving physical and technological infrastructure, get in the way of making finance accessible to as many business enterprises as possible (Islam, Yousuf, and Rahman 2014).
To encourage banks to engage in SME financing, the SME and Special Programmes Department of Bangladesh Bank monitors SME financing activities to better track SME development. A total of Tk31.2 billion was provided to banks and financial institutions under refinance schemes until June 2013 to work with 38,660 enterprises.6 Additionally, agro-based processing industries and female entrepreneurs received refinancing disbursements of Tk2.72 billion and Tk6.43 billion, respectively.
219.7
268.4
282.4
370 .0
361.4
293.5
300.1
260.4
232.8
276.1
271.1
0 50 100 150 200 250 300 350 400
Other services
Retail services
Other manufacturing
Motor vehicle andtransport equipment
Furniture
Chemical andchemical products
Leather products
Garments
Food
All manufacturing
Bangladesh average
One of the most interesting developments in Bangladesh was the surge of microfinance institutions, which demonstrates a decentralized phenomenon that has helped move millions out of poverty (see page 65). This sector will likely be an important component of the financial development of the country. The main source of agricultural credit is through four state-owned commercial banks, two specialized development banks, and two cooperative networks. However, recovery rates are low at 47% in FY2015. Microfinance institutions are also an important source of credit for poor rural households, serving close to a million borrowers in 2013 (Microcredit Regulatory Authority 2015).
At the same time, mobile technology has made mobile phones a key ally in mobile-based deposit and payment services. As of December 2013, 19 banks had launched mobile financial services that involve 146,955 agents and 10.2 million registered customers.
Agriculture and natural disaster loans have also increased. Borrowing from different sources is critical in helping households recover from natural disasters and various crises, especially for poor households with little in the way of savings. Most households get
Figure 2.3: Value of Collateral Needed for a Loan in Bangladesh, 2013 (% of loan value)
Source: World Bank Group. Enterprise Surveys database, Bangladesh (2013). (accessed April 2016). http://www.enterprisesurveys.org/data/exploreeconomies/2013/bangladesh#finance--sector
____________________6 Among the refinance schemes for SMEs are: Tk17.86 billion from the Bangladesh Bank; Tk3.13 billion from the Enterprise Growth and Bank Modernisation
Programme; Tk6.14 billion from the ADB Fund 2; and Tk0.73 billion from the JICA Two Step Loan Fund (Bangladesh Bank Annual Report 2012–2013). Additionally, the ADB Board of Directors on 19 January 2016 approved the release of a $200-million refinance scheme for SMEs under the Second Small and Medium-Sized Enterprise Development Project.
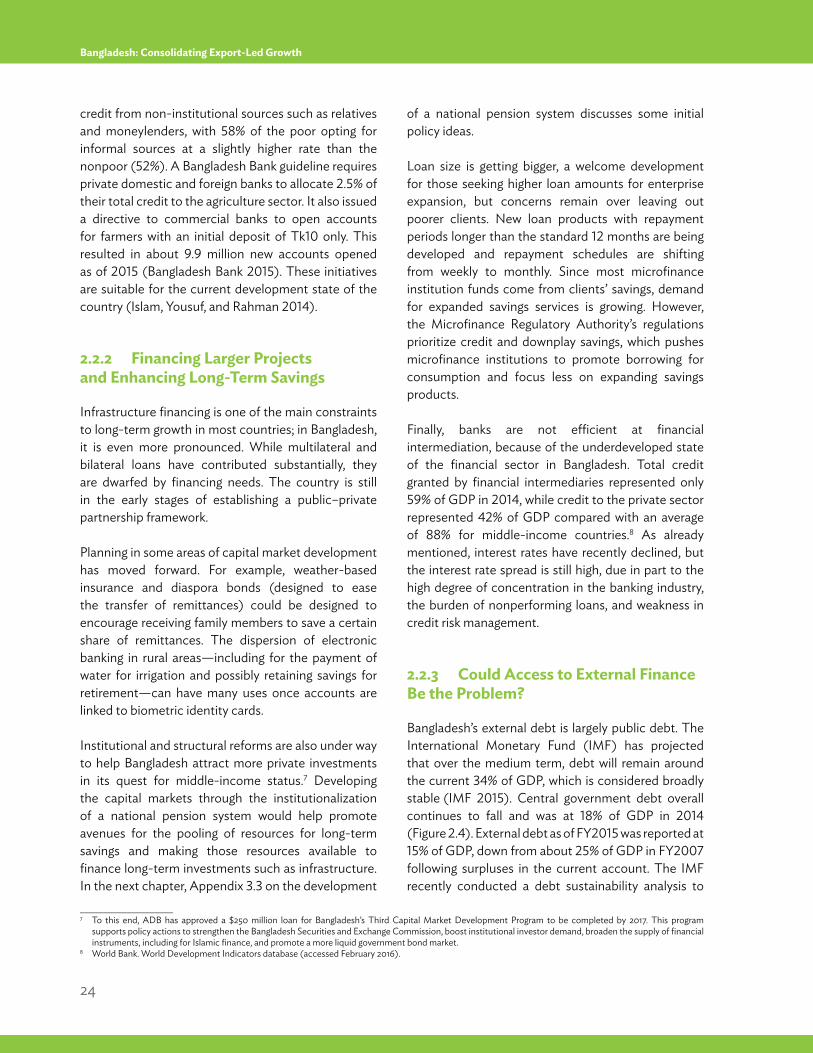
24
Bangladesh: Consolidating Export-Led Growth
credit from non-institutional sources such as relatives and moneylenders, with 58% of the poor opting for informal sources at a slightly higher rate than the nonpoor (52%). A Bangladesh Bank guideline requires private domestic and foreign banks to allocate 2.5% of their total credit to the agriculture sector. It also issued a directive to commercial banks to open accounts for farmers with an initial deposit of Tk10 only. This resulted in about 9.9 million new accounts opened as of 2015 (Bangladesh Bank 2015). These initiatives are suitable for the current development state of the country (Islam, Yousuf, and Rahman 2014).
2.2.2 Financing Larger Projects and Enhancing Long-Term Savings
Infrastructure financing is one of the main constraints to long-term growth in most countries; in Bangladesh, it is even more pronounced. While multilateral and bilateral loans have contributed substantially, they are dwarfed by financing needs. The country is still in the early stages of establishing a public–private partnership framework.
Planning in some areas of capital market development has moved forward. For example, weather-based insurance and diaspora bonds (designed to ease the transfer of remittances) could be designed to encourage receiving family members to save a certain share of remittances. The dispersion of electronic banking in rural areas—including for the payment of water for irrigation and possibly retaining savings for retirement—can have many uses once accounts are linked to biometric identity cards.
Institutional and structural reforms are also under way to help Bangladesh attract more private investments in its quest for middle-income status.7 Developing the capital markets through the institutionalization of a national pension system would help promote avenues for the pooling of resources for long-term savings and making those resources available to finance long-term investments such as infrastructure. In the next chapter, Appendix 3.3 on the development
of a national pension system discusses some initial policy ideas.
Loan size is getting bigger, a welcome development for those seeking higher loan amounts for enterprise expansion, but concerns remain over leaving out poorer clients. New loan products with repayment periods longer than the standard 12 months are being developed and repayment schedules are shifting from weekly to monthly. Since most microfinance institution funds come from clients’ savings, demand for expanded savings services is growing. However, the Microfinance Regulatory Authority’s regulations prioritize credit and downplay savings, which pushes microfinance institutions to promote borrowing for consumption and focus less on expanding savings products.
Finally, banks are not efficient at financial intermediation, because of the underdeveloped state of the financial sector in Bangladesh. Total credit granted by financial intermediaries represented only 59% of GDP in 2014, while credit to the private sector represented 42% of GDP compared with an average of 88% for middle-income countries.8 As already mentioned, interest rates have recently declined, but the interest rate spread is still high, due in part to the high degree of concentration in the banking industry, the burden of nonperforming loans, and weakness in credit risk management.
2.2.3 Could Access to External Finance Be the Problem?
Bangladesh’s external debt is largely public debt. The International Monetary Fund (IMF) has projected that over the medium term, debt will remain around the current 34% of GDP, which is considered broadly stable (IMF 2015). Central government debt overall continues to fall and was at 18% of GDP in 2014 (Figure 2.4). External debt as of FY2015 was reported at 15% of GDP, down from about 25% of GDP in FY2007 following surpluses in the current account. The IMF recently conducted a debt sustainability analysis to
____________________7 To this end, ADB has approved a $250 million loan for Bangladesh’s Third Capital Market Development Program to be completed by 2017. This program
supports policy actions to strengthen the Bangladesh Securities and Exchange Commission, boost institutional investor demand, broaden the supply of financial instruments, including for Islamic finance, and promote a more liquid government bond market.
8 World Bank. World Development Indicators database (accessed February 2016).
25
A Diagnosis of Critical Constraints to Growth
Bangladesh is constrained because either the private investor cannot accrue the returns to that investment, or the social returns are low because of poor geography or inadequate human and physical capital. We discuss each of these possibilities in turn.
2.3.1 Are Poor Geography, Agricultural Land Use, and Water Use Constraints?
Bangladesh experiences natural disasters every year from floods, tropical cyclones, storm surges, and drought; this vulnerability to hazards reflects its location, land characteristics, numerous rivers, and monsoon climate. The country has a vast network of rivers and channels, but also lies in the path of cyclones from the Bay of Bengal, making riverbank erosion prevalent (DMB 2010). In a normal year, 25% of the country is flooded. The direct annual costs of natural disasters over 2001–2010 are estimated to have been between 0.5% and 1% of GDP. Natural disasters destroy an average of 6.4% of national crop production every year and can destroy up to 23% of the national paddy and wheat production in a year with major disasters (World Bank 2015b).
Bangladesh is located in an economically growing part of Asia, with access to the sea and a potential deep-water port to service international trade. However, large low-lying areas susceptible to flooding threaten economic activity in those areas (including agriculture), which climate change will likely make worse. Indeed, the country is considered one of the most climate-vulnerable in the world given its high population density and low-lying delta. On the positive side, the large set of natural inland waterways has given millions of rural inhabitants a means of transportation, amid otherwise few secondary roads, and the wet areas are generally more suitable for rice production.
Inland water transport has advantages over other forms of transport in Bangladesh. It remains the cheapest form, with cargo tariffs below 1 taka per ton-kilometer (km). It has also been proven to be safer to use than roads. Inland water transport has lower diesel consumption, saving an estimated 58.5 million liters of diesel and 155,000 tons of carbon dioxide emissions a year. Converting all inland water transport to road transport would cost around Tk2.1 billion–
2035 for public and publicly guaranteed debt under current trends and found the debt to be significantly below problematic thresholds, even under extreme assumptions of the values of relevant variables. Moreover, the participation of donors and multilateral agencies in the development of Bangladesh, including through grants, has likely reduced the cost of external finance.
Likewise, indicators of private financial flows do not indicate an external financing problem in the least. Moody’s Investor Service rates Bangladesh Ba3 (foreign currency) and both Standard and Poor’s and Fitch Ratings rate it BB–. External transfers (remittances and grants not including capital grants) were equivalent to about 9% of GDP in FY2014. Of that, 8% of GDP corresponded to remittances (about 10 times the size of foreign direct investment). The growth of remittances has been stable and is expected to remain around 6% on average, despite some fluctuations related to oil prices.
2.3 Are Low Returns to Economic Activity a Critical Constraint?Section 2.2 finds that the availability of loanable funds for investment is not a prominent constraint on growth, but it is possible that private investment in
Figure 2.4: Total Public Debt, 2005–2015 (% of GDP)
Source: Estimates based on World Bank. World Development Indicatorsdatabase; World Bank. International Debt Statistics database; International Monetary Fund. World Economic Outlook October 2015 database (all accessed January 2016).
0
10
20
30
40
50
2005 2007 2009 2011 2013 2015
Domestic debtExternal debt
26
Bangladesh: Consolidating Export-Led Growth
Tk3.1 billion while the cost of dredging to continue inland water cargo transport would be around Tk0.6 billion only. However, despite huge efforts to dredge some of the waterways, shallow depths and slow speeds limit transport capacity. Most waterways are also not navigable at night and during monsoon season. In rural communities, waterways remain an important mode of transport. But its importance may soon fade in light of growing industrialization and, eventually, the design and operation of a more reliable logistics chain.
The country’s many low-lying areas are vulnerable to environmental and health consequences and require climate adaptation strategies to address. One of these strategies is to research variants of rice that can better withstand floods. Flooding can contaminate water sources and latrines, while extreme floods can even destroy water and sanitation infrastructure, such as in October 2007 when 73% of latrines in eight districts were damaged during the flood (Ahmed 2008).
Bangladesh’s supply of freshwater is highly dependent on its upstream neighbors in India, with 92.5% of the country’s surface water provided by out-of-country sources (Kolas et al. 2013). Construction of the Farakka Barrage 11 miles upstream of the Bangladesh border, which India built to increase the navigability of the port of Kolkata during the dry season, has affected the supply of water coming into the country. This led to water shortages in Bangladesh until a treaty was reached in 1996 outlining the allocation of the Ganges River flow during the dry season between India and Bangladesh.
Water remains particularly crucial for economic activity in Bangladesh. Out of its yearly freshwater resources, agriculture uses 88%, industry 2%, and domestic sources 10%.9 Although agriculture contributes over 20% of the country’s GDP and almost half of the labor force, drought and floods regularly contribute to the loss of agricultural production.
The smaller size of farms has reduced farm productivity and is unlikely to support livelihoods. Progressively
smaller farms also discourage farmers from innovating and trying new technology, which reduces agricultural productivity (Rahman and Rahman 2008). In addition, the loss of arable land is making it difficult to maintain food safety and quality. It is also more difficult to expand irrigation and farm mechanization while developing resistance to climate change impacts (Planning Commission 2015a). Moreover, agricultural land is lost at the rate of about 1% per year due to diversion of land to other uses, urban settlements, and river erosion (Ministry of Planning 2013). Yearly flooding and cyclones aggravate land erosion. Although land laws and policies are in place to allot such land to the poor and landless, their interests are rarely served. Environmental factors also contribute to land degradation through increased salinity, soil contamination, deforestation, water pollution, falling water tables, and drainage congestion.
Rapid deterioration of infrastructure due to natural disasters and slow replacement of infrastructure add to the perilous state of agriculture. And in the last decade, agriculture contributed only 13.6% of total GDP growth. More than just damaging crops and harvests, natural disasters seriously diminish the productivity and reliability of agricultural activities. Perennially deficient agriculture infrastructure slashes the potential of the agriculture sector as an investment attraction. Through 2010 and 2011, new agriculture investments totaled $66.3 million, a fraction of the $50.3 billion in industry and $1.4 billion in services.
Households cope with natural disasters by borrowing from different sources, selling land and assets, and using up savings. During extended drought or loss of livelihood, people reduce food intake and expenditure on other necessities, migrate to other areas for work, borrow at high rates of interest, and receive support from government agencies. The yearly occurrence of drought and other natural disasters not only reduces wealth, but also the opportunities available to the poor. Poor people with no savings or assets are very vulnerable to natural disasters.
____________________9 World Bank. World Development Indicators database 2011 data (accessed January 2016).
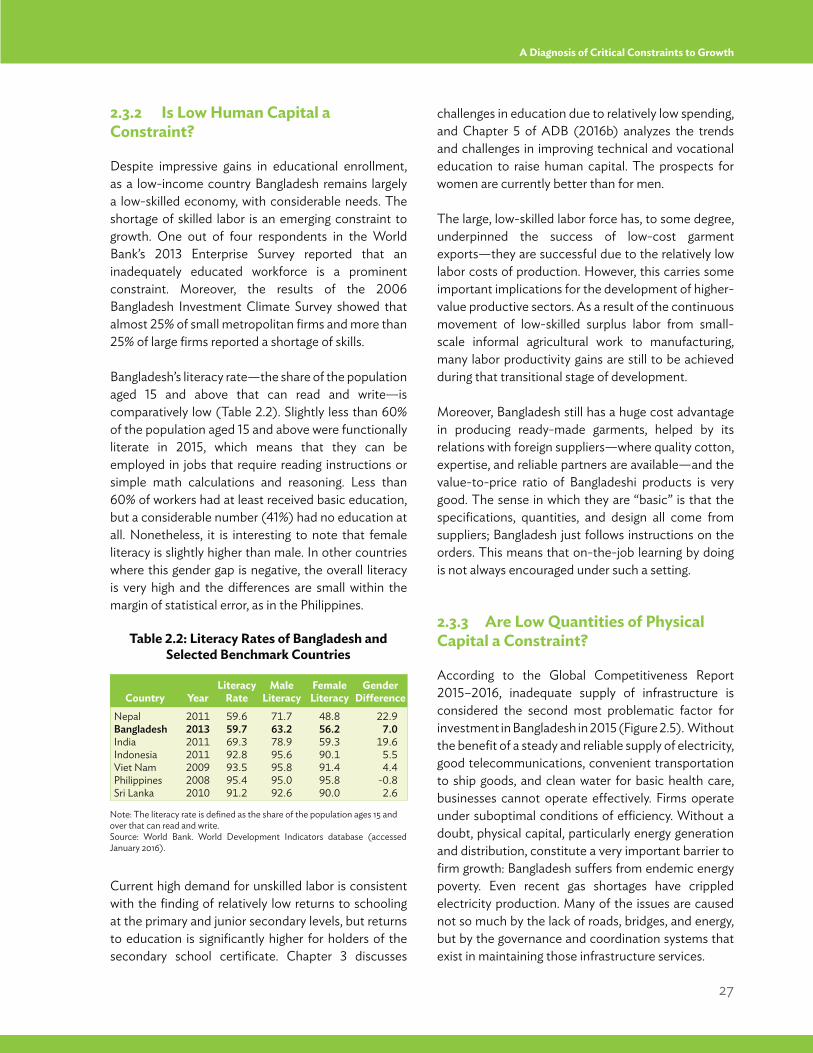
27
A Diagnosis of Critical Constraints to Growth
2.3.2 Is Low Human Capital a Constraint?
Despite impressive gains in educational enrollment, as a low-income country Bangladesh remains largely a low-skilled economy, with considerable needs. The shortage of skilled labor is an emerging constraint to growth. One out of four respondents in the World Bank’s 2013 Enterprise Survey reported that an inadequately educated workforce is a prominent constraint. Moreover, the results of the 2006 Bangladesh Investment Climate Survey showed that almost 25% of small metropolitan firms and more than 25% of large firms reported a shortage of skills.
Bangladesh’s literacy rate—the share of the population aged 15 and above that can read and write—is comparatively low (Table 2.2). Slightly less than 60% of the population aged 15 and above were functionally literate in 2015, which means that they can be employed in jobs that require reading instructions or simple math calculations and reasoning. Less than 60% of workers had at least received basic education, but a considerable number (41%) had no education at all. Nonetheless, it is interesting to note that female literacy is slightly higher than male. In other countries where this gender gap is negative, the overall literacy is very high and the differences are small within the margin of statistical error, as in the Philippines.
Current high demand for unskilled labor is consistent with the finding of relatively low returns to schooling at the primary and junior secondary levels, but returns to education is significantly higher for holders of the secondary school certificate. Chapter 3 discusses
challenges in education due to relatively low spending, and Chapter 5 of ADB (2016b) analyzes the trends and challenges in improving technical and vocational education to raise human capital. The prospects for women are currently better than for men.
The large, low-skilled labor force has, to some degree, underpinned the success of low-cost garment exports—they are successful due to the relatively low labor costs of production. However, this carries some important implications for the development of higher-value productive sectors. As a result of the continuous movement of low-skilled surplus labor from small-scale informal agricultural work to manufacturing, many labor productivity gains are still to be achieved during that transitional stage of development.
Moreover, Bangladesh still has a huge cost advantage in producing ready-made garments, helped by its relations with foreign suppliers—where quality cotton, expertise, and reliable partners are available—and the value-to-price ratio of Bangladeshi products is very good. The sense in which they are “basic” is that the specifications, quantities, and design all come from suppliers; Bangladesh just follows instructions on the orders. This means that on-the-job learning by doing is not always encouraged under such a setting.
2.3.3 Are Low Quantities of Physical Capital a Constraint?
According to the Global Competitiveness Report 2015–2016, inadequate supply of infrastructure is considered the second most problematic factor for investment in Bangladesh in 2015 (Figure 2.5). Without the benefit of a steady and reliable supply of electricity, good telecommunications, convenient transportation to ship goods, and clean water for basic health care, businesses cannot operate effectively. Firms operate under suboptimal conditions of efficiency. Without a doubt, physical capital, particularly energy generation and distribution, constitute a very important barrier to firm growth: Bangladesh suffers from endemic energy poverty. Even recent gas shortages have crippled electricity production. Many of the issues are caused not so much by the lack of roads, bridges, and energy, but by the governance and coordination systems that exist in maintaining those infrastructure services.
Table 2.2: Literacy Rates of Bangladesh and Selected Benchmark Countries
Note: The literacy rate is defined as the share of the population ages 15 and over that can read and write. Source: World Bank. World Development Indicators database (accessed January 2016).
Country YearLiteracy
RateMale
LiteracyFemale Literacy
Gender Difference
NepalBangladeshIndiaIndonesiaViet NamPhilippinesSri Lanka
2011201320112011200920082010
59.659.769.392.893.595.491.2
71.763.278.995.695.895.092.6
48.856.259.390.191.495.890.0
22.97.0
19.65.54.4
-0.82.6
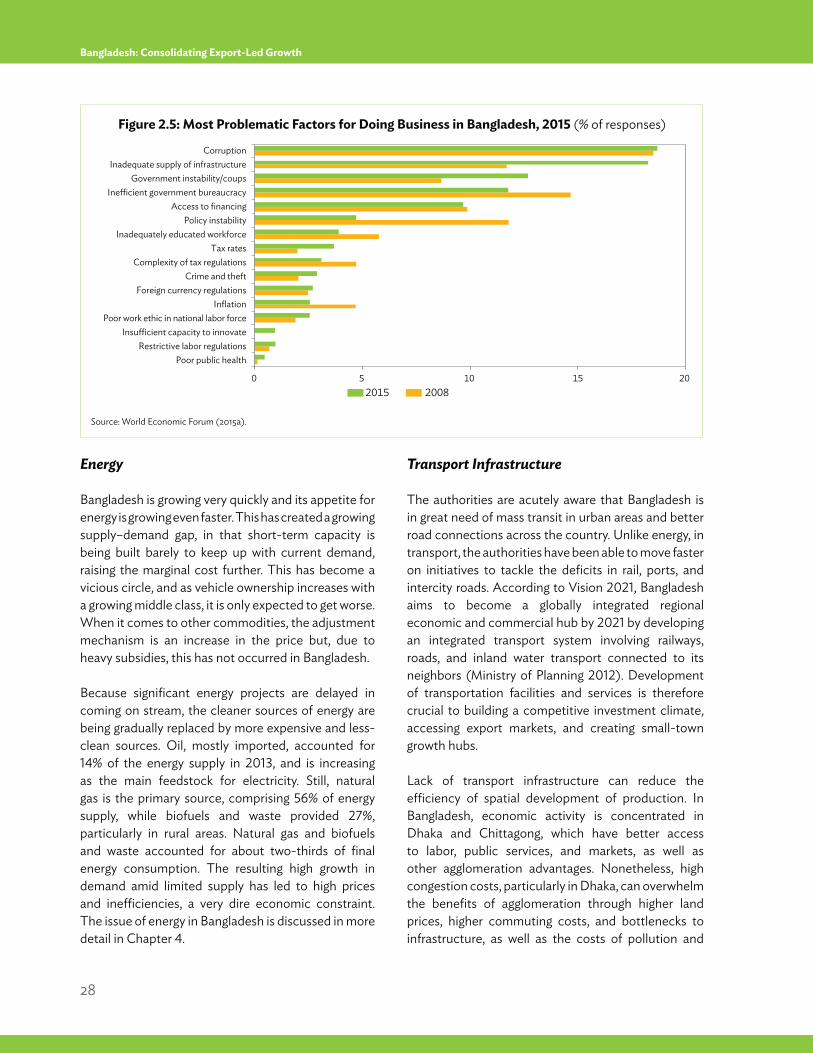
28
Bangladesh: Consolidating Export-Led Growth
Energy
Bangladesh is growing very quickly and its appetite for energy is growing even faster. This has created a growing supply–demand gap, in that short-term capacity is being built barely to keep up with current demand, raising the marginal cost further. This has become a vicious circle, and as vehicle ownership increases with a growing middle class, it is only expected to get worse. When it comes to other commodities, the adjustment mechanism is an increase in the price but, due to heavy subsidies, this has not occurred in Bangladesh.
Because significant energy projects are delayed in coming on stream, the cleaner sources of energy are being gradually replaced by more expensive and less-clean sources. Oil, mostly imported, accounted for 14% of the energy supply in 2013, and is increasing as the main feedstock for electricity. Still, natural gas is the primary source, comprising 56% of energy supply, while biofuels and waste provided 27%, particularly in rural areas. Natural gas and biofuels and waste accounted for about two-thirds of final energy consumption. The resulting high growth in demand amid limited supply has led to high prices and inefficiencies, a very dire economic constraint. The issue of energy in Bangladesh is discussed in more detail in Chapter 4.
Transport Infrastructure
The authorities are acutely aware that Bangladesh is in great need of mass transit in urban areas and better road connections across the country. Unlike energy, in transport, the authorities have been able to move faster on initiatives to tackle the deficits in rail, ports, and intercity roads. According to Vision 2021, Bangladesh aims to become a globally integrated regional economic and commercial hub by 2021 by developing an integrated transport system involving railways, roads, and inland water transport connected to its neighbors (Ministry of Planning 2012). Development of transportation facilities and services is therefore crucial to building a competitive investment climate, accessing export markets, and creating small-town growth hubs.
Lack of transport infrastructure can reduce the efficiency of spatial development of production. In Bangladesh, economic activity is concentrated in Dhaka and Chittagong, which have better access to labor, public services, and markets, as well as other agglomeration advantages. Nonetheless, high congestion costs, particularly in Dhaka, can overwhelm the benefits of agglomeration through higher land prices, higher commuting costs, and bottlenecks to infrastructure, as well as the costs of pollution and
Figure 2.5: Most Problematic Factors for Doing Business in Bangladesh, 2015 (% of responses)
Source: World Economic Forum (2015a).
0 5 10 15 20
Poor public health Restrictive labor regulations
Insufficient capacity to innovate Poor work ethic in national labor force
Inflation Foreign currency regulations
Crime and theft Complexity of tax regulations
Tax rates Inadequately educated workforce
Policy instability Access to financing
Inefficient government bureaucracy Government instability/coups
Inadequate supply of infrastructure Corruption
20082015
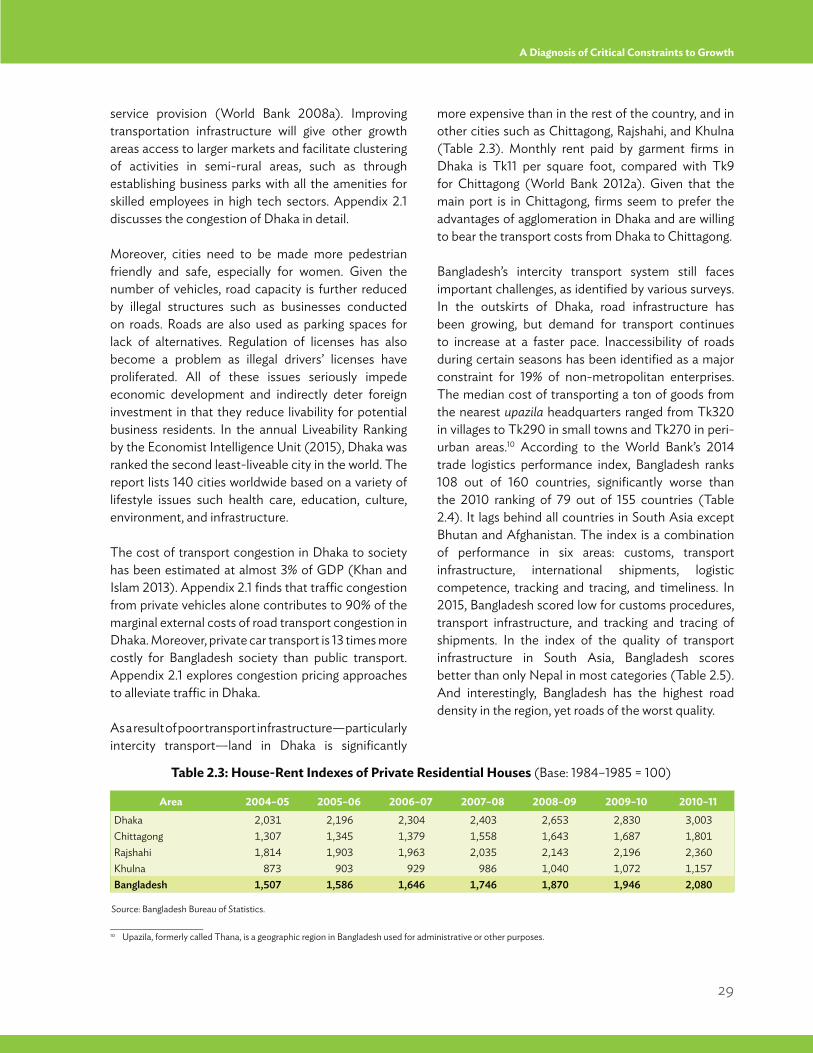
29
A Diagnosis of Critical Constraints to Growth
service provision (World Bank 2008a). Improving transportation infrastructure will give other growth areas access to larger markets and facilitate clustering of activities in semi-rural areas, such as through establishing business parks with all the amenities for skilled employees in high tech sectors. Appendix 2.1 discusses the congestion of Dhaka in detail.
Moreover, cities need to be made more pedestrian friendly and safe, especially for women. Given the number of vehicles, road capacity is further reduced by illegal structures such as businesses conducted on roads. Roads are also used as parking spaces for lack of alternatives. Regulation of licenses has also become a problem as illegal drivers’ licenses have proliferated. All of these issues seriously impede economic development and indirectly deter foreign investment in that they reduce livability for potential business residents. In the annual Liveability Ranking by the Economist Intelligence Unit (2015), Dhaka was ranked the second least-liveable city in the world. The report lists 140 cities worldwide based on a variety of lifestyle issues such health care, education, culture, environment, and infrastructure.
The cost of transport congestion in Dhaka to society has been estimated at almost 3% of GDP (Khan and Islam 2013). Appendix 2.1 finds that traffic congestion from private vehicles alone contributes to 90% of the marginal external costs of road transport congestion in Dhaka. Moreover, private car transport is 13 times more costly for Bangladesh society than public transport. Appendix 2.1 explores congestion pricing approaches to alleviate traffic in Dhaka.
As a result of poor transport infrastructure—particularly intercity transport—land in Dhaka is significantly
Table 2.3: House-Rent Indexes of Private Residential Houses (Base: 1984–1985 = 100)
Source: Bangladesh Bureau of Statistics.
____________________10 Upazila, formerly called Thana, is a geographic region in Bangladesh used for administrative or other purposes.
Area 2004–05 2005–06 2006–07 2007–08 2008–09 2009–10 2010–11Dhaka 2,031 2,196 2,304 2,403 2,653 2,830 3,003Chittagong 1,307 1,345 1,379 1,558 1,643 1,687 1,801Rajshahi 1,814 1,903 1,963 2,035 2,143 2,196 2,360Khulna 873 903 929 986 1,040 1,072 1,157Bangladesh 1,507 1,586 1,646 1,746 1,870 1,946 2,080
more expensive than in the rest of the country, and in other cities such as Chittagong, Rajshahi, and Khulna (Table 2.3). Monthly rent paid by garment firms in Dhaka is Tk11 per square foot, compared with Tk9 for Chittagong (World Bank 2012a). Given that the main port is in Chittagong, firms seem to prefer the advantages of agglomeration in Dhaka and are willing to bear the transport costs from Dhaka to Chittagong.
Bangladesh’s intercity transport system still faces important challenges, as identified by various surveys. In the outskirts of Dhaka, road infrastructure has been growing, but demand for transport continues to increase at a faster pace. Inaccessibility of roads during certain seasons has been identified as a major constraint for 19% of non-metropolitan enterprises. The median cost of transporting a ton of goods from the nearest upazila headquarters ranged from Tk320 in villages to Tk290 in small towns and Tk270 in peri-urban areas.10 According to the World Bank’s 2014 trade logistics performance index, Bangladesh ranks 108 out of 160 countries, significantly worse than the 2010 ranking of 79 out of 155 countries (Table 2.4). It lags behind all countries in South Asia except Bhutan and Afghanistan. The index is a combination of performance in six areas: customs, transport infrastructure, international shipments, logistic competence, tracking and tracing, and timeliness. In 2015, Bangladesh scored low for customs procedures, transport infrastructure, and tracking and tracing of shipments. In the index of the quality of transport infrastructure in South Asia, Bangladesh scores better than only Nepal in most categories (Table 2.5). And interestingly, Bangladesh has the highest road density in the region, yet roads of the worst quality.
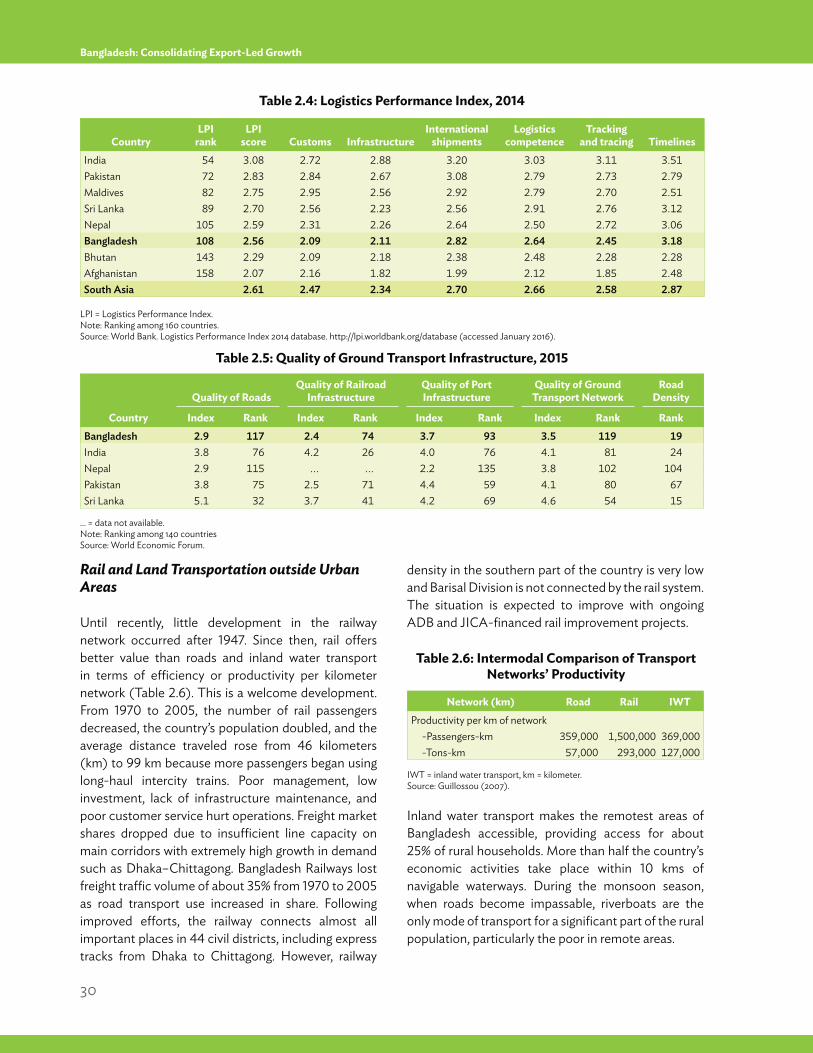
30
Bangladesh: Consolidating Export-Led Growth
Rail and Land Transportation outside Urban Areas
Until recently, little development in the railway network occurred after 1947. Since then, rail offers better value than roads and inland water transport in terms of efficiency or productivity per kilometer network (Table 2.6). This is a welcome development.From 1970 to 2005, the number of rail passengers decreased, the country’s population doubled, and the average distance traveled rose from 46 kilometers (km) to 99 km because more passengers began using long-haul intercity trains. Poor management, low investment, lack of infrastructure maintenance, and poor customer service hurt operations. Freight market shares dropped due to insufficient line capacity on main corridors with extremely high growth in demand such as Dhaka–Chittagong. Bangladesh Railways lost freight traffic volume of about 35% from 1970 to 2005 as road transport use increased in share. Following improved efforts, the railway connects almost all important places in 44 civil districts, including express tracks from Dhaka to Chittagong. However, railway
density in the southern part of the country is very low and Barisal Division is not connected by the rail system. The situation is expected to improve with ongoing ADB and JICA-financed rail improvement projects.
Inland water transport makes the remotest areas of Bangladesh accessible, providing access for about 25% of rural households. More than half the country’s economic activities take place within 10 kms of navigable waterways. During the monsoon season, when roads become impassable, riverboats are the only mode of transport for a significant part of the rural population, particularly the poor in remote areas.
Table 2.4: Logistics Performance Index, 2014
Table 2.6: Intermodal Comparison of Transport Networks’ Productivity
Table 2.5: Quality of Ground Transport Infrastructure, 2015
LPI = Logistics Performance Index.Note: Ranking among 160 countries.Source: World Bank. Logistics Performance Index 2014 database. http://lpi.worldbank.org/database (accessed January 2016).
IWT = inland water transport, km = kilometer.Source: Guillossou (2007).
… = data not available.Note: Ranking among 140 countriesSource: World Economic Forum.
CountryLPI
rankLPI
score Customs InfrastructureInternational
shipmentsLogistics
competenceTracking
and tracing TimelinesIndia 54 3.08 2.72 2.88 3.20 3.03 3.11 3.51Pakistan 72 2.83 2.84 2.67 3.08 2.79 2.73 2.79Maldives 82 2.75 2.95 2.56 2.92 2.79 2.70 2.51Sri Lanka 89 2.70 2.56 2.23 2.56 2.91 2.76 3.12Nepal 105 2.59 2.31 2.26 2.64 2.50 2.72 3.06Bangladesh 108 2.56 2.09 2.11 2.82 2.64 2.45 3.18Bhutan 143 2.29 2.09 2.18 2.38 2.48 2.28 2.28Afghanistan 158 2.07 2.16 1.82 1.99 2.12 1.85 2.48South Asia 2.61 2.47 2.34 2.70 2.66 2.58 2.87
Country
Quality of RoadsQuality of Railroad
InfrastructureQuality of PortInfrastructure
Quality of Ground Transport Network
Road Density
Index Rank Index Rank Index Rank Index Rank RankBangladesh 2.9 117 2.4 74 3.7 93 3.5 119 19India 3.8 76 4.2 26 4.0 76 4.1 81 24Nepal 2.9 115 ... ... 2.2 135 3.8 102 104Pakistan 3.8 75 2.5 71 4.4 59 4.1 80 67Sri Lanka 5.1 32 3.7 41 4.2 69 4.6 54 15
Network (km) Road Rail IWTProductivity per km of network -Passengers-km 359,000 1,500,000 369,000 -Tons-km 57,000 293,000 127,000
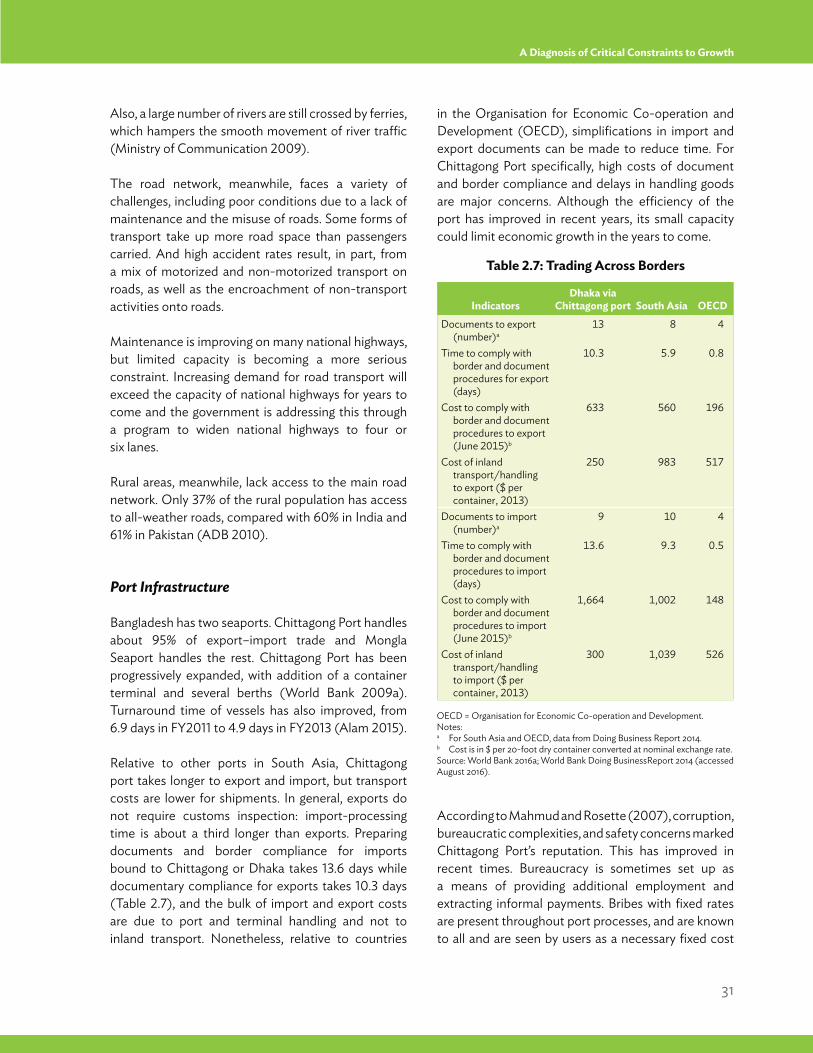
31
A Diagnosis of Critical Constraints to Growth
Also, a large number of rivers are still crossed by ferries, which hampers the smooth movement of river traffic (Ministry of Communication 2009).
The road network, meanwhile, faces a variety of challenges, including poor conditions due to a lack of maintenance and the misuse of roads. Some forms of transport take up more road space than passengers carried. And high accident rates result, in part, from a mix of motorized and non-motorized transport on roads, as well as the encroachment of non-transport activities onto roads.
Maintenance is improving on many national highways, but limited capacity is becoming a more serious constraint. Increasing demand for road transport will exceed the capacity of national highways for years to come and the government is addressing this through a program to widen national highways to four or six lanes.
Rural areas, meanwhile, lack access to the main road network. Only 37% of the rural population has access to all-weather roads, compared with 60% in India and 61% in Pakistan (ADB 2010).
Port Infrastructure
Bangladesh has two seaports. Chittagong Port handles about 95% of export–import trade and Mongla Seaport handles the rest. Chittagong Port has been progressively expanded, with addition of a container terminal and several berths (World Bank 2009a). Turnaround time of vessels has also improved, from 6.9 days in FY2011 to 4.9 days in FY2013 (Alam 2015).
Relative to other ports in South Asia, Chittagong port takes longer to export and import, but transport costs are lower for shipments. In general, exports do not require customs inspection: import-processing time is about a third longer than exports. Preparing documents and border compliance for imports bound to Chittagong or Dhaka takes 13.6 days while documentary compliance for exports takes 10.3 days (Table 2.7), and the bulk of import and export costs are due to port and terminal handling and not to inland transport. Nonetheless, relative to countries
in the Organisation for Economic Co-operation and Development (OECD), simplifications in import and export documents can be made to reduce time. For Chittagong Port specifically, high costs of document and border compliance and delays in handling goods are major concerns. Although the efficiency of the port has improved in recent years, its small capacity could limit economic growth in the years to come.
According to Mahmud and Rosette (2007), corruption, bureaucratic complexities, and safety concerns marked Chittagong Port’s reputation. This has improved in recent times. Bureaucracy is sometimes set up as a means of providing additional employment and extracting informal payments. Bribes with fixed rates are present throughout port processes, and are known to all and are seen by users as a necessary fixed cost
Table 2.7: Trading Across Borders
OECD = Organisation for Economic Co-operation and Development.Notes:a For South Asia and OECD, data from Doing Business Report 2014.b Cost is in $ per 20-foot dry container converted at nominal exchange rate.Source: World Bank 2016a; World Bank Doing BusinessReport 2014 (accessed August 2016).
IndicatorsDhaka via
Chittagong port South Asia OECDDocuments to export
(number)a13 8 4
Time to comply with border and document procedures for export (days)
10.3 5.9 0.8
Cost to comply with border and document procedures to export (June 2015)b
633 560 196
Cost of inland transport/handling to export ($ per container, 2013)
250 983 517
Documents to import (number)a
9 10 4
Time to comply with border and document procedures to import (days)
13.6 9.3 0.5
Cost to comply with border and document procedures to import (June 2015)b
1,664 1,002 148
Cost of inland transport/handling to import ($ per container, 2013)
300 1,039 526
32
Bangladesh: Consolidating Export-Led Growth
(although this has improved through the adoption of ASYCUDA).11 Large, negotiated payments were also used and were met with disapproval because they extracted money from public funds (Mahmud and Rosette 2007).
There are other considerations related to the transport sector. The role of public–private partnerships in infrastructure projects has been expanded with a regulatory and institutional framework, but there is still a long way to go. A public–private partnership office was established to provide support and identify potential projects. Out of six identified road projects, only the Dhaka Elevated Expressway has reached the final stage of contracting. Institutional inadequacy and problems in the bidding and contracting process make it difficult to set up public–private partnerships (Alam 2015). The lack of a formal legal framework creates doubt over obligations to private sector partners, and provisions for cost recovery and compensation (Hassan 2012). Delays in implementing public–private partnerships can also arise due to contract negotiations between the private and public sectors.
More traditional modes of transportation such as bicycles will take on more importance in all urban centers—not just in Bangladesh—as concerns about the environment and urban well-being take on greater importance. Household surveys conducted in 2005 and 2010 showed that the primary mode of transport for households was by rickshaw (36%), followed by buses (34%), and the rest walk or use other motorized modes of transport. Nonetheless, almost 80% of the public funds in Dhaka are invested in infrastructure catering to passenger cars, the most inefficient and non-egalitarian form of transport.
In sum, lack of adequate infrastructure is a clear constraint to growth and, importantly, deters foreign direct investment.
Nonetheless, public and private sector interventions to reduce the problems associated with geography and environment, education, transport, and ports are moving in the right direction. Efforts have been made to improve physical capital in the energy sector, although not quickly enough to raise economic activity.
2.4 Is Low Appropriability for Investors a Constraint?Another possible binding constraint to investors and growth is economic, institutional, or sociopolitical conditions that are not conducive to gains from investment. When people invest less than is socially optimal, this holds back growth. Reasons for this can include government failures, such as a policy environment that generates high risks, market failures, a lack of information, or coordination that may prevent investment from yielding the highest possible returns. Considering the micro risks, the main deterrents to investment are problems establishing and enforcing property rights, and corruption.
In Bangladesh, establishing clear property rights is an important constraint on sustainable long-term growth. Some serious governance failures exist, but it seems that many of them are related to enforcing property contracts.
2.4.1 Are Governance-Related Issues Critical Constraints to Sustained Growth?
Establishing good governance is a priority in Bangladesh’s Sixth and Seventh Five-Year Plans. The government’s vision is to ensure an effective parliamentary process, sound law and order, pro-people public services, and an improved legal and judicial system. It aims to strengthen local governance and create a society with social justice that is free of corruption. While progress has been made in some areas (such as separation of executive, legislative, and judicial powers; freedom of information; and improving parliamentary oversight), stronger rule of law is crucial to continued economic prosperity and social inclusion. Transparency and accountability in governance need stronger commitment. Priority needs to be attached, in particular, to strengthening the anticorruption institutions (ADB 2011).
Bangladesh scores below average on the six governance indicators developed by the World Bank
____________________11 The Automated System for Customs Data (ASYCUDA) is a computerized system designed by the United Nations Conference on Trade and Development to
administer a country’s customs.
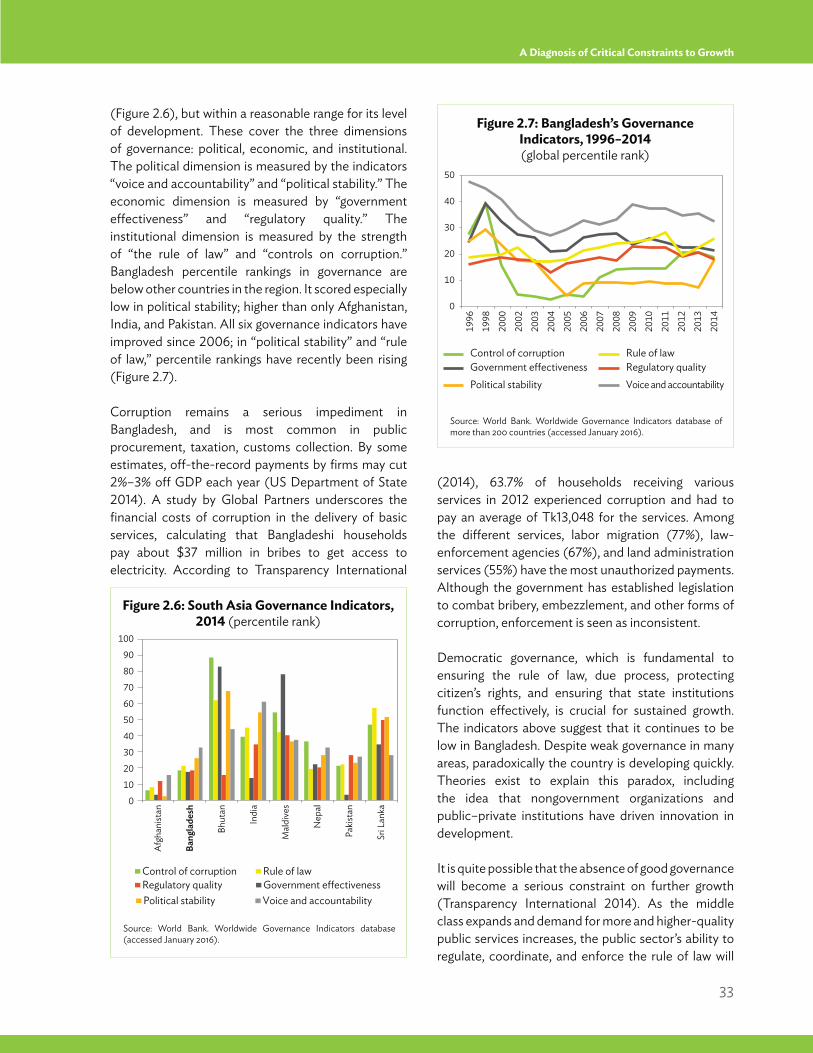
33
A Diagnosis of Critical Constraints to Growth
(Figure 2.6), but within a reasonable range for its level of development. These cover the three dimensions of governance: political, economic, and institutional. The political dimension is measured by the indicators “voice and accountability” and “political stability.” The economic dimension is measured by “government effectiveness” and “regulatory quality.” The institutional dimension is measured by the strength of “the rule of law” and “controls on corruption.” Bangladesh percentile rankings in governance are below other countries in the region. It scored especially low in political stability; higher than only Afghanistan, India, and Pakistan. All six governance indicators have improved since 2006; in “political stability” and “rule of law,” percentile rankings have recently been rising (Figure 2.7).
Corruption remains a serious impediment in Bangladesh, and is most common in public procurement, taxation, customs collection. By some estimates, off-the-record payments by firms may cut 2%–3% off GDP each year (US Department of State 2014). A study by Global Partners underscores the financial costs of corruption in the delivery of basic services, calculating that Bangladeshi households pay about $37 million in bribes to get access to electricity. According to Transparency International
(2014), 63.7% of households receiving various services in 2012 experienced corruption and had to pay an average of Tk13,048 for the services. Among the different services, labor migration (77%), law-enforcement agencies (67%), and land administration services (55%) have the most unauthorized payments. Although the government has established legislation to combat bribery, embezzlement, and other forms of corruption, enforcement is seen as inconsistent.
Democratic governance, which is fundamental to ensuring the rule of law, due process, protecting citizen’s rights, and ensuring that state institutions function effectively, is crucial for sustained growth. The indicators above suggest that it continues to be low in Bangladesh. Despite weak governance in many areas, paradoxically the country is developing quickly. Theories exist to explain this paradox, including the idea that nongovernment organizations and public–private institutions have driven innovation in development.
It is quite possible that the absence of good governance will become a serious constraint on further growth (Transparency International 2014). As the middle class expands and demand for more and higher-quality public services increases, the public sector’s ability to regulate, coordinate, and enforce the rule of law will
Figure 2.6: South Asia Governance Indicators, 2014 (percentile rank)
Figure 2.7: Bangladesh’s Governance Indicators, 1996–2014 (global percentile rank)
Source: World Bank. Worldwide Governance Indicators database (accessed January 2016).
Source: World Bank. Worldwide Governance Indicators database of more than 200 countries (accessed January 2016).
0
90
80
70
60
50
40
30
20
10
100
Afg
hani
stan
Bang
lade
sh
Bhut
an
Indi
a
Mal
dive
s
Nep
al
Paki
stan
Sri L
anka
Control of corruption Rule of lawGovernment effectivenessRegulatory quality
Political stability Voice and accountability
0
50
30
20
10
40
2002
1996
1998
2000
2003
2004
2005
2006
2007
2008
2009
2011
2010
2013
2014
2012
Control of corruption Rule of lawGovernment effectiveness Regulatory qualityPolitical stability Voice and accountability
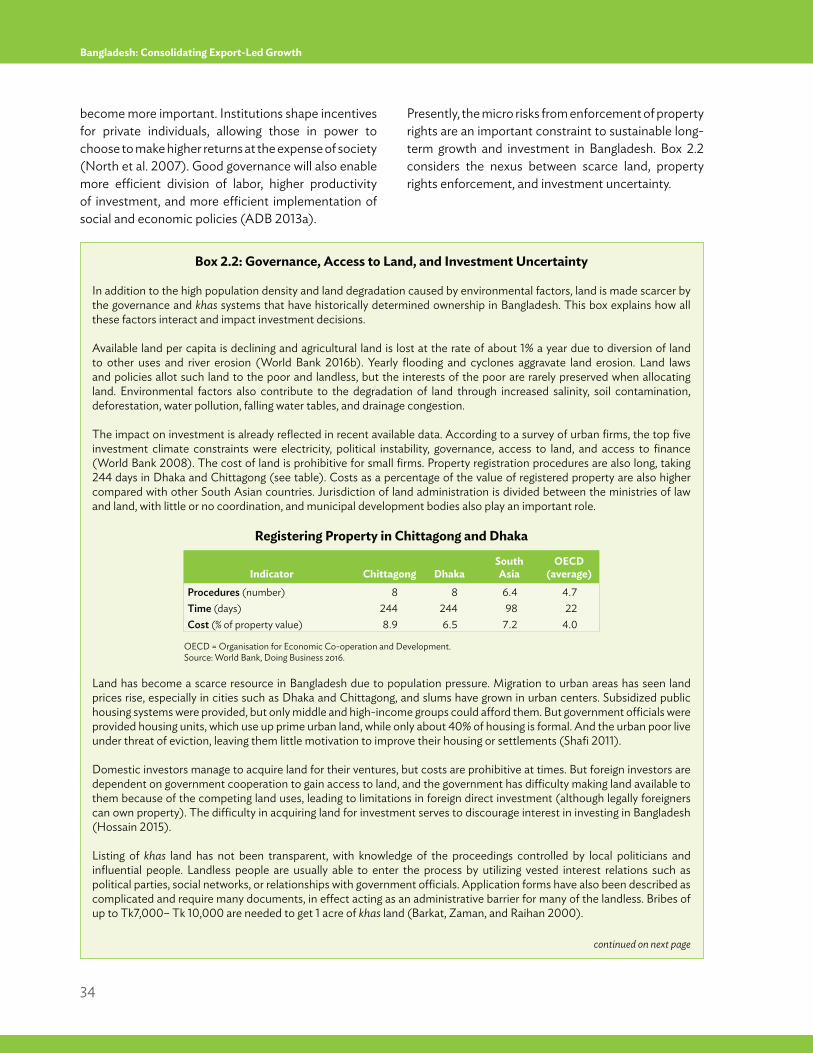
34
Bangladesh: Consolidating Export-Led Growth
become more important. Institutions shape incentives for private individuals, allowing those in power to choose to make higher returns at the expense of society (North et al. 2007). Good governance will also enable more efficient division of labor, higher productivity of investment, and more efficient implementation of social and economic policies (ADB 2013a).
Presently, the micro risks from enforcement of property rights are an important constraint to sustainable long-term growth and investment in Bangladesh. Box 2.2 considers the nexus between scarce land, property rights enforcement, and investment uncertainty.
Box 2.2: Governance, Access to Land, and Investment Uncertainty
In addition to the high population density and land degradation caused by environmental factors, land is made scarcer by the governance and khas systems that have historically determined ownership in Bangladesh. This box explains how all these factors interact and impact investment decisions.
Available land per capita is declining and agricultural land is lost at the rate of about 1% a year due to diversion of land to other uses and river erosion (World Bank 2016b). Yearly flooding and cyclones aggravate land erosion. Land laws and policies allot such land to the poor and landless, but the interests of the poor are rarely preserved when allocating land. Environmental factors also contribute to the degradation of land through increased salinity, soil contamination, deforestation, water pollution, falling water tables, and drainage congestion.
The impact on investment is already reflected in recent available data. According to a survey of urban firms, the top five investment climate constraints were electricity, political instability, governance, access to land, and access to finance (World Bank 2008). The cost of land is prohibitive for small firms. Property registration procedures are also long, taking 244 days in Dhaka and Chittagong (see table). Costs as a percentage of the value of registered property are also higher compared with other South Asian countries. Jurisdiction of land administration is divided between the ministries of law and land, with little or no coordination, and municipal development bodies also play an important role.
Registering Property in Chittagong and Dhaka
Land has become a scarce resource in Bangladesh due to population pressure. Migration to urban areas has seen land prices rise, especially in cities such as Dhaka and Chittagong, and slums have grown in urban centers. Subsidized public housing systems were provided, but only middle and high-income groups could afford them. But government officials were provided housing units, which use up prime urban land, while only about 40% of housing is formal. And the urban poor live under threat of eviction, leaving them little motivation to improve their housing or settlements (Shafi 2011).
Domestic investors manage to acquire land for their ventures, but costs are prohibitive at times. But foreign investors are dependent on government cooperation to gain access to land, and the government has difficulty making land available to them because of the competing land uses, leading to limitations in foreign direct investment (although legally foreigners can own property). The difficulty in acquiring land for investment serves to discourage interest in investing in Bangladesh (Hossain 2015).
Listing of khas land has not been transparent, with knowledge of the proceedings controlled by local politicians and influential people. Landless people are usually able to enter the process by utilizing vested interest relations such as political parties, social networks, or relationships with government officials. Application forms have also been described as complicated and require many documents, in effect acting as an administrative barrier for many of the landless. Bribes of up to Tk7,000– Tk 10,000 are needed to get 1 acre of khas land (Barkat, Zaman, and Raihan 2000).
continued on next page
Indicator Chittagong DhakaSouth Asia
OECD (average)
Procedures (number) 8 8 6.4 4.7Time (days) 244 244 98 22Cost (% of property value) 8.9 6.5 7.2 4.0
OECD = Organisation for Economic Co-operation and Development.Source: World Bank, Doing Business 2016.
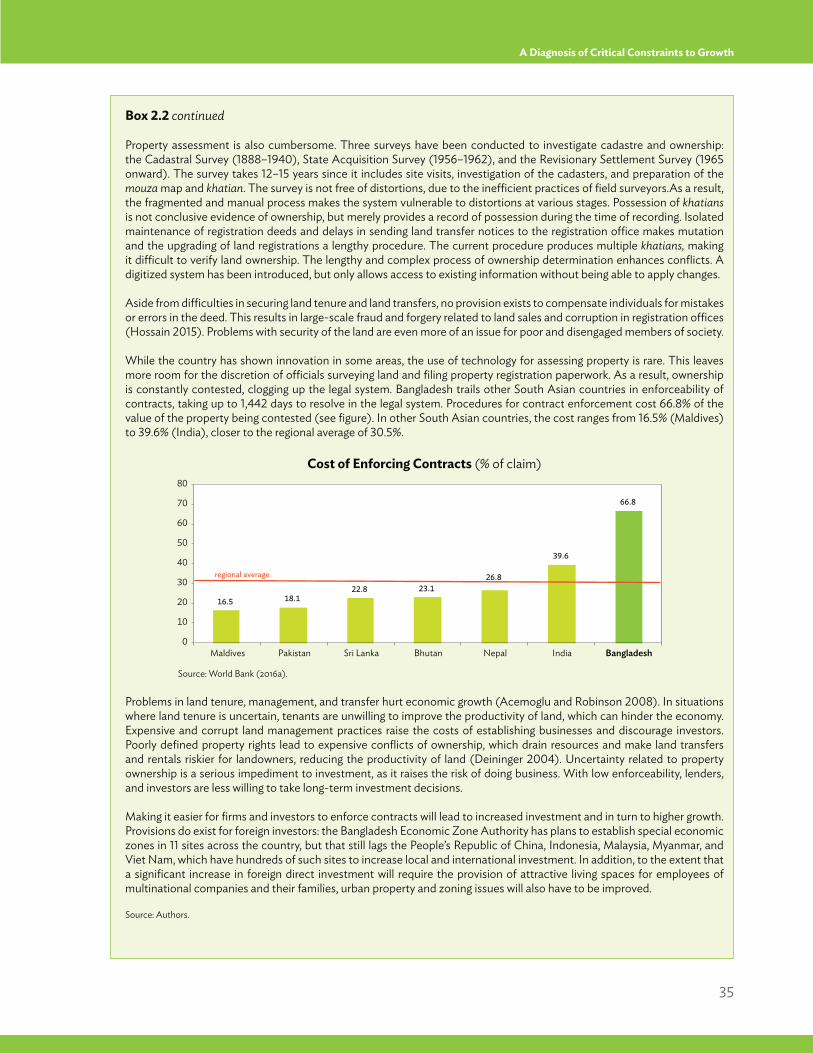
35
A Diagnosis of Critical Constraints to Growth
Box 2.2 continued
Property assessment is also cumbersome. Three surveys have been conducted to investigate cadastre and ownership: the Cadastral Survey (1888–1940), State Acquisition Survey (1956–1962), and the Revisionary Settlement Survey (1965 onward). The survey takes 12–15 years since it includes site visits, investigation of the cadasters, and preparation of the mouza map and khatian. The survey is not free of distortions, due to the inefficient practices of field surveyors.As a result, the fragmented and manual process makes the system vulnerable to distortions at various stages. Possession of khatians is not conclusive evidence of ownership, but merely provides a record of possession during the time of recording. Isolated maintenance of registration deeds and delays in sending land transfer notices to the registration office makes mutation and the upgrading of land registrations a lengthy procedure. The current procedure produces multiple khatians, making it difficult to verify land ownership. The lengthy and complex process of ownership determination enhances conflicts. A digitized system has been introduced, but only allows access to existing information without being able to apply changes.
Aside from difficulties in securing land tenure and land transfers, no provision exists to compensate individuals for mistakes or errors in the deed. This results in large-scale fraud and forgery related to land sales and corruption in registration offices (Hossain 2015). Problems with security of the land are even more of an issue for poor and disengaged members of society.
While the country has shown innovation in some areas, the use of technology for assessing property is rare. This leaves more room for the discretion of officials surveying land and filing property registration paperwork. As a result, ownership is constantly contested, clogging up the legal system. Bangladesh trails other South Asian countries in enforceability of contracts, taking up to 1,442 days to resolve in the legal system. Procedures for contract enforcement cost 66.8% of the value of the property being contested (see figure). In other South Asian countries, the cost ranges from 16.5% (Maldives) to 39.6% (India), closer to the regional average of 30.5%.
Cost of Enforcing Contracts (% of claim)
Source: World Bank (2016a).
Problems in land tenure, management, and transfer hurt economic growth (Acemoglu and Robinson 2008). In situations where land tenure is uncertain, tenants are unwilling to improve the productivity of land, which can hinder the economy. Expensive and corrupt land management practices raise the costs of establishing businesses and discourage investors. Poorly defined property rights lead to expensive conflicts of ownership, which drain resources and make land transfers and rentals riskier for landowners, reducing the productivity of land (Deininger 2004). Uncertainty related to property ownership is a serious impediment to investment, as it raises the risk of doing business. With low enforceability, lenders, and investors are less willing to take long-term investment decisions.
Making it easier for firms and investors to enforce contracts will lead to increased investment and in turn to higher growth. Provisions do exist for foreign investors: the Bangladesh Economic Zone Authority has plans to establish special economic zones in 11 sites across the country, but that still lags the People’s Republic of China, Indonesia, Malaysia, Myanmar, and Viet Nam, which have hundreds of such sites to increase local and international investment. In addition, to the extent that a significant increase in foreign direct investment will require the provision of attractive living spaces for employees of multinational companies and their families, urban property and zoning issues will also have to be improved.
Source: Authors.
16.5
regional average
18.1 22.8 23.1
26.8
39.6
66.8
0
50
40
30
20
10
60
70
80
Maldives Pakistan Sri Lanka Bhutan Nepal India Bangladesh
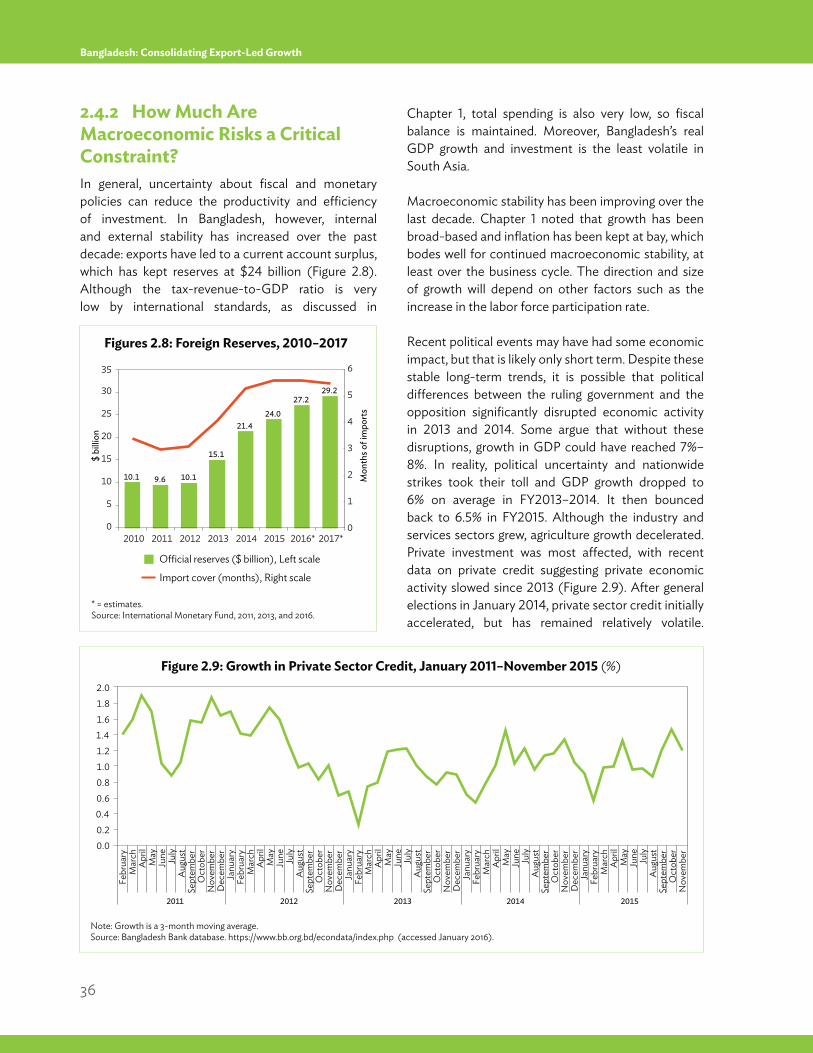
36
Bangladesh: Consolidating Export-Led Growth
2.4.2 How Much Are Macroeconomic Risks a Critical Constraint?In general, uncertainty about fiscal and monetary policies can reduce the productivity and efficiency of investment. In Bangladesh, however, internal and external stability has increased over the past decade: exports have led to a current account surplus, which has kept reserves at $24 billion (Figure 2.8). Although the tax-revenue-to-GDP ratio is very low by international standards, as discussed in
Chapter 1, total spending is also very low, so fiscal balance is maintained. Moreover, Bangladesh’s real GDP growth and investment is the least volatile in South Asia.
Macroeconomic stability has been improving over the last decade. Chapter 1 noted that growth has been broad-based and inflation has been kept at bay, which bodes well for continued macroeconomic stability, at least over the business cycle. The direction and size of growth will depend on other factors such as the increase in the labor force participation rate.
Recent political events may have had some economic impact, but that is likely only short term. Despite these stable long-term trends, it is possible that political differences between the ruling government and the opposition significantly disrupted economic activity in 2013 and 2014. Some argue that without these disruptions, growth in GDP could have reached 7%–8%. In reality, political uncertainty and nationwide strikes took their toll and GDP growth dropped to 6% on average in FY2013–2014. It then bounced back to 6.5% in FY2015. Although the industry and services sectors grew, agriculture growth decelerated. Private investment was most affected, with recent data on private credit suggesting private economic activity slowed since 2013 (Figure 2.9). After general elections in January 2014, private sector credit initially accelerated, but has remained relatively volatile.
10.1 9.6 10.1
15.1
21.4 24.0
27.2 29.2
Official reserves ($ billion), Left scale
Import cover (months), Right scale
0
5
15
10
20
25
30
35 6
5
4
3
2
1
0
$ bi
llion
Mon
ths o
f im
port
s
2010 2011 2012 2013 2014 2015 2016* 2017*
Febr
uary
Mar
chA
pril
Aug
ust
May
June July
Sept
embe
rO
ctob
erN
ovem
ber
Dec
embe
rJa
nuar
yFe
brua
ryM
arch
Apr
ilM
ayJu
ne July
Aug
ust
Sept
embe
rO
ctob
erN
ovem
ber
Dec
embe
rJa
nuar
yFe
brua
ryM
arch
Apr
ilM
ayJu
ne July
Aug
ust
Sept
embe
rO
ctob
erN
ovem
ber
Dec
embe
rJa
nuar
yFe
brua
ryM
arch
Apr
ilM
ayJu
ne July
Aug
ust
Sept
embe
rO
ctob
erN
ovem
ber
Dec
embe
rJa
nuar
yFe
brua
ryM
arch
Apr
ilM
ayJu
ne July
Aug
ust
Sept
embe
rO
ctob
erN
ovem
ber0.0
0.2 0.4 0.6 0.8 1.0 1.2 1.4 1.6 1.8 2.0
2011 2012 2013 2014 2015
Figure 2.9: Growth in Private Sector Credit, January 2011–November 2015 (%)
Figures 2.8: Foreign Reserves, 2010–2017
Note: Growth is a 3-month moving average.Source: Bangladesh Bank database. https://www.bb.org.bd/econdata/index.php (accessed January 2016).
* = estimates.Source: International Monetary Fund, 2011, 2013, and 2016.
37
A Diagnosis of Critical Constraints to Growth
Nonetheless, Figure 1.2 in the previous chapter also shows that the long-term volatility of GDP has declined significantly since the early 1970s despite political disruptions at various times.
2.5 Is Insufficient Self-Discovery and Coordination a Constraint to Growth? 2.5.1 Has the Non-Garment Sector Been Given a Chance to Succeed?
Low social returns may come from insufficient self-discovery.12 Although Bangladesh has been very successful in finding its comparative advantage in garment exports, tax and tariff policies may have actually prevented other sectors from self-discovery.
The premise is as follows: Although policies have been geared to heavily promote exports of ready-made garments (RMG), these have been so strong that they have actually created an anti-export bias for other sectors. This was fine in the early stages of its development, because it allowed Bangladesh garments to get a foot in the door of global markets. But now, RMG is so large it is possibly producing rents to the sector, which is clearly not the most efficient way to allocate resources.
The rationale for the policy therefore has not only disappeared, but also may have partly stifled the potential of other exports. These other sectors enjoy protection from competing imports, so are complacent, selling only to the less-competitive domestic market. Politicians see the current large growth of RMG, but not the potential of other sectors when they point to its success. Not giving all sectors the same opportunity as RMG is dampening the potential for self-discovery. Chapter 5 details the mechanism through which this happens.
Business leaders of other potential sectors are not as organized or as coordinated as those in RMG. For example, although the quality of the raw leather in Bangladesh is excellent, other issues that could help
the industry are a long way from resolution. This is also true of pharmaceuticals, which do not have the proper regulatory framework to enable the sector to make a dent in export markets. Boxes 5.3 and 5.4 discuss some of the tribulations leather and footwear and pharmaceuticals have experienced.
2.5.2 Has Technology Been used to Increase Coordination Externalities?
Many government initiatives attest to a strong willingness to embrace technology as a strategy for growth and poverty reduction. In Vision 2021, the government promotes Digital Bangladesh by 2021, an initiative which proposes to mainstream information and communication technology (ICT) as a pro-poor tool. Medium-term strategies and policies toward the realization of Digital Bangladesh were laid down in the government’s Five-Year Plans. Early initiatives included the establishment of the Bangladesh Association of Software and Information Services, the formation of an ICT task force, and the relaxation of levies for ICT imports. Moreover, the ICT Policy 2009, Right to Information Act 2009, and ICT Act 2009 were promulgated to provide an enabling environment for ICT development.
Government and nongovernment and private organizations, likewise, have implemented many ICT initiatives. Bangladesh Bank, for example, has been at the forefront of the application of technology to advance microfinance.
Pronounced development of ICT started in the early 2000s, most notably in mobile communications. Mobile phone subscriptions grew by an average of 64% annually from 2000 to 2013, and reached 103 million in 2014, from 279,000 in 2000 (Table 2.8). Deregulation in 1998 opened the market to competition that fueled growth and slashed mobile call rates, from Tk9.60 per minute in 2001/2002 to Tk0.83 per minute in 2011/2012 (Bangladesh Telecommunication Regulatory Commission 2013). Bangladesh has the lowest mobile phone call rates in South Asia (Ministry of Planning 2012).
____________________12 Self-discovery refers to a process of natural and learned capabilities in an economy coming together to produce a new good or service where it has a relative
comparative advantage.
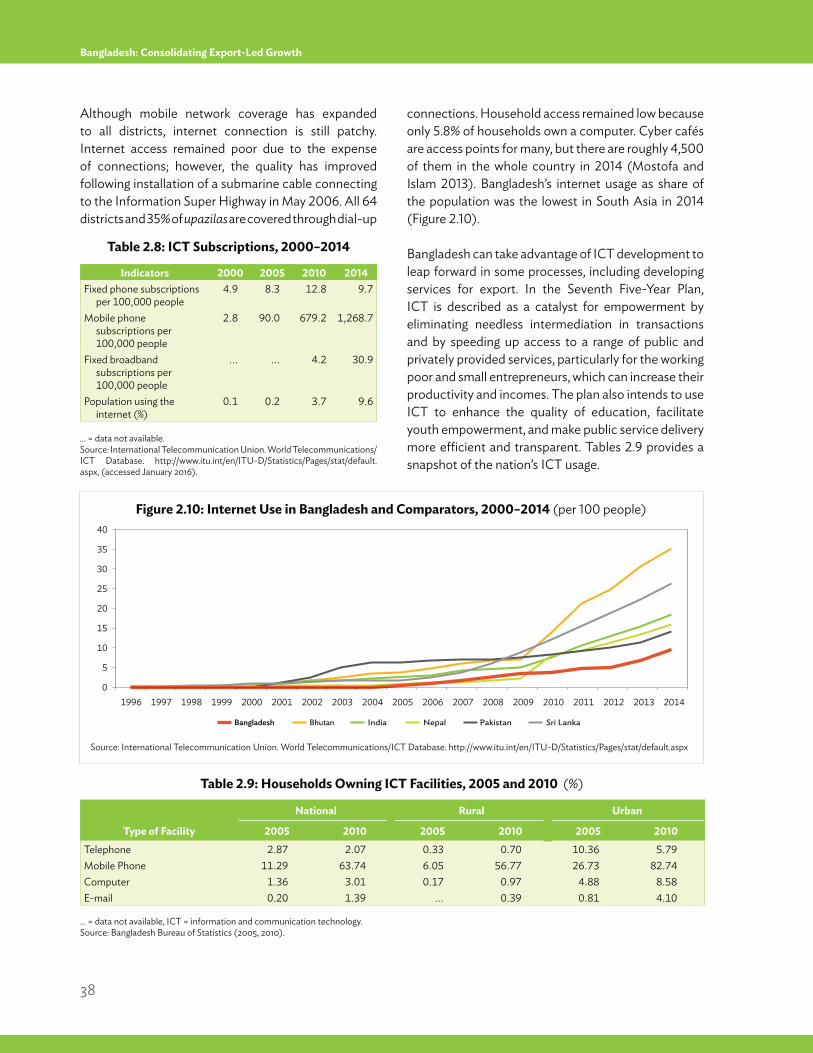
38
Bangladesh: Consolidating Export-Led Growth
Although mobile network coverage has expanded to all districts, internet connection is still patchy. Internet access remained poor due to the expense of connections; however, the quality has improved following installation of a submarine cable connecting to the Information Super Highway in May 2006. All 64 districts and 35% of upazilas are covered through dial-up
connections. Household access remained low because only 5.8% of households own a computer. Cyber cafés are access points for many, but there are roughly 4,500 of them in the whole country in 2014 (Mostofa and Islam 2013). Bangladesh’s internet usage as share of the population was the lowest in South Asia in 2014 (Figure 2.10).
Bangladesh can take advantage of ICT development to leap forward in some processes, including developing services for export. In the Seventh Five-Year Plan, ICT is described as a catalyst for empowerment by eliminating needless intermediation in transactions and by speeding up access to a range of public and privately provided services, particularly for the working poor and small entrepreneurs, which can increase their productivity and incomes. The plan also intends to use ICT to enhance the quality of education, facilitate youth empowerment, and make public service delivery more efficient and transparent. Tables 2.9 provides a snapshot of the nation’s ICT usage.
IndiaBangladesh Bhutan
0
40
30
25
20
15
10
5
35
Nepal Pakistan Sri Lanka
2000 2001 20021996 1997 1998 1999 2003 2004 2005 2006 20082007 2009 2011 20122010 2013 2014
Type of Facility
National Rural Urban
2005 2010 2005 2010 2005 2010Telephone 2.87 2.07 0.33 0.70 10.36 5.79Mobile Phone 11.29 63.74 6.05 56.77 26.73 82.74Computer 1.36 3.01 0.17 0.97 4.88 8.58E-mail 0.20 1.39 ... 0.39 0.81 4.10
Table 2.9: Households Owning ICT Facilities, 2005 and 2010 (%)
… = data not available, ICT = information and communication technology.Source: Bangladesh Bureau of Statistics (2005, 2010).
Figure 2.10: Internet Use in Bangladesh and Comparators, 2000–2014 (per 100 people)
Source: International Telecommunication Union. World Telecommunications/ICT Database. http://www.itu.int/en/ITU-D/Statistics/Pages/stat/default.aspx
Indicators 2000 2005 2010 2014Fixed phone subscriptions
per 100,000 people4.9 8.3 12.8 9.7
Mobile phone subscriptions per 100,000 people
2.8 90.0 679.2 1,268.7
Fixed broadband subscriptions per 100,000 people
... ... 4.2 30.9
Population using the internet (%)
0.1 0.2 3.7 9.6
Table 2.8: ICT Subscriptions, 2000–2014
… = data not available.Source: International Telecommunication Union. World Telecommunications/ICT Database. http://www.itu.int/en/ITU-D/Statistics/Pages/stat/default.aspx, (accessed January 2016).
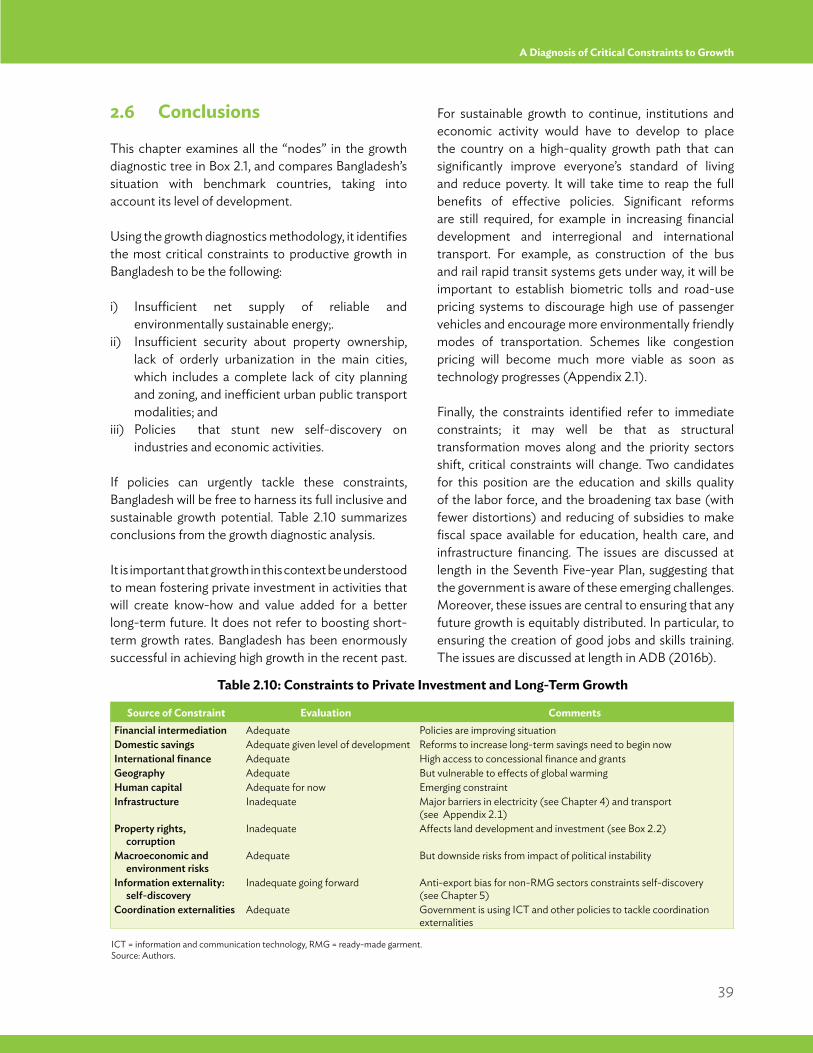
39
A Diagnosis of Critical Constraints to Growth
2.6 Conclusions
This chapter examines all the “nodes” in the growth diagnostic tree in Box 2.1, and compares Bangladesh’s situation with benchmark countries, taking into account its level of development.
Using the growth diagnostics methodology, it identifies the most critical constraints to productive growth in Bangladesh to be the following:
i) Insufficient net supply of reliable and environmentally sustainable energy;.
ii) Insufficient security about property ownership, lack of orderly urbanization in the main cities, which includes a complete lack of city planning and zoning, and inefficient urban public transport modalities; and
iii) Policies that stunt new self-discovery on industries and economic activities.
If policies can urgently tackle these constraints, Bangladesh will be free to harness its full inclusive and sustainable growth potential. Table 2.10 summarizes conclusions from the growth diagnostic analysis.
It is important that growth in this context be understood to mean fostering private investment in activities that will create know-how and value added for a better long-term future. It does not refer to boosting short-term growth rates. Bangladesh has been enormously successful in achieving high growth in the recent past.
For sustainable growth to continue, institutions and economic activity would have to develop to place the country on a high-quality growth path that can significantly improve everyone’s standard of living and reduce poverty. It will take time to reap the full benefits of effective policies. Significant reforms are still required, for example in increasing financial development and interregional and international transport. For example, as construction of the bus and rail rapid transit systems gets under way, it will be important to establish biometric tolls and road-use pricing systems to discourage high use of passenger vehicles and encourage more environmentally friendly modes of transportation. Schemes like congestion pricing will become much more viable as soon as technology progresses (Appendix 2.1).
Finally, the constraints identified refer to immediate constraints; it may well be that as structural transformation moves along and the priority sectors shift, critical constraints will change. Two candidates for this position are the education and skills quality of the labor force, and the broadening tax base (with fewer distortions) and reducing of subsidies to make fiscal space available for education, health care, and infrastructure financing. The issues are discussed at length in the Seventh Five-year Plan, suggesting that the government is aware of these emerging challenges. Moreover, these issues are central to ensuring that any future growth is equitably distributed. In particular, to ensuring the creation of good jobs and skills training. The issues are discussed at length in ADB (2016b).
Source of Constraint Evaluation CommentsFinancial intermediation Adequate Policies are improving situationDomestic savings Adequate given level of development Reforms to increase long-term savings need to begin nowInternational finance Adequate High access to concessional finance and grantsGeography Adequate But vulnerable to effects of global warmingHuman capital Adequate for now Emerging constraintInfrastructure Inadequate Major barriers in electricity (see Chapter 4) and transport
(see Appendix 2.1)Property rights,
corruptionInadequate Affects land development and investment (see Box 2.2)
Macroeconomic and environment risks
Adequate But downside risks from impact of political instability
Information externality: self-discovery
Inadequate going forward Anti-export bias for non-RMG sectors constraints self-discovery (see Chapter 5)
Coordination externalities Adequate Government is using ICT and other policies to tackle coordination externalities
Table 2.10: Constraints to Private Investment and Long-Term Growth
ICT = information and communication technology, RMG = ready-made garment.Source: Authors.
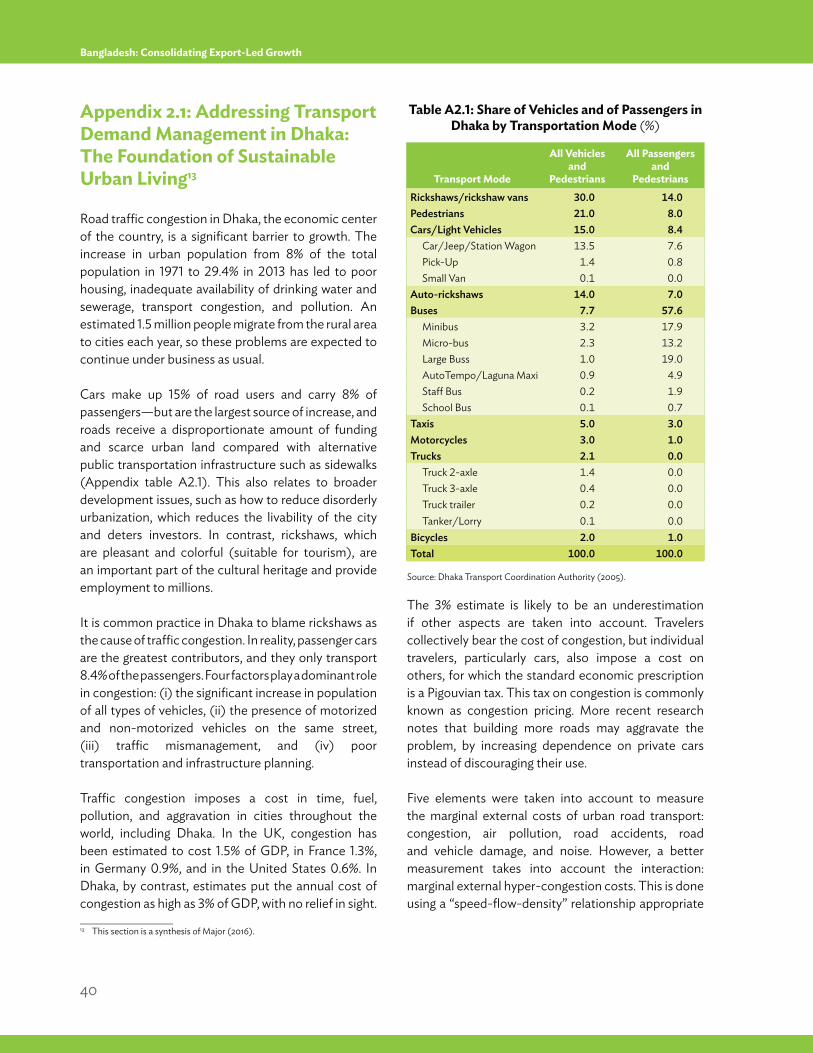
40
Bangladesh: Consolidating Export-Led Growth
Appendix 2.1: Addressing Transport Demand Management in Dhaka: The Foundation of Sustainable Urban Living13
Road traffic congestion in Dhaka, the economic center of the country, is a significant barrier to growth. The increase in urban population from 8% of the total population in 1971 to 29.4% in 2013 has led to poor housing, inadequate availability of drinking water and sewerage, transport congestion, and pollution. An estimated 1.5 million people migrate from the rural area to cities each year, so these problems are expected to continue under business as usual.
Cars make up 15% of road users and carry 8% of passengers—but are the largest source of increase, and roads receive a disproportionate amount of funding and scarce urban land compared with alternative public transportation infrastructure such as sidewalks (Appendix table A2.1). This also relates to broader development issues, such as how to reduce disorderly urbanization, which reduces the livability of the city and deters investors. In contrast, rickshaws, which are pleasant and colorful (suitable for tourism), are an important part of the cultural heritage and provide employment to millions.
It is common practice in Dhaka to blame rickshaws as the cause of traffic congestion. In reality, passenger cars are the greatest contributors, and they only transport 8.4% of the passengers. Four factors play a dominant role in congestion: (i) the significant increase in population of all types of vehicles, (ii) the presence of motorized and non-motorized vehicles on the same street, (iii) traffic mismanagement, and (iv) poor transportation and infrastructure planning.
Traffic congestion imposes a cost in time, fuel, pollution, and aggravation in cities throughout the world, including Dhaka. In the UK, congestion has been estimated to cost 1.5% of GDP, in France 1.3%, in Germany 0.9%, and in the United States 0.6%. In Dhaka, by contrast, estimates put the annual cost of congestion as high as 3% of GDP, with no relief in sight.
The 3% estimate is likely to be an underestimation if other aspects are taken into account. Travelers collectively bear the cost of congestion, but individual travelers, particularly cars, also impose a cost on others, for which the standard economic prescription is a Pigouvian tax. This tax on congestion is commonly known as congestion pricing. More recent research notes that building more roads may aggravate the problem, by increasing dependence on private cars instead of discouraging their use.
Five elements were taken into account to measure the marginal external costs of urban road transport: congestion, air pollution, road accidents, road and vehicle damage, and noise. However, a better measurement takes into account the interaction: marginal external hyper-congestion costs. This is done using a “speed-flow-density” relationship appropriate
____________________13 This section is a synthesis of Major (2016).
Transport Mode
All Vehicles and
Pedestrians
All Passengers and
PedestriansRickshaws/rickshaw vans 30.0 14.0Pedestrians 21.0 8.0Cars/Light Vehicles 15.0 8.4
Car/Jeep/Station Wagon 13.5 7.6Pick-Up 1.4 0.8Small Van 0.1 0.0
Auto-rickshaws 14.0 7.0Buses 7.7 57.6
Minibus 3.2 17.9Micro-bus 2.3 13.2Large Buss 1.0 19.0AutoTempo/Laguna Maxi 0.9 4.9Staff Bus 0.2 1.9School Bus 0.1 0.7
Taxis 5.0 3.0Motorcycles 3.0 1.0Trucks 2.1 0.0
Truck 2-axle 1.4 0.0Truck 3-axle 0.4 0.0Truck trailer 0.2 0.0Tanker/Lorry 0.1 0.0
Bicycles 2.0 1.0Total 100.0 100.0
Table A2.1: Share of Vehicles and of Passengers in Dhaka by Transportation Mode (%)
Source: Dhaka Transport Coordination Authority (2005).
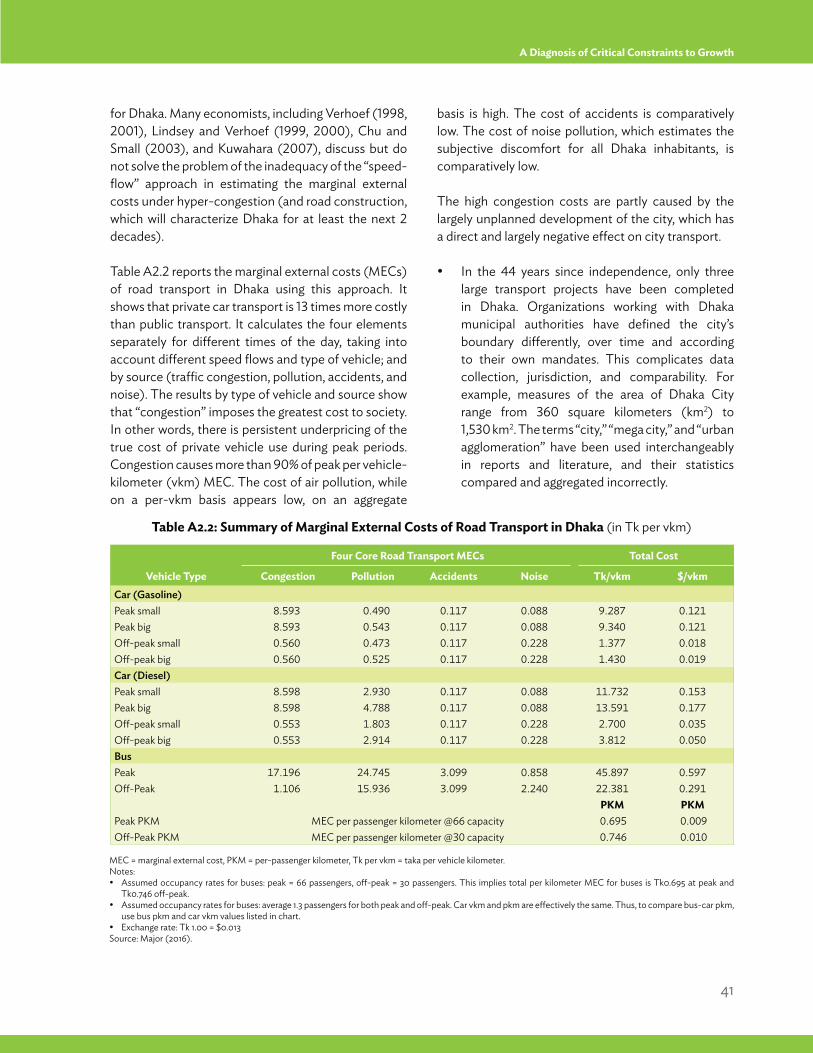
41
A Diagnosis of Critical Constraints to Growth
for Dhaka. Many economists, including Verhoef (1998, 2001), Lindsey and Verhoef (1999, 2000), Chu and Small (2003), and Kuwahara (2007), discuss but do not solve the problem of the inadequacy of the “speed-flow” approach in estimating the marginal external costs under hyper-congestion (and road construction, which will characterize Dhaka for at least the next 2 decades).
Table A2.2 reports the marginal external costs (MECs) of road transport in Dhaka using this approach. It shows that private car transport is 13 times more costly than public transport. It calculates the four elements separately for different times of the day, taking into account different speed flows and type of vehicle; and by source (traffic congestion, pollution, accidents, and noise). The results by type of vehicle and source show that “congestion” imposes the greatest cost to society. In other words, there is persistent underpricing of the true cost of private vehicle use during peak periods. Congestion causes more than 90% of peak per vehicle-kilometer (vkm) MEC. The cost of air pollution, while on a per-vkm basis appears low, on an aggregate
basis is high. The cost of accidents is comparatively low. The cost of noise pollution, which estimates the subjective discomfort for all Dhaka inhabitants, is comparatively low.
The high congestion costs are partly caused by the largely unplanned development of the city, which has a direct and largely negative effect on city transport.
In the 44 years since independence, only three large transport projects have been completed in Dhaka. Organizations working with Dhaka municipal authorities have defined the city’s boundary differently, over time and according to their own mandates. This complicates data collection, jurisdiction, and comparability. For example, measures of the area of Dhaka City range from 360 square kilometers (km2) to 1,530 km2. The terms “city,” “mega city,” and “urban agglomeration” have been used interchangeably in reports and literature, and their statistics compared and aggregated incorrectly.
Table A2.2: Summary of Marginal External Costs of Road Transport in Dhaka (in Tk per vkm)
MEC = marginal external cost, PKM = per-passenger kilometer, Tk per vkm = taka per vehicle kilometer.Notes:
Assumed occupancy rates for buses: peak = 66 passengers, off-peak = 30 passengers. This implies total per kilometer MEC for buses is Tk0.695 at peak and Tk0.746 off-peak.
Assumed occupancy rates for buses: average 1.3 passengers for both peak and off-peak. Car vkm and pkm are effectively the same. Thus, to compare bus-car pkm, use bus pkm and car vkm values listed in chart.
Exchange rate: Tk 1.00 = $0.013 Source: Major (2016).
Vehicle Type
Four Core Road Transport MECs Total Cost
Congestion Pollution Accidents Noise Tk/vkm $/vkmCar (Gasoline)Peak small 8.593 0.490 0.117 0.088 9.287 0.121Peak big 8.593 0.543 0.117 0.088 9.340 0.121Off-peak small 0.560 0.473 0.117 0.228 1.377 0.018Off-peak big 0.560 0.525 0.117 0.228 1.430 0.019Car (Diesel)Peak small 8.598 2.930 0.117 0.088 11.732 0.153Peak big 8.598 4.788 0.117 0.088 13.591 0.177Off-peak small 0.553 1.803 0.117 0.228 2.700 0.035Off-peak big 0.553 2.914 0.117 0.228 3.812 0.050BusPeak 17.196 24.745 3.099 0.858 45.897 0.597Off-Peak 1.106 15.936 3.099 2.240 22.381 0.291
PKM PKMPeak PKM MEC per passenger kilometer @66 capacity 0.695 0.009 Off-Peak PKM MEC per passenger kilometer @30 capacity 0.746 0.010
42
Bangladesh: Consolidating Export-Led Growth
The governance structure of the different transport stakeholders in the city does not yet show clear lines of responsibility and accountability. Fragmentation of transport stakeholders has always been a defining impediment of transport planning in Dhaka. Five agencies and multiple private bus providers share influence, each with independent authority and responsibility: (i) Bangladesh Road Transport Authority: licensing, route permits, fare structure; (ii) Dhaka Transport Coordination Board: policy making; (iii) Dhaka Metropolitan Policy: traffic control; (iii) Dhaka City Corporation (North and South): infrastructure maintenance; (iv) Roads and Highways Department: road construction; (v) Bangladesh Road Transport Corporation: the public bus provider. Nonetheless, the Ministry of Communication is the highest authority responsible for transit, construction, development, expansion, and maintenance of roads (and railways), and several of the above agencies are under its authority.
Various planning initiatives have been implemented over the years, and not all have been completed. The latest plan, ADB’s Greater Dhaka Sustainable Urban Transport Project (ADB 2010), produced a policy document designed to guide development of the overall transport system of Dhaka city. The project strongly recommended a unified authority to manage the overall system, including transportation and land use planning, which was recommended to be named DAMERA (Dhaka Metropolitan Regional Authority). To date, a separate organization has not been established. Instead, the government is trying to reorganize Dhaka Transport Coordination Board, which has been renamed the Dhaka Transport Coordination Authority. Though most Urban Transport projects have not been implemented, two important transit projects have been undertaken with donor support. These are the construction of one main line of the Metro Rapid Transit, and the upgrading of Bangladesh Railway. Recommendations have been made related to organizational development, including a Special Project Organization to implement and monitor better capacity, and support bus transit operations.
Are Congestion Pricing Schemes Possible in Dhaka?
Congestion pricing (CP) aims to charge users the value they place on using publicly provided roads and to guide efficient use of transport resources. It is one part of an overall sustainable development strategy and must integrate with all of a city’s transport initiatives within a comprehensive transport policy. Evidence suggests that well-designed schemes, which must address a number of complications, can yield economic and welfare gains.
CP works by shifting discretionary peak travel to other transportation modes or to off-peak hours. It takes advantage of the fact that a number of drivers on a typical urban road are “discretionary.” By removing a fraction (even as small as 5%) of vehicles from a congested roadway during peak times, CP helps the system flow more efficiently and allows more non-discretionary cars to move through the same space. Such variable pricing to smooth peak and off-peak usage has been successfully adopted in other industries, including for airline tickets, hotel rooms, concert halls, mobile phone rates, and electricity rates.Economists generally agree that CP is the single most viable and sustainable approach to reducing traffic congestion even as implementation is difficult. Drivers generally come to support, or at least accept CP because it unlocks roads of “free loaders.” Bus companies, which are politically influential in Dhaka, wholeheartedly support CP, because it shifts demand in their favor and is usually combined with an improvement of bus transport and routes. Public transit advocates appreciate the ability of CP to generate both funding and incentives to make public transit more attractive. Nonetheless, some aspects need to be addressed for such a scheme to be implemented (Figure A2.1). Fortunately, technology and network research favor Bangladesh if such a scheme were considered.
CP must be placed in the broader context of sustainable development. Traditionally, the default policy to manage congestion has been ‘‘predict and provide,” which unintentionally induces traffic growth. Instead, policy makers throughout the world
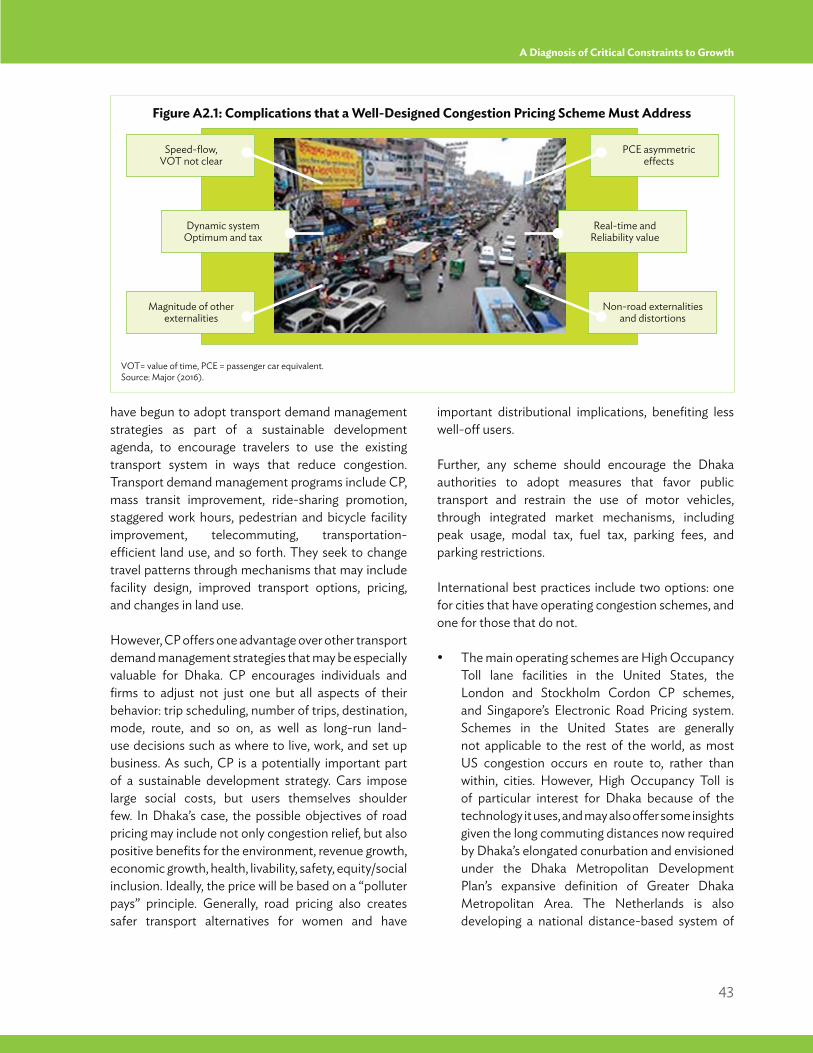
43
A Diagnosis of Critical Constraints to Growth
have begun to adopt transport demand management strategies as part of a sustainable development agenda, to encourage travelers to use the existing transport system in ways that reduce congestion. Transport demand management programs include CP, mass transit improvement, ride-sharing promotion, staggered work hours, pedestrian and bicycle facility improvement, telecommuting, transportation-efficient land use, and so forth. They seek to change travel patterns through mechanisms that may include facility design, improved transport options, pricing, and changes in land use.
However, CP offers one advantage over other transport demand management strategies that may be especially valuable for Dhaka. CP encourages individuals and firms to adjust not just one but all aspects of their behavior: trip scheduling, number of trips, destination, mode, route, and so on, as well as long-run land-use decisions such as where to live, work, and set up business. As such, CP is a potentially important part of a sustainable development strategy. Cars impose large social costs, but users themselves shoulder few. In Dhaka’s case, the possible objectives of road pricing may include not only congestion relief, but also positive benefits for the environment, revenue growth, economic growth, health, livability, safety, equity/social inclusion. Ideally, the price will be based on a “polluter pays” principle. Generally, road pricing also creates safer transport alternatives for women and have
important distributional implications, benefiting less well-off users.
Further, any scheme should encourage the Dhaka authorities to adopt measures that favor public transport and restrain the use of motor vehicles, through integrated market mechanisms, including peak usage, modal tax, fuel tax, parking fees, and parking restrictions.
International best practices include two options: one for cities that have operating congestion schemes, and one for those that do not.
The main operating schemes are High Occupancy Toll lane facilities in the United States, the London and Stockholm Cordon CP schemes, and Singapore’s Electronic Road Pricing system. Schemes in the United States are generally not applicable to the rest of the world, as most US congestion occurs en route to, rather than within, cities. However, High Occupancy Toll is of particular interest for Dhaka because of the technology it uses, and may also offer some insights given the long commuting distances now required by Dhaka’s elongated conurbation and envisioned under the Dhaka Metropolitan Development Plan’s expansive definition of Greater Dhaka Metropolitan Area. The Netherlands is also developing a national distance-based system of
Figure A2.1: Complications that a Well-Designed Congestion Pricing Scheme Must Address
VOT= value of time, PCE = passenger car equivalent.Source: Major (2016).
Dynamic system Optimum and tax
Real-time and Reliability value
Magnitude of other externalities
Non-road externalities and distortions
Speed-flow, VOT not clear
PCE asymmetric effects
44
Bangladesh: Consolidating Export-Led Growth
tolls to control congestion and emissions. Several other countries, particularly in Europe, are also considering national schemes, in part to internalize congestion and other traffic externalities.
In addition, Bogota’s Transmilenio, Curitiba’s Bus Sector Reform (capital of the Brazilian state of Paraná), and Seoul’s Bus Sector Reform are worth reviewing, as the issues they tried to resolve are similar to those in Dhaka. They offer lessons to meeting the challenge of transit system reform in the presence of a large number of independent operators, competitive fares, and institutional dysfunction.
Nonetheless, congestion pricing continues to be a hard sell in cities throughout the world. This is true in fairly wealthy cities, including Edinburgh, Manchester, and even cost-tolerant New York, which rejected an (arguably poorly designed) congestion pricing proposal. Setbacks in peer cities without congestion schemes illustrate the difficulties of designing congestion pricing schemes that are both efficient and publicly acceptable, and certainly Dhaka, which has already rejected some tolls, will be challenging. Still, as the mass rapid transit systems are in their design phase, this is the best time to consider how a CP system could be part of an integrated and orderly urbanization strategy.
Dhaka’s choice of technology will depend on the type of charging scheme and the degree of toll differentiation to be implemented. As such, the choice of technology strictly must “fit form” and come last in the design sequencing. Assessment can be made against nine factors: location accuracy, roadside-infrastructure cost, in-vehicle equipment cost, flexibility, scalability, privacy protection, enforcement, scope for price differentiation, and potential for additional services. Fortunately, this technology will be available in the next 5–10 years for road users to be able to be charged instantaneously through cell phone banking as remote downloadable CP apps for mobile phones become available. Already it is not unusual to see rickshaw drivers using their cell phones to conduct business.
45
Raising Living Standards for All: Maintaining and Propelling Inclusive Growth
Chapter 3Raising Living Standards for All:
Maintaining and Propelling Inclusive Growth
providing adequate social safety nets to ensure that no person goes below a minimum level of economic well-being (Zhuang 2008).
A similar approach to the diagnostics approach used in Chapter 2 can be applied to other areas of policy analysis such as finding critical constraints to inclusiveness. These three main causes are, in turn, occasioned by factors such as low private investment, unequal access to employment opportunities, weak human capabilities, and unequal access to infrastructure and productive assets.
This chapter assesses the inclusiveness of economic growth in Bangladesh using a diagnostic approach. Detailed analysis determines whether basic services are reaching the population. These are health, nutrition, education services, clean water, and an adequate safety net (including for children and the elderly). Table 3.18, on page 72, summarizes what economic and social factors deter inclusive growth and hinder poverty reduction. Subsequent attention to these factors will be needed to ensure shared economic growth and prosperity.
3.1 Introduction
Growth is considered inclusive when all members of society can equally participate in and benefit from the growth process, regardless of individual circumstances (Ali and Zhuang 2007). Accordingly, growth must go beyond simply creating job opportunities and seek to improve access to social services such as education and health care, infrastructure, and to productive assets like land and credit. Adequate social safety nets must be provided to those not fortunate enough to have the means or access to these benefits and opportunities (Zhuang 2008).
Making growth inclusive is crucial to improving social mobility and ensuring that inequalities in income and opportunity are not entrenched across generations.14
A development strategy based on inclusive growth is supported by three pillars:
creating and expanding economic opportunities through high and sustained growth;
ensuring equal access to opportunities for all members of society; and
____________________14 A country’s growth should be inclusive. Otherwise, the resulting inequality could undermine the gains from that growth (Zhuang, Kanbur, and Rhee 2014). Recent
literature shows that growth spells are longer in countries with more equal income distribution (Berg and Ostry 2011; Ostry, Berg, and Tsangarides 2014).
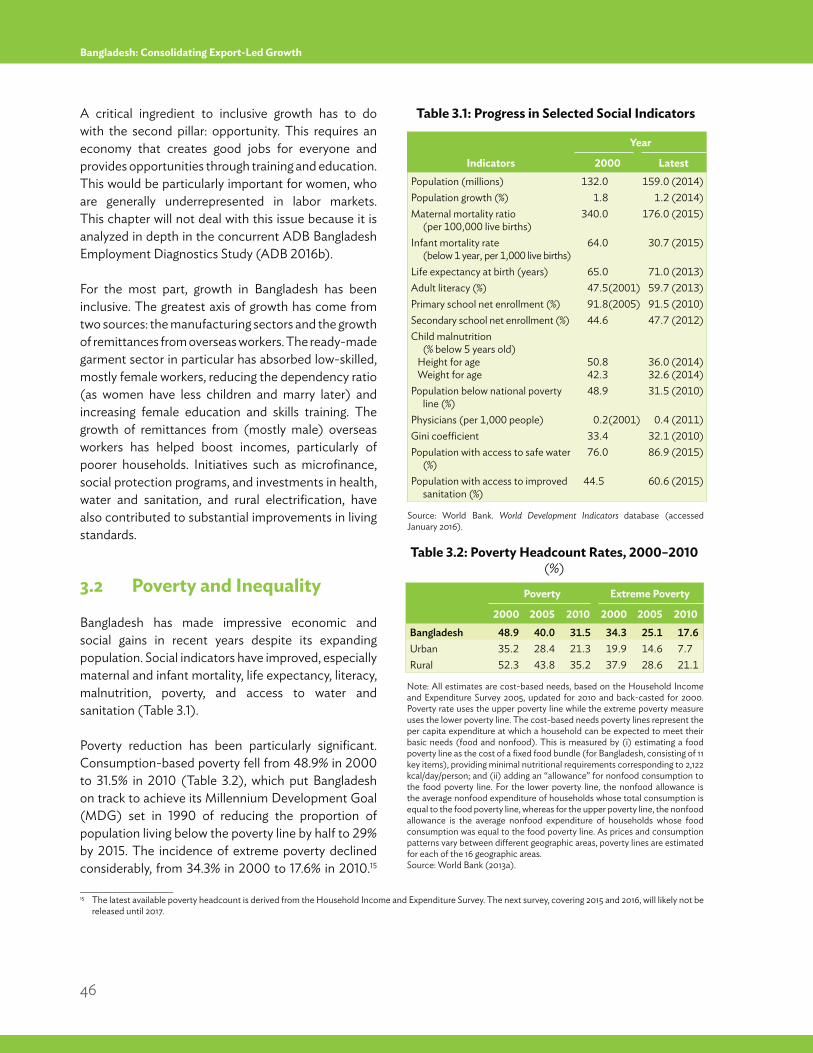
46
Bangladesh: Consolidating Export-Led Growth
A critical ingredient to inclusive growth has to do with the second pillar: opportunity. This requires an economy that creates good jobs for everyone and provides opportunities through training and education. This would be particularly important for women, who are generally underrepresented in labor markets. This chapter will not deal with this issue because it is analyzed in depth in the concurrent ADB Bangladesh Employment Diagnostics Study (ADB 2016b).
For the most part, growth in Bangladesh has been inclusive. The greatest axis of growth has come from two sources: the manufacturing sectors and the growth of remittances from overseas workers. The ready-made garment sector in particular has absorbed low-skilled, mostly female workers, reducing the dependency ratio (as women have less children and marry later) and increasing female education and skills training. The growth of remittances from (mostly male) overseas workers has helped boost incomes, particularly of poorer households. Initiatives such as microfinance, social protection programs, and investments in health, water and sanitation, and rural electrification, have also contributed to substantial improvements in living standards.
3.2 Poverty and Inequality
Bangladesh has made impressive economic and social gains in recent years despite its expanding population. Social indicators have improved, especially maternal and infant mortality, life expectancy, literacy, malnutrition, poverty, and access to water and sanitation (Table 3.1).
Poverty reduction has been particularly significant. Consumption-based poverty fell from 48.9% in 2000 to 31.5% in 2010 (Table 3.2), which put Bangladesh on track to achieve its Millennium Development Goal (MDG) set in 1990 of reducing the proportion of population living below the poverty line by half to 29% by 2015. The incidence of extreme poverty declined considerably, from 34.3% in 2000 to 17.6% in 2010.15
Table 3.1: Progress in Selected Social Indicators
Table 3.2: Poverty Headcount Rates, 2000–2010 (%)
Source: World Bank. World Development Indicators database (accessed January 2016).
Note: All estimates are cost-based needs, based on the Household Income and Expenditure Survey 2005, updated for 2010 and back-casted for 2000. Poverty rate uses the upper poverty line while the extreme poverty measure uses the lower poverty line. The cost-based needs poverty lines represent the per capita expenditure at which a household can be expected to meet their basic needs (food and nonfood). This is measured by (i) estimating a food poverty line as the cost of a fixed food bundle (for Bangladesh, consisting of 11 key items), providing minimal nutritional requirements corresponding to 2,122 kcal/day/person; and (ii) adding an “allowance” for nonfood consumption to the food poverty line. For the lower poverty line, the nonfood allowance is the average nonfood expenditure of households whose total consumption is equal to the food poverty line, whereas for the upper poverty line, the nonfood allowance is the average nonfood expenditure of households whose food consumption was equal to the food poverty line. As prices and consumption patterns vary between different geographic areas, poverty lines are estimated for each of the 16 geographic areas.Source: World Bank (2013a).
Indicators
Year
2000 LatestPopulation (millions) 132.0 159.0 (2014)Population growth (%) 1.8 1.2 (2014)Maternal mortality ratio
(per 100,000 live births)340.0 176.0 (2015)
Infant mortality rate (below 1 year, per 1,000 live births)
64.0 30.7 (2015)
Life expectancy at birth (years) 65.0 71.0 (2013)Adult literacy (%) 47.5(2001) 59.7 (2013)Primary school net enrollment (%) 91.8(2005) 91.5 (2010)Secondary school net enrollment (%) 44.6 47.7 (2012)Child malnutrition
(% below 5 years old) Height for age Weight for age
50.842.3
36.0 (2014)32.6 (2014)
Population below national poverty line (%)
48.9 31.5 (2010)
Physicians (per 1,000 people) 0.2(2001) 0.4 (2011)Gini coefficient 33.4 32.1 (2010)Population with access to safe water
(%)76.0 86.9 (2015)
Population with access to improved sanitation (%)
44.5 60.6 (2015)
____________________15 The latest available poverty headcount is derived from the Household Income and Expenditure Survey. The next survey, covering 2015 and 2016, will likely not be
released until 2017.
Poverty Extreme Poverty
2000 2005 2010 2000 2005 2010Bangladesh 48.9 40.0 31.5 34.3 25.1 17.6Urban 35.2 28.4 21.3 19.9 14.6 7.7Rural 52.3 43.8 35.2 37.9 28.6 21.1
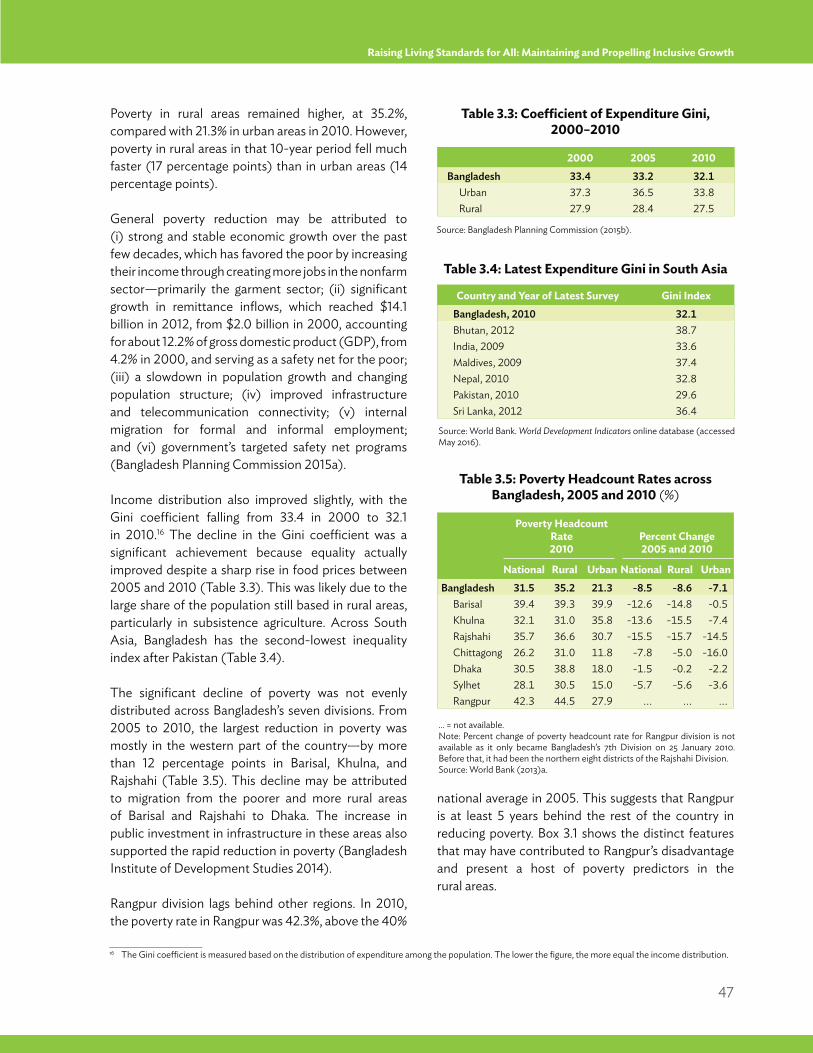
47
Raising Living Standards for All: Maintaining and Propelling Inclusive Growth
Poverty in rural areas remained higher, at 35.2%, compared with 21.3% in urban areas in 2010. However, poverty in rural areas in that 10-year period fell much faster (17 percentage points) than in urban areas (14 percentage points).
General poverty reduction may be attributed to (i) strong and stable economic growth over the past few decades, which has favored the poor by increasing their income through creating more jobs in the nonfarm sector—primarily the garment sector; (ii) significant growth in remittance inflows, which reached $14.1 billion in 2012, from $2.0 billion in 2000, accounting for about 12.2% of gross domestic product (GDP), from 4.2% in 2000, and serving as a safety net for the poor; (iii) a slowdown in population growth and changing population structure; (iv) improved infrastructure and telecommunication connectivity; (v) internal migration for formal and informal employment; and (vi) government’s targeted safety net programs (Bangladesh Planning Commission 2015a).
Income distribution also improved slightly, with the Gini coefficient falling from 33.4 in 2000 to 32.1 in 2010.16 The decline in the Gini coefficient was a significant achievement because equality actually improved despite a sharp rise in food prices between 2005 and 2010 (Table 3.3). This was likely due to the large share of the population still based in rural areas, particularly in subsistence agriculture. Across South Asia, Bangladesh has the second-lowest inequality index after Pakistan (Table 3.4).
The significant decline of poverty was not evenly distributed across Bangladesh’s seven divisions. From 2005 to 2010, the largest reduction in poverty was mostly in the western part of the country—by more than 12 percentage points in Barisal, Khulna, and Rajshahi (Table 3.5). This decline may be attributed to migration from the poorer and more rural areas of Barisal and Rajshahi to Dhaka. The increase in public investment in infrastructure in these areas also supported the rapid reduction in poverty (Bangladesh Institute of Development Studies 2014).
Rangpur division lags behind other regions. In 2010, the poverty rate in Rangpur was 42.3%, above the 40%
national average in 2005. This suggests that Rangpur is at least 5 years behind the rest of the country in reducing poverty. Box 3.1 shows the distinct features that may have contributed to Rangpur’s disadvantage and present a host of poverty predictors in the rural areas.
Table 3.3: Coefficient of Expenditure Gini, 2000–2010
Table 3.4: Latest Expenditure Gini in South Asia
Table 3.5: Poverty Headcount Rates across Bangladesh, 2005 and 2010 (%)
Source: Bangladesh Planning Commission (2015b).
Source: World Bank. World Development Indicators online database (accessed May 2016).
… = not available.Note: Percent change of poverty headcount rate for Rangpur division is not available as it only became Bangladesh’s 7th Division on 25 January 2010. Before that, it had been the northern eight districts of the Rajshahi Division.Source: World Bank (2013)a.
____________________16 The Gini coefficient is measured based on the distribution of expenditure among the population. The lower the figure, the more equal the income distribution.
2000 2005 2010Bangladesh 33.4 33.2 32.1
Urban 37.3 36.5 33.8Rural 27.9 28.4 27.5
Country and Year of Latest Survey Gini IndexBangladesh, 2010 32.1Bhutan, 2012 38.7India, 2009 33.6Maldives, 2009 37.4Nepal, 2010 32.8Pakistan, 2010 29.6Sri Lanka, 2012 36.4
Poverty Headcount Rate2010
Percent Change2005 and 2010
National Rural Urban National Rural UrbanBangladesh 31.5 35.2 21.3 -8.5 -8.6 -7.1
Barisal 39.4 39.3 39.9 -12.6 -14.8 -0.5Khulna 32.1 31.0 35.8 -13.6 -15.5 -7.4Rajshahi 35.7 36.6 30.7 -15.5 -15.7 -14.5Chittagong 26.2 31.0 11.8 -7.8 -5.0 -16.0Dhaka 30.5 38.8 18.0 -1.5 -0.2 -2.2Sylhet 28.1 30.5 15.0 -5.7 -5.6 -3.6Rangpur 42.3 44.5 27.9 ... ... ...
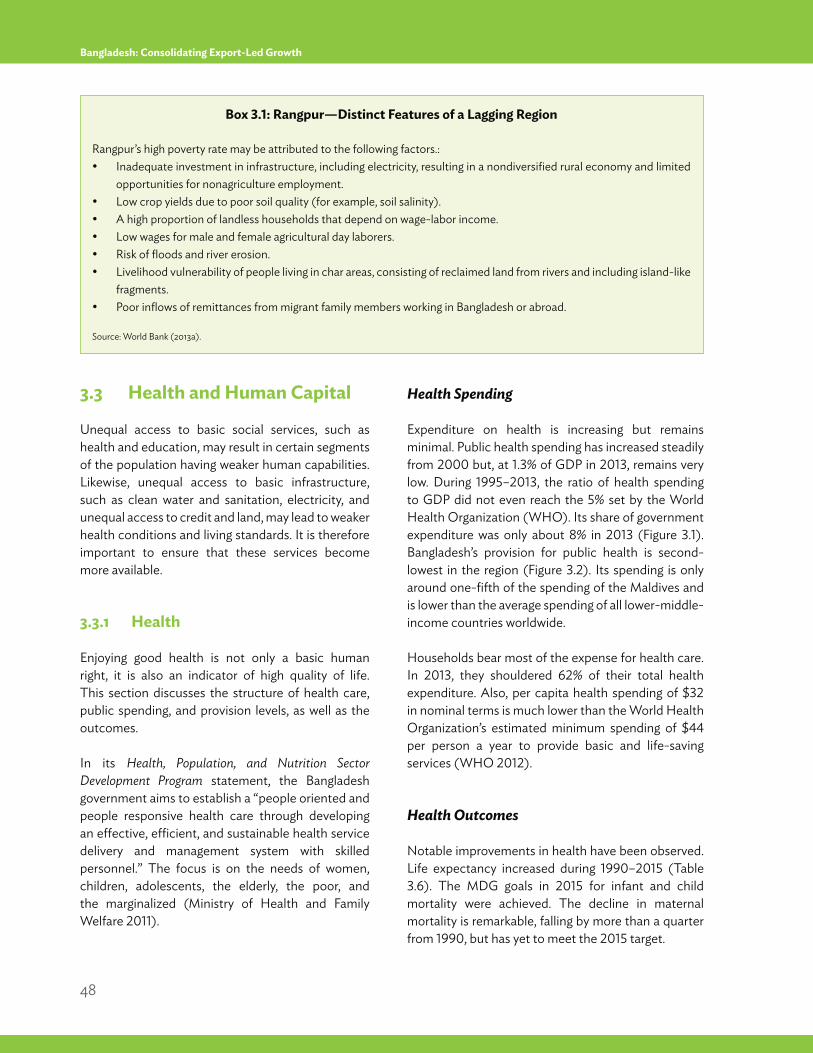
48
Bangladesh: Consolidating Export-Led Growth
3.3 Health and Human Capital
Unequal access to basic social services, such as health and education, may result in certain segments of the population having weaker human capabilities. Likewise, unequal access to basic infrastructure, such as clean water and sanitation, electricity, and unequal access to credit and land, may lead to weaker health conditions and living standards. It is therefore important to ensure that these services become more available.
3.3.1 Health
Enjoying good health is not only a basic human right, it is also an indicator of high quality of life. This section discusses the structure of health care, public spending, and provision levels, as well as the outcomes.
In its Health, Population, and Nutrition Sector Development Program statement, the Bangladesh government aims to establish a “people oriented and people responsive health care through developing an effective, efficient, and sustainable health service delivery and management system with skilled personnel.” The focus is on the needs of women, children, adolescents, the elderly, the poor, and the marginalized (Ministry of Health and Family Welfare 2011).
Health Spending
Expenditure on health is increasing but remains minimal. Public health spending has increased steadily from 2000 but, at 1.3% of GDP in 2013, remains very low. During 1995–2013, the ratio of health spending to GDP did not even reach the 5% set by the World Health Organization (WHO). Its share of government expenditure was only about 8% in 2013 (Figure 3.1). Bangladesh’s provision for public health is second-lowest in the region (Figure 3.2). Its spending is only around one-fifth of the spending of the Maldives and is lower than the average spending of all lower-middle-income countries worldwide.
Households bear most of the expense for health care. In 2013, they shouldered 62% of their total health expenditure. Also, per capita health spending of $32 in nominal terms is much lower than the World Health Organization’s estimated minimum spending of $44 per person a year to provide basic and life-saving services (WHO 2012).
Health Outcomes
Notable improvements in health have been observed. Life expectancy increased during 1990–2015 (Table 3.6). The MDG goals in 2015 for infant and child mortality were achieved. The decline in maternal mortality is remarkable, falling by more than a quarter from 1990, but has yet to meet the 2015 target.
Box 3.1: Rangpur—Distinct Features of a Lagging Region
Rangpur’s high poverty rate may be attributed to the following factors.: Inadequate investment in infrastructure, including electricity, resulting in a nondiversified rural economy and limited
opportunities for nonagriculture employment. Low crop yields due to poor soil quality (for example, soil salinity). A high proportion of landless households that depend on wage-labor income. Low wages for male and female agricultural day laborers. Risk of floods and river erosion. Livelihood vulnerability of people living in char areas, consisting of reclaimed land from rivers and including island-like
fragments. Poor inflows of remittances from migrant family members working in Bangladesh or abroad.
Source: World Bank (2013a).
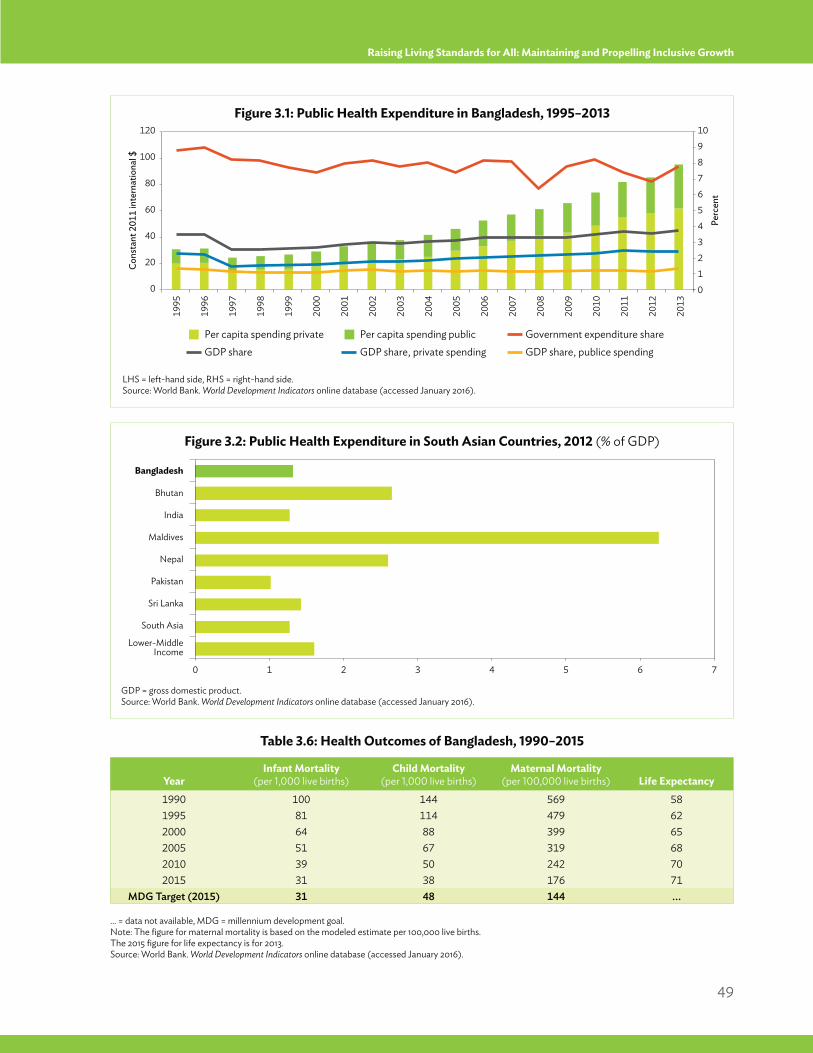
49
Raising Living Standards for All: Maintaining and Propelling Inclusive Growth
Per capita spending publicPer capita spending private Government expenditure share
0
40
20
60
80
100
120 10
9
8
7
5
6
4
3
2
1
0
1998
1999
1995
1996
1997
2000
2001
2002
2003
2004
2005
2006
2007
2008
2009
2010
2011
2012
2013
Cons
tant
201
1 in
tern
atio
nal $
Perc
ent
GDP share GDP share, private spending GDP share, publice spending
0 1 2 3 4 5 6 7
Sri Lanka
South Asia
Pakistan
Lower-MiddleIncome
Maldives
India
Nepal
Bhutan
Bangladesh
Figure 3.1: Public Health Expenditure in Bangladesh, 1995–2013
Figure 3.2: Public Health Expenditure in South Asian Countries, 2012 (% of GDP)
LHS = left-hand side, RHS = right-hand side.Source: World Bank. World Development Indicators online database (accessed January 2016).
GDP = gross domestic product.Source: World Bank. World Development Indicators online database (accessed January 2016).
Table 3.6: Health Outcomes of Bangladesh, 1990–2015
… = data not available, MDG = millennium development goal.Note: The figure for maternal mortality is based on the modeled estimate per 100,000 live births. The 2015 figure for life expectancy is for 2013.Source: World Bank. World Development Indicators online database (accessed January 2016).
YearInfant Mortality
(per 1,000 live births)Child Mortality
(per 1,000 live births)Maternal Mortality
(per 100,000 live births) Life Expectancy1990 100 144 569 581995 81 114 479 622000 64 88 399 652005 51 67 319 682010 39 50 242 702015 31 38 176 71
MDG Target (2015) 31 48 144 ...
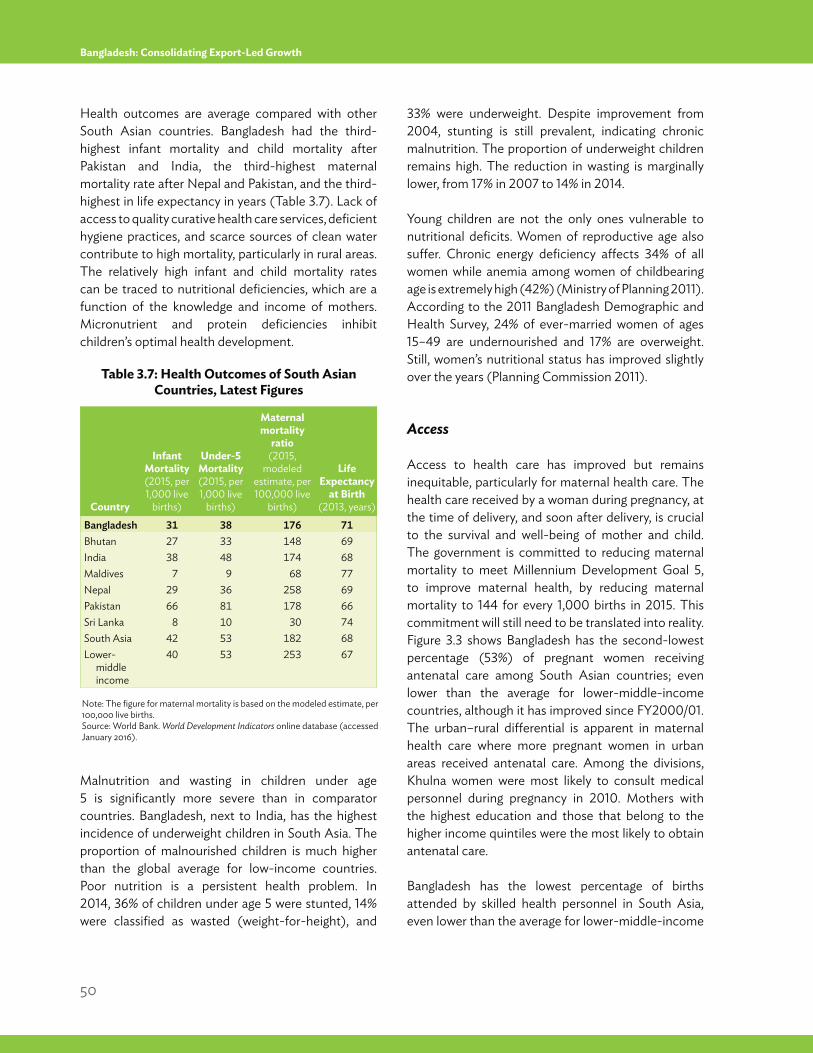
50
Bangladesh: Consolidating Export-Led Growth
Health outcomes are average compared with other South Asian countries. Bangladesh had the third-highest infant mortality and child mortality after Pakistan and India, the third-highest maternal mortality rate after Nepal and Pakistan, and the third-highest in life expectancy in years (Table 3.7). Lack of access to quality curative health care services, deficient hygiene practices, and scarce sources of clean water contribute to high mortality, particularly in rural areas. The relatively high infant and child mortality rates can be traced to nutritional deficiencies, which are a function of the knowledge and income of mothers. Micronutrient and protein deficiencies inhibit children’s optimal health development.
Malnutrition and wasting in children under age 5 is significantly more severe than in comparator countries. Bangladesh, next to India, has the highest incidence of underweight children in South Asia. The proportion of malnourished children is much higher than the global average for low-income countries. Poor nutrition is a persistent health problem. In 2014, 36% of children under age 5 were stunted, 14% were classified as wasted (weight-for-height), and
33% were underweight. Despite improvement from 2004, stunting is still prevalent, indicating chronic malnutrition. The proportion of underweight children remains high. The reduction in wasting is marginally lower, from 17% in 2007 to 14% in 2014.
Young children are not the only ones vulnerable to nutritional deficits. Women of reproductive age also suffer. Chronic energy deficiency affects 34% of all women while anemia among women of childbearing age is extremely high (42%) (Ministry of Planning 2011). According to the 2011 Bangladesh Demographic and Health Survey, 24% of ever-married women of ages 15–49 are undernourished and 17% are overweight. Still, women’s nutritional status has improved slightly over the years (Planning Commission 2011).
Access
Access to health care has improved but remains inequitable, particularly for maternal health care. The health care received by a woman during pregnancy, at the time of delivery, and soon after delivery, is crucial to the survival and well-being of mother and child. The government is committed to reducing maternal mortality to meet Millennium Development Goal 5, to improve maternal health, by reducing maternal mortality to 144 for every 1,000 births in 2015. This commitment will still need to be translated into reality. Figure 3.3 shows Bangladesh has the second-lowest percentage (53%) of pregnant women receiving antenatal care among South Asian countries; even lower than the average for lower-middle-income countries, although it has improved since FY2000/01. The urban–rural differential is apparent in maternal health care where more pregnant women in urban areas received antenatal care. Among the divisions, Khulna women were most likely to consult medical personnel during pregnancy in 2010. Mothers with the highest education and those that belong to the higher income quintiles were the most likely to obtain antenatal care.
Bangladesh has the lowest percentage of births attended by skilled health personnel in South Asia, even lower than the average for lower-middle-income
Table 3.7: Health Outcomes of South Asian Countries, Latest Figures
Note: The figure for maternal mortality is based on the modeled estimate, per 100,000 live births. Source: World Bank. World Development Indicators online database (accessed January 2016).
Country
Infant Mortality(2015, per 1,000 live
births)
Under-5 Mortality (2015, per 1,000 live
births)
Maternal mortality
ratio (2015,
modeled estimate, per 100,000 live
births)
Life Expectancy
at Birth(2013, years)
Bangladesh 31 38 176 71Bhutan 27 33 148 69India 38 48 174 68Maldives 7 9 68 77Nepal 29 36 258 69Pakistan 66 81 178 66Sri Lanka 8 10 30 74South Asia 42 53 182 68Lower-
middle income
40 53 253 67
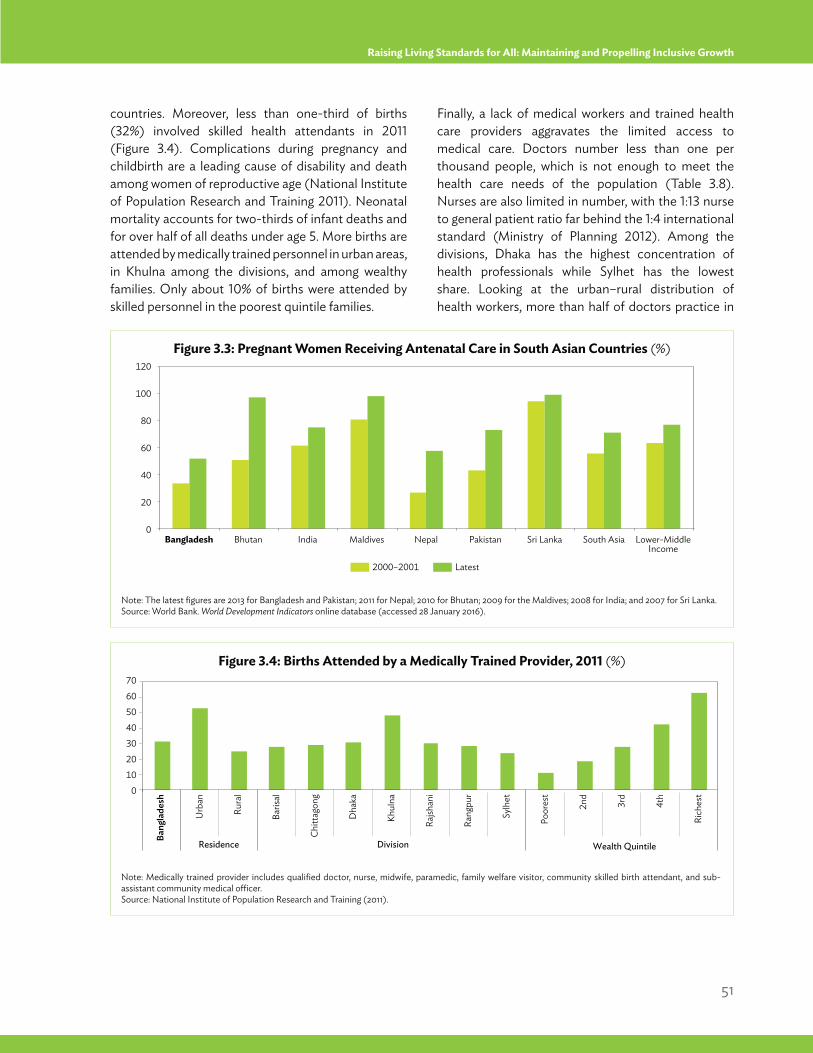
51
Raising Living Standards for All: Maintaining and Propelling Inclusive Growth
countries. Moreover, less than one-third of births (32%) involved skilled health attendants in 2011 (Figure 3.4). Complications during pregnancy and childbirth are a leading cause of disability and death among women of reproductive age (National Institute of Population Research and Training 2011). Neonatal mortality accounts for two-thirds of infant deaths and for over half of all deaths under age 5. More births are attended by medically trained personnel in urban areas, in Khulna among the divisions, and among wealthy families. Only about 10% of births were attended by skilled personnel in the poorest quintile families.
Finally, a lack of medical workers and trained health care providers aggravates the limited access to medical care. Doctors number less than one per thousand people, which is not enough to meet the health care needs of the population (Table 3.8). Nurses are also limited in number, with the 1:13 nurse to general patient ratio far behind the 1:4 international standard (Ministry of Planning 2012). Among the divisions, Dhaka has the highest concentration of health professionals while Sylhet has the lowest share. Looking at the urban–rural distribution of health workers, more than half of doctors practice in
2000–2001 Latest
0
60
40
20
80
100
120
Bangladesh Bhutan India Maldives Nepal Pakistan Sri Lanka South Asia Lower-MiddleIncome
Residence Division Wealth Quintile
0
40302010
6050
70
Urb
an
Bang
lade
sh
Rura
l
Baris
al
Chitt
agon
g
Dha
ka
Khul
na
Rajsh
ani
Rang
pur
Sylh
et
Poor
est
2nd
3rd
Rich
est
4th
Figure 3.3: Pregnant Women Receiving Antenatal Care in South Asian Countries (%)
Figure 3.4: Births Attended by a Medically Trained Provider, 2011 (%)
Note: The latest figures are 2013 for Bangladesh and Pakistan; 2011 for Nepal; 2010 for Bhutan; 2009 for the Maldives; 2008 for India; and 2007 for Sri Lanka. Source: World Bank. World Development Indicators online database (accessed 28 January 2016).
Note: Medically trained provider includes qualified doctor, nurse, midwife, paramedic, family welfare visitor, community skilled birth attendant, and sub-assistant community medical officer.Source: National Institute of Population Research and Training (2011).
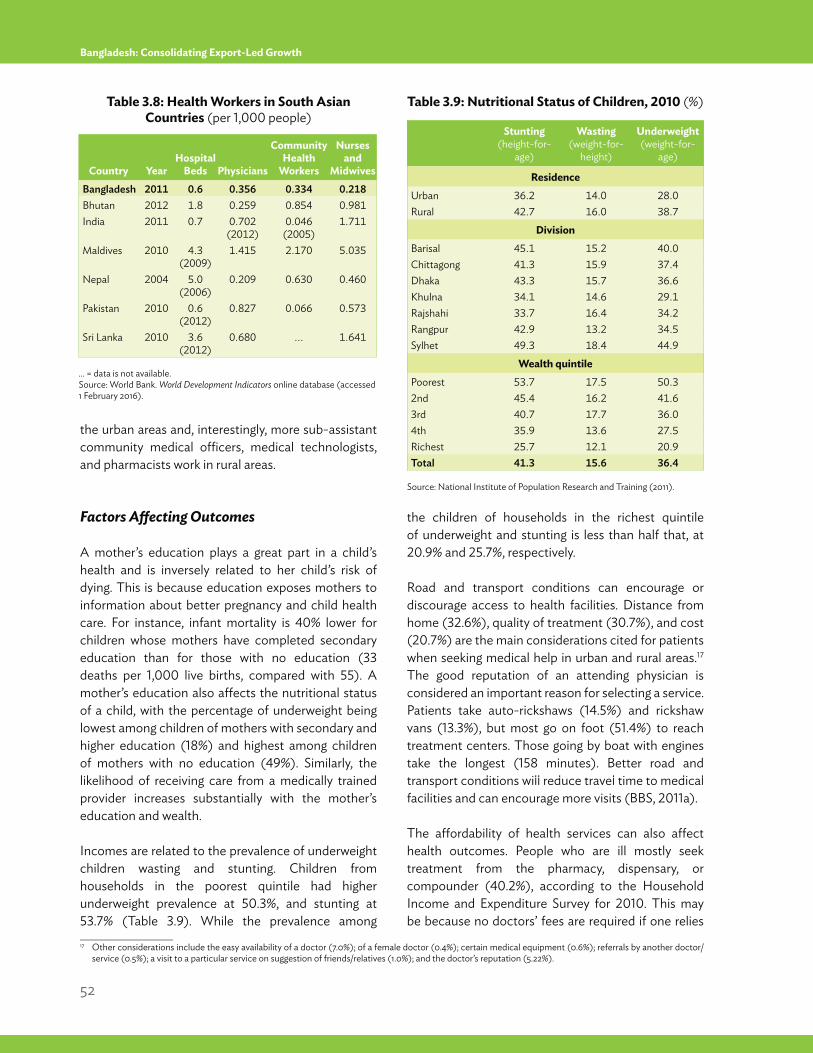
52
Bangladesh: Consolidating Export-Led Growth
the urban areas and, interestingly, more sub-assistant community medical officers, medical technologists, and pharmacists work in rural areas.
Factors Affecting Outcomes
A mother’s education plays a great part in a child’s health and is inversely related to her child’s risk of dying. This is because education exposes mothers to information about better pregnancy and child health care. For instance, infant mortality is 40% lower for children whose mothers have completed secondary education than for those with no education (33 deaths per 1,000 live births, compared with 55). A mother’s education also affects the nutritional status of a child, with the percentage of underweight being lowest among children of mothers with secondary and higher education (18%) and highest among children of mothers with no education (49%). Similarly, the likelihood of receiving care from a medically trained provider increases substantially with the mother’s education and wealth.
Incomes are related to the prevalence of underweight children wasting and stunting. Children from households in the poorest quintile had higher underweight prevalence at 50.3%, and stunting at 53.7% (Table 3.9). While the prevalence among
the children of households in the richest quintile of underweight and stunting is less than half that, at 20.9% and 25.7%, respectively.
Road and transport conditions can encourage or discourage access to health facilities. Distance from home (32.6%), quality of treatment (30.7%), and cost (20.7%) are the main considerations cited for patients when seeking medical help in urban and rural areas.17 The good reputation of an attending physician is considered an important reason for selecting a service. Patients take auto-rickshaws (14.5%) and rickshaw vans (13.3%), but most go on foot (51.4%) to reach treatment centers. Those going by boat with engines take the longest (158 minutes). Better road and transport conditions will reduce travel time to medical facilities and can encourage more visits (BBS, 2011a).
The affordability of health services can also affect health outcomes. People who are ill mostly seek treatment from the pharmacy, dispensary, or compounder (40.2%), according to the Household Income and Expenditure Survey for 2010. This may be because no doctors’ fees are required if one relies
Table 3.8: Health Workers in South Asian Countries (per 1,000 people)
Table 3.9: Nutritional Status of Children, 2010 (%)
… = data is not available.Source: World Bank. World Development Indicators online database (accessed 1 February 2016).
Source: National Institute of Population Research and Training (2011).
Country YearHospital
Beds Physicians
Community Health
Workers
Nurses and
MidwivesBangladesh 2011 0.6 0.356 0.334 0.218Bhutan 2012 1.8 0.259 0.854 0.981India 2011 0.7 0.702
(2012)0.046
(2005)1.711
Maldives 2010 4.3 (2009)
1.415 2.170 5.035
Nepal 2004 5.0 (2006)
0.209 0.630 0.460
Pakistan 2010 0.6 (2012)
0.827 0.066 0.573
Sri Lanka 2010 3.6 (2012)
0.680 ... 1.641
Stunting (height-for-
age)
Wasting (weight-for-
height)
Underweight (weight-for-
age)
ResidenceUrban 36.2 14.0 28.0Rural 42.7 16.0 38.7
DivisionBarisal 45.1 15.2 40.0Chittagong 41.3 15.9 37.4Dhaka 43.3 15.7 36.6Khulna 34.1 14.6 29.1Rajshahi 33.7 16.4 34.2Rangpur 42.9 13.2 34.5Sylhet 49.3 18.4 44.9
Wealth quintilePoorest 53.7 17.5 50.32nd 45.4 16.2 41.63rd 40.7 17.7 36.04th 35.9 13.6 27.5Richest 25.7 12.1 20.9Total 41.3 15.6 36.4
____________________17 Other considerations include the easy availability of a doctor (7.0%); of a female doctor (0.4%); certain medical equipment (0.6%); referrals by another doctor/
service (0.5%); a visit to a particular service on suggestion of friends/relatives (1.0%); and the doctor’s reputation (5.22%).
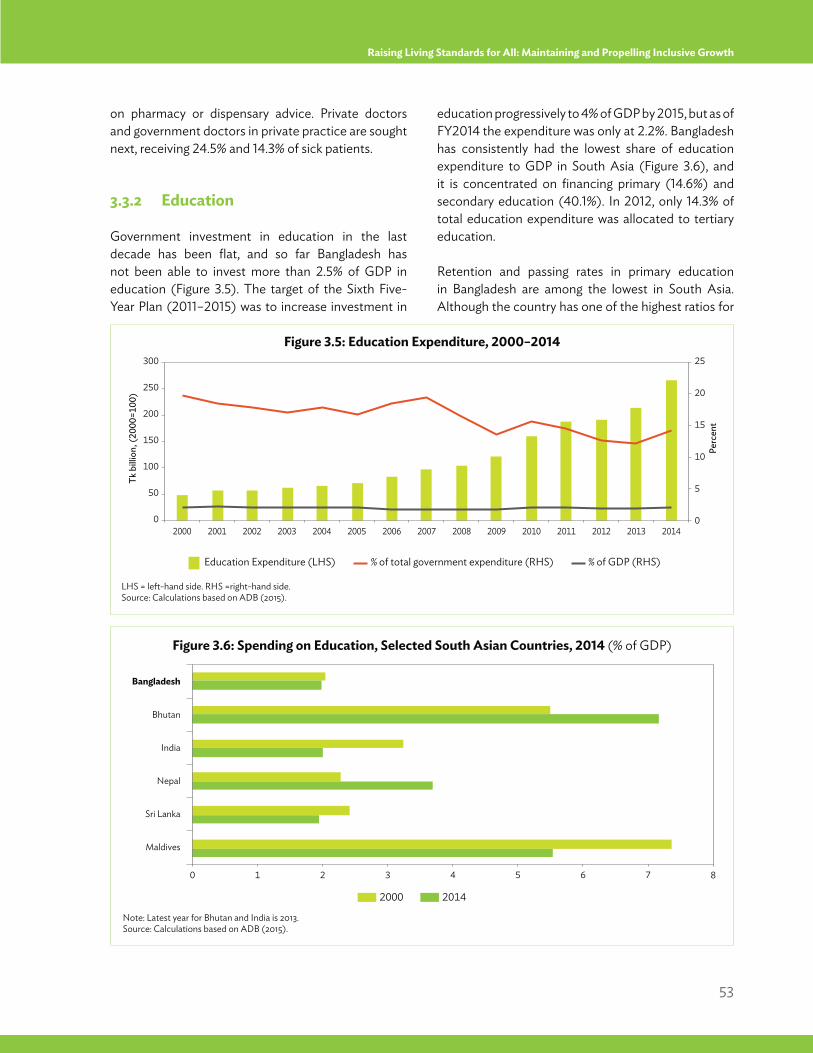
53
Raising Living Standards for All: Maintaining and Propelling Inclusive Growth
education progressively to 4% of GDP by 2015, but as of FY2014 the expenditure was only at 2.2%. Bangladesh has consistently had the lowest share of education expenditure to GDP in South Asia (Figure 3.6), and it is concentrated on financing primary (14.6%) and secondary education (40.1%). In 2012, only 14.3% of total education expenditure was allocated to tertiary education.
Retention and passing rates in primary education in Bangladesh are among the lowest in South Asia. Although the country has one of the highest ratios for
on pharmacy or dispensary advice. Private doctors and government doctors in private practice are sought next, receiving 24.5% and 14.3% of sick patients.
3.3.2 Education
Government investment in education in the last decade has been flat, and so far Bangladesh has not been able to invest more than 2.5% of GDP in education (Figure 3.5). The target of the Sixth Five-Year Plan (2011–2015) was to increase investment in
Education Expenditure (LHS) % of total government expenditure (RHS)
0
100
50
150
200
250
300 25
20
15
10
5
0
Tk b
illio
n, (2
000=
100)
Perc
ent
% of GDP (RHS)
2000 2001 2002 2003 2004 2005 2007 2009 2011 20132006 2008 2010 2012 2014
2000 2014
0 1 2 3 4 5 6 7 8
Maldives
Nepal
India
Sri Lanka
Bhutan
Bangladesh
Figure 3.5: Education Expenditure, 2000–2014
Figure 3.6: Spending on Education, Selected South Asian Countries, 2014 (% of GDP)
LHS = left-hand side. RHS =right-hand side.Source: Calculations based on ADB (2015).
Note: Latest year for Bhutan and India is 2013.Source: Calculations based on ADB (2015).
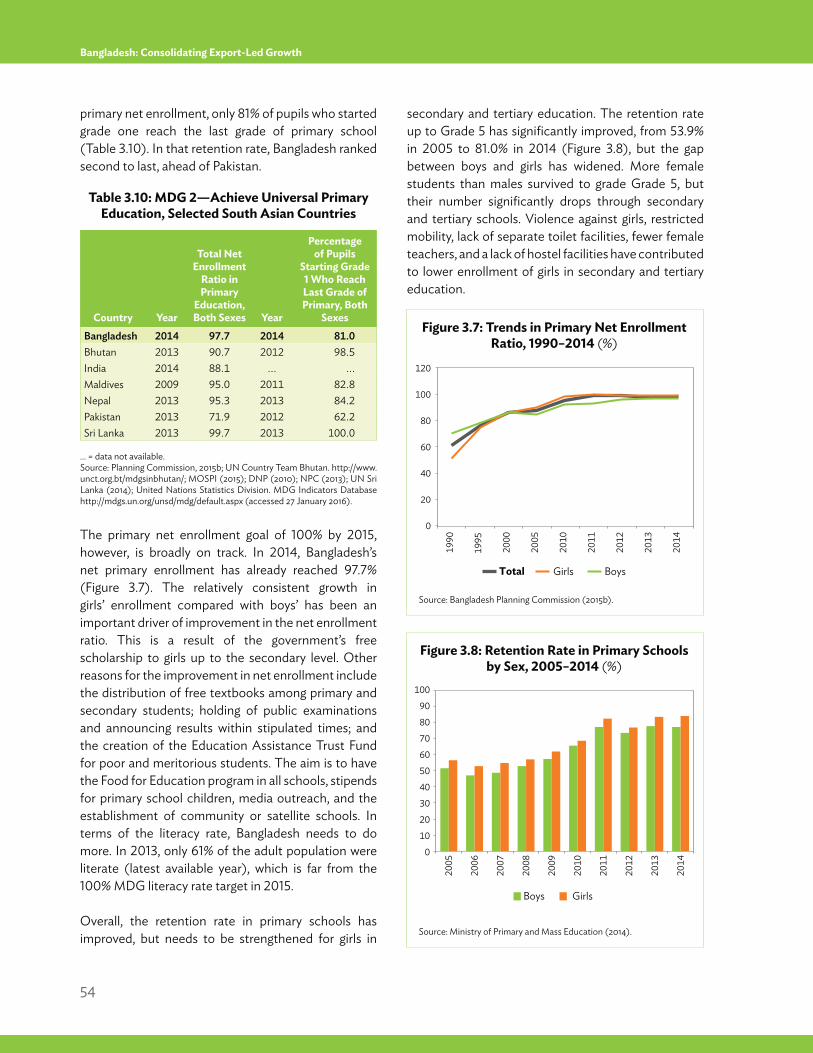
54
Bangladesh: Consolidating Export-Led Growth
primary net enrollment, only 81% of pupils who started grade one reach the last grade of primary school (Table 3.10). In that retention rate, Bangladesh ranked second to last, ahead of Pakistan.
The primary net enrollment goal of 100% by 2015, however, is broadly on track. In 2014, Bangladesh’s net primary enrollment has already reached 97.7% (Figure 3.7). The relatively consistent growth in girls’ enrollment compared with boys’ has been an important driver of improvement in the net enrollment ratio. This is a result of the government’s free scholarship to girls up to the secondary level. Other reasons for the improvement in net enrollment include the distribution of free textbooks among primary and secondary students; holding of public examinations and announcing results within stipulated times; and the creation of the Education Assistance Trust Fund for poor and meritorious students. The aim is to have the Food for Education program in all schools, stipends for primary school children, media outreach, and the establishment of community or satellite schools. In terms of the literacy rate, Bangladesh needs to do more. In 2013, only 61% of the adult population were literate (latest available year), which is far from the 100% MDG literacy rate target in 2015.
Overall, the retention rate in primary schools has improved, but needs to be strengthened for girls in
secondary and tertiary education. The retention rate up to Grade 5 has significantly improved, from 53.9% in 2005 to 81.0% in 2014 (Figure 3.8), but the gap between boys and girls has widened. More female students than males survived to grade Grade 5, but their number significantly drops through secondary and tertiary schools. Violence against girls, restricted mobility, lack of separate toilet facilities, fewer female teachers, and a lack of hostel facilities have contributed to lower enrollment of girls in secondary and tertiary education.
Table 3.10: MDG 2—Achieve Universal Primary Education, Selected South Asian Countries
… = data not available.Source: Planning Commission, 2015b; UN Country Team Bhutan. http://www.unct.org.bt/mdgsinbhutan/; MOSPI (2015); DNP (2010); NPC (2013); UN Sri Lanka (2014); United Nations Statistics Division. MDG Indicators Database http://mdgs.un.org/unsd/mdg/default.aspx (accessed 27 January 2016).
Country Year
Total Net Enrollment
Ratio in Primary
Education, Both Sexes Year
Percentage of Pupils
Starting Grade 1 Who Reach Last Grade of Primary, Both
SexesBangladesh 2014 97.7 2014 81.0Bhutan 2013 90.7 2012 98.5India 2014 88.1 ... ...Maldives 2009 95.0 2011 82.8Nepal 2013 95.3 2013 84.2Pakistan 2013 71.9 2012 62.2Sri Lanka 2013 99.7 2013 100.0
Total
0
120
80
60
40
20
100
1990
1995
2000
2005
2010
2011
2013
2014
2012
Girls Boys
Figure 3.7: Trends in Primary Net Enrollment Ratio, 1990–2014 (%)
Figure 3.8: Retention Rate in Primary Schools by Sex, 2005–2014 (%)
Source: Bangladesh Planning Commission (2015b).
Source: Ministry of Primary and Mass Education (2014).
0
90
80
70
60
50
40
10
20
30
100
Boys Girls
2005
2006
2007
2008
2009
2010
2012
2011
2013
2014
55
Raising Living Standards for All: Maintaining and Propelling Inclusive Growth
Dropout and repetition rates have also improved in the recent years. Dropout rates declined nationally from 47.2% in 2005 to 20.9% in 2014. Still, regional disparities persist (Ministry of Primary and Mass Education 2014). Poverty and other hidden costs of education are the biggest causes for dropouts, especially in rural areas.
The government embarked on a host of reforms to improve quality, particularly in secondary education. Among the initiatives, the examination system in secondary education was replaced with school-based assessment; some 20,500 laptops, multimedia projects, speakers, and internet modems were distributed to secondary and higher secondary institutions, including madrassa; secondary school teachers received training in computer applications. Other reforms include the reorganization of governing bodies of private educational institutions; the formation in each school of the Oversight Committees for Supervision of Teaching at Classrooms; the guarantee of monthly salary payments at well-performing schools; the development and modernization of secondary, technical and madrassa curriculums; the establishment of retirement and welfare fund for nongovernment teachers; and the setup of 11 foreign language centers.
Despite these initiatives, issues in the education system that still require urgent attention include :
Unqualified teachers in primary schools. According to the Annual Primary School Census 2014, many teachers in the primary schools do not have “Certificate in Education” training. The one-year training certificate is supposed to be a requirement for teaching in primary schools. In 2013, only 65% of head teachers had received training in school management and leadership. This may be a factor in a recent study finding that a child who had completed Grade 5 is only 11.7% more likely to be competent at basic arithmetic (51.7% versus 40.2%) than a child with no schooling at all (Asadullah and Chaudhury 2013). Only about 25% of Grade 5 students have mastered Bangla and 33% have mastered mathematics at their curriculum level. Pritchett and Banerji (2013) calls this a “serious learning
crisis,” where students who go to school have very little to show from it.
Low quality of school infrastructure. In 2013, only 76% of primary schools were in good condition. Improved toilets and water supply are priorities for improvement in primary schools. Access to quality facilities is directly associated with quality of retention and attendance rates of students, especially girls. In 2014, 17% of schools reported having no toilet. Only 28% of schools meet the standard class size of 40 students per classroom; and 71% meet the standard classroom size with a dimension of at least 17 x 19.6 feet.
However, the number of poor students in school is increasing. According to the latest Demographic and Health Survey (DHS) data, the net attendance rate at primary school for the bottom quintile rose from 56% in 1993 to 77% in 2011, decreasing the gap between the richest and poorest quintile from 26% to just 5%. Similarly, the secondary net attendance rate for the bottom quintile rose from 3% to 20% during the same period, narrowing the gap between the richest and poorest quintile from 45% to 27%.
The government’s education reforms seem to have paid off and have resulted to fewer illiterates and a general improvement in the stock of human capital. The share of illiterates in the extreme poverty groups has gone down from 64% to 46% in just 7 years. This bodes well for livelihoods, and reflects progress in the generation of a more productive and well-prepared future work force.
3.3.3 Technical and Vocational Education and Training
Technical and vocational education and training (TVET) produces the skills that industry needs. In Bangladesh, TVET comprises formal and nonformal venues. Formal TVET is extensive and divided into three levels: basic training programs, certifications, and diplomas. Basic training focuses on practical skills and lasts between 3 and 6 months, with 360 hours of total instruction. It requires a minimum of eighth grade education though with a waiver for those with 1 year
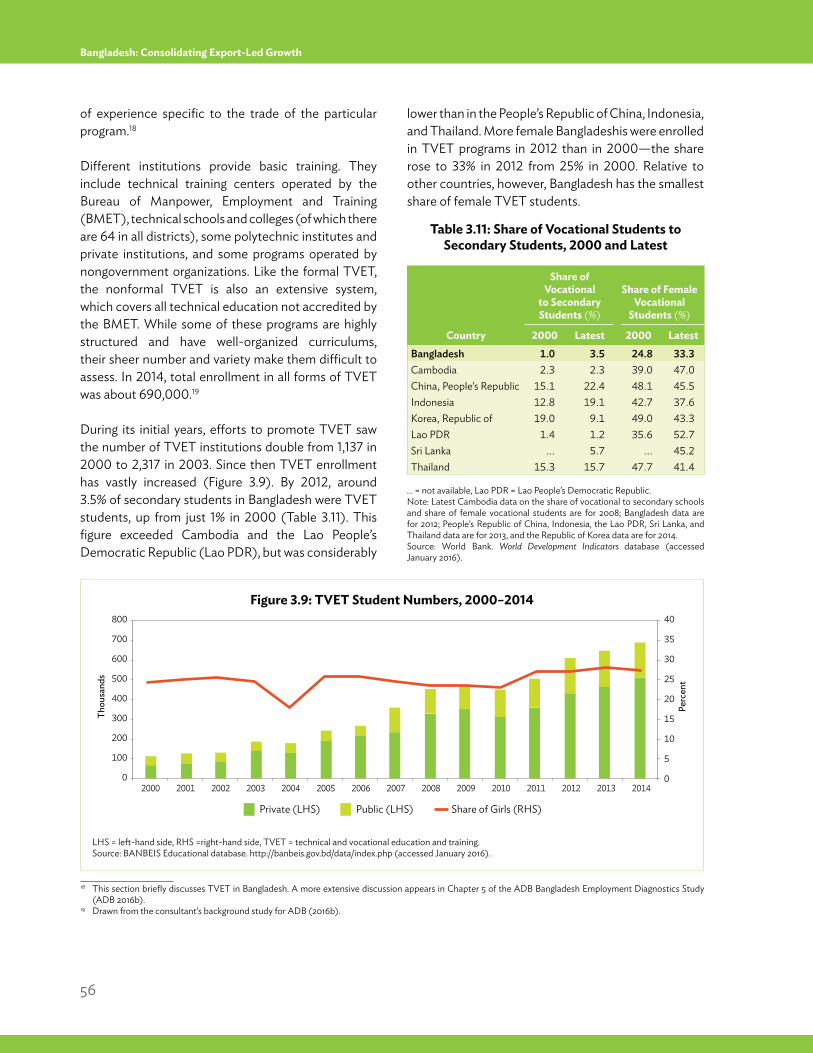
56
Bangladesh: Consolidating Export-Led Growth
of experience specific to the trade of the particular program.18
Different institutions provide basic training. They include technical training centers operated by the Bureau of Manpower, Employment and Training (BMET), technical schools and colleges (of which there are 64 in all districts), some polytechnic institutes and private institutions, and some programs operated by nongovernment organizations. Like the formal TVET, the nonformal TVET is also an extensive system, which covers all technical education not accredited by the BMET. While some of these programs are highly structured and have well-organized curriculums, their sheer number and variety make them difficult to assess. In 2014, total enrollment in all forms of TVET was about 690,000.19
During its initial years, efforts to promote TVET saw the number of TVET institutions double from 1,137 in 2000 to 2,317 in 2003. Since then TVET enrollment has vastly increased (Figure 3.9). By 2012, around 3.5% of secondary students in Bangladesh were TVET students, up from just 1% in 2000 (Table 3.11). This figure exceeded Cambodia and the Lao People’s Democratic Republic (Lao PDR), but was considerably
lower than in the People’s Republic of China, Indonesia, and Thailand. More female Bangladeshis were enrolled in TVET programs in 2012 than in 2000—the share rose to 33% in 2012 from 25% in 2000. Relative to other countries, however, Bangladesh has the smallest share of female TVET students.
Private (LHS) Public (LHS) Share of Girls (RHS)
0
100
200
400
300
500
600
700
800 40
35
30
25
20
10
15
5
0
Thou
sand
s
Perc
ent
2000 2001 2002 2003 2004 2005 2007 2009 2011 20132006 2008 2010 2012 2014
Figure 3.9: TVET Student Numbers, 2000–2014
LHS = left-hand side, RHS =right-hand side, TVET = technical and vocational education and training.Source: BANBEIS Educational database. http://banbeis.gov.bd/data/index.php (accessed January 2016).
Table 3.11: Share of Vocational Students to Secondary Students, 2000 and Latest
… = not available, Lao PDR = Lao People’s Democratic Republic.Note: Latest Cambodia data on the share of vocational to secondary schools and share of female vocational students are for 2008; Bangladesh data are for 2012; People’s Republic of China, Indonesia, the Lao PDR, Sri Lanka, and Thailand data are for 2013, and the Republic of Korea data are for 2014. Source: World Bank. World Development Indicators database (accessed January 2016).
Country
Share of Vocational
to Secondary Students (%)
Share of Female Vocational
Students (%)
2000 Latest 2000 LatestBangladesh 1.0 3.5 24.8 33.3Cambodia 2.3 2.3 39.0 47.0China, People’s Republic 15.1 22.4 48.1 45.5Indonesia 12.8 19.1 42.7 37.6Korea, Republic of 19.0 9.1 49.0 43.3Lao PDR 1.4 1.2 35.6 52.7Sri Lanka ... 5.7 ... 45.2Thailand 15.3 15.7 47.7 41.4
____________________18 This section briefly discusses TVET in Bangladesh. A more extensive discussion appears in Chapter 5 of the ADB Bangladesh Employment Diagnostics Study
(ADB 2016b).19 Drawn from the consultant’s background study for ADB (2016b).
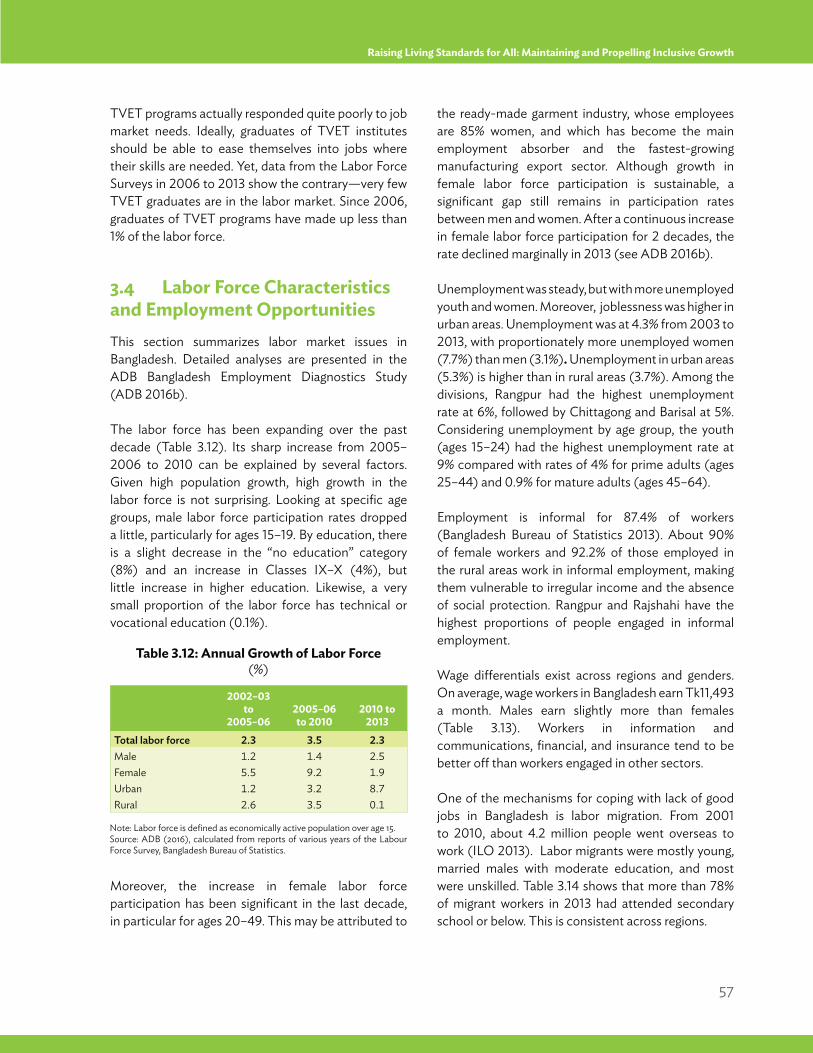
57
Raising Living Standards for All: Maintaining and Propelling Inclusive Growth
TVET programs actually responded quite poorly to job market needs. Ideally, graduates of TVET institutes should be able to ease themselves into jobs where their skills are needed. Yet, data from the Labor Force Surveys in 2006 to 2013 show the contrary—very few TVET graduates are in the labor market. Since 2006, graduates of TVET programs have made up less than 1% of the labor force.
3.4 Labor Force Characteristics and Employment OpportunitiesThis section summarizes labor market issues in Bangladesh. Detailed analyses are presented in the ADB Bangladesh Employment Diagnostics Study (ADB 2016b).
The labor force has been expanding over the past decade (Table 3.12). Its sharp increase from 2005–2006 to 2010 can be explained by several factors. Given high population growth, high growth in the labor force is not surprising. Looking at specific age groups, male labor force participation rates dropped a little, particularly for ages 15–19. By education, there is a slight decrease in the “no education” category (8%) and an increase in Classes IX–X (4%), but little increase in higher education. Likewise, a very small proportion of the labor force has technical or vocational education (0.1%).
Moreover, the increase in female labor force participation has been significant in the last decade, in particular for ages 20–49. This may be attributed to
the ready-made garment industry, whose employees are 85% women, and which has become the main employment absorber and the fastest-growing manufacturing export sector. Although growth in female labor force participation is sustainable, a significant gap still remains in participation rates between men and women. After a continuous increase in female labor force participation for 2 decades, the rate declined marginally in 2013 (see ADB 2016b).
Unemployment was steady, but with more unemployed youth and women. Moreover, joblessness was higher in urban areas. Unemployment was at 4.3% from 2003 to 2013, with proportionately more unemployed women (7.7%) than men (3.1%). Unemployment in urban areas (5.3%) is higher than in rural areas (3.7%). Among the divisions, Rangpur had the highest unemployment rate at 6%, followed by Chittagong and Barisal at 5%. Considering unemployment by age group, the youth (ages 15–24) had the highest unemployment rate at 9% compared with rates of 4% for prime adults (ages 25–44) and 0.9% for mature adults (ages 45–64).
Employment is informal for 87.4% of workers (Bangladesh Bureau of Statistics 2013). About 90% of female workers and 92.2% of those employed in the rural areas work in informal employment, making them vulnerable to irregular income and the absence of social protection. Rangpur and Rajshahi have the highest proportions of people engaged in informal employment.
Wage differentials exist across regions and genders. On average, wage workers in Bangladesh earn Tk11,493 a month. Males earn slightly more than females (Table 3.13). Workers in information and communications, financial, and insurance tend to be better off than workers engaged in other sectors.
One of the mechanisms for coping with lack of good jobs in Bangladesh is labor migration. From 2001 to 2010, about 4.2 million people went overseas to work (ILO 2013). Labor migrants were mostly young, married males with moderate education, and most were unskilled. Table 3.14 shows that more than 78% of migrant workers in 2013 had attended secondary school or below. This is consistent across regions.
Table 3.12: Annual Growth of Labor Force (%)
Note: Labor force is defined as economically active population over age 15.Source: ADB (2016), calculated from reports of various years of the Labour Force Survey, Bangladesh Bureau of Statistics.
2002–03 to
2005–062005–06 to 2010
2010 to 2013
Total labor force 2.3 3.5 2.3Male 1.2 1.4 2.5Female 5.5 9.2 1.9Urban 1.2 3.2 8.7Rural 2.6 3.5 0.1
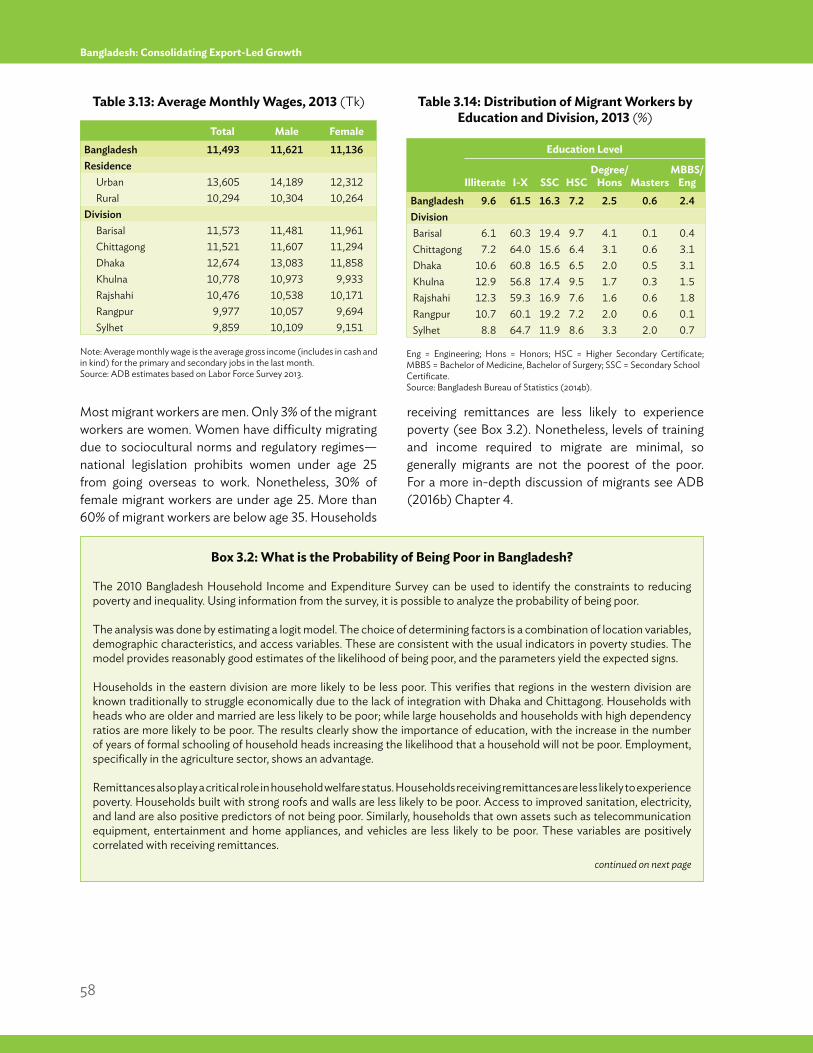
58
Bangladesh: Consolidating Export-Led Growth
Most migrant workers are men. Only 3% of the migrant workers are women. Women have difficulty migrating due to sociocultural norms and regulatory regimes—national legislation prohibits women under age 25 from going overseas to work. Nonetheless, 30% of female migrant workers are under age 25. More than 60% of migrant workers are below age 35. Households
receiving remittances are less likely to experience poverty (see Box 3.2). Nonetheless, levels of training and income required to migrate are minimal, so generally migrants are not the poorest of the poor. For a more in-depth discussion of migrants see ADB (2016b) Chapter 4.
Table 3.13: Average Monthly Wages, 2013 (Tk) Table 3.14: Distribution of Migrant Workers by Education and Division, 2013 (%)
Note: Average monthly wage is the average gross income (includes in cash and in kind) for the primary and secondary jobs in the last month. Source: ADB estimates based on Labor Force Survey 2013.
Eng = Engineering; Hons = Honors; HSC = Higher Secondary Certificate; MBBS = Bachelor of Medicine, Bachelor of Surgery; SSC = Secondary SchoolCertificate.Source: Bangladesh Bureau of Statistics (2014b).
Total Male FemaleBangladesh 11,493 11,621 11,136Residence
Urban 13,605 14,189 12,312Rural 10,294 10,304 10,264
DivisionBarisal 11,573 11,481 11,961Chittagong 11,521 11,607 11,294Dhaka 12,674 13,083 11,858Khulna 10,778 10,973 9,933Rajshahi 10,476 10,538 10,171Rangpur 9,977 10,057 9,694Sylhet 9,859 10,109 9,151
Education Level
Illiterate I-X SSC HSCDegree/
Hons MastersMBBS/
EngBangladesh 9.6 61.5 16.3 7.2 2.5 0.6 2.4DivisionBarisal 6.1 60.3 19.4 9.7 4.1 0.1 0.4Chittagong 7.2 64.0 15.6 6.4 3.1 0.6 3.1Dhaka 10.6 60.8 16.5 6.5 2.0 0.5 3.1Khulna 12.9 56.8 17.4 9.5 1.7 0.3 1.5Rajshahi 12.3 59.3 16.9 7.6 1.6 0.6 1.8Rangpur 10.7 60.1 19.2 7.2 2.0 0.6 0.1Sylhet 8.8 64.7 11.9 8.6 3.3 2.0 0.7
Box 3.2: What is the Probability of Being Poor in Bangladesh?
The 2010 Bangladesh Household Income and Expenditure Survey can be used to identify the constraints to reducing poverty and inequality. Using information from the survey, it is possible to analyze the probability of being poor.
The analysis was done by estimating a logit model. The choice of determining factors is a combination of location variables, demographic characteristics, and access variables. These are consistent with the usual indicators in poverty studies. The model provides reasonably good estimates of the likelihood of being poor, and the parameters yield the expected signs.
Households in the eastern division are more likely to be less poor. This verifies that regions in the western division are known traditionally to struggle economically due to the lack of integration with Dhaka and Chittagong. Households with heads who are older and married are less likely to be poor; while large households and households with high dependency ratios are more likely to be poor. The results clearly show the importance of education, with the increase in the number of years of formal schooling of household heads increasing the likelihood that a household will not be poor. Employment, specifically in the agriculture sector, shows an advantage.
Remittances also play a critical role in household welfare status. Households receiving remittances are less likely to experience poverty. Households built with strong roofs and walls are less likely to be poor. Access to improved sanitation, electricity, and land are also positive predictors of not being poor. Similarly, households that own assets such as telecommunication equipment, entertainment and home appliances, and vehicles are less likely to be poor. These variables are positively correlated with receiving remittances.
continued on next page
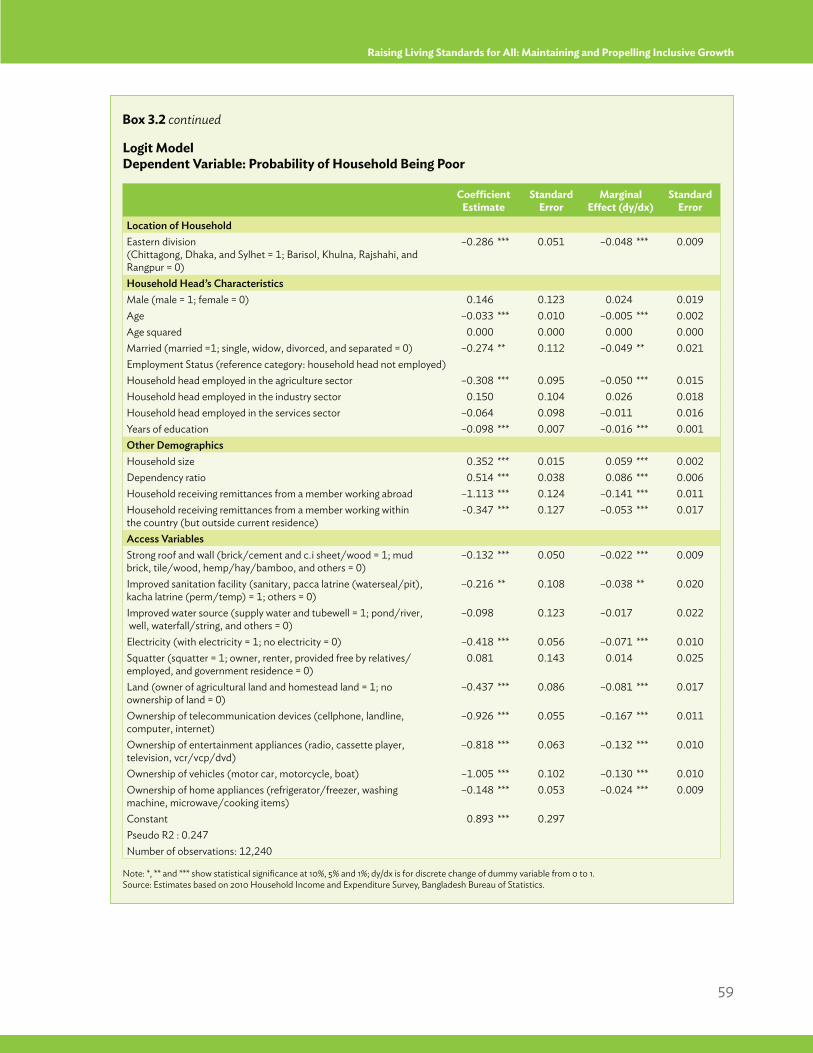
59
Raising Living Standards for All: Maintaining and Propelling Inclusive Growth
Box 3.2 continued
Coefficient Estimate
Standard Error
Marginal Effect (dy/dx)
Standard Error
Location of HouseholdEastern division(Chittagong, Dhaka, and Sylhet = 1; Barisol, Khulna, Rajshahi, and Rangpur = 0)
–0.286 *** 0.051 –0.048 *** 0.009
Household Head’s CharacteristicsMale (male = 1; female = 0) 0.146 0.123 0.024 0.019Age –0.033 *** 0.010 –0.005 *** 0.002Age squared 0.000 0.000 0.000 0.000Married (married =1; single, widow, divorced, and separated = 0) –0.274 ** 0.112 –0.049 ** 0.021Employment Status (reference category: household head not employed)Household head employed in the agriculture sector –0.308 *** 0.095 –0.050 *** 0.015Household head employed in the industry sector 0.150 0.104 0.026 0.018Household head employed in the services sector –0.064 0.098 –0.011 0.016Years of education –0.098 *** 0.007 –0.016 *** 0.001Other DemographicsHousehold size 0.352 *** 0.015 0.059 *** 0.002Dependency ratio 0.514 *** 0.038 0.086 *** 0.006Household receiving remittances from a member working abroad –1.113 *** 0.124 –0.141 *** 0.011Household receiving remittances from a member working within the country (but outside current residence)
-0.347 *** 0.127 –0.053 *** 0.017
Access VariablesStrong roof and wall (brick/cement and c.i sheet/wood = 1; mud brick, tile/wood, hemp/hay/bamboo, and others = 0)
–0.132 *** 0.050 –0.022 *** 0.009
Improved sanitation facility (sanitary, pacca latrine (waterseal/pit), kacha latrine (perm/temp) = 1; others = 0)
–0.216 ** 0.108 –0.038 ** 0.020
Improved water source (supply water and tubewell = 1; pond/river, well, waterfall/string, and others = 0)
–0.098 0.123 –0.017 0.022
Electricity (with electricity = 1; no electricity = 0) –0.418 *** 0.056 –0.071 *** 0.010Squatter (squatter = 1; owner, renter, provided free by relatives/employed, and government residence = 0)
0.081 0.143 0.014 0.025
Land (owner of agricultural land and homestead land = 1; no ownership of land = 0)
–0.437 *** 0.086 –0.081 *** 0.017
Ownership of telecommunication devices (cellphone, landline, computer, internet)
–0.926 *** 0.055 –0.167 *** 0.011
Ownership of entertainment appliances (radio, cassette player, television, vcr/vcp/dvd)
–0.818 *** 0.063 –0.132 *** 0.010
Ownership of vehicles (motor car, motorcycle, boat) –1.005 *** 0.102 –0.130 *** 0.010Ownership of home appliances (refrigerator/freezer, washing machine, microwave/cooking items)
–0.148 *** 0.053 –0.024 *** 0.009
Constant 0.893 *** 0.297Pseudo R2 : 0.247Number of observations: 12,240
Note: *, ** and *** show statistical significance at 10%, 5% and 1%; dy/dx is for discrete change of dummy variable from 0 to 1.Source: Estimates based on 2010 Household Income and Expenditure Survey, Bangladesh Bureau of Statistics.
Logit ModelDependent Variable: Probability of Household Being Poor
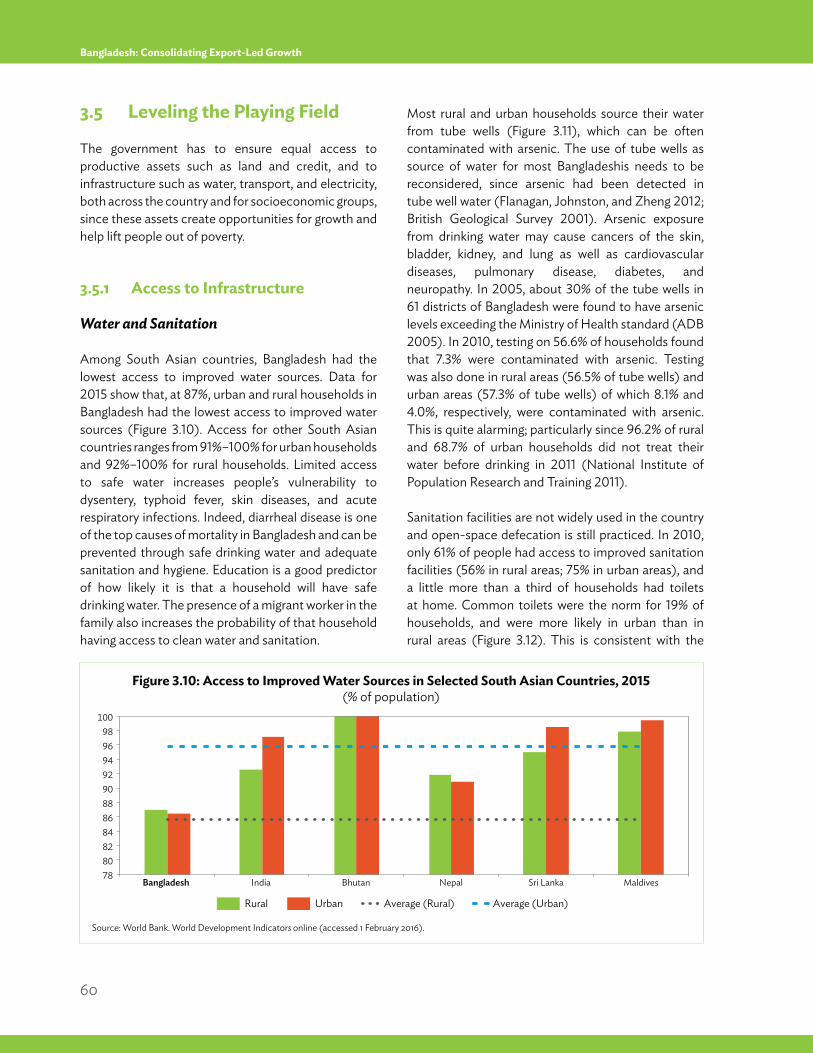
60
Bangladesh: Consolidating Export-Led Growth
3.5 Leveling the Playing Field
The government has to ensure equal access to productive assets such as land and credit, and to infrastructure such as water, transport, and electricity, both across the country and for socioeconomic groups, since these assets create opportunities for growth and help lift people out of poverty.
3.5.1 Access to Infrastructure
Water and Sanitation
Among South Asian countries, Bangladesh had the lowest access to improved water sources. Data for 2015 show that, at 87%, urban and rural households in Bangladesh had the lowest access to improved water sources (Figure 3.10). Access for other South Asian countries ranges from 91%–100% for urban households and 92%–100% for rural households. Limited access to safe water increases people’s vulnerability to dysentery, typhoid fever, skin diseases, and acute respiratory infections. Indeed, diarrheal disease is one of the top causes of mortality in Bangladesh and can be prevented through safe drinking water and adequate sanitation and hygiene. Education is a good predictor of how likely it is that a household will have safe drinking water. The presence of a migrant worker in the family also increases the probability of that household having access to clean water and sanitation.
Most rural and urban households source their water from tube wells (Figure 3.11), which can be often contaminated with arsenic. The use of tube wells as source of water for most Bangladeshis needs to be reconsidered, since arsenic had been detected in tube well water (Flanagan, Johnston, and Zheng 2012; British Geological Survey 2001). Arsenic exposure from drinking water may cause cancers of the skin, bladder, kidney, and lung as well as cardiovascular diseases, pulmonary disease, diabetes, and neuropathy. In 2005, about 30% of the tube wells in 61 districts of Bangladesh were found to have arsenic levels exceeding the Ministry of Health standard (ADB 2005). In 2010, testing on 56.6% of households found that 7.3% were contaminated with arsenic. Testing was also done in rural areas (56.5% of tube wells) and urban areas (57.3% of tube wells) of which 8.1% and 4.0%, respectively, were contaminated with arsenic. This is quite alarming; particularly since 96.2% of rural and 68.7% of urban households did not treat their water before drinking in 2011 (National Institute of Population Research and Training 2011).
Sanitation facilities are not widely used in the country and open-space defecation is still practiced. In 2010, only 61% of people had access to improved sanitation facilities (56% in rural areas; 75% in urban areas), and a little more than a third of households had toilets at home. Common toilets were the norm for 19% of households, and were more likely in urban than in rural areas (Figure 3.12). This is consistent with the
UrbanRural Average (Rural)
78
86848280
88
9290
949698
100
Average (Urban)
Bangladesh India Bhutan Nepal Sri Lanka Maldives
Figure 3.10: Access to Improved Water Sources in Selected South Asian Countries, 2015(% of population)
Source: World Bank. World Development Indicators online (accessed 1 February 2016).
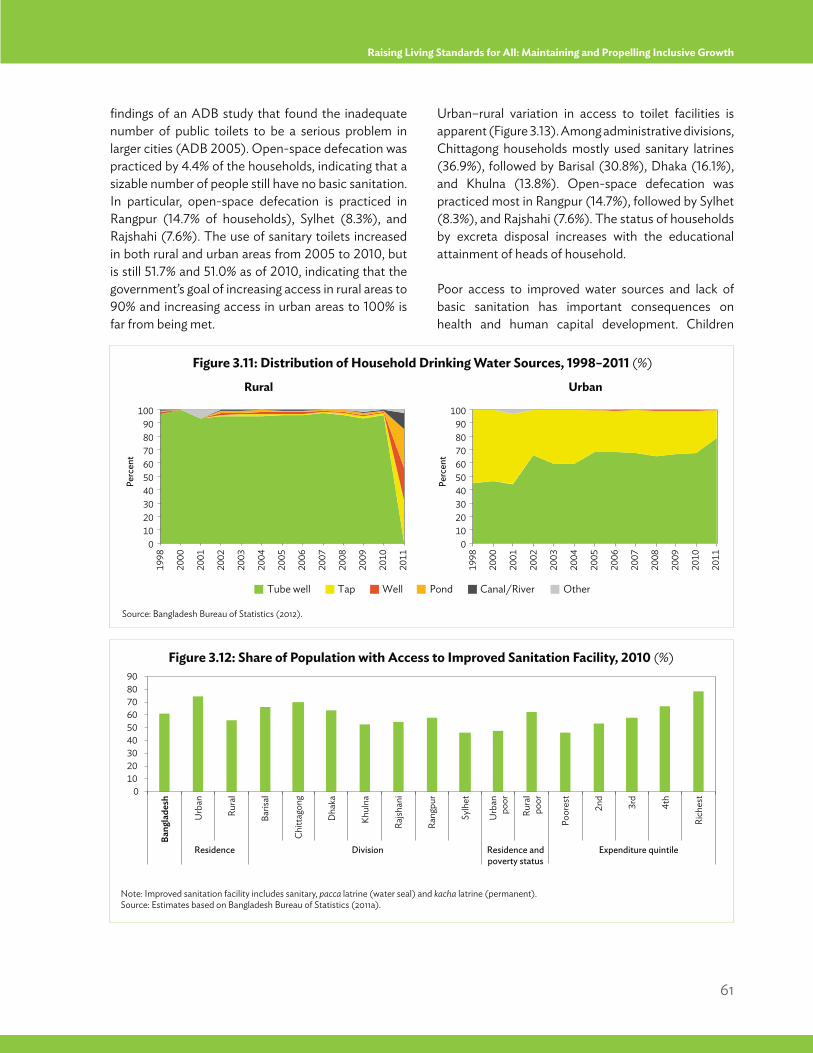
61
Raising Living Standards for All: Maintaining and Propelling Inclusive Growth
findings of an ADB study that found the inadequate number of public toilets to be a serious problem in larger cities (ADB 2005). Open-space defecation was practiced by 4.4% of the households, indicating that a sizable number of people still have no basic sanitation. In particular, open-space defecation is practiced in Rangpur (14.7% of households), Sylhet (8.3%), and Rajshahi (7.6%). The use of sanitary toilets increased in both rural and urban areas from 2005 to 2010, but is still 51.7% and 51.0% as of 2010, indicating that the government’s goal of increasing access in rural areas to 90% and increasing access in urban areas to 100% is far from being met.
Urban–rural variation in access to toilet facilities is apparent (Figure 3.13). Among administrative divisions, Chittagong households mostly used sanitary latrines (36.9%), followed by Barisal (30.8%), Dhaka (16.1%), and Khulna (13.8%). Open-space defecation was practiced most in Rangpur (14.7%), followed by Sylhet (8.3%), and Rajshahi (7.6%). The status of households by excreta disposal increases with the educational attainment of heads of household.
Poor access to improved water sources and lack of basic sanitation has important consequences on health and human capital development. Children
Pond Canal/River OtherTube well Tap Well
1998
2000
2001
2002
2003
2004
2005
2006
2007
2008
2009
2010
2011
1998
2000
2001
2002
2003
2004
2005
2006
2007
2008
2009
2010
2011
0102030405060708090
100
Perc
ent
0102030405060708090
100
Perc
ent
Figure 3.11: Distribution of Household Drinking Water Sources, 1998–2011 (%)
Figure 3.12: Share of Population with Access to Improved Sanitation Facility, 2010 (%)
Source: Bangladesh Bureau of Statistics (2012).
Note: Improved sanitation facility includes sanitary, pacca latrine (water seal) and kacha latrine (permanent).Source: Estimates based on Bangladesh Bureau of Statistics (2011a).
0102030405060708090
Bang
lade
sh
Urb
an
Rura
l
Baris
al
Chitt
agon
g
Dha
ka
Khul
na
Rajsh
ani
Rang
pur
Sylh
et
Urb
anpo
or
Rura
lpo
or
Poor
est
2nd
3rd
4th
Rich
est
Residence Division Expenditure quintileResidence andpoverty status
Rural Urban
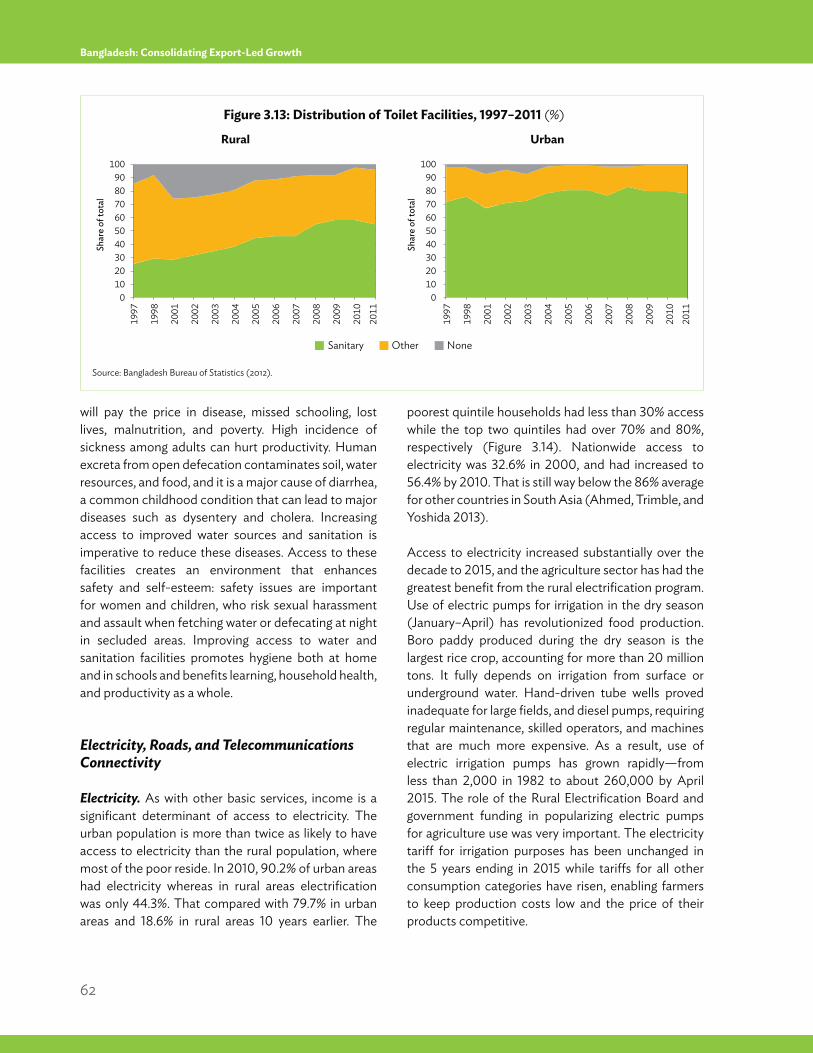
62
Bangladesh: Consolidating Export-Led Growth
will pay the price in disease, missed schooling, lost lives, malnutrition, and poverty. High incidence of sickness among adults can hurt productivity. Human excreta from open defecation contaminates soil, water resources, and food, and it is a major cause of diarrhea, a common childhood condition that can lead to major diseases such as dysentery and cholera. Increasing access to improved water sources and sanitation is imperative to reduce these diseases. Access to these facilities creates an environment that enhances safety and self-esteem: safety issues are important for women and children, who risk sexual harassment and assault when fetching water or defecating at night in secluded areas. Improving access to water and sanitation facilities promotes hygiene both at home and in schools and benefits learning, household health, and productivity as a whole.
Electricity, Roads, and Telecommunications Connectivity
Electricity. As with other basic services, income is a significant determinant of access to electricity. The urban population is more than twice as likely to have access to electricity than the rural population, where most of the poor reside. In 2010, 90.2% of urban areas had electricity whereas in rural areas electrification was only 44.3%. That compared with 79.7% in urban areas and 18.6% in rural areas 10 years earlier. The
poorest quintile households had less than 30% access while the top two quintiles had over 70% and 80%, respectively (Figure 3.14). Nationwide access to electricity was 32.6% in 2000, and had increased to 56.4% by 2010. That is still way below the 86% average for other countries in South Asia (Ahmed, Trimble, and Yoshida 2013). Access to electricity increased substantially over the decade to 2015, and the agriculture sector has had the greatest benefit from the rural electrification program. Use of electric pumps for irrigation in the dry season (January–April) has revolutionized food production. Boro paddy produced during the dry season is the largest rice crop, accounting for more than 20 million tons. It fully depends on irrigation from surface or underground water. Hand-driven tube wells proved inadequate for large fields, and diesel pumps, requiring regular maintenance, skilled operators, and machines that are much more expensive. As a result, use of electric irrigation pumps has grown rapidly—from less than 2,000 in 1982 to about 260,000 by April 2015. The role of the Rural Electrification Board and government funding in popularizing electric pumps for agriculture use was very important. The electricity tariff for irrigation purposes has been unchanged in the 5 years ending in 2015 while tariffs for all other consumption categories have risen, enabling farmers to keep production costs low and the price of their products competitive.
Figure 3.13: Distribution of Toilet Facilities, 1997–2011 (%)
Source: Bangladesh Bureau of Statistics (2012).
Sanitary Other None
1997
1998
2001
2002
2003
2004
2005
2006
2007
2008
2009
2010
2011
1997
1998
2001
2002
2003
2004
2005
2006
2007
2008
2009
2010
2011
0102030405060708090
100
Shar
e of
tota
l
0102030405060708090
100
Shar
e of
tota
l
Rural Urban
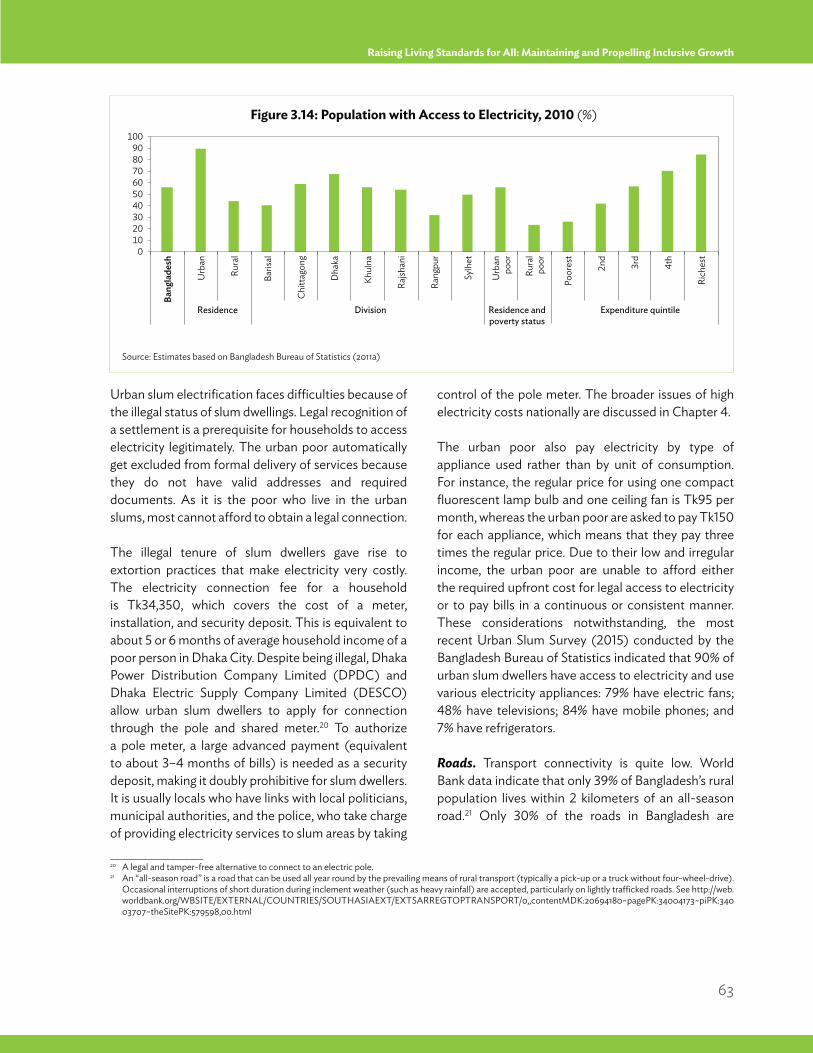
63
Raising Living Standards for All: Maintaining and Propelling Inclusive Growth
Urban slum electrification faces difficulties because of the illegal status of slum dwellings. Legal recognition of a settlement is a prerequisite for households to access electricity legitimately. The urban poor automatically get excluded from formal delivery of services because they do not have valid addresses and required documents. As it is the poor who live in the urban slums, most cannot afford to obtain a legal connection.
The illegal tenure of slum dwellers gave rise to extortion practices that make electricity very costly. The electricity connection fee for a household is Tk34,350, which covers the cost of a meter, installation, and security deposit. This is equivalent to about 5 or 6 months of average household income of a poor person in Dhaka City. Despite being illegal, Dhaka Power Distribution Company Limited (DPDC) and Dhaka Electric Supply Company Limited (DESCO) allow urban slum dwellers to apply for connection through the pole and shared meter.20 To authorize a pole meter, a large advanced payment (equivalent to about 3–4 months of bills) is needed as a security deposit, making it doubly prohibitive for slum dwellers. It is usually locals who have links with local politicians, municipal authorities, and the police, who take charge of providing electricity services to slum areas by taking
control of the pole meter. The broader issues of high electricity costs nationally are discussed in Chapter 4.
The urban poor also pay electricity by type of appliance used rather than by unit of consumption. For instance, the regular price for using one compact fluorescent lamp bulb and one ceiling fan is Tk95 per month, whereas the urban poor are asked to pay Tk150 for each appliance, which means that they pay three times the regular price. Due to their low and irregular income, the urban poor are unable to afford either the required upfront cost for legal access to electricity or to pay bills in a continuous or consistent manner. These considerations notwithstanding, the most recent Urban Slum Survey (2015) conducted by the Bangladesh Bureau of Statistics indicated that 90% of urban slum dwellers have access to electricity and use various electricity appliances: 79% have electric fans; 48% have televisions; 84% have mobile phones; and 7% have refrigerators.
Roads. Transport connectivity is quite low. World Bank data indicate that only 39% of Bangladesh’s rural population lives within 2 kilometers of an all-season road.21 Only 30% of the roads in Bangladesh are
Figure 3.14: Population with Access to Electricity, 2010 (%)
Source: Estimates based on Bangladesh Bureau of Statistics (2011a)
01020304050607080
10090
Bang
lade
sh
Urb
an
Rura
l
Baris
al
Chitt
agon
g
Dha
ka
Khul
na
Rajsh
ani
Rang
pur
Sylh
et
Urb
anpo
or
Rura
lpo
or
Poor
est
2nd
3rd
4th
Rich
est
Residence Division Expenditure quintileResidence andpoverty status
____________________20 A legal and tamper-free alternative to connect to an electric pole. 21 An “all-season road” is a road that can be used all year round by the prevailing means of rural transport (typically a pick-up or a truck without four-wheel-drive).
Occasional interruptions of short duration during inclement weather (such as heavy rainfall) are accepted, particularly on lightly trafficked roads. See http://web.worldbank.org/WBSITE/EXTERNAL/COUNTRIES/SOUTHASIAEXT/EXTSARREGTOPTRANSPORT/0,,contentMDK:20694180~pagePK:34004173~piPK:34003707~theSitePK:579598,00.html
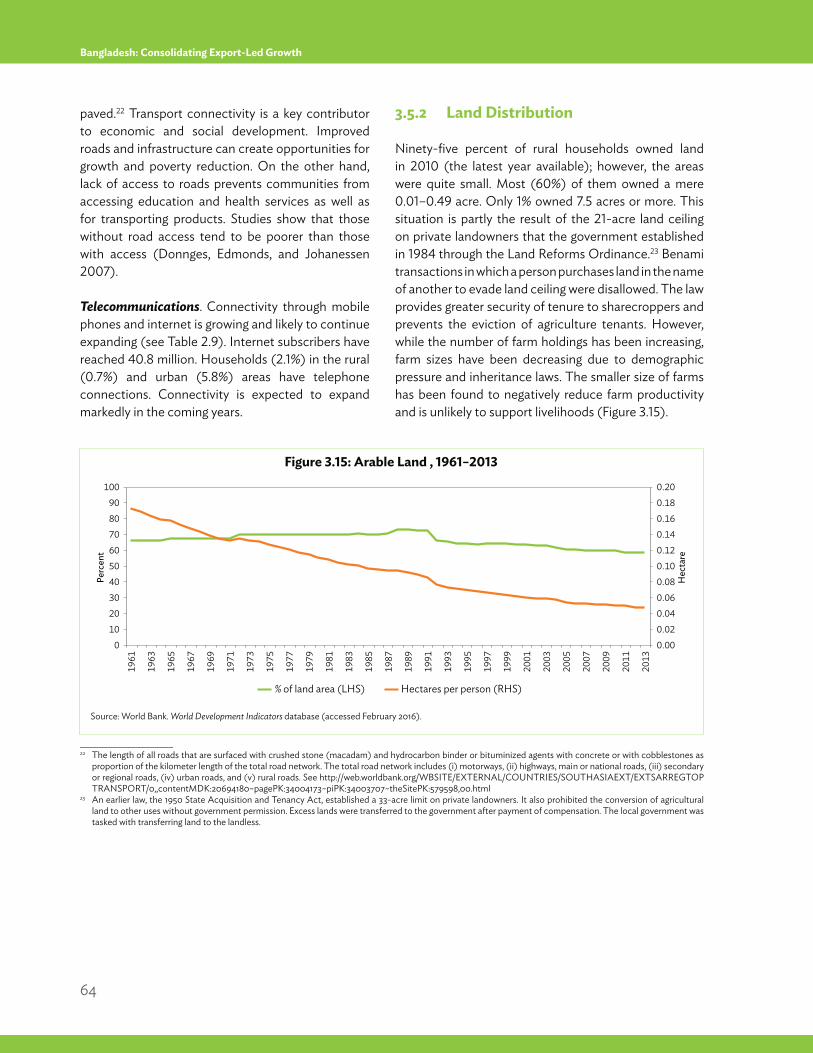
64
Bangladesh: Consolidating Export-Led Growth
paved.22 Transport connectivity is a key contributor to economic and social development. Improved roads and infrastructure can create opportunities for growth and poverty reduction. On the other hand, lack of access to roads prevents communities from accessing education and health services as well as for transporting products. Studies show that those without road access tend to be poorer than those with access (Donnges, Edmonds, and Johanessen 2007).
Telecommunications. Connectivity through mobile phones and internet is growing and likely to continue expanding (see Table 2.9). Internet subscribers have reached 40.8 million. Households (2.1%) in the rural (0.7%) and urban (5.8%) areas have telephone connections. Connectivity is expected to expand markedly in the coming years.
3.5.2 Land Distribution
Ninety-five percent of rural households owned land in 2010 (the latest year available); however, the areas were quite small. Most (60%) of them owned a mere 0.01–0.49 acre. Only 1% owned 7.5 acres or more. This situation is partly the result of the 21-acre land ceiling on private landowners that the government established in 1984 through the Land Reforms Ordinance.23 Benami transactions in which a person purchases land in the name of another to evade land ceiling were disallowed. The law provides greater security of tenure to sharecroppers and prevents the eviction of agriculture tenants. However, while the number of farm holdings has been increasing, farm sizes have been decreasing due to demographic pressure and inheritance laws. The smaller size of farms has been found to negatively reduce farm productivity and is unlikely to support livelihoods (Figure 3.15).
____________________22 The length of all roads that are surfaced with crushed stone (macadam) and hydrocarbon binder or bituminized agents with concrete or with cobblestones as
proportion of the kilometer length of the total road network. The total road network includes (i) motorways, (ii) highways, main or national roads, (iii) secondary or regional roads, (iv) urban roads, and (v) rural roads. See http://web.worldbank.org/WBSITE/EXTERNAL/COUNTRIES/SOUTHASIAEXT/EXTSARREGTOPTRANSPORT/0,,contentMDK:20694180~pagePK:34004173~piPK:34003707~theSitePK:579598,00.html
23 An earlier law, the 1950 State Acquisition and Tenancy Act, established a 33-acre limit on private landowners. It also prohibited the conversion of agricultural land to other uses without government permission. Excess lands were transferred to the government after payment of compensation. The local government was tasked with transferring land to the landless.
% of land area (LHS) Hectares per person (RHS)
0 0.00
100 0.20
0.14
0.180.16
0.100.12
0.04
0.080.06
0.02
70
9080
6050
30
10
40
20
1963
1967
1969
1965
1971
1973
1975
1977
1979
1961
1981
1983
1985
1987
2001
1995
1997
1999
1993
1989
1991
2003
2005
2007
2009
2011
2013
Perc
ent
Hec
tare
Figure 3.15: Arable Land , 1961–2013
Source: World Bank. World Development Indicators database (accessed February 2016).
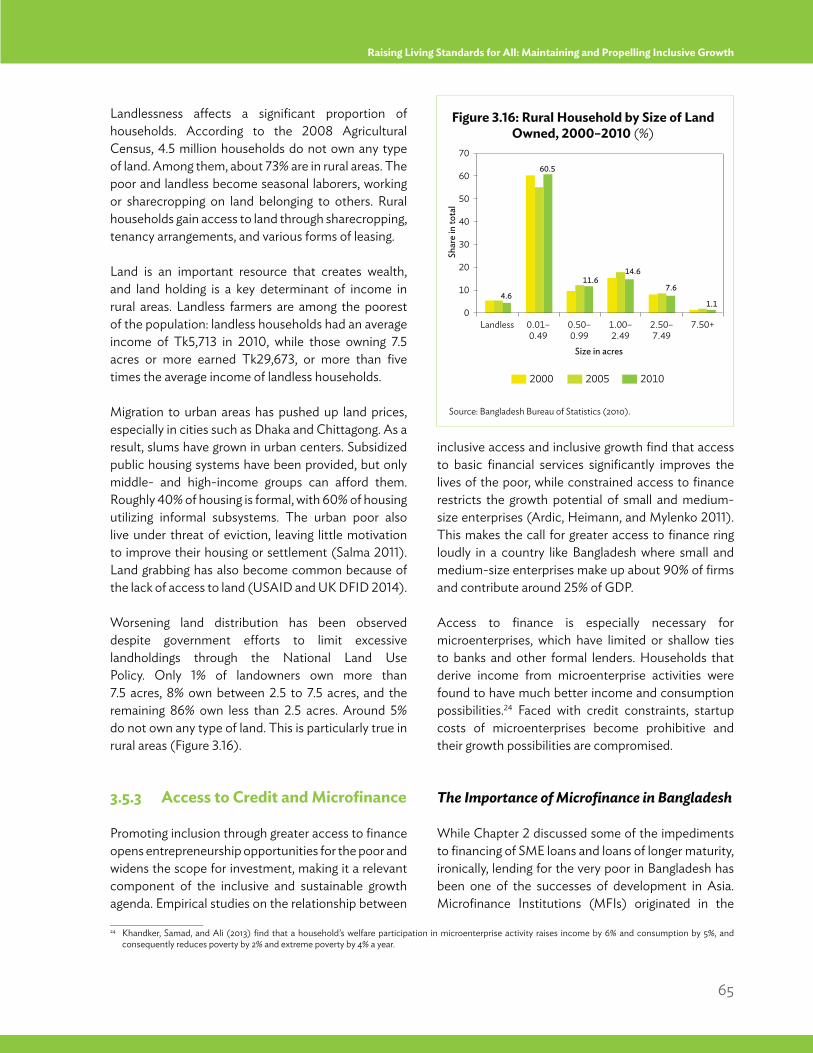
65
Raising Living Standards for All: Maintaining and Propelling Inclusive Growth
Landlessness affects a significant proportion of households. According to the 2008 Agricultural Census, 4.5 million households do not own any type of land. Among them, about 73% are in rural areas. The poor and landless become seasonal laborers, working or sharecropping on land belonging to others. Rural households gain access to land through sharecropping, tenancy arrangements, and various forms of leasing.
Land is an important resource that creates wealth, and land holding is a key determinant of income in rural areas. Landless farmers are among the poorest of the population: landless households had an average income of Tk5,713 in 2010, while those owning 7.5 acres or more earned Tk29,673, or more than five times the average income of landless households.
Migration to urban areas has pushed up land prices, especially in cities such as Dhaka and Chittagong. As a result, slums have grown in urban centers. Subsidized public housing systems have been provided, but only middle- and high-income groups can afford them. Roughly 40% of housing is formal, with 60% of housing utilizing informal subsystems. The urban poor also live under threat of eviction, leaving little motivation to improve their housing or settlement (Salma 2011). Land grabbing has also become common because of the lack of access to land (USAID and UK DFID 2014).
Worsening land distribution has been observed despite government efforts to limit excessive landholdings through the National Land Use Policy. Only 1% of landowners own more than 7.5 acres, 8% own between 2.5 to 7.5 acres, and the remaining 86% own less than 2.5 acres. Around 5% do not own any type of land. This is particularly true in rural areas (Figure 3.16).
3.5.3 Access to Credit and Microfinance
Promoting inclusion through greater access to finance opens entrepreneurship opportunities for the poor and widens the scope for investment, making it a relevant component of the inclusive and sustainable growth agenda. Empirical studies on the relationship between
inclusive access and inclusive growth find that access to basic financial services significantly improves the lives of the poor, while constrained access to finance restricts the growth potential of small and medium-size enterprises (Ardic, Heimann, and Mylenko 2011). This makes the call for greater access to finance ring loudly in a country like Bangladesh where small and medium-size enterprises make up about 90% of firms and contribute around 25% of GDP. Access to finance is especially necessary for microenterprises, which have limited or shallow ties to banks and other formal lenders. Households that derive income from microenterprise activities were found to have much better income and consumption possibilities.24 Faced with credit constraints, startup costs of microenterprises become prohibitive and their growth possibilities are compromised.
The Importance of Microfinance in Bangladesh
While Chapter 2 discussed some of the impediments to financing of SME loans and loans of longer maturity, ironically, lending for the very poor in Bangladesh has been one of the successes of development in Asia. Microfinance Institutions (MFIs) originated in the
0
60
50
40
30
20
10
70
2000 2005 2010
4.6
60.5
11.614.6
7.6
1.1
Landless
Size in acres
0.01–0.49
0.50–0.99
1.00–2.49
2.50–7.49
7.50+
Shar
e in
tota
l
Figure 3.16: Rural Household by Size of Land Owned, 2000–2010 (%)
Source: Bangladesh Bureau of Statistics (2010).
____________________24 Khandker, Samad, and Ali (2013) find that a household’s welfare participation in microenterprise activity raises income by 6% and consumption by 5%, and
consequently reduces poverty by 2% and extreme poverty by 4% a year.
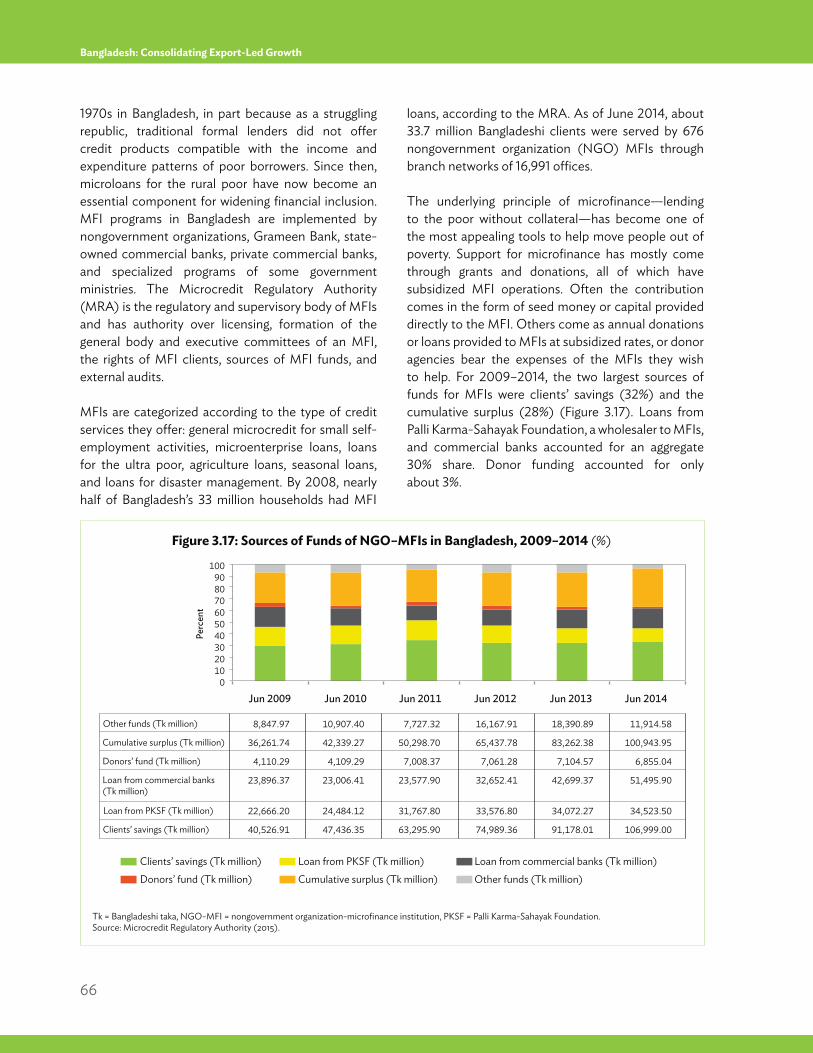
66
Bangladesh: Consolidating Export-Led Growth
1970s in Bangladesh, in part because as a struggling republic, traditional formal lenders did not offer credit products compatible with the income and expenditure patterns of poor borrowers. Since then, microloans for the rural poor have now become an essential component for widening financial inclusion. MFI programs in Bangladesh are implemented by nongovernment organizations, Grameen Bank, state-owned commercial banks, private commercial banks, and specialized programs of some government ministries. The Microcredit Regulatory Authority (MRA) is the regulatory and supervisory body of MFIs and has authority over licensing, formation of the general body and executive committees of an MFI, the rights of MFI clients, sources of MFI funds, and external audits.
MFIs are categorized according to the type of credit services they offer: general microcredit for small self-employment activities, microenterprise loans, loans for the ultra poor, agriculture loans, seasonal loans, and loans for disaster management. By 2008, nearly half of Bangladesh’s 33 million households had MFI
loans, according to the MRA. As of June 2014, about 33.7 million Bangladeshi clients were served by 676 nongovernment organization (NGO) MFIs through branch networks of 16,991 offices.
The underlying principle of microfinance—lending to the poor without collateral—has become one of the most appealing tools to help move people out of poverty. Support for microfinance has mostly come through grants and donations, all of which have subsidized MFI operations. Often the contribution comes in the form of seed money or capital provided directly to the MFI. Others come as annual donations or loans provided to MFIs at subsidized rates, or donor agencies bear the expenses of the MFIs they wish to help. For 2009–2014, the two largest sources of funds for MFIs were clients’ savings (32%) and the cumulative surplus (28%) (Figure 3.17). Loans from Palli Karma-Sahayak Foundation, a wholesaler to MFIs, and commercial banks accounted for an aggregate 30% share. Donor funding accounted for only about 3%.
Donors’ fund (Tk million) Cumulative surplus (Tk million) Other funds (Tk million)Clients’ savings (Tk million) Loan from PKSF (Tk million) Loan from commercial banks (Tk million)
Perc
ent
0102030405060708090
100
Jun 2009 Jun 2010 Jun 2011 Jun 2012 Jun 2013 Jun 2014
Other funds (Tk million) 8,847.97 10,907.40 7,727.32 16,167.91 18,390.89 11,914.58
Cumulative surplus (Tk million) 36,261.74 42,339.27 50,298.70 65,437.78 83,262.38 100,943.95
Donors’ fund (Tk million) 4,110.29 4,109.29 7,008.37 7,061.28 7,104.57 6,855.04
Loan from commercial banks(Tk million)
23,896.37 23,006.41 23,577.90 32,652.41 42,699.37 51,495.90
Loan from PKSF (Tk million) 22,666.20 24,484.12 31,767.80 33,576.80 34,072.27 34,523.50
Clients’ savings (Tk million) 40,526.91 47,436.35 63,295.90 74,989.36 91,178.01 106,999.00
Figure 3.17: Sources of Funds of NGO–MFIs in Bangladesh, 2009–2014 (%)
Tk = Bangladeshi taka, NGO-MFI = nongovernment organization-microfinance institution, PKSF = Palli Karma-Sahayak Foundation.Source: Microcredit Regulatory Authority (2015).
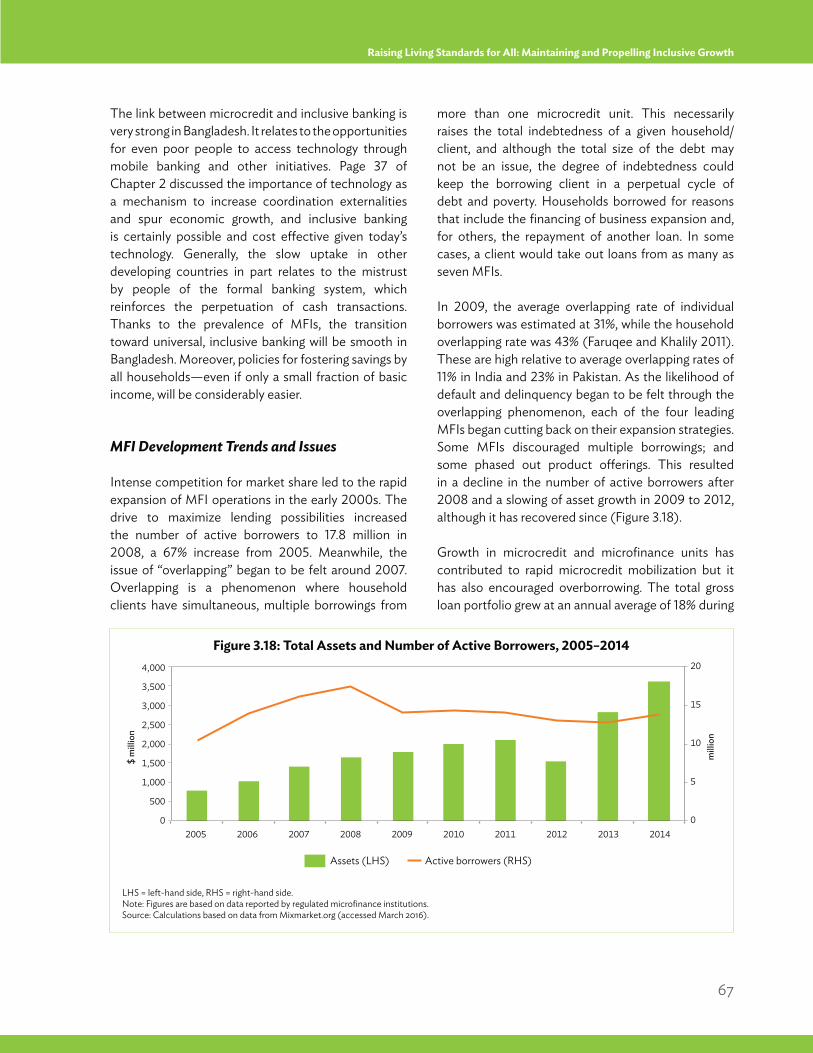
67
Raising Living Standards for All: Maintaining and Propelling Inclusive Growth
more than one microcredit unit. This necessarily raises the total indebtedness of a given household/client, and although the total size of the debt may not be an issue, the degree of indebtedness could keep the borrowing client in a perpetual cycle of debt and poverty. Households borrowed for reasons that include the financing of business expansion and, for others, the repayment of another loan. In some cases, a client would take out loans from as many as seven MFIs.
In 2009, the average overlapping rate of individual borrowers was estimated at 31%, while the household overlapping rate was 43% (Faruqee and Khalily 2011). These are high relative to average overlapping rates of 11% in India and 23% in Pakistan. As the likelihood of default and delinquency began to be felt through the overlapping phenomenon, each of the four leading MFIs began cutting back on their expansion strategies. Some MFIs discouraged multiple borrowings; and some phased out product offerings. This resulted in a decline in the number of active borrowers after 2008 and a slowing of asset growth in 2009 to 2012, although it has recovered since (Figure 3.18).
Growth in microcredit and microfinance units has contributed to rapid microcredit mobilization but it has also encouraged overborrowing. The total gross loan portfolio grew at an annual average of 18% during
The link between microcredit and inclusive banking is very strong in Bangladesh. It relates to the opportunities for even poor people to access technology through mobile banking and other initiatives. Page 37 of Chapter 2 discussed the importance of technology as a mechanism to increase coordination externalities and spur economic growth, and inclusive banking is certainly possible and cost effective given today’s technology. Generally, the slow uptake in other developing countries in part relates to the mistrust by people of the formal banking system, which reinforces the perpetuation of cash transactions. Thanks to the prevalence of MFIs, the transition toward universal, inclusive banking will be smooth in Bangladesh. Moreover, policies for fostering savings by all households—even if only a small fraction of basic income, will be considerably easier.
MFI Development Trends and Issues
Intense competition for market share led to the rapid expansion of MFI operations in the early 2000s. The drive to maximize lending possibilities increased the number of active borrowers to 17.8 million in 2008, a 67% increase from 2005. Meanwhile, the issue of “overlapping” began to be felt around 2007. Overlapping is a phenomenon where household clients have simultaneous, multiple borrowings from
Assets (LHS) Active borrowers (RHS)
0
5
10
15
20
0
500
1,000
1,500
2,000
2,500
3,000
3,500
4,000
2005 2006 2007 2008 2009 2010 2011 2012 2013 2014
$ m
illio
n
mill
ion
Figure 3.18: Total Assets and Number of Active Borrowers, 2005–2014
LHS = left-hand side, RHS = right-hand side.Note: Figures are based on data reported by regulated microfinance institutions. Source: Calculations based on data from Mixmarket.org (accessed March 2016).
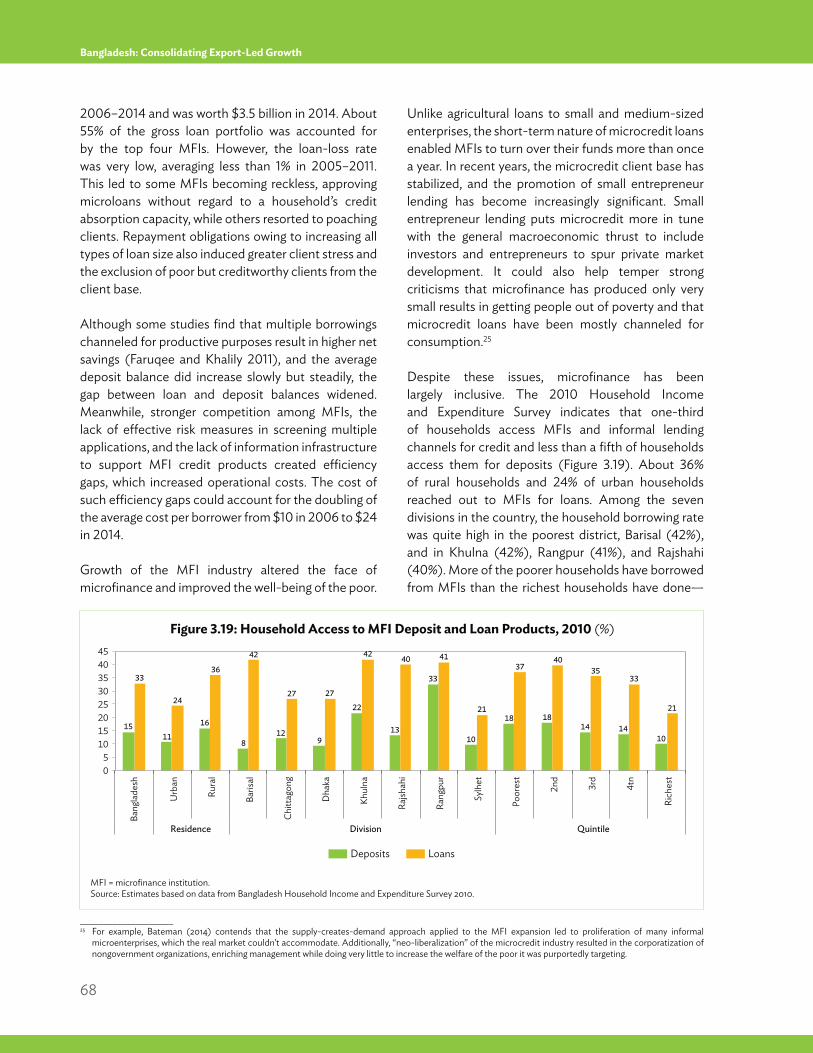
68
Bangladesh: Consolidating Export-Led Growth
2006–2014 and was worth $3.5 billion in 2014. About 55% of the gross loan portfolio was accounted for by the top four MFIs. However, the loan-loss rate was very low, averaging less than 1% in 2005–2011. This led to some MFIs becoming reckless, approving microloans without regard to a household’s credit absorption capacity, while others resorted to poaching clients. Repayment obligations owing to increasing all types of loan size also induced greater client stress and the exclusion of poor but creditworthy clients from the client base.
Although some studies find that multiple borrowings channeled for productive purposes result in higher net savings (Faruqee and Khalily 2011), and the average deposit balance did increase slowly but steadily, the gap between loan and deposit balances widened. Meanwhile, stronger competition among MFIs, the lack of effective risk measures in screening multiple applications, and the lack of information infrastructure to support MFI credit products created efficiency gaps, which increased operational costs. The cost of such efficiency gaps could account for the doubling of the average cost per borrower from $10 in 2006 to $24 in 2014.
Growth of the MFI industry altered the face of microfinance and improved the well-being of the poor.
Unlike agricultural loans to small and medium-sized enterprises, the short-term nature of microcredit loans enabled MFIs to turn over their funds more than once a year. In recent years, the microcredit client base has stabilized, and the promotion of small entrepreneur lending has become increasingly significant. Small entrepreneur lending puts microcredit more in tune with the general macroeconomic thrust to include investors and entrepreneurs to spur private market development. It could also help temper strong criticisms that microfinance has produced only very small results in getting people out of poverty and that microcredit loans have been mostly channeled for consumption.25
Despite these issues, microfinance has been largely inclusive. The 2010 Household Income and Expenditure Survey indicates that one-third of households access MFIs and informal lending channels for credit and less than a fifth of households access them for deposits (Figure 3.19). About 36% of rural households and 24% of urban households reached out to MFIs for loans. Among the seven divisions in the country, the household borrowing rate was quite high in the poorest district, Barisal (42%), and in Khulna (42%), Rangpur (41%), and Rajshahi (40%). More of the poorer households have borrowed from MFIs than the richest households have done—
____________________25 For example, Bateman (2014) contends that the supply-creates-demand approach applied to the MFI expansion led to proliferation of many informal
microenterprises, which the real market couldn’t accommodate. Additionally, “neo-liberalization” of the microcredit industry resulted in the corporatization of nongovernment organizations, enriching management while doing very little to increase the welfare of the poor it was purportedly targeting.
Deposits Loans
15 11
16
8 12
9
22
13
33
10
18 18 14 14
10
33
24
36
42
27 27
42 40 41
21
37 40
35 33
21
05
1015202530354045
Urb
an
Rura
l
Baris
al
Chitt
agon
g
Dha
ka
Khul
na
Rajsh
ahi
Rang
pur
Sylh
et
Poor
est
2nd
3rd
4tn
Rich
est
Bang
lade
sh
Residence Division Quintile
Figure 3.19: Household Access to MFI Deposit and Loan Products, 2010 (%)
MFI = microfinance institution.Source: Estimates based on data from Bangladesh Household Income and Expenditure Survey 2010.
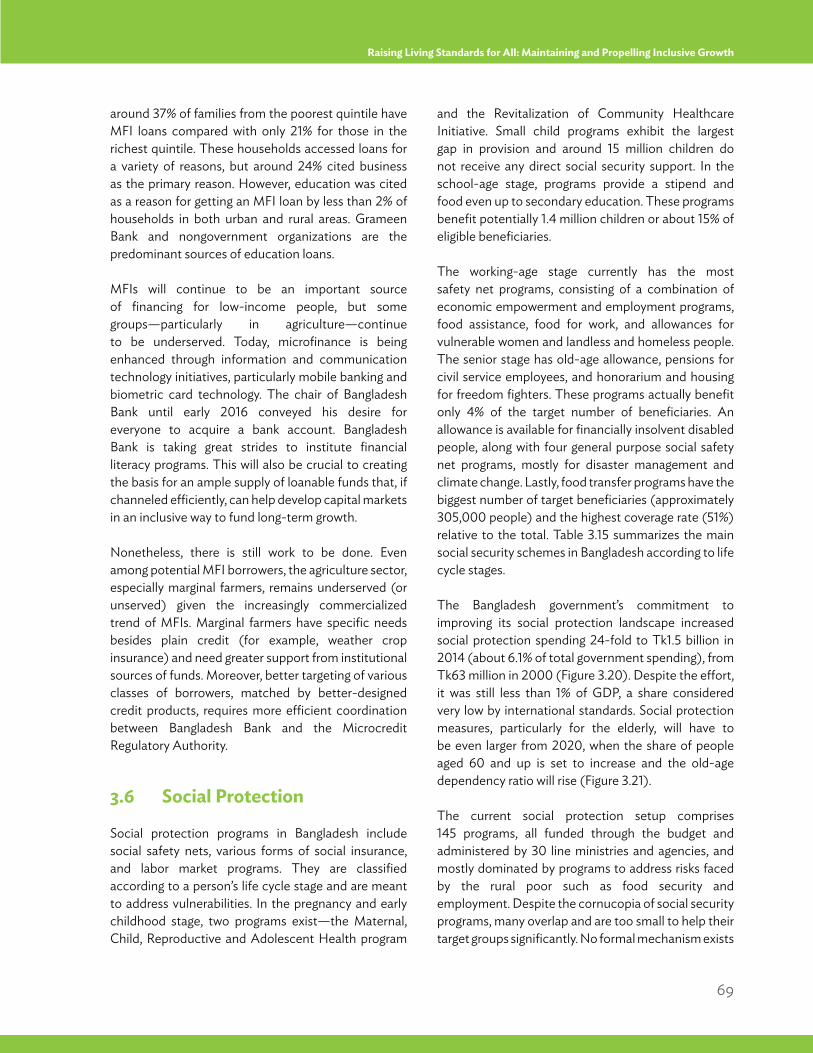
69
Raising Living Standards for All: Maintaining and Propelling Inclusive Growth
around 37% of families from the poorest quintile have MFI loans compared with only 21% for those in the richest quintile. These households accessed loans for a variety of reasons, but around 24% cited business as the primary reason. However, education was cited as a reason for getting an MFI loan by less than 2% of households in both urban and rural areas. Grameen Bank and nongovernment organizations are the predominant sources of education loans.
MFIs will continue to be an important source of financing for low-income people, but some groups—particularly in agriculture—continue to be underserved. Today, microfinance is being enhanced through information and communication technology initiatives, particularly mobile banking and biometric card technology. The chair of Bangladesh Bank until early 2016 conveyed his desire for everyone to acquire a bank account. Bangladesh Bank is taking great strides to institute financial literacy programs. This will also be crucial to creating the basis for an ample supply of loanable funds that, if channeled efficiently, can help develop capital markets in an inclusive way to fund long-term growth.
Nonetheless, there is still work to be done. Even among potential MFI borrowers, the agriculture sector, especially marginal farmers, remains underserved (or unserved) given the increasingly commercialized trend of MFIs. Marginal farmers have specific needs besides plain credit (for example, weather crop insurance) and need greater support from institutional sources of funds. Moreover, better targeting of various classes of borrowers, matched by better-designed credit products, requires more efficient coordination between Bangladesh Bank and the Microcredit Regulatory Authority.
3.6 Social Protection
Social protection programs in Bangladesh include social safety nets, various forms of social insurance, and labor market programs. They are classified according to a person’s life cycle stage and are meant to address vulnerabilities. In the pregnancy and early childhood stage, two programs exist—the Maternal, Child, Reproductive and Adolescent Health program
and the Revitalization of Community Healthcare Initiative. Small child programs exhibit the largest gap in provision and around 15 million children do not receive any direct social security support. In the school-age stage, programs provide a stipend and food even up to secondary education. These programs benefit potentially 1.4 million children or about 15% of eligible beneficiaries.
The working-age stage currently has the most safety net programs, consisting of a combination of economic empowerment and employment programs, food assistance, food for work, and allowances for vulnerable women and landless and homeless people. The senior stage has old-age allowance, pensions for civil service employees, and honorarium and housing for freedom fighters. These programs actually benefit only 4% of the target number of beneficiaries. An allowance is available for financially insolvent disabled people, along with four general purpose social safety net programs, mostly for disaster management and climate change. Lastly, food transfer programs have the biggest number of target beneficiaries (approximately 305,000 people) and the highest coverage rate (51%) relative to the total. Table 3.15 summarizes the main social security schemes in Bangladesh according to life cycle stages.
The Bangladesh government’s commitment to improving its social protection landscape increased social protection spending 24-fold to Tk1.5 billion in 2014 (about 6.1% of total government spending), from Tk63 million in 2000 (Figure 3.20). Despite the effort, it was still less than 1% of GDP, a share considered very low by international standards. Social protection measures, particularly for the elderly, will have to be even larger from 2020, when the share of people aged 60 and up is set to increase and the old-age dependency ratio will rise (Figure 3.21).
The current social protection setup comprises 145 programs, all funded through the budget and administered by 30 line ministries and agencies, and mostly dominated by programs to address risks faced by the rural poor such as food security and employment. Despite the cornucopia of social security programs, many overlap and are too small to help their target groups significantly. No formal mechanism exists
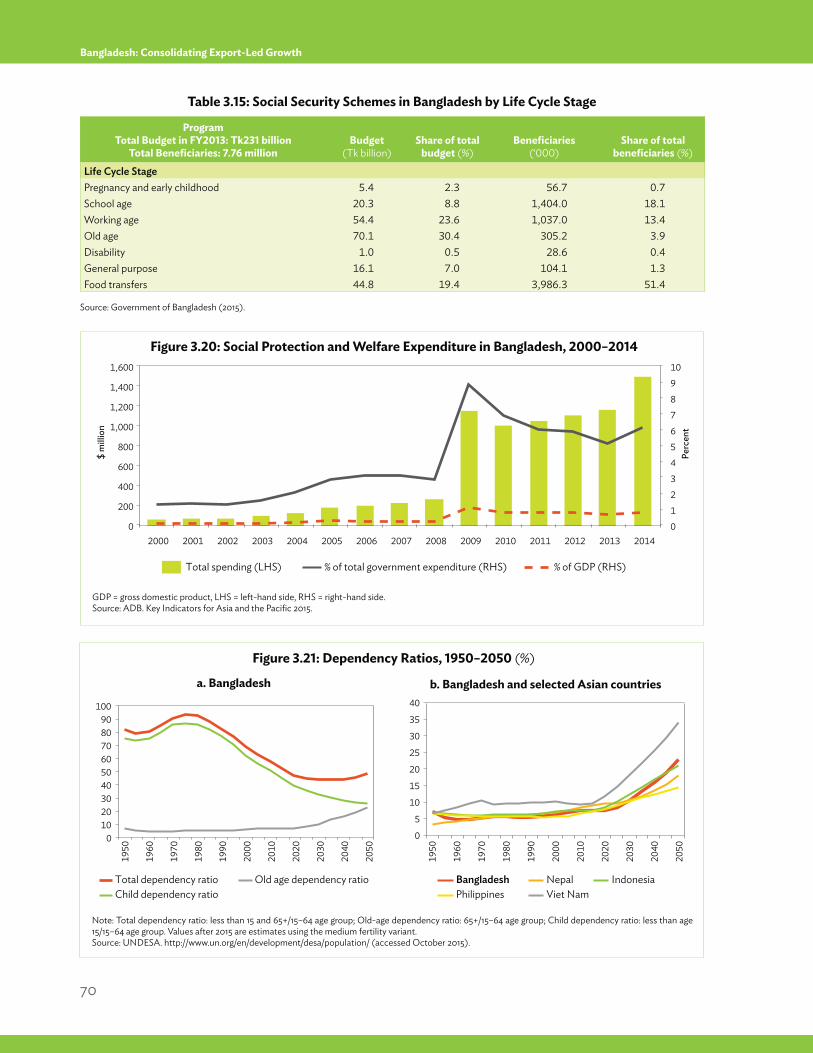
70
Bangladesh: Consolidating Export-Led Growth
Total spending (LHS) % of total government expenditure (RHS) % of GDP (RHS)
$ m
illio
n
0
200
400
600
800
1,000
1,200
1,400
1,600
Perc
ent
0
1
2
3
4
5
6
7
8
9
10
2000 2001 2002 2003 2004 2005 2006 2007 2008 2009 2010 2011 2012 2013 2014
Figure 3.21: Dependency Ratios, 1950–2050 (%)
Note: Total dependency ratio: less than 15 and 65+/15–64 age group; Old-age dependency ratio: 65+/15–64 age group; Child dependency ratio: less than age 15/15–64 age group. Values after 2015 are estimates using the medium fertility variant. Source: UNDESA. http://www.un.org/en/development/desa/population/ (accessed October 2015).
Figure 3.20: Social Protection and Welfare Expenditure in Bangladesh, 2000–2014
GDP = gross domestic product, LHS = left-hand side, RHS = right-hand side.Source: ADB. Key Indicators for Asia and the Pacific 2015.
a. Bangladesh b. Bangladesh and selected Asian countries
0
5
10
15
20
25
30
35
40
Bangladesh Nepal Indonesia Philippines Viet Nam
0 10 20 30 40 50 60 70 80 90
100
Total dependency ratio Old age dependency ratio Child dependency ratio
1950
1960
1970
1980
1990
2000
2010
2020
2030
2040
2050
1950
1960
1970
1980
1990
2000
2010
2020
2030
2040
2050
Program Total Budget in FY2013: Tk231 billion
Total Beneficiaries: 7.76 millionBudget
(Tk billion)Share of total
budget (%)Beneficiaries
(‘000)Share of total
beneficiaries (%)
Life Cycle Stage Pregnancy and early childhood 5.4 2.3 56.7 0.7School age 20.3 8.8 1,404.0 18.1Working age 54.4 23.6 1,037.0 13.4Old age 70.1 30.4 305.2 3.9Disability 1.0 0.5 28.6 0.4General purpose 16.1 7.0 104.1 1.3Food transfers 44.8 19.4 3,986.3 51.4
Table 3.15: Social Security Schemes in Bangladesh by Life Cycle Stage
Source: Government of Bangladesh (2015).
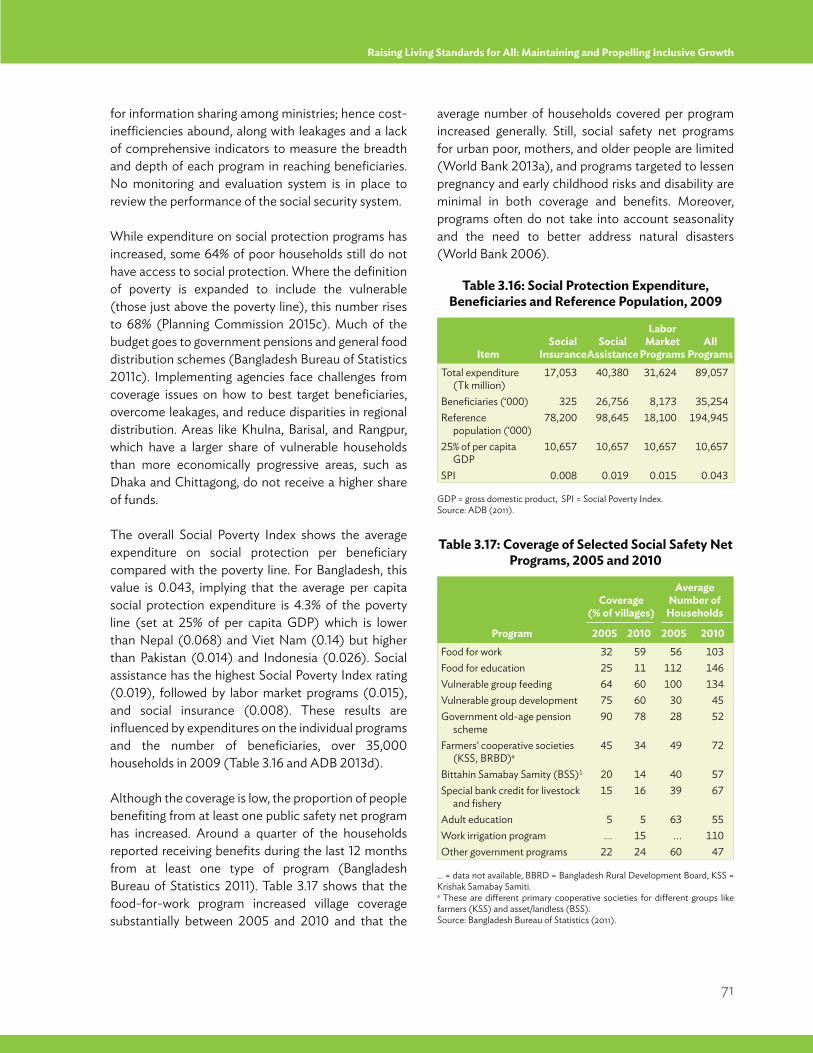
71
Raising Living Standards for All: Maintaining and Propelling Inclusive Growth
for information sharing among ministries; hence cost-inefficiencies abound, along with leakages and a lack of comprehensive indicators to measure the breadth and depth of each program in reaching beneficiaries. No monitoring and evaluation system is in place to review the performance of the social security system.
While expenditure on social protection programs has increased, some 64% of poor households still do not have access to social protection. Where the definition of poverty is expanded to include the vulnerable (those just above the poverty line), this number rises to 68% (Planning Commission 2015c). Much of the budget goes to government pensions and general food distribution schemes (Bangladesh Bureau of Statistics 2011c). Implementing agencies face challenges from coverage issues on how to best target beneficiaries, overcome leakages, and reduce disparities in regional distribution. Areas like Khulna, Barisal, and Rangpur, which have a larger share of vulnerable households than more economically progressive areas, such as Dhaka and Chittagong, do not receive a higher share of funds.
The overall Social Poverty Index shows the average expenditure on social protection per beneficiary compared with the poverty line. For Bangladesh, this value is 0.043, implying that the average per capita social protection expenditure is 4.3% of the poverty line (set at 25% of per capita GDP) which is lower than Nepal (0.068) and Viet Nam (0.14) but higher than Pakistan (0.014) and Indonesia (0.026). Social assistance has the highest Social Poverty Index rating (0.019), followed by labor market programs (0.015), and social insurance (0.008). These results are influenced by expenditures on the individual programs and the number of beneficiaries, over 35,000 households in 2009 (Table 3.16 and ADB 2013d).
Although the coverage is low, the proportion of people benefiting from at least one public safety net program has increased. Around a quarter of the households reported receiving benefits during the last 12 months from at least one type of program (Bangladesh Bureau of Statistics 2011). Table 3.17 shows that the food-for-work program increased village coverage substantially between 2005 and 2010 and that the
average number of households covered per program increased generally. Still, social safety net programs for urban poor, mothers, and older people are limited (World Bank 2013a), and programs targeted to lessen pregnancy and early childhood risks and disability are minimal in both coverage and benefits. Moreover, programs often do not take into account seasonality and the need to better address natural disasters (World Bank 2006).
Table 3.16: Social Protection Expenditure, Beneficiaries and Reference Population, 2009
GDP = gross domestic product, SPI = Social Poverty Index.Source: ADB (2011).
ItemSocial
InsuranceSocial
Assistance
Labor Market
ProgramsAll
ProgramsTotal expenditure
(Tk million)17,053 40,380 31,624 89,057
Beneficiaries (‘000) 325 26,756 8,173 35,254Reference
population (‘000)78,200 98,645 18,100 194,945
25% of per capita GDP
10,657 10,657 10,657 10,657
SPI 0.008 0.019 0.015 0.043
Table 3.17: Coverage of Selected Social Safety Net Programs, 2005 and 2010
... = data not available, BBRD = Bangladesh Rural Development Board, KSS = Krishak Samabay Samiti.a These are different primary cooperative societies for different groups like farmers (KSS) and asset/landless (BSS).Source: Bangladesh Bureau of Statistics (2011).
Program
Coverage (% of villages)
Average Number of
Households
2005 2010 2005 2010Food for work 32 59 56 103Food for education 25 11 112 146Vulnerable group feeding 64 60 100 134Vulnerable group development 75 60 30 45Government old-age pension
scheme 90 78 28 52
Farmers’ cooperative societies (KSS, BRBD)a
45 34 49 72
Bittahin Samabay Samity (BSS)1 20 14 40 57Special bank credit for livestock
and fishery 15 16 39 67
Adult education 5 5 63 55Work irrigation program ... 15 ... 110 Other government programs 22 24 60 47
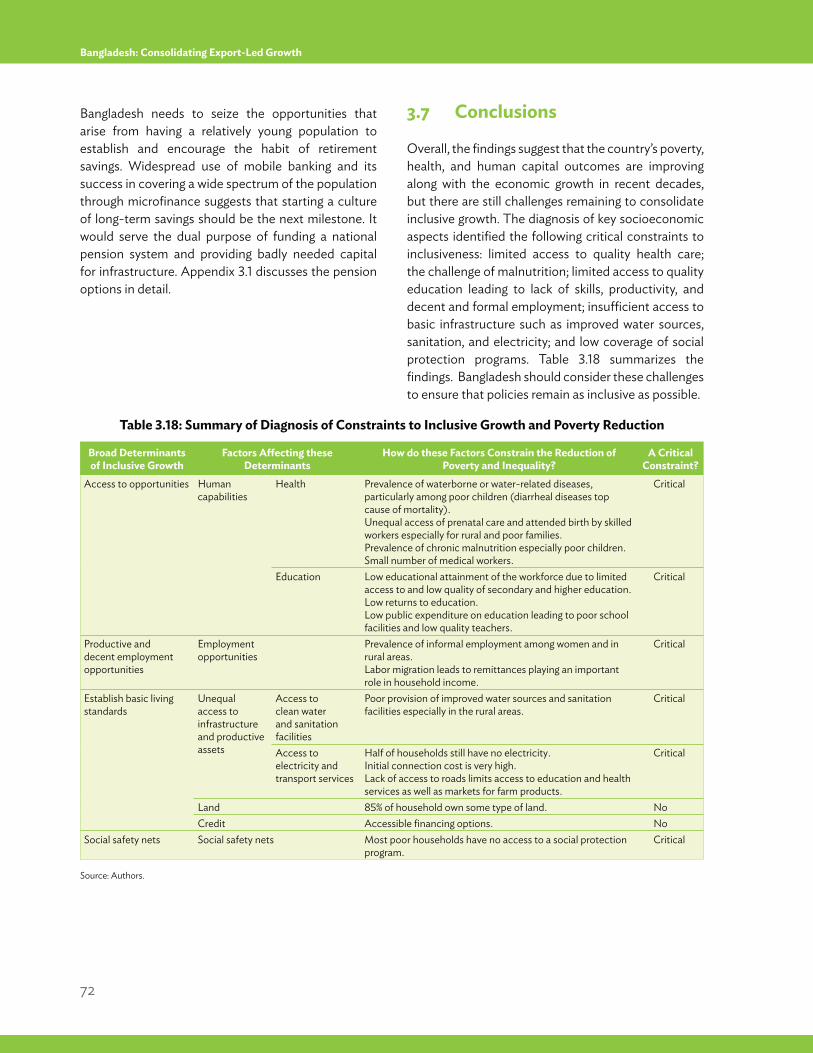
72
Bangladesh: Consolidating Export-Led Growth
Bangladesh needs to seize the opportunities that arise from having a relatively young population to establish and encourage the habit of retirement savings. Widespread use of mobile banking and its success in covering a wide spectrum of the population through microfinance suggests that starting a culture of long-term savings should be the next milestone. It would serve the dual purpose of funding a national pension system and providing badly needed capital for infrastructure. Appendix 3.1 discusses the pension options in detail.
3.7 Conclusions
Overall, the findings suggest that the country’s poverty, health, and human capital outcomes are improving along with the economic growth in recent decades, but there are still challenges remaining to consolidate inclusive growth. The diagnosis of key socioeconomic aspects identified the following critical constraints to inclusiveness: limited access to quality health care; the challenge of malnutrition; limited access to quality education leading to lack of skills, productivity, and decent and formal employment; insufficient access to basic infrastructure such as improved water sources, sanitation, and electricity; and low coverage of social protection programs. Table 3.18 summarizes the findings. Bangladesh should consider these challenges to ensure that policies remain as inclusive as possible.
Table 3.18: Summary of Diagnosis of Constraints to Inclusive Growth and Poverty Reduction
Source: Authors.
Broad Determinants of Inclusive Growth
Factors Affecting these Determinants
How do these Factors Constrain the Reduction of Poverty and Inequality?
A Critical Constraint?
Access to opportunities Human capabilities
Health Prevalence of waterborne or water-related diseases, particularly among poor children (diarrheal diseases top cause of mortality).Unequal access of prenatal care and attended birth by skilled workers especially for rural and poor families.Prevalence of chronic malnutrition especially poor children.Small number of medical workers.
Critical
Education Low educational attainment of the workforce due to limited access to and low quality of secondary and higher education.Low returns to education.Low public expenditure on education leading to poor school facilities and low quality teachers.
Critical
Productive and decent employment opportunities
Employment opportunities
Prevalence of informal employment among women and in rural areas.Labor migration leads to remittances playing an important role in household income.
Critical
Establish basic living standards
Unequal access to infrastructure and productive assets
Access to clean water and sanitation facilities
Poor provision of improved water sources and sanitation facilities especially in the rural areas.
Critical
Access to electricity and transport services
Half of households still have no electricity.Initial connection cost is very high.Lack of access to roads limits access to education and health services as well as markets for farm products.
Critical
Land 85% of household own some type of land. NoCredit Accessible financing options. No
Social safety nets Social safety nets Most poor households have no access to a social protection program.
Critical
73
Raising Living Standards for All: Maintaining and Propelling Inclusive Growth
Appendix 3.1: The Bangladesh Pension System: A Must-Have
Some sociodemographic variables weigh into the depth of social protection needs. The greater the number of older people relative to other age cohorts, the greater is the dependency rate and the need for pension provision. In 2015, the share of the elderly (age 65) to the total population in Bangladesh had increased to almost 5% of the population from 3.1% in 1990. This still compares favorably to 4.1% in Cambodia, 6.6% in Viet Nam, 10.1% in Thailand, 11.7% in Singapore, and 26.3% in Japan (UNESCAP 2015).
In April 2015, the government approved the National Social Security Strategy, and has begun the work of expanding the social protection system, including pensions. The design of an old-age pension system can take on many features. The overall architecture depends on (i) the nature of the benefits that a pensions system promises (defined benefit, defined contribution, or hybrid notional defined contribution schemes); (ii) its financial structure (pay-as-you-go or fully funded in advance) and implementing institutions (public or private); (iii) how it fits the multi-pillar typology defined by the World Bank (see below); and (iv) how it is related to other types of retirement income provision. Pensions could be contributory or non-contributory. An example of a contributory pension system is a mandatory occupational pension, where both employees and employers contribute. Another example is a private pension where individuals contribute voluntarily. Non-contributory pensions help combat absolute poverty while contributory pension systems help reduce relative poverty.
The proposed system differentiates pension system components into five pillars: (i) a non-contributory “zero pillar” for targeted older people living in poverty; (ii) a mandatory earnings-based “first pillar;” (iii) a mandatory saving-based “second pillar;” (iv) a complementary voluntary “third pillar;” and (v) a nonfinancial “fourth pillar” which includes access to informal support, other formal social programs,
and other individual financial and non-financial assets (Pallares-Miralles, Romero, and Whitehouse 2012).
Several types of social pensions exist but are not currently in place in Bangladesh. A universal minimum pension scheme is one where people over a certain age receive a pension, and it is less costly to administer than means-tested pension schemes. A universal system takes more time to set up but does away with the “socially stigmatizing” nature of means-tested systems, which filter through the list of people deserving social assistance and often end up excluding many (Johnson and Williamson 2006). Bangladesh has a means-tested social pension.
Table A3.1 helps contextualize the reality of social pension benefits. The average amount of social pensions received by the elderly in Bangladesh is quite low and hardly sufficient—at just $4 per month, it is equivalent to only 5% of per capita GDP. As to coverage, the World Bank (2009a) finds that in Asia, only 20% workers are covered by a pension scheme. In Bangladesh, the coverage rate is 24%, lower than in South Asian neighbors the Maldives (68%) and Nepal (31%).
Revamping Social Protection in Bangladesh
Bangladesh already has a basic social security infrastructure. After independence, the government pension was set up, complemented by a provident fund that acted as a savings vehicle for government and private sector employees and provided them with lump-sum amounts on retirement. The social security landscape has changed significantly since then, fueled by greater demand for safety net measures as the population has expanded. Figure A3.1 shows that most benefits of the various social protection programs accrue to households in the rural areas, where most people in Bangladesh live.
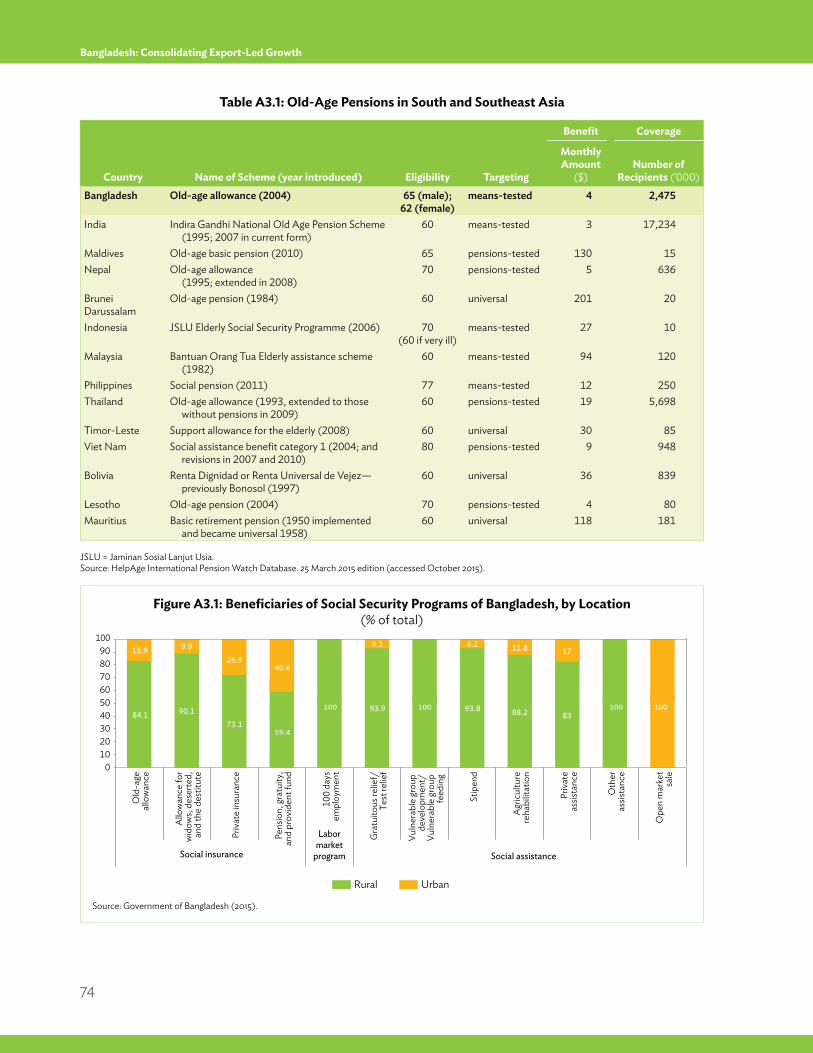
74
Bangladesh: Consolidating Export-Led Growth
Table A3.1: Old-Age Pensions in South and Southeast Asia
JSLU = Jaminan Sosial Lanjut Usia.Source: HelpAge International Pension Watch Database. 25 March 2015 edition (accessed October 2015).
Country Name of Scheme (year introduced) Eligibility Targeting
Benefit Coverage
Monthly Amount
($)Number of
Recipients ('000)
Bangladesh Old-age allowance (2004) 65 (male); 62 (female)
means-tested 4 2,475
India Indira Gandhi National Old Age Pension Scheme (1995; 2007 in current form)
60 means-tested 3 17,234
Maldives Old-age basic pension (2010) 65 pensions-tested 130 15Nepal Old-age allowance
(1995; extended in 2008)70 pensions-tested 5 636
Brunei Darussalam
Old-age pension (1984) 60 universal 201 20
Indonesia JSLU Elderly Social Security Programme (2006) 70 (60 if very ill)
means-tested 27 10
Malaysia Bantuan Orang Tua Elderly assistance scheme (1982)
60 means-tested 94 120
Philippines Social pension (2011) 77 means-tested 12 250Thailand Old-age allowance (1993, extended to those
without pensions in 2009)60 pensions-tested 19 5,698
Timor-Leste Support allowance for the elderly (2008) 60 universal 30 85Viet Nam Social assistance benefit category 1 (2004; and
revisions in 2007 and 2010)80 pensions-tested 9 948
Bolivia Renta Dignidad or Renta Universal de Vejez—previously Bonosol (1997)
60 universal 36 839
Lesotho Old-age pension (2004) 70 pensions-tested 4 80Mauritius Basic retirement pension (1950 implemented
and became universal 1958)60 universal 118 181
Social insurance
Labormarket
program Social assistance
0
706050
10
403020
90 15.9
84.1
26.9
73.1
17
83
40.6
59.4
100 100 100 100
9.9
90.1
6.1
93.9
6.2
93.8
11.8
88.2
80
100
Old
-age
allo
wan
ce
Allo
wan
ce fo
rw
idow
s, d
eser
ted,
and
the
dest
itute
Priv
ate
insu
ranc
e
Pens
ion,
grat
uity
,an
d pr
ovid
ent f
und
100
days
empl
oym
ent
Gra
tuito
us re
lief/
Test
relie
f
Vuln
erab
le gr
oup
deve
lopm
ent/
Vuln
erab
le gr
oup
feed
ing
Stip
end
Agr
icul
ture
reha
bilit
atio
n
Priv
ate
assis
tanc
e
Oth
eras
sista
nce
Ope
n m
arke
tsa
le
Rural Urban
Figure A3.1: Beneficiaries of Social Security Programs of Bangladesh, by Location(% of total)
Source: Government of Bangladesh (2015).
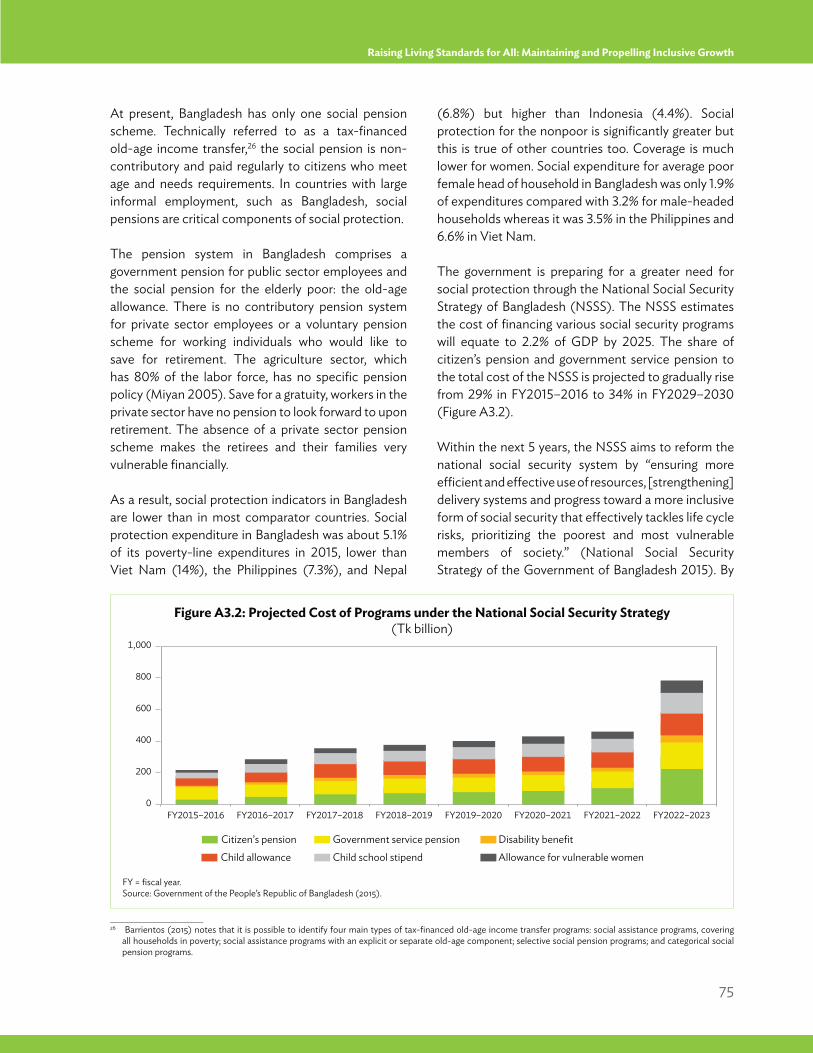
75
Raising Living Standards for All: Maintaining and Propelling Inclusive Growth
At present, Bangladesh has only one social pension scheme. Technically referred to as a tax-financed old-age income transfer,26 the social pension is non-contributory and paid regularly to citizens who meet age and needs requirements. In countries with large informal employment, such as Bangladesh, social pensions are critical components of social protection.
The pension system in Bangladesh comprises a government pension for public sector employees and the social pension for the elderly poor: the old-age allowance. There is no contributory pension system for private sector employees or a voluntary pension scheme for working individuals who would like to save for retirement. The agriculture sector, which has 80% of the labor force, has no specific pension policy (Miyan 2005). Save for a gratuity, workers in the private sector have no pension to look forward to upon retirement. The absence of a private sector pension scheme makes the retirees and their families very vulnerable financially.
As a result, social protection indicators in Bangladesh are lower than in most comparator countries. Social protection expenditure in Bangladesh was about 5.1% of its poverty-line expenditures in 2015, lower than Viet Nam (14%), the Philippines (7.3%), and Nepal
(6.8%) but higher than Indonesia (4.4%). Social protection for the nonpoor is significantly greater but this is true of other countries too. Coverage is much lower for women. Social expenditure for average poor female head of household in Bangladesh was only 1.9% of expenditures compared with 3.2% for male-headed households whereas it was 3.5% in the Philippines and 6.6% in Viet Nam.
The government is preparing for a greater need for social protection through the National Social Security Strategy of Bangladesh (NSSS). The NSSS estimates the cost of financing various social security programs will equate to 2.2% of GDP by 2025. The share of citizen’s pension and government service pension to the total cost of the NSSS is projected to gradually rise from 29% in FY2015–2016 to 34% in FY2029–2030 (Figure A3.2).
Within the next 5 years, the NSSS aims to reform the national social security system by “ensuring more efficient and effective use of resources, [strengthening] delivery systems and progress toward a more inclusive form of social security that effectively tackles life cycle risks, prioritizing the poorest and most vulnerable members of society.” (National Social Security Strategy of the Government of Bangladesh 2015). By
Child allowance Child school stipend Allowance for vulnerable womenCitizen’s pension Government service pension Disability benefit
0
600
400
200
800
1,000
FY2015–2016 FY2016–2017 FY2017–2018 FY2018–2019 FY2019–2020 FY2020–2021 FY2021–2022 FY2022–2023
____________________26 Barrientos (2015) notes that it is possible to identify four main types of tax-financed old-age income transfer programs: social assistance programs, covering
all households in poverty; social assistance programs with an explicit or separate old-age component; selective social pension programs; and categorical social pension programs.
Figure A3.2: Projected Cost of Programs under the National Social Security Strategy (Tk billion)
FY = fiscal year.Source: Government of the People’s Republic of Bangladesh (2015).
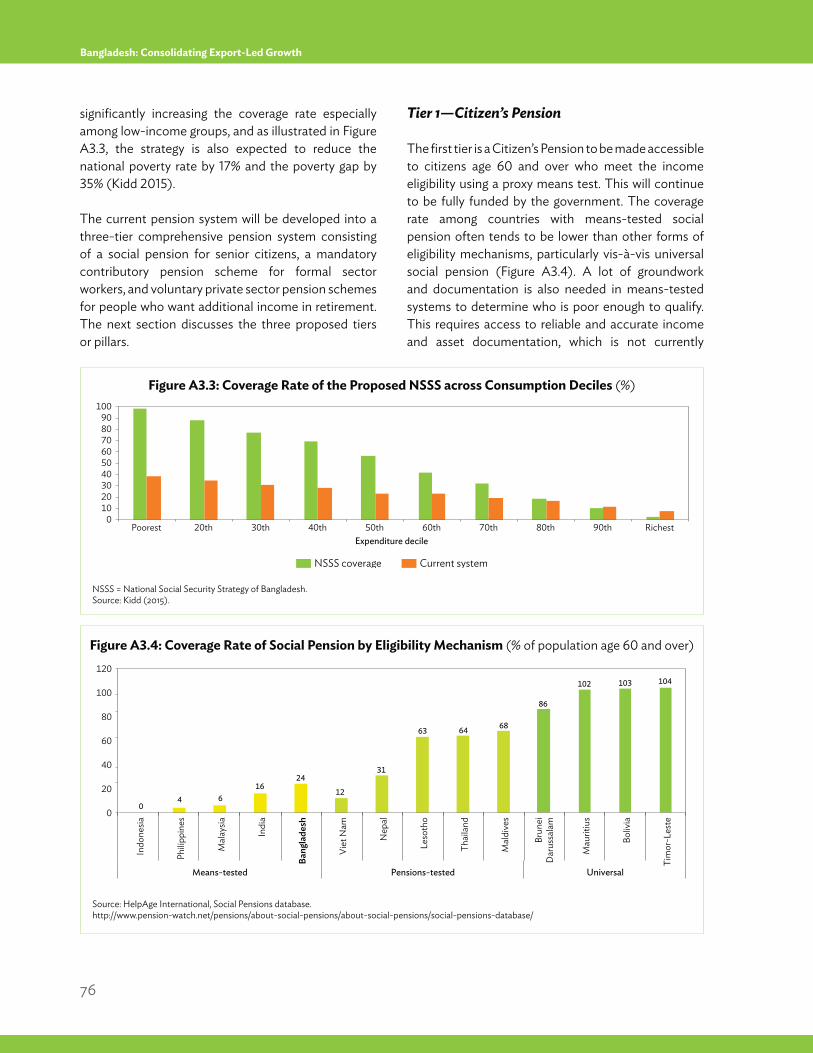
76
Bangladesh: Consolidating Export-Led Growth
significantly increasing the coverage rate especially among low-income groups, and as illustrated in Figure A3.3, the strategy is also expected to reduce the national poverty rate by 17% and the poverty gap by 35% (Kidd 2015).
The current pension system will be developed into a three-tier comprehensive pension system consisting of a social pension for senior citizens, a mandatory contributory pension scheme for formal sector workers, and voluntary private sector pension schemes for people who want additional income in retirement. The next section discusses the three proposed tiers or pillars.
Tier 1—Citizen’s Pension
The first tier is a Citizen’s Pension to be made accessible to citizens age 60 and over who meet the income eligibility using a proxy means test. This will continue to be fully funded by the government. The coverage rate among countries with means-tested social pension often tends to be lower than other forms of eligibility mechanisms, particularly vis-à-vis universal social pension (Figure A3.4). A lot of groundwork and documentation is also needed in means-tested systems to determine who is poor enough to qualify. This requires access to reliable and accurate income and asset documentation, which is not currently
Figure A3.3: Coverage Rate of the Proposed NSSS across Consumption Deciles (%)
Figure A3.4: Coverage Rate of Social Pension by Eligibility Mechanism (% of population age 60 and over)
NSSS = National Social Security Strategy of Bangladesh. Source: Kidd (2015).
Source: HelpAge International, Social Pensions database.http://www.pension-watch.net/pensions/about-social-pensions/about-social-pensions/social-pensions-database/
NSSS coverage Current system
0102030405060708090
100
Poorest 20th 30th 40th 50th 60th 70th 80th 90th RichestExpenditure decile
0
20
40
60
80
100
04 6
1624
12
31
63 64 68
86
102 103 104120
Indo
nesia
Philip
pine
s
Mal
aysia
Indi
a
Bang
lade
sh
Viet
Nam
Nep
al
Leso
tho
Thai
land
Mal
dive
s
Brun
eiD
arus
sala
m
Mau
ritiu
s
Boliv
ia
Tim
or-L
este
Means-tested Pensions-tested Universal
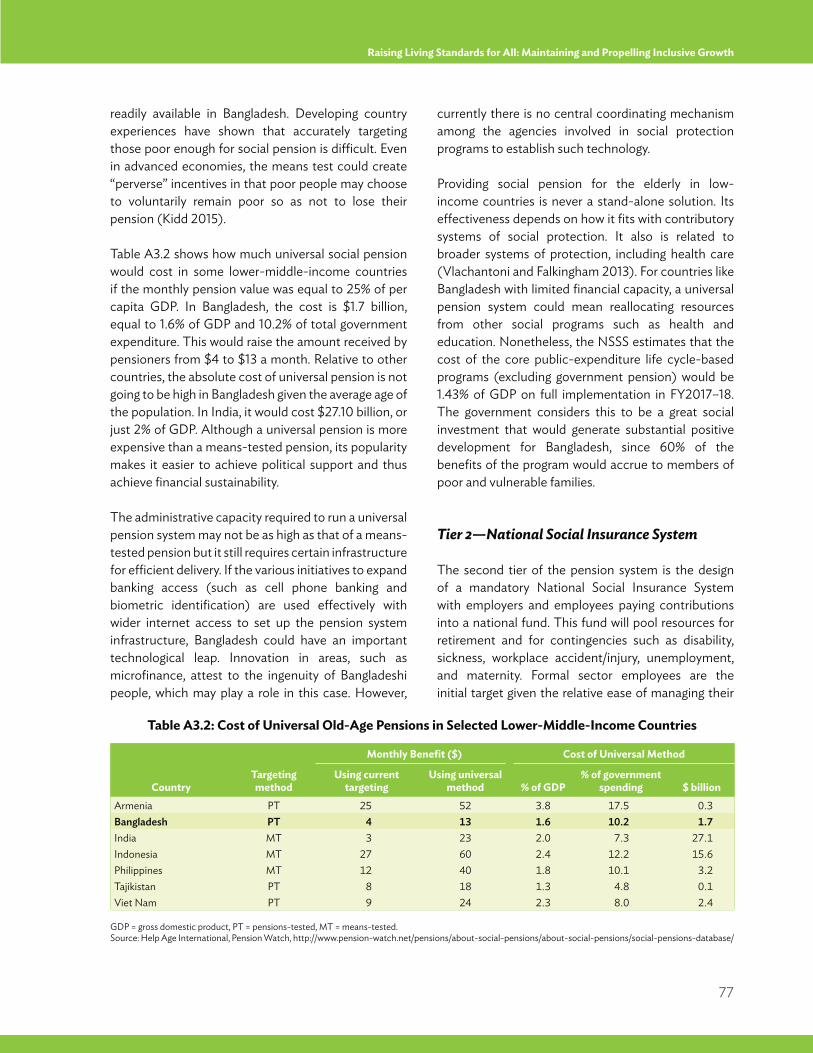
77
Raising Living Standards for All: Maintaining and Propelling Inclusive Growth
readily available in Bangladesh. Developing country experiences have shown that accurately targeting those poor enough for social pension is difficult. Even in advanced economies, the means test could create “perverse” incentives in that poor people may choose to voluntarily remain poor so as not to lose their pension (Kidd 2015).
Table A3.2 shows how much universal social pension would cost in some lower-middle-income countries if the monthly pension value was equal to 25% of per capita GDP. In Bangladesh, the cost is $1.7 billion, equal to 1.6% of GDP and 10.2% of total government expenditure. This would raise the amount received by pensioners from $4 to $13 a month. Relative to other countries, the absolute cost of universal pension is not going to be high in Bangladesh given the average age of the population. In India, it would cost $27.10 billion, or just 2% of GDP. Although a universal pension is more expensive than a means-tested pension, its popularity makes it easier to achieve political support and thus achieve financial sustainability.
The administrative capacity required to run a universal pension system may not be as high as that of a means-tested pension but it still requires certain infrastructure for efficient delivery. If the various initiatives to expand banking access (such as cell phone banking and biometric identification) are used effectively with wider internet access to set up the pension system infrastructure, Bangladesh could have an important technological leap. Innovation in areas, such as microfinance, attest to the ingenuity of Bangladeshi people, which may play a role in this case. However,
currently there is no central coordinating mechanism among the agencies involved in social protection programs to establish such technology.
Providing social pension for the elderly in low-income countries is never a stand-alone solution. Its effectiveness depends on how it fits with contributory systems of social protection. It also is related to broader systems of protection, including health care (Vlachantoni and Falkingham 2013). For countries like Bangladesh with limited financial capacity, a universal pension system could mean reallocating resources from other social programs such as health and education. Nonetheless, the NSSS estimates that the cost of the core public-expenditure life cycle-based programs (excluding government pension) would be 1.43% of GDP on full implementation in FY2017–18. The government considers this to be a great social investment that would generate substantial positive development for Bangladesh, since 60% of the benefits of the program would accrue to members of poor and vulnerable families.
Tier 2—National Social Insurance System
The second tier of the pension system is the design of a mandatory National Social Insurance System with employers and employees paying contributions into a national fund. This fund will pool resources for retirement and for contingencies such as disability, sickness, workplace accident/injury, unemployment, and maternity. Formal sector employees are the initial target given the relative ease of managing their
Table A3.2: Cost of Universal Old-Age Pensions in Selected Lower-Middle-Income Countries
GDP = gross domestic product, PT = pensions-tested, MT = means-tested.Source: Help Age International, Pension Watch, http://www.pension-watch.net/pensions/about-social-pensions/about-social-pensions/social-pensions-database/
CountryTargeting method
Monthly Benefit ($) Cost of Universal Method
Using current targeting
Using universal method % of GDP
% of government spending $ billion
Armenia PT 25 52 3.8 17.5 0.3Bangladesh PT 4 13 1.6 10.2 1.7India MT 3 23 2.0 7.3 27.1Indonesia MT 27 60 2.4 12.2 15.6Philippines MT 12 40 1.8 10.1 3.2Tajikistan PT 8 18 1.3 4.8 0.1Viet Nam PT 9 24 2.3 8.0 2.4
78
Bangladesh: Consolidating Export-Led Growth
mandatory payment arrangements. The scheme will be funded through contributions and managed by the Insurance Development and Regulatory Authority under the Ministry of Finance. The National Social Insurance System is central to the government’s long-term vision for social security in Bangladesh and it will be instrumental in the development of universal pension coverage along with the tier 1 Citizen’s Pension.
Occupational pensions may be generally categorized into two types: defined benefit and defined contribution. A defined benefit pension scheme provides employees with a fixed, preestablished benefit upon retirement based on a formula that takes into account the number of years of service and contributions based mostly on income or wages. In contrast, there is no automatic pension in a defined contribution scheme. Instead, individual accounts are created for every employee and the contributions are pooled into a fund with counterpart contributions from the employer. Upon retirement, an employee could receive either a lump-sum amount or an annuity, (a stream of payments that extends until death). There is no guaranteed amount on retirement; the pension would depend on the performance of the pension funds. There can be many accounts, such as in the case of Singapore.27
Defined benefit and defined contribution plans differ in the risks they present to employers and employees, the sensitivity of benefits to inflation, the flexibility of funding, the importance of governmental supervision, and in the investment performance of the pension fund. In defined benefit schemes, society shares in the investment and longevity risk. In defined contribution schemes, the individual bears the risk. Defined contribution schemes are essentially fully funded; that is, the market value of the pension fund’s assets is equal to the liability of the employer to the fund’s beneficiaries.
Many countries offer a combination of the two, with some limitations. The defined benefits system is more complex and may not be very practical to implement
in a country with almost 90% of income earned from informal sector activities and/or remittances. Although capital markets need to develop further, a defined contribution system could be set up gradually in Bangladesh. Indeed, remittances from overseas workers tend to provide an important source of savings in all countries, and Bangladesh is no exception (see Chapter 3 of ADB 2016b).
Table A3.3 lists the mandatory old-age income security programs available in some Asian countries. Mandatory publicly managed defined benefit schemes exist in the People’s Republic of China, India, the Republic of Korea, the Lao People’s Democratic Republic (Lao PDR), Pakistan, the Philippines, Thailand, and Viet Nam. For Brunei Darussalam, Indonesia, Malaysia, Nepal, Singapore, and Sri Lanka, defined contribution schemes take the form of provident funds, and this could be a consideration for Bangladesh. Contribution rates vary. For the insured person, it ranges from 1% (Pakistan) to 20% (Singapore), while for the contributor it ranges from 2.5% (Lao PDR) to 20% (People’s Republic of China). The establishment of a defined contribution scheme has begun. The Ministry of Finance will be in charge of the NSSS and will coordinate with the banks. For the moment, the Insurance Development and Regulatory Authority, and the health and labor ministries will regulate and manage the new system from 2015 to 2026, and a new agency could sprout thereafter. Greater administrative capacity will also be needed to implement and monitor compliance with laws mandating the contribution arrangement between employer and employee.
Another challenge will be bringing the huge informal sector within the envelope of social insurance. Selling voluntary pension schemes to informal sector workers and ensuring their compliance with compulsory systems is difficult. Informal sector workers have low and variable pay, low capacity to save and are more likely to default on mandatory payments. Hu and Stewart (2009) recommend using existing nonpension
____________________27 For example, in Singapore, the Central Provident Fund provides four types of accounts per member: (i) an ordinary account to finance the purchase of a house,
medical insurance, and education; (ii) a special account, which is primarily for retirement but may be invested in retirement-related financial instruments; (iii) a Medisave account for medical expenses; and (iv) a retirement account to finance periodic payments at retirement (annuities paid out until the account is depleted).
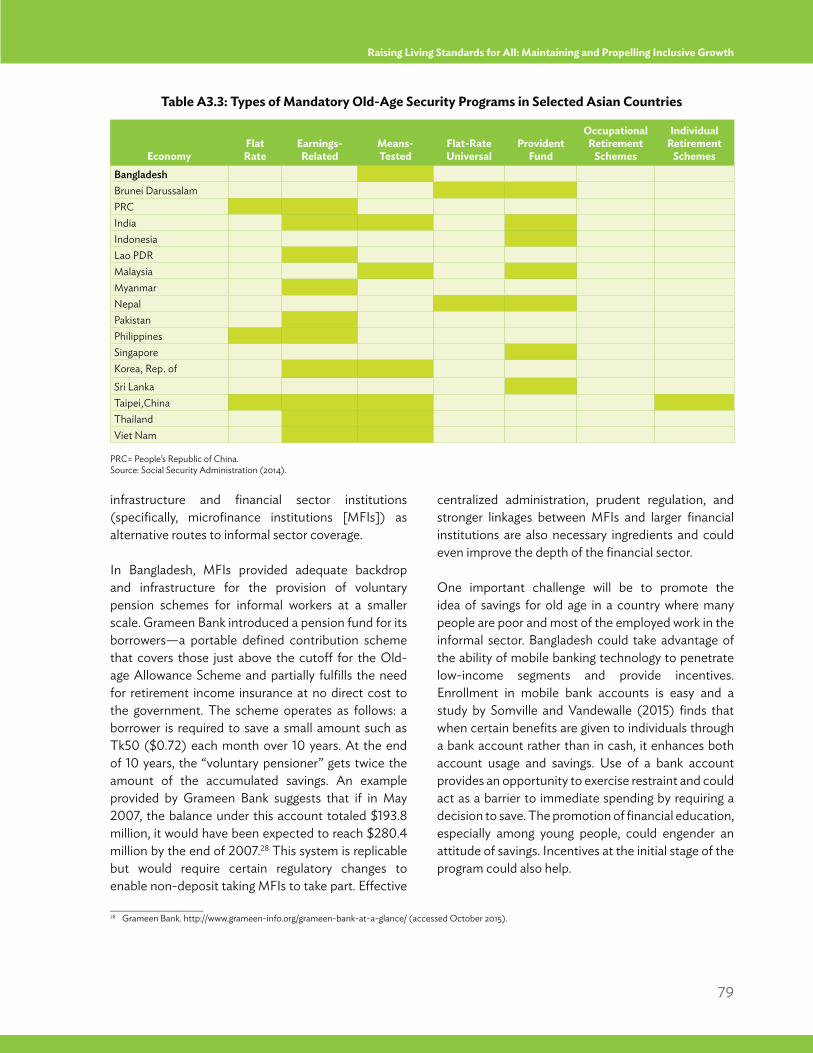
79
Raising Living Standards for All: Maintaining and Propelling Inclusive Growth
infrastructure and financial sector institutions (specifically, microfinance institutions [MFIs]) as alternative routes to informal sector coverage.
In Bangladesh, MFIs provided adequate backdrop and infrastructure for the provision of voluntary pension schemes for informal workers at a smaller scale. Grameen Bank introduced a pension fund for its borrowers—a portable defined contribution scheme that covers those just above the cutoff for the Old-age Allowance Scheme and partially fulfills the need for retirement income insurance at no direct cost to the government. The scheme operates as follows: a borrower is required to save a small amount such as Tk50 ($0.72) each month over 10 years. At the end of 10 years, the “voluntary pensioner” gets twice the amount of the accumulated savings. An example provided by Grameen Bank suggests that if in May 2007, the balance under this account totaled $193.8 million, it would have been expected to reach $280.4 million by the end of 2007.28 This system is replicable but would require certain regulatory changes to enable non-deposit taking MFIs to take part. Effective
centralized administration, prudent regulation, and stronger linkages between MFIs and larger financial institutions are also necessary ingredients and could even improve the depth of the financial sector.
One important challenge will be to promote the idea of savings for old age in a country where many people are poor and most of the employed work in the informal sector. Bangladesh could take advantage of the ability of mobile banking technology to penetrate low-income segments and provide incentives. Enrollment in mobile bank accounts is easy and a study by Somville and Vandewalle (2015) finds that when certain benefits are given to individuals through a bank account rather than in cash, it enhances both account usage and savings. Use of a bank account provides an opportunity to exercise restraint and could act as a barrier to immediate spending by requiring a decision to save. The promotion of financial education, especially among young people, could engender an attitude of savings. Incentives at the initial stage of the program could also help.
____________________28 Grameen Bank. http://www.grameen-info.org/grameen-bank-at-a-glance/ (accessed October 2015).
PRC= People’s Republic of China. Source: Social Security Administration (2014).
Table A3.3: Types of Mandatory Old-Age Security Programs in Selected Asian Countries
EconomyFlat Rate
Earnings-Related
Means-Tested
Flat-Rate Universal
Provident Fund
Occupational Retirement
Schemes
Individual Retirement
SchemesBangladeshBrunei DarussalamPRCIndia IndonesiaLao PDRMalaysiaMyanmarNepalPakistanPhilippinesSingaporeKorea, Rep. of
Sri LankaTaipei,ChinaThailandViet Nam
80
Bangladesh: Consolidating Export-Led Growth
Tier 3—Private Voluntary Pensions
The third tier of a pensions system for Bangladesh consists of private (self-funded) pensions for citizens who want more income in old age. One option is to establish a pensions regulatory authority to regulate and supervise private pensions to ensure their integrity, fairness, and sustainability. The Bank and Financial Institutions Division of the Ministry of Finance currently has the role of regulator. It is studying private pensions to examine how to promote their growth while ensuring the security of investments in such schemes.
Voluntary private pensions could help tap the old-age savings needs of overseas Bangladeshi workers and act as a channel for remittances to be set aside for future needs by investing the funds in the local financial market. In this manner, private pension funds help develop financial market depth. Private pension funds are long-term investors with portfolios linked to capital market activities. On a macro-scale, pension funds inject long-term savings, which Bangladesh could use to finance infrastructure investment projects.
Conclusion
Despite the challenges of reforming the social protection system, the Bangladesh government’s April 2015 approval of the National Social Security Strategy is a move in the right direction. The biggest feature of the strategy is the establishment of a mandatory occupational pension for formal sector workers. The design of this scheme should consider pension adequacy (in coverage and risk), its affordability for individuals and businesses, and fiscal and macroeconomic perspectives such as financial soundness and sustainability and its robustness to withstand economic and financial shocks. Provision of a postretirement income with a safety net for the elderly poor should also be considered. The sustainability of the National Social Security Strategy will depend on the success of the Medium-Term Revenue Mobilization Plan as articulated in the Sixth Five-Year Plan.
Bangladesh’s population characteristics underscore the need to provide for old age now. Bangladesh could capitalize on its demographic dividend by managing ways to increase savings (through education and skills promotion) to generate higher income. With higher pay comes wider room to save for both immediate needs and for the golden years.
81
The Energy Challenge: A Critical Constraint to Growth
Chapter 4The Energy Challenge: A Critical
Constraint to Growth
Like many countries, Bangladesh will need to import more energy to fuel its economy, which is what most non-oil producing countries do. We argue, nonetheless, that many possibilities still exist to make production and distribution more cost-effective and to enact policies that will encourage consumers to use energy more efficiently. Studies have shown that energy efficiency can save 10%–20% of energy by changing consumer behavior through mandates or changes in prices and tariffs that discourage overuse of energy.30 Energy prices are way too low and concerted effort is needed to rationalize prices. Since international oil and gas prices are near their lowest in almost 12 years (as of mid-2016), removing the subsidy component now would not affect the budget. At the same time, it would not impact actual prices for final consumers. Households could gradually adjust their consumption if prices rise again.
After describing the structure of the energy and power sector and energy demand structure, this chapter explains why excess demand for energy exists and how this is affecting medium-term growth. It then offers three possible solutions. First, energy prices have to be higher to induce energy conservation by households and firms. This is related to the removal of broad-based
4.1 Introduction
The energy supply–demand gap in Bangladesh, according to a strong consensus, remains among the main constraints to sustained economic growth. The country has been grappling with this issue over the last decade, mostly by finding ways to bring supply online quickly until longer-term policies can truly take effect. As incomes grow, so does the consumption of energy per capita, at 3% annually. What are the issues, and how can the energy gap be more permanently resolved? This chapter explains the reasons behind the supply–demand gap, and why some of the policies implemented in recent years have not had the intended impact.
In the last 5 years, Bangladesh installed significant new capacity and made enormous advances in rural electrification in remote areas and urban slums, as discussed in section 3.5.1. At the macro level, however, the country has not succeeded in attracting the private sector to oil, natural gas, and electricity production. Even if installation of energy capacity is accelerated, this will be a moving target: energy consumption per capita is still very low in Bangladesh, but income elasticity is very high.29 This means that demand will rise almost twice as fast as income under a business-as-usual scenario.____________________29 The term “elasticity” most commonly refers to sensitivity or responsiveness. Generally, it was used to quantify the response in one variable when another variable
changes.30 See for example the Energy Star program in the United States, https://www.energystar.gov. Of course, it can vary vastly by locality. The United States Energy
Information Administration compiles many local and international sources with detailed savings from improved energy efficiency. See https://www.eia.gov/emeu/efficiency/energy_savings.htm
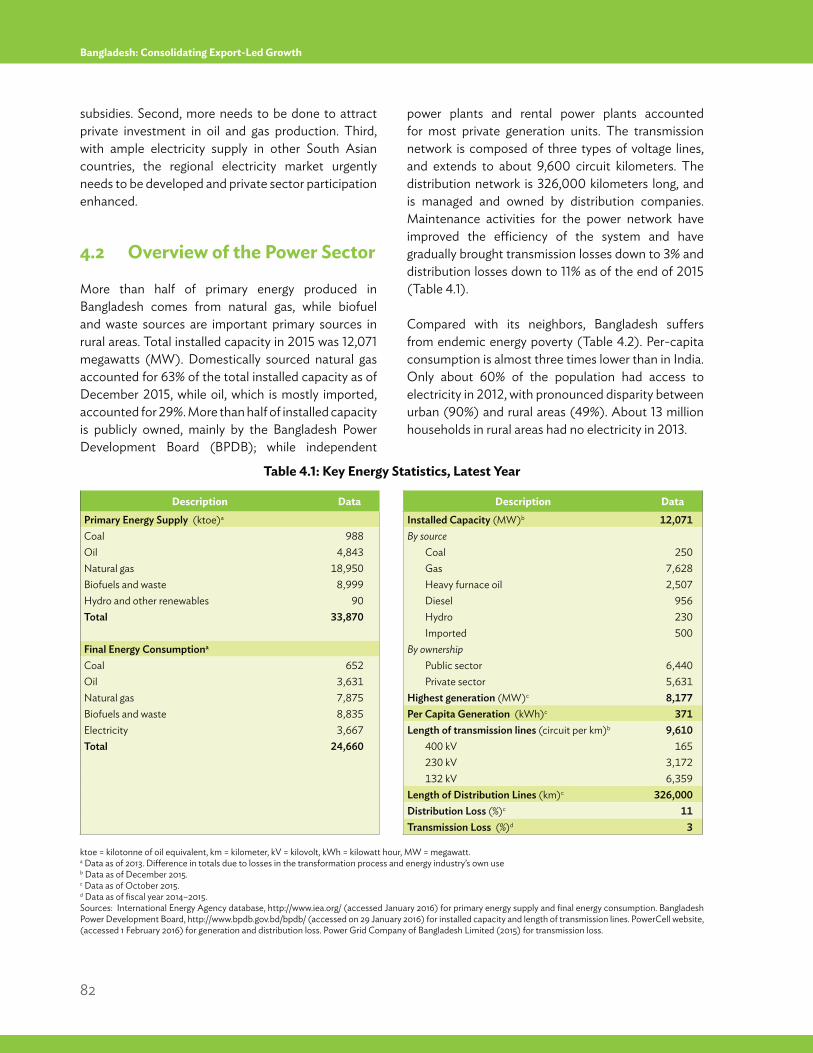
82
Bangladesh: Consolidating Export-Led Growth
subsidies. Second, more needs to be done to attract private investment in oil and gas production. Third, with ample electricity supply in other South Asian countries, the regional electricity market urgently needs to be developed and private sector participation enhanced.
4.2 Overview of the Power Sector
More than half of primary energy produced in Bangladesh comes from natural gas, while biofuel and waste sources are important primary sources in rural areas. Total installed capacity in 2015 was 12,071 megawatts (MW). Domestically sourced natural gas accounted for 63% of the total installed capacity as of December 2015, while oil, which is mostly imported, accounted for 29%. More than half of installed capacity is publicly owned, mainly by the Bangladesh Power Development Board (BPDB); while independent
power plants and rental power plants accounted for most private generation units. The transmission network is composed of three types of voltage lines, and extends to about 9,600 circuit kilometers. The distribution network is 326,000 kilometers long, and is managed and owned by distribution companies. Maintenance activities for the power network have improved the efficiency of the system and have gradually brought transmission losses down to 3% and distribution losses down to 11% as of the end of 2015 (Table 4.1). Compared with its neighbors, Bangladesh suffers from endemic energy poverty (Table 4.2). Per-capita consumption is almost three times lower than in India. Only about 60% of the population had access to electricity in 2012, with pronounced disparity between urban (90%) and rural areas (49%). About 13 million households in rural areas had no electricity in 2013.
Table 4.1: Key Energy Statistics, Latest Year
ktoe = kilotonne of oil equivalent, km = kilometer, kV = kilovolt, kWh = kilowatt hour, MW = megawatt.a Data as of 2013. Difference in totals due to losses in the transformation process and energy industry’s own useb Data as of December 2015. c Data as of October 2015.d Data as of fiscal year 2014–2015.Sources: International Energy Agency database, http://www.iea.org/ (accessed January 2016) for primary energy supply and final energy consumption. Bangladesh Power Development Board, http://www.bpdb.gov.bd/bpdb/ (accessed on 29 January 2016) for installed capacity and length of transmission lines. PowerCell website, (accessed 1 February 2016) for generation and distribution loss. Power Grid Company of Bangladesh Limited (2015) for transmission loss.
Description Data Description DataPrimary Energy Supply (ktoe)a Installed Capacity (MW)b 12,071Coal 988 By sourceOil 4,843 Coal 250Natural gas 18,950 Gas 7,628Biofuels and waste 8,999 Heavy furnace oil 2,507Hydro and other renewables 90 Diesel 956Total 33,870 Hydro 230
Imported 500Final Energy Consumptiona By ownershipCoal 652 Public sector 6,440Oil 3,631 Private sector 5,631Natural gas 7,875 Highest generation (MW)c 8,177 Biofuels and waste 8,835 Per Capita Generation (kWh)c 371 Electricity 3,667 Length of transmission lines (circuit per km)b 9,610Total 24,660 400 kV 165
230 kV 3,172132 kV 6,359
Length of Distribution Lines (km)c 326,000Distribution Loss (%)c 11Transmission Loss (%)d 3
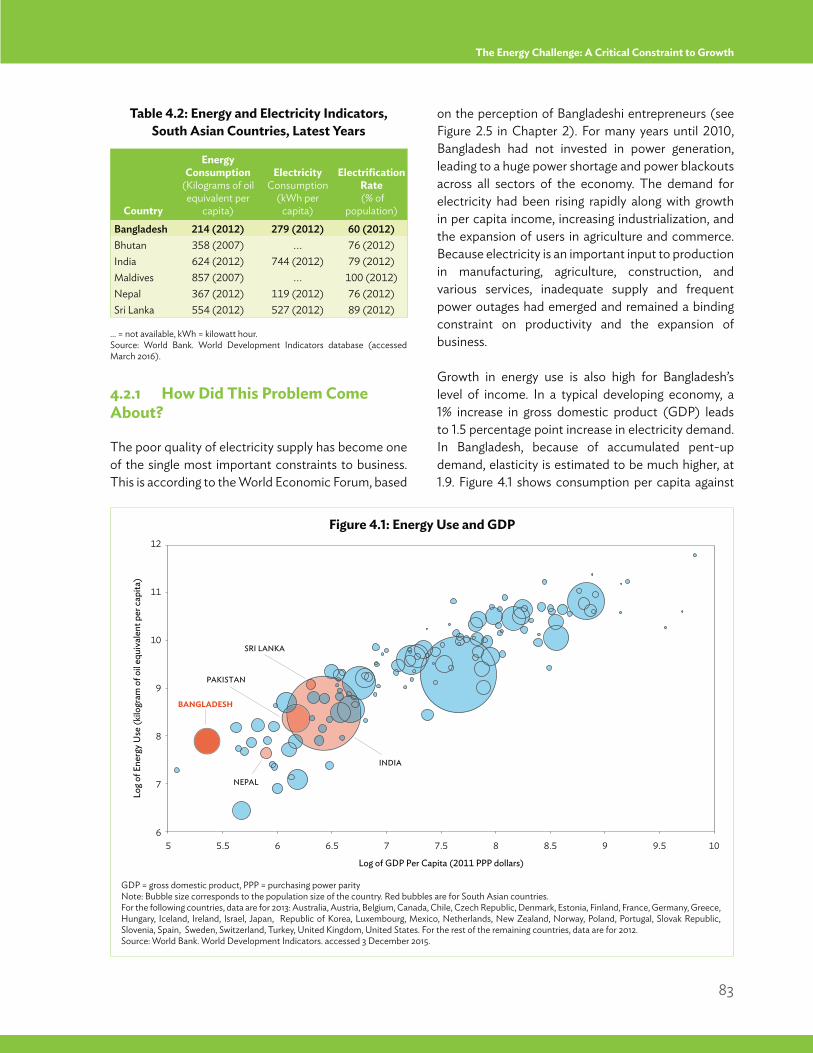
83
The Energy Challenge: A Critical Constraint to Growth
4.2.1 How Did This Problem Come About?
The poor quality of electricity supply has become one of the single most important constraints to business. This is according to the World Economic Forum, based
on the perception of Bangladeshi entrepreneurs (see Figure 2.5 in Chapter 2). For many years until 2010, Bangladesh had not invested in power generation, leading to a huge power shortage and power blackouts across all sectors of the economy. The demand for electricity had been rising rapidly along with growth in per capita income, increasing industrialization, and the expansion of users in agriculture and commerce. Because electricity is an important input to production in manufacturing, agriculture, construction, and various services, inadequate supply and frequent power outages had emerged and remained a binding constraint on productivity and the expansion of business.
Growth in energy use is also high for Bangladesh’s level of income. In a typical developing economy, a 1% increase in gross domestic product (GDP) leads to 1.5 percentage point increase in electricity demand. In Bangladesh, because of accumulated pent-up demand, elasticity is estimated to be much higher, at 1.9. Figure 4.1 shows consumption per capita against
Table 4.2: Energy and Electricity Indicators, South Asian Countries, Latest Years
… = not available, kWh = kilowatt hour.Source: World Bank. World Development Indicators database (accessed March 2016).
Country
Energy Consumption
(Kilograms of oil equivalent per
capita)
Electricity Consumption
(kWh per capita)
Electrification Rate (% of
population)
Bangladesh 214 (2012) 279 (2012) 60 (2012)Bhutan 358 (2007) ... 76 (2012)India 624 (2012) 744 (2012) 79 (2012)Maldives 857 (2007) ... 100 (2012)Nepal 367 (2012) 119 (2012) 76 (2012)Sri Lanka 554 (2012) 527 (2012) 89 (2012)
Figure 4.1: Energy Use and GDP
GDP = gross domestic product, PPP = purchasing power parityNote: Bubble size corresponds to the population size of the country. Red bubbles are for South Asian countries.For the following countries, data are for 2013: Australia, Austria, Belgium, Canada, Chile, Czech Republic, Denmark, Estonia, Finland, France, Germany, Greece, Hungary, Iceland, Ireland, Israel, Japan, Republic of Korea, Luxembourg, Mexico, Netherlands, New Zealand, Norway, Poland, Portugal, Slovak Republic, Slovenia, Spain, Sweden, Switzerland, Turkey, United Kingdom, United States. For the rest of the remaining countries, data are for 2012.Source: World Bank. World Development Indicators. accessed 3 December 2015.
6
8
7
9
10
11
12
SRI LANKA
PAKISTAN
INDIA
NEPAL
BANGLADESH
Log
of E
nerg
y Use
(kilo
gram
of o
il eq
uiva
lent
per
cap
ita)
Log of GDP Per Capita (2011 PPP dollars)
6.55.55 6 7 7.5 8 8.5 9 9.5 10
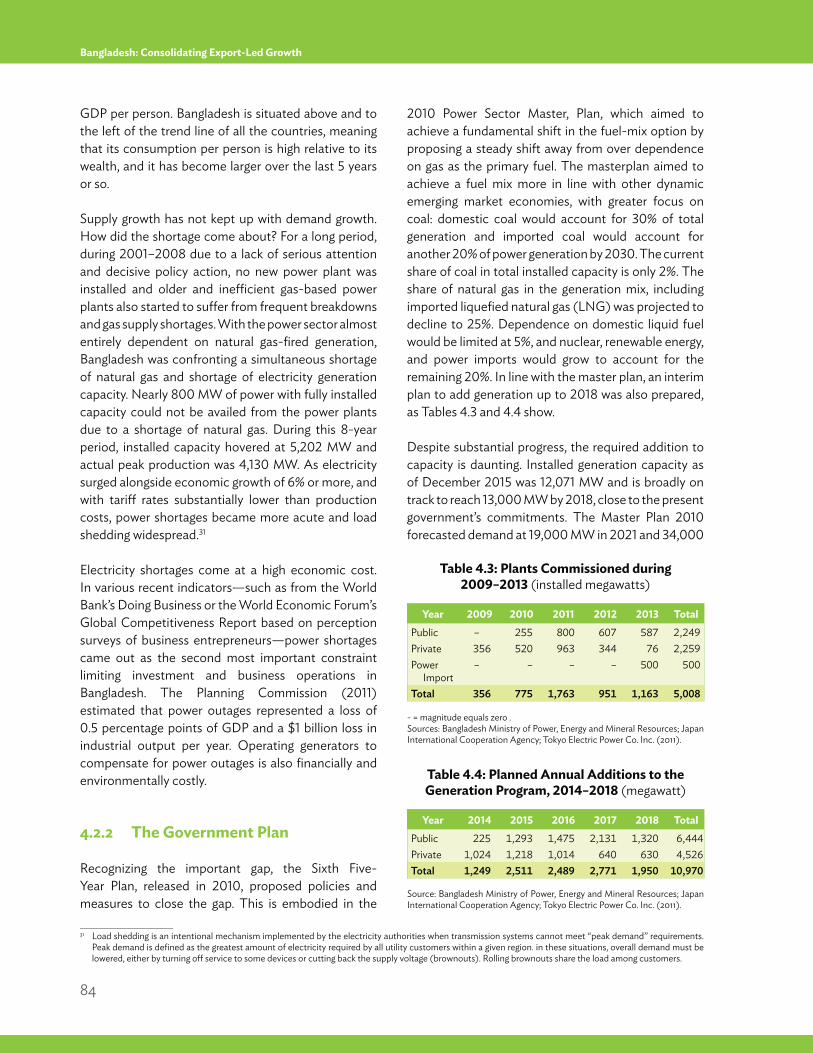
84
Bangladesh: Consolidating Export-Led Growth
GDP per person. Bangladesh is situated above and to the left of the trend line of all the countries, meaning that its consumption per person is high relative to its wealth, and it has become larger over the last 5 years or so.
Supply growth has not kept up with demand growth. How did the shortage come about? For a long period, during 2001–2008 due to a lack of serious attention and decisive policy action, no new power plant was installed and older and inefficient gas-based power plants also started to suffer from frequent breakdowns and gas supply shortages. With the power sector almost entirely dependent on natural gas-fired generation, Bangladesh was confronting a simultaneous shortage of natural gas and shortage of electricity generation capacity. Nearly 800 MW of power with fully installed capacity could not be availed from the power plants due to a shortage of natural gas. During this 8-year period, installed capacity hovered at 5,202 MW and actual peak production was 4,130 MW. As electricity surged alongside economic growth of 6% or more, and with tariff rates substantially lower than production costs, power shortages became more acute and load shedding widespread.31
Electricity shortages come at a high economic cost. In various recent indicators—such as from the World Bank’s Doing Business or the World Economic Forum’s Global Competitiveness Report based on perception surveys of business entrepreneurs—power shortages came out as the second most important constraint limiting investment and business operations in Bangladesh. The Planning Commission (2011) estimated that power outages represented a loss of 0.5 percentage points of GDP and a $1 billion loss in industrial output per year. Operating generators to compensate for power outages is also financially and environmentally costly.
4.2.2 The Government Plan
Recognizing the important gap, the Sixth Five-Year Plan, released in 2010, proposed policies and measures to close the gap. This is embodied in the
2010 Power Sector Master, Plan, which aimed to achieve a fundamental shift in the fuel-mix option by proposing a steady shift away from over dependence on gas as the primary fuel. The masterplan aimed to achieve a fuel mix more in line with other dynamic emerging market economies, with greater focus on coal: domestic coal would account for 30% of total generation and imported coal would account for another 20% of power generation by 2030. The current share of coal in total installed capacity is only 2%. The share of natural gas in the generation mix, including imported liquefied natural gas (LNG) was projected to decline to 25%. Dependence on domestic liquid fuel would be limited at 5%, and nuclear, renewable energy, and power imports would grow to account for the remaining 20%. In line with the master plan, an interim plan to add generation up to 2018 was also prepared, as Tables 4.3 and 4.4 show.
Despite substantial progress, the required addition to capacity is daunting. Installed generation capacity as of December 2015 was 12,071 MW and is broadly on track to reach 13,000 MW by 2018, close to the present government’s commitments. The Master Plan 2010 forecasted demand at 19,000 MW in 2021 and 34,000
____________________31 Load shedding is an intentional mechanism implemented by the electricity authorities when transmission systems cannot meet “peak demand” requirements.
Peak demand is defined as the greatest amount of electricity required by all utility customers within a given region. in these situations, overall demand must be lowered, either by turning off service to some devices or cutting back the supply voltage (brownouts). Rolling brownouts share the load among customers.
Year 2009 2010 2011 2012 2013 TotalPublic – 255 800 607 587 2,249Private 356 520 963 344 76 2,259Power
Import– – – – 500 500
Total 356 775 1,763 951 1,163 5,008
Year 2014 2015 2016 2017 2018 TotalPublic 225 1,293 1,475 2,131 1,320 6,444Private 1,024 1,218 1,014 640 630 4,526Total 1,249 2,511 2,489 2,771 1,950 10,970
Table 4.3: Plants Commissioned during 2009–2013 (installed megawatts)
Table 4.4: Planned Annual Additions to the Generation Program, 2014–2018 (megawatt)
- = magnitude equals zero .Sources: Bangladesh Ministry of Power, Energy and Mineral Resources; Japan International Cooperation Agency; Tokyo Electric Power Co. Inc. (2011).
Source: Bangladesh Ministry of Power, Energy and Mineral Resources; Japan International Cooperation Agency; Tokyo Electric Power Co. Inc. (2011).
85
The Energy Challenge: A Critical Constraint to Growth
MW in 2030. To meet this target, the “base” generation capacity should be 39,000 MW by 2030 (to ensure reliable steady supply). After allowing for phasing out or decommissioning of old and gas-guzzling power plants and all recently installed quick rental power plants, the required new capacity addition in the power sector to achieve the 39,000 MW target is estimated to be about 45,000–50,000 MW. Achieving the intermediate target of 19,000 MW by 2021 will require adding new generation capacity of about 23,809 MW by that year, almost doubling the December 2015 capacity in 6 years!
Achieving the targeted levels of new capacity will be extremely challenging on several fronts, including physical implementation of the massive generation capacity, liberalization of the power market regulations, and, most importantly, mobilization of the huge amount of financial resources needed.
As in recent years, the private sector will be expected to play a major role in carrying out the massive new electricity generation plan. To be sure, some major, large power plants will be largely primarily built by government with financial support from bilateral official and multilateral sources. These include the following:
Two coal-based power plants at Materbari in Chittagong with 1,200 MW each built with assistance from Japan.
Bangladesh-India public sector joint venture 1,320 MW coal-based power plant at Rampal, near Mongla.
800 MW liquefied-natural-gas-based power plant in Khulna that will be powered by imported gas from India’s H-Energy Ltd.
1,320-megawatt coal-based power plant at Kalapara by the joint venture formed by China National Machinery Import & Export (Group) Corporation, and the Bangladesh Power Development Board.
North-West Power Generation Company Limited Ruppur nuclear power plant with 2,000 MW capacity with technical and other support from the Russian Federation.
Some rehabilitation of old BPDB-owned power plants.
Nevertheless, the public sector alone will not be able to mobilize and finance the massive investment plan. The private sector (foreign, domestic, and joint venture) must finance more than half of the required investment in the power sector.
The Sixth Five-Year Plan identified generation from rental power plants as an immediate solution to the power crisis in 2010. And such plants sprouted everywhere. Installed capacity was to be increased to 15,457 MW between fiscal year (FY) 2010 and FY2015 under the Sixth Plan. After accounting for the 500 MW of imported power from India, actual capacity/supply potential increased more than 8,000 MW to 12,071 MW. Despite falling short of the 15,457 MW target, the more than doubling of installed capacity under the sixth plan was indeed very impressive. Progress was also made in reducing transmission and distribution losses.
But this increase in rental power plants had an important side effect: a substantial increase in the cost of electricity generation. The visible increase in private generation capacity has also led to an unwelcome and huge increase in the marginal cost of electricity. Much of the additional private electricity supply has come from quick rental power plants that supply electricity to the national grid at a much higher unit cost than from other sources, owing to the use of liquid fuel as feedstock. As a result, the average cost of power generation has progressively increased from about Tk2.7 per kWh in FY2010 to Tk7.6 per kWh in FY2015.
Under the Seventh Five-Year Plan spanning 2016–2020, the strategy is for a slight change in the objectives of the last plan. This against a backdrop of mounting challenges in accessing primary fuel and even a severe rationing of gas. But the realism of supplying electricity through nuclear power during the plan needs to be revisited. Based on the lessons of the Sixth Five-Year Plan and a more realistic assessment of energy supply prospects, the government revised the Power Sector Master Plan 2010 projections for power generation in the seventh plan. In this revised scenario, total generation during FY2016–FY2020 would increase by 12,584 MW (excluding captive power), a larger target,
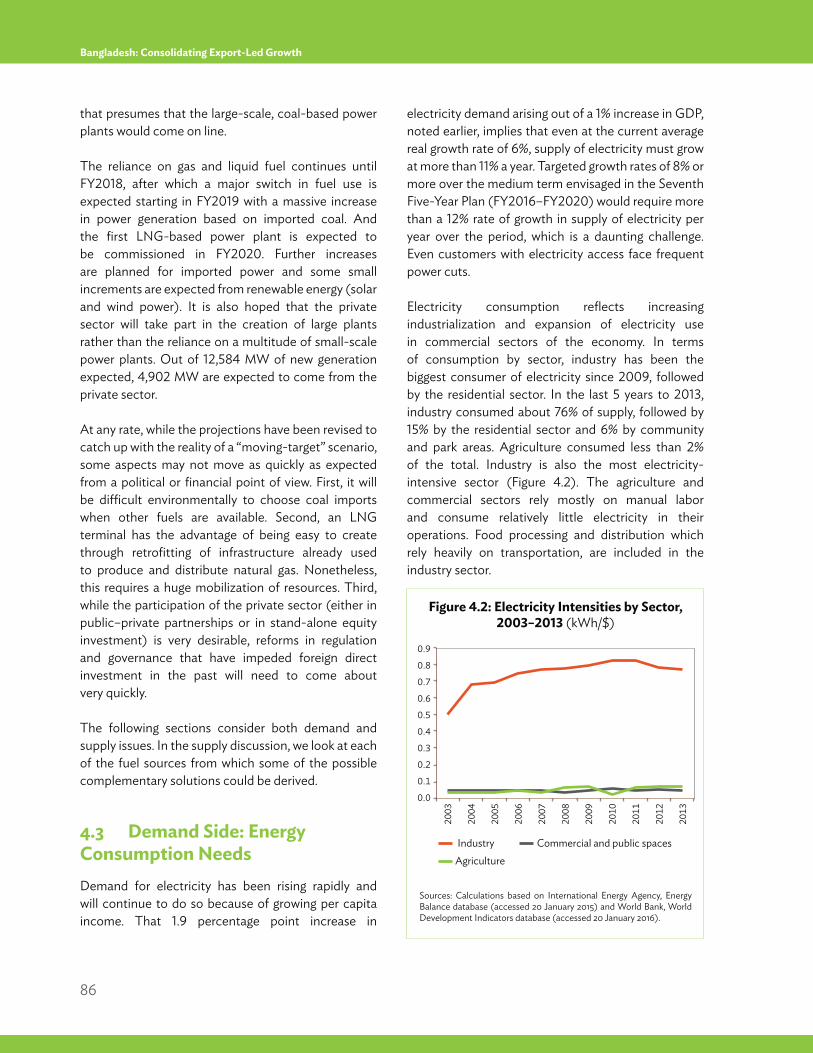
86
Bangladesh: Consolidating Export-Led Growth
that presumes that the large-scale, coal-based power plants would come on line.
The reliance on gas and liquid fuel continues until FY2018, after which a major switch in fuel use is expected starting in FY2019 with a massive increase in power generation based on imported coal. And the first LNG-based power plant is expected to be commissioned in FY2020. Further increases are planned for imported power and some small increments are expected from renewable energy (solar and wind power). It is also hoped that the private sector will take part in the creation of large plants rather than the reliance on a multitude of small-scale power plants. Out of 12,584 MW of new generation expected, 4,902 MW are expected to come from the private sector.
At any rate, while the projections have been revised to catch up with the reality of a “moving-target” scenario, some aspects may not move as quickly as expected from a political or financial point of view. First, it will be difficult environmentally to choose coal imports when other fuels are available. Second, an LNG terminal has the advantage of being easy to create through retrofitting of infrastructure already used to produce and distribute natural gas. Nonetheless, this requires a huge mobilization of resources. Third, while the participation of the private sector (either in public–private partnerships or in stand-alone equity investment) is very desirable, reforms in regulation and governance that have impeded foreign direct investment in the past will need to come about very quickly.
The following sections consider both demand and supply issues. In the supply discussion, we look at each of the fuel sources from which some of the possible complementary solutions could be derived.
4.3 Demand Side: Energy Consumption NeedsDemand for electricity has been rising rapidly and will continue to do so because of growing per capita income. That 1.9 percentage point increase in
electricity demand arising out of a 1% increase in GDP, noted earlier, implies that even at the current average real growth rate of 6%, supply of electricity must grow at more than 11% a year. Targeted growth rates of 8% or more over the medium term envisaged in the Seventh Five-Year Plan (FY2016–FY2020) would require more than a 12% rate of growth in supply of electricity per year over the period, which is a daunting challenge. Even customers with electricity access face frequent power cuts.
Electricity consumption reflects increasing industrialization and expansion of electricity use in commercial sectors of the economy. In terms of consumption by sector, industry has been the biggest consumer of electricity since 2009, followed by the residential sector. In the last 5 years to 2013, industry consumed about 76% of supply, followed by 15% by the residential sector and 6% by community and park areas. Agriculture consumed less than 2% of the total. Industry is also the most electricity- intensive sector (Figure 4.2). The agriculture and commercial sectors rely mostly on manual labor and consume relatively little electricity in their operations. Food processing and distribution which rely heavily on transportation, are included in the industry sector.
Industry
0.0
0.9
0.7
0.6
0.5
0.4
0.3
0.2
0.1
0.8
2006
2005
2004
2003
2007
2008
2009
2010
2011
2013
2012
Commercial and public spacesAgriculture
Figure 4.2: Electricity Intensities by Sector, 2003–2013 (kWh/$)
Sources: Calculations based on International Energy Agency, Energy Balance database (accessed 20 January 2015) and World Bank, World Development Indicators database (accessed 20 January 2016).
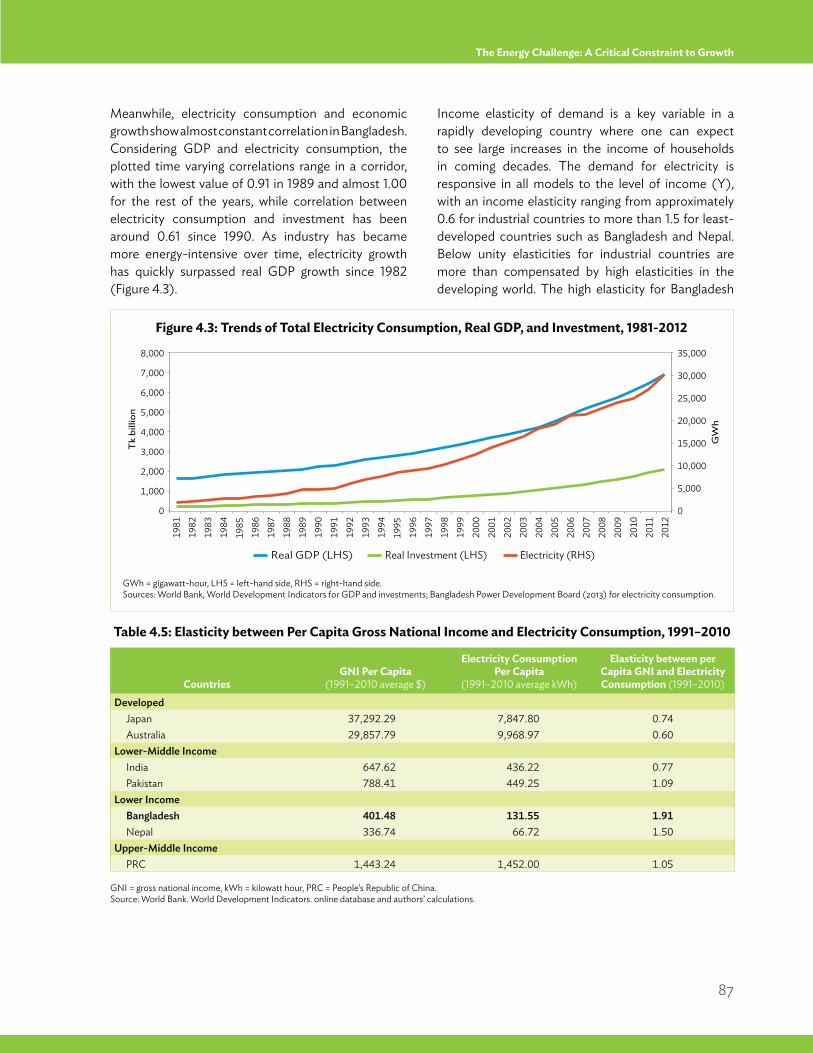
87
The Energy Challenge: A Critical Constraint to Growth
Meanwhile, electricity consumption and economic growth show almost constant correlation in Bangladesh. Considering GDP and electricity consumption, the plotted time varying correlations range in a corridor, with the lowest value of 0.91 in 1989 and almost 1.00 for the rest of the years, while correlation between electricity consumption and investment has been around 0.61 since 1990. As industry has became more energy-intensive over time, electricity growth has quickly surpassed real GDP growth since 1982 (Figure 4.3).
Income elasticity of demand is a key variable in a rapidly developing country where one can expect to see large increases in the income of households in coming decades. The demand for electricity is responsive in all models to the level of income (Y), with an income elasticity ranging from approximately 0.6 for industrial countries to more than 1.5 for least-developed countries such as Bangladesh and Nepal. Below unity elasticities for industrial countries are more than compensated by high elasticities in the developing world. The high elasticity for Bangladesh
Figure 4.3: Trends of Total Electricity Consumption, Real GDP, and Investment, 1981-2012
GWh = gigawatt-hour, LHS = left-hand side, RHS = right-hand side.Sources: World Bank, World Development Indicators for GDP and investments; Bangladesh Power Development Board (2013) for electricity consumption.
Real GDP (LHS)
Tk
billi
on
GW
h
0
8,000
0
35,000
5,000
30,000
25,000
20,000
15,000
10,000
6,000
5,000
4,000
3,000
2,000
1,000
7,000
1992
1991
1990
1996
1995
1997
1993
1994
1998
1999
1982
1981
1986
1985
1987
1983
1984
1988
1989
2000
2001
2002
2006
2005
2004
2003
2007
2008
2009
2010
2011
2012
Real Investment (LHS) Electricity (RHS)
Table 4.5: Elasticity between Per Capita Gross National Income and Electricity Consumption, 1991–2010
GNI = gross national income, kWh = kilowatt hour, PRC = People’s Republic of China. Source: World Bank. World Development Indicators. online database and authors’ calculations.
CountriesGNI Per Capita
(1991–2010 average $)
Electricity Consumption Per Capita
(1991–2010 average kWh)
Elasticity between per Capita GNI and Electricity Consumption (1991–2010)
DevelopedJapan 37,292.29 7,847.80 0.74Australia 29,857.79 9,968.97 0.60
Lower-Middle IncomeIndia 647.62 436.22 0.77Pakistan 788.41 449.25 1.09
Lower IncomeBangladesh 401.48 131.55 1.91Nepal 336.74 66.72 1.50
Upper-Middle IncomePRC 1,443.24 1,452.00 1.05
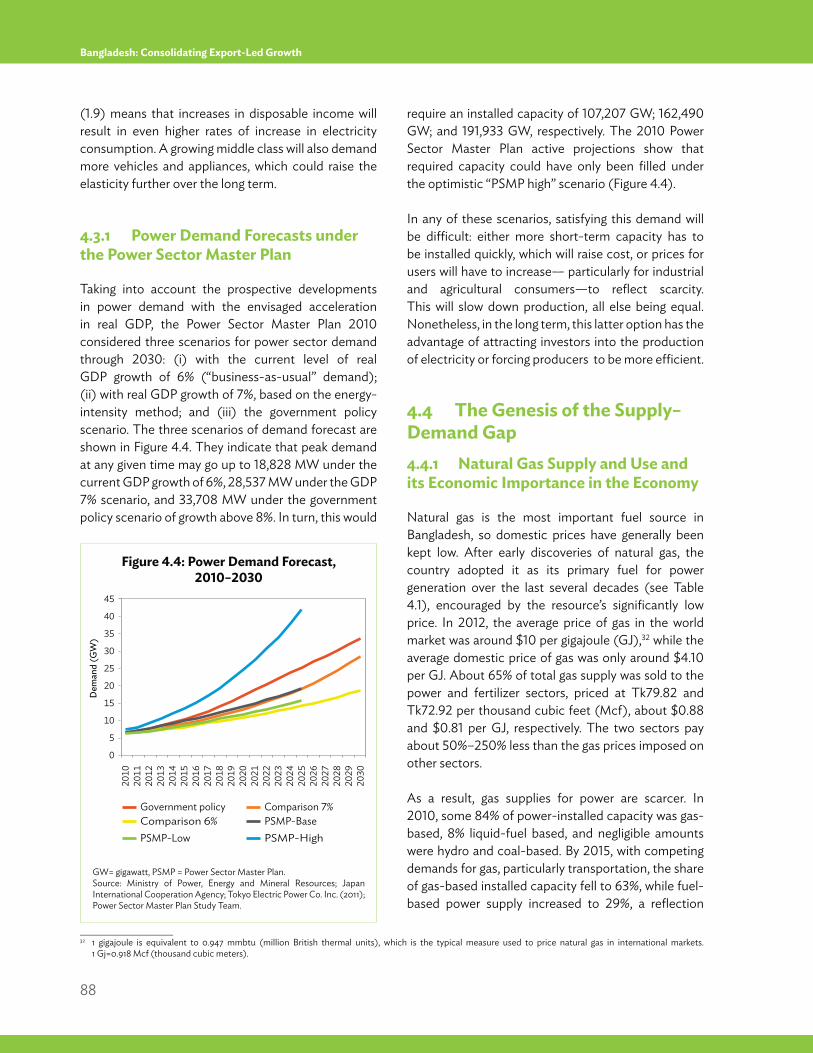
88
Bangladesh: Consolidating Export-Led Growth
(1.9) means that increases in disposable income will result in even higher rates of increase in electricity consumption. A growing middle class will also demand more vehicles and appliances, which could raise the elasticity further over the long term.
4.3.1 Power Demand Forecasts under the Power Sector Master Plan
Taking into account the prospective developments in power demand with the envisaged acceleration in real GDP, the Power Sector Master Plan 2010 considered three scenarios for power sector demand through 2030: (i) with the current level of real GDP growth of 6% (“business-as-usual” demand); (ii) with real GDP growth of 7%, based on the energy-intensity method; and (iii) the government policy scenario. The three scenarios of demand forecast are shown in Figure 4.4. They indicate that peak demand at any given time may go up to 18,828 MW under the current GDP growth of 6%, 28,537 MW under the GDP 7% scenario, and 33,708 MW under the government policy scenario of growth above 8%. In turn, this would
require an installed capacity of 107,207 GW; 162,490 GW; and 191,933 GW, respectively. The 2010 Power Sector Master Plan active projections show that required capacity could have only been filled under the optimistic “PSMP high” scenario (Figure 4.4).
In any of these scenarios, satisfying this demand will be difficult: either more short-term capacity has to be installed quickly, which will raise cost, or prices for users will have to increase— particularly for industrial and agricultural consumers—to reflect scarcity. This will slow down production, all else being equal. Nonetheless, in the long term, this latter option has the advantage of attracting investors into the production of electricity or forcing producers to be more efficient.
4.4 The Genesis of the Supply–Demand Gap4.4.1 Natural Gas Supply and Use and its Economic Importance in the Economy
Natural gas is the most important fuel source in Bangladesh, so domestic prices have generally been kept low. After early discoveries of natural gas, the country adopted it as its primary fuel for power generation over the last several decades (see Table 4.1), encouraged by the resource’s significantly low price. In 2012, the average price of gas in the world market was around $10 per gigajoule (GJ),32 while the average domestic price of gas was only around $4.10 per GJ. About 65% of total gas supply was sold to the power and fertilizer sectors, priced at Tk79.82 and Tk72.92 per thousand cubic feet (Mcf), about $0.88 and $0.81 per GJ, respectively. The two sectors pay about 50%–250% less than the gas prices imposed on other sectors.
As a result, gas supplies for power are scarcer. In 2010, some 84% of power-installed capacity was gas-based, 8% liquid-fuel based, and negligible amounts were hydro and coal-based. By 2015, with competing demands for gas, particularly transportation, the share of gas-based installed capacity fell to 63%, while fuel-based power supply increased to 29%, a reflection
____________________32 1 gigajoule is equivalent to 0.947 mmbtu (million British thermal units), which is the typical measure used to price natural gas in international markets.
1 Gj=0.918 Mcf (thousand cubic meters).
Comparison 6%Government policy Comparison 7%
0
45
35
30
25
20
15
10
5
40
PSMP-HighPSMP-Base
PSMP-Low
2013
2010
2011
2012
2018
2019
2020
2014
2015
2016
2017
2023
2028
2029
2024
2025
2026
2027
2021
2022
2030
Dem
and
(GW
)
Figure 4.4: Power Demand Forecast, 2010–2030
GW= gigawatt, PSMP = Power Sector Master Plan. Source: Ministry of Power, Energy and Mineral Resources; Japan International Cooperation Agency; Tokyo Electric Power Co. Inc. (2011); Power Sector Master Plan Study Team.
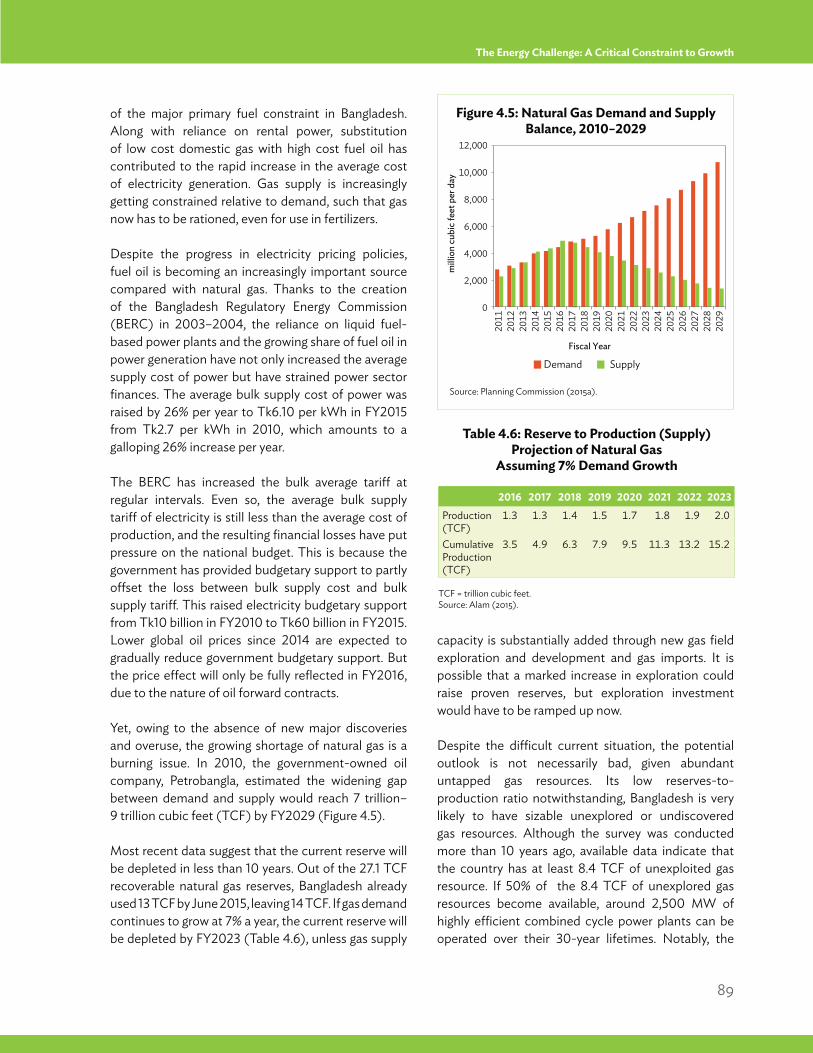
89
The Energy Challenge: A Critical Constraint to Growth
of the major primary fuel constraint in Bangladesh. Along with reliance on rental power, substitution of low cost domestic gas with high cost fuel oil has contributed to the rapid increase in the average cost of electricity generation. Gas supply is increasingly getting constrained relative to demand, such that gas now has to be rationed, even for use in fertilizers.
Despite the progress in electricity pricing policies, fuel oil is becoming an increasingly important source compared with natural gas. Thanks to the creation of the Bangladesh Regulatory Energy Commission (BERC) in 2003–2004, the reliance on liquid fuel-based power plants and the growing share of fuel oil in power generation have not only increased the average supply cost of power but have strained power sector finances. The average bulk supply cost of power was raised by 26% per year to Tk6.10 per kWh in FY2015 from Tk2.7 per kWh in 2010, which amounts to a galloping 26% increase per year.
The BERC has increased the bulk average tariff at regular intervals. Even so, the average bulk supply tariff of electricity is still less than the average cost of production, and the resulting financial losses have put pressure on the national budget. This is because the government has provided budgetary support to partly offset the loss between bulk supply cost and bulk supply tariff. This raised electricity budgetary support from Tk10 billion in FY2010 to Tk60 billion in FY2015. Lower global oil prices since 2014 are expected to gradually reduce government budgetary support. But the price effect will only be fully reflected in FY2016, due to the nature of oil forward contracts.
Yet, owing to the absence of new major discoveries and overuse, the growing shortage of natural gas is a burning issue. In 2010, the government-owned oil company, Petrobangla, estimated the widening gap between demand and supply would reach 7 trillion– 9 trillion cubic feet (TCF) by FY2029 (Figure 4.5).
Most recent data suggest that the current reserve will be depleted in less than 10 years. Out of the 27.1 TCF recoverable natural gas reserves, Bangladesh already used 13 TCF by June 2015, leaving 14 TCF. If gas demand continues to grow at 7% a year, the current reserve will be depleted by FY2023 (Table 4.6), unless gas supply
capacity is substantially added through new gas field exploration and development and gas imports. It is possible that a marked increase in exploration could raise proven reserves, but exploration investment would have to be ramped up now.
Despite the difficult current situation, the potential outlook is not necessarily bad, given abundant untapped gas resources. Its low reserves-to-production ratio notwithstanding, Bangladesh is very likely to have sizable unexplored or undiscovered gas resources. Although the survey was conducted more than 10 years ago, available data indicate that the country has at least 8.4 TCF of unexploited gas resource. If 50% of the 8.4 TCF of unexplored gas resources become available, around 2,500 MW of highly efficient combined cycle power plants can be operated over their 30-year lifetimes. Notably, the
Figure 4.5: Natural Gas Demand and Supply Balance, 2010–2029
Source: Planning Commission (2015a).
0
10,000
8,000
6,000
4,000
2,000
12,000
Demand
Fiscal Year
mill
ion
cubi
c fe
et p
er d
ay
Supply
2011
2012
2013
2014
2015
2016
2018
2017
2019
2020
2021
2022
2023
2024
2026
2025
2027
2029
2028
Table 4.6: Reserve to Production (Supply) Projection of Natural Gas
Assuming 7% Demand Growth
TCF = trillion cubic feet.Source: Alam (2015).
2016 2017 2018 2019 2020 2021 2022 2023Production (TCF)
1.3 1.3 1.4 1.5 1.7 1.8 1.9 2.0
Cumulative Production (TCF)
3.5 4.9 6.3 7.9 9.5 11.3 13.2 15.2
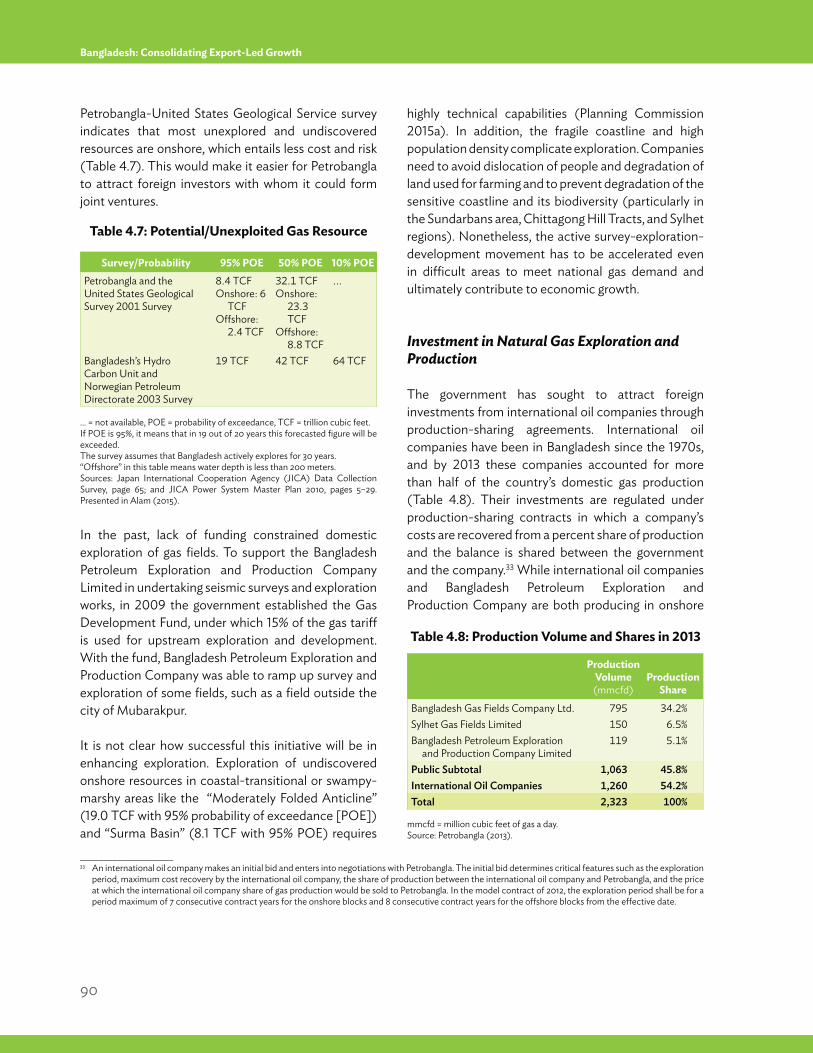
90
Bangladesh: Consolidating Export-Led Growth
Petrobangla-United States Geological Service survey indicates that most unexplored and undiscovered resources are onshore, which entails less cost and risk (Table 4.7). This would make it easier for Petrobangla to attract foreign investors with whom it could form joint ventures.
In the past, lack of funding constrained domestic exploration of gas fields. To support the Bangladesh Petroleum Exploration and Production Company Limited in undertaking seismic surveys and exploration works, in 2009 the government established the Gas Development Fund, under which 15% of the gas tariff is used for upstream exploration and development. With the fund, Bangladesh Petroleum Exploration and Production Company was able to ramp up survey and exploration of some fields, such as a field outside the city of Mubarakpur.
It is not clear how successful this initiative will be in enhancing exploration. Exploration of undiscovered onshore resources in coastal-transitional or swampy-marshy areas like the “Moderately Folded Anticline” (19.0 TCF with 95% probability of exceedance [POE]) and “Surma Basin” (8.1 TCF with 95% POE) requires
highly technical capabilities (Planning Commission 2015a). In addition, the fragile coastline and high population density complicate exploration. Companies need to avoid dislocation of people and degradation of land used for farming and to prevent degradation of the sensitive coastline and its biodiversity (particularly in the Sundarbans area, Chittagong Hill Tracts, and Sylhet regions). Nonetheless, the active survey-exploration-development movement has to be accelerated even in difficult areas to meet national gas demand and ultimately contribute to economic growth.
Investment in Natural Gas Exploration and Production
The government has sought to attract foreign investments from international oil companies through production-sharing agreements. International oil companies have been in Bangladesh since the 1970s, and by 2013 these companies accounted for more than half of the country’s domestic gas production (Table 4.8). Their investments are regulated under production-sharing contracts in which a company’s costs are recovered from a percent share of production and the balance is shared between the government and the company.33 While international oil companies and Bangladesh Petroleum Exploration and Production Company are both producing in onshore
____________________33 An international oil company makes an initial bid and enters into negotiations with Petrobangla. The initial bid determines critical features such as the exploration
period, maximum cost recovery by the international oil company, the share of production between the international oil company and Petrobangla, and the price at which the international oil company share of gas production would be sold to Petrobangla. In the model contract of 2012, the exploration period shall be for a period maximum of 7 consecutive contract years for the onshore blocks and 8 consecutive contract years for the offshore blocks from the effective date.
Table 4.7: Potential/Unexploited Gas Resource
… = not available, POE = probability of exceedance, TCF = trillion cubic feet.If POE is 95%, it means that in 19 out of 20 years this forecasted figure will be exceeded. The survey assumes that Bangladesh actively explores for 30 years. “Offshore” in this table means water depth is less than 200 meters. Sources: Japan International Cooperation Agency (JICA) Data Collection Survey, page 65; and JICA Power System Master Plan 2010, pages 5–29. Presented in Alam (2015).
Survey/Probability 95% POE 50% POE 10% POEPetrobangla and the United States Geological Survey 2001 Survey
8.4 TCFOnshore: 6
TCFOffshore:
2.4 TCF
32.1 TCFOnshore:
23.3 TCF
Offshore: 8.8 TCF
...
Bangladesh’s Hydro Carbon Unit and Norwegian Petroleum Directorate 2003 Survey
19 TCF 42 TCF 64 TCF
Table 4.8: Production Volume and Shares in 2013
mmcfd = million cubic feet of gas a day.Source: Petrobangla (2013).
Production Volume (mmcfd)
Production Share
Bangladesh Gas Fields Company Ltd. 795 34.2%Sylhet Gas Fields Limited 150 6.5%Bangladesh Petroleum Exploration and Production Company Limited
119 5.1%
Public Subtotal 1,063 45.8%International Oil Companies 1,260 54.2%Total 2,323 100%
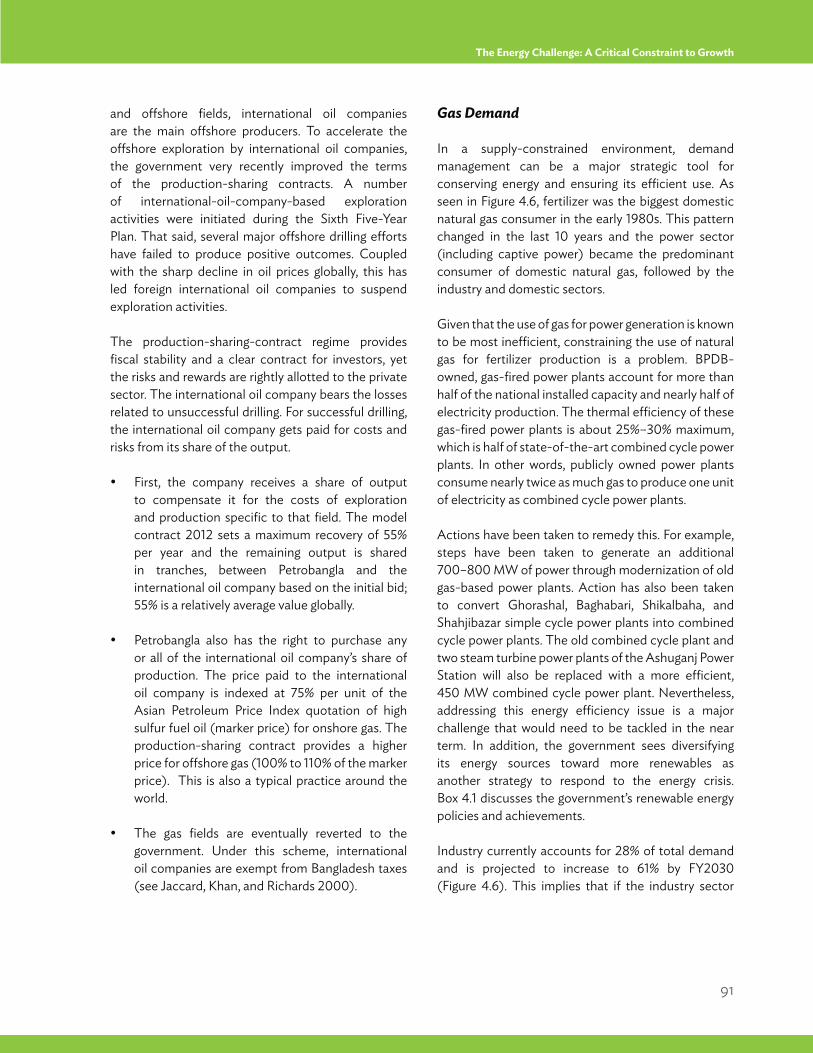
91
The Energy Challenge: A Critical Constraint to Growth
and offshore fields, international oil companies are the main offshore producers. To accelerate the offshore exploration by international oil companies, the government very recently improved the terms of the production-sharing contracts. A number of international-oil-company-based exploration activities were initiated during the Sixth Five-Year Plan. That said, several major offshore drilling efforts have failed to produce positive outcomes. Coupled with the sharp decline in oil prices globally, this has led foreign international oil companies to suspend exploration activities.
The production-sharing-contract regime provides fiscal stability and a clear contract for investors, yet the risks and rewards are rightly allotted to the private sector. The international oil company bears the losses related to unsuccessful drilling. For successful drilling, the international oil company gets paid for costs and risks from its share of the output.
First, the company receives a share of output to compensate it for the costs of exploration and production specific to that field. The model contract 2012 sets a maximum recovery of 55% per year and the remaining output is shared in tranches, between Petrobangla and the international oil company based on the initial bid; 55% is a relatively average value globally.
Petrobangla also has the right to purchase any or all of the international oil company’s share of production. The price paid to the international oil company is indexed at 75% per unit of the Asian Petroleum Price Index quotation of high sulfur fuel oil (marker price) for onshore gas. The production-sharing contract provides a higher price for offshore gas (100% to 110% of the marker price). This is also a typical practice around the world.
The gas fields are eventually reverted to the government. Under this scheme, international oil companies are exempt from Bangladesh taxes (see Jaccard, Khan, and Richards 2000).
Gas Demand
In a supply-constrained environment, demand management can be a major strategic tool for conserving energy and ensuring its efficient use. As seen in Figure 4.6, fertilizer was the biggest domestic natural gas consumer in the early 1980s. This pattern changed in the last 10 years and the power sector (including captive power) became the predominant consumer of domestic natural gas, followed by the industry and domestic sectors.
Given that the use of gas for power generation is known to be most inefficient, constraining the use of natural gas for fertilizer production is a problem. BPDB-owned, gas-fired power plants account for more than half of the national installed capacity and nearly half of electricity production. The thermal efficiency of these gas-fired power plants is about 25%–30% maximum, which is half of state-of-the-art combined cycle power plants. In other words, publicly owned power plants consume nearly twice as much gas to produce one unit of electricity as combined cycle power plants.
Actions have been taken to remedy this. For example, steps have been taken to generate an additional 700–800 MW of power through modernization of old gas-based power plants. Action has also been taken to convert Ghorashal, Baghabari, Shikalbaha, and Shahjibazar simple cycle power plants into combined cycle power plants. The old combined cycle plant and two steam turbine power plants of the Ashuganj Power Station will also be replaced with a more efficient, 450 MW combined cycle power plant. Nevertheless, addressing this energy efficiency issue is a major challenge that would need to be tackled in the near term. In addition, the government sees diversifying its energy sources toward more renewables as another strategy to respond to the energy crisis. Box 4.1 discusses the government’s renewable energy policies and achievements.
Industry currently accounts for 28% of total demand and is projected to increase to 61% by FY2030 (Figure 4.6). This implies that if the industry sector
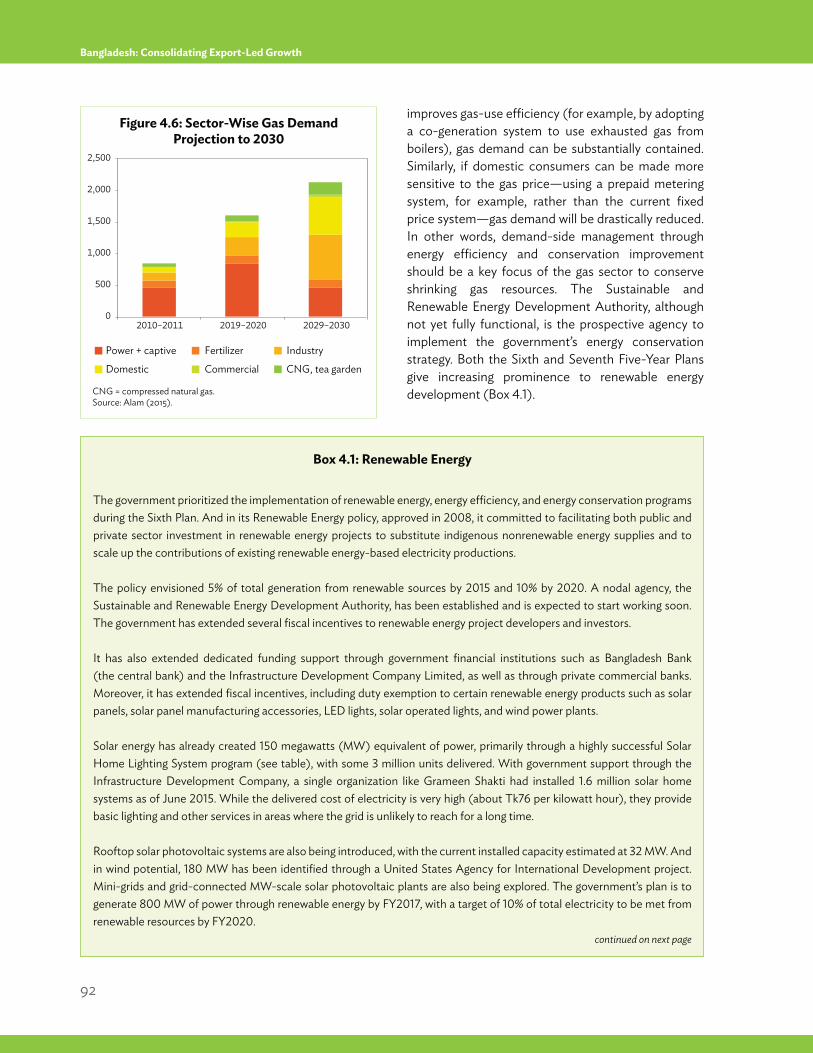
92
Bangladesh: Consolidating Export-Led Growth
improves gas-use efficiency (for example, by adopting a co-generation system to use exhausted gas from boilers), gas demand can be substantially contained. Similarly, if domestic consumers can be made more sensitive to the gas price—using a prepaid metering system, for example, rather than the current fixed price system—gas demand will be drastically reduced. In other words, demand-side management through energy efficiency and conservation improvement should be a key focus of the gas sector to conserve shrinking gas resources. The Sustainable and Renewable Energy Development Authority, although not yet fully functional, is the prospective agency to implement the government’s energy conservation strategy. Both the Sixth and Seventh Five-Year Plans give increasing prominence to renewable energy development (Box 4.1).
Domestic Commercial CNG, tea garden
Power + captive Fertilizer Industry
0
1,500
1,000
500
2,000
2,500
2010–2011 2019–2020 2029–2030
Figure 4.6: Sector-Wise Gas Demand Projection to 2030
CNG = compressed natural gas.Source: Alam (2015).
Box 4.1: Renewable Energy
The government prioritized the implementation of renewable energy, energy efficiency, and energy conservation programs during the Sixth Plan. And in its Renewable Energy policy, approved in 2008, it committed to facilitating both public and private sector investment in renewable energy projects to substitute indigenous nonrenewable energy supplies and to scale up the contributions of existing renewable energy-based electricity productions.
The policy envisioned 5% of total generation from renewable sources by 2015 and 10% by 2020. A nodal agency, the Sustainable and Renewable Energy Development Authority, has been established and is expected to start working soon. The government has extended several fiscal incentives to renewable energy project developers and investors.
It has also extended dedicated funding support through government financial institutions such as Bangladesh Bank (the central bank) and the Infrastructure Development Company Limited, as well as through private commercial banks. Moreover, it has extended fiscal incentives, including duty exemption to certain renewable energy products such as solar panels, solar panel manufacturing accessories, LED lights, solar operated lights, and wind power plants.
Solar energy has already created 150 megawatts (MW) equivalent of power, primarily through a highly successful Solar Home Lighting System program (see table), with some 3 million units delivered. With government support through the Infrastructure Development Company, a single organization like Grameen Shakti had installed 1.6 million solar home systems as of June 2015. While the delivered cost of electricity is very high (about Tk76 per kilowatt hour), they provide basic lighting and other services in areas where the grid is unlikely to reach for a long time.
Rooftop solar photovoltaic systems are also being introduced, with the current installed capacity estimated at 32 MW. And in wind potential, 180 MW has been identified through a United States Agency for International Development project. Mini-grids and grid-connected MW-scale solar photovoltaic plants are also being explored. The government’s plan is to generate 800 MW of power through renewable energy by FY2017, with a target of 10% of total electricity to be met from renewable resources by FY2020.
continued on next page
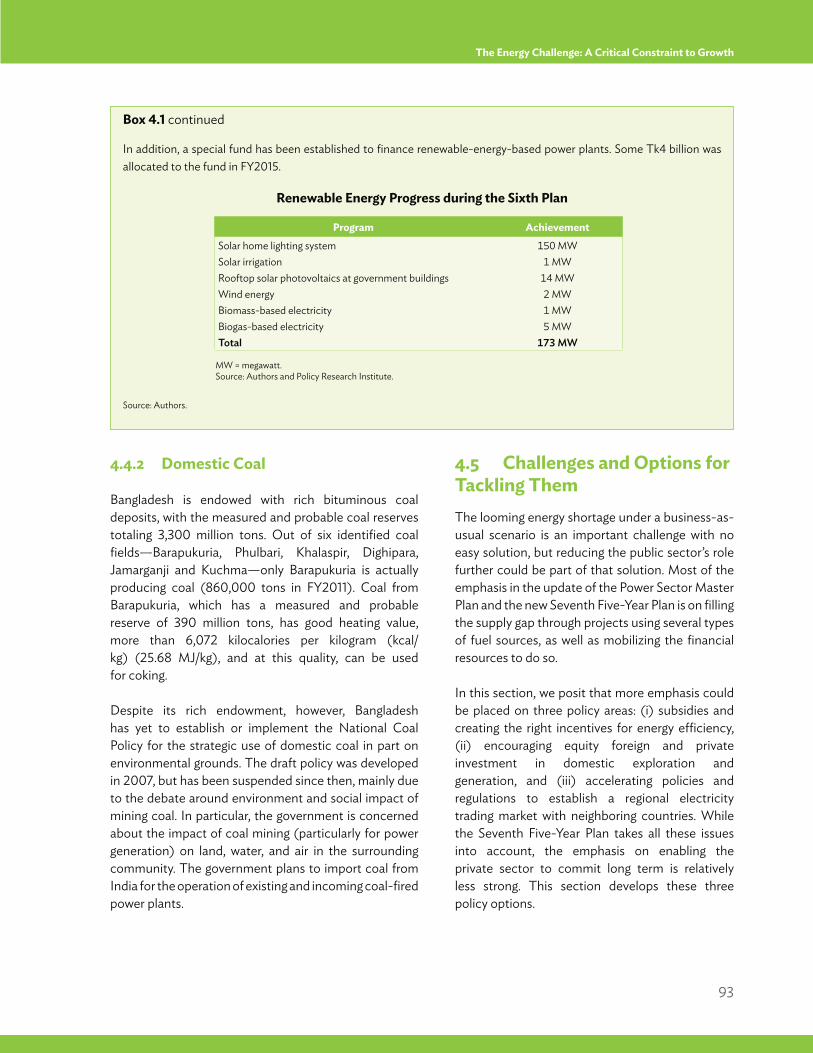
93
The Energy Challenge: A Critical Constraint to Growth
4.4.2 Domestic Coal
Bangladesh is endowed with rich bituminous coal deposits, with the measured and probable coal reserves totaling 3,300 million tons. Out of six identified coal fields—Barapukuria, Phulbari, Khalaspir, Dighipara, Jamarganji and Kuchma—only Barapukuria is actually producing coal (860,000 tons in FY2011). Coal from Barapukuria, which has a measured and probable reserve of 390 million tons, has good heating value, more than 6,072 kilocalories per kilogram (kcal/kg) (25.68 MJ/kg), and at this quality, can be used for coking.
Despite its rich endowment, however, Bangladesh has yet to establish or implement the National Coal Policy for the strategic use of domestic coal in part on environmental grounds. The draft policy was developed in 2007, but has been suspended since then, mainly due to the debate around environment and social impact of mining coal. In particular, the government is concerned about the impact of coal mining (particularly for power generation) on land, water, and air in the surrounding community. The government plans to import coal from India for the operation of existing and incoming coal-fired power plants.
4.5 Challenges and Options for Tackling ThemThe looming energy shortage under a business-as-usual scenario is an important challenge with no easy solution, but reducing the public sector’s role further could be part of that solution. Most of the emphasis in the update of the Power Sector Master Plan and the new Seventh Five-Year Plan is on filling the supply gap through projects using several types of fuel sources, as well as mobilizing the financial resources to do so.
In this section, we posit that more emphasis could be placed on three policy areas: (i) subsidies and creating the right incentives for energy efficiency, (ii) encouraging equity foreign and private investment in domestic exploration and generation, and (iii) accelerating policies and regulations to establish a regional electricity trading market with neighboring countries. While the Seventh Five-Year Plan takes all these issues into account, the emphasis on enabling the private sector to commit long term is relatively less strong. This section develops these three policy options.
Program AchievementSolar home lighting system 150 MWSolar irrigation 1 MWRooftop solar photovoltaics at government buildings 14 MWWind energy 2 MWBiomass-based electricity 1 MWBiogas-based electricity 5 MWTotal 173 MW
MW = megawatt.Source: Authors and Policy Research Institute.
In addition, a special fund has been established to finance renewable-energy-based power plants. Some Tk4 billion was allocated to the fund in FY2015.
Renewable Energy Progress during the Sixth Plan
Source: Authors.
Box 4.1 continued
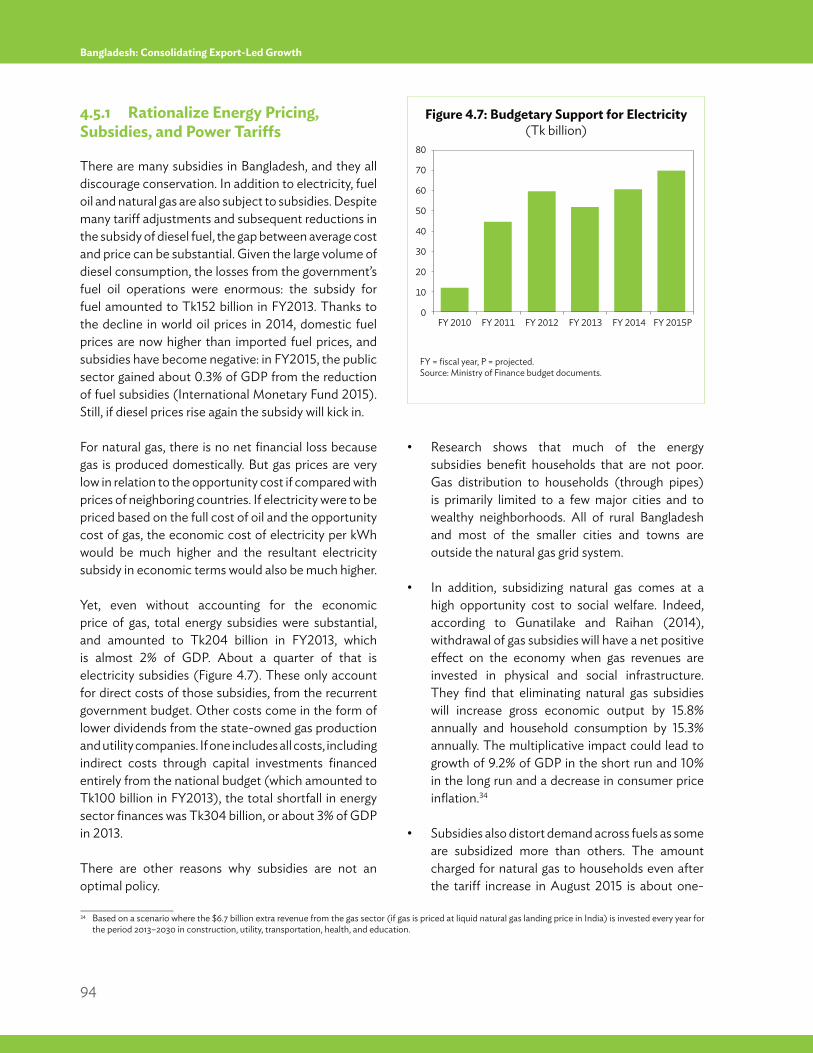
94
Bangladesh: Consolidating Export-Led Growth
4.5.1 Rationalize Energy Pricing, Subsidies, and Power Tariffs
There are many subsidies in Bangladesh, and they all discourage conservation. In addition to electricity, fuel oil and natural gas are also subject to subsidies. Despite many tariff adjustments and subsequent reductions in the subsidy of diesel fuel, the gap between average cost and price can be substantial. Given the large volume of diesel consumption, the losses from the government’s fuel oil operations were enormous: the subsidy for fuel amounted to Tk152 billion in FY2013. Thanks to the decline in world oil prices in 2014, domestic fuel prices are now higher than imported fuel prices, and subsidies have become negative: in FY2015, the public sector gained about 0.3% of GDP from the reduction of fuel subsidies (International Monetary Fund 2015). Still, if diesel prices rise again the subsidy will kick in.
For natural gas, there is no net financial loss because gas is produced domestically. But gas prices are very low in relation to the opportunity cost if compared with prices of neighboring countries. If electricity were to be priced based on the full cost of oil and the opportunity cost of gas, the economic cost of electricity per kWh would be much higher and the resultant electricity subsidy in economic terms would also be much higher.
Yet, even without accounting for the economic price of gas, total energy subsidies were substantial, and amounted to Tk204 billion in FY2013, which is almost 2% of GDP. About a quarter of that is electricity subsidies (Figure 4.7). These only account for direct costs of those subsidies, from the recurrent government budget. Other costs come in the form of lower dividends from the state-owned gas production and utility companies. If one includes all costs, including indirect costs through capital investments financed entirely from the national budget (which amounted to Tk100 billion in FY2013), the total shortfall in energy sector finances was Tk304 billion, or about 3% of GDP in 2013.
There are other reasons why subsidies are not an optimal policy.
subsidies benefit households that are not poor. Gas distribution to households (through pipes) is primarily limited to a few major cities and to wealthy neighborhoods. All of rural Bangladesh and most of the smaller cities and towns are outside the natural gas grid system.
high opportunity cost to social welfare. Indeed, according to Gunatilake and Raihan (2014), withdrawal of gas subsidies will have a net positive effect on the economy when gas revenues are invested in physical and social infrastructure. They find that eliminating natural gas subsidies will increase gross economic output by 15.8% annually and household consumption by 15.3% annually. The multiplicative impact could lead to growth of 9.2% of GDP in the short run and 10% in the long run and a decrease in consumer price inflation.34
are subsidized more than others. The amount charged for natural gas to households even after the tariff increase in August 2015 is about one-
0
60
50
40
30
20
10
70
80
FY 2010 FY 2011 FY 2012 FY 2013 FY 2014 FY 2015P
Figure 4.7: Budgetary Support for Electricity (Tk billion)
FY = fiscal year, P = projected.Source: Ministry of Finance budget documents.
____________________34 Based on a scenario where the $6.7 billion extra revenue from the gas sector (if gas is priced at liquid natural gas landing price in India) is invested every year for
the period 2013–2030 in construction, utility, transportation, health, and education.
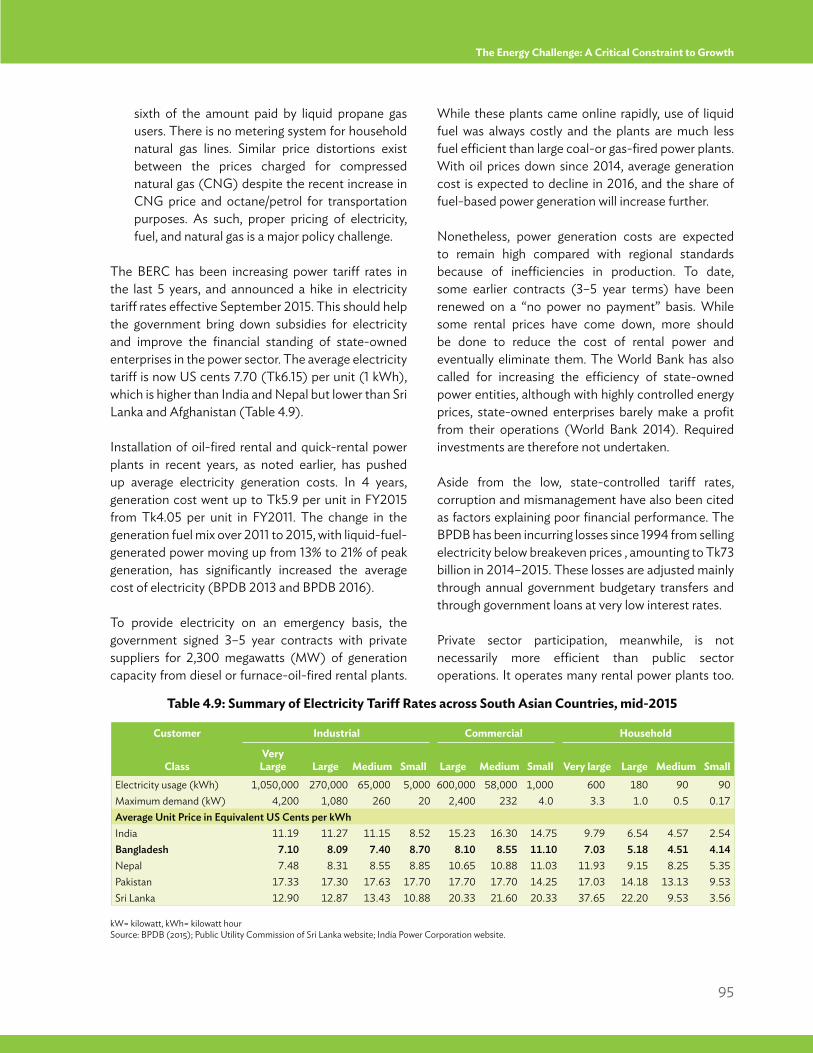
95
The Energy Challenge: A Critical Constraint to Growth
sixth of the amount paid by liquid propane gas users. There is no metering system for household natural gas lines. Similar price distortions exist between the prices charged for compressed natural gas (CNG) despite the recent increase in CNG price and octane/petrol for transportation purposes. As such, proper pricing of electricity, fuel, and natural gas is a major policy challenge.
The BERC has been increasing power tariff rates in the last 5 years, and announced a hike in electricity tariff rates effective September 2015. This should help the government bring down subsidies for electricity and improve the financial standing of state-owned enterprises in the power sector. The average electricity tariff is now US cents 7.70 (Tk6.15) per unit (1 kWh), which is higher than India and Nepal but lower than Sri Lanka and Afghanistan (Table 4.9).
Installation of oil-fired rental and quick-rental power plants in recent years, as noted earlier, has pushed up average electricity generation costs. In 4 years, generation cost went up to Tk5.9 per unit in FY2015 from Tk4.05 per unit in FY2011. The change in the generation fuel mix over 2011 to 2015, with liquid-fuel-generated power moving up from 13% to 21% of peak generation, has significantly increased the average cost of electricity (BPDB 2013 and BPDB 2016).
To provide electricity on an emergency basis, the government signed 3–5 year contracts with private suppliers for 2,300 megawatts (MW) of generation capacity from diesel or furnace-oil-fired rental plants.
While these plants came online rapidly, use of liquid fuel was always costly and the plants are much less fuel efficient than large coal-or gas-fired power plants. With oil prices down since 2014, average generation cost is expected to decline in 2016, and the share of fuel-based power generation will increase further.
Nonetheless, power generation costs are expected to remain high compared with regional standards because of inefficiencies in production. To date, some earlier contracts (3–5 year terms) have been renewed on a “no power no payment” basis. While some rental prices have come down, more should be done to reduce the cost of rental power and eventually eliminate them. The World Bank has also called for increasing the efficiency of state-owned power entities, although with highly controlled energy prices, state-owned enterprises barely make a profit from their operations (World Bank 2014). Required investments are therefore not undertaken.
Aside from the low, state-controlled tariff rates, corruption and mismanagement have also been cited as factors explaining poor financial performance. The BPDB has been incurring losses since 1994 from selling electricity below breakeven prices , amounting to Tk73 billion in 2014–2015. These losses are adjusted mainly through annual government budgetary transfers and through government loans at very low interest rates.
Private sector participation, meanwhile, is not necessarily more efficient than public sector operations. It operates many rental power plants too.
Table 4.9: Summary of Electricity Tariff Rates across South Asian Countries, mid-2015
kW= kilowatt, kWh= kilowatt hourSource: BPDB (2015); Public Utility Commission of Sri Lanka website; India Power Corporation website.
Customer Industrial Commercial Household
ClassVery
Large Large Medium Small Large Medium Small Very large Large Medium SmallElectricity usage (kWh) 1,050,000 270,000 65,000 5,000 600,000 58,000 1,000 600 180 90 90Maximum demand (kW) 4,200 1,080 260 20 2,400 232 4.0 3.3 1.0 0.5 0.17Average Unit Price in Equivalent US Cents per kWhIndia 11.19 11.27 11.15 8.52 15.23 16.30 14.75 9.79 6.54 4.57 2.54Bangladesh 7.10 8.09 7.40 8.70 8.10 8.55 11.10 7.03 5.18 4.51 4.14Nepal 7.48 8.31 8.55 8.85 10.65 10.88 11.03 11.93 9.15 8.25 5.35Pakistan 17.33 17.30 17.63 17.70 17.70 17.70 14.25 17.03 14.18 13.13 9.53Sri Lanka 12.90 12.87 13.43 10.88 20.33 21.60 20.33 37.65 22.20 9.53 3.56
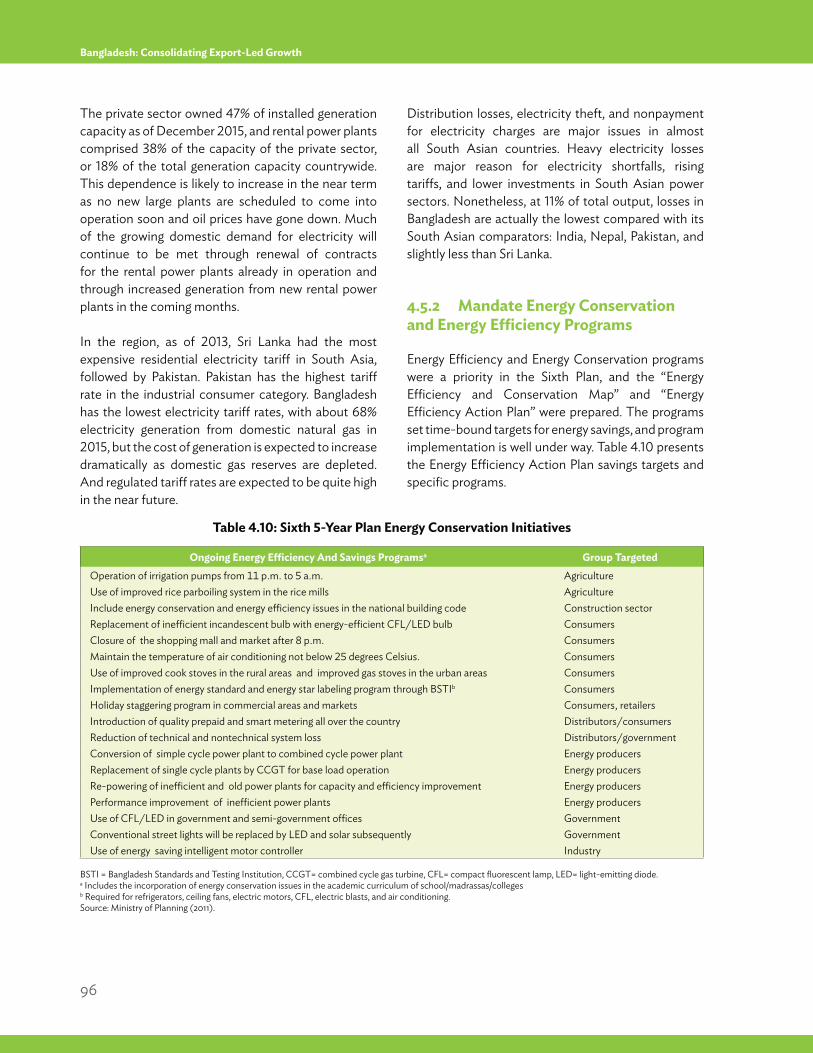
96
Bangladesh: Consolidating Export-Led Growth
The private sector owned 47% of installed generation capacity as of December 2015, and rental power plants comprised 38% of the capacity of the private sector, or 18% of the total generation capacity countrywide. This dependence is likely to increase in the near term as no new large plants are scheduled to come into operation soon and oil prices have gone down. Much of the growing domestic demand for electricity will continue to be met through renewal of contracts for the rental power plants already in operation and through increased generation from new rental power plants in the coming months.
In the region, as of 2013, Sri Lanka had the most expensive residential electricity tariff in South Asia, followed by Pakistan. Pakistan has the highest tariff rate in the industrial consumer category. Bangladesh has the lowest electricity tariff rates, with about 68% electricity generation from domestic natural gas in 2015, but the cost of generation is expected to increase dramatically as domestic gas reserves are depleted. And regulated tariff rates are expected to be quite high in the near future.
Distribution losses, electricity theft, and nonpayment for electricity charges are major issues in almost all South Asian countries. Heavy electricity losses are major reason for electricity shortfalls, rising tariffs, and lower investments in South Asian power sectors. Nonetheless, at 11% of total output, losses in Bangladesh are actually the lowest compared with its South Asian comparators: India, Nepal, Pakistan, and slightly less than Sri Lanka.
4.5.2 Mandate Energy Conservation and Energy Efficiency Programs
Energy Efficiency and Energy Conservation programs were a priority in the Sixth Plan, and the “Energy Efficiency and Conservation Map” and “Energy Efficiency Action Plan” were prepared. The programs set time-bound targets for energy savings, and program implementation is well under way. Table 4.10 presents the Energy Efficiency Action Plan savings targets and specific programs.
Table 4.10: Sixth 5-Year Plan Energy Conservation Initiatives
BSTI = Bangladesh Standards and Testing Institution, CCGT= combined cycle gas turbine, CFL= compact fluorescent lamp, LED= light-emitting diode.a Includes the incorporation of energy conservation issues in the academic curriculum of school/madrassas/colleges b Required for refrigerators, ceiling fans, electric motors, CFL, electric blasts, and air conditioning.Source: Ministry of Planning (2011).
Ongoing Energy Efficiency And Savings Programsa Group TargetedOperation of irrigation pumps from 11 p.m. to 5 a.m. AgricultureUse of improved rice parboiling system in the rice mills AgricultureInclude energy conservation and energy efficiency issues in the national building code Construction sectorReplacement of inefficient incandescent bulb with energy-efficient CFL/LED bulb ConsumersClosure of the shopping mall and market after 8 p.m. ConsumersMaintain the temperature of air conditioning not below 25 degrees Celsius. ConsumersUse of improved cook stoves in the rural areas and improved gas stoves in the urban areas ConsumersImplementation of energy standard and energy star labeling program through BSTIb ConsumersHoliday staggering program in commercial areas and markets Consumers, retailersIntroduction of quality prepaid and smart metering all over the country Distributors/consumersReduction of technical and nontechnical system loss Distributors/governmentConversion of simple cycle power plant to combined cycle power plant Energy producersReplacement of single cycle plants by CCGT for base load operation Energy producersRe-powering of inefficient and old power plants for capacity and efficiency improvement Energy producersPerformance improvement of inefficient power plants Energy producersUse of CFL/LED in government and semi-government offices GovernmentConventional street lights will be replaced by LED and solar subsequently GovernmentUse of energy saving intelligent motor controller Industry
97
The Energy Challenge: A Critical Constraint to Growth
Successful implementation of these initiatives should help conserve resources. If the initiatives are followed as planned, primary and secondary energy are estimated at 10% in 2016, 15% by 2021, and 20% by 2030. But these are mostly mandates that are very difficult to enforce.
A much easier way to promote energy efficiency is to raise the price so that budget-conscious consumers are more careful about use. However, because it is politically much more difficult, the tendency is to just put forth open targets rather than mandates. Some of these targets will be easy to achieve, such as installing LEDs (light-emitting diodes) lightbulbs or other energy-efficient lighting in government buildings. However, the government should also set targets for the reduction of energy use by industry. Moreover, measures such as congestion charges or other incentives to use public transportation can save fuel.
4.5.3 Attract Investment in Exploration and Infrastructure
To accelerate offshore exploration by international oil companies, the government recently improved the terms of the production-sharing contracts, and international oil companies initiated exploration activities during the Sixth Plan. But the failure of several of these, mentioned earlier, coupled with the sharp decline in oil prices globally led many of the foreign international oil companies to suspend their exploration activities.
Enhanced gas exploration and production needs to be part of the formula for closing the supply gap. No major new gas field has been discovered in recent decades and the rapid loss of pressure in the offshore Shanghu field in the Bay of Bengal has been a major supply shock for Bangladesh. The current stock of proven and recoverable natural gas at current extraction rates will last only about 10–13 years, a relatively short period, without more onshore and offshore gas exploration. Even if the power sector master plan is implemented effectively and the dependence on gas
is reduced significantly in relative terms, the country will face major supply shocks. The problem, as noted, is that the country has not attracted sufficient foreign investment—not just in energy, but in all sectors.
Since Petrobangla still runs most of the exploration, appetite among international oil companies remains minimal for exploration and investment in Bangladesh. The large number of regulatory hurdles and the prospects of selling to a domestic market at subsidized prices reduce the appetite of international oil companies to invest. The country would have to offer a significantly more attractive package of incentives to attract exploration.
Opening up an LNG terminal is also a good idea and would be complementary to domestic production. Indeed, recognizing shrinking domestic gas resources, Petrobangla is planning LNG imports. Texas-based Excelerate Energy and Petrobangla have signed a nonbinding term sheet to set up the country’s first LNG import terminal near Moheshkhali Island in the Bay of Bengal near Chittagong. Excelerate Energy will now conduct a study, and based on the results, the government is expected to sign a terminal use agreement with Excelerate Energy for 15 years, subject to approval from the cabinet purchase committee.
The terminal will have 138,000 cubic meters of LNG storage capacity and a base re-gasification capacity of 500 million cubic feet of gas a day (mmcfd), with gas supply due to start in 2017. The International Finance Corporation is likely to have equity participation in the terminal company. According to the energy ministry’s estimate, the government will have to spend around $2.7 billion annually to import 500 mmcfd LNG and to use a floating terminal.35
The LNG import will have the additional benefit of exposing Bangladesh to the international traded price of gas, forcing higher domestic prices, which itself would help to reduce the supply–demand gap. Currently the weighted average price of domestic gas is about $1.9 per GJ, far below the international traded gas price (Figure 4.8). Assuming that LNG imports start in 2016, the weighted average of the
____________________35 A floating terminal is a smaller vessel that converts LNG back into natural gas for transportation and use directly at markets. It is a very new technology.
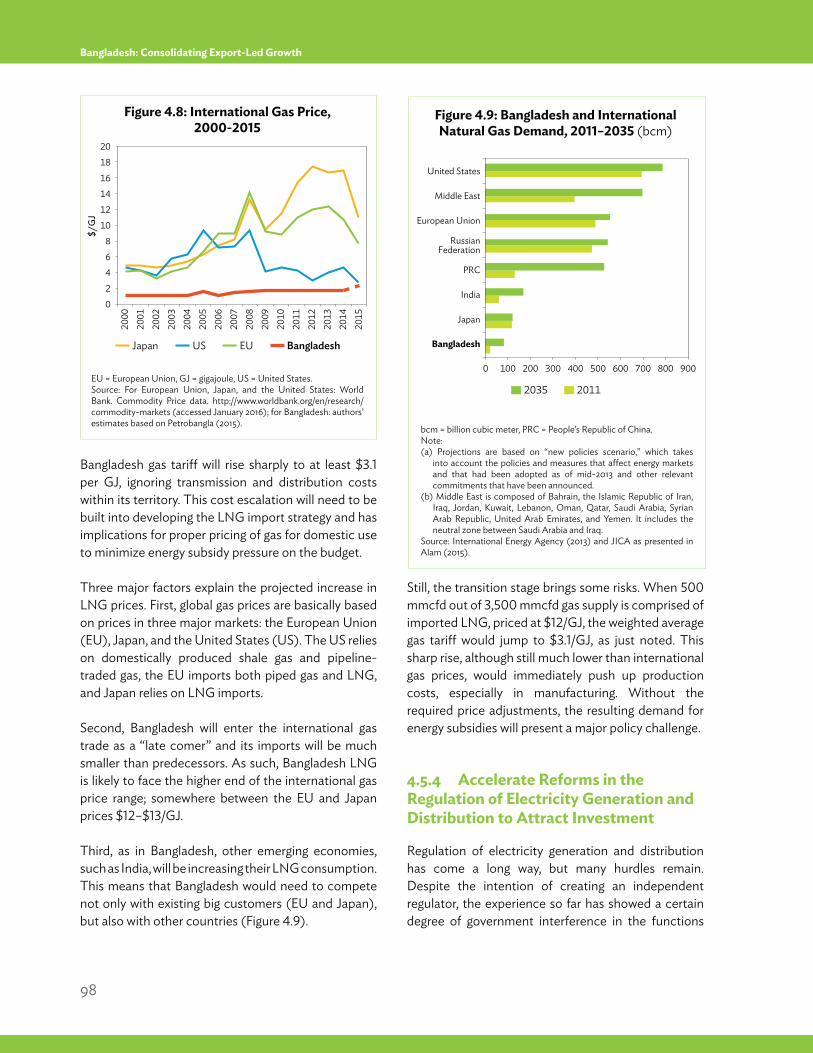
98
Bangladesh: Consolidating Export-Led Growth
Bangladesh gas tariff will rise sharply to at least $3.1 per GJ, ignoring transmission and distribution costs within its territory. This cost escalation will need to be built into developing the LNG import strategy and has implications for proper pricing of gas for domestic use to minimize energy subsidy pressure on the budget.
Three major factors explain the projected increase in LNG prices. First, global gas prices are basically based on prices in three major markets: the European Union (EU), Japan, and the United States (US). The US relies on domestically produced shale gas and pipeline-traded gas, the EU imports both piped gas and LNG, and Japan relies on LNG imports.
Second, Bangladesh will enter the international gas trade as a “late comer” and its imports will be much smaller than predecessors. As such, Bangladesh LNG is likely to face the higher end of the international gas price range; somewhere between the EU and Japan prices $12–$13/GJ.
Third, as in Bangladesh, other emerging economies, such as India, will be increasing their LNG consumption. This means that Bangladesh would need to compete not only with existing big customers (EU and Japan), but also with other countries (Figure 4.9).
Still, the transition stage brings some risks. When 500 mmcfd out of 3,500 mmcfd gas supply is comprised of imported LNG, priced at $12/GJ, the weighted average gas tariff would jump to $3.1/GJ, as just noted. This sharp rise, although still much lower than international gas prices, would immediately push up production costs, especially in manufacturing. Without the required price adjustments, the resulting demand for energy subsidies will present a major policy challenge.
4.5.4 Accelerate Reforms in the Regulation of Electricity Generation and Distribution to Attract Investment
Regulation of electricity generation and distribution has come a long way, but many hurdles remain. Despite the intention of creating an independent regulator, the experience so far has showed a certain degree of government interference in the functions
Japan
0
20
141210
8
642
1816
2000
2001
2002
2006
2005
2004
2003
2007
2008
2009
2010
2011
2012
2013
2014
2015
US EU Bangladesh
$/G
J
0 100 200 300 400 600500 700 800 900
India
Japan
Bangladesh
RussianFederation
European Union
PRC
Middle East
United States
2035 2011
Figure 4.8: International Gas Price, 2000-2015
Figure 4.9: Bangladesh and International Natural Gas Demand, 2011–2035 (bcm)
EU = European Union, GJ = gigajoule, US = United States.Source: For European Union, Japan, and the United States: World Bank. Commodity Price data. http://www.worldbank.org/en/research/commodity-markets (accessed January 2016); for Bangladesh: authors’ estimates based on Petrobangla (2015). bcm = billion cubic meter, PRC = People’s Republic of China.
Note: (a) Projections are based on “new policies scenario,” which takes
into account the policies and measures that affect energy markets and that had been adopted as of mid-2013 and other relevant commitments that have been announced.
(b) Middle East is composed of Bahrain, the Islamic Republic of Iran, Iraq, Jordan, Kuwait, Lebanon, Oman, Qatar, Saudi Arabia, Syrian Arab Republic, United Arab Emirates, and Yemen. It includes the neutral zone between Saudi Arabia and Iraq.
Source: International Energy Agency (2013) and JICA as presented in Alam (2015).
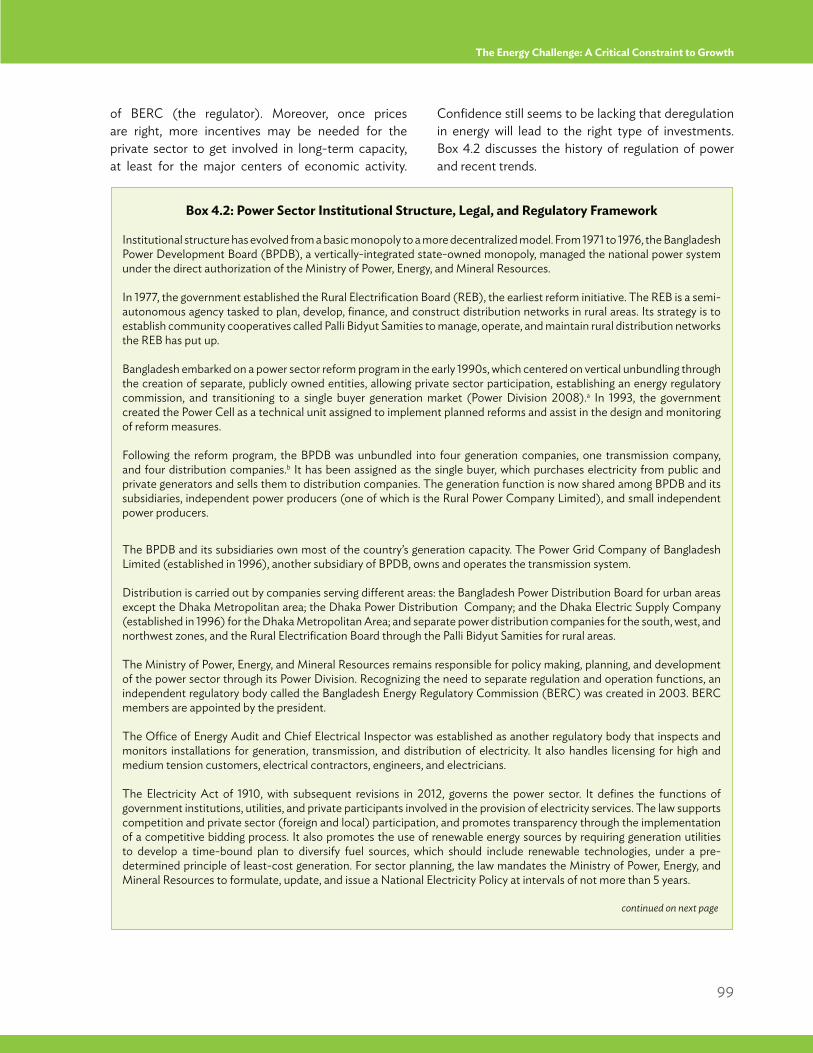
99
The Energy Challenge: A Critical Constraint to Growth
of BERC (the regulator). Moreover, once prices are right, more incentives may be needed for the private sector to get involved in long-term capacity, at least for the major centers of economic activity.
Confidence still seems to be lacking that deregulation in energy will lead to the right type of investments. Box 4.2 discusses the history of regulation of power and recent trends.
Box 4.2: Power Sector Institutional Structure, Legal, and Regulatory Framework
Institutional structure has evolved from a basic monopoly to a more decentralized model. From 1971 to 1976, the Bangladesh Power Development Board (BPDB), a vertically-integrated state-owned monopoly, managed the national power system under the direct authorization of the Ministry of Power, Energy, and Mineral Resources.
In 1977, the government established the Rural Electrification Board (REB), the earliest reform initiative. The REB is a semi-autonomous agency tasked to plan, develop, finance, and construct distribution networks in rural areas. Its strategy is to establish community cooperatives called Palli Bidyut Samities to manage, operate, and maintain rural distribution networks the REB has put up.
Bangladesh embarked on a power sector reform program in the early 1990s, which centered on vertical unbundling through the creation of separate, publicly owned entities, allowing private sector participation, establishing an energy regulatory commission, and transitioning to a single buyer generation market (Power Division 2008).a In 1993, the government created the Power Cell as a technical unit assigned to implement planned reforms and assist in the design and monitoring of reform measures.
Following the reform program, the BPDB was unbundled into four generation companies, one transmission company, and four distribution companies.b It has been assigned as the single buyer, which purchases electricity from public and private generators and sells them to distribution companies. The generation function is now shared among BPDB and its subsidiaries, independent power producers (one of which is the Rural Power Company Limited), and small independent power producers.
The BPDB and its subsidiaries own most of the country’s generation capacity. The Power Grid Company of Bangladesh Limited (established in 1996), another subsidiary of BPDB, owns and operates the transmission system.
Distribution is carried out by companies serving different areas: the Bangladesh Power Distribution Board for urban areas except the Dhaka Metropolitan area; the Dhaka Power Distribution Company; and the Dhaka Electric Supply Company (established in 1996) for the Dhaka Metropolitan Area; and separate power distribution companies for the south, west, and northwest zones, and the Rural Electrification Board through the Palli Bidyut Samities for rural areas.
The Ministry of Power, Energy, and Mineral Resources remains responsible for policy making, planning, and development of the power sector through its Power Division. Recognizing the need to separate regulation and operation functions, an independent regulatory body called the Bangladesh Energy Regulatory Commission (BERC) was created in 2003. BERC members are appointed by the president.
The Office of Energy Audit and Chief Electrical Inspector was established as another regulatory body that inspects and monitors installations for generation, transmission, and distribution of electricity. It also handles licensing for high and medium tension customers, electrical contractors, engineers, and electricians.
The Electricity Act of 1910, with subsequent revisions in 2012, governs the power sector. It defines the functions of government institutions, utilities, and private participants involved in the provision of electricity services. The law supports competition and private sector (foreign and local) participation, and promotes transparency through the implementation of a competitive bidding process. It also promotes the use of renewable energy sources by requiring generation utilities to develop a time-bound plan to diversify fuel sources, which should include renewable technologies, under a pre-determined principle of least-cost generation. For sector planning, the law mandates the Ministry of Power, Energy, and Mineral Resources to formulate, update, and issue a National Electricity Policy at intervals of not more than 5 years.
continued on next page
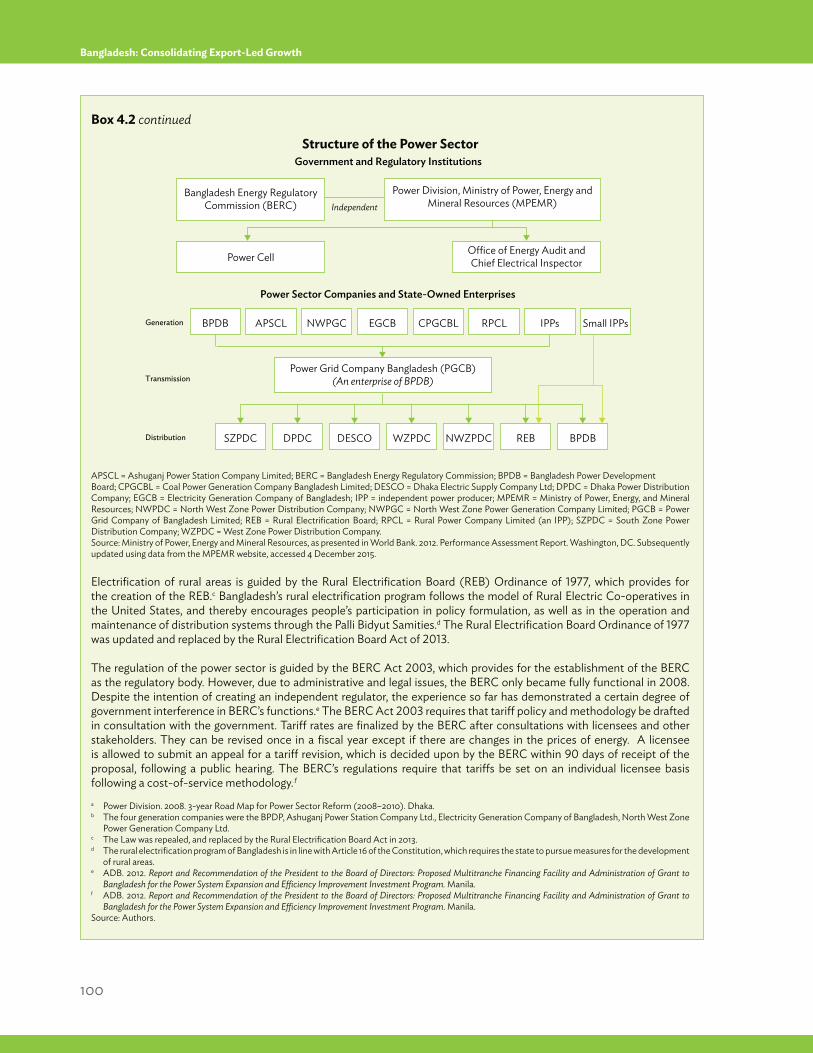
100
Bangladesh: Consolidating Export-Led Growth
Box 4.2 continued
Structure of the Power Sector
APSCL = Ashuganj Power Station Company Limited; BERC = Bangladesh Energy Regulatory Commission; BPDB = Bangladesh Power DevelopmentBoard; CPGCBL = Coal Power Generation Company Bangladesh Limited; DESCO = Dhaka Electric Supply Company Ltd; DPDC = Dhaka Power DistributionCompany; EGCB = Electricity Generation Company of Bangladesh; IPP = independent power producer; MPEMR = Ministry of Power, Energy, and Mineral Resources; NWPDC = North West Zone Power Distribution Company; NWPGC = North West Zone Power Generation Company Limited; PGCB = Power Grid Company of Bangladesh Limited; REB = Rural Electrification Board; RPCL = Rural Power Company Limited (an IPP); SZPDC = South Zone Power Distribution Company; WZPDC = West Zone Power Distribution Company.Source: Ministry of Power, Energy and Mineral Resources, as presented in World Bank. 2012. Performance Assessment Report. Washington, DC. Subsequently updated using data from the MPEMR website, accessed 4 December 2015.
Electrification of rural areas is guided by the Rural Electrification Board (REB) Ordinance of 1977, which provides for the creation of the REB.c Bangladesh’s rural electrification program follows the model of Rural Electric Co-operatives in the United States, and thereby encourages people’s participation in policy formulation, as well as in the operation and maintenance of distribution systems through the Palli Bidyut Samities.d The Rural Electrification Board Ordinance of 1977 was updated and replaced by the Rural Electrification Board Act of 2013.
The regulation of the power sector is guided by the BERC Act 2003, which provides for the establishment of the BERC as the regulatory body. However, due to administrative and legal issues, the BERC only became fully functional in 2008. Despite the intention of creating an independent regulator, the experience so far has demonstrated a certain degree of government interference in BERC’s functions.e The BERC Act 2003 requires that tariff policy and methodology be drafted in consultation with the government. Tariff rates are finalized by the BERC after consultations with licensees and other stakeholders. They can be revised once in a fiscal year except if there are changes in the prices of energy. A licensee is allowed to submit an appeal for a tariff revision, which is decided upon by the BERC within 90 days of receipt of the proposal, following a public hearing. The BERC’s regulations require that tariffs be set on an individual licensee basis following a cost-of-service methodology..f a Power Division. 2008. 3-year Road Map for Power Sector Reform (2008–2010). Dhaka.b The four generation companies were the BPDP, Ashuganj Power Station Company Ltd., Electricity Generation Company of Bangladesh, North West Zone
Power Generation Company Ltd. c The Law was repealed, and replaced by the Rural Electrification Board Act in 2013.d The rural electrification program of Bangladesh is in line with Article 16 of the Constitution, which requires the state to pursue measures for the development
of rural areas.e ADB. 2012. Report and Recommendation of the President to the Board of Directors: Proposed Multitranche Financing Facility and Administration of Grant to
Bangladesh for the Power System Expansion and Efficiency Improvement Investment Program. Manila.f ADB. 2012. Report and Recommendation of the President to the Board of Directors: Proposed Multitranche Financing Facility and Administration of Grant to
Bangladesh for the Power System Expansion and Efficiency Improvement Investment Program. Manila.Source: Authors.
Government and Regulatory Institutions
Power Sector Companies and State-Owned Enterprises
Generation
Transmission
Distribution
Bangladesh Energy Regulatory Commission (BERC)
Power Cell
BPDB APSCL NWPGC EGCB CPGCBL RPCL IPPs Small IPPs
SZPDC DPDC DESCO WZPDC NWZPDC REB BPDB
Office of Energy Audit and Chief Electrical Inspector
Power Division, Ministry of Power, Energy and Mineral Resources (MPEMR)
Power Grid Company Bangladesh (PGCB)(An enterprise of BPDB)
Independent
101
The Energy Challenge: A Critical Constraint to Growth
Financing power generation will also require the development of long-term capital markets. High-impact steps are needed in the short term. In a survey of international power sponsors who could be interested in Bangladesh, conducted in December 2009, the most significant issue raised by survey participants was the credibility of the government and regulators in fostering independent power producers in Bangladesh.
The general sense was that without a stronger government commitment to the process it would be difficult to attract the caliber of sponsors and contractors required for projects to succeed. The answer, in the market’s eyes, was not to overreach, but instead to focus efforts on successfully closing a few major projects to generate the positive momentum for achieving the government’s larger objectives. While conducting the transactions, there is a need for transparency in selecting the winning bidders. This is especially important for project financing—international commercial financiers will look for credible project sponsors and fair tender processes.
4.5.5 Embrace Regional Electricity Trading Markets
Regional electricity trade can allow Bangladesh to meet growing electricity demand in a cost-effective way. Linking Bangladesh with other countries and regions may reduce the need for domestic investment in high-cost generation capacity and provide back-up power. Equity investment would also give the government some financial relief. In principle, regional interconnection and trade can provide the following benefits:
Enhance the reliability and security of the local network by linking it with a larger grid and a greater number of generation sources, thus increasing the diversity of the generation system.
May reduce generation costs through economies of scale associated with power generation from larger facilities. Optimizing capital requirements for the electricity sector can free up capital
resources for other investments and improve the domestic fiscal situation.
Interconnection (and the ability to acquire power through trade) allows individual countries to have lower reserve requirements, which reduces the need (and cost) of investing in reserve power capacity.
Trade may allow more competition in open markets as it increases the availability of electricity from different sources at varying costs. In addition, interconnection between markets may allow convergence of electricity prices, since the connected areas can function as a single market. Interconnection may lead to an important reduction in variable costs as countries do not need to import expensive fuels.
In the case of seasonal renewable resources, such as hydropower, interconnection allows the linking of basins with different hydrology, securing for the user energy that can be supplied by different sources. This balancing of variable renewable resources also applies to wind and even biomass energy. There are many options for creating and expanding regional power markets, as well as examples from other regions around the world.
Electricity requirements in South Asian countries continues to rise, while progress on generation and transmission expansion remains slow and limited, and all but Bhutan have been suffering electricity supply shortages. Load shedding has severely undermined economies. For example, the electricity crisis in Pakistan reduced GDP by at least 2% in 2013 and 2014 (ADB 2015c).
South Asia’s energy resource endowments are varied. Fossil fuels are available in some areas, while huge renewable energy resources estimated at 350 MW remain unexploited in other areas (IRADe 2013). Bangladesh, India, and Pakistan are endowed with natural gas and coal resources. However, these resources have been insufficient to meet the exponential growth in electricity demand driven
102
Bangladesh: Consolidating Export-Led Growth
mainly by economic expansion and large populations in these countries. Yet, Nepal and Bhutan have huge hydropower potential that is left unexploited due to insufficient investment.
Differences in time zones, designated weekends, and festivities among countries create differing peak times, and translate into opportunities for optimizing load generation in the region. Intraseasonal differences also present the same opportunity. During monsoon season, when the hydropower generation capacities of Nepal and Bhutan are more than sufficient, some hydro output can be exported to Bangladesh, India, and Pakistan. In the same way, during winter season, the thermal power output of Bangladesh, India, and Pakistan can support hydropower-dependent countries. The complementarities of electricity supply and demand in South Asia make a good case for regional power trading. In addition, the proximity of transmission networks makes establishing an integrated electricity system viable. Table 4.14 maps the prospects for electricity trade in the region.
Regional power trade offers technical and operational, economic, financial, and environmental benefits. Integrating power subsystems improves the reliability and efficiency of the system by allowing coordinated planning and operation, sharing of reserves, and easy access to back-up electricity during emergencies. More reliable systems raise business productivity and competitiveness, especially for firms engaged in
energy-intensive operations. It also allows optimal utilization of cost-effective energy resources, reducing generation costs.
Countries can also engage in collaborative financial partnerships to build capacity. This allows smaller countries like Bhutan and Nepal to benefit from economies of scale in developing large capacity hydropower plants. This enables them to price their power exports competitively. In addition, building large power plants attracts private sector participation, lowers average costs and leads to higher returns than small plants.
Cross-border trading in electricity has many other advantages. Lesser dependence on imported fuels cushions countries from volatility of the international prices of oil, natural gas, and coal. Greater use of hydropower under such trade, meanwhile, would also reduce carbon dioxide emissions. In addition, it can contribute to social benefits: according to WHO and UNDP (2009), greater access to energy boosts human development, including higher school enrollment and lower deprivation.
India and Bangladesh, India and Bhutan, and India and Nepal have engaged in cross-border electricity trade under bilateral agreements. The benefits of electricity trade can be encouraged by establishing a regional power exchange, developing adequate trade infrastructure, and creating and implementing
Table 4.11: Complementarities of Resources and Available Interconnections in South Asia
... = not applicable.Source: World Bank (2008), presented in IRADe (2013).
Importing Country
Exporting Country
Bangladesh Bhutan India Nepal Sri LankaBangladesh ‥. Some hydropower;
connection via India Sharing reserves; electricity swap; HVDC back-to-back link
Some hydropower; connection via India
No scope
Bhutan Small amount of thermal power and gas; connection via India
... Dry season support; connection
Unlikely. Similarity of resources and seasonal shortages.
No scope
India Significant amount of gas or power possible; resource uncertainty
Significant quantities of hydro power
... Significant hydropower export possible
Some peak power support possible
Nepal Small amount of thermal power and gas; connection via India
Unlikely due to similarity of resources and seasonal shortage.
Thermal power support during dry season
... No scope
Sri Lanka Unlikely Unlikely Dry season and thermal power support
Unlikely ...
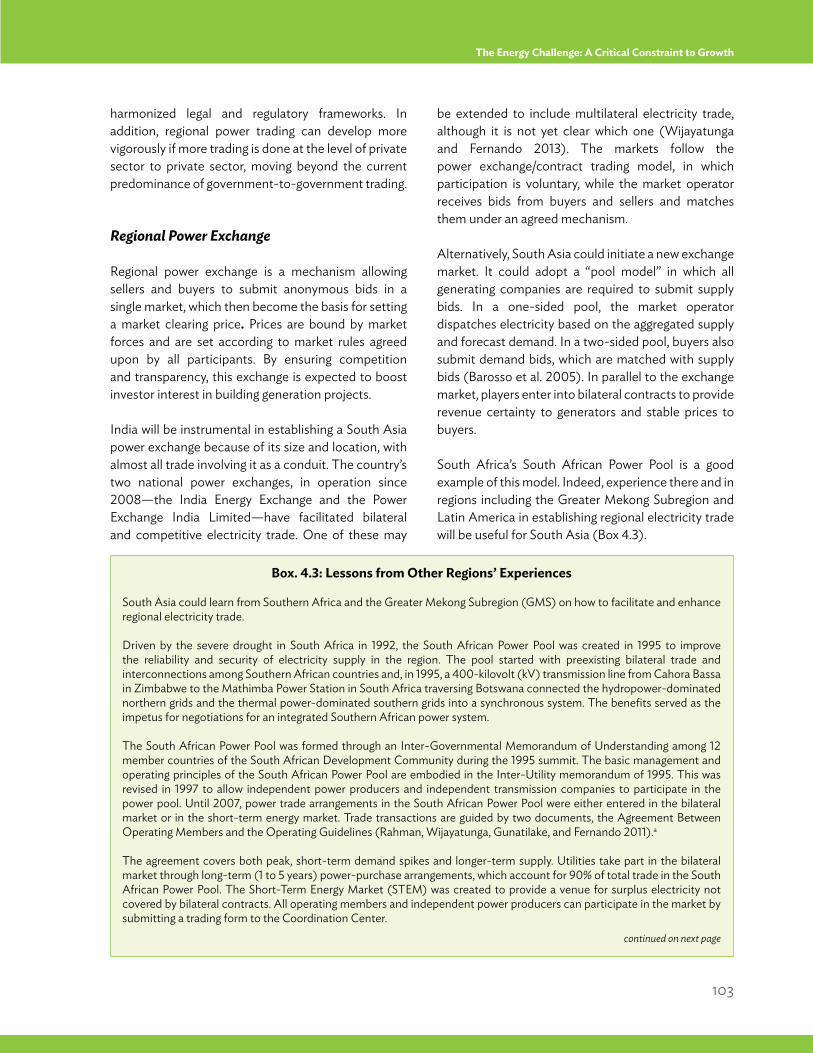
103
The Energy Challenge: A Critical Constraint to Growth
harmonized legal and regulatory frameworks. In addition, regional power trading can develop more vigorously if more trading is done at the level of private sector to private sector, moving beyond the current predominance of government-to-government trading.
Regional Power Exchange
Regional power exchange is a mechanism allowing sellers and buyers to submit anonymous bids in a single market, which then become the basis for setting a market clearing price. Prices are bound by market forces and are set according to market rules agreed upon by all participants. By ensuring competition and transparency, this exchange is expected to boost investor interest in building generation projects. India will be instrumental in establishing a South Asia power exchange because of its size and location, with almost all trade involving it as a conduit. The country’s two national power exchanges, in operation since 2008—the India Energy Exchange and the Power Exchange India Limited—have facilitated bilateral and competitive electricity trade. One of these may
be extended to include multilateral electricity trade, although it is not yet clear which one (Wijayatunga and Fernando 2013). The markets follow the power exchange/contract trading model, in which participation is voluntary, while the market operator receives bids from buyers and sellers and matches them under an agreed mechanism.
Alternatively, South Asia could initiate a new exchange market. It could adopt a “pool model” in which all generating companies are required to submit supply bids. In a one-sided pool, the market operator dispatches electricity based on the aggregated supply and forecast demand. In a two-sided pool, buyers also submit demand bids, which are matched with supply bids (Barosso et al. 2005). In parallel to the exchange market, players enter into bilateral contracts to provide revenue certainty to generators and stable prices to buyers.
South Africa’s South African Power Pool is a good example of this model. Indeed, experience there and in regions including the Greater Mekong Subregion and Latin America in establishing regional electricity trade will be useful for South Asia (Box 4.3).
Box. 4.3: Lessons from Other Regions’ Experiences
South Asia could learn from Southern Africa and the Greater Mekong Subregion (GMS) on how to facilitate and enhance regional electricity trade.
Driven by the severe drought in South Africa in 1992, the South African Power Pool was created in 1995 to improve the reliability and security of electricity supply in the region. The pool started with preexisting bilateral trade and interconnections among Southern African countries and, in 1995, a 400-kilovolt (kV) transmission line from Cahora Bassa in Zimbabwe to the Mathimba Power Station in South Africa traversing Botswana connected the hydropower-dominated northern grids and the thermal power-dominated southern grids into a synchronous system. The benefits served as the impetus for negotiations for an integrated Southern African power system.
The South African Power Pool was formed through an Inter-Governmental Memorandum of Understanding among 12 member countries of the South African Development Community during the 1995 summit. The basic management and operating principles of the South African Power Pool are embodied in the Inter-Utility memorandum of 1995. This was revised in 1997 to allow independent power producers and independent transmission companies to participate in the power pool. Until 2007, power trade arrangements in the South African Power Pool were either entered in the bilateral market or in the short-term energy market. Trade transactions are guided by two documents, the Agreement Between Operating Members and the Operating Guidelines (Rahman, Wijayatunga, Gunatilake, and Fernando 2011).a
The agreement covers both peak, short-term demand spikes and longer-term supply. Utilities take part in the bilateral market through long-term (1 to 5 years) power-purchase arrangements, which account for 90% of total trade in the South African Power Pool. The Short-Term Energy Market (STEM) was created to provide a venue for surplus electricity not covered by bilateral contracts. All operating members and independent power producers can participate in the market by submitting a trading form to the Coordination Center.
continued on next page
104
Bangladesh: Consolidating Export-Led Growth
Harmonized Legal, Regulatory, and Technical Standards Framework
A regional power market requires broad agreement among interested countries to facilitate bilateral power
exchanges, followed by the creation of multilateral power exchanges (Rahman et al. 2011). This can be facilitated through the South Asia Association for Regional Cooperation. A range of legal and regulatory issues need to be harmonized, including trading
continued on next page
The bids may be for monthly, weekly, and daily contracts. The Coordination Center matches the bids and publishes the quantity and price results. Prices are based on seller’s price. Wheeling charges are paid directly by buyers to the transmission owner. In 2009, a fully competitive Day-Ahead Market replaced the Short-Term Energy Market. In the Day-Ahead Market, price is calculated based on aggregated supply and demand bids and transmission capacities. Generators are paid the same pool price.
Another good example of energy cooperation is among GMS member countries, started in 1992 as part of the GMS Cooperation Program. In 1995, the GMS established the Electric Power Forum to further energy cooperation in the areas of regional power trade and interconnections. GMS and the Asian Development Bank initiated the Regional Indicative Master Plan to analyze energy demand and identify priority interconnections to facilitate regional power trade. The Experts Group on Power Interconnection and Trade determined institutional, legal, and other necessary arrangements to develop and operate the interconnected network.
In 2002, the Inter-Governmental Agreement on Regional Power Trade provided the broad framework for GMS power trade and the development of regional power trade in stages—starting with bilateral trade through power purchase agreements involving independent power producers, then to trading between two GMS countries through a transit GMS country and then to a competitive regional market.
GMS has built power projects that have strengthened existing connections between the Lao People’s Democratic Republic (Lao PDR) and Thailand, the Lao PDR and Cambodia, Myanmar and Yunnan Province in the People’s Republic of China, and Yunnan Province and Viet Nam.
New capacity from hydropower and coal-fired plants in the Lao PDR, mainly for export to Thailand, hydropower plants in Myanmar for export to Yunnan Province, a 115-kilovolt transmission line from Cambodia to Thailand, and a 230-kilovolt transmission line from Cambodia to Viet Nam boosted existing subregional connections and resulted in about 34,139 gigawatt hours of electricity trade in 2010.
Thailand and Viet Nam managed their growing electricity demand using imported and competitively priced electricity from the Lao PDR and Yunnan Province. Outlying regions of Cambodia, the Lao PDR, and Viet Nam were all able to gain access to affordable electricity from nearby GMS countries (ADB 2012b).b Nonetheless, the GMS still has a long way to go in establishing a regional power market.
Latin America
Cross-border electricity trade and integration has been particularly important for some Latin American countries and subregions. A total of more than 50 gigawatt-hours (GWh) was traded (that is, the aggregate of power exchanges between countries) by the region in 2012, of which 40.7 GWh were accounted for by Brazil.
Of the region‘s total electricity exports of around 50 GWh in 2012, Paraguay was the single-largest trading country, accounting for 47.7 GWh (primarily exports from the large Itaipu and Yacyreta hydropower plants).
Electricity trade occurs primarily in three separate zones: (i) Argentina, Brazil, Paraguay, and Uruguay; (ii) Mexico and Central America; and (iii) Colombia, Ecuador, Panama, and Venezuela. Paraguay plays the most important role in the region‘s electricity trade, being the largest net exporter. With an average of 45 GWh exported annually since 2000, Paraguay is a major electricity supplier to Brazil and Argentina.
Box 4.3 continued
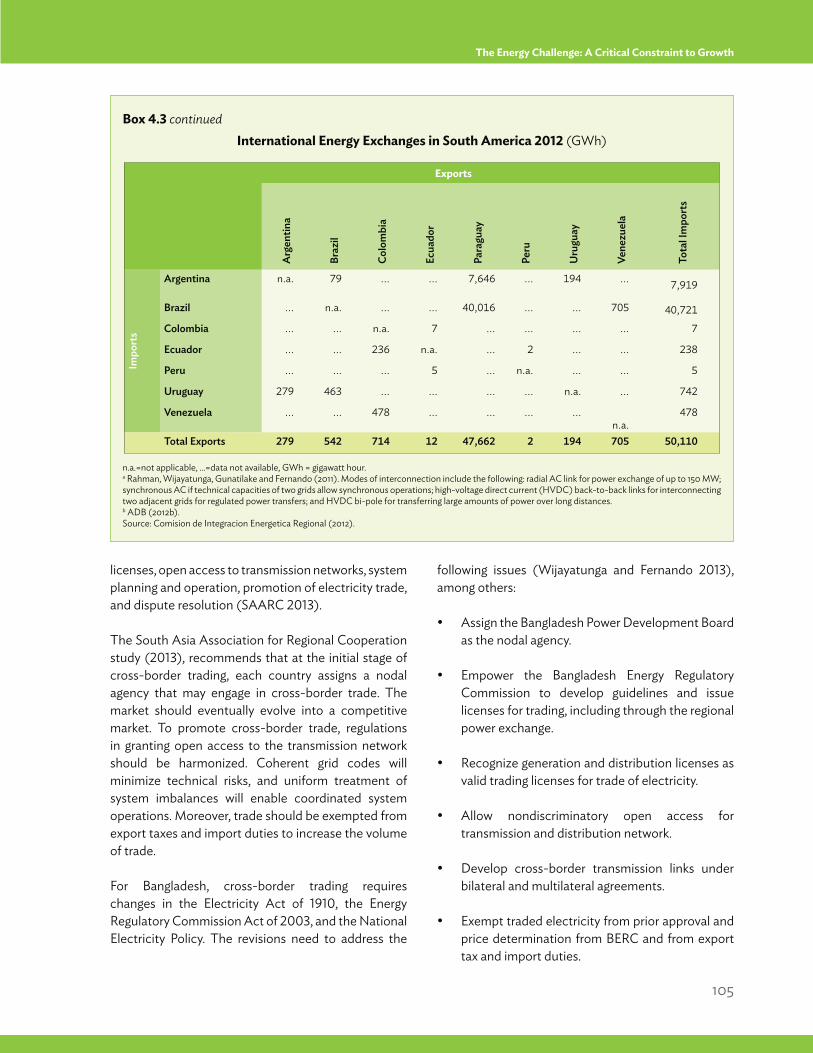
105
The Energy Challenge: A Critical Constraint to Growth
licenses, open access to transmission networks, system planning and operation, promotion of electricity trade, and dispute resolution (SAARC 2013).
The South Asia Association for Regional Cooperation study (2013), recommends that at the initial stage of cross-border trading, each country assigns a nodal agency that may engage in cross-border trade. The market should eventually evolve into a competitive market. To promote cross-border trade, regulations in granting open access to the transmission network should be harmonized. Coherent grid codes will minimize technical risks, and uniform treatment of system imbalances will enable coordinated system operations. Moreover, trade should be exempted from export taxes and import duties to increase the volume of trade.
For Bangladesh, cross-border trading requires changes in the Electricity Act of 1910, the Energy Regulatory Commission Act of 2003, and the National Electricity Policy. The revisions need to address the
following issues (Wijayatunga and Fernando 2013), among others:
Assign the Bangladesh Power Development Board as the nodal agency.
Empower the Bangladesh Energy Regulatory Commission to develop guidelines and issue licenses for trading, including through the regional power exchange.
Recognize generation and distribution licenses as valid trading licenses for trade of electricity.
Allow nondiscriminatory open access for transmission and distribution network.
Develop cross-border transmission links under bilateral and multilateral agreements.
Exempt traded electricity from prior approval and price determination from BERC and from export tax and import duties.
Box 4.3 continuedInternational Energy Exchanges in South America 2012 (GWh)
Exports
Arg
entin
a
Braz
il
Colo
mbi
a
Ecua
dor
Para
guay
Peru
Uru
guay
Vene
zuel
a
Tota
l Im
port
s
Impo
rts
Argentina n.a. 79 ... ... 7,646 ... 194 ... 7,919
Brazil ... n.a. ... ... 40,016 ... ... 705 40,721
Colombia ... ... n.a. 7 ... ... ... ... 7
Ecuador ... ... 236 n.a. ... 2 ... ... 238
Peru ... ... ... 5 ... n.a. ... ... 5
Uruguay 279 463 ... ... ... ... n.a. ... 742
Venezuela ... ... 478 ... ... ... ... n.a.
478
Total Exports 279 542 714 12 47,662 2 194 705 50,110
n.a.=not applicable, ...=data not available, GWh = gigawatt hour. a Rahman, Wijayatunga, Gunatilake and Fernando (2011). Modes of interconnection include the following: radial AC link for power exchange of up to 150 MW; synchronous AC if technical capacities of two grids allow synchronous operations; high-voltage direct current (HVDC) back-to-back links for interconnecting two adjacent grids for regulated power transfers; and HVDC bi-pole for transferring large amounts of power over long distances. b ADB (2012b). Source: Comision de Integracion Energetica Regional (2012).
106
Bangladesh: Consolidating Export-Led Growth
Develop a grid code allowing coordinated system operation with other South Asian countries, treatment of system imbalances from schedule, and a mechanism for resolution of disputes related to the regional power market.
Electricity trade is already considered an element of the Power Sector Master Plan 2010, although it has not been appropriately emphasized. Bangladesh is already receiving about 450 MW–500 MW of power from India under a government-to-government deal. Although the 2016–2020 Five-Year Plan is a continuation of the previous plan, with ambitious targets for expanding electricity, the focus is still on addressing implementation gaps of the earlier plan, and less on a bold new outlook toward regional power trade (although there is general support for it). Regional electricity trade requires the concerted effort of involved countries to develop adequate power capacity to facilitate reliable and secure electricity transfers. But concerted effort by one of the potential parties can help move other members along. Bangladesh is well-placed to take on that catalyst role. Interconnections can be constructed in a phased manner; commencing with the most feasible infrastructure that would facilitate bilateral trade, and then upgrading to accommodate multilateral electricity transfers. The conduct of economic and technical analyses is imperative to decide on the mode of interconnection (synchronous or asynchronous) and scheme for grid-level protection (Rahman et al. 2011).36 Technical risks can be managed fairly easily because all countries in South Asia follow similar technical standards in power system planning and operation.
The South Asia Subregional Economic Cooperation Program could help set initial regional standards. The program is a project-based partnership among Bangladesh, Bhutan, the Maldives, Nepal, and Sri Lanka. It has been a venue for improving infrastructure for intraregional energy trade. Under it, about $1.28 billion has been invested in energy
projects, including an electrical grid interconnection project between Bangladesh and India and a transmission capacity expansion project in Nepal. In 2013, the program established the South Asia Subregional Economic Cooperation Program Electricity Transmission Utility Forum as a technical subcommittee focused on the development of cross-border power transmission infrastructure. This forum could be a venue for setting regional technical standards.
The first national-grid-to-national-grid inter-connection in South Asia was between India and Bangladesh. Initiated in 2013, it was facilitated by a 500-megawatt, back-to-back, high voltage, direct-current transmission link between Baharampur in eastern India and Bheramara in western Bangladesh. It allows both countries to independently manage their subsystem. The new transmission project is expected to result to annual benefits ranging from $145 million to $389 million (Wijayatunga, Chattopadhaya, and Fernando 2015). The interconnector between Pallatana in India and Comilla in eastern Bangladesh was commissioned in 2013. A number of other possible interconnectors for increased power import from India and other neighbors like Bhutan to Bangladesh are currently under consideration with support from the Indian government. Some of these include Silchar to Fenchuganj for 750 MW, Alipurduar to Bogra 1,000 MW, and Purania to Barapukuria 1,000 MW. Other route options are being discussed actively, such as a possible 765-kilovolt high-voltage direct current line between Bangladesh and northeastern India, and even a regional gas linkage for thermal generation. There is also great potential for exchanges with Myanmar, which can sell some possible excess electricity (Figure 4.10).
Options for Increasing Interconnectedness
Achieving the best connection involves important technical challenges, making it necessary to prioritize regional negotiations among all countries involved. For
____________________36 Modes of interconnection include the following: radial AC link for power exchange of up to 150 MW; synchronous AC if technical capacities of two grids allow
synchronous operations; HVDC back-to-back links for interconnecting two adjacent grids for regulated power transfers; and HVDC bi-pole for transferring large amounts of power over long distances.
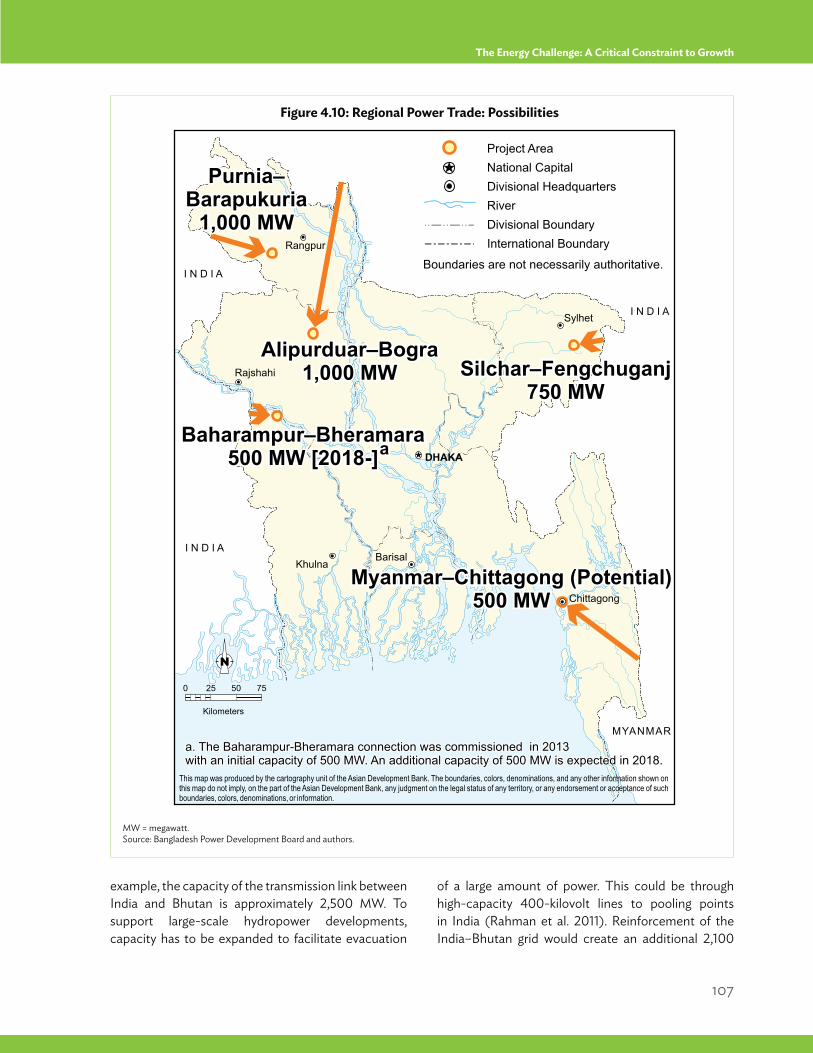
107
The Energy Challenge: A Critical Constraint to Growth
example, the capacity of the transmission link between India and Bhutan is approximately 2,500 MW. To support large-scale hydropower developments, capacity has to be expanded to facilitate evacuation
of a large amount of power. This could be through high-capacity 400-kilovolt lines to pooling points in India (Rahman et al. 2011). Reinforcement of the India–Bhutan grid would create an additional 2,100
Figure 4.10: Regional Power Trade: Possibilities
MW = megawatt. Source: Bangladesh Power Development Board and authors.
108
Bangladesh: Consolidating Export-Led Growth
MW of capacity and up to $1.8 billion annual benefit (Wijayatunga and Fernando 2013). The existing interconnections between India and Nepal allow transfers of up to 400 gigawatt-hours only, supported by three 132 kV and some 33/11-kilovolt cross-border links. This technical constraint thus implies limited transfer of huge power surpluses of Nepal to India during the summer.
There are four possible interconnections that could address the constraint—between Butwal (Nepal) and Gorakpur (India), Duhabi and Purnea, Dhalkebar and Muzaffarpur, and Anarmani and Siliguri. Currently under way is the construction of a 400-kilovolt transmission line between Dhalkebar and Muzaffarpur.
There is no interconnection between India and Pakistan and India and Sri Lanka. To initiate trade, a possible interconnection between India and Pakistan could go through Daninath substation near Lahore and Patti in Indian Punjab. For Sri Lanka, the best option is an interconnection with double-circuit high-voltage direct current (HVDC) overhead transmission and a double circuit HVDC submarine cable (Rahman et. al. 2011).
The Bay of Bengal Initiative for Multi-Sectoral Technical and Economic Cooperation Secretariat has finished a draft deal to set up power grid connections for electricity trade among its seven member countries: Bangladesh, Bhutan, India, Myanmar, Nepal, Sri Lanka, and Thailand. This covered trans-power exchange and grid interconnection, hydropower development, and energy security of the region. The deal will pave the way for all member countries to buy and sell energy according to need through private or public companies and ease power generation, distribution, and trading between the initiative states. The relevant initiative bodies are responsible for identifying regional and subregional projects in the area of power generation, transmission, and power trade, including hydropower, natural gas, solar, wind, and biofuel, and implementing them with top priority to meet increasing demand for power in the region. The seven member states have the potential of generating around 260,000 MW of hydropower, including 150,000 MW by India, 40,000 MW by Myanmar, 30,000 MW by Bhutan and Nepal each, 500 MW by Bangladesh and Thailand each, and 1,000 MW by Sri Lanka.
All these possibilities could just be the beginning of a much broader regional power trade initiative, which alone could add 3,000 MW of electricity to the Bangladesh national grid. Beyond that, other major regional initiatives encompassing Bhutan, Nepal, and northeastern India with huge hydropower potential can be envisaged. Both Bhutan and Nepal are interested in long-term investment in their hydropower projects and in exporting their surplus hydropower to Bangladesh.
4.6 Conclusions and Policy RecommendationsUnless the current energy supply gap can be bridged, Bangladesh’s long-term economic growth rate will continue to underperform relative to its potential. The marginal cost of producing electricity has increased substantially in the last 5 years, during which financial viability of the power sector has become more difficult to achieve. A large share of electricity is produced either by rental power plants with low capacity or old and inefficient plants that would soon need to be retired. For most firms, expensive and inefficient diesel-generated electricity and cheap but unreliable electricity supply from the grid represents an unacceptable trade-off.
The supply–demand gap problem has its genesis in four deficiencies: (i) limited participation of private investors in energy projects, (ii) inefficient operation of the state-owned oil and gas production company and minimal competition in generation, (iii) limited international oil company investment in exploration, and (iv) low subsidized tariff rates are in effect (below cost-recovery level).
The solution will be a combination of attracting the private sector into investing in power plant projects; diversifying the fuel mix and the sources of energy, in particular, relying on imports; and expanding regional electricity trading markets. To do this, the institutional and regulatory environment will have to be strengthened further. On the demand side, despite regulations to promote better energy efficiency, unless consumers are faced with higher electricity and fuel prices, they will have little incentive to change consumption behavior.
109
The Energy Challenge: A Critical Constraint to Growth
Yet the potential outlook is not necessarily bad. Bangladesh has abundant untapped natural gas resources as well as South Asian neighbors like Bhutan and Nepal with large supplies of hydropower. Bangladesh also has ample room for improving energy efficiency.
An awareness campaign is required that brings to light the negative economic impact of electricity subsidies and the need to increase opportunities for private investors to come in at different stages of the supply chain. At the moment, the government has taken on this challenge as part of its master plan. However, the supply–demand gap is not a problem that only a few officials at the Ministry of Energy and Petrobangla can solve. Naturally, the government will need to lead the charge and coordinate any substantive solution, but households and firms that are the users need to be a major part of the solution. The government should consider an awareness campaign and demonstration impacts (for example, by awarding firms that find energy-savings solutions, or special zones that give foreign investors in the energy sector the same types of privileges offered to investors in the garment sector). The low levels of foreign direct investment described in Chapter 1 are the manifestation of institutional bottlenecks that are also very prevalent in the energy sector. In this regard, recent reforms of production-
sharing contracts with oil and gas companies go in the right direction.
Finally, a campaign to increase tariffs will need a concerted political commitment. This would have to begin with an information campaign on the cost to the budget of subsidies and how that money could be spent on health, education, or fertilizer for example. The campaign would also show that the wealthier consumers tend to benefit the most from the subsidies. The announcements would have to come about some months in advance from the actual implementation to allow consumers—both industrial and households—to adjust. Subsidies could be maintained somewhat for fertilizer and private sector and solar wind projects in combination with campaigns for changes in energy consumption behavior.
These three main areas are discussed in detail in the Five-Year Plan, except that the plan is much more specific about financing issues as well as institutional limitations. In this regard, the difference between the discussion in the plan and the discussion in this chapter is mostly one of emphasis. The annex table of Chapter 5 in the plan (Planning Commission 2015) provides a detailed list of power generation projects in the Seventh Plan.
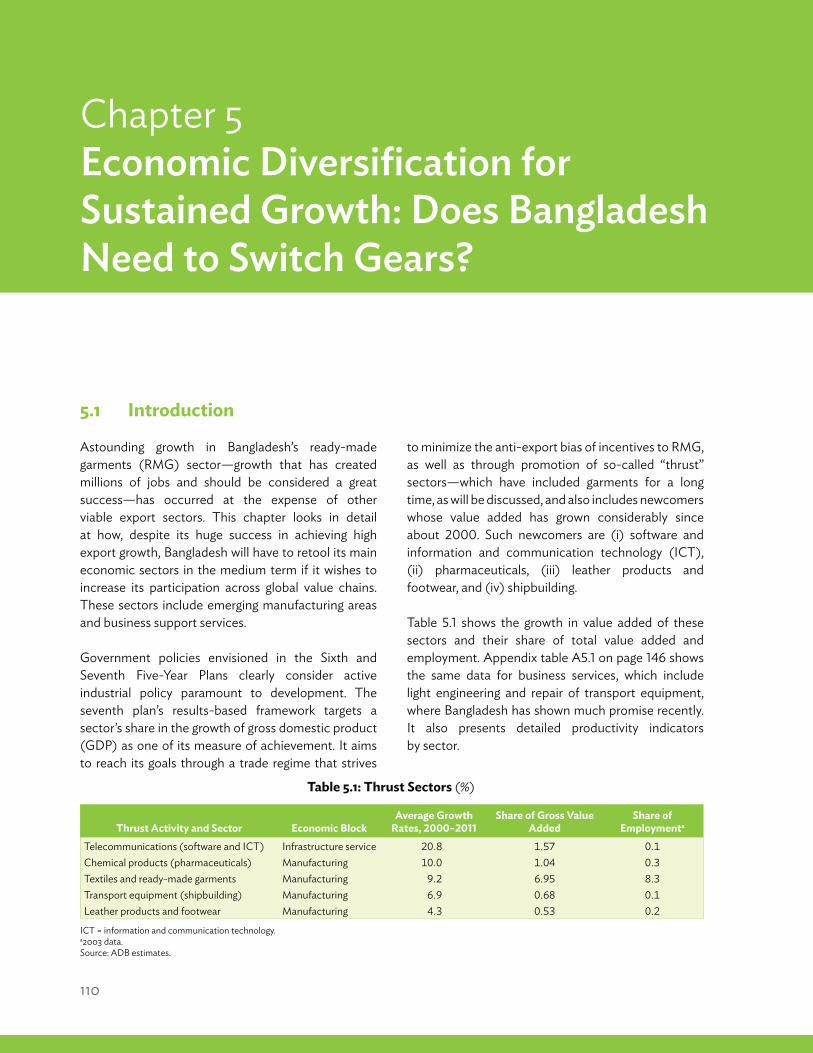
110
Bangladesh: Consolidating Export-Led Growth
Chapter 5Economic Diversification for Sustained Growth: Does Bangladesh Need to Switch Gears?
to minimize the anti-export bias of incentives to RMG, as well as through promotion of so-called “thrust” sectors—which have included garments for a long time, as will be discussed, and also includes newcomers whose value added has grown considerably since about 2000. Such newcomers are (i) software and information and communication technology (ICT), (ii) pharmaceuticals, (iii) leather products and footwear, and (iv) shipbuilding.
Table 5.1 shows the growth in value added of these sectors and their share of total value added and employment. Appendix table A5.1 on page 146 shows the same data for business services, which include light engineering and repair of transport equipment, where Bangladesh has shown much promise recently. It also presents detailed productivity indicators by sector.
5.1 Introduction
Astounding growth in Bangladesh’s ready-made garments (RMG) sector—growth that has created millions of jobs and should be considered a great success—has occurred at the expense of other viable export sectors. This chapter looks in detail at how, despite its huge success in achieving high export growth, Bangladesh will have to retool its main economic sectors in the medium term if it wishes to increase its participation across global value chains. These sectors include emerging manufacturing areas and business support services.
Government policies envisioned in the Sixth and Seventh Five-Year Plans clearly consider active industrial policy paramount to development. The seventh plan’s results-based framework targets a sector’s share in the growth of gross domestic product (GDP) as one of its measure of achievement. It aims to reach its goals through a trade regime that strives
Table 5.1: Thrust Sectors (%)
ICT = information and communication technology. a2003 data.Source: ADB estimates.
Thrust Activity and Sector Economic BlockAverage Growth
Rates, 2000–2011Share of Gross Value
AddedShare of
Employmenta
Telecommunications (software and ICT) Infrastructure service 20.8 1.57 0.1Chemical products (pharmaceuticals) Manufacturing 10.0 1.04 0.3Textiles and ready-made garments Manufacturing 9.2 6.95 8.3Transport equipment (shipbuilding) Manufacturing 6.9 0.68 0.1Leather products and footwear Manufacturing 4.3 0.53 0.2
111
Economic Diversification for Sustained Growth: Does Bangladesh Need to Switch Gears?
Thrust sectors may allow Bangladesh to move up the production value chain by developing expertise and niches in related areas. At the same time, the manufacture of textiles and garments historically has been the source of early industrialization across the world (see Goldin 1990, for example). This brings up the issue of whether the right development strategy is to support specific sectors that have promise, or whether the use of indirect support strategies that could benefit all sectors—including services and nontradables—is more effective.
For Bangladesh, the initial wave of government industrial policy support to the garments sector, in the 1980s and 1990s, inadvertently eclipsed indirect strategies that could have benefited all sectors. Over time, support strategies for thrust sectors in general were reinforced, but certain policy incentives for the RMG sector—which should have been gradually withdrawn by the mid-2000s to allow other priority sectors to catch up with RMG—did not occur. For example, the gradual phaseout of corporate income tax. This altered the policy landscape and created a business environment biased against the development of other exports.
We argue that more than promoting thrust sectors, the government needs to remove the disincentives to non-RMG exports and potential export sectors that arise from the current trade regime.
Despite past debate, a lack of data and the difficulty of measuring productivity in an economy and how firms interact across sectors is a significant barrier to understanding the effects of diversification policies. Fortunately, this chapter develops a methodology to link production processes within the country with data on international production sharing. It considers what happens to sectoral linkages through the production process when a particular sector begins to thrive. In particular, it shows how do business services, infrastructure services, and education and community services respond to growing export-oriented sectors.
The chapter examines Bangladesh’s export sectors in detail—particularly RMG—their competitiveness, and their links to the domestic and nontradable sectors. By
scrutinizing these links, the analysis makes inferences about the structural transformation taking place, how it compares to other countries, and more importantly, what influence industrial policy has had on this transformation.
It then discusses the process of diversification, and how the export sector relates to the nontradable sectors.37 Using input–output tables juxtaposed with trade data over more than a decade to decipher linkages between productive sectors, we find that, unlike other countries, Bangladesh has not been able to develop strong internal or external linkages that would enable a more diversified productive transformation, including insertion into global production chains. The conclusion is that while the RMG export-promotion policies of the 1980s and 1990s were a resounding success, they should have been reevaluated and leveled with other sectors during the 2000s, as this may have enabled a resource reallocation to other promising sectors and to infrastructure services. In addition, for Bangladesh to engage in global value chains and be vertically integrated into cross-border production activities, it will have to more actively develop a tradition of producing intermediate goods such as machinery components and auto parts.
5.1.1 The Ready-Made Garment Sector in Bangladesh: Huge Success but Challenges Ahead
Growth of RMG exports has been astounding by any measure. The RMG sector in Bangladesh was initiated in the late 1970s, with nine export-oriented garment manufacturing firms earning less than a million dollars a year. In 1980, Bangladesh occupied the 76th position by the US dollar value of clothing exports, or less than $200 million. By 1995, it was 22nd at $1.969 billion. By 2014, it had almost overtaken Italy as the second-largest clothes exporter in the world by dollar value, at over $25 billion, behind the People’s Republic of China (PRC). And by 2014, it was the clear leader in exports per person, at $155 compared with $136 in the PRC. Growth of the textile and RMG sectors has led the way in manufacturing. This largely explains how the
____________________37 Most commonly, the nontradables or items in the nontradables sectors consist of locally rendered services, including health, education, retail, and consumption.
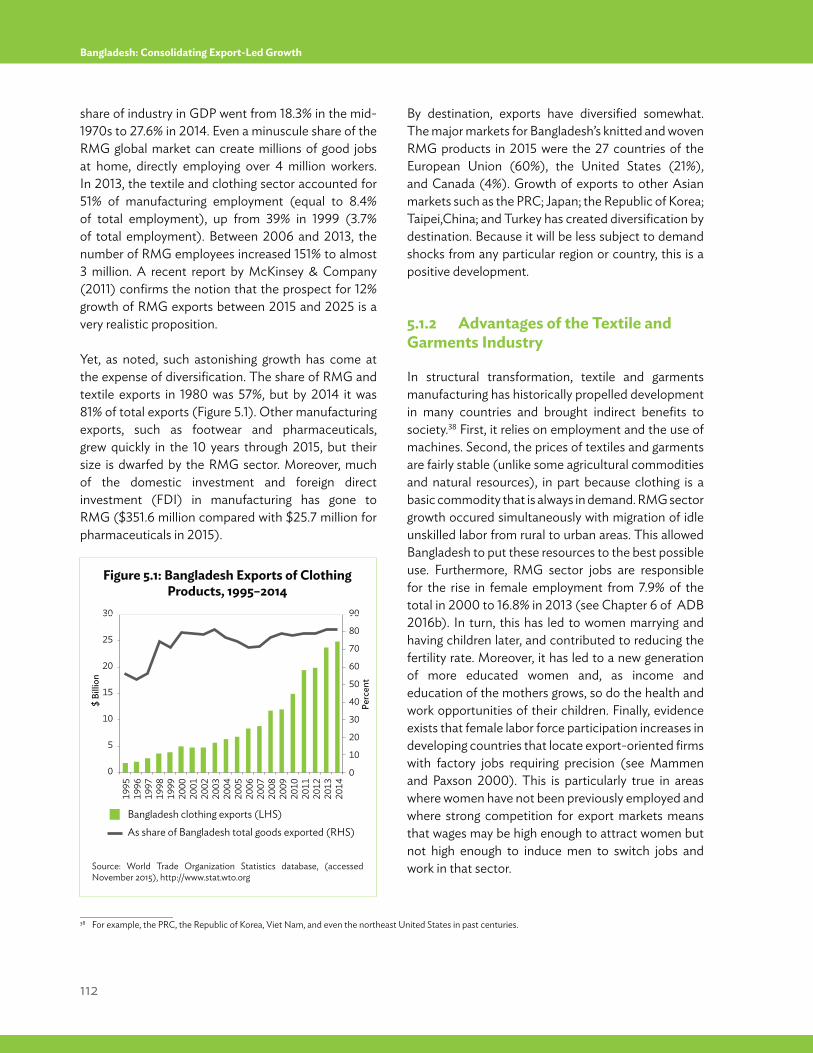
112
Bangladesh: Consolidating Export-Led Growth
share of industry in GDP went from 18.3% in the mid-1970s to 27.6% in 2014. Even a minuscule share of the RMG global market can create millions of good jobs at home, directly employing over 4 million workers. In 2013, the textile and clothing sector accounted for 51% of manufacturing employment (equal to 8.4% of total employment), up from 39% in 1999 (3.7% of total employment). Between 2006 and 2013, the number of RMG employees increased 151% to almost 3 million. A recent report by McKinsey & Company (2011) confirms the notion that the prospect for 12% growth of RMG exports between 2015 and 2025 is a very realistic proposition.
Yet, as noted, such astonishing growth has come at the expense of diversification. The share of RMG and textile exports in 1980 was 57%, but by 2014 it was 81% of total exports (Figure 5.1). Other manufacturing exports, such as footwear and pharmaceuticals, grew quickly in the 10 years through 2015, but their size is dwarfed by the RMG sector. Moreover, much of the domestic investment and foreign direct investment (FDI) in manufacturing has gone to RMG ($351.6 million compared with $25.7 million for pharmaceuticals in 2015).
By destination, exports have diversified somewhat. The major markets for Bangladesh’s knitted and woven RMG products in 2015 were the 27 countries of the European Union (60%), the United States (21%), and Canada (4%). Growth of exports to other Asian markets such as the PRC; Japan; the Republic of Korea; Taipei,China; and Turkey has created diversification by destination. Because it will be less subject to demand shocks from any particular region or country, this is a positive development.
5.1.2 Advantages of the Textile and Garments Industry
In structural transformation, textile and garments manufacturing has historically propelled development in many countries and brought indirect benefits to society.38 First, it relies on employment and the use of machines. Second, the prices of textiles and garments are fairly stable (unlike some agricultural commodities and natural resources), in part because clothing is a basic commodity that is always in demand. RMG sector growth occured simultaneously with migration of idle unskilled labor from rural to urban areas. This allowed Bangladesh to put these resources to the best possible use. Furthermore, RMG sector jobs are responsible for the rise in female employment from 7.9% of the total in 2000 to 16.8% in 2013 (see Chapter 6 of ADB 2016b). In turn, this has led to women marrying and having children later, and contributed to reducing the fertility rate. Moreover, it has led to a new generation of more educated women and, as income and education of the mothers grows, so do the health and work opportunities of their children. Finally, evidence exists that female labor force participation increases in developing countries that locate export-oriented firms with factory jobs requiring precision (see Mammen and Paxson 2000). This is particularly true in areas where women have not been previously employed and where strong competition for export markets means that wages may be high enough to attract women but not high enough to induce men to switch jobs and work in that sector.
Bangladesh clothing exports (LHS)As share of Bangladesh total goods exported (RHS)
0
10
5
15
20
25
30 90
80
70
60
40
50
30
20
10
0
1998
1999
1995
1996
1997
2000
2001
2002
2003
2004
2005
2006
2007
2008
2009
2010
2011
2012
2013
2014
$ Bi
llion
Perc
ent
Figure 5.1: Bangladesh Exports of Clothing Products, 1995–2014
Source: World Trade Organization Statistics database, (accessed November 2015), http://www.stat.wto.org
____________________38 For example, the PRC, the Republic of Korea, Viet Nam, and even the northeast United States in past centuries.
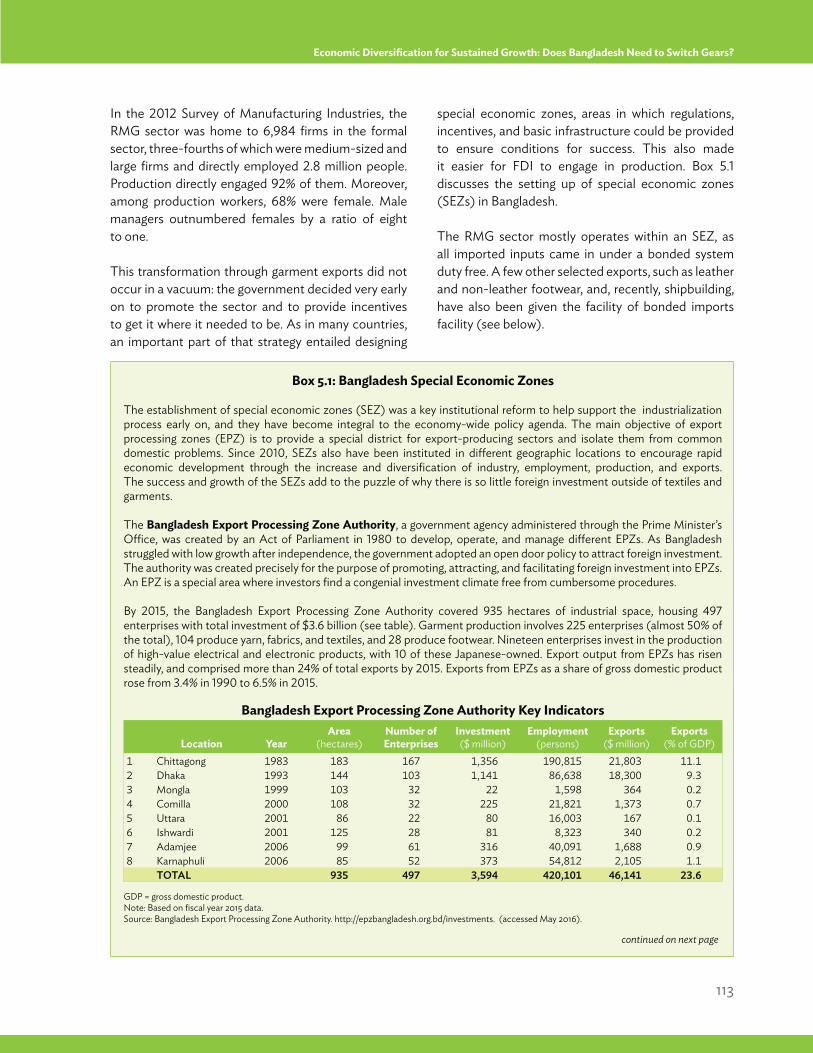
113
Economic Diversification for Sustained Growth: Does Bangladesh Need to Switch Gears?
In the 2012 Survey of Manufacturing Industries, the RMG sector was home to 6,984 firms in the formal sector, three-fourths of which were medium-sized and large firms and directly employed 2.8 million people. Production directly engaged 92% of them. Moreover, among production workers, 68% were female. Male managers outnumbered females by a ratio of eight to one.
This transformation through garment exports did not occur in a vacuum: the government decided very early on to promote the sector and to provide incentives to get it where it needed to be. As in many countries, an important part of that strategy entailed designing
special economic zones, areas in which regulations, incentives, and basic infrastructure could be provided to ensure conditions for success. This also made it easier for FDI to engage in production. Box 5.1 discusses the setting up of special economic zones (SEZs) in Bangladesh.
The RMG sector mostly operates within an SEZ, as all imported inputs came in under a bonded system duty free. A few other selected exports, such as leather and non-leather footwear, and, recently, shipbuilding, have also been given the facility of bonded imports facility (see below).
Box 5.1: Bangladesh Special Economic Zones
The establishment of special economic zones (SEZ) was a key institutional reform to help support the industrialization process early on, and they have become integral to the economy-wide policy agenda. The main objective of export processing zones (EPZ) is to provide a special district for export-producing sectors and isolate them from common domestic problems. Since 2010, SEZs also have been instituted in different geographic locations to encourage rapid economic development through the increase and diversification of industry, employment, production, and exports. The success and growth of the SEZs add to the puzzle of why there is so little foreign investment outside of textiles and garments.
The Bangladesh Export Processing Zone Authority, a government agency administered through the Prime Minister’s Office, was created by an Act of Parliament in 1980 to develop, operate, and manage different EPZs. As Bangladesh struggled with low growth after independence, the government adopted an open door policy to attract foreign investment. The authority was created precisely for the purpose of promoting, attracting, and facilitating foreign investment into EPZs. An EPZ is a special area where investors find a congenial investment climate free from cumbersome procedures.
By 2015, the Bangladesh Export Processing Zone Authority covered 935 hectares of industrial space, housing 497 enterprises with total investment of $3.6 billion (see table). Garment production involves 225 enterprises (almost 50% of the total), 104 produce yarn, fabrics, and textiles, and 28 produce footwear. Nineteen enterprises invest in the production of high-value electrical and electronic products, with 10 of these Japanese-owned. Export output from EPZs has risen steadily, and comprised more than 24% of total exports by 2015. Exports from EPZs as a share of gross domestic product rose from 3.4% in 1990 to 6.5% in 2015.
Bangladesh Export Processing Zone Authority Key Indicators
Location YearArea
(hectares)Number of Enterprises
Investment ($ million)
Employment (persons)
Exports ($ million)
Exports (% of GDP)
1 Chittagong 1983 183 167 1,356 190,815 21,803 11.12 Dhaka 1993 144 103 1,141 86,638 18,300 9.33 Mongla 1999 103 32 22 1,598 364 0.24 Comilla 2000 108 32 225 21,821 1,373 0.75 Uttara 2001 86 22 80 16,003 167 0.16 Ishwardi 2001 125 28 81 8,323 340 0.27 Adamjee 2006 99 61 316 40,091 1,688 0.98 Karnaphuli 2006 85 52 373 54,812 2,105 1.1 TOTAL 935 497 3,594 420,101 46,141 23.6
GDP = gross domestic product.Note: Based on fiscal year 2015 data. Source: Bangladesh Export Processing Zone Authority. http://epzbangladesh.org.bd/investments. (accessed May 2016).
continued on next page
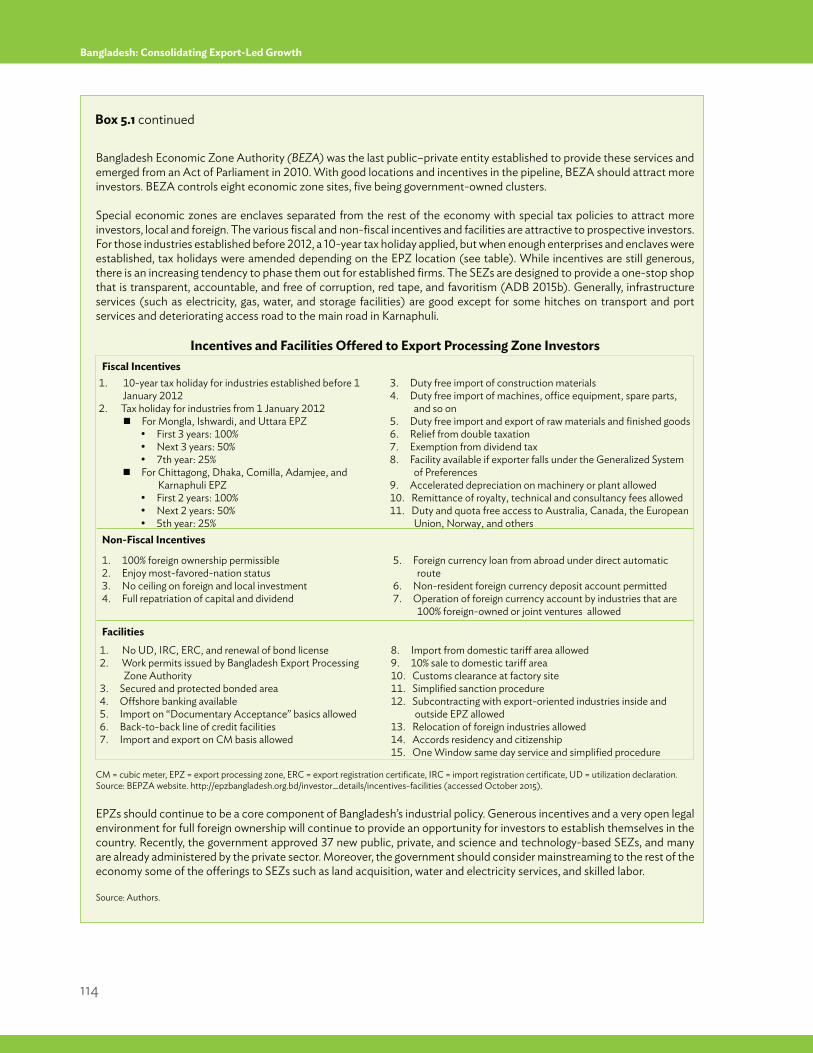
114
Bangladesh: Consolidating Export-Led Growth
Box 5.1 continued
Bangladesh Economic Zone Authority (BEZA) was the last public–private entity established to provide these services and emerged from an Act of Parliament in 2010. With good locations and incentives in the pipeline, BEZA should attract more investors. BEZA controls eight economic zone sites, five being government-owned clusters.
Special economic zones are enclaves separated from the rest of the economy with special tax policies to attract more investors, local and foreign. The various fiscal and non-fiscal incentives and facilities are attractive to prospective investors. For those industries established before 2012, a 10-year tax holiday applied, but when enough enterprises and enclaves were established, tax holidays were amended depending on the EPZ location (see table). While incentives are still generous, there is an increasing tendency to phase them out for established firms. The SEZs are designed to provide a one-stop shop that is transparent, accountable, and free of corruption, red tape, and favoritism (ADB 2015b). Generally, infrastructure services (such as electricity, gas, water, and storage facilities) are good except for some hitches on transport and port services and deteriorating access road to the main road in Karnaphuli.
Incentives and Facilities Offered to Export Processing Zone Investors Fiscal Incentives
1. 10-year tax holiday for industries established before 1 January 2012
2. Tax holiday for industries from 1 January 2012 For Mongla, Ishwardi, and Uttara EPZ
First 3 years: 100% Next 3 years: 50% 7th year: 25%
For Chittagong, Dhaka, Comilla, Adamjee, and Karnaphuli EPZ
First 2 years: 100% Next 2 years: 50% 5th year: 25%
3. Duty free import of construction materials4. Duty free import of machines, office equipment, spare parts,
and so on5. Duty free import and export of raw materials and finished goods6. Relief from double taxation7. Exemption from dividend tax8. Facility available if exporter falls under the Generalized System
of Preferences 9. Accelerated depreciation on machinery or plant allowed10. Remittance of royalty, technical and consultancy fees allowed11. Duty and quota free access to Australia, Canada, the European
Union, Norway, and othersNon-Fiscal Incentives
1. 100% foreign ownership permissible2. Enjoy most-favored-nation status3. No ceiling on foreign and local investment4. Full repatriation of capital and dividend
5. Foreign currency loan from abroad under direct automatic route
6. Non-resident foreign currency deposit account permitted7. Operation of foreign currency account by industries that are
100% foreign-owned or joint ventures allowed
Facilities1. No UD, IRC, ERC, and renewal of bond license2. Work permits issued by Bangladesh Export Processing
Zone Authority3. Secured and protected bonded area4. Offshore banking available5. Import on “Documentary Acceptance” basics allowed6. Back-to-back line of credit facilities7. Import and export on CM basis allowed
8. Import from domestic tariff area allowed9. 10% sale to domestic tariff area10. Customs clearance at factory site11. Simplified sanction procedure12. Subcontracting with export-oriented industries inside and
outside EPZ allowed13. Relocation of foreign industries allowed14. Accords residency and citizenship15. One Window same day service and simplified procedure
CM = cubic meter, EPZ = export processing zone, ERC = export registration certificate, IRC = import registration certificate, UD = utilization declaration. Source: BEPZA website. http://epzbangladesh.org.bd/investor_details/incentives-facilities (accessed October 2015).
EPZs should continue to be a core component of Bangladesh’s industrial policy. Generous incentives and a very open legal environment for full foreign ownership will continue to provide an opportunity for investors to establish themselves in the country. Recently, the government approved 37 new public, private, and science and technology-based SEZs, and many are already administered by the private sector. Moreover, the government should consider mainstreaming to the rest of the economy some of the offerings to SEZs such as land acquisition, water and electricity services, and skilled labor. Source: Authors.
115
Economic Diversification for Sustained Growth: Does Bangladesh Need to Switch Gears?
In addition to SEZs, a series of policies and external factors over the years contributed to the stellar performance of RMG exports.
The Multi-Fiber Arrangement, which allowed Bangladesh to import quota-free until 2005, provided the initial impetus. Faced with quota restrictions, the Republic of Korea firm Daewoo entered into partnership with Desh Garments of Bangladesh to produce garments in Bangladesh using the underused Bangladesh import quota to the United States (US) and Europe. Improved market access to the US and European markets quickly enticed other entrepreneurs, and the Republic of Korea technology was quickly adapted and transferred to other local investors through competitive hiring of managers and trained labor.
The policy of creating a special bonded warehouse system designated RMG as a “100% export-oriented” industry and created a duty-free environment for the sector even though huge tariff and non-tariff barriers affected the rest of the economy. Moreover, effective taxation of earnings from RMG was very low and income from RMG enterprises is exempt from taxes.
To keep the sector free from inefficient tax administration, and yet raise revenue from a highly profitable sector, in 1992, the National Board of Revenue adopted a policy of imposing a one-off tax on export proceeds of 0.3% (called advance income tax or Tax Deducted at Source), which was convenient to collect and administer. Other exports subject to this tax paid a rate of 0.8%. Over the last years, the tax rate on the RMG exporters was slowly increased to 0.8% of export volume in the FY2013 budget, but then temporarily lowered to 0.3% in FY2014 to mitigate the higher costs incurred by the sector due to political disturbances. In June 2015, the rate was raised to 0.6% and equalized with other export sectors—as their rate was lowered from 0.8% to 0.6% (Bhowmikm and Bala 2015).
Other specific conditions also helped foster the sector’s growth. The Ministry of Finance established a system allowing the use of back-to-
back letters of credit by which imported inputs were procured against export orders. This saved the industry substantial working capital costs and foreign exchange and provided RMG exporters with a relative shield against exchange rate fluctuations. Non-RMG exporters, on the other hand, did not benefit from this incentive.
Before determining the source of the competitiveness of RMG compared with other sectors of the Bangladeshi economy, the following section looks in more detail at the structure of the RMG sector and its position in the global clothing industry.
5.1.3 Garment Sector’s Place in the Global Economy and the Fashion Industry
Clothing is more than a necessary good. Far from just a garment for warmth or protection against the elements, clothes can be a form of cultural identity, a signal of income status, or a form of self-expression. Between 1980 and 2014, world trade in clothing grew almost sixfold to $986 billion. In 2012, the global apparel market was valued at $1.7 trillion, and employed about 75 million people. Forecasts indicate the global apparel sector, assuming current trends, will reach $2.11 trillion in nominal terms by 2025, led by the PRC (Figure 5.2).
Short product life cycles, vastly differentiated products, and consumer loyalty through branding and competitive price points are just some of the features of today’s ever-changing market for clothing. The industry has thrived on a liberalized global trading environment that allows parts of the manufacturing process to be outsourced to suppliers outside national borders. Such arrangements eventually propelled the importance of the RMG sector in countries’ exports, including Bangladesh, Brazil, Cambodia, the PRC, India, Indonesia, Madagascar, Sri Lanka, and Viet Nam (Figure 5.3). Moreover, clothing production forms a substantial part of GDP at 35% in Bangladesh and 13% in Cambodia.
Productivity of the RMG sector—based on low fixed costs and labor-intensive manufacturing processes—put Bangladesh on the path of export-oriented industrialization. RMG exporters had access to low-
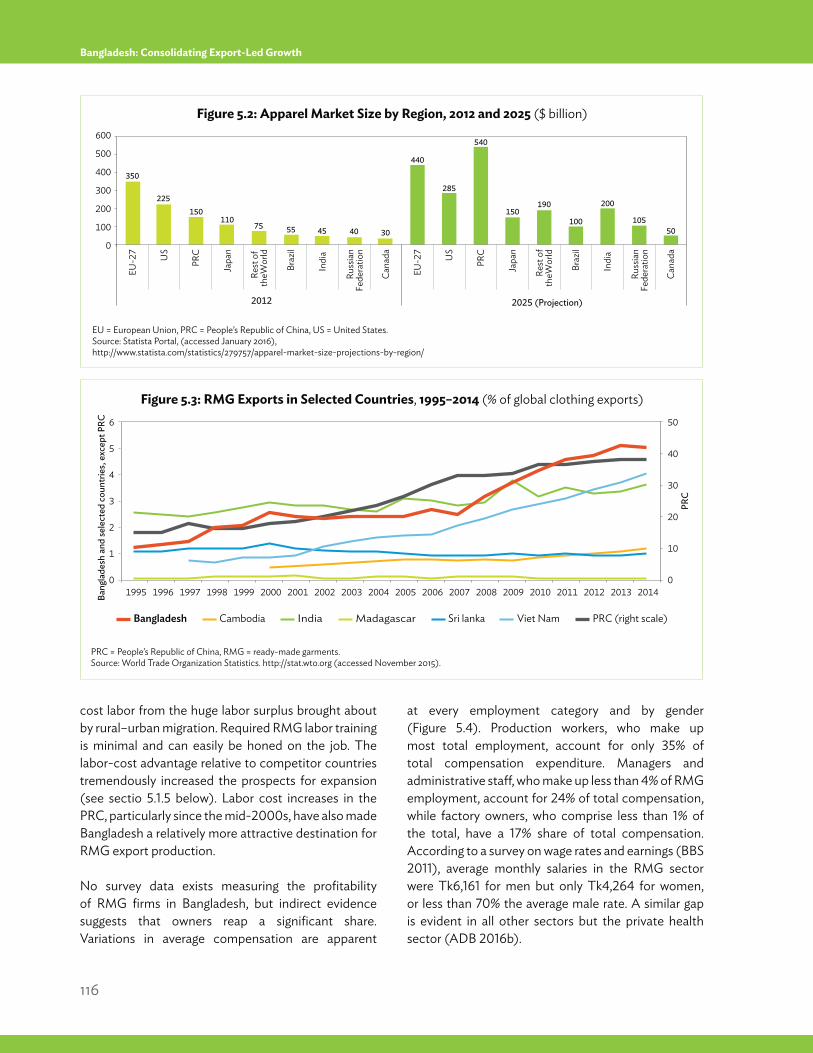
116
Bangladesh: Consolidating Export-Led Growth
cost labor from the huge labor surplus brought about by rural–urban migration. Required RMG labor training is minimal and can easily be honed on the job. The labor-cost advantage relative to competitor countries tremendously increased the prospects for expansion (see sectio 5.1.5 below). Labor cost increases in the PRC, particularly since the mid-2000s, have also made Bangladesh a relatively more attractive destination for RMG export production.
No survey data exists measuring the profitability of RMG firms in Bangladesh, but indirect evidence suggests that owners reap a significant share. Variations in average compensation are apparent
at every employment category and by gender (Figure 5.4). Production workers, who make up most total employment, account for only 35% of total compensation expenditure. Managers and administrative staff, who make up less than 4% of RMG employment, account for 24% of total compensation, while factory owners, who comprise less than 1% of the total, have a 17% share of total compensation. According to a survey on wage rates and earnings (BBS 2011), average monthly salaries in the RMG sector were Tk6,161 for men but only Tk4,264 for women, or less than 70% the average male rate. A similar gap is evident in all other sectors but the private health sector (ADB 2016b).
2012 2025 (Projection)
0
300
200
100
500
400
600EU
-27
US
PRC
Japa
n
Rest
of
theW
orld
Braz
il
Indi
a
Russ
ian
Fede
ratio
n
Cana
da
EU-2
7
US
PRC
Japa
n
Rest
of
theW
orld
Braz
il
Indi
a
Russ
ian
Fede
ratio
n
Cana
da
350
225150
11075 55 45 40 30
440
285
150190
100 10550
200
540
Figure 5.2: Apparel Market Size by Region, 2012 and 2025 ($ billion)
Figure 5.3: RMG Exports in Selected Countries, 1995–2014 (% of global clothing exports)
EU = European Union, PRC = People’s Republic of China, US = United States. Source: Statista Portal, (accessed January 2016), http://www.statista.com/statistics/279757/apparel-market-size-projections-by-region/
PRC = People’s Republic of China, RMG = ready-made garments.Source: World Trade Organization Statistics. http://stat.wto.org (accessed November 2015).
IndiaBangladesh Cambodia
0
6
4
3
2
0
50
40
30
20
101
5
Madagascar Sri lanka Viet Nam PRC (right scale)
20001995Bang
lade
sh a
nd se
lect
ed c
ount
ries,
exc
ept P
RC
PRC
1996 1998 19991997 2001 2002 2003 2004 2005 2006 2007 20092008 2010 2011 2012 2013 2014
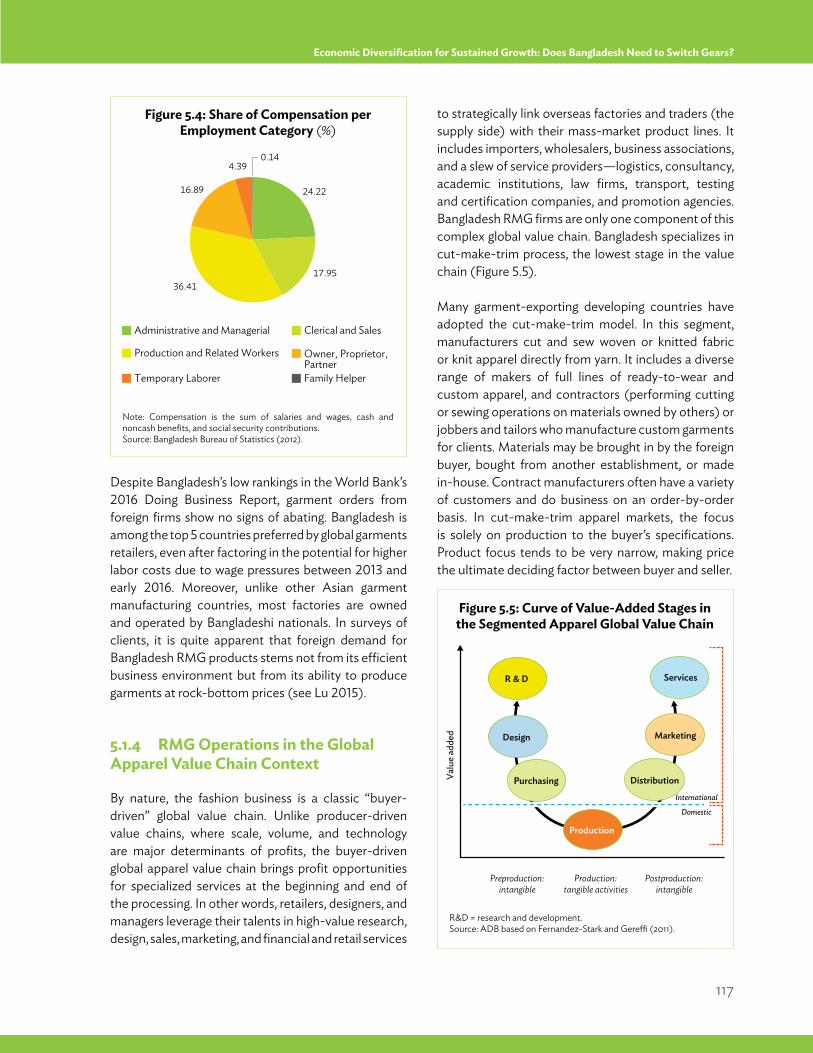
117
Economic Diversification for Sustained Growth: Does Bangladesh Need to Switch Gears?
Despite Bangladesh’s low rankings in the World Bank’s 2016 Doing Business Report, garment orders from foreign firms show no signs of abating. Bangladesh is among the top 5 countries preferred by global garments retailers, even after factoring in the potential for higher labor costs due to wage pressures between 2013 and early 2016. Moreover, unlike other Asian garment manufacturing countries, most factories are owned and operated by Bangladeshi nationals. In surveys of clients, it is quite apparent that foreign demand for Bangladesh RMG products stems not from its efficient business environment but from its ability to produce garments at rock-bottom prices (see Lu 2015).
5.1.4 RMG Operations in the Global Apparel Value Chain Context
By nature, the fashion business is a classic “buyer-driven” global value chain. Unlike producer-driven value chains, where scale, volume, and technology are major determinants of profits, the buyer-driven global apparel value chain brings profit opportunities for specialized services at the beginning and end of the processing. In other words, retailers, designers, and managers leverage their talents in high-value research, design, sales, marketing, and financial and retail services
to strategically link overseas factories and traders (the supply side) with their mass-market product lines. It includes importers, wholesalers, business associations, and a slew of service providers—logistics, consultancy, academic institutions, law firms, transport, testing and certification companies, and promotion agencies. Bangladesh RMG firms are only one component of this complex global value chain. Bangladesh specializes in cut-make-trim process, the lowest stage in the value chain (Figure 5.5).
Many garment-exporting developing countries have adopted the cut-make-trim model. In this segment, manufacturers cut and sew woven or knitted fabric or knit apparel directly from yarn. It includes a diverse range of makers of full lines of ready-to-wear and custom apparel, and contractors (performing cutting or sewing operations on materials owned by others) or jobbers and tailors who manufacture custom garments for clients. Materials may be brought in by the foreign buyer, bought from another establishment, or made in-house. Contract manufacturers often have a variety of customers and do business on an order-by-order basis. In cut-make-trim apparel markets, the focus is solely on production to the buyer’s specifications. Product focus tends to be very narrow, making price the ultimate deciding factor between buyer and seller.
24.22
17.9536.41
16.89
4.390.14
Administrative and Managerial Clerical and Sales
Production and Related Workers Owner, Proprietor,Partner
Temporary Laborer Family Helper
Figure 5.4: Share of Compensation per Employment Category (%)
Figure 5.5: Curve of Value-Added Stages in the Segmented Apparel Global Value Chain
Note: Compensation is the sum of salaries and wages, cash and noncash benefits, and social security contributions.Source: Bangladesh Bureau of Statistics (2012).
R&D = research and development. Source: ADB based on Fernandez-Stark and Gereffi (2011).
Valu
e ad
ded
Preproduction:intangible
Postproduction:intangible
Production:tangible activities
International
Domestic
R & D
Design Marketing
Services
Production
Purchasing Distribution
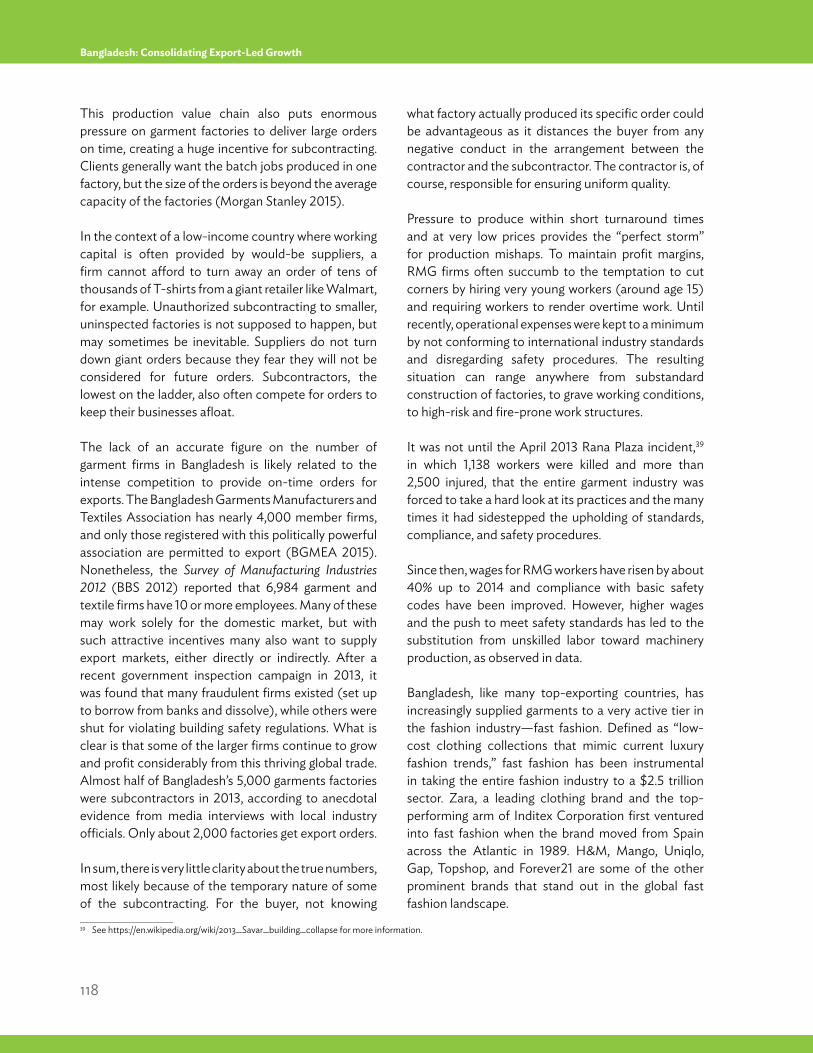
118
Bangladesh: Consolidating Export-Led Growth
This production value chain also puts enormous pressure on garment factories to deliver large orders on time, creating a huge incentive for subcontracting. Clients generally want the batch jobs produced in one factory, but the size of the orders is beyond the average capacity of the factories (Morgan Stanley 2015).
In the context of a low-income country where working capital is often provided by would-be suppliers, a firm cannot afford to turn away an order of tens of thousands of T-shirts from a giant retailer like Walmart, for example. Unauthorized subcontracting to smaller, uninspected factories is not supposed to happen, but may sometimes be inevitable. Suppliers do not turn down giant orders because they fear they will not be considered for future orders. Subcontractors, the lowest on the ladder, also often compete for orders to keep their businesses afloat.
The lack of an accurate figure on the number of garment firms in Bangladesh is likely related to the intense competition to provide on-time orders for exports. The Bangladesh Garments Manufacturers and Textiles Association has nearly 4,000 member firms, and only those registered with this politically powerful association are permitted to export (BGMEA 2015). Nonetheless, the Survey of Manufacturing Industries 2012 (BBS 2012) reported that 6,984 garment and textile firms have 10 or more employees. Many of these may work solely for the domestic market, but with such attractive incentives many also want to supply export markets, either directly or indirectly. After a recent government inspection campaign in 2013, it was found that many fraudulent firms existed (set up to borrow from banks and dissolve), while others were shut for violating building safety regulations. What is clear is that some of the larger firms continue to grow and profit considerably from this thriving global trade. Almost half of Bangladesh’s 5,000 garments factories were subcontractors in 2013, according to anecdotal evidence from media interviews with local industry officials. Only about 2,000 factories get export orders.
In sum, there is very little clarity about the true numbers, most likely because of the temporary nature of some of the subcontracting. For the buyer, not knowing
what factory actually produced its specific order could be advantageous as it distances the buyer from any negative conduct in the arrangement between the contractor and the subcontractor. The contractor is, of course, responsible for ensuring uniform quality.
Pressure to produce within short turnaround times and at very low prices provides the “perfect storm” for production mishaps. To maintain profit margins, RMG firms often succumb to the temptation to cut corners by hiring very young workers (around age 15) and requiring workers to render overtime work. Until recently, operational expenses were kept to a minimum by not conforming to international industry standards and disregarding safety procedures. The resulting situation can range anywhere from substandard construction of factories, to grave working conditions, to high-risk and fire-prone work structures.
It was not until the April 2013 Rana Plaza incident,39 in which 1,138 workers were killed and more than 2,500 injured, that the entire garment industry was forced to take a hard look at its practices and the many times it had sidestepped the upholding of standards, compliance, and safety procedures.
Since then, wages for RMG workers have risen by about 40% up to 2014 and compliance with basic safety codes have been improved. However, higher wages and the push to meet safety standards has led to the substitution from unskilled labor toward machinery production, as observed in data.
Bangladesh, like many top-exporting countries, has increasingly supplied garments to a very active tier in the fashion industry—fast fashion. Defined as “low-cost clothing collections that mimic current luxury fashion trends,” fast fashion has been instrumental in taking the entire fashion industry to a $2.5 trillion sector. Zara, a leading clothing brand and the top-performing arm of Inditex Corporation first ventured into fast fashion when the brand moved from Spain across the Atlantic in 1989. H&M, Mango, Uniqlo, Gap, Topshop, and Forever21 are some of the other prominent brands that stand out in the global fast fashion landscape.
____________________39 See https://en.wikipedia.org/wiki/2013_Savar_building_collapse for more information.
119
Economic Diversification for Sustained Growth: Does Bangladesh Need to Switch Gears?
____________________40 The cost of making a pair of jeans ranges from about $1.30–$1.40 per piece in Bangladesh and $4–$5 in India, where there is generally more design input.
The business model is referred to as “cheap chic” and involves the rapid translation of design trends into clothes that make it to store racks quickly but do not linger. Fast fashion companies thrive on fast cycles: rapid prototyping, small batches combined with large variety, more efficient transportation and delivery, and merchandise that is presented “floor-ready” on hangers with price tags already attached. The idea is to provide consumers with accessible and affordable clothes at convenient prices, marketed as highly wearable, on-trend apparel that makes the impression of being here today but probably gone tomorrow. For retailers, this transformation in buying habits has translated into huge revenues from skyrocketing sales. Between 2008 and 2014, Zara’s revenues rose from $10 billion to $19.7 billion, H&M revenues increased from $10.8 billion to $20.2 billion, and Fast Retailing (Uniqlo) increased its revenues from $6 billion to $16.6 billion. The sales of these three companies together add up to about a third of Bangladesh’s GDP.
Segmented Global Value Chains
Due to the lack of strong links between apparel manufacturers and the higher value processes in the production chain illustrated in Figure 5.5, the fast-fashion value chain is effectively “segmented.” The production of a fast-fashion garment could be described as a global value chain, and the stage of garment manufacture (at the bottom of the curve in Figure 5.5) occurs in Bangladesh. It is denoted as a segmented value chain because of the broken link of accountability once the garment is shipped abroad. The sector’s production process is completely decoupled informally from the fast-fashion production process.
This segmentation also exacerbated the dissociation between the unit cost of production and its retail price, and Bangladesh’s ability to move up the value chain. As long as the big buyers maintain price-setting power, garment makers have no incentive to upgrade facilities or enhance workers’ skills because race-to-the-bottom cost-cutting measures will always take
precedence to guarantee a firm’s survival. Moreover, because of the focus on meeting orders on time, firms have little leeway to become more proactive at anticipating buyers’ needs. Critical activities that could help Bangladesh RMG move beyond the cut-make-trim template, such as investing in research and development and developing local designing and pattern-making capabilities, are not pursued.
RMG workers have limited exposure to technical know-how in the knitwear industry because they have few opportunities for advancement. These basic RMG goods produced in Bangladesh constitute only a limited share of the entire global value chain, unlike those produced in the PRC (Figure 5.6).
After accounting for the imported content of basic RMG goods, Bangladesh ends up netting only a small share of the value added: a pair of jeans that costs $1.50 to make could sell for more than $20.40 Bangladesh is still confined mostly to manufacturing of T-shirts and other basic garments because the manufacturing base of its RMG sector is not diversified enough to allow for development of higher-valued garments. More importantly, the basic RMG products have very low price points ex-factory, whether the final product is sold for $6 at a Walmart shop in New Jersey or £30 (about $44) at Barney and Taylor in London.
The sustainability of the fast-fashion industry will need to be examined in the context of demand and the type of goods or services that Bangladesh is producing. Staying at the low end of the value chain and having an advantage in that niche is not the best recipe for developing middle-income status. The good news is that the comparative advantage revealed by the success of RMG is the capacity to overcome logistical and infrastructure deficiencies to produce clothing to specifications and on time; and those are the types of capabilities that can ensure quality in this sector or create advantages in other areas of production.
Major data and definitional limitations exist for measuring unit labor costs of RMG manufacturing. The main one is the difficulty of relating the value
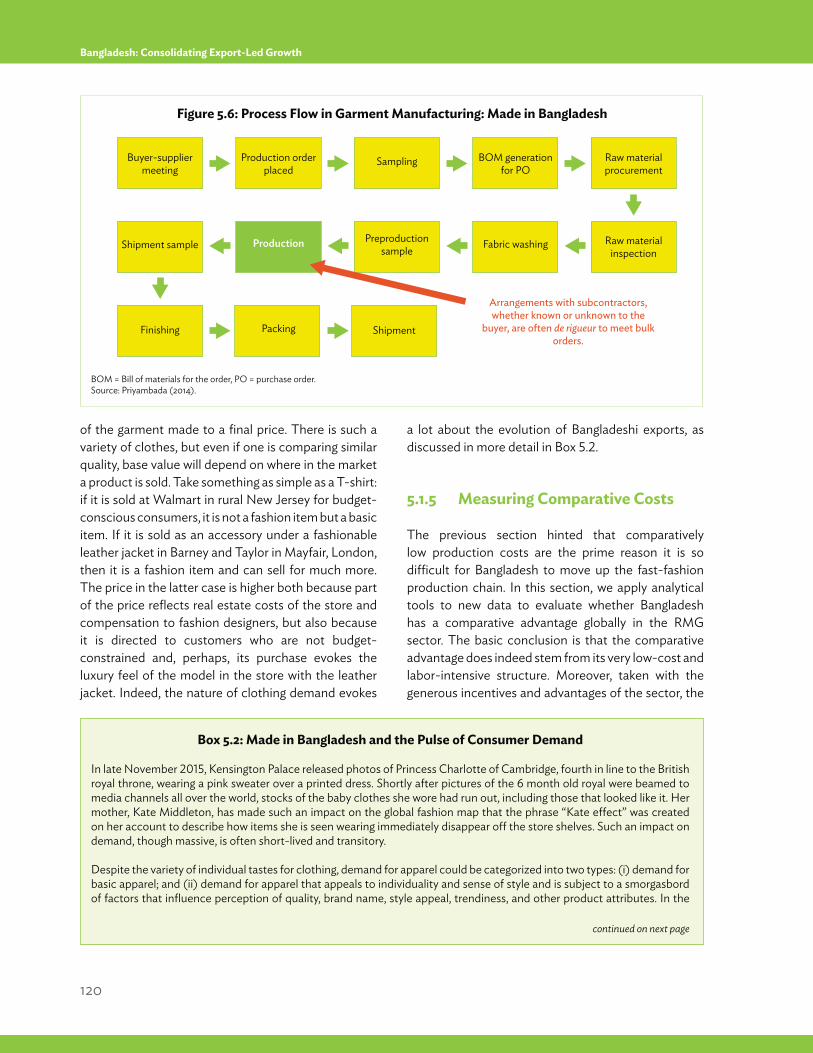
120
Bangladesh: Consolidating Export-Led Growth
of the garment made to a final price. There is such a variety of clothes, but even if one is comparing similar quality, base value will depend on where in the market a product is sold. Take something as simple as a T-shirt: if it is sold at Walmart in rural New Jersey for budget-conscious consumers, it is not a fashion item but a basic item. If it is sold as an accessory under a fashionable leather jacket in Barney and Taylor in Mayfair, London, then it is a fashion item and can sell for much more. The price in the latter case is higher both because part of the price reflects real estate costs of the store and compensation to fashion designers, but also because it is directed to customers who are not budget-constrained and, perhaps, its purchase evokes the luxury feel of the model in the store with the leather jacket. Indeed, the nature of clothing demand evokes
a lot about the evolution of Bangladeshi exports, as discussed in more detail in Box 5.2.
5.1.5 Measuring Comparative Costs
The previous section hinted that comparatively low production costs are the prime reason it is so difficult for Bangladesh to move up the fast-fashion production chain. In this section, we apply analytical tools to new data to evaluate whether Bangladesh has a comparative advantage globally in the RMG sector. The basic conclusion is that the comparative advantage does indeed stem from its very low-cost and labor-intensive structure. Moreover, taken with the generous incentives and advantages of the sector, the
Buyer-supplier meeting
Production order placed
Sampling BOM generation for PO
Raw material procurement
Shipment sample Production Preproduction sample
Finishing Packing Shipment
Fabric washing Raw material inspection
Arrangements with subcontractors, whether known or unknown to the
buyer, are often de rigueur to meet bulk orders.
Figure 5.6: Process Flow in Garment Manufacturing: Made in Bangladesh
BOM = Bill of materials for the order, PO = purchase order.Source: Priyambada (2014).
Box 5.2: Made in Bangladesh and the Pulse of Consumer Demand
In late November 2015, Kensington Palace released photos of Princess Charlotte of Cambridge, fourth in line to the British royal throne, wearing a pink sweater over a printed dress. Shortly after pictures of the 6 month old royal were beamed to media channels all over the world, stocks of the baby clothes she wore had run out, including those that looked like it. Her mother, Kate Middleton, has made such an impact on the global fashion map that the phrase “Kate effect” was created on her account to describe how items she is seen wearing immediately disappear off the store shelves. Such an impact on demand, though massive, is often short-lived and transitory.
Despite the variety of individual tastes for clothing, demand for apparel could be categorized into two types: (i) demand for basic apparel; and (ii) demand for apparel that appeals to individuality and sense of style and is subject to a smorgasbord of factors that influence perception of quality, brand name, style appeal, trendiness, and other product attributes. In the
continued on next page
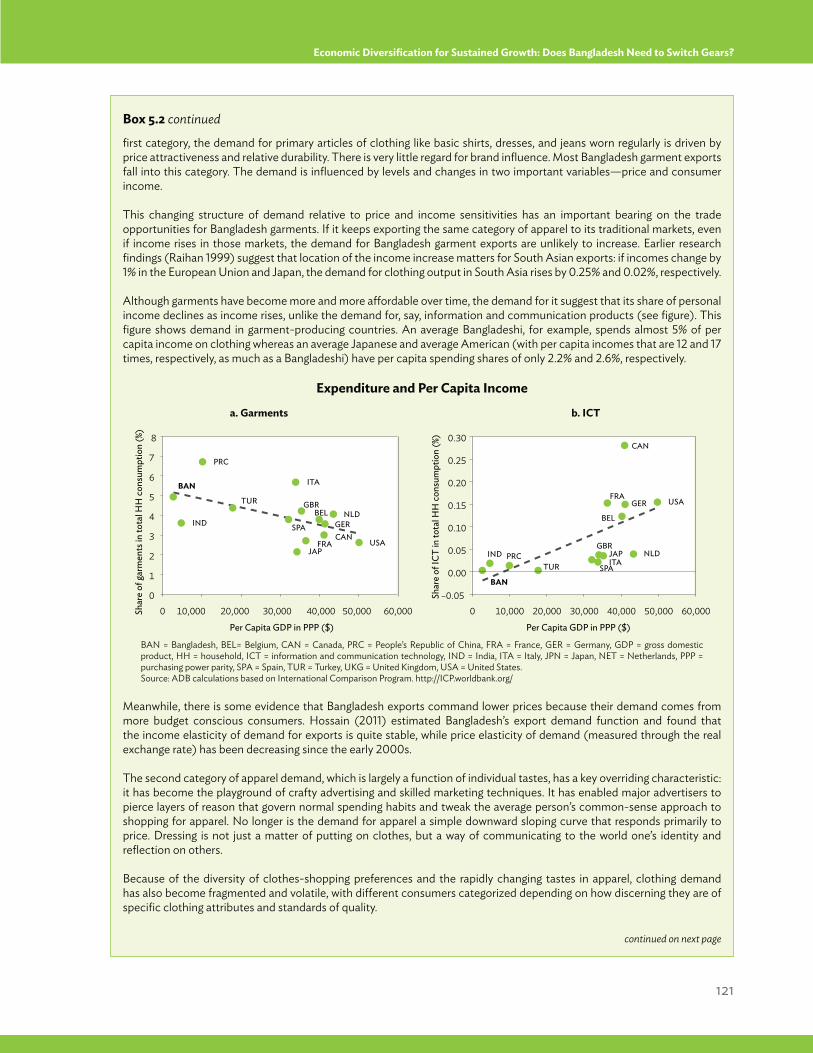
121
Economic Diversification for Sustained Growth: Does Bangladesh Need to Switch Gears?
continued on next page
Box 5.2 continued
first category, the demand for primary articles of clothing like basic shirts, dresses, and jeans worn regularly is driven by price attractiveness and relative durability. There is very little regard for brand influence. Most Bangladesh garment exports fall into this category. The demand is influenced by levels and changes in two important variables—price and consumer income.
This changing structure of demand relative to price and income sensitivities has an important bearing on the trade opportunities for Bangladesh garments. If it keeps exporting the same category of apparel to its traditional markets, even if income rises in those markets, the demand for Bangladesh garment exports are unlikely to increase. Earlier research findings (Raihan 1999) suggest that location of the income increase matters for South Asian exports: if incomes change by 1% in the European Union and Japan, the demand for clothing output in South Asia rises by 0.25% and 0.02%, respectively.
Although garments have become more and more affordable over time, the demand for it suggest that its share of personal income declines as income rises, unlike the demand for, say, information and communication products (see figure). This figure shows demand in garment-producing countries. An average Bangladeshi, for example, spends almost 5% of per capita income on clothing whereas an average Japanese and average American (with per capita incomes that are 12 and 17 times, respectively, as much as a Bangladeshi) have per capita spending shares of only 2.2% and 2.6%, respectively.
Expenditure and Per Capita Income
BAN = Bangladesh, BEL= Belgium, CAN = Canada, PRC = People’s Republic of China, FRA = France, GER = Germany, GDP = gross domestic product, HH = household, ICT = information and communication technology, IND = India, ITA = Italy, JPN = Japan, NET = Netherlands, PPP = purchasing power parity, SPA = Spain, TUR = Turkey, UKG = United Kingdom, USA = United States.Source: ADB calculations based on International Comparison Program. http://ICP.worldbank.org/
Meanwhile, there is some evidence that Bangladesh exports command lower prices because their demand comes from more budget conscious consumers. Hossain (2011) estimated Bangladesh’s export demand function and found that the income elasticity of demand for exports is quite stable, while price elasticity of demand (measured through the real exchange rate) has been decreasing since the early 2000s.
The second category of apparel demand, which is largely a function of individual tastes, has a key overriding characteristic: it has become the playground of crafty advertising and skilled marketing techniques. It has enabled major advertisers to pierce layers of reason that govern normal spending habits and tweak the average person’s common-sense approach to shopping for apparel. No longer is the demand for apparel a simple downward sloping curve that responds primarily to price. Dressing is not just a matter of putting on clothes, but a way of communicating to the world one’s identity and reflection on others.
Because of the diversity of clothes-shopping preferences and the rapidly changing tastes in apparel, clothing demand has also become fragmented and volatile, with different consumers categorized depending on how discerning they are of specific clothing attributes and standards of quality.
a. Garments b. ICT
BAN
PRC
IND BEL
CAN FRA
GER
ITA
JAP
NLD SPA
TUR GBR
USA
BAN
PRC IND
BEL
CAN
FRA GER
ITA JAP NLD
SPA TUR
GBR
USA
0
1
2
3
4
5
6
7
8
Per Capita GDP in PPP ($)
Shar
e of
gar
men
ts in
tota
l HH
con
sum
ptio
n (%
)
0 10,000 20,000 30,000 40,000 50,000 60,000–0.05
0.00
0.05
0.10
0.15
0.20
0.25
0.30
Per Capita GDP in PPP ($)
Shar
e of
ICT
in to
tal H
H c
onsu
mpt
ion
(%)
0 10,000 20,000 30,000 40,000 50,000 60,000
122
Bangladesh: Consolidating Export-Led Growth
implication is that the RMG sector is highly profitable compared with others in Bangladesh.
In seminal research, Bela Balassa (1965) introduced the concept of “revealed comparative advantage” (RCA). Countries have a certain pattern of trade where they export some items and import others. Balassa argued that under the assumption that these trade patterns indicate intercountry differences in relative costs and other nonprice factors, the observed trade pattern reveals comparative advantages of the trading countries. Thus, there is no need to search for cost data and instead comparative advantage can be measured based on actual trade flows. Still, one can use export prices as an indicator of competitiveness under the assumption that these prices are given by the marketplace and not by some monopoly power of a particular seller or buyer.
RMG does not give Bangladesh any monopoly power to dictate prices, because its share in the global market
for such exports is barely 5%. In practical terms, even if exporters had the scope to negotiate prices with buyers, they would be unlikely to extract any significant rent. Bangladesh’s export prices are therefore reflective of production costs plus some amount of “normal profit.” Also, since production costs in Bangladesh differ from those in other countries that compete for market share in the destination markets, prices in the destination markets reflect these cost differentials, giving lower-cost suppliers the competitive advantage over higher-cost suppliers.
Eight comparator countries were selected for the RMG competitor analysis. Bangladeshi exports compete with countries at all stages of development, on products that range from mostly RMG (basic garments rather than high-value garments) and some non-RMG products such as jute and jute goods, frozen food, footwear, and leather products. However, sources in the RMG industry suggest that Bangladesh exports compete primarily with those from Cambodia,
Box 5.2 continued
Can Bangladesh appeal to higher-income consumers?
To benefit sustainably from its garment export performance, Bangladesh needs to be able to shift its production capabilities to cater to the higher value-added category of clothing demand. One possibility is to shift gears toward the domestic market, by beginning lines of fashion that can appeal to the growing and vast Bangladeshi middle class. With exposure to media, they can hit the styles for younger people that also appeal to their sense as individuals.
More importantly, this would be a way of developing the types of skills that will allow them to move to the “retail” end of the fashion value chain. This is an important way to test these skills: the company Watsons has done that with appliances, producing refrigerators with features that cater specifically to typical Bangladeshi households, but increasingly using reverse engineering skills to move to other products such as air conditioners, televisions, and motorcycles.
The fragmented nature of this individuality-driven apparel category, in turn, makes for a good environment to use branding to drive demand. Particularly for income-insensitive but socially conscious consumers, branding could also be a vehicle to push issues that go beyond the product itself, for example, ensuring that clothes and leather goods are produced in ways that are not harmful to the environment and the sourcing of materials for its production is transparent.
For clothing from Bangladesh, it is a bit of a stretch to imagine consumers getting all worked up about the pollution generated by a $6 shirt. Likewise, consumers who find cheap bargains irresistible may not want to be reminded about the labor and compensation practices in low-income countries where their shirts and jeans are made. The “Made-in-Bangladesh” campaign has tried to bridge that image gap somewhat, by creating some doubt, juxtaposing a pretty Bangladeshi model that looks like a factory worker posing tight jeans.
Suppliers have tried to address this problem of demand volatility by engaging consumers directly. For example, at the point of purchase, sales personnel at Zara ask clients what they like most of a particular type or style of clothing. This information is fed into a central database so in-house designers can immediately use it to design a fresh batch of clothes.
Source: Authors.
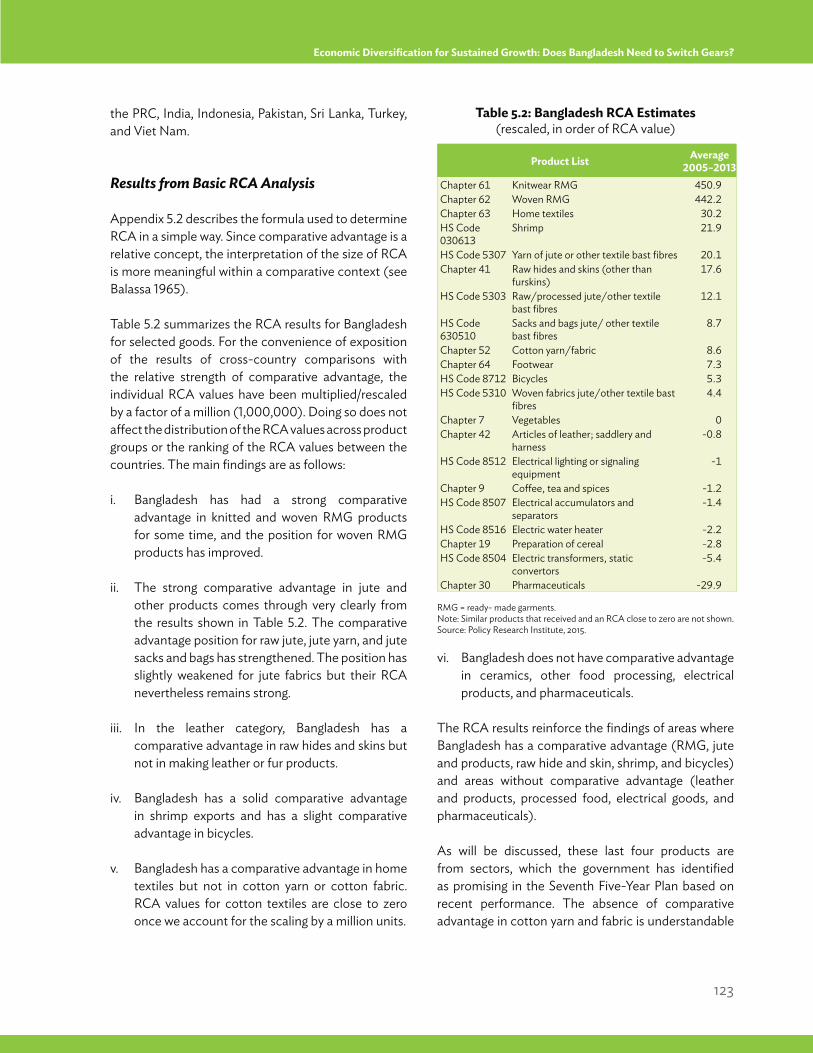
123
Economic Diversification for Sustained Growth: Does Bangladesh Need to Switch Gears?
the PRC, India, Indonesia, Pakistan, Sri Lanka, Turkey, and Viet Nam.
Results from Basic RCA Analysis
Appendix 5.2 describes the formula used to determine RCA in a simple way. Since comparative advantage is a relative concept, the interpretation of the size of RCA is more meaningful within a comparative context (see Balassa 1965).
Table 5.2 summarizes the RCA results for Bangladesh for selected goods. For the convenience of exposition of the results of cross-country comparisons with the relative strength of comparative advantage, the individual RCA values have been multiplied/rescaled by a factor of a million (1,000,000). Doing so does not affect the distribution of the RCA values across product groups or the ranking of the RCA values between the countries. The main findings are as follows:
i. Bangladesh has had a strong comparative advantage in knitted and woven RMG products for some time, and the position for woven RMG products has improved.
ii. The strong comparative advantage in jute and other products comes through very clearly from the results shown in Table 5.2. The comparative advantage position for raw jute, jute yarn, and jute sacks and bags has strengthened. The position has slightly weakened for jute fabrics but their RCA nevertheless remains strong.
iii. In the leather category, Bangladesh has a comparative advantage in raw hides and skins but not in making leather or fur products.
iv. Bangladesh has a solid comparative advantage in shrimp exports and has a slight comparative advantage in bicycles.
v. Bangladesh has a comparative advantage in home textiles but not in cotton yarn or cotton fabric. RCA values for cotton textiles are close to zero once we account for the scaling by a million units.
vi. Bangladesh does not have comparative advantage in ceramics, other food processing, electrical products, and pharmaceuticals.
The RCA results reinforce the findings of areas where Bangladesh has a comparative advantage (RMG, jute and products, raw hide and skin, shrimp, and bicycles) and areas without comparative advantage (leather and products, processed food, electrical goods, and pharmaceuticals).
As will be discussed, these last four products are from sectors, which the government has identified as promising in the Seventh Five-Year Plan based on recent performance. The absence of comparative advantage in cotton yarn and fabric is understandable
RMG = ready- made garments.Note: Similar products that received and an RCA close to zero are not shown.Source: Policy Research Institute, 2015.
Table 5.2: Bangladesh RCA Estimates (rescaled, in order of RCA value)
Product List Average 2005–2013
Chapter 61 Knitwear RMG 450.9Chapter 62 Woven RMG 442.2Chapter 63 Home textiles 30.2HS Code 030613
Shrimp 21.9
HS Code 5307 Yarn of jute or other textile bast fibres 20.1Chapter 41 Raw hides and skins (other than
furskins)17.6
HS Code 5303 Raw/processed jute/other textile bast fibres
12.1
HS Code 630510
Sacks and bags jute/ other textile bast fibres
8.7
Chapter 52 Cotton yarn/fabric 8.6Chapter 64 Footwear 7.3HS Code 8712 Bicycles 5.3HS Code 5310 Woven fabrics jute/other textile bast
fibres4.4
Chapter 7 Vegetables 0Chapter 42 Articles of leather; saddlery and
harness-0.8
HS Code 8512 Electrical lighting or signaling equipment
-1
Chapter 9 Coffee, tea and spices -1.2HS Code 8507 Electrical accumulators and
separators-1.4
HS Code 8516 Electric water heater -2.2Chapter 19 Preparation of cereal -2.8HS Code 8504 Electric transformers, static
convertors-5.4
Chapter 30 Pharmaceuticals -29.9
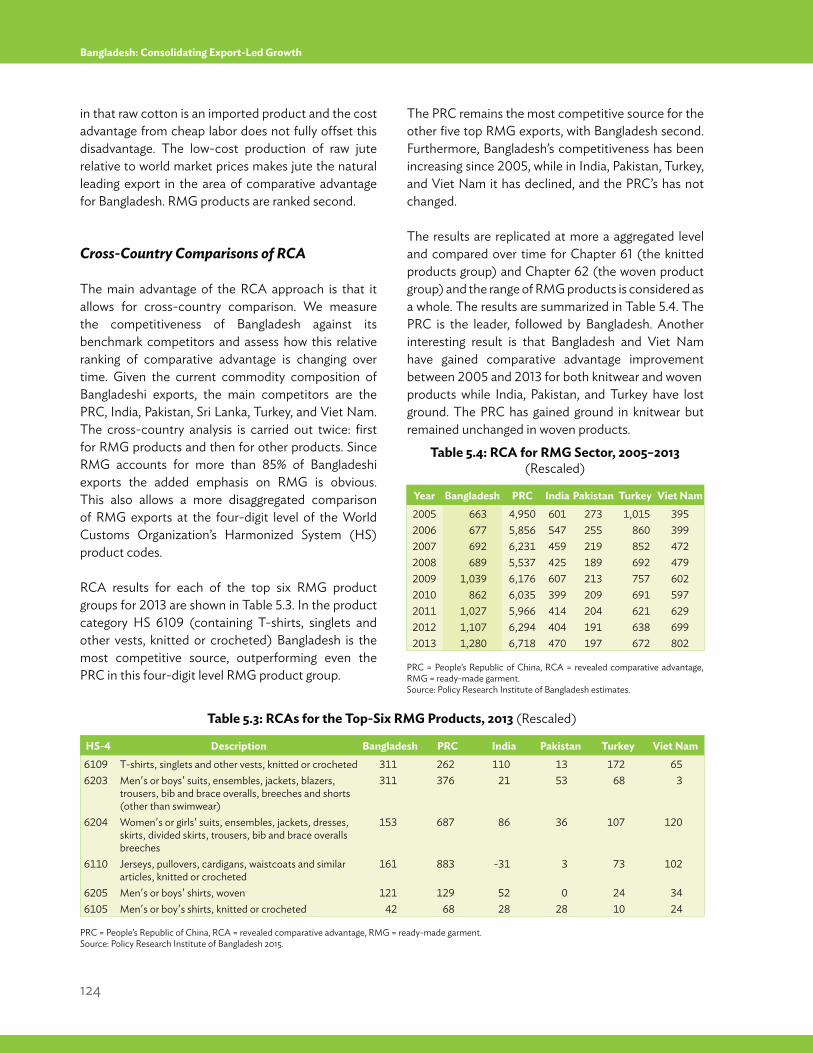
124
Bangladesh: Consolidating Export-Led Growth
in that raw cotton is an imported product and the cost advantage from cheap labor does not fully offset this disadvantage. The low-cost production of raw jute relative to world market prices makes jute the natural leading export in the area of comparative advantage for Bangladesh. RMG products are ranked second.
Cross-Country Comparisons of RCA
The main advantage of the RCA approach is that it allows for cross-country comparison. We measure the competitiveness of Bangladesh against its benchmark competitors and assess how this relative ranking of comparative advantage is changing over time. Given the current commodity composition of Bangladeshi exports, the main competitors are the PRC, India, Pakistan, Sri Lanka, Turkey, and Viet Nam. The cross-country analysis is carried out twice: first for RMG products and then for other products. Since RMG accounts for more than 85% of Bangladeshi exports the added emphasis on RMG is obvious. This also allows a more disaggregated comparison of RMG exports at the four-digit level of the World Customs Organization’s Harmonized System (HS) product codes.
RCA results for each of the top six RMG product groups for 2013 are shown in Table 5.3. In the product category HS 6109 (containing T-shirts, singlets and other vests, knitted or crocheted) Bangladesh is the most competitive source, outperforming even the PRC in this four-digit level RMG product group.
The PRC remains the most competitive source for the other five top RMG exports, with Bangladesh second. Furthermore, Bangladesh’s competitiveness has been increasing since 2005, while in India, Pakistan, Turkey, and Viet Nam it has declined, and the PRC’s has not changed.
The results are replicated at more a aggregated level and compared over time for Chapter 61 (the knitted products group) and Chapter 62 (the woven product group) and the range of RMG products is considered as a whole. The results are summarized in Table 5.4. The PRC is the leader, followed by Bangladesh. Another interesting result is that Bangladesh and Viet Nam have gained comparative advantage improvement between 2005 and 2013 for both knitwear and wovenproducts while India, Pakistan, and Turkey have lost ground. The PRC has gained ground in knitwear but remained unchanged in woven products.
Table 5.3: RCAs for the Top-Six RMG Products, 2013 (Rescaled)
PRC = People’s Republic of China, RCA = revealed comparative advantage, RMG = ready-made garment.Source: Policy Research Institute of Bangladesh 2015.
HS-4 Description Bangladesh PRC India Pakistan Turkey Viet Nam6109 T-shirts, singlets and other vests, knitted or crocheted 311 262 110 13 172 656203 Men's or boys' suits, ensembles, jackets, blazers,
trousers, bib and brace overalls, breeches and shorts (other than swimwear)
311 376 21 53 68 3
6204 Women's or girls' suits, ensembles, jackets, dresses, skirts, divided skirts, trousers, bib and brace overalls breeches
153 687 86 36 107 120
6110 Jerseys, pullovers, cardigans, waistcoats and similar articles, knitted or crocheted
161 883 -31 3 73 102
6205 Men's or boys' shirts, woven 121 129 52 0 24 346105 Men's or boy's shirts, knitted or crocheted 42 68 28 28 10 24
Year Bangladesh PRC India Pakistan Turkey Viet Nam2005 663 4,950 601 273 1,015 3952006 677 5,856 547 255 860 3992007 692 6,231 459 219 852 4722008 689 5,537 425 189 692 4792009 1,039 6,176 607 213 757 6022010 862 6,035 399 209 691 5972011 1,027 5,966 414 204 621 6292012 1,107 6,294 404 191 638 6992013 1,280 6,718 470 197 672 802
Table 5.4: RCA for RMG Sector, 2005–2013 (Rescaled)
PRC = People’s Republic of China, RCA = revealed comparative advantage, RMG = ready-made garment.Source: Policy Research Institute of Bangladesh estimates.
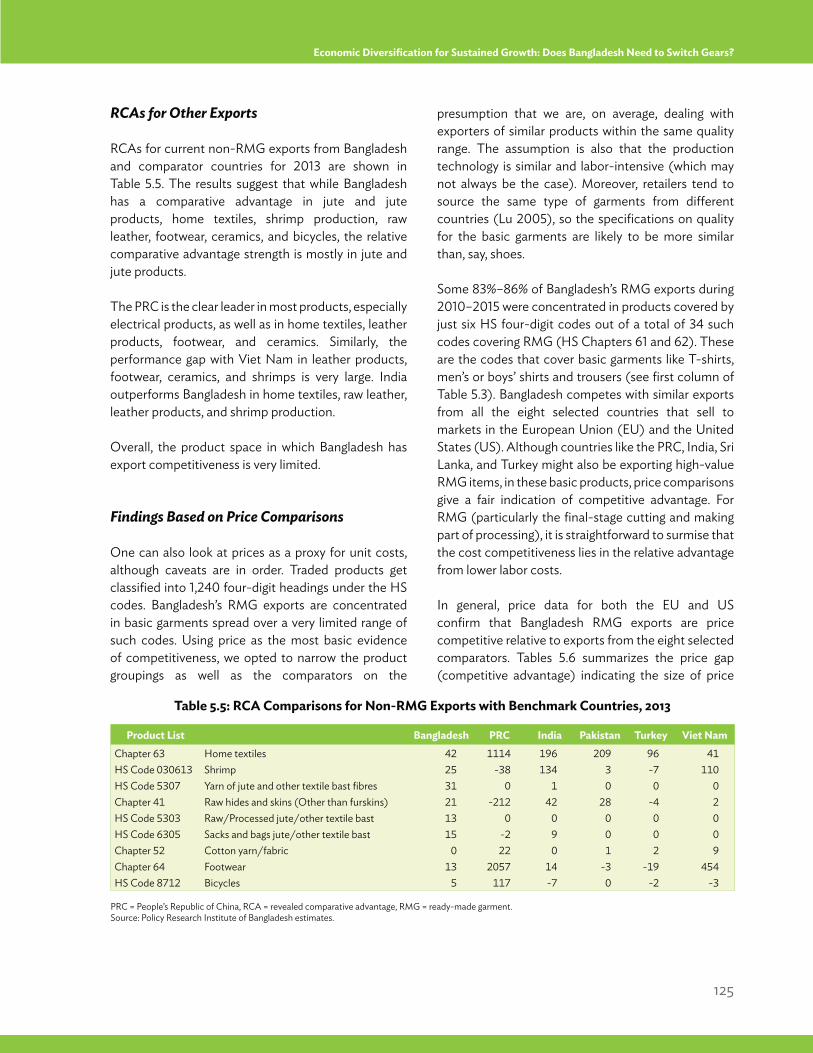
125
Economic Diversification for Sustained Growth: Does Bangladesh Need to Switch Gears?
RCAs for Other Exports
RCAs for current non-RMG exports from Bangladesh and comparator countries for 2013 are shown in Table 5.5. The results suggest that while Bangladesh has a comparative advantage in jute and jute products, home textiles, shrimp production, raw leather, footwear, ceramics, and bicycles, the relative comparative advantage strength is mostly in jute and jute products.
The PRC is the clear leader in most products, especially electrical products, as well as in home textiles, leather products, footwear, and ceramics. Similarly, the performance gap with Viet Nam in leather products, footwear, ceramics, and shrimps is very large. India outperforms Bangladesh in home textiles, raw leather, leather products, and shrimp production.
Overall, the product space in which Bangladesh has export competitiveness is very limited.
Findings Based on Price Comparisons
One can also look at prices as a proxy for unit costs, although caveats are in order. Traded products get classified into 1,240 four-digit headings under the HS codes. Bangladesh’s RMG exports are concentrated in basic garments spread over a very limited range of such codes. Using price as the most basic evidence of competitiveness, we opted to narrow the product groupings as well as the comparators on the
presumption that we are, on average, dealing with exporters of similar products within the same quality range. The assumption is also that the production technology is similar and labor-intensive (which may not always be the case). Moreover, retailers tend to source the same type of garments from different countries (Lu 2005), so the specifications on quality for the basic garments are likely to be more similar than, say, shoes. Some 83%–86% of Bangladesh’s RMG exports during 2010–2015 were concentrated in products covered by just six HS four-digit codes out of a total of 34 such codes covering RMG (HS Chapters 61 and 62). These are the codes that cover basic garments like T-shirts, men’s or boys’ shirts and trousers (see first column of Table 5.3). Bangladesh competes with similar exports from all the eight selected countries that sell to markets in the European Union (EU) and the United States (US). Although countries like the PRC, India, Sri Lanka, and Turkey might also be exporting high-value RMG items, in these basic products, price comparisons give a fair indication of competitive advantage. For RMG (particularly the final-stage cutting and making part of processing), it is straightforward to surmise that the cost competitiveness lies in the relative advantage from lower labor costs.
In general, price data for both the EU and US confirm that Bangladesh RMG exports are price competitive relative to exports from the eight selected comparators. Tables 5.6 summarizes the price gap (competitive advantage) indicating the size of price
Table 5.5: RCA Comparisons for Non-RMG Exports with Benchmark Countries, 2013
PRC = People’s Republic of China, RCA = revealed comparative advantage, RMG = ready-made garment.Source: Policy Research Institute of Bangladesh estimates.
Product List Bangladesh PRC India Pakistan Turkey Viet NamChapter 63 Home textiles 42 1114 196 209 96 41HS Code 030613 Shrimp 25 -38 134 3 -7 110HS Code 5307 Yarn of jute and other textile bast fibres 31 0 1 0 0 0Chapter 41 Raw hides and skins (Other than furskins) 21 -212 42 28 -4 2HS Code 5303 Raw/Processed jute/other textile bast 13 0 0 0 0 0HS Code 6305 Sacks and bags jute/other textile bast 15 -2 9 0 0 0Chapter 52 Cotton yarn/fabric 0 22 0 1 2 9Chapter 64 Footwear 13 2057 14 -3 -19 454HS Code 8712 Bicycles 5 117 -7 0 -2 -3
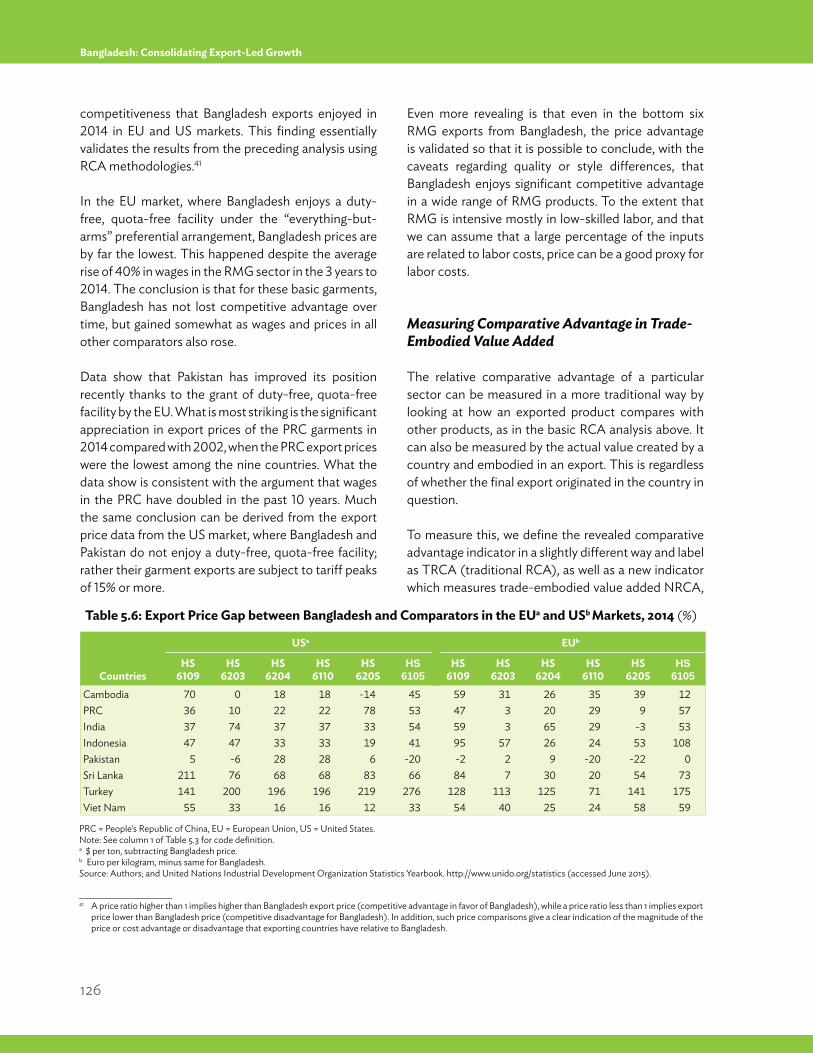
126
Bangladesh: Consolidating Export-Led Growth
Table 5.6: Export Price Gap between Bangladesh and Comparators in the EUa and USb Markets, 2014 (%)
Countries
USa EUb
HS 6109
HS 6203
HS 6204
HS 6110
HS 6205
HS 6105
HS 6109
HS 6203
HS 6204
HS 6110
HS 6205
HS 6105
Cambodia 70 0 18 18 -14 45 59 31 26 35 39 12PRC 36 10 22 22 78 53 47 3 20 29 9 57India 37 74 37 37 33 54 59 3 65 29 -3 53Indonesia 47 47 33 33 19 41 95 57 26 24 53 108Pakistan 5 -6 28 28 6 -20 -2 2 9 -20 -22 0Sri Lanka 211 76 68 68 83 66 84 7 30 20 54 73Turkey 141 200 196 196 219 276 128 113 125 71 141 175Viet Nam 55 33 16 16 12 33 54 40 25 24 58 59
competitiveness that Bangladesh exports enjoyed in 2014 in EU and US markets. This finding essentially validates the results from the preceding analysis using RCA methodologies.41
In the EU market, where Bangladesh enjoys a duty-free, quota-free facility under the “everything-but-arms” preferential arrangement, Bangladesh prices are by far the lowest. This happened despite the average rise of 40% in wages in the RMG sector in the 3 years to 2014. The conclusion is that for these basic garments, Bangladesh has not lost competitive advantage over time, but gained somewhat as wages and prices in all other comparators also rose.
Data show that Pakistan has improved its position recently thanks to the grant of duty-free, quota-free facility by the EU. What is most striking is the significant appreciation in export prices of the PRC garments in 2014 compared with 2002, when the PRC export prices were the lowest among the nine countries. What the data show is consistent with the argument that wages in the PRC have doubled in the past 10 years. Much the same conclusion can be derived from the export price data from the US market, where Bangladesh and Pakistan do not enjoy a duty-free, quota-free facility; rather their garment exports are subject to tariff peaks of 15% or more.
Even more revealing is that even in the bottom six RMG exports from Bangladesh, the price advantage is validated so that it is possible to conclude, with the caveats regarding quality or style differences, that Bangladesh enjoys significant competitive advantage in a wide range of RMG products. To the extent that RMG is intensive mostly in low-skilled labor, and that we can assume that a large percentage of the inputs are related to labor costs, price can be a good proxy for labor costs.
Measuring Comparative Advantage in Trade-Embodied Value Added
The relative comparative advantage of a particular sector can be measured in a more traditional way by looking at how an exported product compares with other products, as in the basic RCA analysis above. It can also be measured by the actual value created by a country and embodied in an export. This is regardless of whether the final export originated in the country in question.
To measure this, we define the revealed comparative advantage indicator in a slightly different way and label as TRCA (traditional RCA), as well as a new indicator which measures trade-embodied value added NRCA,
____________________41 A price ratio higher than 1 implies higher than Bangladesh export price (competitive advantage in favor of Bangladesh), while a price ratio less than 1 implies export
price lower than Bangladesh price (competitive disadvantage for Bangladesh). In addition, such price comparisons give a clear indication of the magnitude of the price or cost advantage or disadvantage that exporting countries have relative to Bangladesh.
PRC = People’s Republic of China, EU = European Union, US = United States. Note: See column 1 of Table 5.3 for code definition.a $ per ton, subtracting Bangladesh price.b Euro per kilogram, minus same for Bangladesh.Source: Authors; and United Nations Industrial Development Organization Statistics Yearbook. http://www.unido.org/statistics (accessed June 2015).
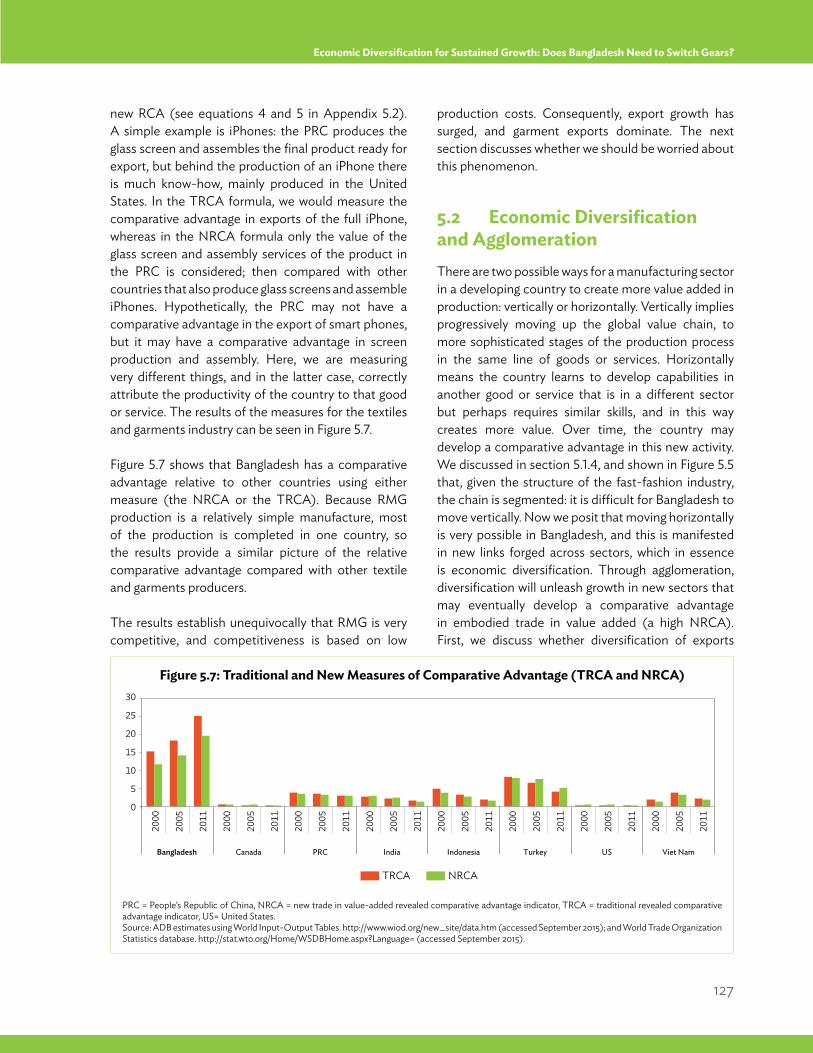
127
Economic Diversification for Sustained Growth: Does Bangladesh Need to Switch Gears?
new RCA (see equations 4 and 5 in Appendix 5.2). A simple example is iPhones: the PRC produces the glass screen and assembles the final product ready for export, but behind the production of an iPhone there is much know-how, mainly produced in the United States. In the TRCA formula, we would measure the comparative advantage in exports of the full iPhone, whereas in the NRCA formula only the value of the glass screen and assembly services of the product in the PRC is considered; then compared with other countries that also produce glass screens and assemble iPhones. Hypothetically, the PRC may not have a comparative advantage in the export of smart phones, but it may have a comparative advantage in screen production and assembly. Here, we are measuring very different things, and in the latter case, correctly attribute the productivity of the country to that good or service. The results of the measures for the textiles and garments industry can be seen in Figure 5.7.
Figure 5.7 shows that Bangladesh has a comparative advantage relative to other countries using either measure (the NRCA or the TRCA). Because RMG production is a relatively simple manufacture, most of the production is completed in one country, so the results provide a similar picture of the relative comparative advantage compared with other textile and garments producers.
The results establish unequivocally that RMG is very competitive, and competitiveness is based on low
production costs. Consequently, export growth has surged, and garment exports dominate. The next section discusses whether we should be worried about this phenomenon.
5.2 Economic Diversification and AgglomerationThere are two possible ways for a manufacturing sector in a developing country to create more value added in production: vertically or horizontally. Vertically implies progressively moving up the global value chain, to more sophisticated stages of the production process in the same line of goods or services. Horizontally means the country learns to develop capabilities in another good or service that is in a different sector but perhaps requires similar skills, and in this way creates more value. Over time, the country may develop a comparative advantage in this new activity. We discussed in section 5.1.4, and shown in Figure 5.5 that, given the structure of the fast-fashion industry, the chain is segmented: it is difficult for Bangladesh to move vertically. Now we posit that moving horizontally is very possible in Bangladesh, and this is manifested in new links forged across sectors, which in essence is economic diversification. Through agglomeration, diversification will unleash growth in new sectors that may eventually develop a comparative advantage in embodied trade in value added (a high NRCA). First, we discuss whether diversification of exports
Bangladesh Canada PRC Indonesia Turkey US Viet NamIndia
0
15
10
5
25
20
30
2000
2005
2011
2000
2005
2011
2000
2005
2011
2000
2005
2011
2000
2005
2011
2000
2005
2011
2000
2005
2011
2000
2005
2011
TRCA NRCA
Figure 5.7: Traditional and New Measures of Comparative Advantage (TRCA and NRCA)
PRC = People’s Republic of China, NRCA = new trade in value-added revealed comparative advantage indicator, TRCA = traditional revealed comparative advantage indicator, US= United States.Source: ADB estimates using World Input-Output Tables. http://www.wiod.org/new_site/data.htm (accessed September 2015); and World Trade Organization Statistics database. http://stat.wto.org/Home/WSDBHome.aspx?Language= (accessed September 2015).
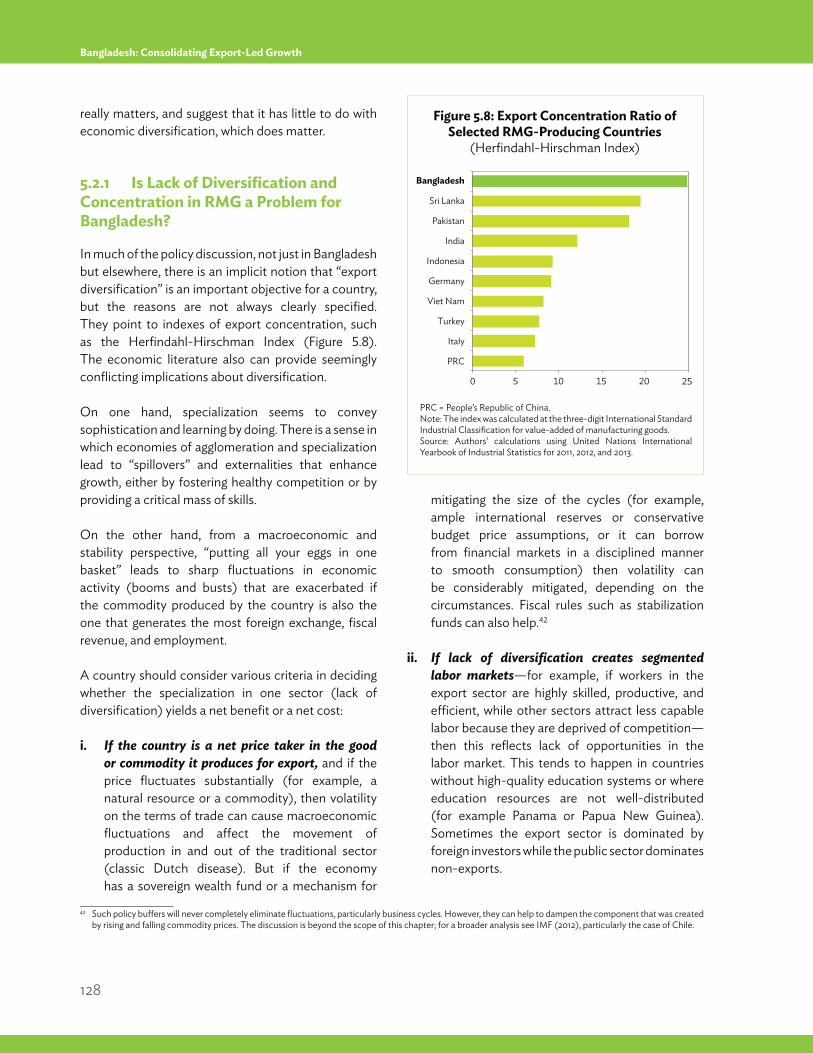
128
Bangladesh: Consolidating Export-Led Growth
really matters, and suggest that it has little to do with economic diversification, which does matter.
5.2.1 Is Lack of Diversification and Concentration in RMG a Problem for Bangladesh?
In much of the policy discussion, not just in Bangladesh but elsewhere, there is an implicit notion that “export diversification” is an important objective for a country, but the reasons are not always clearly specified. They point to indexes of export concentration, such as the Herfindahl-Hirschman Index (Figure 5.8). The economic literature also can provide seemingly conflicting implications about diversification.
On one hand, specialization seems to convey sophistication and learning by doing. There is a sense in which economies of agglomeration and specialization lead to “spillovers” and externalities that enhance growth, either by fostering healthy competition or by providing a critical mass of skills.
On the other hand, from a macroeconomic and stability perspective, “putting all your eggs in one basket” leads to sharp fluctuations in economic activity (booms and busts) that are exacerbated if the commodity produced by the country is also the one that generates the most foreign exchange, fiscal revenue, and employment.
A country should consider various criteria in deciding whether the specialization in one sector (lack of diversification) yields a net benefit or a net cost:
i. If the country is a net price taker in the good or commodity it produces for export, and if the price fluctuates substantially (for example, a natural resource or a commodity), then volatility on the terms of trade can cause macroeconomic fluctuations and affect the movement of production in and out of the traditional sector (classic Dutch disease). But if the economy has a sovereign wealth fund or a mechanism for
mitigating the size of the cycles (for example, ample international reserves or conservative budget price assumptions, or it can borrow from financial markets in a disciplined manner to smooth consumption) then volatility can be considerably mitigated, depending on the circumstances. Fiscal rules such as stabilization funds can also help.42
ii. If lack of diversification creates segmented labor markets—for example, if workers in the export sector are highly skilled, productive, and efficient, while other sectors attract less capable labor because they are deprived of competition—then this reflects lack of opportunities in the labor market. This tends to happen in countries without high-quality education systems or where education resources are not well-distributed (for example Panama or Papua New Guinea). Sometimes the export sector is dominated by foreign investors while the public sector dominates non-exports.
____________________42 Such policy buffers will never completely eliminate fluctuations, particularly business cycles. However, they can help to dampen the component that was created
by rising and falling commodity prices. The discussion is beyond the scope of this chapter; for a broader analysis see IMF (2012), particularly the case of Chile.
0 5 10 15 20 25
Germany
Viet Nam
Turkey
Italy
PRC
India
Pakistan
Indonesia
Sri Lanka
Bangladesh
Figure 5.8: Export Concentration Ratio of Selected RMG-Producing Countries
(Herfindahl-Hirschman Index)
PRC = People’s Republic of China.Note: The index was calculated at the three-digit International Standard Industrial Classification for value-added of manufacturing goods.Source: Authors’ calculations using United Nations International Yearbook of Industrial Statistics for 2011, 2012, and 2013.
129
Economic Diversification for Sustained Growth: Does Bangladesh Need to Switch Gears?
iii. If the economy’s consumer market is small and possibly remote (for example, some Pacific island nations), then diversification may not be a choice because the small domestic market does not provide possibilities for specialization and economies of scale.43 However, a large economy that produces one or two exports can still diversify. This is because new sectors can create a critical mass of knowledge and learning, supported by thriving and growing demand within the domestic market. This does not always happen, but it is perfectly possible for an economy to have a diversified production base for domestic consumption and just a few exports. It is also possible for these few exports to create important demand linkages with business and the services sector, and to generate employment. Lack of diversification in the export market is then not a problem.
iv. If lack of diversification has led to preferential policies through the concentration of economic power and special interests in that particular sector—for example, because they receive special exemptions that are not necessarily given to other sectors—then this can stifle competition between this particular sector and other potential export sectors. Some firms in the privileged sector may acquire monopoly power, which discourages innovation, and have the incentive to engage in rent-seeking behavior to protect their exemptions and privileges.
For Bangladesh, RMG exports pass the test of the first three criteria above. These exports have not created the type of macroeconomic fluctuations typical of some natural resource-dependent economies. Quite the contrary, clothing has relatively stable demand and has led the country to external current account surpluses and allowed for a very manageable external debt. As discussed in section 2.5.2, credit arrangements with RMG suppliers mean there is minimal foreign exchange risk, and in any case reserves have been high.
Second, because the RMG sector hires mainly low-skilled workers and ownership of factories for the most part is domestic, workers in RMG are not necessarily more skilled than workers in other sectors. Third, Bangladesh has a young and growing consumer market and a large population so no “diseconomies-of-scale” argument arises from only concentrating in one export sector. As will be discussed next, some evidence suggests that sectors such as repair services of transport equipment that cater mostly to the domestic market are becoming important. The fourth point above is considered in section 5.5 in more detail: the RMG sector has received some preferences, but since 2013 or so have other so-called thrust sectors.
Diversifying away from RMG exports is not a panacea from a conceptual point of view; unless, of course, the new sectors are more “sophisticated” than RMG. But there is no reason to believe at face value that greater sophistication and value added cannot be created in the garment sector. After all, manufacturing growth in many East Asian economies has come through their insertion into global production chains and the acquisition of greater skills within the chain, and this strategy has produced high rates of economic growth.
In the following analysis, we part from the premise that export concentration in itself is not a problem for sustained development and structural transformation, as long as the four conditions above are satisfied and as long as there are no negative secondary effects in the domestic economy. If the “star” sector can help pull other sectors along, let it be so.
5.2.2 Exports Don’t Explain Everything
Emphasis in economic literature on the virtues of exporting comes from evidence suggesting that higher exports are a manifestation of production sophistication and competitiveness. First, export diversification is considered the culmination of a number of factors (Hausmann and Hidalgo 2011). One
____________________43 A small economy is defined as a country with fewer than 1.5 million inhabitants.
130
Bangladesh: Consolidating Export-Led Growth
can equate observed sophistication of exports across product space as a sign of innovation and complexity. Felipe and Kumar (2012) equate the diversity and sophistication of products manufactured by a specific country with its per capita GDP,44 with the implication that the greater the variety of products exported and the closer they are to the structure of a rich country’s product space, the more it signals that a country’s development is going in the right direction.
The literature suggests that Bangladesh can create networks for its exports with foreign producers and engage in “learning by doing” to absorb new technologies. This can propel higher growth, because it embodies the notion of economies of agglomeration. Also, the right conditions and a critical mass of people working together can produce a better product and innovate (in the broad sense of the word). The idea is that if clusters of firms that create productive knowledge can be established, then through spillover effects individual firms and their industry in turn can grow (Aghion and Howitt 1992, Romer 1986).
However, the tendency is to use trade data, rather than domestic production structures, to make inferences about a country’s productivity, sophistication, and even structural transformation. This stems from the difficulty of gathering evidence on the role of domestic production structures, which overwhelmingly are services. Moreover, if exporting is the culmination of a firm or sector’s increasing competitiveness in the domestic economy, policy makers ideally need to discover the features and characteristics of the production and employment structure before that country can begin to ramp up exports successfully.
For many reasons, inferences using trade data do not necessarily provide a good picture of the links within an economy. This is mostly related to the difficulties of measuring productivity in sectors of the domestic economy such as the following:
Most of the evidence comes from very detailed trade data, which generally measures only trade in goods. However, services are not only becoming
an increasingly important part of international trade, but various “support” or knowledge services for industries may not be directly traded yet they make up an important part of the value of a good or service traded. Data on this is very scant, even less so data that bears cross-country comparison, and little detail exists on the “value” linkages of different goods or services.
In many developing countries, notably Bangladesh, a large portion of the economy is informal, and many services go undetected by business registries, tax authorities (perhaps because they have no tax liability), or statistical agencies. This is particularly true in economies where most of the transactions are cash-based. Consequently, a Bangladeshi operation of three information technology people who design web-based software used by a company overseas has added value to the operations of that firm, but their income may not be captured as a service in the Bangladesh national accounts.
The treatment of machinery and transport equipment is different in developing countries; this is because their low-cost labor allows for the repair and continued operation of machines that in developed economies would have outlived their operational life. National accounts data generally do not directly capture those savings.
Learning by doing and specialization is something more readily observable in clusters of advanced economies. Yet similar innovation may be occurring in the cities of developing countries but the value added is not recorded. Consider the “reverse innovation” of a wheelchair in India (Winter and Govondarajan 2015). Engineers reengineered an expensive wheelchair to make it suitable for India’s bumpy roads and removed some of the “bells and whistles” that Americans need but people in India may find unnecessary given available domestic or family help. With this, they could reduce the wheelchair’s price. If valued at the selling price in India, that machine would
____________________44 They find that the complexity of a product is a function of the capabilities it requires, while the complexity of a country is given by the number of locally available
capabilities.
131
Economic Diversification for Sustained Growth: Does Bangladesh Need to Switch Gears?
have shown a relatively lower value added than in the United States, yet the cost-savings were an innovation for the local market.
The degree of diversification is by nature specifically related to the use of a country as a unit of measurement for the analysis. In some ways, the economics literature in general is implicitly not accounting for the size of markets when comparing countries: one expects the PRC to be more diversified than Luxembourg, as it is many times larger. Yet towns the size of Luxembourg within the PRC may not be very diversified.
Finally, at the level of 35 sectors, a country may not seem very specialized, but within a particular sector sophistication, talent, and knowledge spillovers may be enormous (for example, the Malaysian petroleum services sector).
5.3 Linking Goods and Services
In this section, we use domestic production data to say something about economic diversification. This allows us to get a much richer view of the role of services as not only an “output” from production in some cases, but as crucial supporting “inputs” to production. The simplest example is the transportation services required to take a manufactured good to market.
The framework we use can illustrate how services are a set of supporting industries that can strengthen links across the economy and contribute to economic diversification and eventual growth in new sectors. As services sectors become more important globally, countries can engage in increasingly complex business-related services without having to export them, particularly in an era of full global communication.
The analysis relates to the presence or absence of supplier industries and related industries that are internationally competitive (Porter 1990). Porter relates this dimension to spillover benefits that go beyond the boundaries of an industry, to explain
the tendency of successful firms within a country to form clusters of related and supporting industries. Grant (1991) asserted that the presence within a nation of suppliers and related industries that are internationally competitive provides benefits such as innovation, upgrading, information flow, and shared technology development that create advantages for downstream industries. Porter (1998) also emphasizes the importance of forming clusters or agglomeration to deliver cost-effective inputs and highlights the importance of these supporting industries to innovate by working closely with the end user. Many of these supporting industries could be nontradable services.
Regardless of its stellar growth, RMG could diversify through the “horizontal” movement of capabilities across similar sectors. Section 5.2.1 has already established that export concentration in RMG by itself should not be harmful for sustained growth of the economy. The question is whether it has contributed to diversification, by spurring development of other sectors. If so, we should observe the following phenomena.
First, one should see how its growth has led to new skills and the creation of parallel activities either through forward links (reverse engineering of knitting machines, for example) or the “pull” factor of infrastructure services and business services. In other words, it stimulated the creation and growth of related sectors. Second, we should see that the profits of this sector were reinvested in other new activities, including enhancing the training and skills of employees. Finally, infrastructure investment and improvement of ports would come hand-in-hand with RMG growth and investment, which could support new sectors. Other “thrust” sectors have been considered promising by the government in the last few years, but have not taken off. This could be solely due to challenges specific to that sector, such as quality and labor issues, but may in part also be due to the concentration of resources and capital in RMG, the “Star” sector. We examine the evolution of output links, and capital and labor use in section 5.3.2.
132
Bangladesh: Consolidating Export-Led Growth
5.3.1 Input-Output Linkages and Agglomeration
As mentioned earlier, economic diversification is the process whereby special links across sectors—particularly across manufacturing and services sectors—eventually lead to the creation and development of new economic activities. Once new activities are created, in the process of structural transformation some will move to export markets and may eventually develop a comparative advantage. This framework thus also allows us to identify the new sectors created and how competitive they are internationally—whether as a direct export, or as an indirect support service to other direct exports. The support service should have a high score on the new revealed comparative advantage indicator (NRCA). Moreover, as countries move up the income ladder, this should manifest itself in a proliferation of activities related to business and professional services, and some of these may be eventually exported.
It is also important to try to understand how the interactions of the different sectors have evolved in countries that are more developed and to consider strategies that could bring about similar linkages and dynamics in Bangladesh. In particular, by looking at successful cases now, their patterns of production and the structures and relationships that changed to enable the country to progress. We extend the analysis to the PRC and Viet Nam, which have been extremely successful in diversifying their production structures. Also, India (which has some historical similarities to Bangladesh as well as a thriving garment sector) and the US (as a prototype of an advanced economy).
The sector-specific quantitative details encompassing the whole economy provided in the input-output tables enable us to analyze its state and evolution and draw inferences about directional economic policies. Visually, the dot plot matrixes for Bangladesh in Figure A5.3.1 indicate that during the decade under study (2000–2011), the country’s comparative advantage in the RMG sector increased significantly, while other sectors lagged behind in export markets,
with the economy continuing to lose its comparative edge in key sectors such as agriculture and leather products and footwear production. Indeed, there are progressively fewer links between RMG and other productive sectors.
We develop a so-called index of agglomeration to capture what the figures in Appendix 5.3 shows visually: an index used to measure the intensity and participation of forward and backward inter-sectorial linkages. The “forward” index measures the degree to which goods sectors (agriculture, manufacturing, and natural resources) “pull” services sectors though demand links. The “backward” index of agglomeration measures the degree to which business, infrastructure, and community services are able to expand linkages to other sectors. The overall index measures not only the strength of linkages across all sectors, but also the number of linkages and degree of participation. The setup and derivation of the framework for the five countries is explained in detail in Appendix 5.3.
Table 5.7 summarizes the results. The higher the index of agglomeration (for any specific economic block, which comprises a set of sectors with similar production characteristics),45 the more integrated and linked sectors are, and the higher the number of sectors that “take part” in those linkages. The values are an average for 2000, 2006, and 2011. The first part shows the “backward” agglomeration index for agriculture, natural resources, and manufacturing. The second shows the forward agglomeration for the three blocks of services. The final part shows the total agglomeration (both forward and backward), applying equation 8 in Appendix 5.3.
The results show Viet Nam scores highest on the agglomeration index, indicating a well-linked economy with many and high multiplier levels. Not only is it highly diversified, but also those links have fostered growth of similar sectors. There are also spillovers from infrastructure and manufacturing. The PRC’s linkages from the natural resources (oil and metals sectors) and manufacturing come out strong. The agglomeration index also shows a very important
____________________44 There are 35 sectors, divided into six “economic blocks”: (i) agriculture, (ii) natural resources, (iii) manufacturing, (iv) infrastructure services (which includes
construction), (v) business support services, and (vi) government and community services. Construction is folded in with infrastructure services. The last column of Table 5.7 indicates the number of sectors in each economic block.
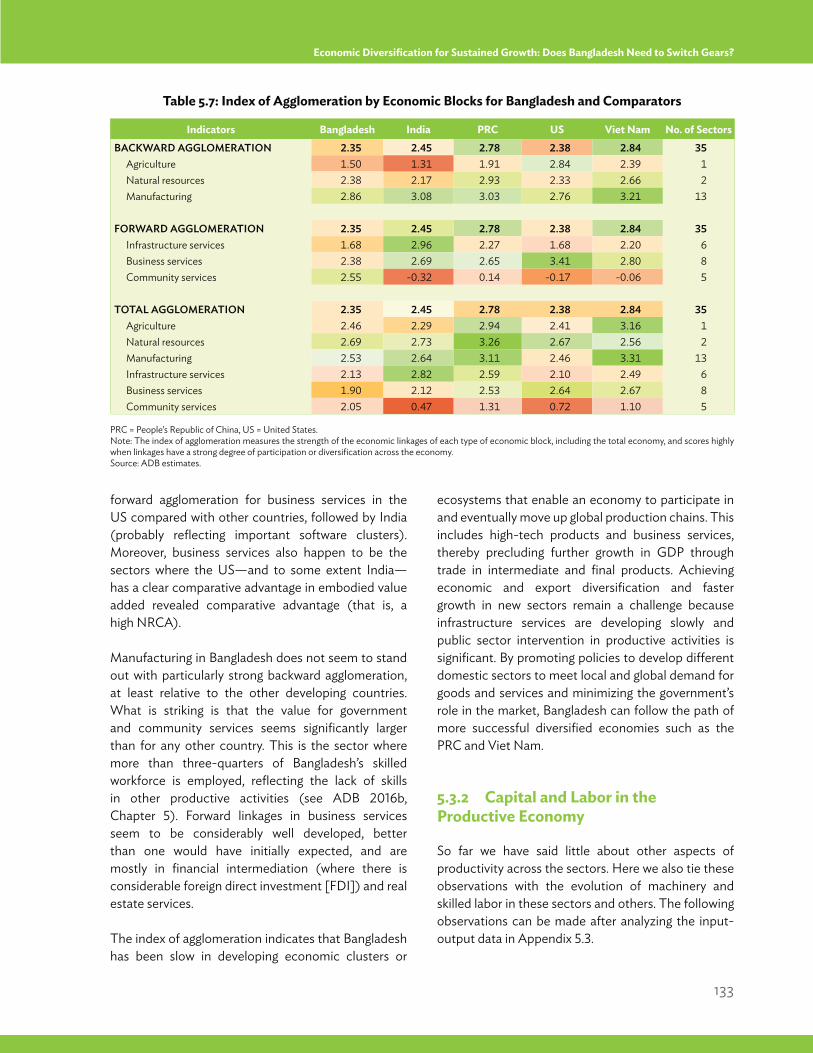
133
Economic Diversification for Sustained Growth: Does Bangladesh Need to Switch Gears?
forward agglomeration for business services in the US compared with other countries, followed by India (probably reflecting important software clusters). Moreover, business services also happen to be the sectors where the US—and to some extent India—has a clear comparative advantage in embodied value added revealed comparative advantage (that is, a high NRCA).
Manufacturing in Bangladesh does not seem to stand out with particularly strong backward agglomeration, at least relative to the other developing countries. What is striking is that the value for government and community services seems significantly larger than for any other country. This is the sector where more than three-quarters of Bangladesh’s skilled workforce is employed, reflecting the lack of skills in other productive activities (see ADB 2016b, Chapter 5). Forward linkages in business services seem to be considerably well developed, better than one would have initially expected, and are mostly in financial intermediation (where there is considerable foreign direct investment [FDI]) and real estate services.
The index of agglomeration indicates that Bangladesh has been slow in developing economic clusters or
ecosystems that enable an economy to participate in and eventually move up global production chains. This includes high-tech products and business services, thereby precluding further growth in GDP through trade in intermediate and final products. Achieving economic and export diversification and faster growth in new sectors remain a challenge because infrastructure services are developing slowly and public sector intervention in productive activities is significant. By promoting policies to develop different domestic sectors to meet local and global demand for goods and services and minimizing the government’s role in the market, Bangladesh can follow the path of more successful diversified economies such as the PRC and Viet Nam.
5.3.2 Capital and Labor in the Productive Economy
So far we have said little about other aspects of productivity across the sectors. Here we also tie these observations with the evolution of machinery and skilled labor in these sectors and others. The following observations can be made after analyzing the input-output data in Appendix 5.3.
Table 5.7: Index of Agglomeration by Economic Blocks for Bangladesh and Comparators
PRC = People’s Republic of China, US = United States.Note: The index of agglomeration measures the strength of the economic linkages of each type of economic block, including the total economy, and scores highly when linkages have a strong degree of participation or diversification across the economy.Source: ADB estimates.
Indicators Bangladesh India PRC US Viet Nam No. of SectorsBACKWARD AGGLOMERATION 2.35 2.45 2.78 2.38 2.84 35
Agriculture 1.50 1.31 1.91 2.84 2.39 1Natural resources 2.38 2.17 2.93 2.33 2.66 2Manufacturing 2.86 3.08 3.03 2.76 3.21 13
FORWARD AGGLOMERATION 2.35 2.45 2.78 2.38 2.84 35Infrastructure services 1.68 2.96 2.27 1.68 2.20 6Business services 2.38 2.69 2.65 3.41 2.80 8Community services 2.55 -0.32 0.14 -0.17 -0.06 5
TOTAL AGGLOMERATION 2.35 2.45 2.78 2.38 2.84 35Agriculture 2.46 2.29 2.94 2.41 3.16 1Natural resources 2.69 2.73 3.26 2.67 2.56 2Manufacturing 2.53 2.64 3.11 2.46 3.31 13Infrastructure services 2.13 2.82 2.59 2.10 2.49 6Business services 1.90 2.12 2.53 2.64 2.67 8Community services 2.05 0.47 1.31 0.72 1.10 5
134
Bangladesh: Consolidating Export-Led Growth
The fastest growing sectors for gross value added at constant 1996 prices from 2000 to 2011 are tied to the thrust sectors (see Table 5.1 and Appendix 5.1). Telecommunications, chemicals, and textiles and wearing apparel are among the top 10 thrust sectors being promoted by the government, transport equipment is 15th, leather products and footwear is 26th, and business services is 30th. In this context, the government’s thrust sectors were identified only after they became successful. RMG, for example, was never a thrust sector when it was launched. It is of note that the multipliers and the value-added growth do not seem to be correlated at all. From 2000 to 2011, the share of gross value added or the products was virtually unchanged.
The analysis in Appendix 5.3 shows how machinery, the sector with the highest multiplier (3.92), is also in highest demand by the sector “sale, maintenance and repair of motor vehicles” (which is a business service). Note that none of these are exported services, and they comprise just under 0.25% of gross value added. However, from the research on TVET (see the ADB Employment Diagnostic Study) and anecdotal evidence, the country is becoming quite skilled in machinery, particularly the repair of transport equipment. Most likely this occurs because, given low per capita income, the average Bangladeshi finds it too expensive to import vehicles, so skills have been developed for the repair, maintenance, and retrofit of vehicles. This also leads to much longer useful life of transportation equipment in Bangladesh compared with other countries. The input-output analysis also shows linkages in “electrical specialized equipment” and “transport equipment.” This may also include an infant shipbuilding industry. While some of these connections may still be speculative, looking at the evolution of links across sectors in other countries may also help to project the direction that Bangladesh could or should take for greater economic diversification and production
sophistication. It also confirms that this type of horizontal diversification may be easier and more natural to achieve than moving up the segmented global value chain of the fashion industry.
Leather and footwear did not do that well during 2000–2011. Exports fell and became less competitive. This happened despite repeated assertions of the high quality of Bangladeshi leather, and the success of footwear in the domestic market. The various sector-specific issues involved in this evolution are discussed in Box 5.3, with environmental aspects at the forefront. Leather and footwear may be in dire need of FDI, given the ample potential for inserting into the global value chain.
5.3.3 Use of Capital and Skilled Labor and Insertion into Global Value Chains
As sectors become more sophisticated and their capabilities increase, substitution of low-cost labor with high-skilled labor and mechanization may occur. We use input-output information together with employment and investment data to examine these patterns in Bangladesh.
In Bangladesh, most capital formation seems to have happened in construction, however, textiles and garments have seen a significant increase in the capital/labor ratio as unskilled labor is replaced by machines. This pattern has also historically occurred in textiles in other countries. RMG has still one of the lowest capital-labor ratios of the 35 subsectors in the 2012 Survey of Manufacturing Industries. The textile sector is more capital-intensive than RMG, but only slightly more so than other sectors within manufacturing. However, the capital/labor ratio in RMG is increasing.46 It is possible that the skills gap between a garment worker and a middle-manager in a garment factory is now so high (or at least perceived as such) that instead of “skilling” floor workers, RMG entrepreneurs may prefer to increase capital intensity. Moreover, while
____________________46 Sectors that have had the highest increase in gross fixed capital formation that is not related to the construction of buildings and infrastructure are: textiles and
garments, chemical and chemical products, and nonmetallic minerals. The increase is particularly large for textiles and garments from 2006 to 2012, despite a large increase in employment. This has come with a very large increase in hourly wages since 2012–2013, attesting to the substitution of unskilled labor for capital.
135
Economic Diversification for Sustained Growth: Does Bangladesh Need to Switch Gears?
purchasing some of the more sophisticated machines can be consistent with innovation, skilled operators and maintenance staff are apparently in too short a supply to allow full adoption of some of the new technologies.
FDI in Bangladesh is small and concentrated in just a few traditional sectors: RMG, financial services, oil and gas, and telecommunications. Within RMG, sourcing by international firms accounts for most FDI in that sector. Moreover, the type of FDI has not led to technology transfer, as it is only gross FDI, not net FDI; much of it in the form of working capital for specific orders under the “back-to-back” letter of credit scheme discussed in section 5.1.
Technology Transfers and Insertion into the Global Production Chain
Transfer of nonproprietary technologies in textile, RMG, footwear, and leather from foreign to domestic sources is fairly easy. However, the same cannot be said of high-value industries such as information technology, pharmaceuticals, and electronics. Direct technology transfers from these industries through EPZ and other channels has been very limited. Technology transfer for industrial development requires human resources (scientists and engineers), information (market information, patent disclosures, technical books, and computer databases) and modern laboratories (ADB 2015b). With Bangladesh’s strong commitment to science and technology and the development of more SEZ, the economy is making progress and the time lag for greater economic gains may be shortened significantly.
In addition to relatively few linkages of the domestic sectors, we also find evidence that Bangladesh has been unable to link global production chains. The country touts itself as an exporter of finished low-cost garments, yet 23% of textiles and garments production are used as intermediate inputs in other countries. The rest is for international consumption.
Appendix 5.4 details the methodology and results used to determine global value chain insertion. The analysis derives the multiplier effects of a $1 million increase in final demand for products originating in Bangladesh, and the multiplier effects on final demand for products originating in the rest of the world, by sector. Two results are evident: Bangladesh is clearly at a very low end of the global production chains in every sector, and almost every sector is noticeably reliant on imported intermediate products, hence the rest of the world benefits from the spillover effects of an increase in final demand for Bangladesh products.
Global production processes are generally not reliant on Bangladesh for intermediate products; hence the country does not benefit from the feedback effects of an increase in final demand for Bangladesh products. One could argue that the country is well-inserted into the fashion industry value chain, because it produces garments, but it is a very segmented value chain because of the way the industry operates (see section 5.2).
Struggles of Other Manufacturers
As with the concentration level of exports (Figure 5.8), the agglomeration analysis provides another testament to the high and increasing concentration of the domestic economy in RMG and the lack of development of other productive activities. Notably, the leather and footwear sector no longer has the comparative advantage it had in 2000. It is also the sector in Bangladesh manufacturing with the lowest multiplier after “other nonmetallic products.” It is also interesting that, by 2011, RCA was confined to only “textiles and garments” and “private households with employed persons”.47 The latter includes a significant portion of the informal economy (see the multipliers and NRCA values by sector in Appendix table 5.1).
Two case studies of potentially promising sectors, leather and footwear and pharmaceuticals, are discussed in Boxes 5.3 and 5.4.
____________________47 This type of analysis does not show remittances.
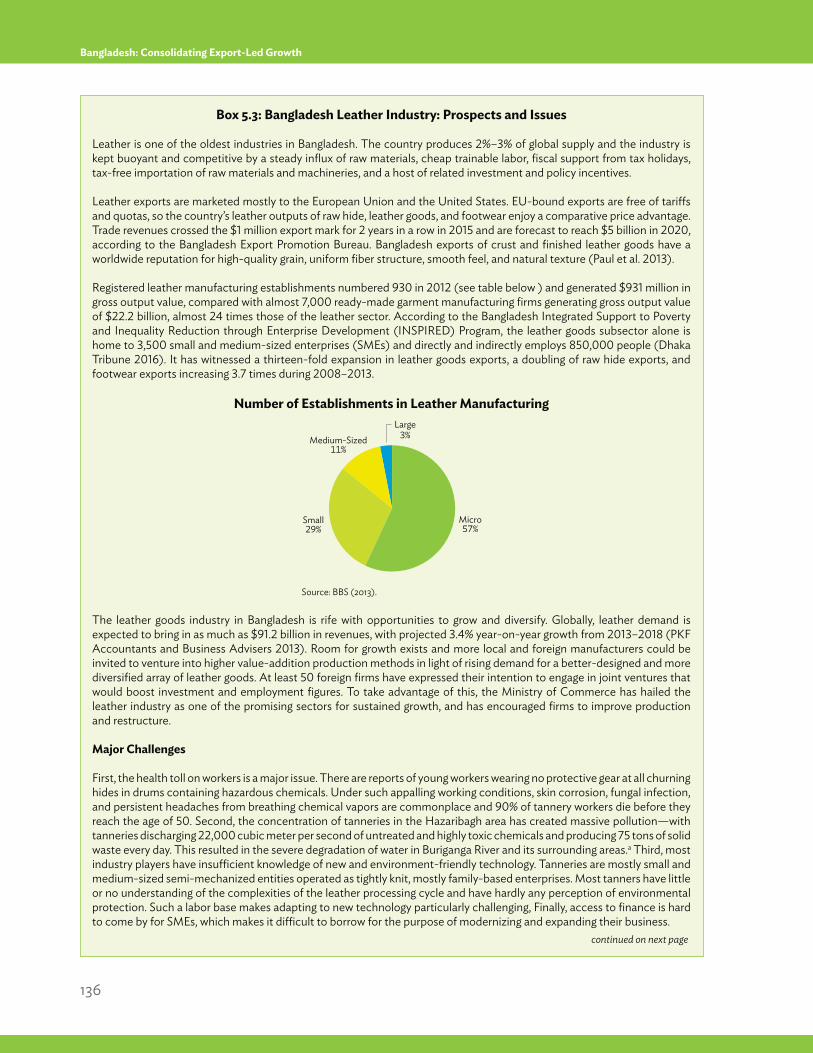
136
Bangladesh: Consolidating Export-Led Growth
Box 5.3: Bangladesh Leather Industry: Prospects and Issues
Leather is one of the oldest industries in Bangladesh. The country produces 2%–3% of global supply and the industry is kept buoyant and competitive by a steady influx of raw materials, cheap trainable labor, fiscal support from tax holidays, tax-free importation of raw materials and machineries, and a host of related investment and policy incentives.
Leather exports are marketed mostly to the European Union and the United States. EU-bound exports are free of tariffs and quotas, so the country’s leather outputs of raw hide, leather goods, and footwear enjoy a comparative price advantage. Trade revenues crossed the $1 million export mark for 2 years in a row in 2015 and are forecast to reach $5 billion in 2020, according to the Bangladesh Export Promotion Bureau. Bangladesh exports of crust and finished leather goods have a worldwide reputation for high-quality grain, uniform fiber structure, smooth feel, and natural texture (Paul et al. 2013).
Registered leather manufacturing establishments numbered 930 in 2012 (see table below ) and generated $931 million in gross output value, compared with almost 7,000 ready-made garment manufacturing firms generating gross output value of $22.2 billion, almost 24 times those of the leather sector. According to the Bangladesh Integrated Support to Poverty and Inequality Reduction through Enterprise Development (INSPIRED) Program, the leather goods subsector alone is home to 3,500 small and medium-sized enterprises (SMEs) and directly and indirectly employs 850,000 people (Dhaka Tribune 2016). It has witnessed a thirteen-fold expansion in leather goods exports, a doubling of raw hide exports, and footwear exports increasing 3.7 times during 2008–2013.
Number of Establishments in Leather Manufacturing
Source: BBS (2013).
The leather goods industry in Bangladesh is rife with opportunities to grow and diversify. Globally, leather demand is expected to bring in as much as $91.2 billion in revenues, with projected 3.4% year-on-year growth from 2013–2018 (PKF Accountants and Business Advisers 2013). Room for growth exists and more local and foreign manufacturers could be invited to venture into higher value-addition production methods in light of rising demand for a better-designed and more diversified array of leather goods. At least 50 foreign firms have expressed their intention to engage in joint ventures that would boost investment and employment figures. To take advantage of this, the Ministry of Commerce has hailed the leather industry as one of the promising sectors for sustained growth, and has encouraged firms to improve production and restructure.
Major Challenges
First, the health toll on workers is a major issue. There are reports of young workers wearing no protective gear at all churning hides in drums containing hazardous chemicals. Under such appalling working conditions, skin corrosion, fungal infection, and persistent headaches from breathing chemical vapors are commonplace and 90% of tannery workers die before they reach the age of 50. Second, the concentration of tanneries in the Hazaribagh area has created massive pollution—with tanneries discharging 22,000 cubic meter per second of untreated and highly toxic chemicals and producing 75 tons of solid waste every day. This resulted in the severe degradation of water in Buriganga River and its surrounding areas.a Third, most industry players have insufficient knowledge of new and environment-friendly technology. Tanneries are mostly small and medium-sized semi-mechanized entities operated as tightly knit, mostly family-based enterprises. Most tanners have little or no understanding of the complexities of the leather processing cycle and have hardly any perception of environmental protection. Such a labor base makes adapting to new technology particularly challenging, Finally, access to finance is hard to come by for SMEs, which makes it difficult to borrow for the purpose of modernizing and expanding their business.
continued on next page
Medium-Sized11%
Micro57%
Small29%
Large3%
137
Economic Diversification for Sustained Growth: Does Bangladesh Need to Switch Gears?
Box 5.3 continued
Linkages Across Sectors are Weak
Local support industries such as chemicals (which are essential inputs in tanning) are still underdeveloped. Leather enterprises therefore rely on imports, underscoring the lack of backward linkages. They also have no centralized institute to boost marketing knowledge and networking know-how, and the lack of integrated initiatives to promote leather globally leaves many firms stuck with old ways of marketing. Insufficient research and development, along with very limited skills promotion, adds to the issues that prevent Bangladesh from becoming internationally recognized as a quality producer.
Room for Improvement
One notable, recent change is the adoption of production methods less harmful to the environment. Training initiatives have opened to turn low-wage workers into skilled workers to enable more firms to upgrade into the higher-value production sphere of leather making.
Also, huge local demand for footwear (approximately 200–300 million pairs a year) may be used as a takeoff point for developing backward linkages to enhance connectivity and increase overall competitiveness between firms. Branding is also another area in which Bangladesh leather firms could promote their leather as a reputable commodity.
The extent to which greater global demand for environment-friendly leatherwear would change the business practices of manufacturers is still unknown. The production of leather using eco-friendly and sustainable methods is a desirable goal. This can be achieved if the sector properly addresses health and environmental concerns, complies with international standards, helps ease access to finance, and addresses skills upgrade issues in the sector.
a Outrage and criticism at the detrimental impact of tanneries on the Hazaribagh area brought together leather market stakeholders to cooperate in making possible the relocation of tanneries to Savar, which is ongoing (Al-Muti and Ahmad 2015).Source: Authors.
Box 5.4: Bangladesh Pharmaceutical Industry: Prospects and Issues
The pharmaceutical industry has been an economic thrust sector on the export priority list since 2006. Reforms in the industry such as the National Drug Ordinance in 1982 and the National Drug Policy 2005 have made Bangladesh almost self-sufficient in domestic pharmaceutical production. Low overall manufacturing costs, significant private sector investments, and government support have propelled the sector. Pharmaceutical exports grew from $2 million in 2000 to reach $73 million in FY2014–2015, according to the Bangladesh Export Promotion Bureau, although they are still dwarfed by RMG and leather exports. Still, industry insiders project the pharmaceutical market in Bangladesh to be around $2.5 billion per year around 2020 (Masud 2013).
Since patents are critical to their strategic conduct, pharmaceutical firms in Bangladesh stand to benefit from the recent decision by the World Trade Organization’s Council for Trade-Related Aspects of Intellectual Property Rights to absolve least-developed countries from enforcing intellectual property rights on pharmaceutical products until after 2032 (Saez 2015). This extension of the patent exemption will provide Bangladesh’s pharmaceutical sector the opportunity to legally reverse-engineer patented medicines for domestic consumption and export to other least-developed countries, as well as ample chance to establish price and quality competitiveness. Bangladesh, through its sound track record of partnerships with prominent multinational companies, has one of the strongest potential bases for pharmaceutical manufacturing.
Why Have Pharmaceutical Exports Not Taken Off?
Bangladesh focuses on the final stage of drug manufacturing, and imports active pharmaceutical ingredients, the core inputs for manufacturing drugs. These ingredients comprise around 40%–50% of drug-making costs, which leaves a narrow profit margin of less than 10% (whereas the process of making the complete final formulation has a 20%–30% profit margin). Pharmaceutical activities are concentrated on the manufacture of high-end drugs, branded generics, low-end generics, and contract manufacturing, all of which use mostly imported active pharmaceutical ingredients. Establishing
continued on next page
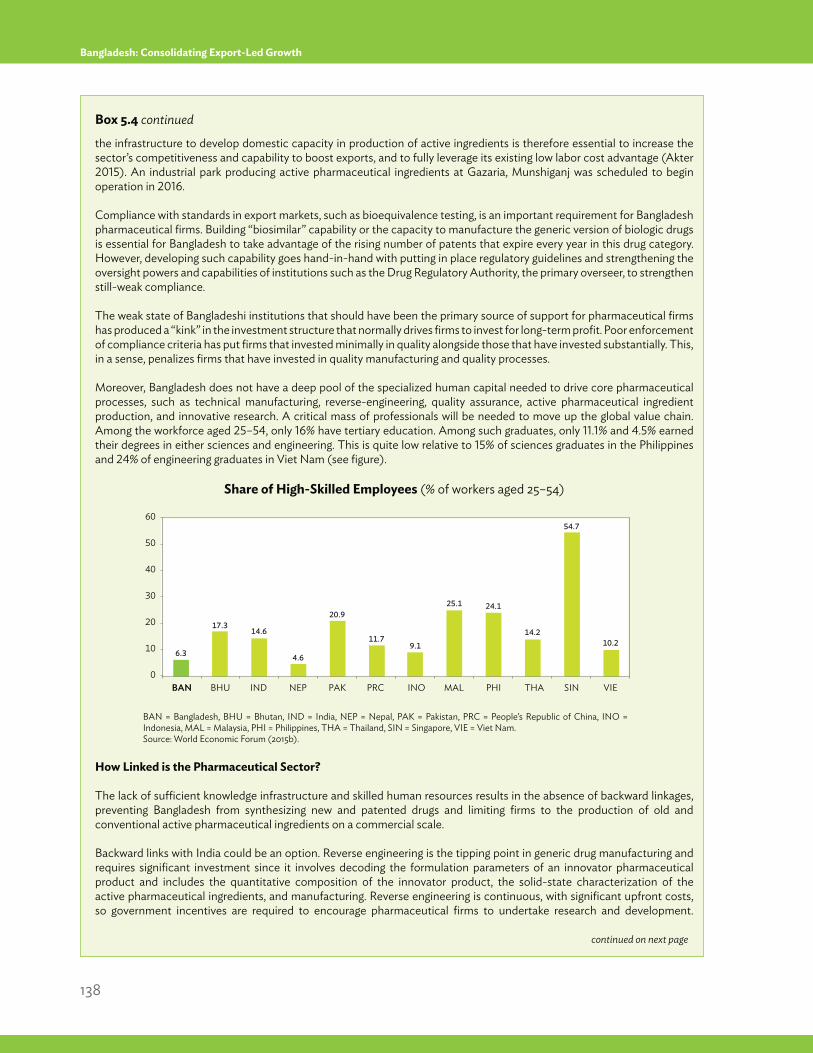
138
Bangladesh: Consolidating Export-Led Growth
Box 5.4 continued
the infrastructure to develop domestic capacity in production of active ingredients is therefore essential to increase the sector’s competitiveness and capability to boost exports, and to fully leverage its existing low labor cost advantage (Akter 2015). An industrial park producing active pharmaceutical ingredients at Gazaria, Munshiganj was scheduled to begin operation in 2016.
Compliance with standards in export markets, such as bioequivalence testing, is an important requirement for Bangladesh pharmaceutical firms. Building “biosimilar” capability or the capacity to manufacture the generic version of biologic drugs is essential for Bangladesh to take advantage of the rising number of patents that expire every year in this drug category. However, developing such capability goes hand-in-hand with putting in place regulatory guidelines and strengthening the oversight powers and capabilities of institutions such as the Drug Regulatory Authority, the primary overseer, to strengthen still-weak compliance.
The weak state of Bangladeshi institutions that should have been the primary source of support for pharmaceutical firms has produced a “kink” in the investment structure that normally drives firms to invest for long-term profit. Poor enforcement of compliance criteria has put firms that invested minimally in quality alongside those that have invested substantially. This, in a sense, penalizes firms that have invested in quality manufacturing and quality processes.
Moreover, Bangladesh does not have a deep pool of the specialized human capital needed to drive core pharmaceutical processes, such as technical manufacturing, reverse-engineering, quality assurance, active pharmaceutical ingredient production, and innovative research. A critical mass of professionals will be needed to move up the global value chain. Among the workforce aged 25–54, only 16% have tertiary education. Among such graduates, only 11.1% and 4.5% earned their degrees in either sciences and engineering. This is quite low relative to 15% of sciences graduates in the Philippines and 24% of engineering graduates in Viet Nam (see figure).
Share of High-Skilled Employees (% of workers aged 25–54)
BAN = Bangladesh, BHU = Bhutan, IND = India, NEP = Nepal, PAK = Pakistan, PRC = People’s Republic of China, INO = Indonesia, MAL = Malaysia, PHI = Philippines, THA = Thailand, SIN = Singapore, VIE = Viet Nam.Source: World Economic Forum (2015b).
How Linked is the Pharmaceutical Sector?
The lack of sufficient knowledge infrastructure and skilled human resources results in the absence of backward linkages, preventing Bangladesh from synthesizing new and patented drugs and limiting firms to the production of old and conventional active pharmaceutical ingredients on a commercial scale.
Backward links with India could be an option. Reverse engineering is the tipping point in generic drug manufacturing and requires significant investment since it involves decoding the formulation parameters of an innovator pharmaceutical product and includes the quantitative composition of the innovator product, the solid-state characterization of the active pharmaceutical ingredients, and manufacturing. Reverse engineering is continuous, with significant upfront costs, so government incentives are required to encourage pharmaceutical firms to undertake research and development.
6.3
17.3 14.6
4.6
20.9
11.7 9.1
25.1 24.1
14.2
54.7
10.2
BAN BHU IND NEP PAK PRC INO MAL PHI THA SIN VIE 0
30
20
10
40
50
60
continued on next page
139
Economic Diversification for Sustained Growth: Does Bangladesh Need to Switch Gears?
5.4 The Role of Current Policies in DiversificationOne needs to understand what policies constrain non-RMG labor-intensive exports relative to RMG exports in order to reduce Bangladesh’s mono-product export base and its economic vulnerability. Unlike RMG, other exporters face a choice between domestic sales and exports. And what do they find? The tariff regime is such that the production and domestic sale of import-substitute products, particularly consumer goods, is protected from import competition. As a result, profitability is significantly higher from domestic sales than from exports. For exports of footwear or automobile batteries, for example, protective tariffs significantly prop up domestic prices, keeping them above international prices. Whereas average tariffs on consumer goods is about 51%, effective protection on most consumer goods is raised through “tariff escalation” by maintaining substantially lower average tariffs (13%) on inputs.
Non-RMG sectors are shielded from competition. When exporting these products to developed or emerging market economies, the prices companies can fetch are typically close to international prices, not least because of competition from other suppliers. In
export markets, profits therefore have to be earned by keeping costs low, whereas in the domestic market producers can be complacent. The drive for innovation is also thwarted. To gain and retain market access for exports requires exporters to be constantly alert to the competition. Ensuring a highly protected domestic market with profits propped up by tariffs breeds complacency and inefficiency in non-RMG producers and potential exporters, particularly if they have the basic skills to produce high-quality goods and services.
This “anti-export bias” will continue unless the government addresses the vital issue of relative profitability of exports versus domestic sales. One critical missing element in the strategy for export expansion is the proper aligning of the tariff regime to make export production just as attractive as the production of import substitutes. This is why footwear exports are not booming as they are in Viet Nam. Non-leather footwear is just like apparel-making in that they have similar capabilities; GDP is therefore not growing as much as it could. It is necessary for Bangladesh to reduce high tariffs on consumer goods and to develop a comparative advantage in intermediate goods if it is to take part in more global value chains and increase value added.
Box 5.4 continuedPharmaceutical manufacturers in India, for example, enjoy increased weighted deduction of up to 200% on in-house research and development expenses. Bangladesh is becoming more inclined to engage in research and development. It has 3,500 Drug Master Filea approvals for active pharmaceutical ingredients and more than 150 pharmaceutical plants in the country approved by the United States Food and Drug Administration.
Another human resource pool that could benefit from an upgrading of knowledge and skills through training is for medical representatives recruited for sales, marketing, and information channels (see Chapter 3 of ADB 2016b). The absence of a standardized incentive scheme for these types of worker creates high turnover of medical representatives.
Opportunities
The global market for pharmaceutical products is huge, and opportunities in generic drugs are growing fast. In 2015 alone, patented drugs worth an estimated $60 billion went off-patent, which opens up potential revenue space for generic manufacturers. Bangladesh could be ideally positioned to gain from these opportunities, with its cost advantages and skilled staff, but it needs to address pharmaceutical industry challenges to cement its competitive advantage, build a strong presence in the global generics market, and be an effective mechanism for economic diversification and inclusive and sustainable economic transformation.
a The drug master file is a document prepared by a pharmaceutical manufacturer and submitted at its discretion to the appropriate regulatory authority in the intended drug market.Source: Authors.
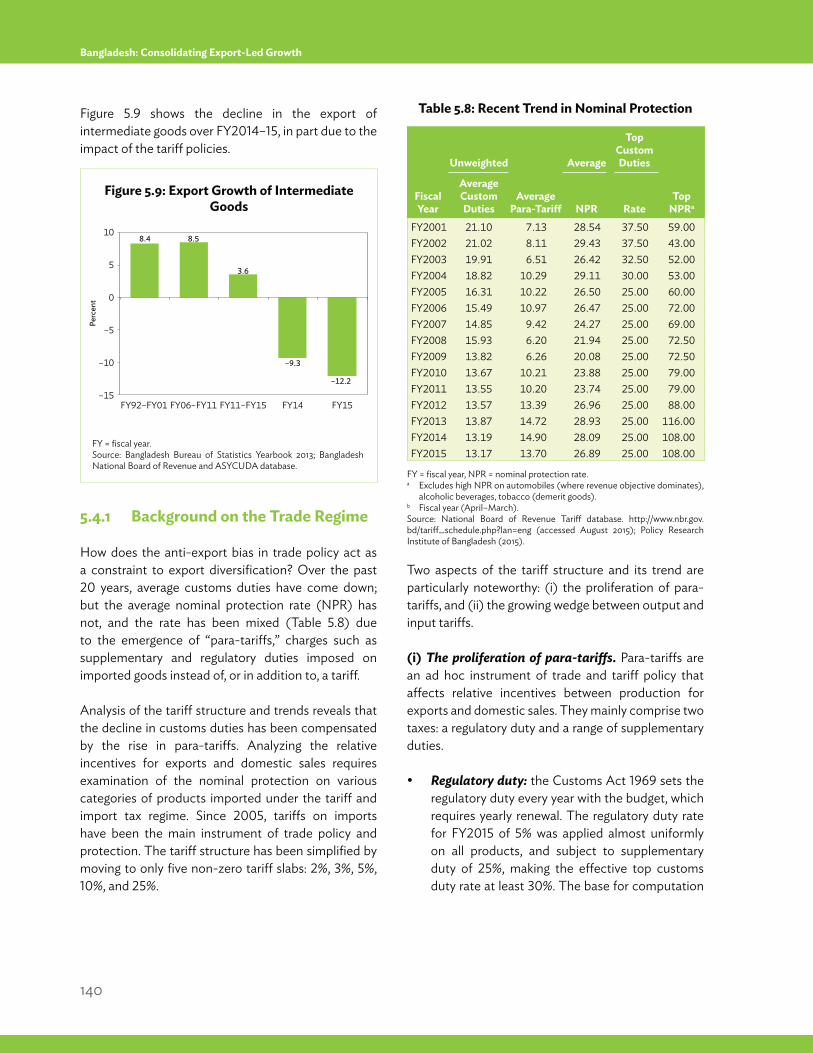
140
Bangladesh: Consolidating Export-Led Growth
Figure 5.9 shows the decline in the export of intermediate goods over FY2014–15, in part due to the impact of the tariff policies.
5.4.1 Background on the Trade Regime
How does the anti-export bias in trade policy act as a constraint to export diversification? Over the past 20 years, average customs duties have come down; but the average nominal protection rate (NPR) has not, and the rate has been mixed (Table 5.8) due to the emergence of “para-tariffs,” charges such as supplementary and regulatory duties imposed on imported goods instead of, or in addition to, a tariff.
Analysis of the tariff structure and trends reveals that the decline in customs duties has been compensated by the rise in para-tariffs. Analyzing the relative incentives for exports and domestic sales requires examination of the nominal protection on various categories of products imported under the tariff and import tax regime. Since 2005, tariffs on imports have been the main instrument of trade policy and protection. The tariff structure has been simplified by moving to only five non-zero tariff slabs: 2%, 3%, 5%, 10%, and 25%.
Two aspects of the tariff structure and its trend are particularly noteworthy: (i) the proliferation of para-tariffs, and (ii) the growing wedge between output and input tariffs.
(i) The proliferation of para-tariffs. Para-tariffs are an ad hoc instrument of trade and tariff policy that affects relative incentives between production for exports and domestic sales. They mainly comprise two taxes: a regulatory duty and a range of supplementary duties.
Regulatory duty: the Customs Act 1969 sets the regulatory duty every year with the budget, which requires yearly renewal. The regulatory duty rate for FY2015 of 5% was applied almost uniformly on all products, and subject to supplementary duty of 25%, making the effective top customs duty rate at least 30%. The base for computation
Perc
ent
–15
–5
0
–10
5
10
FY92–FY01 FY06–FY11 FY11–FY15 FY14 FY15
8.4 8.5
3.6
–9.3
–12.2
Figure 5.9: Export Growth of Intermediate Goods
FY = fiscal year.Source: Bangladesh Bureau of Statistics Yearbook 2013; Bangladesh National Board of Revenue and ASYCUDA database.
Table 5.8: Recent Trend in Nominal Protection
FY = fiscal year, NPR = nominal protection rate.a Excludes high NPR on automobiles (where revenue objective dominates),
alcoholic beverages, tobacco (demerit goods).b Fiscal year (April–March).Source: National Board of Revenue Tariff database. http://www.nbr.gov.bd/tariff_schedule.php?lan=eng (accessed August 2015); Policy Research Institute of Bangladesh (2015).
Fiscal Year
Unweighted
Average Para-Tariff
Average
Top Custom Duties
Top NPRa
Average Custom Duties NPR Rate
FY2001 21.10 7.13 28.54 37.50 59.00FY2002 21.02 8.11 29.43 37.50 43.00FY2003 19.91 6.51 26.42 32.50 52.00FY2004 18.82 10.29 29.11 30.00 53.00FY2005 16.31 10.22 26.50 25.00 60.00FY2006 15.49 10.97 26.47 25.00 72.00FY2007 14.85 9.42 24.27 25.00 69.00FY2008 15.93 6.20 21.94 25.00 72.50FY2009 13.82 6.26 20.08 25.00 72.50FY2010 13.67 10.21 23.88 25.00 79.00FY2011 13.55 10.20 23.74 25.00 79.00FY2012 13.57 13.39 26.96 25.00 88.00FY2013 13.87 14.72 28.93 25.00 116.00FY2014 13.19 14.90 28.09 25.00 108.00FY2015 13.17 13.70 26.89 25.00 108.00
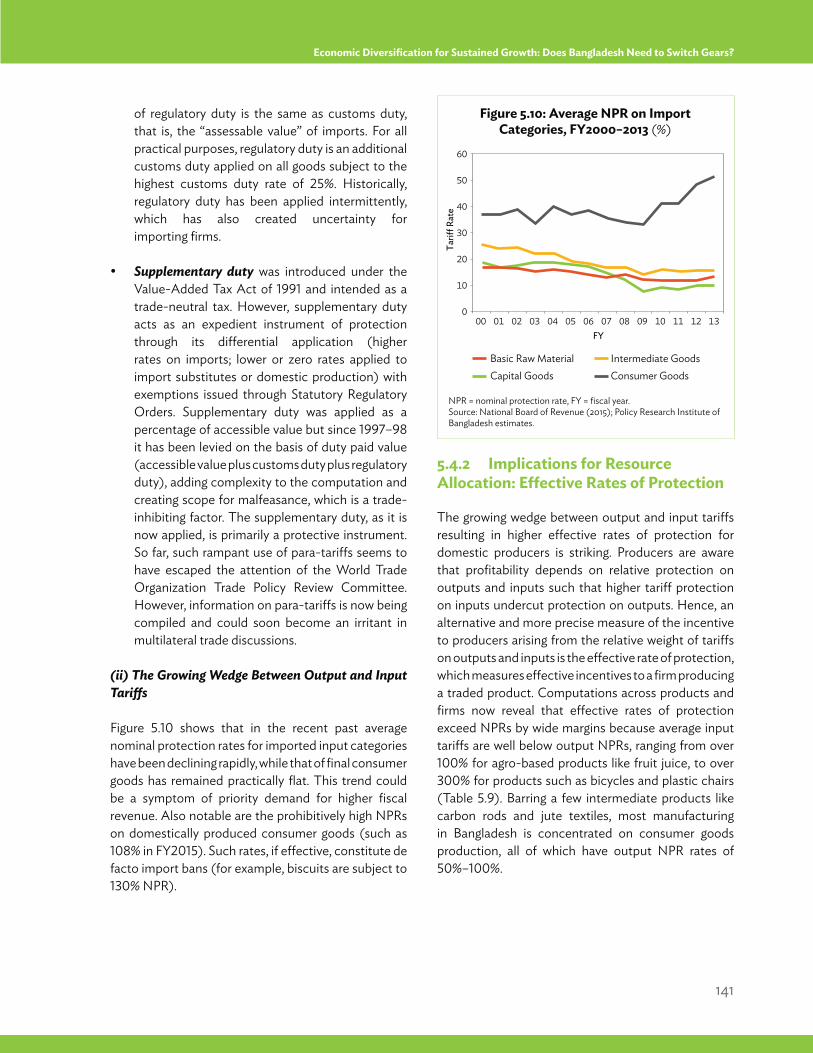
141
Economic Diversification for Sustained Growth: Does Bangladesh Need to Switch Gears?
of regulatory duty is the same as customs duty, that is, the “assessable value” of imports. For all practical purposes, regulatory duty is an additional customs duty applied on all goods subject to the highest customs duty rate of 25%. Historically, regulatory duty has been applied intermittently, which has also created uncertainty for importing firms.
Supplementary duty was introduced under the Value-Added Tax Act of 1991 and intended as a trade-neutral tax. However, supplementary duty acts as an expedient instrument of protection through its differential application (higher rates on imports; lower or zero rates applied to import substitutes or domestic production) with exemptions issued through Statutory Regulatory Orders. Supplementary duty was applied as a percentage of accessible value but since 1997–98 it has been levied on the basis of duty paid value (accessible value plus customs duty plus regulatory duty), adding complexity to the computation and creating scope for malfeasance, which is a trade-inhibiting factor. The supplementary duty, as it is now applied, is primarily a protective instrument. So far, such rampant use of para-tariffs seems to have escaped the attention of the World Trade Organization Trade Policy Review Committee. However, information on para-tariffs is now being compiled and could soon become an irritant in multilateral trade discussions.
(ii) The Growing Wedge Between Output and Input Tariffs
Figure 5.10 shows that in the recent past average nominal protection rates for imported input categories have been declining rapidly, while that of final consumer goods has remained practically flat. This trend could be a symptom of priority demand for higher fiscal revenue. Also notable are the prohibitively high NPRs on domestically produced consumer goods (such as 108% in FY2015). Such rates, if effective, constitute de facto import bans (for example, biscuits are subject to 130% NPR).
5.4.2 Implications for Resource Allocation: Effective Rates of Protection
The growing wedge between output and input tariffs resulting in higher effective rates of protection for domestic producers is striking. Producers are aware that profitability depends on relative protection on outputs and inputs such that higher tariff protection on inputs undercut protection on outputs. Hence, an alternative and more precise measure of the incentive to producers arising from the relative weight of tariffs on outputs and inputs is the effective rate of protection, which measures effective incentives to a firm producing a traded product. Computations across products and firms now reveal that effective rates of protection exceed NPRs by wide margins because average input tariffs are well below output NPRs, ranging from over 100% for agro-based products like fruit juice, to over 300% for products such as bicycles and plastic chairs (Table 5.9). Barring a few intermediate products like carbon rods and jute textiles, most manufacturing in Bangladesh is concentrated on consumer goods production, all of which have output NPR rates of 50%–100%.
Basic Raw Material Intermediate Goods
0
60
40
30
20
10
50
Capital Goods Consumer Goods
00 01 02 03 04 05 06 07 08 09 10 11 12 13
Tariff
Rat
e
FY
Figure 5.10: Average NPR on Import Categories, FY2000–2013 (%)
NPR = nominal protection rate, FY = fiscal year.Source: National Board of Revenue (2015); Policy Research Institute of Bangladesh estimates.
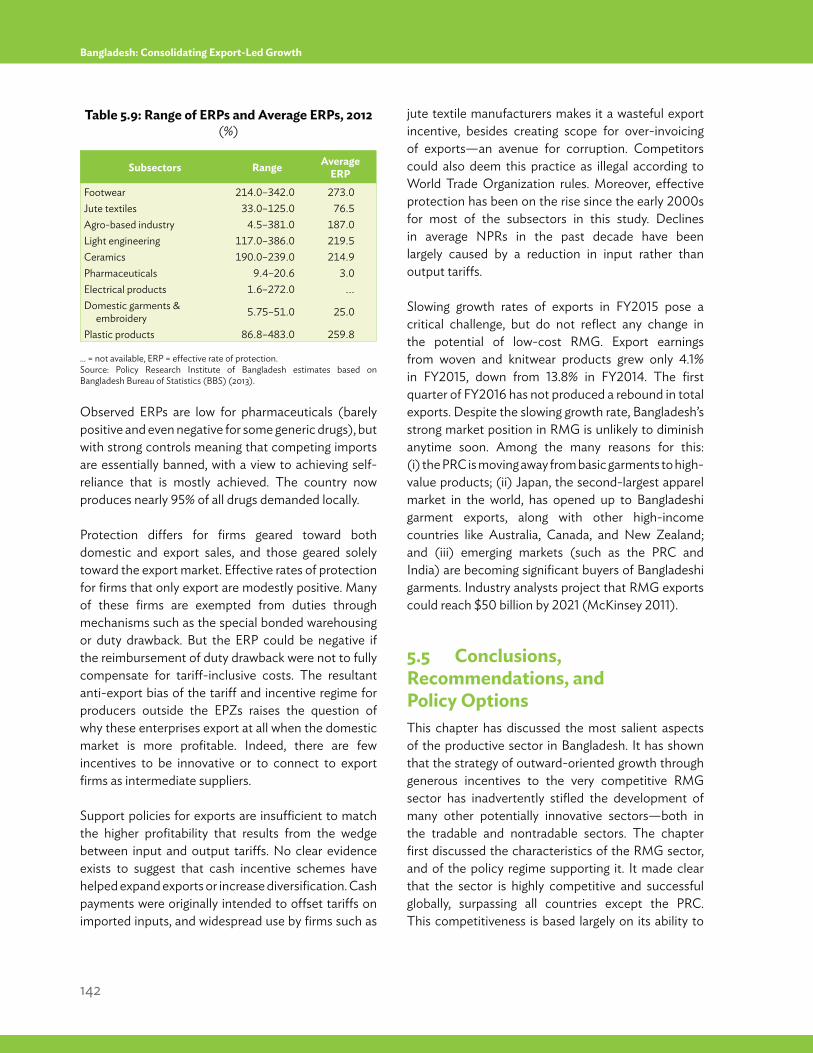
142
Bangladesh: Consolidating Export-Led Growth
Observed ERPs are low for pharmaceuticals (barely positive and even negative for some generic drugs), but with strong controls meaning that competing imports are essentially banned, with a view to achieving self-reliance that is mostly achieved. The country now produces nearly 95% of all drugs demanded locally.
Protection differs for firms geared toward both domestic and export sales, and those geared solely toward the export market. Effective rates of protection for firms that only export are modestly positive. Many of these firms are exempted from duties through mechanisms such as the special bonded warehousing or duty drawback. But the ERP could be negative if the reimbursement of duty drawback were not to fully compensate for tariff-inclusive costs. The resultant anti-export bias of the tariff and incentive regime for producers outside the EPZs raises the question of why these enterprises export at all when the domestic market is more profitable. Indeed, there are few incentives to be innovative or to connect to export firms as intermediate suppliers.
Support policies for exports are insufficient to match the higher profitability that results from the wedge between input and output tariffs. No clear evidence exists to suggest that cash incentive schemes have helped expand exports or increase diversification. Cash payments were originally intended to offset tariffs on imported inputs, and widespread use by firms such as
jute textile manufacturers makes it a wasteful export incentive, besides creating scope for over-invoicing of exports—an avenue for corruption. Competitors could also deem this practice as illegal according to World Trade Organization rules. Moreover, effective protection has been on the rise since the early 2000s for most of the subsectors in this study. Declines in average NPRs in the past decade have been largely caused by a reduction in input rather than output tariffs.
Slowing growth rates of exports in FY2015 pose a critical challenge, but do not reflect any change in the potential of low-cost RMG. Export earnings from woven and knitwear products grew only 4.1% in FY2015, down from 13.8% in FY2014. The first quarter of FY2016 has not produced a rebound in total exports. Despite the slowing growth rate, Bangladesh’s strong market position in RMG is unlikely to diminish anytime soon. Among the many reasons for this: (i) the PRC is moving away from basic garments to high-value products; (ii) Japan, the second-largest apparel market in the world, has opened up to Bangladeshi garment exports, along with other high-income countries like Australia, Canada, and New Zealand; and (iii) emerging markets (such as the PRC and India) are becoming significant buyers of Bangladeshi garments. Industry analysts project that RMG exports could reach $50 billion by 2021 (McKinsey 2011).
5.5 Conclusions, Recommendations, and Policy OptionsThis chapter has discussed the most salient aspects of the productive sector in Bangladesh. It has shown that the strategy of outward-oriented growth through generous incentives to the very competitive RMG sector has inadvertently stifled the development of many other potentially innovative sectors—both in the tradable and nontradable sectors. The chapter first discussed the characteristics of the RMG sector, and of the policy regime supporting it. It made clear that the sector is highly competitive and successful globally, surpassing all countries except the PRC. This competitiveness is based largely on its ability to
Table 5.9: Range of ERPs and Average ERPs, 2012 (%)
… = not available, ERP = effective rate of protection.Source: Policy Research Institute of Bangladesh estimates based on Bangladesh Bureau of Statistics (BBS) (2013).
Subsectors Range Average ERP
Footwear 214.0–342.0 273.0Jute textiles 33.0–125.0 76.5Agro-based industry 4.5–381.0 187.0Light engineering 117.0–386.0 219.5Ceramics 190.0–239.0 214.9Pharmaceuticals 9.4–20.6 3.0Electrical products 1.6–272.0 ...Domestic garments &
embroidery 5.75–51.0 25.0
Plastic products 86.8–483.0 259.8
143
Economic Diversification for Sustained Growth: Does Bangladesh Need to Switch Gears?
produce basic garments at very low cost. However, given that garments are a small part of a global fashion industry dominated by international conglomerates, it will be difficult for Bangladesh to integrate vertically into the fashion value chain. Nonetheless, the capabilities required to produce garments or other manufactures competitively can be utilized in many other areas of the production sphere in Bangladesh, and these need to be developed.48
Using input-output tables juxtaposed with new RCA indicators, we have shown that Bangladesh has been unable to diversify across productive goods and services. We identify sectors in which there has been some promise, such as leather and footwear and pharmaceuticals. For various reasons, none of these sectors has been able to take off in recent years. Moreover, most other manufacturing sectors are not inserted into global production chains. A large part of this has to do with trade policies that create a huge anti-export bias for non-RMG sectors: because of current incentives, and tariff rates, it is much more profitable to import raw materials and intermediate goods and produce for the domestic market than to export either intermediate or final goods.
Until very recently, the government’s industrial policy relied on picking a few thrust sectors and offering them generous export incentives—many through the SEZ regime. The decision as to which sector is promising primarily relies on growth rates of value added evaluated after the fact, in conjunction with certain targets for every sector. But such a policy exacerbates any type of production concentration by encouraging future growth and larger sectors that are already ahead of others, instead of creating incentives for innovation. The government should consider reducing its strategy of “picking winners” and instead focus on creating the right environment for all types of businesses to thrive. In particular, the difficulties of doing business in Bangladesh are clearly reflected in the World Economic Forum competitiveness index and are all areas on which policy makers could put more focus on.
5.5.1 Main Recommendations
The first recommendation is to withdraw some of the support to the RMG, which has outlived its useful life. As a general principle, incentives for infant industries need to be time-bound, and these were not. Special incentives, such as corporate income tax exemption or tax holidays for imported machinery, need to be removed. The longer they remain, the less likely it will be politically feasible for the government to remove them and to resist possible undue influence from garment factory owners. Even without these incentives, it is unlikely that the sector will lose its comparative advantage, as it has earned itself an excellent reputation.
Instead, RMG has to contribute more to infrastructure and to increase human capital. It is not enough to train unskilled workers on the factory floor—garment workers should be provided training and incentives to become middle managers and to play a more integral part in the production process.
Moreover, working conditions have to improve. Workers at garment factories frequently work in very fragile buildings, are packed into limited space, and work long hours. One way to improve this situation is for government to embrace the “Made in Bangladesh” campaign, which also places more responsibility on buyers to support better working conditions and safe factories.
Second, the government must identify the barriers to other productive sectors, both goods and services, formal and informal. Once they identify the barriers, it will be easier to provide solutions. In gathering better data and analyzing the evidence, some of the information externalities and coordination failures may be identified, and this itself will allow policy makers to determine the appropriate extent of intervention.
____________________48 Bangladesh is expert in the last stage of processing (“cutting and making”) in the fabrication of garments in the textile industry. However, there is no reason to
believe that this could not extend to other sectors.
144
Bangladesh: Consolidating Export-Led Growth
The challenges for leather and pharmaceuticals have been identified. Both sectors are in a good position globally to grow. Environmental challenges in leather have to be resolved; in pharmaceuticals, more FDI and assistance with certifications may help them create international alliances to move up the pharmaceutical production chain. Other services identified (such as repair of machinery and transport equipment, back-office software) could benefit from specific government support, such as certification of products and ways to bring in skilled leaders.
Third, eliminating anti-export bias against non-RMG exports to get traction on economic diversification, should be the highest priority. The trade policy regime and resulting tariff structure of Bangladesh is skewed toward import-substituting activities with a substantial anti-export bias and should be eliminated. RMG production exists as an insular “free trade” enclave.
The government, in recent years, has selectively provided such facilities as special bonded warehouses (previously restricted only for 100% export-oriented firms like RMG) to exporting firms that satisfy a critical minimum export volume, thus mitigating some of the disincentive from a high tariff regime. This is a positive step forward. Nevertheless, a major challenge in any budget will be to address the problem of anti-export bias from hurting emerging and potential exports. The high ERP for import-competing production needs to be scaled down, starting by reversing the growing wedge between output and input tariffs as rapidly as possible. Moreover, the disincentive to produce intermediate inputs and instead import them is a manifestation of the lack of insertion into global production chains.
Fourth, government agencies that deal with investors and the foreign market must be reformed for a keener focus on promoting investment opportunities. Better coordination capabilities are required between private sector interests and government objectives. At the moment, there are three key agencies: the Bangladesh Export Processing Zone Authority, the Foreign Investment Board, and the Bangladesh Export Promotion Bureau.
Although the latter two agencies are under the Prime Minister’s Office and are therefore very much part of the government, they are very fragmented. Merging them into just one key agency responsible for investment and export opportunities to help the “Made in Bangladesh” business area flourish should be considered. Because this unified agency would be the authority in understanding the market dynamics of Bangladesh products, it would be a more efficient coordinator of information, guidance, and links between public and private investment interests. It should operate as a one-stop shop and be fully resourced to provide investors and exporters timely and reliable information.
Currently, some of these services are provided in the EPZs. However, they should be more generalized to help any business entity—domestic or foreign—that needs information and networking with others. It should help identify capabilities and opportunities, lead research on new markets, and be a source of solid investment support rather than an agent to lobby for special preferences. It should be managed by the best political and technical talent, and have access to the highest levels of government if issues arise. By using the feedback from potential investors, it can work with other government bodies to improve the investment climate and reduce barriers for foreigners to do business. It should also help present a positive image of Bangladesh abroad.
The following improvements should go hand in hand with this agency:
Efficiency of customs administration. A transparent and efficient customs administration is necessary for export success. All exports must be brought within the fold of a priority clearance mechanism equipped with state-of-the-art hardware and software.
Efficiency of import-export procedures. Export and imports are intricately linked and their performance depends on simplification of import procedures. Modernization of import clearance with better technology and IT software can complement export diversification.
145
Economic Diversification for Sustained Growth: Does Bangladesh Need to Switch Gears?
Transparency and efficiency of behind-the-border services. Industrial and investment policies need to be brought into line with those of trading partners and comparators for long-term export sector sustainability. Furthermore, a friendly investment climate should foster FDI in global value chains linking Bangladesh with transnational companies elsewhere.
Finally, more has to be done to attract FDI, particularly the type that increases transfer of technology. FDI is critical for an export-oriented economy like Bangladesh, not just because of the capital it brings, but for the technology and knowledge transfer and job creation with skill development associated with such FDI. The 1980s partnership between Desh Garments and Daewoo in the early stages of the evolution of the RMG sector allowed Bangladesh to acquire important technology and market access that proved invaluable later when
this knowledge was heavily disbursed throughout the industry.
FDI, along with technology transfer and market access, is just as critical for economic diversification, particularly to exploit new product and market opportunities that would be difficult to acquire without partnership with well-established foreign companies. Many foreign investors must be searching for low-cost production centers like Bangladesh, but they do not seem to come to Bangladesh. The government needs to understand why. It needs to survey potential investors to determine whether negative perceptions of Bangladesh are the result of lack of information. The government must also find ways to better disseminate information about opportunities in Bangladesh and the capabilities of its workers. Urban areas need to also become more livable. With technically oriented foreign investors who can establish innovative organizational structures, new sectors in Bangladesh can flourish.
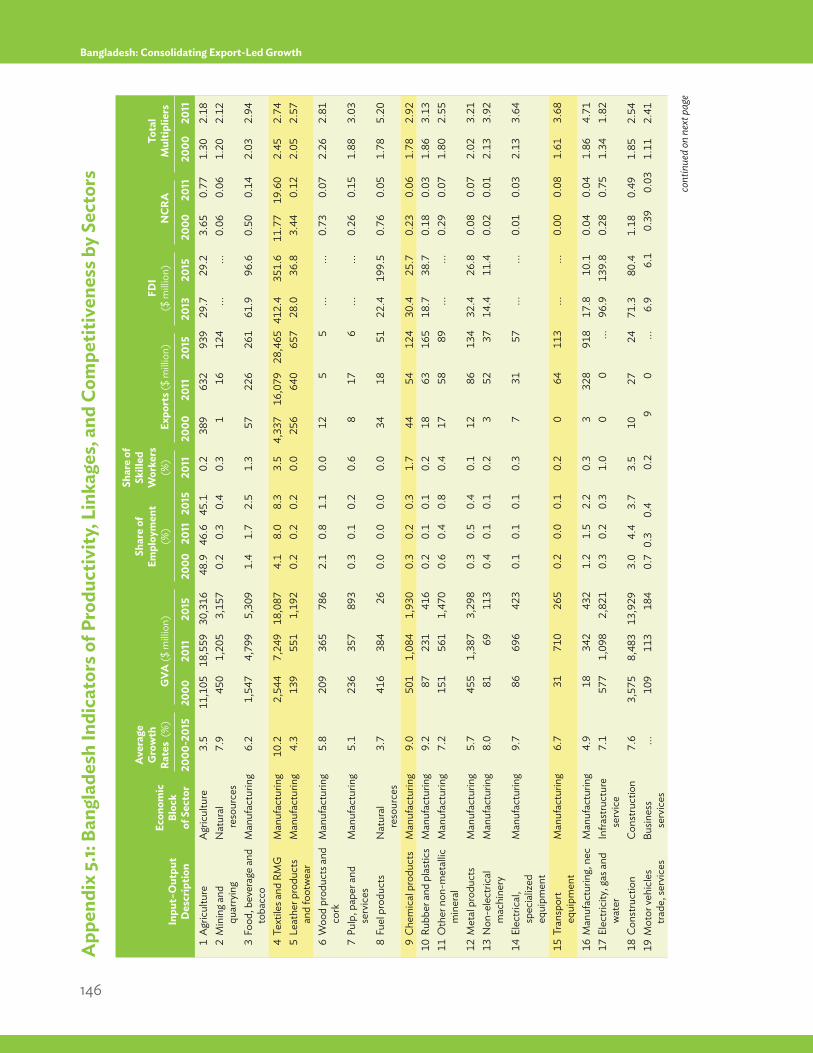
146
Bangladesh: Consolidating Export-Led Growth
App
endi
x 5.
1: Ba
ngla
desh
Indi
cato
rs o
f Pro
duct
ivity
, Lin
kage
s, an
d Co
mpe
titiv
enes
s by
Sect
ors
Inpu
t–O
utpu
t D
escr
iptio
n
Econ
omic
Bl
ock
of S
ecto
r
Aver
age
Gro
wth
Ra
tes
(%)
GVA
($ m
illion
)
Shar
e of
Em
ploy
men
t (%
)
Shar
e of
Sk
illed
W
orke
rs
(%)
Expo
rts (
$ m
illion
)FD
I ($
milli
on)
NCR
ATo
tal
Mul
tiplie
rs
2000
-201
520
0020
1120
1520
0020
1120
1520
1120
0020
1120
1520
1320
1520
0020
1120
0020
11 1
Agr
icul
ture
Agr
icul
ture
3.5
11
,105
18,5
5930
,316
48.9
46.6
45.1
0.2
3
89
632
939
29.
7 29
.2 3
.65
0.77
1.30
2.18
2 M
inin
g and
qu
arry
ing
Nat
ural
re
sour
ces
7.9
4
50
1,2
05
3,15
70.
20.
30.
4 0
.3
1
1612
4...
...
0.0
6 0.
061.
202.
12
3 F
ood,
bev
erag
e an
d to
bacc
oM
anuf
actu
ring
6.2
1,
547
4,79
95,
309
1.4
1.7
2.5
1.3
5
7 22
626
1 6
1.9
96.6
0.5
0 0.
142.
032.
94
4 T
extil
es a
nd R
MG
Man
ufac
turin
g 1
0.2
2,5
44
7,2
49
18,0
87 4
.1
8.0
8.3
3.5
4,
337
16,0
7928
,465
412
.4
351.
6 1
1.77
19
.60
2.45
2.74
5 L
eath
er p
rodu
cts
and
foot
wea
rM
anuf
actu
ring
4.3
1
39
551
1,
192
0.2
0.
20.
2 0
.0
256
64
065
7 2
8.0
36.8
3.4
4 0.
122.
052.
57
6 W
ood
prod
ucts
and
co
rkM
anuf
actu
ring
5.8
2
09
365
78
6 2
.1
0.8
1.1
0.0
1
2 5
5...
...
0.7
3 0.
072.
262.
81
7 P
ulp,
pap
er a
nd
serv
ices
Man
ufac
turin
g 5
.1
236
3
57
893
0.3
0.
10.
20.
6 8
17
6...
...
0.2
6 0.
151.
883.
03
8 F
uel p
rodu
cts
Nat
ural
re
sour
ces
3.7
4
16
384
26
0.0
0.
00.
0 0
.0
34
1851
22.
4 19
9.5
0.7
6 0.
051.
785.
20
9 C
hem
ical
pro
duct
sM
anuf
actu
ring
9.0
5
01
1,0
84
1,93
0 0
.3
0.2
0.3
1.7
4
4 54
124
30.
4 25
.7 0
.23
0.06
1.78
2.92
10
Rubb
er a
nd p
last
ics
Man
ufac
turin
g 9
.2
87
231
41
6 0
.2
0.1
0.1
0.2
1
8 63
165
18.7
38
.7 0
.18
0.03
1.86
3.13
11
Oth
er n
on-m
etal
lic
min
eral
Man
ufac
turin
g 7
.2
151
5
61
1,47
0 0
.6
0.4
0.8
0.4
1
7 58
89 ..
. ...
0.2
9 0.
071.
802.
55
12
Met
al p
rodu
cts
Man
ufac
turin
g 5
.7
455
1
,387
3,
298
0.3
0.
50.
4 0
.1 1
2 86
134
32.4
26
.8 0
.08
0.07
2.02
3.21
13
Non
-ele
ctric
al
mac
hine
ryM
anuf
actu
ring
8.0
8
1 6
9 11
3 0
.4
0.1
0.1
0.2
3
52
37 1
4.4
11.4
0.0
2 0.
012.
133.
92
14
Elec
trica
l, sp
ecia
lized
eq
uipm
ent
Man
ufac
turin
g 9
.7
86
696
42
3 0
.1
0.1
0.1
0.3
7
31
57 ..
. ...
0.01
0.
032.
133.
64
15
Tran
spor
t eq
uipm
ent
Man
ufac
turin
g 6
.7
31
710
26
5 0
.2
0.0
0.1
0.2
0
64
113
...
... 0
.00
0.08
1.61
3.68
16
Man
ufac
turin
g, n
ecM
anuf
actu
ring
4.9
1
8 3
42
432
1.2
1.
52.
2 0
.3
3
328
918
17.
8 10
.1 0
.04
0.04
1.86
4.71
17
Elec
trici
ty, g
as a
nd
wat
erIn
frast
ruct
ure
serv
ice
7.1
5
77
1,0
98
2,82
1 0
.3
0.2
0.3
1.0
0
0
... 9
6.9
139.
8 0
.28
0.75
1.34
1.82
18
Cons
truct
ion
Cons
truct
ion
7.6
3
,575
8
,483
13
,929
3.0
4.
43.
7 3
.5
10
2724
71.3
80
.4 1
.18
0.49
1.85
2.54
19M
otor
vehi
cles
tra
de, s
ervi
ces
Busin
ess
serv
ices
...10
911
318
40.
70.
30.
40.
29
0...
6.9
6.1
0.39
0.03
1.11
2.41
cont
inue
d on
nex
t pag
e
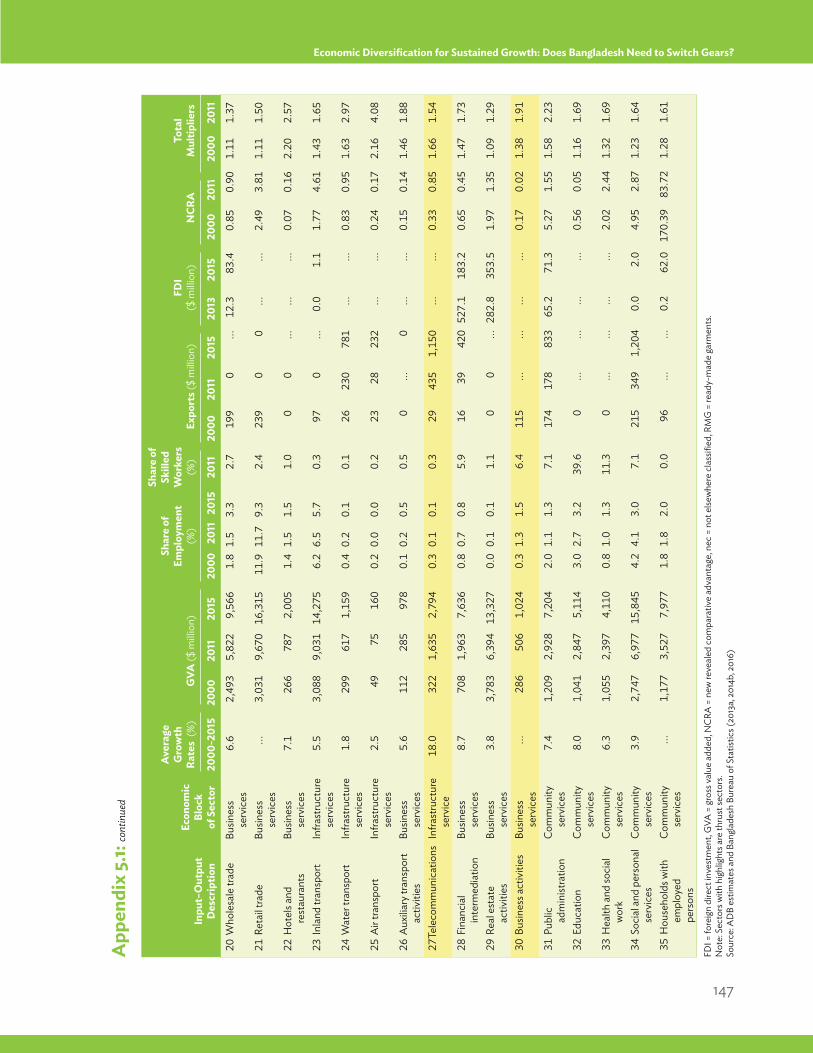
147
Economic Diversification for Sustained Growth: Does Bangladesh Need to Switch Gears?
FDI =
fore
ign
dire
ct in
vest
men
t, G
VA =
gros
s val
ue a
dded
, NCR
A =
new
reve
aled
com
para
tive
adva
ntag
e, n
ec =
not
else
whe
re c
lass
ified
, RM
G =
read
y-m
ade
garm
ents
. N
ote:
Sec
tors
with
hig
hlig
hts a
re th
rust
sect
ors.
Sour
ce: A
DB
estim
ates
and
Ban
glad
esh
Bure
au o
f Sta
tistic
s (20
13a,
201
4b, 2
016)
Inpu
t–O
utpu
t D
escr
iptio
n
Econ
omic
Bl
ock
of S
ecto
r
Aver
age
Gro
wth
Ra
tes
(%)
GVA
($ m
illion
)
Shar
e of
Em
ploy
men
t (%
)
Shar
e of
Sk
illed
W
orke
rs
(%)
Expo
rts (
$ m
illion
)FD
I ($
milli
on)
NCR
ATo
tal
Mul
tiplie
rs
2000
-201
520
0020
1120
1520
0020
1120
1520
1120
0020
1120
1520
1320
1520
0020
1120
0020
11 2
0 W
hole
sale
trad
eBu
sines
s se
rvic
es6.
6 2
,493
5,8
22
9,56
6 1
.8 1
.53.
3 2
.7
199
0
...12
.3
83.4
0.8
50.
901.
111.
37
21
Reta
il tra
deBu
sines
s se
rvic
es...
3,03
19,
670
16,3
1511
.911
.79.
32.
423
90
0...
...2.
493.
811.
111.
50
22
Hot
els a
nd
rest
aura
nts
Busin
ess
serv
ices
7.1
266
787
2,00
51.
41.
51.
51.
00
0...
......
0.07
0.16
2.20
2.57
23
Inla
nd tr
ansp
ort
Infra
stru
ctur
e se
rvic
es5.
53,
088
9,03
114
,275
6.2
6.5
5.7
0.3
970
...0.
01.
11.
774.
611.
431.
65
24
Wat
er tr
ansp
ort
Infra
stru
ctur
e se
rvic
es1.
829
961
71,
159
0.4
0.2
0.1
0.1
2623
078
1...
...0.
830.
951.
632.
97
25
Air
trans
port
Infra
stru
ctur
e se
rvic
es2.
549
7516
00.
20.
00.
00.
223
2823
2...
...0.
240.
172.
164.
08
26
Aux
iliary
tran
spor
t ac
tiviti
esBu
sines
s se
rvic
es5.
611
228
597
80.
10.
20.
50.
50
...0
......
0.15
0.14
1.46
1.88
27 T
elec
omm
unic
atio
nsIn
frast
ruct
ure
serv
ice
18.0
322
1,63
52,
794
0.3
0.1
0.1
0.3
2943
51,
150
......
0.33
0.85
1.66
1.54
28
Fina
ncia
l in
term
edia
tion
Busin
ess
serv
ices
8.7
708
1,96
37,
636
0.8
0.7
0.8
5.9
1639
420
527.
118
3.2
0.65
0.45
1.47
1.73
29
Real
est
ate
activ
ities
Busin
ess
serv
ices
3.8
3,78
36,
394
13,3
270.
00.
10.
11.
10
0...
282.
835
3.5
1.97
1.35
1.09
1.29
30
Busin
ess a
ctiv
ities
Busin
ess
serv
ices
...28
650
61,
024
0.3
1.3
1.5
6.4
115
......
......
0.17
0.02
1.38
1.91
31
Publ
ic
adm
inist
ratio
nCo
mm
unity
se
rvic
es7.
41,
209
2,92
87,
204
2.0
1.1
1.3
7.1
174
178
833
65.2
71.3
5.27
1.55
1.58
2.23
32
Educ
atio
nCo
mm
unity
se
rvic
es8.
01,
041
2,84
75,
114
3.0
2.7
3.2
39.6
0...
......
...0.
560.
051.
161.
69
33
Hea
lth a
nd so
cial
w
ork
Com
mun
ity
serv
ices
6.3
1,05
52,
397
4,11
00.
81.
01.
311
.30
......
......
2.02
2.44
1.32
1.69
34
Soci
al a
nd p
erso
nal
serv
ices
Com
mun
ity
serv
ices
3.9
2,74
76,
977
15,8
454.
24.
13.
07.
121
534
91,
204
0.0
2.0
4.95
2.87
1.23
1.64
35
Hou
seho
lds w
ith
empl
oyed
pe
rson
s
Com
mun
ity
serv
ices
...1,
177
3,52
77,
977
1.8
1.8
2.0
0.0
96...
...0.
262
.017
0.39
83.7
21.
281.
61
App
endi
x 5.
1: co
ntin
ued
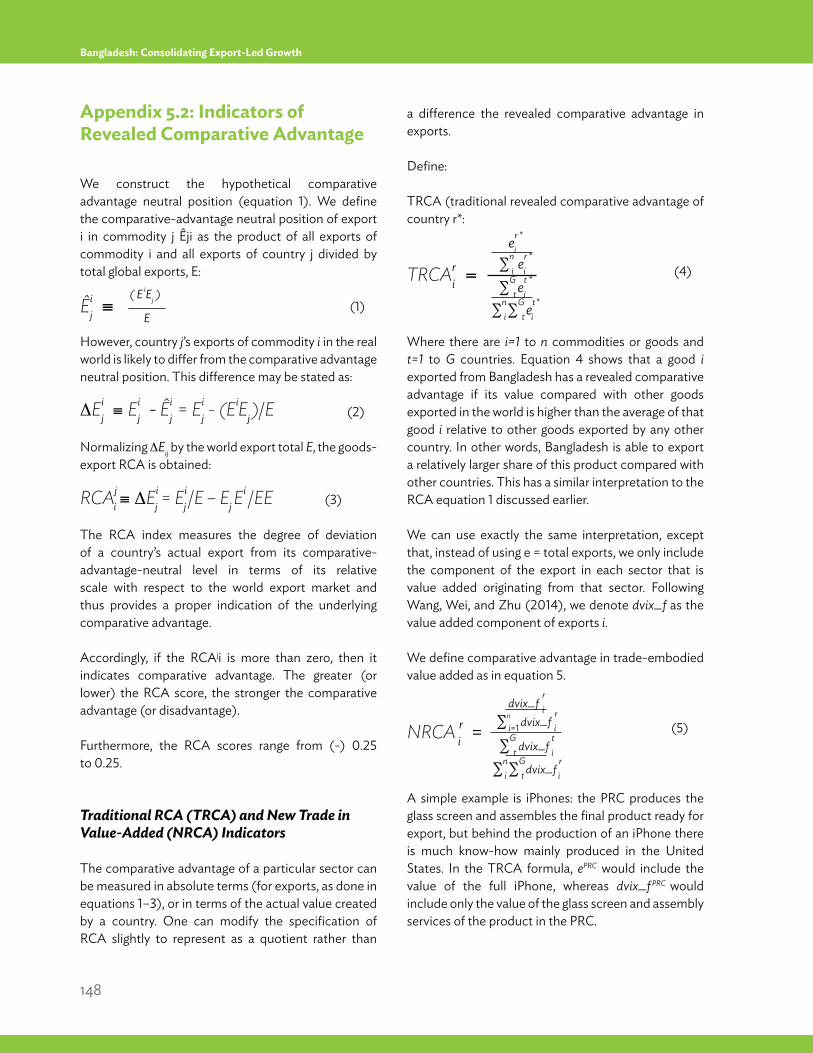
148
Bangladesh: Consolidating Export-Led Growth
Appendix 5.2: Indicators of Revealed Comparative Advantage
We construct the hypothetical comparative advantage neutral position (equation 1). We define the comparative-advantage neutral position of export i in commodity j Êji as the product of all exports of commodity i and all exports of country j divided by total global exports, E:
(1)
However, country j’s exports of commodity i in the real world is likely to differ from the comparative advantage neutral position. This difference may be stated as:
(2)
Normalizing Eij by the world export total E, the goods-export RCA is obtained:
RCAji Ei
j = Eij /E – Ej E
i /EE (3)
The RCA index measures the degree of deviation of a country’s actual export from its comparative-advantage-neutral level in terms of its relative scale with respect to the world export market and thus provides a proper indication of the underlying comparative advantage.
Accordingly, if the RCAji is more than zero, then it indicates comparative advantage. The greater (or lower) the RCA score, the stronger the comparative advantage (or disadvantage).
Furthermore, the RCA scores range from (-) 0.25 to 0.25.
Traditional RCA (TRCA) and New Trade in Value-Added (NRCA) Indicators
The comparative advantage of a particular sector can be measured in absolute terms (for exports, as done in equations 1–3), or in terms of the actual value created by a country. One can modify the specification of RCA slightly to represent as a quotient rather than
a difference the revealed comparative advantage in exports.
Define:
TRCA (traditional revealed comparative advantage of country r*:
(4)
Where there are i=1 to n commodities or goods and t=1 to G countries. Equation 4 shows that a good i exported from Bangladesh has a revealed comparative advantage if its value compared with other goods exported in the world is higher than the average of that good i relative to other goods exported by any other country. In other words, Bangladesh is able to export a relatively larger share of this product compared with other countries. This has a similar interpretation to the RCA equation 1 discussed earlier.
We can use exactly the same interpretation, except that, instead of using e = total exports, we only include the component of the export in each sector that is value added originating from that sector. Following Wang, Wei, and Zhu (2014), we denote dvix_f as the value added component of exports i.
We define comparative advantage in trade-embodied value added as in equation 5.
(5)
A simple example is iPhones: the PRC produces the glass screen and assembles the final product ready for export, but behind the production of an iPhone there is much know-how mainly produced in the United States. In the TRCA formula, ePRC would include the value of the full iPhone, whereas dvix_f PRC would include only the value of the glass screen and assembly services of the product in the PRC.
Êij
( E iEj )
E
TRCAri
er *i
ni e
r *i
Gt e
t *i
ni
Gt e
t *i
NRCA ri =n
i=1 dvix_f r i
Gt dvix_f
t i
ni
Gt dvix_f
r i
dvix_f r i
Eij Ei
j - Êij = Ei
j - (Ei Ej )/E
149
Economic Diversification for Sustained Growth: Does Bangladesh Need to Switch Gears?
Appendix 5.3: Input-Output Linkages and the Export Potential of an Economic Sector
Input-output tables depict the interactions among industrial and institutional sectors of an economy. They can be used to study the linkages between traded and nontraded sectors and analyze possible intersectoral spillovers. They do so even intertemporally and interspatially, depending on data availability. A variety of econometric, statistical, and mathematical methods can be applied to study various factors and facets of an economy, and to understand its functioning and evolution. To understand how a particular productive sector evolves to become a significant exporting one, it is necessary to study its role in the domestic economy, even before it became an exporter. The analyses presented in section 5.2 only allowed us to understand the competitiveness of a particular sector in its role as an exporter.
To make inferences about the development of new sectors in the domestic economy, we need to understand how a particular sector responds to changes in demand; for its products and the products of other sectors. In particular, we are interested in examining how the manufacturing sector in some countries changed over time and whether it has helped induce growth of other, possibly nontradable sectors (a “spillover” effect). If this is not happening, it could be due to factors such as distortive price policies, macroeconomic instability, and underdeveloped institutions.
Indeed, using the input-output tables of a whole set of countries, Bartelme and Gorodnichenko (2015) document a strong and robust relationship between the strength of industry linkages and aggregate productivity. They find that distortions—which act as taxes on revenue or intermediate input usage—reduce the multiplier effect of the input-output linkages. In other words, government intervention can affect the pull or push effect of intermediate demand. This
makes statistics based on the input-output entries potentially powerful indicators of the presence of distortions in the economy.
In this analysis, we are not able to directly explain why some linkages are stronger than others and even less whether they are due to policy distortions. Within an economy, the linkages are determined by the most cost-efficient production technology specific to an industry and product. However, if the policies are effective and some of the basic elements of an “economic ecosystem” are in place,49 it should be the case that innovative sectors can develop and eventually penetrate export markets. The analysis also illustrates how quickly an economy has been developing and transforming structurally during the decade, with each sector increasing its contribution to the economy by increasingly participating in the production processes of other industries or sectors.
Given that the NRCA indexes point to the concentration of export-oriented activities only in a few sectors, it could be inferred that some economic ecosystems or clusters, however basic, have been developing, and possibly maturing, to serve evolving domestic economic needs. However, the cusp point of the development process at which the focal sectors of these ecosystems or clusters could break into the global market and take part in global value chains still needs to be determined by a comparative study of countries that successfully take part in various international production sharing arrangements.
The economy is divided into the 35 sectors from the World Input-Output Data Tables database, except that the sectors are ordered according to how “tradable” they are: agriculture and natural resources are listed first, then manufacturing, the key sector at this juncture of Bangladesh’s economic development, and finally, services. In turn, manufacturing activities are ranked according to the sophistication of the goods produced as defined by the Economic Complexity Index of Hidalgo and Hausmann (2009).50 The services are divided into two types: supporting infrastructure such
____________________49 A country may need to have the right conditions to develop innovative sectors: good “infrastructure” for education, transport (land, air and water), utilities, the
legal framework (rule of law), stable governance, and so on. Only then can it attempt to gain comparative advantage by developing the most cost-efficient and competitive production processes (in quality of output).
50 The Economic Complexity Index, developed by Hidalgo and Hausmann (2009), is a holistic measure of the production characteristics of a large economic system (either a country, a sector or a product). The index combines metrics of the diversity of countries and the ubiquity of products to create measures of the relative complexity of a country’s exports.
150
Bangladesh: Consolidating Export-Led Growth
as transport and telecommunications, and so-called “business services,” which include the financial sector, real estate, wholesale and retail trade, rental and leasing of machinery and equipment, and other business activities. Activities of the labor force engaged in professional services likely are related to the supplies of these sectors. Finally, government and community services, including education, are listed at the end given that, generally speaking, public services provide support to the productive sector only indirectly.
Consider a unit value change in the demand for the products of each sector (demand shock). So as to respond to that shock, the output of the sector in consideration as well as that of other sectors that supply it will change. Let’s take “textile and textile products,” labeled “TRMG” (which includes ready-made garments). There could be two extreme supply-use scenarios. Either it only demands intermediate inputs from itself, or it demands from every single sector of the economy an equal amount.
The extent of inter-industry demand, of course, does not necessarily have any discernible direct relationship to the growth of the value added or export potential of the sector, although demand links could eventually stimulate growth in the recipient sector. However, if one sector depends on some other sectors for supplies, and these sectors in turn increase their demand for other sectors’ products, domestic output will increase. Such supply-and-use or input-output links and the exploitation of the potential for such linkages could set the stage for a faster and dynamic structural transformation in the local economy, and could perhaps lead to greater diversification.
To link to the discussion in section 5.1, initially a nascent sector like RMG is likely to have only basic linkages to a few other manufacturing sectors (its suppliers), as well as transport and trade services. However, an economic ecosystem is likely to develop to support the RMG sector. With new investments and without policy or institutional distortions, other similar manufacturing sectors will begin to develop to take advantage of the ecosystem and the business opportunities it presents.
Further, as the economy develops, it is possible that even a business services sector such as renting of transport equipment, which at first mostly caters to the RMG sector, will also begin to develop and mature. It could then end its dependence, say, on RMG in particular and manufacturing in general, and establish its own forward and backward linkages with other sectors—including the external sector. Moreover, the country could establish new services to support exports directly and indirectly, and develop a revealed comparative advantage in certain portions of a global value chain but without directly exporting a product (as measured by NRCA in equation 5).
The representation of the Bangladesh economy in the dot plot matrixes (Figure A5.3.) illustrates patterns for 2000, 2006, and 2011. However, we need an indicator to represent the degree to which an economy creates backward and forward linkages among its sectors. For example, assume that RMG demands machinery repair services. Over time, if these services expand to provide machinery repair to other sectors in manufacturing, the economy would then have experienced some level of structural transformation. We develop a so-called “Index of Agglomeration” to measure the extent of the inter-sectoral linkages in the economy. It is somewhat similar to Fadinger, Ghiglino, and Teteryatnikova (2015), except that we try to differentiate between productive tradable sectors and nontradable or services sectors.51 We also disaggregate the analysis by major activity, taking into account the fact that productive sectors like manufacturing and agriculture are more likely to export directly than services such as finance and repair. Of course, at a level of aggregation of 35 sectors per economy, there are many interactions within the sector that cannot be captured, particularly those that may arise from high specialization.
We define a backward multiplier of sector i, as the impact of a unit value increase in the demand of sector i ’s product on all sectors of the economy; and a forward multiplier as the impact on the output of sector i of a unit value increase in the demand for the products of each of the sectors in the economy. It therefore measures the strength of a sector’s links to other
____________________51 Fadinger, Ghiglino, and Teteryatnikovax (2015) find that poor countries have more extreme distributions of input-output multipliers than rich economies:
there are a few high-multiplier sectors, while most sectors have very low multipliers; in contrast, rich countries have more sectors with intermediate multipliers. Moreover, the correlations of these with productivities and tax rates are positive in poor countries and negative in rich ones.
151
Economic Diversification for Sustained Growth: Does Bangladesh Need to Switch Gears?
sectors. A high multiplier may reflect quite complex and extensive spillovers, or simply a high degree of vertical integration. For the economy as a whole, large spillovers within a given sector would be represented as a high multiplier value along the diagonal of the Leontief Inverse or the total requirement matrix. A more formal exposition of these concepts is provided in 2015 ADB Key Indicators Part IV: Global Value Chains Indicators for International Production Sharing.
The following observations can be made about Bangladesh:
The highest demand for intermediate inputs comes from its own sector (to produce garments, one requires textiles). Unlike Fadinger, Ghiglino, and Teteryatnikova (2015), it is possible that a sector with a low backward multiplier may still be important, say, because it has a comparative advantage in the value added that it creates for another exportable product. This product may be imported into the economy, processed in some way and then exported. The process under which real value added is created may be strongly linked to the external economy but not at all to the domestic economy (for example, an export processing enclave such as RMG).
Inter-industry demand linkages in Bangladesh do not seem to evolve significantly through time, and changes seen in the multipliers are rather insignificant. Manufacturing, for example, did not create substantial backward linkages with supporting sectors (other than with itself). Indeed, we find that when RMG demand increases, only demand for products of the sector and those of “government and community services” increase through backward linkages. Few sectors come out as strong in the effect on the wider economy of a change in the final demand of a sector’s product.
The results are consistent with recent studies, particularly using input-output tables. First, we find that agriculture tends to have low multipliers and weaker links with sectors than manufacturing does. This is particularly true for the case of backward linkages with supporting services such as trade and telecommunications. Second, as mentioned earlier, the “textiles and garment products” sector does not necessarily seem to be creating more linkages with other domestic sectors, but instead is concentrating more by strengthening intrasector dependencies. Nonetheless, its competitiveness in the global market as measured by the NRCA continues to be high and rises throughout the 3 years analyzed (2000, 2006, and 2011).
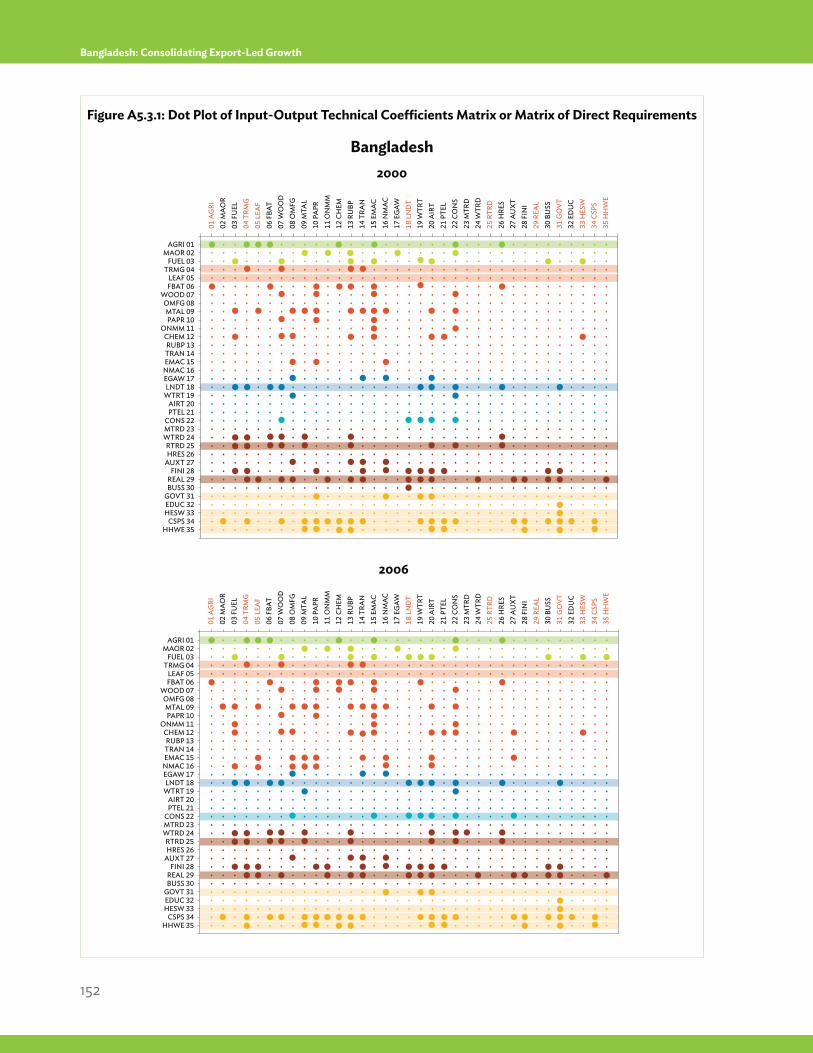
152
Bangladesh: Consolidating Export-Led Growth
Figure A5.3.1: Dot Plot of Input-Output Technical Coefficients Matrix or Matrix of Direct Requirements
2000
Bangladesh
2006
AGRI 01MAOR 02
FUEL 03TRMG 04
LEAF 05FBAT 06
WOOD 07OMFG 08MTAL 09PAPR 10
ONMM 11CHEM 12RUBP 13TRAN 14EMAC 15
NMAC 16EGAW 17LNDT 18
WTRT 19AIRT 20PTEL 21
CONS 22MTRD 23WTRD 24RTRD 25HRES 26
AUXT 27FINI 28
REAL 29BUSS 30
GOVT 31EDUC 32HESW 33
CSPS 34HHWE 35
01 A
GRI
02
MAO
R03
FU
EL
04 T
RMG
05
LEA
F 06
FBA
T 07
WO
OD
08
OM
FG
09 M
TAL
10 P
APR
11
ON
MM
12
CH
EM
13 R
UBP
14
TRA
N
15 E
MAC
16
NM
AC
17 E
GAW
18
LN
DT
19 W
TRT
20 A
IRT
21 P
TEL
22 C
ON
S 23
MTR
D
24 W
TRD
25
RTR
D
26 H
RES
27 A
UX
T 28
FIN
I 29
REA
L 30
BU
SS
31 G
OVT
32
ED
UC
33 H
ESW
34
CSP
S 35
HH
WE
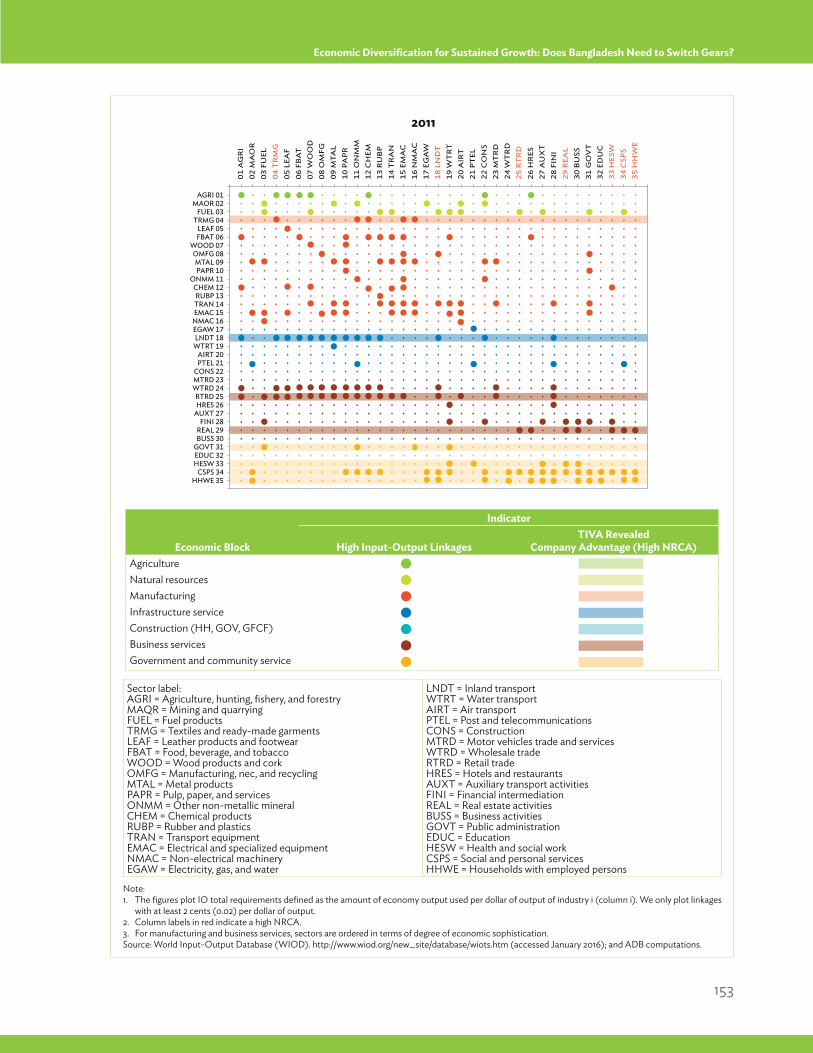
153
Economic Diversification for Sustained Growth: Does Bangladesh Need to Switch Gears?
Economic Block
Indicator
High Input-Output LinkagesTIVA Revealed
Company Advantage (High NRCA)AgricultureNatural resourcesManufacturingInfrastructure serviceConstruction (HH, GOV, GFCF)Business servicesGovernment and community service
2011
Note: 1. The figures plot IO total requirements defined as the amount of economy output used per dollar of output of industry i (column i). We only plot linkages
with at least 2 cents (0.02) per dollar of output.2. Column labels in red indicate a high NRCA.3. For manufacturing and business services, sectors are ordered in terms of degree of economic sophistication.Source: World Input-Output Database (WIOD). http://www.wiod.org/new_site/database/wiots.htm (accessed January 2016); and ADB computations.
Sector label:AGRI = Agriculture, hunting, fishery, and forestryMAQR = Mining and quarryingFUEL = Fuel productsTRMG = Textiles and ready-made garmentsLEAF = Leather products and footwearFBAT = Food, beverage, and tobaccoWOOD = Wood products and corkOMFG = Manufacturing, nec, and recyclingMTAL = Metal productsPAPR = Pulp, paper, and servicesONMM = Other non-metallic mineralCHEM = Chemical productsRUBP = Rubber and plasticsTRAN = Transport equipmentEMAC = Electrical and specialized equipmentNMAC = Non-electrical machineryEGAW = Electricity, gas, and water
LNDT = Inland transportWTRT = Water transportAIRT = Air transportPTEL = Post and telecommunicationsCONS = ConstructionMTRD = Motor vehicles trade and servicesWTRD = Wholesale tradeRTRD = Retail tradeHRES = Hotels and restaurantsAUXT = Auxiliary transport activitiesFINI = Financial intermediationREAL = Real estate activitiesBUSS = Business activitiesGOVT = Public administrationEDUC = EducationHESW = Health and social workCSPS = Social and personal servicesHHWE = Households with employed persons
AGRI 01MAOR 02
FUEL 03TRMG 04
LEAF 05FBAT 06
WOOD 07OMFG 08MTAL 09PAPR 10
ONMM 11CHEM 12RUBP 13TRAN 14EMAC 15
NMAC 16EGAW 17LNDT 18
WTRT 19AIRT 20PTEL 21
CONS 22MTRD 23WTRD 24RTRD 25HRES 26
AUXT 27FINI 28
REAL 29BUSS 30
GOVT 31EDUC 32HESW 33
CSPS 34HHWE 35
01 A
GR
I 02
MA
OR
03 F
UEL
04
TR
MG
05
LEA
F 06
FB
AT
07
WO
OD
08
OM
FG
09 M
TAL
10 P
APR
11
ON
MM
12
CH
EM
13 R
UB
P 14
TR
AN
15
EM
AC
16
NM
AC
17
EG
AW
18
LN
DT
19
WT
RT
20
AIR
T
21 P
TEL
22
CO
NS
23 M
TR
D
24 W
TR
D
25 R
TR
D
26 H
RES
27
AU
XT
28
FIN
I 29
REA
L 30
BU
SS
31 G
OV
T
32 E
DU
C
33 H
ESW
34
CSP
S 35
HH
WE
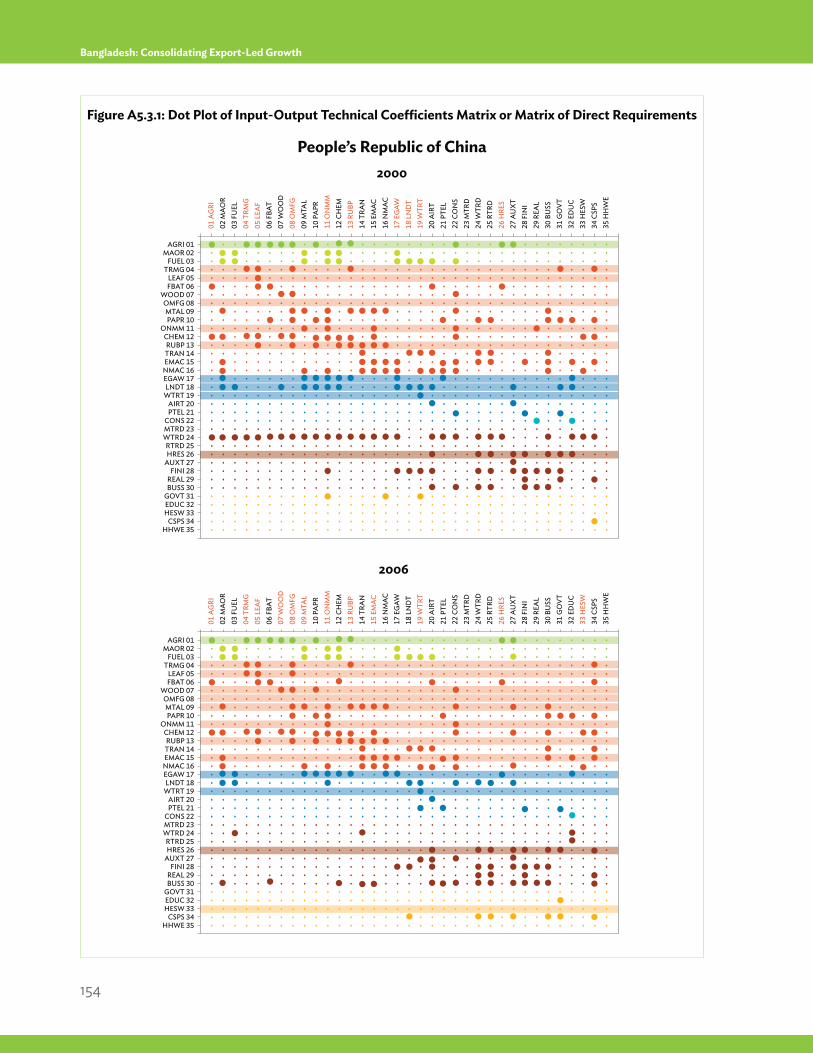
154
Bangladesh: Consolidating Export-Led Growth
Figure A5.3.1: Dot Plot of Input-Output Technical Coefficients Matrix or Matrix of Direct Requirements
2000
People’s Republic of China
2006
AGRI 01MAOR 02
FUEL 03TRMG 04
LEAF 05FBAT 06
WOOD 07OMFG 08MTAL 09PAPR 10
ONMM 11CHEM 12RUBP 13TRAN 14EMAC 15
NMAC 16EGAW 17LNDT 18
WTRT 19AIRT 20PTEL 21
CONS 22MTRD 23WTRD 24RTRD 25HRES 26
AUXT 27FINI 28
REAL 29BUSS 30
GOVT 31EDUC 32HESW 33
CSPS 34HHWE 35
01 A
GRI
02
MAO
R03
FU
EL
04 T
RMG
05
LEA
F 06
FBA
T 07
WO
OD
08
OM
FG
09 M
TAL
10 P
APR
11
ON
MM
12
CH
EM
13 R
UBP
14
TRA
N
15 E
MAC
16
NM
AC
17 E
GAW
18
LN
DT
19 W
TRT
20 A
IRT
21 P
TEL
22 C
ON
S 23
MTR
D
24 W
TRD
25
RTR
D
26 H
RES
27 A
UX
T 28
FIN
I 29
REA
L 30
BU
SS
31 G
OVT
32
ED
UC
33 H
ESW
34
CSP
S 35
HH
WE
AGRI 01MAOR 02
FUEL 03TRMG 04
LEAF 05FBAT 06
WOOD 07OMFG 08MTAL 09PAPR 10
ONMM 11CHEM 12RUBP 13TRAN 14EMAC 15
NMAC 16EGAW 17LNDT 18
WTRT 19AIRT 20PTEL 21
CONS 22MTRD 23WTRD 24RTRD 25HRES 26
AUXT 27FINI 28
REAL 29BUSS 30
GOVT 31EDUC 32HESW 33
CSPS 34HHWE 35
01 A
GRI
02
MAO
R03
FU
EL
04 T
RMG
05
LEA
F 06
FBA
T 07
WO
OD
08
OM
FG
09 M
TAL
10 P
APR
11
ON
MM
12
CH
EM
13 R
UBP
14
TRA
N
15 E
MAC
16
NM
AC
17 E
GAW
18
LN
DT
19 W
TRT
20 A
IRT
21 P
TEL
22 C
ON
S 23
MTR
D
24 W
TRD
25
RTR
D
26 H
RES
27 A
UX
T 28
FIN
I 29
REA
L 30
BU
SS
31 G
OVT
32
ED
UC
33 H
ESW
34
CSP
S 35
HH
WE
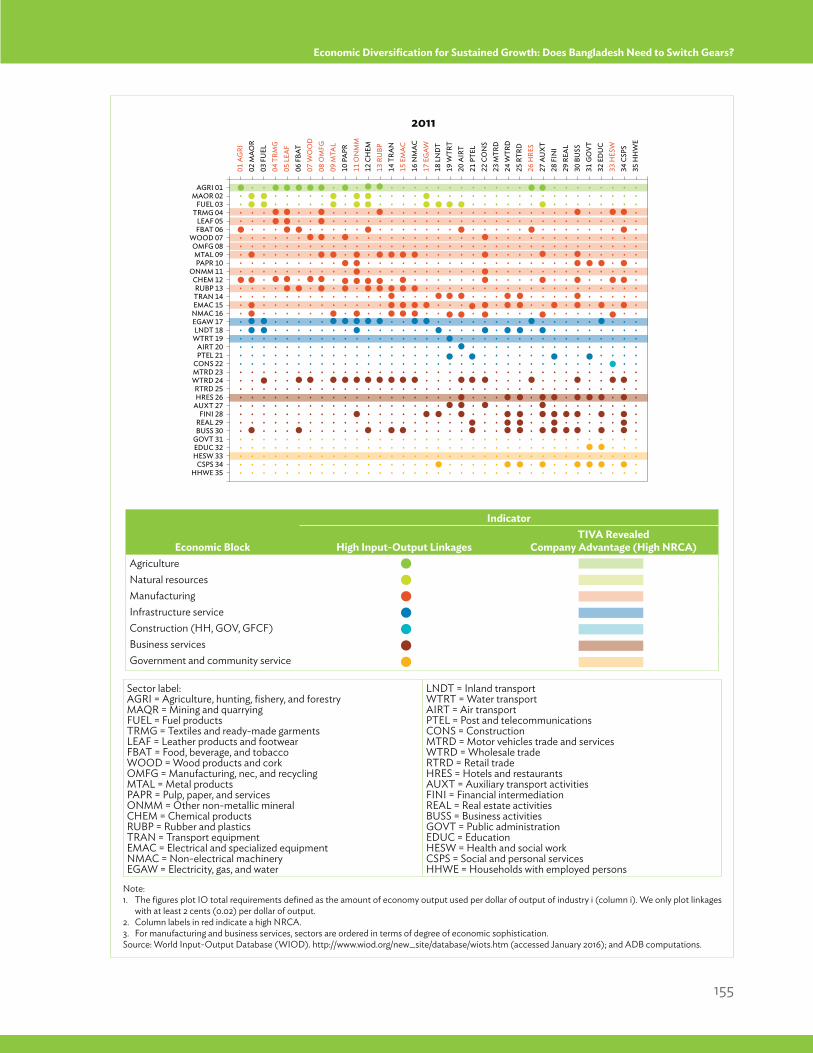
155
Economic Diversification for Sustained Growth: Does Bangladesh Need to Switch Gears?
2011
AGRI 01MAOR 02
FUEL 03TRMG 04
LEAF 05FBAT 06
WOOD 07OMFG 08MTAL 09PAPR 10
ONMM 11CHEM 12RUBP 13TRAN 14EMAC 15
NMAC 16EGAW 17LNDT 18
WTRT 19AIRT 20PTEL 21
CONS 22MTRD 23WTRD 24RTRD 25HRES 26
AUXT 27FINI 28
REAL 29BUSS 30
GOVT 31EDUC 32HESW 33
CSPS 34HHWE 35
01 A
GRI
02
MAO
R03
FU
EL
04 T
RMG
05
LEA
F 06
FBA
T 07
WO
OD
08
OM
FG
09 M
TAL
10 P
APR
11
ON
MM
12
CH
EM
13 R
UBP
14
TRA
N
15 E
MAC
16
NM
AC
17 E
GAW
18
LN
DT
19 W
TRT
20 A
IRT
21 P
TEL
22 C
ON
S 23
MTR
D
24 W
TRD
25
RTR
D
26 H
RES
27 A
UX
T 28
FIN
I 29
REA
L 30
BU
SS
31 G
OVT
32
ED
UC
33 H
ESW
34
CSP
S 35
HH
WE
Economic Block
Indicator
High Input-Output LinkagesTIVA Revealed
Company Advantage (High NRCA)AgricultureNatural resourcesManufacturingInfrastructure serviceConstruction (HH, GOV, GFCF)Business servicesGovernment and community service
Note: 1. The figures plot IO total requirements defined as the amount of economy output used per dollar of output of industry i (column i). We only plot linkages
with at least 2 cents (0.02) per dollar of output.2. Column labels in red indicate a high NRCA.3. For manufacturing and business services, sectors are ordered in terms of degree of economic sophistication.Source: World Input-Output Database (WIOD). http://www.wiod.org/new_site/database/wiots.htm (accessed January 2016); and ADB computations.
Sector label:AGRI = Agriculture, hunting, fishery, and forestryMAQR = Mining and quarryingFUEL = Fuel productsTRMG = Textiles and ready-made garmentsLEAF = Leather products and footwearFBAT = Food, beverage, and tobaccoWOOD = Wood products and corkOMFG = Manufacturing, nec, and recyclingMTAL = Metal productsPAPR = Pulp, paper, and servicesONMM = Other non-metallic mineralCHEM = Chemical productsRUBP = Rubber and plasticsTRAN = Transport equipmentEMAC = Electrical and specialized equipmentNMAC = Non-electrical machineryEGAW = Electricity, gas, and water
LNDT = Inland transportWTRT = Water transportAIRT = Air transportPTEL = Post and telecommunicationsCONS = ConstructionMTRD = Motor vehicles trade and servicesWTRD = Wholesale tradeRTRD = Retail tradeHRES = Hotels and restaurantsAUXT = Auxiliary transport activitiesFINI = Financial intermediationREAL = Real estate activitiesBUSS = Business activitiesGOVT = Public administrationEDUC = EducationHESW = Health and social workCSPS = Social and personal servicesHHWE = Households with employed persons
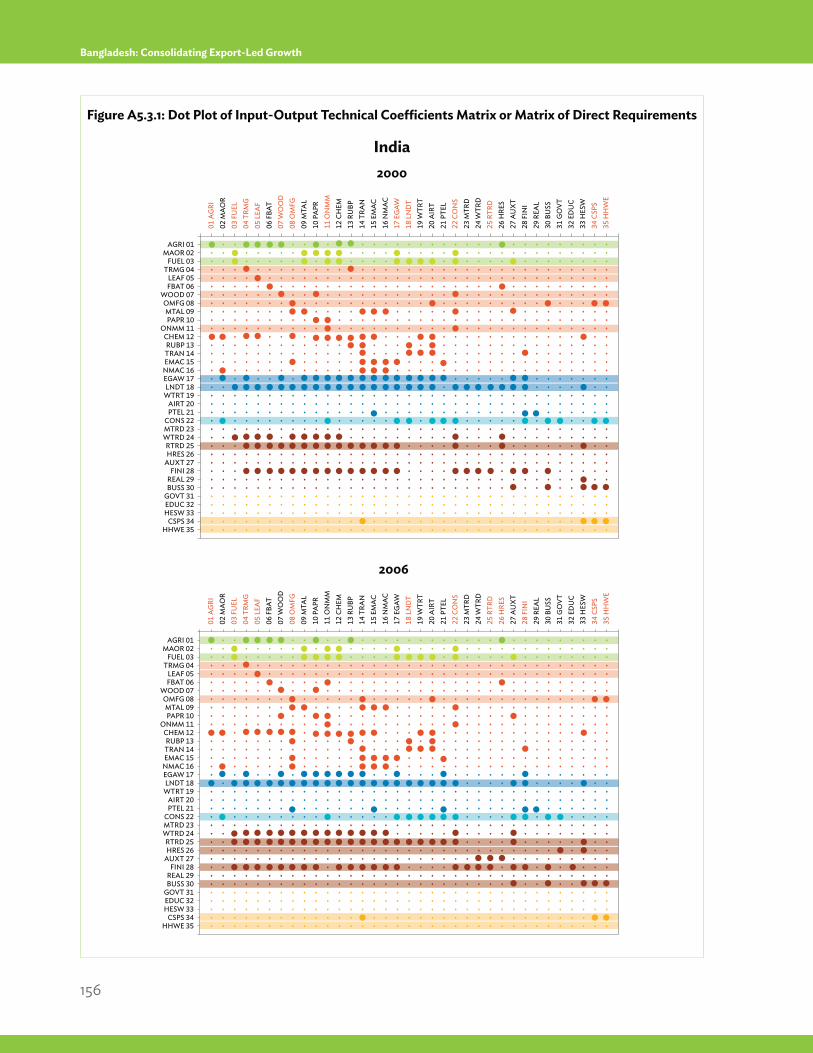
156
Bangladesh: Consolidating Export-Led Growth
Figure A5.3.1: Dot Plot of Input-Output Technical Coefficients Matrix or Matrix of Direct Requirements
2000
India
2006
AGRI 01MAOR 02
FUEL 03TRMG 04
LEAF 05FBAT 06
WOOD 07OMFG 08MTAL 09PAPR 10
ONMM 11CHEM 12RUBP 13TRAN 14EMAC 15
NMAC 16EGAW 17LNDT 18
WTRT 19AIRT 20PTEL 21
CONS 22MTRD 23WTRD 24RTRD 25HRES 26
AUXT 27FINI 28
REAL 29BUSS 30
GOVT 31EDUC 32HESW 33
CSPS 34HHWE 35
01 A
GRI
02
MAO
R03
FU
EL
04 T
RMG
05
LEA
F 06
FBA
T 07
WO
OD
08
OM
FG
09 M
TAL
10 P
APR
11
ON
MM
12
CH
EM
13 R
UBP
14
TRA
N
15 E
MAC
16
NM
AC
17 E
GAW
18
LN
DT
19 W
TRT
20 A
IRT
21 P
TEL
22 C
ON
S 23
MTR
D
24 W
TRD
25
RTR
D
26 H
RES
27 A
UX
T 28
FIN
I 29
REA
L 30
BU
SS
31 G
OVT
32
ED
UC
33 H
ESW
34
CSP
S 35
HH
WE
AGRI 01MAOR 02
FUEL 03TRMG 04
LEAF 05FBAT 06
WOOD 07OMFG 08MTAL 09PAPR 10
ONMM 11CHEM 12RUBP 13TRAN 14EMAC 15
NMAC 16EGAW 17LNDT 18
WTRT 19AIRT 20PTEL 21
CONS 22MTRD 23WTRD 24RTRD 25HRES 26
AUXT 27FINI 28
REAL 29BUSS 30
GOVT 31EDUC 32HESW 33
CSPS 34HHWE 35
01 A
GRI
02
MAO
R03
FU
EL
04 T
RMG
05
LEA
F 06
FBA
T 07
WO
OD
08
OM
FG
09 M
TAL
10 P
APR
11
ON
MM
12
CH
EM
13 R
UBP
14
TRA
N
15 E
MAC
16
NM
AC
17 E
GAW
18
LN
DT
19 W
TRT
20 A
IRT
21 P
TEL
22 C
ON
S 23
MTR
D
24 W
TRD
25
RTR
D
26 H
RES
27 A
UX
T 28
FIN
I 29
REA
L 30
BU
SS
31 G
OVT
32
ED
UC
33 H
ESW
34
CSP
S 35
HH
WE
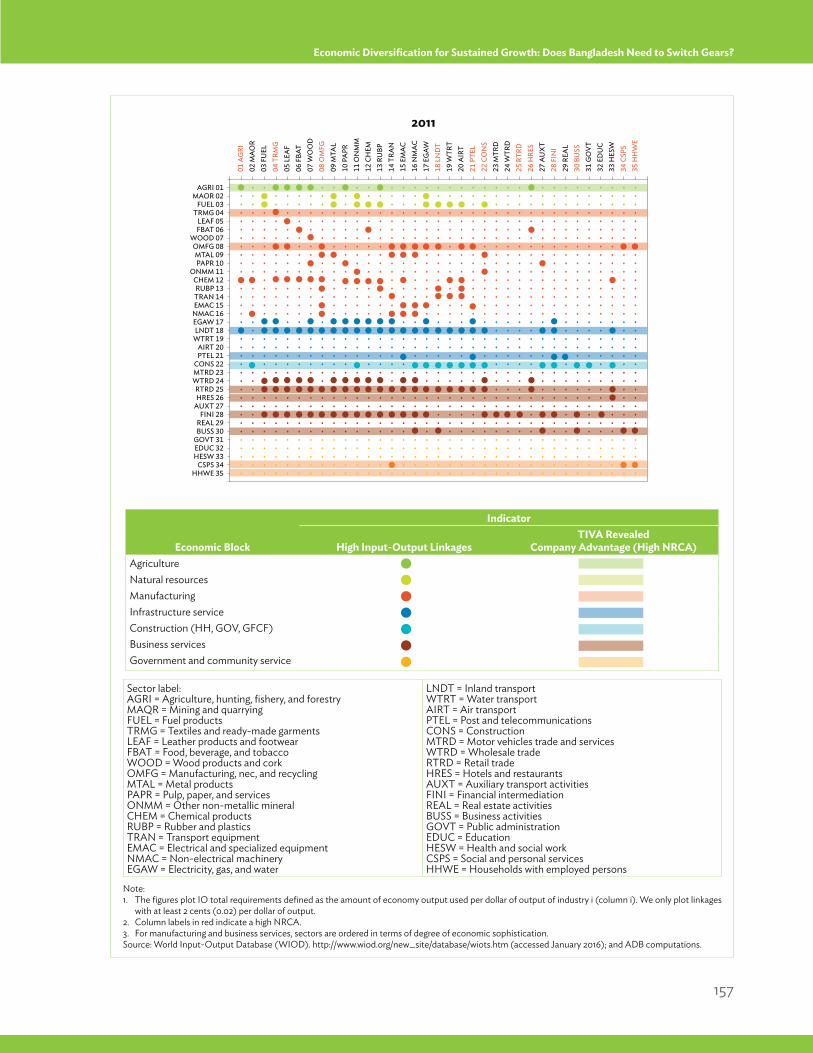
157
Economic Diversification for Sustained Growth: Does Bangladesh Need to Switch Gears?
2011
AGRI 01MAOR 02
FUEL 03TRMG 04
LEAF 05FBAT 06
WOOD 07OMFG 08MTAL 09PAPR 10
ONMM 11CHEM 12RUBP 13TRAN 14EMAC 15
NMAC 16EGAW 17LNDT 18
WTRT 19AIRT 20PTEL 21
CONS 22MTRD 23WTRD 24RTRD 25HRES 26
AUXT 27FINI 28
REAL 29BUSS 30
GOVT 31EDUC 32HESW 33
CSPS 34HHWE 35
01 A
GRI
02
MAO
R03
FU
EL
04 T
RMG
05
LEA
F 06
FBA
T 07
WO
OD
08
OM
FG
09 M
TAL
10 P
APR
11
ON
MM
12
CH
EM
13 R
UBP
14
TRA
N
15 E
MAC
16
NM
AC
17 E
GAW
18
LN
DT
19 W
TRT
20 A
IRT
21 P
TEL
22 C
ON
S 23
MTR
D
24 W
TRD
25
RTR
D
26 H
RES
27 A
UX
T 28
FIN
I 29
REA
L 30
BU
SS
31 G
OVT
32
ED
UC
33 H
ESW
34
CSP
S 35
HH
WE
Economic Block
Indicator
High Input-Output LinkagesTIVA Revealed
Company Advantage (High NRCA)AgricultureNatural resourcesManufacturingInfrastructure serviceConstruction (HH, GOV, GFCF)Business servicesGovernment and community service
Note: 1. The figures plot IO total requirements defined as the amount of economy output used per dollar of output of industry i (column i). We only plot linkages
with at least 2 cents (0.02) per dollar of output.2. Column labels in red indicate a high NRCA.3. For manufacturing and business services, sectors are ordered in terms of degree of economic sophistication.Source: World Input-Output Database (WIOD). http://www.wiod.org/new_site/database/wiots.htm (accessed January 2016); and ADB computations.
Sector label:AGRI = Agriculture, hunting, fishery, and forestryMAQR = Mining and quarryingFUEL = Fuel productsTRMG = Textiles and ready-made garmentsLEAF = Leather products and footwearFBAT = Food, beverage, and tobaccoWOOD = Wood products and corkOMFG = Manufacturing, nec, and recyclingMTAL = Metal productsPAPR = Pulp, paper, and servicesONMM = Other non-metallic mineralCHEM = Chemical productsRUBP = Rubber and plasticsTRAN = Transport equipmentEMAC = Electrical and specialized equipmentNMAC = Non-electrical machineryEGAW = Electricity, gas, and water
LNDT = Inland transportWTRT = Water transportAIRT = Air transportPTEL = Post and telecommunicationsCONS = ConstructionMTRD = Motor vehicles trade and servicesWTRD = Wholesale tradeRTRD = Retail tradeHRES = Hotels and restaurantsAUXT = Auxiliary transport activitiesFINI = Financial intermediationREAL = Real estate activitiesBUSS = Business activitiesGOVT = Public administrationEDUC = EducationHESW = Health and social workCSPS = Social and personal servicesHHWE = Households with employed persons
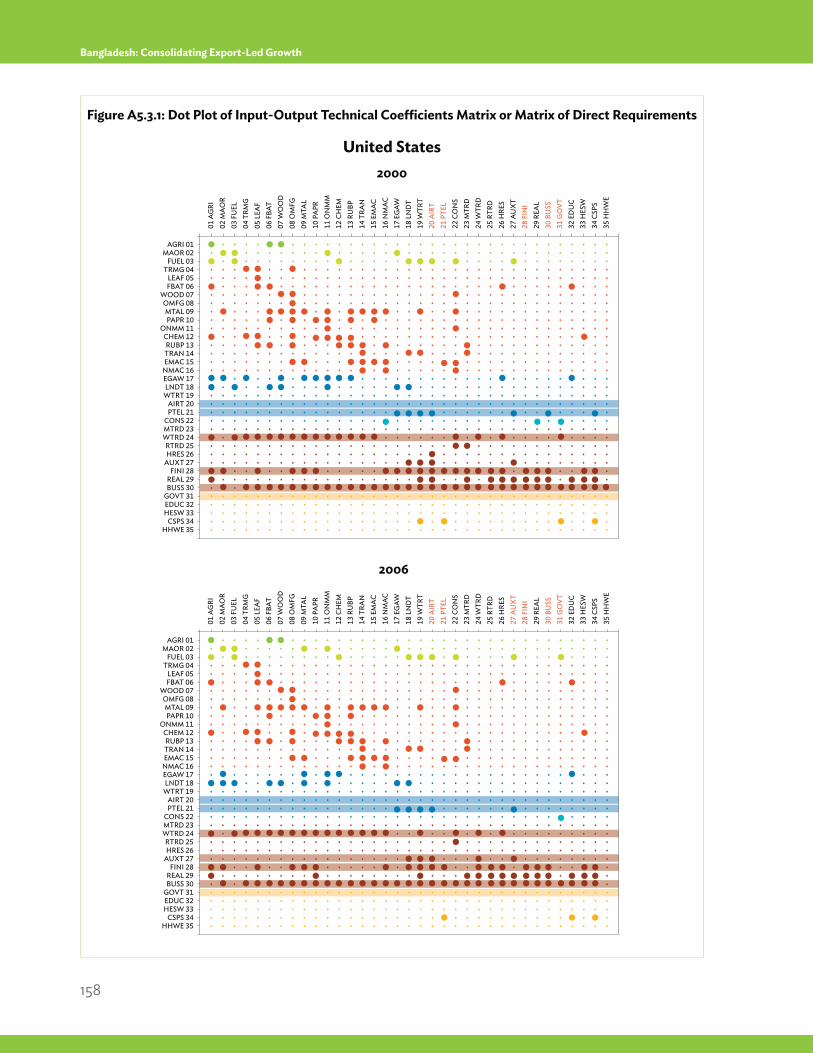
158
Bangladesh: Consolidating Export-Led Growth
Figure A5.3.1: Dot Plot of Input-Output Technical Coefficients Matrix or Matrix of Direct Requirements
2000
United States
2006
AGRI 01MAOR 02
FUEL 03TRMG 04
LEAF 05FBAT 06
WOOD 07OMFG 08MTAL 09PAPR 10
ONMM 11CHEM 12RUBP 13TRAN 14EMAC 15
NMAC 16EGAW 17LNDT 18
WTRT 19AIRT 20PTEL 21
CONS 22MTRD 23WTRD 24RTRD 25HRES 26
AUXT 27FINI 28
REAL 29BUSS 30
GOVT 31EDUC 32HESW 33
CSPS 34HHWE 35
01 A
GRI
02
MAO
R03
FU
EL
04 T
RMG
05
LEA
F 06
FBA
T 07
WO
OD
08
OM
FG
09 M
TAL
10 P
APR
11
ON
MM
12
CH
EM
13 R
UBP
14
TRA
N
15 E
MAC
16
NM
AC
17 E
GAW
18
LN
DT
19 W
TRT
20 A
IRT
21 P
TEL
22 C
ON
S 23
MTR
D
24 W
TRD
25
RTR
D
26 H
RES
27 A
UX
T 28
FIN
I 29
REA
L 30
BU
SS
31 G
OVT
32
ED
UC
33 H
ESW
34
CSP
S 35
HH
WE
AGRI 01MAOR 02
FUEL 03TRMG 04
LEAF 05FBAT 06
WOOD 07OMFG 08MTAL 09PAPR 10
ONMM 11CHEM 12RUBP 13TRAN 14EMAC 15
NMAC 16EGAW 17LNDT 18
WTRT 19AIRT 20PTEL 21
CONS 22MTRD 23WTRD 24RTRD 25HRES 26
AUXT 27FINI 28
REAL 29BUSS 30
GOVT 31EDUC 32HESW 33
CSPS 34HHWE 35
01 A
GRI
02
MAO
R03
FU
EL
04 T
RMG
05
LEA
F 06
FBA
T 07
WO
OD
08
OM
FG
09 M
TAL
10 P
APR
11
ON
MM
12
CH
EM
13 R
UBP
14
TRA
N
15 E
MAC
16
NM
AC
17 E
GAW
18
LN
DT
19 W
TRT
20 A
IRT
21 P
TEL
22 C
ON
S 23
MTR
D
24 W
TRD
25
RTR
D
26 H
RES
27 A
UX
T 28
FIN
I 29
REA
L 30
BU
SS
31 G
OVT
32
ED
UC
33 H
ESW
34
CSP
S 35
HH
WE
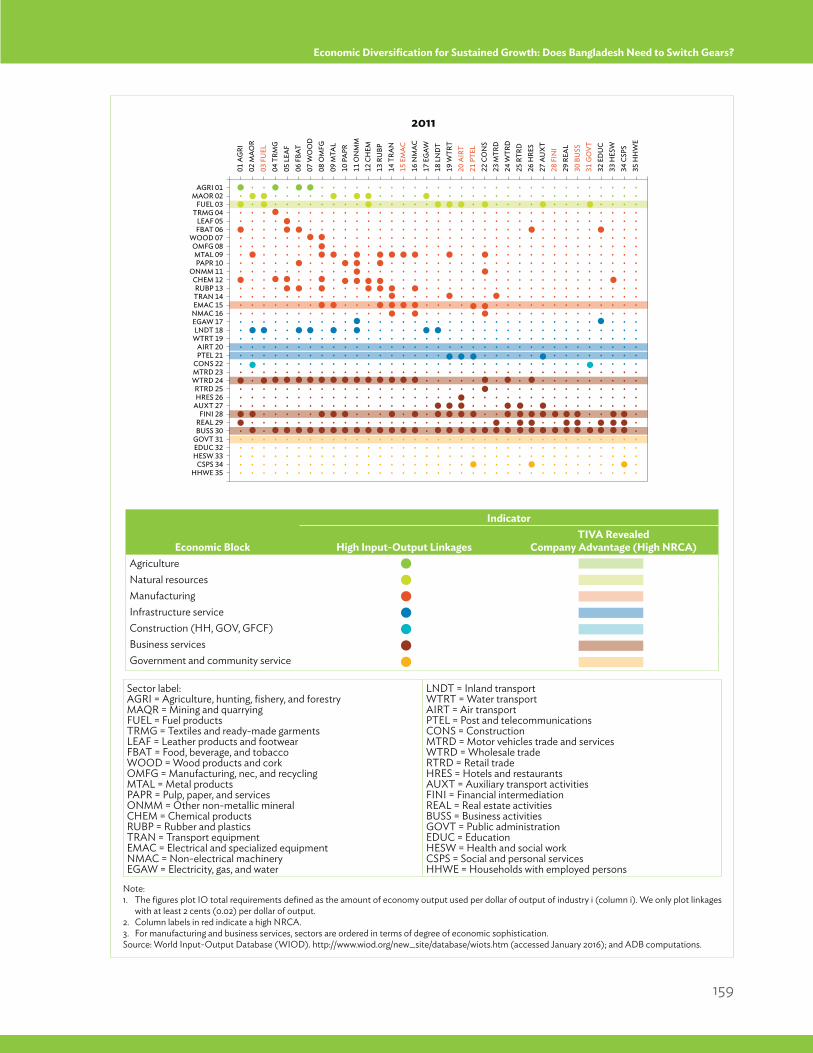
159
Economic Diversification for Sustained Growth: Does Bangladesh Need to Switch Gears?
2011
AGRI 01MAOR 02
FUEL 03TRMG 04
LEAF 05FBAT 06
WOOD 07OMFG 08MTAL 09PAPR 10
ONMM 11CHEM 12RUBP 13TRAN 14EMAC 15
NMAC 16EGAW 17LNDT 18
WTRT 19AIRT 20PTEL 21
CONS 22MTRD 23WTRD 24RTRD 25HRES 26
AUXT 27FINI 28
REAL 29BUSS 30
GOVT 31EDUC 32HESW 33
CSPS 34HHWE 35
01 A
GRI
02
MAO
R03
FU
EL
04 T
RMG
05
LEA
F 06
FBA
T 07
WO
OD
08
OM
FG
09 M
TAL
10 P
APR
11
ON
MM
12
CH
EM
13 R
UBP
14
TRA
N
15 E
MAC
16
NM
AC
17 E
GAW
18
LN
DT
19 W
TRT
20 A
IRT
21 P
TEL
22 C
ON
S 23
MTR
D
24 W
TRD
25
RTR
D
26 H
RES
27 A
UX
T 28
FIN
I 29
REA
L 30
BU
SS
31 G
OVT
32
ED
UC
33 H
ESW
34
CSP
S 35
HH
WE
Economic Block
Indicator
High Input-Output LinkagesTIVA Revealed
Company Advantage (High NRCA)AgricultureNatural resourcesManufacturingInfrastructure serviceConstruction (HH, GOV, GFCF)Business servicesGovernment and community service
Note: 1. The figures plot IO total requirements defined as the amount of economy output used per dollar of output of industry i (column i). We only plot linkages
with at least 2 cents (0.02) per dollar of output.2. Column labels in red indicate a high NRCA.3. For manufacturing and business services, sectors are ordered in terms of degree of economic sophistication.Source: World Input-Output Database (WIOD). http://www.wiod.org/new_site/database/wiots.htm (accessed January 2016); and ADB computations.
Sector label:AGRI = Agriculture, hunting, fishery, and forestryMAQR = Mining and quarryingFUEL = Fuel productsTRMG = Textiles and ready-made garmentsLEAF = Leather products and footwearFBAT = Food, beverage, and tobaccoWOOD = Wood products and corkOMFG = Manufacturing, nec, and recyclingMTAL = Metal productsPAPR = Pulp, paper, and servicesONMM = Other non-metallic mineralCHEM = Chemical productsRUBP = Rubber and plasticsTRAN = Transport equipmentEMAC = Electrical and specialized equipmentNMAC = Non-electrical machineryEGAW = Electricity, gas, and water
LNDT = Inland transportWTRT = Water transportAIRT = Air transportPTEL = Post and telecommunicationsCONS = ConstructionMTRD = Motor vehicles trade and servicesWTRD = Wholesale tradeRTRD = Retail tradeHRES = Hotels and restaurantsAUXT = Auxiliary transport activitiesFINI = Financial intermediationREAL = Real estate activitiesBUSS = Business activitiesGOVT = Public administrationEDUC = EducationHESW = Health and social workCSPS = Social and personal servicesHHWE = Households with employed persons
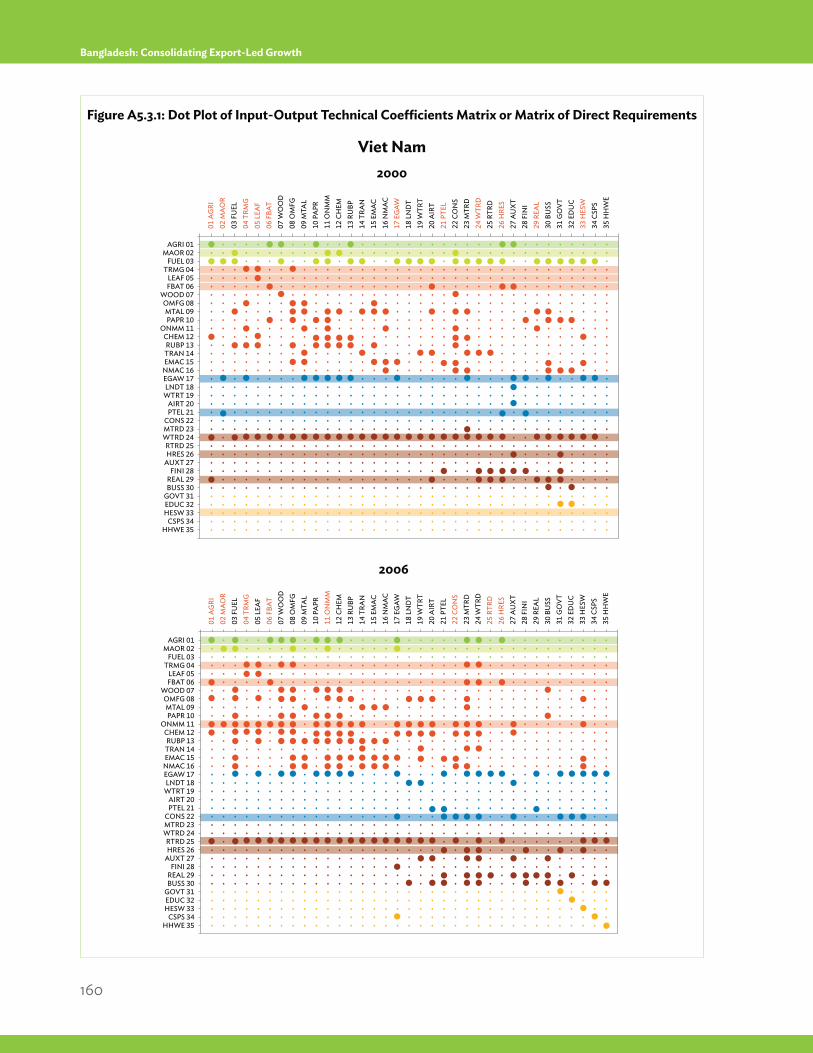
160
Bangladesh: Consolidating Export-Led Growth
Figure A5.3.1: Dot Plot of Input-Output Technical Coefficients Matrix or Matrix of Direct Requirements
2000
Viet Nam
2006
AGRI 01MAOR 02
FUEL 03TRMG 04
LEAF 05FBAT 06
WOOD 07OMFG 08MTAL 09PAPR 10
ONMM 11CHEM 12RUBP 13TRAN 14EMAC 15
NMAC 16EGAW 17LNDT 18
WTRT 19AIRT 20PTEL 21
CONS 22MTRD 23WTRD 24RTRD 25HRES 26
AUXT 27FINI 28
REAL 29BUSS 30
GOVT 31EDUC 32HESW 33
CSPS 34HHWE 35
01 A
GRI
02
MAO
R03
FU
EL
04 T
RMG
05
LEA
F 06
FBA
T 07
WO
OD
08
OM
FG
09 M
TAL
10 P
APR
11
ON
MM
12
CH
EM
13 R
UBP
14
TRA
N
15 E
MAC
16
NM
AC
17 E
GAW
18
LN
DT
19 W
TRT
20 A
IRT
21 P
TEL
22 C
ON
S 23
MTR
D
24 W
TRD
25
RTR
D
26 H
RES
27 A
UX
T 28
FIN
I 29
REA
L 30
BU
SS
31 G
OVT
32
ED
UC
33 H
ESW
34
CSP
S 35
HH
WE
AGRI 01MAOR 02
FUEL 03TRMG 04
LEAF 05FBAT 06
WOOD 07OMFG 08MTAL 09PAPR 10
ONMM 11CHEM 12RUBP 13TRAN 14EMAC 15
NMAC 16EGAW 17LNDT 18
WTRT 19AIRT 20PTEL 21
CONS 22MTRD 23WTRD 24RTRD 25HRES 26
AUXT 27FINI 28
REAL 29BUSS 30
GOVT 31EDUC 32HESW 33
CSPS 34HHWE 35
01 A
GRI
02
MAO
R03
FU
EL
04 T
RMG
05
LEA
F 06
FBA
T 07
WO
OD
08
OM
FG
09 M
TAL
10 P
APR
11
ON
MM
12
CH
EM
13 R
UBP
14
TRA
N
15 E
MAC
16
NM
AC
17 E
GAW
18
LN
DT
19 W
TRT
20 A
IRT
21 P
TEL
22 C
ON
S 23
MTR
D
24 W
TRD
25
RTR
D
26 H
RES
27 A
UX
T 28
FIN
I 29
REA
L 30
BU
SS
31 G
OVT
32
ED
UC
33 H
ESW
34
CSP
S 35
HH
WE
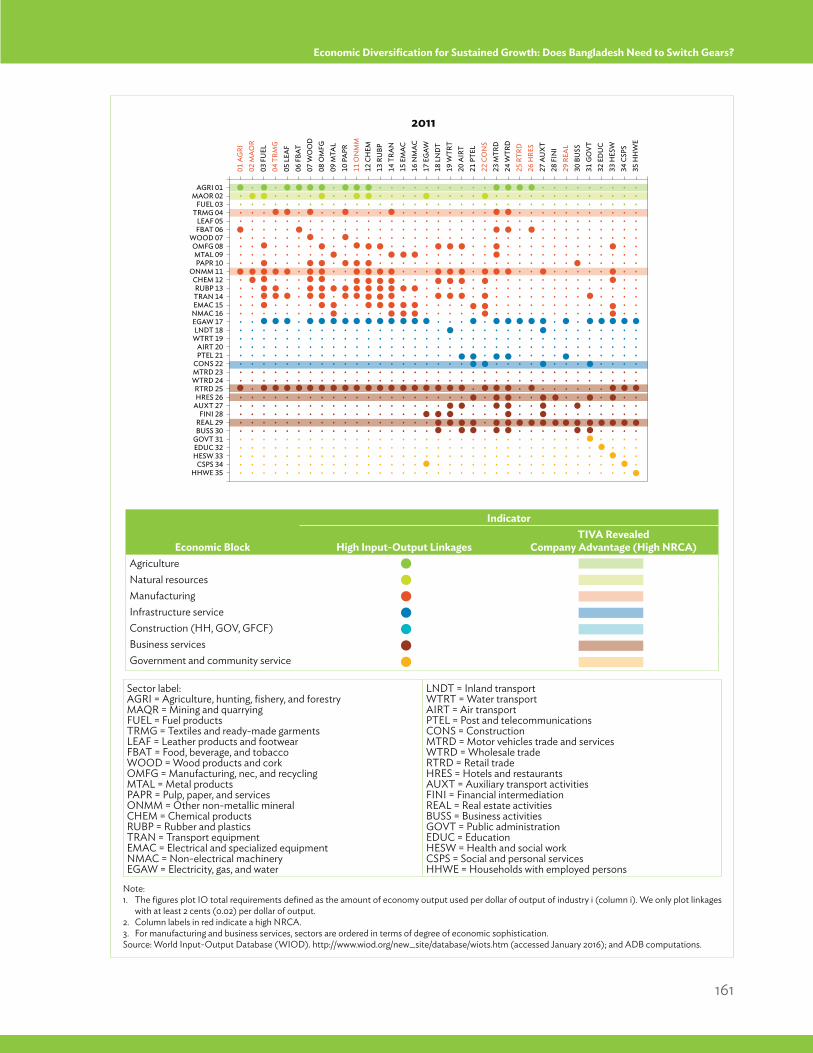
161
Economic Diversification for Sustained Growth: Does Bangladesh Need to Switch Gears?
2011
AGRI 01MAOR 02
FUEL 03TRMG 04
LEAF 05FBAT 06
WOOD 07OMFG 08MTAL 09PAPR 10
ONMM 11CHEM 12RUBP 13TRAN 14EMAC 15
NMAC 16EGAW 17LNDT 18
WTRT 19AIRT 20PTEL 21
CONS 22MTRD 23WTRD 24RTRD 25HRES 26
AUXT 27FINI 28
REAL 29BUSS 30
GOVT 31EDUC 32HESW 33
CSPS 34HHWE 35
01 A
GRI
02
MAO
R03
FU
EL
04 T
RMG
05
LEA
F 06
FBA
T 07
WO
OD
08
OM
FG
09 M
TAL
10 P
APR
11
ON
MM
12
CH
EM
13 R
UBP
14
TRA
N
15 E
MAC
16
NM
AC
17 E
GAW
18
LN
DT
19 W
TRT
20 A
IRT
21 P
TEL
22 C
ON
S 23
MTR
D
24 W
TRD
25
RTR
D
26 H
RES
27 A
UX
T 28
FIN
I 29
REA
L 30
BU
SS
31 G
OVT
32
ED
UC
33 H
ESW
34
CSP
S 35
HH
WE
Economic Block
Indicator
High Input-Output LinkagesTIVA Revealed
Company Advantage (High NRCA)AgricultureNatural resourcesManufacturingInfrastructure serviceConstruction (HH, GOV, GFCF)Business servicesGovernment and community service
Note: 1. The figures plot IO total requirements defined as the amount of economy output used per dollar of output of industry i (column i). We only plot linkages
with at least 2 cents (0.02) per dollar of output.2. Column labels in red indicate a high NRCA.3. For manufacturing and business services, sectors are ordered in terms of degree of economic sophistication.Source: World Input-Output Database (WIOD). http://www.wiod.org/new_site/database/wiots.htm (accessed January 2016); and ADB computations.
Sector label:AGRI = Agriculture, hunting, fishery, and forestryMAQR = Mining and quarryingFUEL = Fuel productsTRMG = Textiles and ready-made garmentsLEAF = Leather products and footwearFBAT = Food, beverage, and tobaccoWOOD = Wood products and corkOMFG = Manufacturing, nec, and recyclingMTAL = Metal productsPAPR = Pulp, paper, and servicesONMM = Other non-metallic mineralCHEM = Chemical productsRUBP = Rubber and plasticsTRAN = Transport equipmentEMAC = Electrical and specialized equipmentNMAC = Non-electrical machineryEGAW = Electricity, gas, and water
LNDT = Inland transportWTRT = Water transportAIRT = Air transportPTEL = Post and telecommunicationsCONS = ConstructionMTRD = Motor vehicles trade and servicesWTRD = Wholesale tradeRTRD = Retail tradeHRES = Hotels and restaurantsAUXT = Auxiliary transport activitiesFINI = Financial intermediationREAL = Real estate activitiesBUSS = Business activitiesGOVT = Public administrationEDUC = EducationHESW = Health and social workCSPS = Social and personal servicesHHWE = Households with employed persons
162
Bangladesh: Consolidating Export-Led Growth
We compare the Bangladesh experience with four other countries, so as to understand how these patterns may differ from those of countries that are many years ahead of Bangladesh in structural transformation. Countries are Viet Nam (which has more diversified exports), the People’s Republic of China (PRC) (which is likely one of the most diversified countries in terms of production), India (which has pockets of developed sectors) and the United States (as an example of an advanced economy). All of these countries started industrializing at different times, to some extent producing and exporting textiles and garments. We are interested in examining not just linkages of the economy as a whole, but also how the types of sectors interact.
All countries (including Bangladesh) have one or two types of infrastructure service that are very important for all sectors and are demanded by almost all product groups.52 In particular, transport is demanded by all sectors (inland transport has strong linkages with all sectors, particularly in India and Bangladesh, but not in Viet Nam). Water, gas, and electricity have very strong linkages in the PRC, India, and Viet Nam, but not in Bangladesh (possibly due to many manufacturing firms having their own rental power plants). In the United States and the PRC, services provide an important demand pull to the “telecommunication and post” sector.
Business and infrastructure services: In terms of business services, only the United States shows strong linkages that are independent of the productive sectors. However, India is also competitive in “exports” (in value-added terms) of certain business activities that include information technology software. Not surprisingly, in all countries distributive services—wholesale and retail trade—clearly have strong linkages with practically all productive sectors. Financial services and real estate services are also prominent, particularly in Bangladesh and India. Of interest is the category of business activities such as rental and leasing of machinery, which is likely a nontraded service.
The United States figures prominently in having strong linkages between business services and telecommunications, and within the business services sectors. In other words, a clear “cluster” around business services has existed throughout 2000 to 2011, the period of analysis. The existence of activities that do not depend on the productive sectors (agriculture and manufacturing) is the manifestation of a well-developed service economy. Moreover, the United States has a strong revealed comparative advantage in the trade-in-value-added of this category of business activities. Both the PRC and Viet Nam also show increasingly more agglomeration around business services as they become more important in the economy, but these services are linked mostly to other manufacturing. In other words, their business activities still depend largely on supporting the manufacturing sector. Interestingly, although the domestic linkages of business activities for the case of India are not very strong, as with the United States, the comparative advantage is in the value-added export of this business sector. We know that Silicon Valley in the United States and Bangalore in India are important centers of software production; this may be partially captured here.53
What do these patterns say about the structural transformation and export potential of Bangladesh? One way to think about it is whether Bangladesh is beginning to exhibit some of these same patterns in the intermediate input linkages as slightly wealthier middle-income economies, and whether the new links are becoming stronger. In other words, in what way is the strong growth of RMG exports influencing the development of nontradable services and movement toward other manufacturing activities? Unfortunately, the concentration of resources in “textiles and ready-made garments” is also evident in the analysis of the domestic economy.
More troubling is the still-strong reliance on nonproductive areas such as government and community services in Bangladesh. This is evident in the number of forward linkages from the “government
____________________52 These would be measured by the number of forward multipliers, reading horizontally the number of dark blue dots in the figures of Appendix 5.2.53 Internet services and software production may appear in various sectors, depending on the type of firm to commission it (post and telecommunications,
wholesale services, and “other” services). However, this is the sector most likely to have the subcontracting of such services.
163
Economic Diversification for Sustained Growth: Does Bangladesh Need to Switch Gears?
and community services” sector to manufacturing. This contrasts strongly with the weakness of the linkages with other sectors. The correct interpretation would be of a bureaucracy that is intervening to a high degree in the productive sectors, as the country cannot have a revealed comparative advantage in a public good. Some of this could reflect the prevalent and strong presence of nongovernment organizations and the donor community in Bangladesh, but it could also reflect the still-strong intervention of the state in many economic activities.
Summary Indicator of Agglomeration
We construct summary indicators of the degree and strength of related linkages, defined as the “agglomeration” index for each economic activity block and for the whole economy. The index numerically summarizes the degree of clustering as a whole and for each economic activity block. This is graphically illustrated in the country dot plot matrixes of Figure A5.3. (differentiated by the color of the dots in the country technical coefficients matrix).
More formally, we define the agglomeration index of an economic activity “block” k=1 to 7 as AGGck where c is the country (c=1 to 5). The seven economic activity blocks (and their respective color in the matrix representations of Figure A5.3) are agriculture (dark green) natural resources (light green), manufacturing (red), construction and infrastructure services (blue), business services (brown), and government and community services (orange). The first three blocks produce primary and tradable goods, and the others produce generally, though not necessarily, nontradable services or supporting activities. Of course, the aggregation of the economic activity blocks is the input-output technical coefficients matrix of the economy as a whole.
There are two components of agglomeration: The first is that formed by “backward” linkages (the number of “dots” along the sector “column” and intensity of a given sector as illustrated in the dot plot matrixes. We will define this term as AGG(b), the backward
agglomeration of the k economic block of country c as: (6)
Where m(b)i is the backward total requirements multiplier of sector i, defined as the additional output, in value terms, that must be produced by all the sectors in an economy if sector i is to produce one more unit value of output for final consumption including exports. m(b)i is also the vertical sum of each element in the Leontief inverse matrix for the column corresponding to sector i. l is the number of sectors in an economic activity block k, whereas n is the total number of sectors in the economy. And pi is the indicator of participation, defined as a “significantly important” contributor from the technical coefficients matrix. This particular variable is defined as the metric that indicates whether sector i contributes to the production process of any given sector of the economy, including itself. To denote its significance, pi is a binary variable that takes the value of 1 if the direct requirements coefficient is greater than 0.02 and zero otherwise.54 A well-diversified economy has a high pi.
Essentially, AGG(b)kj describes the degree of
agglomeration or clustering of economic activity in a particular economic block (or a particular economy) created by backward (demand) linkages. It provides an indicator, not only of the strength of the linkages among sectors (given by the sum of multipliers, m(b)i), but also the degree of participation of other sectors in the production of that sector. Hence, in some ways, the product provides a “booster” to the multiplier term if many sectors are involved in production. The extreme counter example is an enclave, which has a high multiplier but only demands from itself. The indicator is expressed in logs to create a more manageable range. Similarly, we define the term AGG(f) as the agglomeration formed through forward linkages. The agglomeration indicator for the kth economic block of country c is:
(7)
where m(f)i is the “forward” total requirements multiplier of a sector i, defined as the additional supply,
____________________54 The direct requirement or technical coefficients matrix generally has a value for each entry, but some are insignificantly small, which for all practical purposes
indicates a very weak link to the respective intermediate sector. Therefore, we assume this is statistically not different from zero. We test this for sensitivity and get a slightly different value of the indicator, but qualitatively the same results.
AGG(b)kc = ln [ l
i = 1 m(b)i * ] li = 1
ng = 1 pg
l * n
AGG(f)kc = ln [ l
j = 1 m(f)j * ] lj = 1
nh = 1 ph
l * n
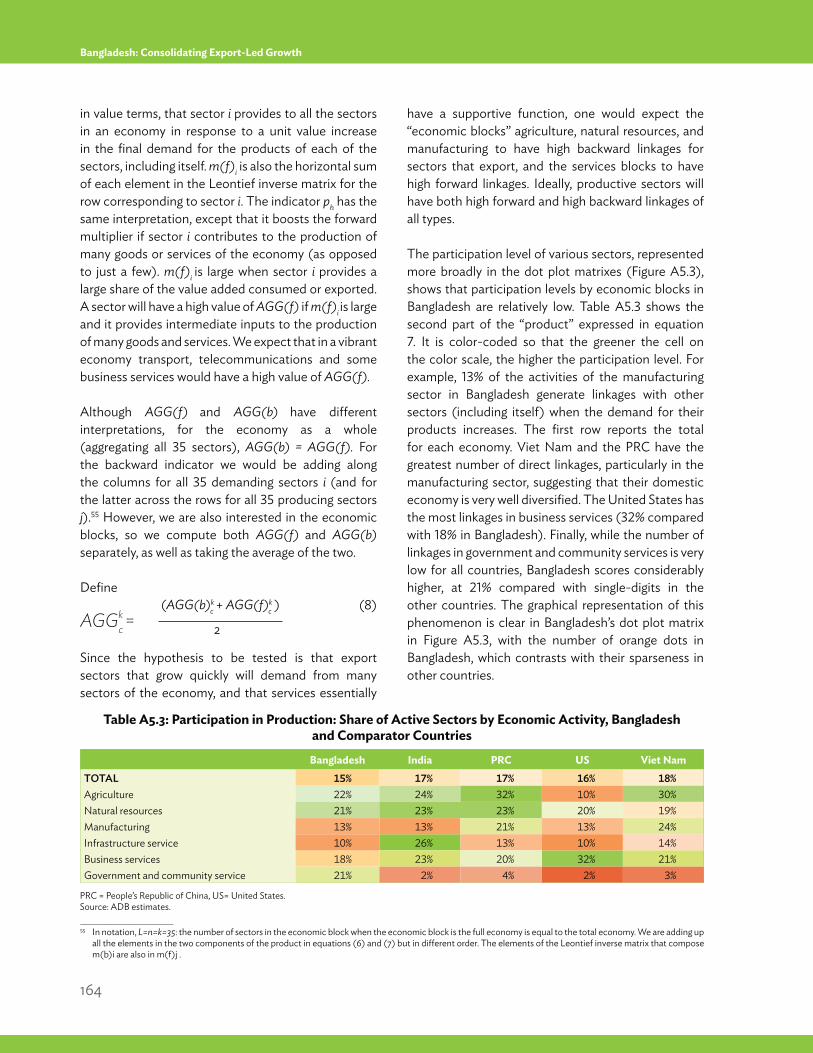
164
Bangladesh: Consolidating Export-Led Growth
in value terms, that sector i provides to all the sectors in an economy in response to a unit value increase in the final demand for the products of each of the sectors, including itself. m(f)i is also the horizontal sum of each element in the Leontief inverse matrix for the row corresponding to sector i. The indicator ph has the same interpretation, except that it boosts the forward multiplier if sector i contributes to the production of many goods or services of the economy (as opposed to just a few). m(f)i is large when sector i provides a large share of the value added consumed or exported. A sector will have a high value of AGG(f) if m(f)i is large and it provides intermediate inputs to the production of many goods and services. We expect that in a vibrant economy transport, telecommunications and some business services would have a high value of AGG(f).
Although AGG(f) and AGG(b) have different interpretations, for the economy as a whole (aggregating all 35 sectors), AGG(b) = AGG(f). For the backward indicator we would be adding along the columns for all 35 demanding sectors i (and for the latter across the rows for all 35 producing sectors j).55 However, we are also interested in the economic blocks, so we compute both AGG(f) and AGG(b) separately, as well as taking the average of the two.
Define (8)
Since the hypothesis to be tested is that export sectors that grow quickly will demand from many sectors of the economy, and that services essentially
have a supportive function, one would expect the “economic blocks” agriculture, natural resources, and manufacturing to have high backward linkages for sectors that export, and the services blocks to have high forward linkages. Ideally, productive sectors will have both high forward and high backward linkages of all types.
The participation level of various sectors, represented more broadly in the dot plot matrixes (Figure A5.3), shows that participation levels by economic blocks in Bangladesh are relatively low. Table A5.3 shows the second part of the “product” expressed in equation 7. It is color-coded so that the greener the cell on the color scale, the higher the participation level. For example, 13% of the activities of the manufacturing sector in Bangladesh generate linkages with other sectors (including itself) when the demand for their products increases. The first row reports the total for each economy. Viet Nam and the PRC have the greatest number of direct linkages, particularly in the manufacturing sector, suggesting that their domestic economy is very well diversified. The United States has the most linkages in business services (32% compared with 18% in Bangladesh). Finally, while the number of linkages in government and community services is very low for all countries, Bangladesh scores considerably higher, at 21% compared with single-digits in the other countries. The graphical representation of this phenomenon is clear in Bangladesh’s dot plot matrix in Figure A5.3, with the number of orange dots in Bangladesh, which contrasts with their sparseness in other countries.
Bangladesh India PRC US Viet NamTOTAL 15% 17% 17% 16% 18%Agriculture 22% 24% 32% 10% 30%Natural resources 21% 23% 23% 20% 19%Manufacturing 13% 13% 21% 13% 24%Infrastructure service 10% 26% 13% 10% 14%Business services 18% 23% 20% 32% 21%Government and community service 21% 2% 4% 2% 3%
Table A5.3: Participation in Production: Share of Active Sectors by Economic Activity, Bangladeshand Comparator Countries
PRC = People’s Republic of China, US= United States.Source: ADB estimates.____________________55 In notation, L=n=k=35: the number of sectors in the economic block when the economic block is the full economy is equal to the total economy. We are adding up
all the elements in the two components of the product in equations (6) and (7) but in different order. The elements of the Leontief inverse matrix that compose m(b)i are also in m(f)j .
AGGkc =
(AGG(b)kc + AGG(f)k
c )
2
165
Economic Diversification for Sustained Growth: Does Bangladesh Need to Switch Gears?
Of course, Table A5.3 says nothing about the strength of the linkage, as measured by the multiplier effect. A sector may demand from another only a negligible amount. In other words, it may be indicative of a well-integrated and diversified economy but not necessarily a very productive one from the point of view of a sector’s contribution to enhancing or creating linkages with other sectors. Joining the matrixes showing the total requirements and the degree of participation provides an indication of agglomeration. It helps us understand how sectors in the domestic economy work together and could be used to look at where the economy has developed its capabilities, and if those are clustered around certain industries.
The results of the agglomeration indicators for the total economy and subsectors for the five countries were discussed in the main text and presented in Table 5.7. Some general trends are worth pointing out, based on our small and unrepresentative sample of five countries. First, the highest overall values of agglomeration tend to occur in the productive sectors, particularly in manufacturing. Second, other than a few isolated cases, for all countries and all sectors, multipliers increase through time (regardless of the level of development). Third, the PRC and Viet Nam, the most diversified countries, show the highest levels of total agglomeration in manufacturing (3.11 for the PRC and 3.31 for Viet Nam), as well as a core development of business services sectors that decouple somewhat from the manufacturing sector. In contrast, from the diagrams in Figure A5.3.1, one still observes that business services are strictly dependent on the manufacturing sector in India and Bangladesh.
We can also relate the agglomeration index results to the NRCA. Taking advantage of the dynamic nature of this data, we explore how structural transformation is taking place. In other words, we can infer not only how these patterns change through time, but also how they may herald exports in increasingly higher value-added goods. In 2000, Bangladesh had a revealed comparative advantage in “leather and footwear,” “textiles and garments,” “real estate services,” “retail trade,” and all sectors that compose government and community services except for education, according to the NRCA (and illustrated as the shaded rows in the first dot plate matrix of Appendix A5.3).56 This means that these
sectors produce the most value added embedded in exports relative to the total value added and relative to the same sectors in other countries.
If we juxtapose the sectors with a high NRCA and compare how these change across time, the results for Bangladesh show that the sectors with a high NRCA are actually those where there is progressively less demand linkages from other sectors. This is not necessarily detrimental for growth if the level of concentration or agglomeration is occurring within that sector (as indicated by a high “agglomeration” indicator for manufacturing).
Appendix 5.4: How Linked is Bangladesh to Global Production Chains?This appendix details the methodology for decomposing the effect of a $1 million increase in the final demand of the products produced in Bangladesh, by sector, and presents the resulting calculations using input-output tables.
A salient feature of an input-output table is that it provides the mechanism for detailing the direct and indirect linkages between production and trade in a systematic manner. Since every sector-specific production process can be represented as the linear combination of the contributions of all industry sectors, the intermediate use matrix and the associated matrix of technical coefficients (A) are square (ADB 2015a). Further, in the matrix representation of a realistic economy, no column sum in A is greater than 1, and at least one column sum is less than 1 (implying non-negative value added in every sector). Given these characteristics of the technical coefficient matrix A, a powerful economic analytical tool known as the Leontief inverse can be derived from it. Formulaically, it is expressed as
L = (I – A)–1 (9)
where I is the identity matrix whose dimensions are same as that of A. L is also known as the total requirements matrix, whereas the matrix of technical
____________________56 These are at a much more aggregated level than what was shown in Figure 5.7.
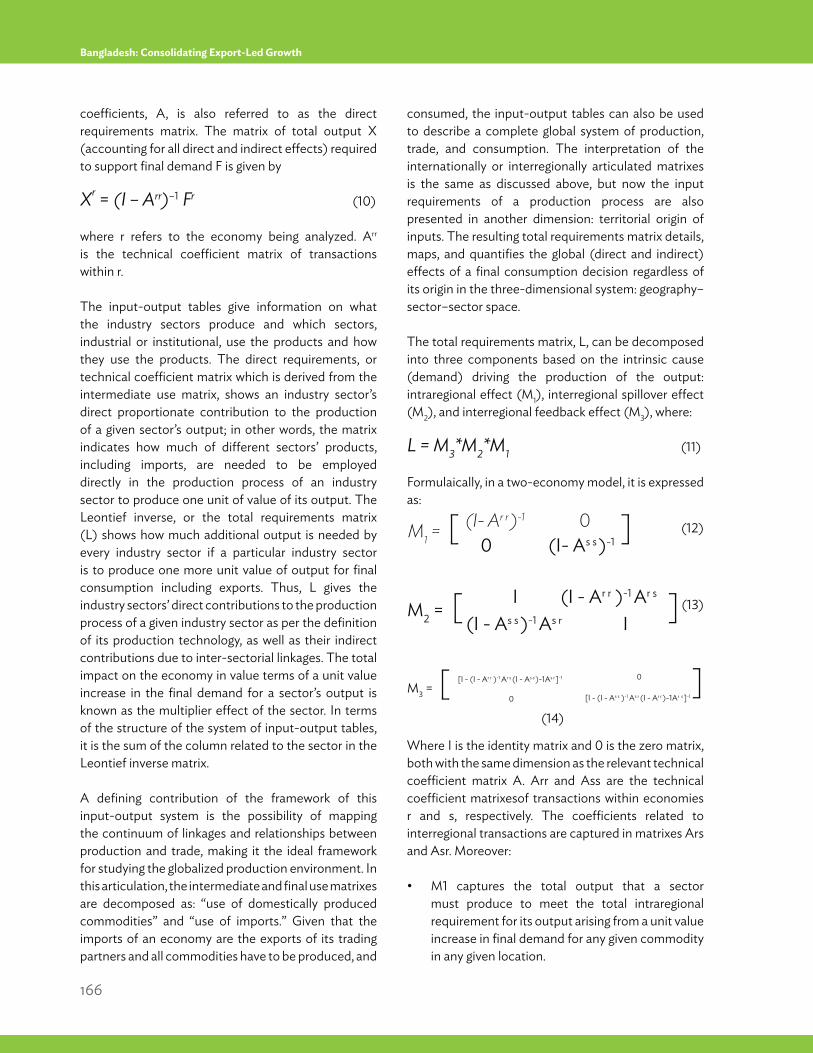
166
Bangladesh: Consolidating Export-Led Growth
coefficients, A, is also referred to as the direct requirements matrix. The matrix of total output X (accounting for all direct and indirect effects) required to support final demand F is given by
Xr = (I – Arr)–1 Fr (10)
where r refers to the economy being analyzed. Arr
is the technical coefficient matrix of transactions within r.
The input-output tables give information on what the industry sectors produce and which sectors, industrial or institutional, use the products and how they use the products. The direct requirements, or technical coefficient matrix which is derived from the intermediate use matrix, shows an industry sector’s direct proportionate contribution to the production of a given sector’s output; in other words, the matrix indicates how much of different sectors’ products, including imports, are needed to be employed directly in the production process of an industry sector to produce one unit of value of its output. The Leontief inverse, or the total requirements matrix (L) shows how much additional output is needed by every industry sector if a particular industry sector is to produce one more unit value of output for final consumption including exports. Thus, L gives the industry sectors’ direct contributions to the production process of a given industry sector as per the definition of its production technology, as well as their indirect contributions due to inter-sectorial linkages. The total impact on the economy in value terms of a unit value increase in the final demand for a sector’s output is known as the multiplier effect of the sector. In terms of the structure of the system of input-output tables, it is the sum of the column related to the sector in the Leontief inverse matrix.
A defining contribution of the framework of this input-output system is the possibility of mapping the continuum of linkages and relationships between production and trade, making it the ideal framework for studying the globalized production environment. In this articulation, the intermediate and final use matrixes are decomposed as: “use of domestically produced commodities” and “use of imports.” Given that the imports of an economy are the exports of its trading partners and all commodities have to be produced, and
consumed, the input-output tables can also be used to describe a complete global system of production, trade, and consumption. The interpretation of the internationally or interregionally articulated matrixes is the same as discussed above, but now the input requirements of a production process are also presented in another dimension: territorial origin of inputs. The resulting total requirements matrix details, maps, and quantifies the global (direct and indirect) effects of a final consumption decision regardless of its origin in the three-dimensional system: geography–sector–sector space.
The total requirements matrix, L, can be decomposed into three components based on the intrinsic cause (demand) driving the production of the output: intraregional effect (M1), interregional spillover effect (M2), and interregional feedback effect (M3), where:
L = M3*M2*M1 (11)
Formulaically, in a two-economy model, it is expressed as:
Where I is the identity matrix and 0 is the zero matrix, both with the same dimension as the relevant technical coefficient matrix A. Arr and Ass are the technical coefficient matrixesof transactions within economies r and s, respectively. The coefficients related to interregional transactions are captured in matrixes Ars and Asr. Moreover:
must produce to meet the total intraregional requirement for its output arising from a unit value increase in final demand for any given commodity in any given location.
M1 = [ (I- Ar r )-1 0
]
M2 = [ I (I - Ar r )-1 Ar s ]
M3 = [ [I - (I - Ar r )-1 Ar s (I - As s )-1As r ]-1
[I - (I - As s )-1 As r (I - Ar r )-1Ar s ]-1 ]
0 (I- As s )-1
(I - As s )-1 As r I
0
0
(12)
(13)
(14)
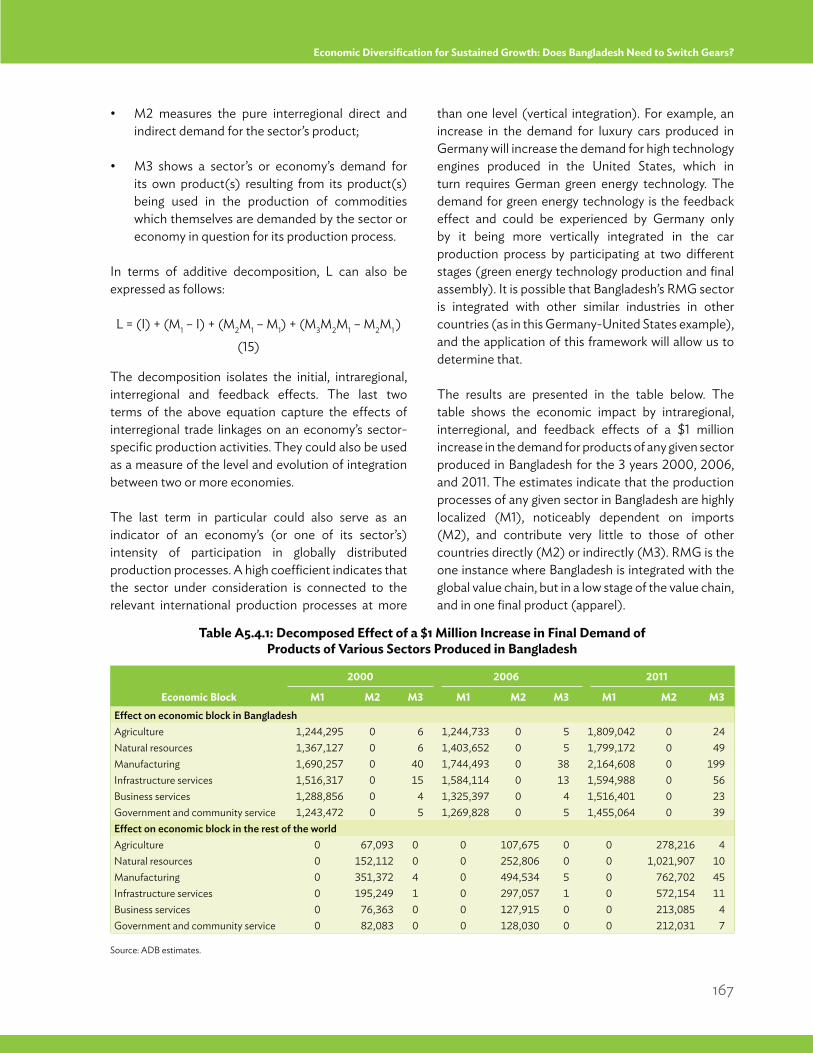
167
Economic Diversification for Sustained Growth: Does Bangladesh Need to Switch Gears?
indirect demand for the sector’s product;
its own product(s) resulting from its product(s) being used in the production of commodities which themselves are demanded by the sector or economy in question for its production process.
In terms of additive decomposition, L can also be expressed as follows:
L = (I) + (M1 – I) + (M2M1 – M1) + (M3M2M1 – M2M1 )
The decomposition isolates the initial, intraregional, interregional and feedback effects. The last two terms of the above equation capture the effects of interregional trade linkages on an economy’s sector-specific production activities. They could also be used as a measure of the level and evolution of integration between two or more economies.
The last term in particular could also serve as an indicator of an economy’s (or one of its sector’s) intensity of participation in globally distributed production processes. A high coefficient indicates that the sector under consideration is connected to the relevant international production processes at more
than one level (vertical integration). For example, an increase in the demand for luxury cars produced in Germany will increase the demand for high technology engines produced in the United States, which in turn requires German green energy technology. The demand for green energy technology is the feedback effect and could be experienced by Germany only by it being more vertically integrated in the car production process by participating at two different stages (green energy technology production and final assembly). It is possible that Bangladesh’s RMG sector is integrated with other similar industries in other countries (as in this Germany-United States example), and the application of this framework will allow us to determine that.
The results are presented in the table below. The table shows the economic impact by intraregional, interregional, and feedback effects of a $1 million increase in the demand for products of any given sector produced in Bangladesh for the 3 years 2000, 2006, and 2011. The estimates indicate that the production processes of any given sector in Bangladesh are highly localized (M1), noticeably dependent on imports (M2), and contribute very little to those of other countries directly (M2) or indirectly (M3). RMG is the one instance where Bangladesh is integrated with the global value chain, but in a low stage of the value chain, and in one final product (apparel).
Table A5.4.1: Decomposed Effect of a $1 Million Increase in Final Demand ofProducts of Various Sectors Produced in Bangladesh
Source: ADB estimates.
Economic Block
2000 2006 2011
M1 M2 M3 M1 M2 M3 M1 M2 M3Effect on economic block in BangladeshAgriculture 1,244,295 0 6 1,244,733 0 5 1,809,042 0 24Natural resources 1,367,127 0 6 1,403,652 0 5 1,799,172 0 49Manufacturing 1,690,257 0 40 1,744,493 0 38 2,164,608 0 199Infrastructure services 1,516,317 0 15 1,584,114 0 13 1,594,988 0 56Business services 1,288,856 0 4 1,325,397 0 4 1,516,401 0 23Government and community service 1,243,472 0 5 1,269,828 0 5 1,455,064 0 39Effect on economic block in the rest of the worldAgriculture 0 67,093 0 0 107,675 0 0 278,216 4Natural resources 0 152,112 0 0 252,806 0 0 1,021,907 10Manufacturing 0 351,372 4 0 494,534 5 0 762,702 45Infrastructure services 0 195,249 1 0 297,057 1 0 572,154 11Business services 0 76,363 0 0 127,915 0 0 213,085 4Government and community service 0 82,083 0 0 128,030 0 0 212,031 7
(15)
168
Bangladesh: Consolidating Export-Led Growth
Chapter 6Conclusions and Policy Recommendations
sector (RMG), oil and gas, and telecommunications (which grew 25% in 14 years). These four sectors account for 60% of FDI. The other side of the coin has been that, for various reasons discussed in Chapter 5, the productive sector has not diversified into areas or sectors where Bangladesh has potential.
Outside of garments, Bangladesh is barely linked to the global production chain, which would be required for it to benefit from technology transfers. However, in other areas the country has shown considerable resilience and innovation: microfinance and remittances from overseas workers have brought millions out of poverty, for example. Some productive areas such as repair of machinery and transport equipment, light engineering and related services—where progress is difficult to identify using current data—could begin to grow steadily with the right policy environment. The problem is that, given entrenched informality, and unability of the government to identify and support other endeavors, it is difficult to attract new equity FDI. All of this affects the potential for economic growth. Table 6.1 shows only the critical constraints to growth identified in Chapter 2, and Table 3.18 (page 72 ), identified the areas where growth could be more inclusive in health care and basic education.
6.1 Conclusions
Since its tumultuous beginnings after independence, Bangladesh has made enormous progress in all areas of socioeconomic development, achieving solid and steady annual economic growth averaging nearly 6% over the last 15 years. Importantly, growth has been mostly inclusive, with poverty declining 17.4 percentage points between 2000 and 2010: the poverty headcount fell to 31.5 in 2010, the latest available figure (21.5 in urban areas and 35.2 in rural areas). Moreover, large increases in female labor force participation in the export sector have accompanied a decline in fertility rates and improved access to health, education, and basic infrastructure. Remittances from overseas workers have risen steadily to comprise about 12% of gross domestic product (GDP) in 2015, helping to lift millions of mostly rural households out of poverty.
This report has identified the actual and latent constraints to sustainable growth, which will require more private investment and the right type of foreign direct investment (FDI). Although FDI has been growing, it was still only about 1% of GDP in 2014 (compared with almost 3% average in the middle-income country grouping that includes Bangladesh). Moreover, it is concentrated in banking, the ready-made garment
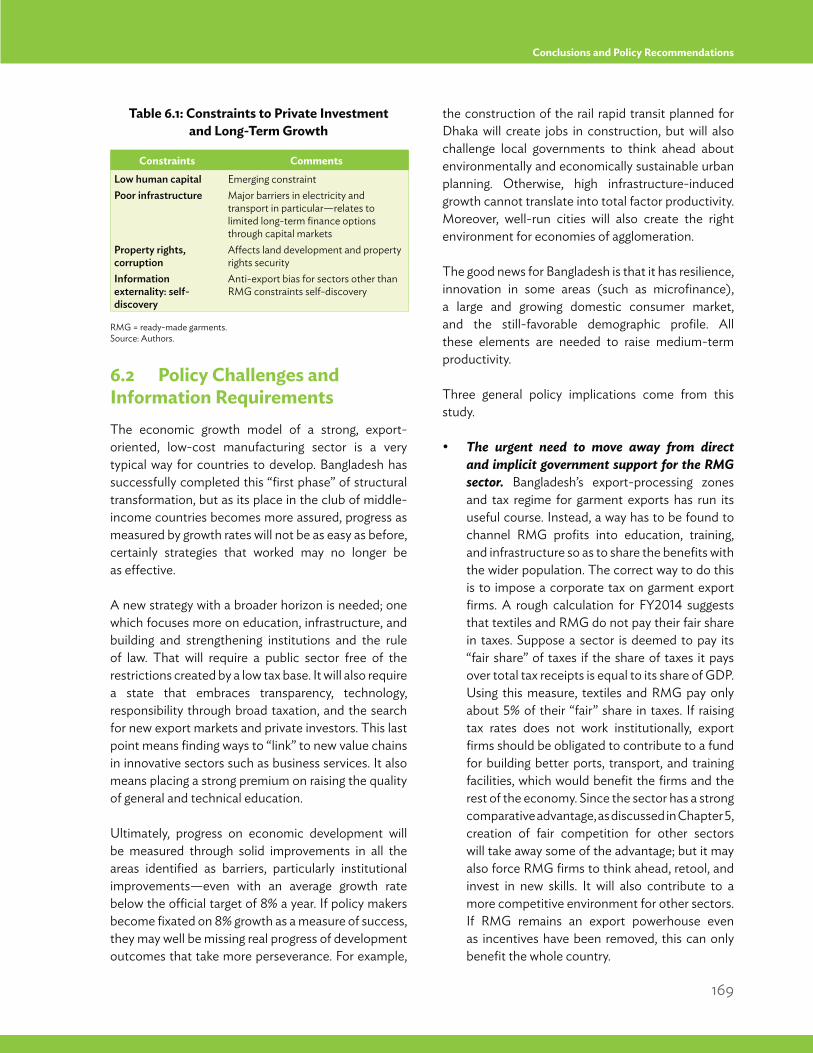
169
Conclusions and Policy Recommendations
6.2 Policy Challenges and Information RequirementsThe economic growth model of a strong, export-oriented, low-cost manufacturing sector is a very typical way for countries to develop. Bangladesh has successfully completed this “first phase” of structural transformation, but as its place in the club of middle-income countries becomes more assured, progress as measured by growth rates will not be as easy as before, certainly strategies that worked may no longer be as effective.
A new strategy with a broader horizon is needed; one which focuses more on education, infrastructure, and building and strengthening institutions and the rule of law. That will require a public sector free of the restrictions created by a low tax base. It will also require a state that embraces transparency, technology, responsibility through broad taxation, and the search for new export markets and private investors. This last point means finding ways to “link” to new value chains in innovative sectors such as business services. It also means placing a strong premium on raising the quality of general and technical education.
Ultimately, progress on economic development will be measured through solid improvements in all the areas identified as barriers, particularly institutional improvements—even with an average growth rate below the official target of 8% a year. If policy makers become fixated on 8% growth as a measure of success, they may well be missing real progress of development outcomes that take more perseverance. For example,
the construction of the rail rapid transit planned for Dhaka will create jobs in construction, but will also challenge local governments to think ahead about environmentally and economically sustainable urban planning. Otherwise, high infrastructure-induced growth cannot translate into total factor productivity. Moreover, well-run cities will also create the right environment for economies of agglomeration.
The good news for Bangladesh is that it has resilience, innovation in some areas (such as microfinance), a large and growing domestic consumer market, and the still-favorable demographic profile. All these elements are needed to raise medium-term productivity.
Three general policy implications come from this study.
The urgent need to move away from direct and implicit government support for the RMG sector. Bangladesh’s export-processing zones and tax regime for garment exports has run its useful course. Instead, a way has to be found to channel RMG profits into education, training, and infrastructure so as to share the benefits with the wider population. The correct way to do this is to impose a corporate tax on garment export firms. A rough calculation for FY2014 suggests that textiles and RMG do not pay their fair share in taxes. Suppose a sector is deemed to pay its “fair share” of taxes if the share of taxes it pays over total tax receipts is equal to its share of GDP. Using this measure, textiles and RMG pay only about 5% of their “fair” share in taxes. If raising tax rates does not work institutionally, export firms should be obligated to contribute to a fund for building better ports, transport, and training facilities, which would benefit the firms and the rest of the economy. Since the sector has a strong comparative advantage, as discussed in Chapter 5, creation of fair competition for other sectors will take away some of the advantage; but it may also force RMG firms to think ahead, retool, and invest in new skills. It will also contribute to a more competitive environment for other sectors. If RMG remains an export powerhouse even as incentives have been removed, this can only benefit the whole country.
Table 6.1: Constraints to Private Investment and Long-Term Growth
RMG = ready-made garments. Source: Authors.
Constraints CommentsLow human capital Emerging constraintPoor infrastructure Major barriers in electricity and
transport in particular—relates to limited long-term finance options through capital markets
Property rights, corruption
Affects land development and property rights security
Information externality: self-discovery
Anti-export bias for sectors other than RMG constraints self-discovery
170
Bangladesh: Consolidating Export-Led Growth
Another way of creating more fiscal space for education and infrastructure expenditure, and to make energy consumption more efficient, is related to untargeted subsidies from the budget. The number of effective tax waivers and energy subsidies is excessive. Given falling oil prices, the time is right to remove broad fuel and electricity subsidies. However, this needs to be accompanied by a concerted and well-financed campaign to show the benefits of such a policy. The removal of these subsidies needs to be gradual, transparent, and its reasoning and steps clearly explained to the public through media campaigns. Among various possibilities, the money saved could be deposited into an independently managed sovereign energy infrastructure fund, with information about its assets and earnings publicly available on the internet.57
Although many poor households may not be able to afford the rational electricity tariff, there are ways to target these groups, and examples from other countries can be followed. Where detailed information about poor households exists, direct targeting of subsidies is easy. Otherwise means-testing mechanisms can be used. For example, households in certain poor neighborhoods can be charged a subsidized rate per kilowatt-hour (kWh) for the first, say, 100 kWh—or a reasonable amount of consumption for a household—used per month. Any consumption beyond that amount reverts to higher rates. Naturally, and as discussed in Chapter 4, the government would need to spend more on supply and distribution expansion, and on the maintenance of electricity networks.
Finally, low FDI is a great concern, and is the manifestation of poor infrastructure and disorderly urbanization, as well as uncertainty about property rights and their enforcement. In the case of oil and gas and other potentially competitive sectors, the government has not been able to convince investors that Bangladesh is an attractive place to establish business, despite an abundant supply of hard-working low-skilled labor. As a first step, the investment
promotion agency has to become stronger and work in partnership with government ministries to discover what investors want and how they can better provide it.
Chapter 3 identified critical constraints in human capabilities (health and education), and access to basic infrastructure and social protection. Although the government has put priority on increasing public expenditure on health and education, quality services are still limited for some segments of the population; in particular, low income, rural people, and residents in Sylhet. For families in the lowest quintile of income, access to antenatal health care and births attended by skilled health workers is in significantly short supply; hence, more than half of children in those families are malnourished. The quality of social services needs to be increased. The distribution of trained health workers is concentrated in Dhaka. In schools, teacher qualifications and support management systems need to be reviewed. Basic facilities such as functioning toilets need to be provided. Also, more needs to be done to increase labor opportunities and participation by providing skills training for both male and females (see Chapters 5 and 6, ADB [2016b]).
Three areas are still in critical need of improvement to ensure growth is inclusive, even as the government is making a lot of effort. First, the average education and skills set will necessarily become a critically binding constraint to growth in the next decade. Second, social protection programs have been developed and expenditure on programs increased in recent years. Nonetheless, coverage can be increased further to support the marginalized population and strengthen social safety nets. Finally, limited access to safe water, sanitation, electricity, and the roads network also act as critical constraints on raising opportunities. Access has been improved in the past few years, but some marginal populations (such as urban poor in relation to lack of improved water; and the rural poor without sanitation facilities and electricity) still face limited access. However, in all these areas, the government is acutely aware of the needs and still has time to implement a cohesive strategy. Financing such projects will require continued strong coordination with development partners.
____________________57 An example of full transparency in a wealth fund is the Government Pension Fund of Norway’s declaration of income from hydrocarbons. https://www.nbim.no/
en/the-fund/
171
Conclusions and Policy Recommendations
Bangladesh is in the early part of its structural transformation, and most of the population and employment is still rural. Here, there are several issues. First, while the proliferation of small plots has significantly reduced productivity, some areas have become substantially more productive, but they lack adequate infrastructure for transport and cold storage. The small national food surplus attests to the success of agriculture but also to missed opportunities for selling and even exporting food because of the inadequate infrastructure. Moreover, Bangladesh is one of the most vulnerable countries to the effects of climate change, and this may well affect agricultural varieties and productivity. Although Bangladesh has implemented very successful programs of adaptation and mitigation, there is a lot of room for progress. The government is well aware of these issues.
Thinking ahead, the key to increasing the stock of infrastructure will be the availability of long-term financing. The baseline is now being set. First, recent social security reform aims to build a national pension system, and the demographic dividend will still provide enough time for the savings of the emerging middle class to be channeled into long-term investment. Parallel to this is the need to deepen capital market development. Enactment and amendments to legislation have already been approved, and more reforms are planned, including of insurance markets.58
Also, this study has only focused in depth on some of the constraints to medium-term sustainable economic growth. Nonetheless, many important topics have not received a full analysis. First, employment and training were only indirectly discussed since the concurrent ADB Employment Diagnostics Study covers this area. Second, Bangladesh is vulnerable on many fronts: to climate change, political instability, the inability of the informal sector to move ahead, and to corruption—particularly as experienced by businesses. The agriculture sector has many challenges too. Lack of coverage on these and other areas by no means reduces their immediate importance. Indeed, these topics are analyzed fully in the background papers of the Seventh Five-Year Plan.
In addition to the specific policies, the approach to policy making has to become more innovative. While the quality and optimism of the Five-Year Plan is admirable, the focus should be on objectives and specific public sector interventions, and how those can produce a thriving private sector. The plan’s results–based framework is too ambitious. For example, the aim is to reach 8% real GDP annual average growth in 2020 (from an estimated average of 6.4% in 2010–2015). The key growth driver will be the industry sector, which would need to reach 11% annual growth (compared with an 8.8% annual average during 2010–2015). All this would require private investment to rise from 21% (2014 estimate) to 28% in 2020, including threefold growth in the FDI-to-GDP ratio (from 1% to 3%). This increase in investment in such a short period has hardly ever happened in other countries in a sustained manner over 5 years.
Overambitious poverty-reduction targets will also pose some challenges for data production and evaluation. The establishment of the National Social Protection Strategy in 2015 and the goals of almost eradicating poverty by 2030 will require a significant revamping of the conditional cash transfer program. The household survey will be used to identify people living in poverty and biometric cards will be provided to all, with mobile banking digitizing the process. This already ambitious program will require accurate data on the consumption of households across all regions. Yet the Household Income and Expenditure Survey, originally planned for a 2015 release, will now be released in 2016 or 2017. Consequently, many of the premises and targets in this area are based on projections of the 2015 poverty rate, which itself is derived from calculations based on the 2010 figure.
Given the results–based framework used, monitoring and evaluation of the Five-Year Plan’s implementation will become paramount. Yet it is unclear that Bangladesh itself will be able to step up data production and do so without significant financial and technical assistance. Already the national statistical system is strained while being asked to produce a considerable amount of new information to measure the Sustainable Development
____________________58 ADB is supporting reforms to extend the yield curve for government bonds and, therefore, promoting a more liquid government bond market and eventually in the
corporate debt market. It is also catalyzing institutional investor demand by broadening, deepening, and diversifying the investor base and enhancing the supply of alternative financial instruments.
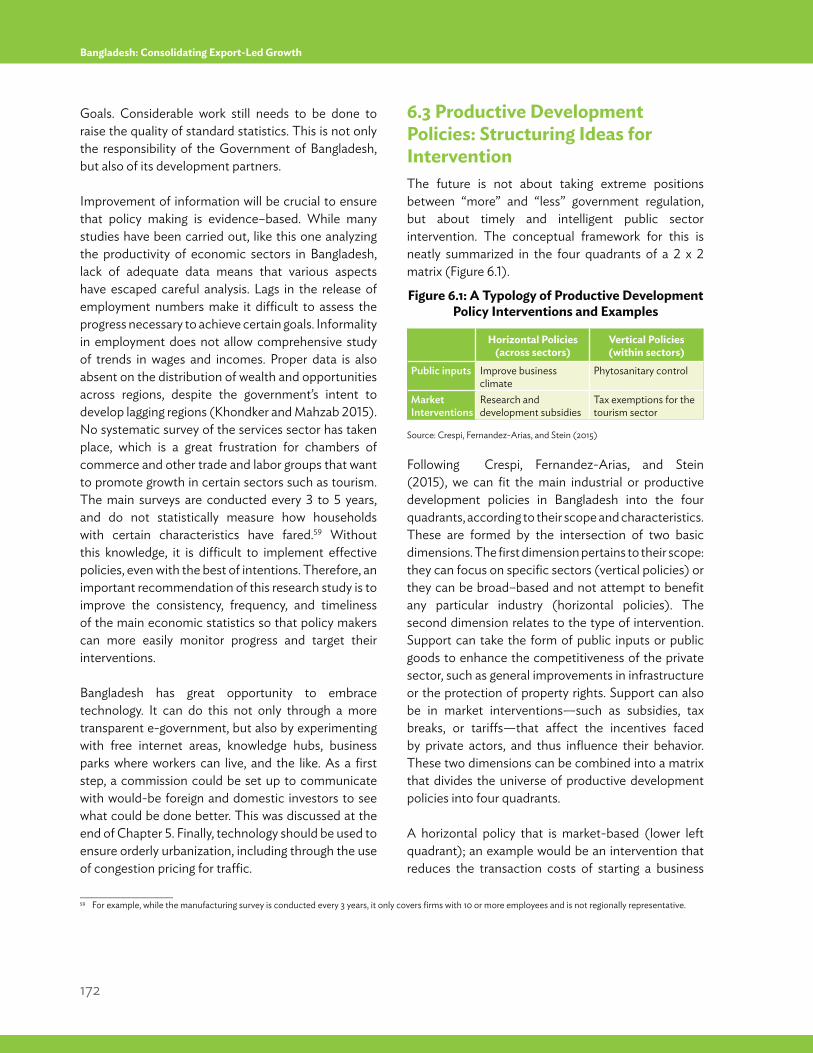
172
Bangladesh: Consolidating Export-Led Growth
Goals. Considerable work still needs to be done to raise the quality of standard statistics. This is not only the responsibility of the Government of Bangladesh, but also of its development partners.
Improvement of information will be crucial to ensure that policy making is evidence–based. While many studies have been carried out, like this one analyzing the productivity of economic sectors in Bangladesh, lack of adequate data means that various aspects have escaped careful analysis. Lags in the release of employment numbers make it difficult to assess the progress necessary to achieve certain goals. Informality in employment does not allow comprehensive study of trends in wages and incomes. Proper data is also absent on the distribution of wealth and opportunities across regions, despite the government’s intent to develop lagging regions (Khondker and Mahzab 2015). No systematic survey of the services sector has taken place, which is a great frustration for chambers of commerce and other trade and labor groups that want to promote growth in certain sectors such as tourism. The main surveys are conducted every 3 to 5 years, and do not statistically measure how households with certain characteristics have fared.59 Without this knowledge, it is difficult to implement effective policies, even with the best of intentions. Therefore, an important recommendation of this research study is to improve the consistency, frequency, and timeliness of the main economic statistics so that policy makers can more easily monitor progress and target their interventions.
Bangladesh has great opportunity to embrace technology. It can do this not only through a more transparent e-government, but also by experimenting with free internet areas, knowledge hubs, business parks where workers can live, and the like. As a first step, a commission could be set up to communicate with would-be foreign and domestic investors to see what could be done better. This was discussed at the end of Chapter 5. Finally, technology should be used to ensure orderly urbanization, including through the use of congestion pricing for traffic.
6.3 Productive Development Policies: Structuring Ideas for InterventionThe future is not about taking extreme positions between “more” and “less” government regulation, but about timely and intelligent public sector intervention. The conceptual framework for this is neatly summarized in the four quadrants of a 2 x 2 matrix (Figure 6.1).
Following Crespi, Fernandez-Arias, and Stein (2015), we can fit the main industrial or productive development policies in Bangladesh into the four quadrants, according to their scope and characteristics. These are formed by the intersection of two basic dimensions. The first dimension pertains to their scope: they can focus on specific sectors (vertical policies) or they can be broad–based and not attempt to benefit any particular industry (horizontal policies). The second dimension relates to the type of intervention. Support can take the form of public inputs or public goods to enhance the competitiveness of the private sector, such as general improvements in infrastructure or the protection of property rights. Support can also be in market interventions—such as subsidies, tax breaks, or tariffs—that affect the incentives faced by private actors, and thus influence their behavior. These two dimensions can be combined into a matrix that divides the universe of productive development policies into four quadrants.
A horizontal policy that is market-based (lower left quadrant); an example would be an intervention that reduces the transaction costs of starting a business
____________________59 For example, while the manufacturing survey is conducted every 3 years, it only covers firms with 10 or more employees and is not regionally representative.
Figure 6.1: A Typology of Productive Development Policy Interventions and Examples
Source: Crespi, Fernandez-Arias, and Stein (2015)
Horizontal Policies
(across sectors)Vertical Policies (within sectors)
Public inputs Improve business climate
Phytosanitary control
Market Interventions
Research and development subsidies
Tax exemptions for the tourism sector
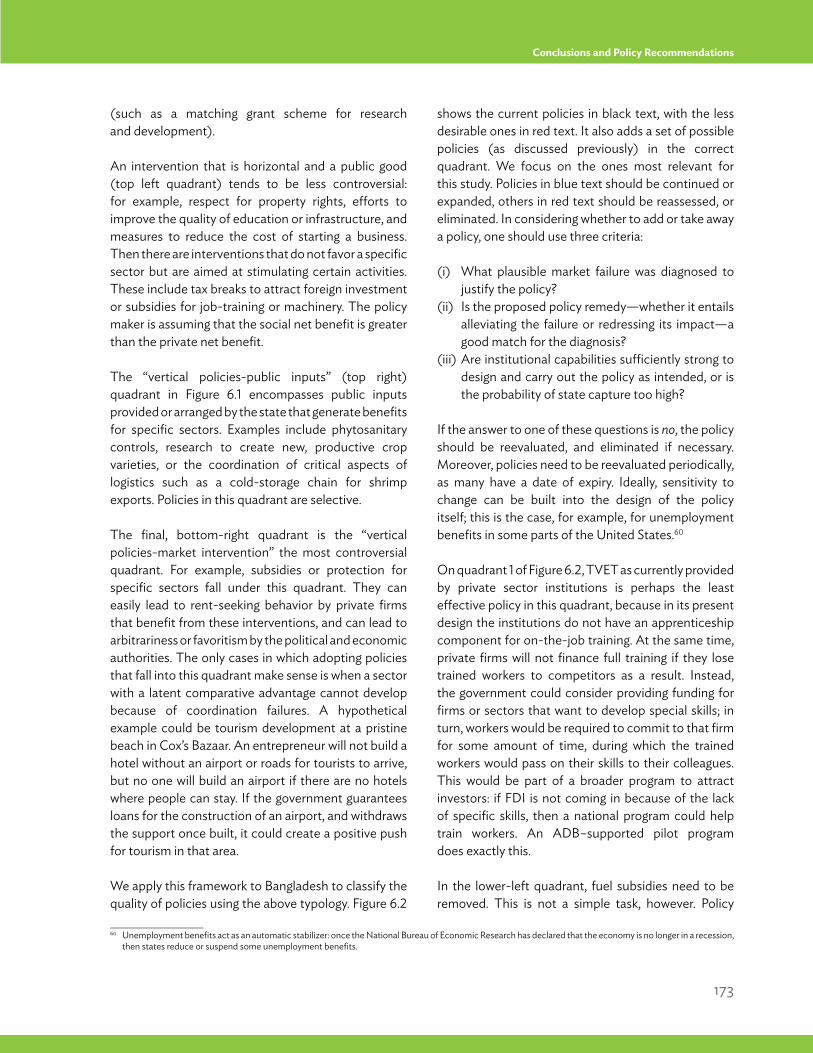
173
Conclusions and Policy Recommendations
(such as a matching grant scheme for research and development).
An intervention that is horizontal and a public good (top left quadrant) tends to be less controversial: for example, respect for property rights, efforts to improve the quality of education or infrastructure, and measures to reduce the cost of starting a business. Then there are interventions that do not favor a specific sector but are aimed at stimulating certain activities. These include tax breaks to attract foreign investment or subsidies for job-training or machinery. The policy maker is assuming that the social net benefit is greater than the private net benefit.
The “vertical policies-public inputs” (top right) quadrant in Figure 6.1 encompasses public inputs provided or arranged by the state that generate benefits for specific sectors. Examples include phytosanitary controls, research to create new, productive crop varieties, or the coordination of critical aspects of logistics such as a cold-storage chain for shrimp exports. Policies in this quadrant are selective.
The final, bottom-right quadrant is the “vertical policies-market intervention” the most controversial quadrant. For example, subsidies or protection for specific sectors fall under this quadrant. They can easily lead to rent-seeking behavior by private firms that benefit from these interventions, and can lead to arbitrariness or favoritism by the political and economic authorities. The only cases in which adopting policies that fall into this quadrant make sense is when a sector with a latent comparative advantage cannot develop because of coordination failures. A hypothetical example could be tourism development at a pristine beach in Cox’s Bazaar. An entrepreneur will not build a hotel without an airport or roads for tourists to arrive, but no one will build an airport if there are no hotels where people can stay. If the government guarantees loans for the construction of an airport, and withdraws the support once built, it could create a positive push for tourism in that area.
We apply this framework to Bangladesh to classify the quality of policies using the above typology. Figure 6.2
shows the current policies in black text, with the less desirable ones in red text. It also adds a set of possible policies (as discussed previously) in the correct quadrant. We focus on the ones most relevant for this study. Policies in blue text should be continued or expanded, others in red text should be reassessed, or eliminated. In considering whether to add or take away a policy, one should use three criteria:
(i) What plausible market failure was diagnosed to justify the policy?
(ii) Is the proposed policy remedy—whether it entails alleviating the failure or redressing its impact—a good match for the diagnosis?
(iii) Are institutional capabilities sufficiently strong to design and carry out the policy as intended, or is the probability of state capture too high?
If the answer to one of these questions is no, the policy should be reevaluated, and eliminated if necessary. Moreover, policies need to be reevaluated periodically, as many have a date of expiry. Ideally, sensitivity to change can be built into the design of the policy itself; this is the case, for example, for unemployment benefits in some parts of the United States.60
On quadrant 1 of Figure 6.2, TVET as currently provided by private sector institutions is perhaps the least effective policy in this quadrant, because in its present design the institutions do not have an apprenticeship component for on-the-job training. At the same time, private firms will not finance full training if they lose trained workers to competitors as a result. Instead, the government could consider providing funding for firms or sectors that want to develop special skills; in turn, workers would be required to commit to that firm for some amount of time, during which the trained workers would pass on their skills to their colleagues. This would be part of a broader program to attract investors: if FDI is not coming in because of the lack of specific skills, then a national program could help train workers. An ADB–supported pilot program does exactly this.
In the lower-left quadrant, fuel subsidies need to be removed. This is not a simple task, however. Policy
____________________60 Unemployment benefits act as an automatic stabilizer: once the National Bureau of Economic Research has declared that the economy is no longer in a recession,
then states reduce or suspend some unemployment benefits.
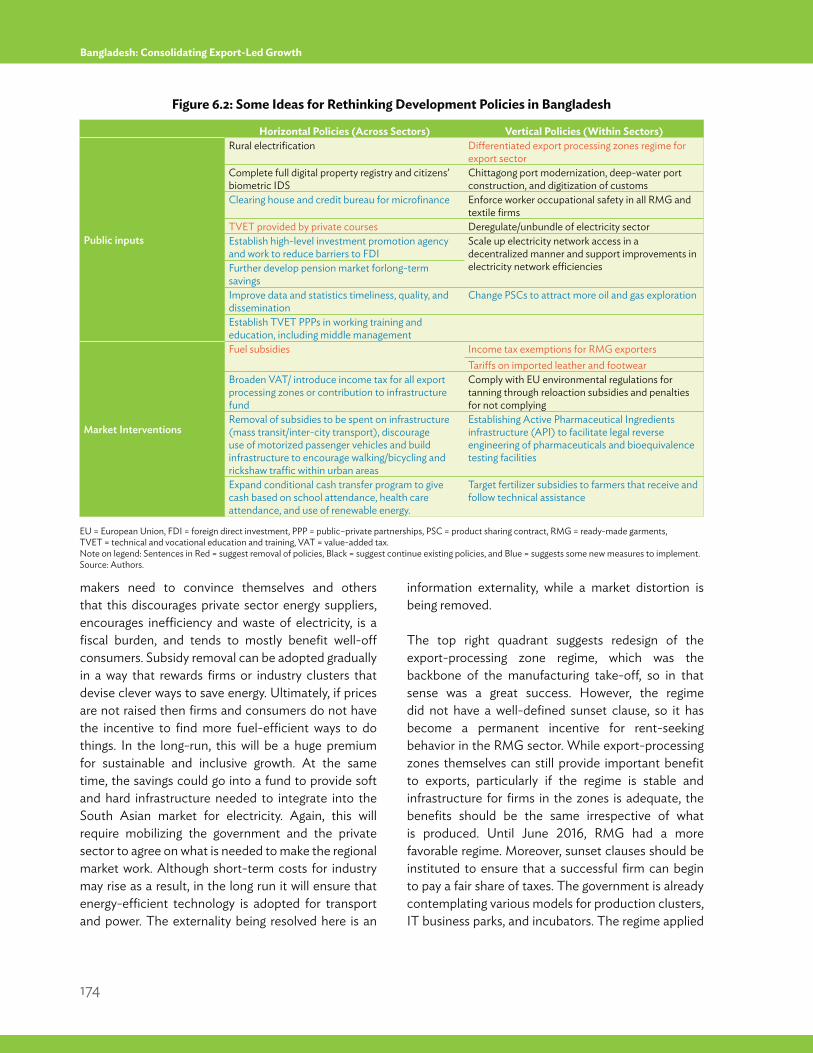
174
Bangladesh: Consolidating Export-Led Growth
makers need to convince themselves and others that this discourages private sector energy suppliers, encourages inefficiency and waste of electricity, is a fiscal burden, and tends to mostly benefit well-off consumers. Subsidy removal can be adopted gradually in a way that rewards firms or industry clusters that devise clever ways to save energy. Ultimately, if prices are not raised then firms and consumers do not have the incentive to find more fuel-efficient ways to do things. In the long-run, this will be a huge premium for sustainable and inclusive growth. At the same time, the savings could go into a fund to provide soft and hard infrastructure needed to integrate into the South Asian market for electricity. Again, this will require mobilizing the government and the private sector to agree on what is needed to make the regional market work. Although short-term costs for industry may rise as a result, in the long run it will ensure that energy-efficient technology is adopted for transport and power. The externality being resolved here is an
information externality, while a market distortion is being removed.
The top right quadrant suggests redesign of the export-processing zone regime, which was the backbone of the manufacturing take-off, so in that sense was a great success. However, the regime did not have a well-defined sunset clause, so it has become a permanent incentive for rent-seeking behavior in the RMG sector. While export-processing zones themselves can still provide important benefit to exports, particularly if the regime is stable and infrastructure for firms in the zones is adequate, the benefits should be the same irrespective of what is produced. Until June 2016, RMG had a more favorable regime. Moreover, sunset clauses should be instituted to ensure that a successful firm can begin to pay a fair share of taxes. The government is already contemplating various models for production clusters, IT business parks, and incubators. The regime applied
Figure 6.2: Some Ideas for Rethinking Development Policies in Bangladesh
EU = European Union, FDI = foreign direct investment, PPP = public–private partnerships, PSC = product sharing contract, RMG = ready-made garments,TVET = technical and vocational education and training, VAT = value-added tax.Note on legend: Sentences in Red = suggest removal of policies, Black = suggest continue existing policies, and Blue = suggests some new measures to implement. Source: Authors.
Horizontal Policies (Across Sectors) Vertical Policies (Within Sectors)
Public inputs
Rural electrification Differentiated export processing zones regime for export sector
Complete full digital property registry and citizens’ biometric IDS
Chittagong port modernization, deep-water port construction, and digitization of customs
Clearing house and credit bureau for microfinance Enforce worker occupational safety in all RMG and textile firms
TVET provided by private courses Deregulate/unbundle of electricity sectorEstablish high-level investment promotion agency and work to reduce barriers to FDI
Scale up electricity network access in a decentralized manner and support improvements in electricity network efficienciesFurther develop pension market forlong-term
savingsImprove data and statistics timeliness, quality, and dissemination
Change PSCs to attract more oil and gas exploration
Establish TVET PPPs in working training and education, including middle management
Market Interventions
Fuel subsidies Income tax exemptions for RMG exportersTariffs on imported leather and footwear
Broaden VAT/ introduce income tax for all export processing zones or contribution to infrastructure fund
Comply with EU environmental regulations for tanning through reloaction subsidies and penalties for not complying
Removal of subsidies to be spent on infrastructure (mass transit/inter-city transport), discourage use of motorized passenger vehicles and build infrastructure to encourage walking/bicycling and rickshaw traffic within urban areas
Establishing Active Pharmaceutical Ingredients infrastructure (API) to facilitate legal reverse engineering of pharmaceuticals and bioequivalence testing facilities
Expand conditional cash transfer program to give cash based on school attendance, health care attendance, and use of renewable energy.
Target fertilizer subsidies to farmers that receive and follow technical assistance
175
Conclusions and Policy Recommendations
____________________61 This is akin to the private sector “referral bonus” in which people get discounts in a fitness club if they refer a new member. A similar policy was applied to the
blueberry export sector in Argentina.
to these should ensure that incentives are designed to help them get started but are automatically removed beyond a certain threshold. One example from other countries is to provide a subsidy to a “pioneer” (a firm that is the first to export a product) but to base that subsidy on the size of all exports, not just the pioneer’s exports (to correct for the “first mover” externality). In other words, every time a new firm comes in to export that same product, the pioneer firm gets a small “prize.”61
The RMG sector needs to contribute to the development of the country through higher payment of taxes, so as to fund badly needed infrastructure. The government, with support of the International Monetary Fund, has been working on reforming aspects of the tax system (including the VAT and tax administration), but progress has been very slow. Individual shareholders of exporting firms should contribute their fair share of income taxes, so that development continues to be inclusive. Finally, the anti-export bias for all sectors outside of textiles and garments, as discussed in Chapter 5, has led to high effective protection rates for final goods and a strong disincentive for other sectors to target export markets. The government has recently taken this on board, but para-tariffs need to be removed immediately.
On fertilizer subsidies, a large part of these is seeking to address an important market externality or development need: food security. This is a strictly productive endeavor because it is expected to increase agricultural yields. Therefore, one could argue that some of the subsidy corrects a market failure: without the subsidy, a farmer would be unlikely to use fertilizer if it was expensive, and so crops would not grow. Nonetheless, fragmentation of farms into smaller parcels as the rural population grows, along with erosion and rising water tables, means that crop yields must continue to rise to maintain good production. Therefore, fertilizer subsidies could be further targeted, for example, by providing higher subsidies for groups that lease a machine, or for farmers who agree to receive technical assistance in growing crops and in marketing. If this was organized in conjunction with lending programs to small and medium-sized
enterprises in rural areas and a continued steady inflow of remittances income for startups, it would help stem the heavy flow of migrants from rural to urban areas. Local governments would also need to be empowered and their capacity strengthened.
What about policies that could help other potential export sectors (lower right quadrant)? Box 5.3 and Box 5.4 on pages 136 and 137 talk about the challenges faced by the leather and pharmaceutical sectors. However, shipbuilding and some IT services, and also repair of transport machinery, may have even more potential (see Katouria and Mezgheni-Malouche 2015). The government needs to work on the “information” externality. It needs to talk to entrepreneurs inside and outside Bangladesh to find out what these services sectors need to establish themselves, even if only in the domestic market at first, and look for foreign investors who could establish these services. Already Bangladesh Bank is establishing mechanisms for money transfers if small businesses sell their web services abroad. Ultimately, it is important to design the state intervention in such a way that it is sufficiently broad–based and objective enough to decrease the opportunity for state capture.
Finally, the production and issuance of biometric identity cards for all the population is a first step to reducing the informality of the economy by ensuring that everyone is captured in transactions networks. Such technology can eventually be used for government transactions, opening bank accounts, paying for water, transport and electricity services, and receiving government transfers. This could really launch Bangladesh into a future digital age, to “leap-frog” development. Such information could also be used to collect data about household needs, and eventually be used for a congestion-pricing system in Dhaka, as discussed in Appendix 2.1. If linked to mobile banking through smartphones, it could also allow remittances and other income to be channeled into savings and retirement accounts. Related to this is the need to complete the digital land registry and enforce zoning laws in urban areas. Such a reality would be very consistent with Bangladesh’s already proven resilient, innovative, and inclusive development strategy.
176
References
References
Acemoglu, D. and J. Robinson. 2008. The Role of Institutions in Growth and Development. Commission on Growth and Development Working Paper. No. 10. Washington, DC: World Bank. http://siteresources.worldbank.org/EXTPREMNET/Resources/489960–1338997241035/Growth_Commission_Working_Paper_10_Role_Institutions_Growth_Development.pdf
Aghion, P. and P. Howitt.1992. A Model of Growth through Creative Destruction. Econometrica 60 (2). pp. 323–51. Ahmed, R. 2006. Achieving 100% Sanitation: WaterAid Bangladesh and VERC Approach. WaterAid Bangladesh.
Paper presented in a regional workshop, organized by the Water Supply and Sanitation Collaborative Council on Women and Sanitation. New Delhi.
Ahmed, S. 2008. An Assessment of the Impacts of Floods on Sanitation in Rural Bangladesh. BRAC Research and Evaluation Division Working Paper. No. 7. Dhaka: BRAC Research and Evaluation Division.
Ahmed, A., S. Haq, M. Nasreen, and A. Hassan. 2015. Climate Change and Disaster Management, Sectoral inputs towards the formulation of Seventh Five-Year Plan (2016–2021), January 2015.
Ahmed, F., C. Trimble, and N. Yoshida. 2013. The Transition from Underpricing Residential Electricity in Bangladesh: Fiscal and Distributional impacts. Policy Note World Bank Report Number: 76441-BD. World Bank. Washington, DC. January.
Aidt, T. 2003. Economic Analysis of Corruption: A Survey. The Economic Journal 491 (113). pp. F632–652.A. Kolås, et al. 2013. Water Scarcity in Bangladesh. Transboundary Rivers, Conflict and Cooperation. Olso: Peace
Research Institute Oslo. http://file.prio.no/publication_files/prio/PRIO%20Report%20-%20Water%20Scarcity%20in%20Bangladesh.pdf
Akter, K. 2015. The Pharmaceuticals Industry of Bangladesh. Bangladesh Textile Today 08 (04). http://www.textiletoday.com.bd/the-pharmaceuticals-industry-of-bangladesh/
Alam, G. M. 2015. Strategy for Infrastructure Sector: Background Paper for the Seventh Five-Year Plan. Policy Research Institute of Bangladesh, Dhaka.
Ali, I. and J. Zhuang. 2007. Inclusive Growth Toward a Prosperous Asia. Economics and Research Department Working Paper Series. No. 97. Manila: ADB.
Al-Muti, S.A. and N. Ahmad. 2015. Bangladesh: Billion Dollar Leather Sector Poised for Growth after Environmental Reform. In Asia. 15 April. The Asia Foundation. http://asiafoundation.org/in-asia/2015/04/15/bangladesh-billion-dollar-leather-sector-poised-for-growth-after-environmental-reform/
Ardic, O. P., M. Heimann, and N. Mylenko. 2011. Access to Financial Services and the Financial Inclusion Agenda around the World, A Cross Country Analysis with a New Data Set. World Bank Policy Research Working Paper. No. 5537. Washington, DC: World Bank. http://www-wds.worldbank.org/servlet/WDSContentServer/WDSP/IB/2011/01/18/000158349_20110118141442/Rendered/PDF/WPS5537.pdf
177
References
Asadullah, M and N.Chaudhury, 2013. Primary Schooling, Student Learning, and School Quality in Rural Bangladesh. Center for Global Development Working Paper 349. Washington, DC: Center for Global Development.
Asian Development Bank. 2005. Country Strategy and Program: Bangladesh, 2006–2010. Manila._______. 2009. Sector Assistance Program Evaluation for Bangladesh Energy Sector. Manila._______. 2010a. Bangladesh: Sustainable Rural Infrastructure Improvement Project. Manila._______. 2010b. Bangladesh: Greater Dhaka Sustainable Urban Transport Project. Manila._______. 2011. Country Partnership Strategy: Bangladesh, 2011–2015—Risk Assessment and Risk Management Plan.
Manila._______.2012a. Report and Recommendation of the President to the Board of Directors: Proposed Multitranche
Financing Facility and Administration of Grant People’s Republic of Bangladesh: Power System Expansion and Efficiency Improvement Investment Program. Manila.
_______. 2012b. Greater Mekong Subregion, Power Trade and Interconnection: 2 Decades of Cooperation. Manila ._______. 2013a. Asian Development Outlook 2013 Update. Manila. http://www.adb.org/sites/default/files/
publication/30418/ado2013-update_1.pdf_______. 2013b. $250 million ADB Loan to Improve, Expand Water Supplies in Bangladesh Capital. News
Release. 23 October. http://www.adb.org/news/250-million-adb-loan-improve-expand-water-supplies-bangladesh-capital
_______. 2013c. Study on a South Asia Regional Power Exchange (RETA 7529). Manila._______. 2013d. The Social Protection Index: Assessing Results for Asia and the Pacific. Manila _______. 2015a. Key Indicators for Asia and the Pacific. Manila._______. 2015b. Asian Economic Integration Report 2015: How Can Special Economic Zones Catalyze Economic
Development? Manila._______. 2015c. Energy Sector Assessment of Pakistan. Manila._______. Statistical Database System. https://adbs.adb.org/sdbs/index.jsp (accessed January 2016)._______. 2016a. Asian Development Outlook 2016. Manila._______. 2016b. Bangladesh Employment Diagnostics Study. Manila.Asian Productivity Organization. http://www.apo-tokyo.org/wedo/measurement Bae, K., and V. Goyal. 2009. Creditor Rights, Enforcement, and Bank Loans. Journal of Finance 64 (2). pp. 823–860. B. Balassa. 1965. Trade Liberalization and Revealed Comparative Advantage. The Manchester School of Economic
and Social Studies. 33 (2). pp. 99–123.Bangladesh Bank. 2014. Quarterly Report April–June 2014. Dhaka._______. Annual Report 2008–2014. https://www.bb.org.bd/pub/publictn.php_______. 2015. Annual Report. https://www.bb.org.bd/pub/annual/anreport/ar1415/index1415.php_______. Economic Data database. https://www.bb.org.bd/econdata/index.phpBangladesh Bureau of Statistics. 1978. A Report on the Household Expenditure Survey of Bangladesh 1973-74. Dhaka._______. 2008. Agriculture Census. Dhaka._______. 2009. Multiple Indicator Cluster Survey 2009. Planning Division, Ministry of Planning. Dhaka._______. 2011. Agriculture Statistics Yearbook. Dhaka._______. 2011a. Household Income and Expenditure Survey 2010. Dhaka._______. 2011b. Population Projection of Bangladesh Dynamics and Trends 2011–2061. Dhaka._______. 2011c. Report of the Household Income & Expenditure Survey 2010. Ministry of Planning. Dhaka. http://www.
bbs.gov.bd/WebTestApplication/userfiles/Image/LatestReports/HIES-10.pdf _______. 2013a. 2012Statistical Yearbook of Bangladesh. Dhaka. _______. 2013b. Survey of Manufacturing Industries (SMI 2012). Dhaka. http://www.bbs.gov.bd/
WebTestApplication/userfiles/Image/LatestReports/SMI-%202012.pdf_______. 2014a. Report on Survey on the Use of Remittance (SUR) 2013. Dhaka._______. 2014b. Statistical Yearbook of Bangladesh 2013. Dhaka._______. 2016. Statistical Yearbook Bangladesh 2014. Dhaka. Bangladesh Export Processing Zones Authority. Year Wise Investment. http://epzbangladesh.org.bd/investmentsBangladesh Export Promotion Bureau. Statistic Data. http://epb.portal.gov.bd/site/files/e587b5b2-2ec8-4810-
9de0-e9eea1f0ee87/StatisticBangladesh Garment Manufacturers & Exporters Association (BGMEA). 2015. The Apparel Story. http://www.
bgmea.com.bd/media/newsletters/January-February-2015/January-February-2015.pdf
178
References
Bangladesh Institute of Development Studies. 2014. Regional Inequality in Bangladesh in the 2000s: Revisiting the East-West Divide Debate. Dhaka.
Bangladesh Ministry of Communication. 2009. Road Master Plan. Government of the People’s Republic of Bangladesh, Ministry of Communication, Roads and Highways Department. http://www.rthd.gov.bd/assets/docs/road_master_plan.pdf
Bangladesh Ministry of Power, Energy and Mineral Resources, Japan International Cooperation Agency, and The Tokyo Electric Power Co. Inc. 2011. Power Sector Masterplan 2010. http://www.bpdb.gov.bd/download/PSMP/PSMP2010(Summary).pdf
Bangladesh National Board of Revenue. Tariff Schedule. http://www.nbr.gov.bd/tariff_schedule.php?lan=eng; (accessed August 2015)
Bangladesh Power Development Board. 2013. Annual Report 2010–2011. Dhaka._______. 2015. Annual Report 2013-2014. Dhaka. _______. 2016. Annual Report 2014-2015. Dhaka. Bangladesh Railway. 2015. Master Plan of Bangladesh Railway. Dhaka. http://railway.portal.gov.bd/site/
page/8e5a704d-72e2–4d69-b443–21988229cbbc (in Bangla).Bangladesh Telecommunication Regulatory Commission. 2013. Annual Report 2012–2013. Dhaka.Barkat, A., S. Zaman and S. Raihan. 2000. Khas Land: A Study on Existing Law and Practice. Report prepared for the
Programme for Research on Poverty Alleviation, Grameen Trust, Grameen Bank, Dhaka.Barosso, L.A., T.H. Cavalcanti, P. Giesbertz, and K. Purchala. 2005. Classification of Electricity Market Models
Worldwide. Institute of Electrical and Electronics Engineers. Paper presented at the 2005 CIGRE/IEEE PES International Symposium. New Orleans. 5-7 October.
Barrientos, A. 2015. Is There a Role for Social Pensions in Asia? Asia & the Pacific Policy Studies. 2 (1). pp. 8–20, January 2015.
Bartelme D., and Y. Gorodnichenko. 2015. Linkages and Economic Development. National Bureau of Economic Research (NBER) Working Paper No. 21251. Cambridge: NBER.
Bateman, M. 2014. The Rise and Fall of Muhammad Yunus and the Microcredit Model. International Development Studies (IDS) Working Paper Series No. 1Nova Scotia. IDS. http://www.microfinancegateway.org/sites/default/files/mfg-en-paper-the-rise-and-fall-of-muhammad-yunus-and-the-microcredit-model-jan-2014.pdf
Berg, A. G. and J. D. Ostry. 2011. Inequality and Unsustainable Growth: Two Sides of the Same Coin? International Monetary Fund Staff Discussion Note. Washington, DC: IMF. SDN/11/08.
Bhowmikm R. and S.K. Bala. 2015. Amendments to Income Tax Statutes in 2015: Extents and Effects. The Cost And Management. 43 (3). May–June 2015. http://www.icmab.org.bd/images/stories/journal/2015/May-Jun/1-Amendments%20to%20Income%20Tax.pdf
British Geological Survey and Department of Public Health Engineering. 2001. Arsenic Contamination of Groundwater in Bangladesh. British Geological Survey Technical Report WC/00/19, Volume 2 (Final Report). Nottingham, England.
CARE. 2003. Land Policy and Administration in Bangladesh: A Literature Review. Care Rural Livelihoods Programme. May.
CCTV News. 2015. How is China's Garment Industry Dealing with Rising Labor Costs? (video), https://www.youtube.com/watch?v=Ofo_eQhD4HQ
Centre for Policy Dialogue. 2007. Bangladesh Vision 2021. Dhaka: Centre for Policy Dialogue. Chowdhury, M. and M. Baten. 2010. Increasing Landlessness and Its Impact on Food. Dhaka: Centre for Policy
Dialogue. http://papers.ssrn.com/sol3/papers.cfm?abstract_id=1663334 Chowdhury, S., G. Azam, and S. Islam. 2013. Problems and Prospects of SME Financing in Bangladesh. Asian
Business Review (2) 2. Issue 4. Chu, X. and K. Small. 2003. Hypercongestion. Journal of Transport Economics and Policy. 37 (3). pp. 319–352.
University of Bath.Comisión de Integración Energética Regional. 2012. Información del sector energético en países de America del
Sur, América Central y el Caribe. http://www.cier.org.uy/d06- sie/2013/sieCIER2013.pdfCrespi, G., E. Fernandez-Arias and E. Stein, eds. 2014. Rethinking Productive Development: Sound Policies and
Institutions for Economic Transformation. Washington, DC: Palgrave Mcmillan and Inter-American Development Bank.
179
References
Dhaka Tribune. 2014. Financial Inclusion: Challenges of SMEs and Start Ups. 23 December. http://www.dhakatribune.com/long-form/2014/dec/23/financial-inclusion-challenges-sme-and-start-ups
Dhaka Tribune. 2016. Tannery relocation likely to be complete by June. 11 January. http://www.dhakatribune.com/bangladesh/2016/jan/11/tannery-relocation-likely-be-complete-june
Deininger, K. 2004. Land Policies for Growth and Poverty Reduction: Key Issues and Challenges Ahead. Washington DC: WorldBank.
DeJongh, T. 2009. Assessing the Impact of Recent Credit Constraints on Energy Sector Investment Requirements in Bangladesh
Department of Environment. 2012. Bangladesh Environment and Climate Change Outlook (ECCO) 2012. June 2013. Government of Bangladesh, Dhaka.
Department of National Planning (DNP). 2010. Millennium Development Goals: Maldives Country Report 2010. Male: Government of Maldives, DNP. http://www.unicef.org/maldives/MDG_report_final_(july_11).pdf
Dhaka Electricity Supply Company (DESCO). 2011. Annual Reports. Dhaka. https://www.desco.org.bd/uploads/attachments/ann_rpt_2011.pdf
Dhaka Transport Co-Ordination Authority (DTCA). 2005. Strategic Transport Plan for Dhaka. Ministry of Communications, Government of Bangladesh.
Disaster Management Bureau. 2010. National Plan for Disaster Management 2010–2015. Disaster Management & Relief Division. Dhaka. http://faolex.fao.org/docs/pdf/bgd146945.pdf
Donnges, C., G. Edmonds, and B. Johanessen. 2007. Rural Road Maintenance: Sustaining the Benefits of Improved Access. Bangkok: International Labour Organization.
European Parliament. 2011. An Assessment of the Effects of Land Ownership and Land Grab on Development –With a Particular Focus on Small Holdings.
European Commission. Eurostat database. http://ec.europa.eu/eurostat/data/database Fadinger, H., C. Ghiglino and M. Teteryatnikova. 2015. Productivity, Networks and Input-Output Structure:
Preliminary and Incomplete. Paper presented at the 2015 Annual Meeting of the Society for Economic Dynamics. Warsaw, Poland. 25–27 June.
Faruqee, R., and B. Khalily. 2011. Multiple Borrowing by MFI Clients. Current Status and Implications for Future of Microfinance. Dhaka: Institute of Microfinance.
Felipe, J. A. Abdonand U. Kumar. 2012. Tracking the Middle-income Trap: What Is It, Who Is in It, and Why? Working Paper 715. New York: Levy Economics Institute of Bard College.
Fernandez-Stark, K., S. Frederick, and G. Gereffi. 2011. The Apparel Global Value Chain: Economic Upgrading and Workforce Development. Center on Globalization, Governance and Competitiveness. Durham, NC: Duke University,
Flanagan, S., R. Johnston, and Y. Zheng. 2012. Arsenic in Tube Well Water in Bangladesh: Health and Economic Impacts and Implications for Arsenic Mitigation. Bulletin of World Health Organization 90 (11). pp. 839–46. November.
Food and Agriculture Organization of the United Nations. 2010. Bangladesh: Eroding Rivers, Eroding Livelihoods, Environmental Context. Rome: FAO. http://www.fao.org/docrep/013/i1255b/i1255b03.pdf
Galor, O. and D. Weil. 1996. The Gender Gap, Fertility and Growth. The American Economic Review 86 (3). June. pp. 374–387
Germanwatch. 2016. Global Climate Risk Index 2016: Who Suffers the Most from Extreme Weather Conditions? Weather-Related Loss Events in 2014 and 1995–2014. Bonn: Germanwatch.
Goldin, C. 1990. Understanding the Gender Wage Gap: An Economic History of American Women. Oxford: Oxford University Press.
Government of Netherlands and Bangladesh Planning Commission. 2014. Bangladesh Delta Plan 2100 Formulation Project Inception Report. Bangladesh Planning Commission, Dhaka. http://bangladeshdeltaplan2100.org/wp-content/uploads/2016/02/Inception-Report-version-7-14-12-2014-jhr-final.pdf
Government of the People’s Republic of Bangladesh. 1996. Treaty Between the Government of the People’s Republic of Bangladesh and the Government of the Republic of India on Sharing of the Ganga/Ganges Waters at Farakka. Dhaka.
_______. 1998. National Policy for Safe Water Supply and Sanitation. Local Government Division, Ministry of Local Government, Rural Development and Cooperatives. Dhaka.
180
References
_______. 2001. National Water Management Plan. Ministry of Water Resources, Water Resources Planning Organization. Dhaka.
_______. 2005. National Sanitation Strategy. Local Government Division, Ministry of Local Government, Rural Development and Cooperatives, Dhaka, Bangladesh.
_______. 2010. Involuntary Resettlement Assessment and Measures: Bangladesh Sustainable Rural Infrastructure Improvement Project. Manila: ADB.
Grant, R.M. 1991. The Resource-Based Theory of Competitive Advantage: Implications for Strategy Formulation. California Management Review 33 (3). pp. 114–135.
Guillossou, J. N. 2007. People’s Republic of Bangladesh: Revival of Inland Water Transport-Options and Strategies. Bangladesh Development Series No. 20. Washington, DC: World Bank.
Gunatilake, H. and S. Raihan. 2014. Opportunity Cost of Natural Gas Subsidies in Bangladesh. ADB South Asia Working Paper Series. No. 25. Manila: ADB.
Haider, S. 2015. A Prescription for Growth. Dhaka Tribune. 13 February. http://www.dhakatribune.com/long-form/2015/feb/13/prescription-growth#sthash.Dxt5ucie.dpuf
Haq, A.I. 2016. What 2016 holds for BangladeshEeconomy. Financial Express. 16 January. http://www.thefinancialexpress-bd.com/2016/01/06/9527
Hassan, R. 2012. PPP in Bangladesh: Reality and Prospect. ASA University Review 6 (1). January–June.Hausmann, R. and C. Hidalgo. 2011. The Network Structure of Economic Output. Journal of Economic Growth.
Springer 16 (4): pp. 309–342. December. Hausmann, R., D. Rodrik, and A. Velasco. 2005. Growth Diagnostics. Cambridge, MA: John F. Kennedy School of
Government, Harvard University.HelpAge International. Social Pension Database. http://www.pension-watch.net/about-social-pensions/about-
social-pensions/social-pensions-database/Hidalgo, C.A. and R. Hausmann. 2009. The Building Blocks of Economic Complexity. Proceedings of the National
Academy of Sciences 106 (105). pp. 10570–10575Hossain, A. 2011. The Foreign-Income and Real-Exchange-Rate Elasticities of Bangladesh Exports. The Pakistan
Development Review 50 (2). pp. 119–144.Hossain, M. 2015. Improving Land Administration and Management in Bangladesh. Dhaka: Bangladesh Institute of
Development Studies.Hu, Y-W. and F. Stewart. 2009. Pension Coverage and Informal Sector Workers: International Experiences. OECD
Working Papers on Insurance and Private Pensions. No. 31. Paris: OECD. Integrated Research and Action for Development (IRADe). 2013. Prospects for Regional Cooperation on Cross-
Border Electricity Trade in South Asia. New Delhi: IRADe.International Energy Agency. 2013. World Energy Outlook 2013. Paris.International Energy Agency. IEA database. http://www.iea.org/. (Accessed January 2016)International Labour Organization. 2013. Bangladesh Country Report: Trade and Employment. ILO Country Office
for Bangladesh, Dhaka.International Monetary Fund. World Economic Outlook (WEO) Database. https://www.imf.org/external/pubs/ft/
weo/2015/01/weodata/index.aspx_______. 2008. Bangladesh: 2008 Article IV Consultation. IMF Country Report. No. 334. October. Washington, DC.
IMF._______. 2010. Bangladesh: 2009 Article IV Consultation. IMF Country Report. No. 10/55. February. Washington,
DC._______. 2011. Article IV Consultation. IMF Country Report No. 11/314. December. Washington, DC: IMF._______. 2013. Article IV Consultation. IMF Country Report. No. 13/357. December. Washington, DC: IMF._______. 2015. Bangladesh: Fifth and Sixth Reviews Under the Extended Credit Facility Arrangement— Press Release
and Staff Report. IMF Country Report. No. 15/304. Washington, DC: IMF._______. Balance of Payments Statistics. Database. http://data.imf.org/regular.aspx?key=60947517 _______. Financial Access Survey. IMF e-Library Data database. http://data.imf.org/?sk=E5DCAB7E-A5CA-4892-
A6EA-598B5463A34C. (accessed January 2016)International Social Security Association. 2015. Social Security Programs Throughout the World, Asia and the Pacific
2014. Washington, DC: Social Security Administration. https://www.ssa.gov/policy/docs/progdesc/ssptw/2014-2015/asia/ssptw14asia.pdf
181
References
International Telecommunication Union. ICT Indicators database. http://www.itu.int/en/ITU-D/Statistics/Pages/stat/default.aspx. (accessed January 2016)
IS Academy on Land Governance for Equitable and Sustainable Development. 2012. Bangladesh Factsheet. Utrecht, Netherlands. http://www.landgovernance.org/assets/2014/05/Bangladesh-Factsheet-20121.pdf
Islam, A., L. Yousuf, and I. Rahman. 2014. SME Financing in Bangladesh: A Comparative Analysis of Conventional and Islamic Banks. Journal of Islamic Banking and Finance 2 (1). pp. 79–92. http://aripd.org/journals/jibf/Vol_2_No_1_March_2014/5.pdf
Islam, R. 2007. Pre-and Post-Tsunami Coastal Planning and Land-use Policies and Issues in Bangladesh. Proceedings of the Workshop on Coastal Area Planning and Management in Asian Tsunami-affected Countries. Bangkok. 27-29 September 2006. http://www.fao.org/docrep/010/ag124e/AG124E05.htm
Islam, R. 2012. Key Factors and Readiness Perception Indicators Appraisal: Public–Private Partnership in Infrastructure Development Project in Bangladesh. Dhaka: BRAC University, Institute of Governance Studies.
Jaccard, M., M.R. Khan, and J. Richards. 2000. Natural Gas Options for Bangladesh. Dhaka: Center for Policy Research.
Johnson, S. and J. Williamson. 2006. Do Universal Non-Contributory Old-Age Pensions Make Sense for Rural Areas in Low-Income Countries? International Social Security Review 59 (4). pp. 47–65.
Kathuria, S. and M. Malouche. 2016. Toward New Sources of Competitiveness in Bangladesh: Key Insights of the Diagnostic Trade Integration Study. Directions in Development—Trade. Washington, DC: World Bank.
Khan, A.R. and M. Khan. 2010. Population Programs in Bangladesh: Problems, Prospects and Policy Issues. Dhaka. http://populationcommunication.com/wp-content/uploads/2014/06/Bangladesh_report.pdf
Khan, S., F. Shaheen, M. Yusuf, and A. Tanveer. 2007. Regional Integration, Trade and Conflict in South Asia. Winnipeg, Canada: International Institute for Sustainable Development. https://www.iisd.org/pdf/2007/tas_rta_south_asia.pdf
Khan, S., M. Toaha, and M. Awal. 2009. Automated Digital Archive for Land Registration and Records. International Technology Management Review 2 (1). pp. 50–65.
Khan, T. and R. Islam. 2013. Estimating Costs of Traffic Congestion in Dhaka City. International Journal of Engineering Science and Innovative Technology. 2 (3). pp. 281–289.
Khan, W., E. Hossin and J. Akbor. 2015. Leather Industry in Bangladesh: A Systematic Literature Review. Asian Business Review. 5 (3). pp. 111–118. http://journals.abc.us.org/index.php/abr/article/view/591/424
Khandker, S., S. Hussain, and A. Rubaba. 2013. Does Access to Finance Matter in Enterprise Growth? Evidence from Bangladesh. Institute of Microfinance Working Paper No. 15. Dhaka. http://www.inm.org.bd/publication/workingpaper/workingpaper15.pdf
Khondker, B. and M. Mahzab. 2015. Lagging Districts Development. Background study paper for preparation of the Seventh Five-Year Plan. Dhaka: Bangladesh Institute of Development Studies.
Kidd, S. 2015. Establishing Comprehensive National Old Age Pension Systems. Materials on Development Financing. No. 8. Frankfurt: KfW Development Bank. https://www.kfw-entwicklungsbank.de/PDF/Download-Center/Materialien/Nr.-8_establishing-comprehensive-national-old-age-pension-systems.pdf
Kidd, S. and B. Khondker. 2015. Bangladesh Approves, In Principle, Its National Social Security Strategy. Development Pathways. 5 May. http://www.developmentpathways.co.uk/resources/bangladesh-approves-its-national-social-security-strategy/
Koskennurmi-Sivonen, R. and P. Pietarila. 2009. Quality Clothes—An Outline of a Model for Assessing the Quality of Customized Clothing. University of Helsinki. http://www.helsinki.fi/~rkosken/quality.pdf
Kuwahara, M. 2007. Microsimulation of Freeway Ramp Merging Processes under Congested Traffic Conditions. IEEE Transactions on Intelligent Transportation Systems 8 (3). pp. 470–479.
Lindsey, R. and E. Verhoef. 1999. Congestion Modeling. Tinbergen Institute Discussion Papers 99–091/3. Tinbergen Institute. Netherlands.
_______. 2000. Congestion Modelling. In David A. Hensher and Kenneth J. Button, eds. Handbooks in Transport, 1: Handbook of Transport Modelling. pp. 353–373. Elsevier: Amsterdam.
Lu, S. 2015. 2015 U.S. Fashion Industry Benchmark Study. United States Fashion Industry Association. June.Lucintel. 2013. Global Leather Goods Industry: Trend, Profit and Forecast Analysis. Irving, Texas: Lucintel. Mahmud, T. and J. Rossette. 2007. Problems and Potentials of Chittagong Port: A Follow-up Diagnostic Study.
Working paper. Transparency International Bangladesh. Dhaka. http://www.ti-bangladesh.org/beta3/index.php/en/research-policy/92-diagnostic-study/499-problems-and-potentials-of-chittagong-port-a-follow-up-diagnostic-study
182
References
Major, J. 2016. “Assessment of Marginal External Costs of Transport in Dhaka and of Congestion Pricing as a Transport Demand Management Tool.” Background paper prepared for the Asia Development Bank, Manila.
Mammen, K. and C. Paxson. 2000. Women's Work and Economic Development. Journal of Economic Perspectives 14 (4). pp. 141–164.
Martinez, L.A. 2012. The Country-Specific Nature of Apparel Elasticities and Impacts of the Multi-Fibre Arrangement. Honors Projects. Paper 49. Macalester College, St. Paul, Minnesota. http://digitalcommons.macalester.edu/economics_honors_projects/49
Masud, M. 2013. Bangladesh Pharmaceutical Sector: An Overview. Pharmabiz.com. 26 September. http://www.pharmabiz.com/ArticleDetails.aspx?aid=77989&sid=21
McKellar, L. ed. 2009. Pension Systems for the Informal Sector in Asia. Social Protection and Labor Discussion Paper. No. 0903. Human Development Network. Washington, DC: World Bank. http://siteresources.worldbank.org/SOCIALPROTECTION/Resources/SP-Discussion-papers/Pensions-DP/0903.pdf
McKinsey & Company Inc. 2011. Bangladesh’s Ready-Made Garments Landscape: The Challenge of Growth. November. https://www.mckinsey.de/sites/mck_files/files/2011_McKinsey_Bangladesh.pdf
Microcredit Regulatory Authority. 2015. An Overview of Microcredit in Bangladesh. Dhaka. http://www.mra.gov.bd/images/mra_files/News/mcinbd17082015.pdf
Microfinance Regulatory Authority. 2014. An Overview of Microfinance in Bangladesh. Dhaka. http://www.mra.gov.bd/images/mra_files/Publications/microcredit%20in%20bd14072014.pdf
Ministry of Communications. 2009. Road Master Plan: Volume 1 Main Text. Dhaka.Ministry of Finance. 2010. Towards Revamping Power and Energy Sector: A Road Map. Dhaka: Finance Division,
Ministry of Finance._______. 2015b. Bangladesh Economic Review 2014. Dhaka: Bangladesh Government Press. Ministry of Health and Family Welfare. 2011. Health, Population, and Nutrition Sector Development Program 2011–
2016. Dhaka._______. 2013. Human Resources for Health Country Profile Bangladesh. Dhaka. http://www.searo.who.int/
bangladesh/publications/hrh_pofile1.pdf?ua=1Ministry of Local Government, Rural Development and Cooperatives. 2011. National Urban Sector Policy Draft.
Local Government Division, Ministry of Local Government, Rural Development and Cooperatives. Dhaka.
_______. 2012. Perspective Plan of Bangladesh 2010–2021. Dhaka. http://www.plancomm.gov.bd/upload/2014/Perspective%20Plan/Perspective%20Plan_Final.pdf
_______. 2015. “Agriculture Sector Development Strategy.” Background paper for preparation of 7th Five Year Plan. http://www.plancomm.gov.bd/wp-content/uploads/2015/02/17_-Agriculture-Sector-Development-Strategy.pdf
Ministry of Power, Energy and Mineral Resources. 2008. 3-year Road Map for Power Sector Reform (2008–2010). Dhaka
Ministry of Primary and Mass Education. 2014. Annual Primary School Census. Dhaka.Ministry of Road Transport and Bridges. 2009. Road Master Plan 2009. Road Transport and Highways Division,
Dhaka. http://www.rthd.gov.bd/assets/docs/road_master_plan.pdfMinistry of Statistics and Programme Implementation (MOSPI). 2015. Millennium Development Goals: India
Country Report 2015. Dhaka. http://mospi.nic.in/Mospi_New/upload/mdg_26feb15.pdfMinistry of Environment and Forests. 2001. State of the Environment Bangladesh 2001. Dhaka. http://www.moef.gov.
bd/html/state_of_env/state_of_env.html Miyan, M.A. 2005. Retirement and Pension System in Bangladesh. International University of Business Agriculture
and Technology, Dhaka http://www.pensiondevelopment.org/documenten/Retirement%20and%20Pension%20System%20in%20Bangladesh%20M%20Alimullah%20Miyan.pdf
Morgan Stanley. 2015. Bangladesh Ready Made Garments Industry: Moving Towards Sustainability. Executive Summary. Morgan Stanley, New York. https://www.morganstanley.com/sustainableinvesting/pdf/Bangladesh_Garments_Industry_Exec_Summary.pdf
Mostofa, M. and S. Islam. 2013. A Snapshot Survey of Cyber Café Users in Dhaka City, Bangladesh. Research Journal of Recent Sciences. 2(3), pp. 53-58, http://www.isca.in/rjrs/archive/v2/i3/9.ISCA-RJRS-2012-421.pdf
National Institute of Population Research and Training. 2011. Bangladesh Demographic and Health Survey 2011. Dhaka. http://dhsprogram.com/pubs/pdf/fr265/fr265.pdf
183
References
National Planning Commission (NPC). 2013. Nepal Millennium Development Goals: Progress Report 2013. Kathmandu. http://www.npc.gov.np/images/download/mdg-report-2013.pdf
North, D. C., J. J. Wallis, S. B. Webb, and B. R. Weingast. 2007. Limited Access Orders in the Developing World: A New Approach to the Problems of Development. World Bank Policy Research Working Paper 4359. Washington, DC: World Bank.
Nuruzzaman, N. et al. 2014. A Study on Quality of Life of Elderly Population in Bangladesh. American Journal of Health Research 2 (4). pp.152–157. http://article.sciencepublishinggroup.com/pdf/10.11648.j.ajhr.20140204.18.pdf
Ostry, J., A. Berg, and C. Tsangarides. 2014. Redistribution, Inequality and Growth. IMF Staff Discussion Note. Washington, DC: International Monetary Fund.
Pallares-Miralles, M., C. Romero, and E. Whitehouse. 2012. International Patterns of Pension Provision II: A Worldwide View of Facts and Figures. World Bank Social Protection & Labor Discussion Paper. No. 1211. Washington, DC: World Bank.
Park, D. and G B. Estrada. 2014. Emerging Asia’s Public Pension Systems: Challenges and Reform Efforts. In Equitable and sustainable pensions: challenges and experience. Washington, DC : International Monetary Fund, https://www.imf.org/external/np/seminars/eng/2013/oapfad/pdf/park_ppr.pdf
Paul, H. L., A. P. M. Antunes, A. D. Covington, P. Evans, and P. S. Phillips. 2013. Bangladeshi Leather Industry: An Overview of Recent Sustainable Developments. Journal of the Society of Leather Technologists and Chemists 97. pp. 25–32. 0144–0322.
Petrobangla. 2015. Annual Report 2015. Dhaka.Planning Commission. 2011. Sixth Five Year Plan, FY 2011–FY2015: Accelerating Growth and Reducing Poverty. Dhaka._______. 2015a. Seventh Five-Year Plan FY2016-FY2020: Accelerating Growth, Empowering Citizens. Dhaka:
Government of Bangladesh._______. 2015b. Millennium Development Goals Bangladesh Progress Report 2015. Dhaka. http://www.plancomm.gov.
bd/wp-content/uploads/2015/09/MDGs-Bangladeh-Progress-Report_-PDF_Final_September-2015.pdf_______. 2015c. National Social Security Strategy (NSSS) of Bangladesh. Dhaka. http://www.plancomm.gov.bd/wp-
content/uploads/2015/04/Final-Draft-of-National-Social-Security-Strategy_NSSS.pdf _______. 2015d. Agricultural Sector Development Strategy: Background Paper for Preparation of 7th Five Year
Plan. Dhaka. http://www.plancomm.gov.bd/wp-content/uploads/2015/02/17_-Agriculture-Sector-Development-Strategy.pdf
PKF Accountants and Business Advisers. 2013. Technical Report: Leather Sector. Report on the Technical Assistance to Stimulate Applications for the SME Competitiveness Grant Scheme under the European Union’s INSPIRED Program for Bangladesh. Brussels. http://euinspired.org.bd/docs/grant_scheme/INSPIRED%20-%20Leather%20Sector%20Report%20-%20Jan%2013.pdf
Policy Research Institute of Bangladesh. 2015. Diversification of Export: The Options. Report prepared by Policy Research Institute of Bangladesh for the Asian Development Bank, September. http://www.pri-bd.org/
Porter, M. 1990.The Competitive Advantage of Nations. New York: Free Press.Porter, M. 1998. Clusters and the New Economics of Competition. Harvard Business Review. November-
December. pp. 77–90.Power Grid Company of Bangladesh Limited. 2015. Annual Report 2014–2015. Dhaka. https://www.pgcb.org.bd/
PGCB/upload/Reports/Annual%20Report%20(Including%20Directors%20Report)%202014-2015.pdfPriyambada, K. 2014. Apparel Production Overview. Online slide review. http://www.slideshare.net/
PriyambadaKhushboo/apparel-manufacturing-processPublic Utility Commission of Sri Lanka. Tariff Revision 2014. http://www.pucsl.gov.lk/english/information-centre/
tariff-revision-2013/Radelet, S. and J. Sachs. 1998. Shipping Costs, Manufactured Exports and Economic Growth. Columbia University
Academic Commons.Rahman, A., M. Abdullah, A. Haroon, and R. Tooheen. 2013. ICT Impact on Socio-Economic Conditions of Rural
Bangladesh. Journal of World Economic Research. 2 (1). pp. 1–8.Rahman, H. and S. Manprasert. 2006. Landlessness and its Impact on Economic Development: A Case Study on
Bangladesh. Journal of Social Sciences 2. pp. 54–60. Rahman, H. 2008. Agricultural Land Use and Land Susceptibility in Bangladesh: An Overview. Earth Community
Organization, the Global Community Global File. http://globalcommunitywebnet.com/GlobalFiles/2004WorkHasiburrahman.htm
184
References
Rahman, S. and M. Rahman. 2008. Impact of Land Fragmentation and Resource Ownership on Productivity and Efficiency: The Case of Rice Producers in Bangladesh. Land Use Policy. 26 (1). pp. 95–103.
Rahman, S., M. Mannan, and M. Mamun. 2014. Implementation of Congestion Pricing: A Solution for Bangladesh. Presented at the Second International Conference on Advances in Civil Engineering 2014. Chittagong, Bangladesh. 26–28 December.
Rahman, S. B. 2015. Shining Future for Bangladesh Leather Sector as China Shifts Focus. bdnews24.com. 9 March. http://bdnews24.com/business/2015/03/09/shining-future-for-bangladesh-leather-sector-as-china-shifts-focus
Rahman, S. H., P. D. C. Wijayatunga, H. Gunatilake, and P. N. Fernando. 2011. Energy Trade in South Asia: Opportunities and Challenges. Manila: ADB.
Raihan, S. 1999. The Textile and Clothing Industry of Bangladesh: In a Changing World Economy. Centre for Policy Dialogue Report. No. 18. Dhaka. http://www.cpd.org.bd/pub_attach/DR-18.pdf
Raihan, S. 2015. Economic Diversification, Structural Change and Employment in Bangladesh. Forthcoming. Background Paper pepared for the Bangladesh Employment Diagnostics Study. Manila.
Ramey, G. and V. Ramey. 1995. Cross-Country Evidence on the Link Between Volatility and Growth. The American Economic Review. 85 (5). pp. 1138–1151.
Romer, P. 1986. Increasing Returns and Long-Run Growth. Journal of Political Economy. 94 (5). pp. 1002–37.RootsBD.com. 2015. New Price List of Gas—Bangladesh Energy Regulatory Commission. 27 August. http://rootsbd.
com/bangladesh/new-price-gas-electricity-bangladesh-september-2015-www-berc-org-bd/.Saez, C. 2015. LDC Pharma IP Waiver Until 2033 Approved by WTO TRIPS Council. Intellectual Property Watch.
6 November. http://www.ip-watch.org/2015/11/06/ldc-pharma-ip-waiver-until-2033-approved-by-wto-trips-council/
Saha, S. 2015. Leather Sector Sees Record Exports. The Daily Star. 8 March. http://www.thedailystar.net/leather-sector-sees-record-exports-33201
Saricam, C., A. Aksoy, and F. Kalaoglu. 2012. Determination of the Priorities of Customer Requirements and Quality in Apparel Retail Industry. International Journal of Business and Science. 3 (16). pp. 242–250. http://ijbssnet.com/journals/Vol_3_No_16_Special_Issue_August_2012/26.pdf
Sattar, Z. 2015. Diversification of Exports: The Options. Presentation at ADB Workshop, Bangladesh Country Diagnostic Studies, Dhaka, Bangladesh. August 2015.
Sen, A. 2011. Growth and Other Concerns. The Hindu. 14 February. http://www.thehindu.com/opinion/op-ed/growth-and-other-concerns/article1451973.ece
Shafi, S. 2011. Keynote Paper on Urban Land Tenure and Housing. Presented at the Bangladesh Urban Forum, Dhaka. 5–7 December. http://www.bufbd.org/download?download=7:housing-land-tenure
Shahabuddin, Q. and Z. Ali. 2006. Natural Disasters, Risks, Vulnerability and Persistence of Poverty: An Analysis of Household Level Data. Dhaka: Bangladesh Institute of Development Studies. http://r4d.dfid.gov.uk/PDF/Outputs/ChronicPoverty_RC/wp15fulltext.pdf
Social Security Administration (SSA). 2014. Social Security Protection Throughout the World: Asia and the Pacific, 2014. Washington
Somville, X. and C. Vandawalle. 2015. Switching from Cash to Account-Based Transfers Triggers Savings among the Poor. voxeu. 11 May. http://www.voxeu.org/article/triggering-savings-among-poor
Statista. Apparel Market Size Projections from 2012 to 2025, by Region (in billion U.S. dollars). Online statistics database. http://www.statista.com/statistics/279757/apparel-market-size-projections-by-region/
The Asia Foundation. 2010. Promoting Public–Private Partnership in Bangladesh. Dhaka: The Asia Foundation. http://www.asiafoundation.org/resources/pdfs/PromotingPublicPrivatePartnershipinBangladesh.pdf
The Economist Intelligence Unit. 2015. Global Liveability Ranking 2015. http://www.eiu.com/public/thankyou_download.aspx?activity=download&campaignid=Liveability2015
Transparency International Bangladesh. 2012. Corruption in Service Sectors: National Household Survey 2012. Dhaka._______. 2014. National Integrity Assessment Bangladesh. Dhaka.United Nations. 2015. World Population Prospects. The 2015 Revision. Department of Economic and Social Affairs.
New York: United Nations._______. 2015. The Millennium Development Goals Report 2015. New York: United Nations.United Nations Conference of Trade and Development (UNCTAD). 2014. The Impact of Access to Financial
Services, Including by Highlighting the Impact on Remittances on Development: Economic Empowerment of Women and Youth. Expert meeting on the Bangladesh Country Paper. http://unctad.org/meetings/en/Presentation/ciem6_2014_Bangladesh_en.pdf
185
References
UNICEF. Arsenic Mitigation in Bangladesh. Key Statistics. http://www.unicef.org/bangladesh/Arsenic.pdf_______. Rural Sanitation, Hygiene and Water Supply. Key Statistics. (http://www.unicef.org/bangladesh/RURAL_
Water_Sanitation_and_Hygiene.pdf United Nations Department of Economics and Social Affairs (UNDESA). World Population Prospects, the 2015
Revision. https://esa.un.org/unpd/wpp/Download/Standard/Population/United Nations Development Programme (UNDP). 2015. Human Development Report 2015: Work for Human
Development. New York: UNDP.United Nations Economic and Social Commission for Asia and the Pacific (UNESCAP). 2016. Statistical Yearbook
for Asia and the Pacific 2015. New York: UNESCAP. http://www.unescap.org/resources/statistical-yearbook-asia-and-pacific-2015
United Nations Environment Programme (UNEP). 2013. Scoping Study: The State of Social Housing in Bangladesh. Sustainable Social Housing Initiative. UNEP.
United Nations Statistics Division (UNSD). Undata database. http://data.un.org/Explorer.aspx?d=SNA _______. Millennium Development Goals Indicators database. http://unstats.un.org/unsd/mdg/default.aspxUnited Nations (UN) Sri Lanka. 2015. Millennium Development Goals Country Report 2014. Colombo: UN Sri Lanka.
http://un.lk/wp-content/uploads/2015/03/MDG-Country-Report-2014.pdfUrban Partnerships for Poverty Reduction (UPPR). 2011. Poor Settlements in Bangladesh: An Assessment of 29 UPPR
Towns and Cities. Dhaka: UPPR.United States (US) Department of State. 2014. Investment Climate Statement–Bangladesh June 2014. http://
www.state.gov/e/eb/rls/othr/ics/2014/228770.htm _______. 2014. Bangladesh Investment Climate Statement. Washington: US Department of State.US Energy Information Administration. International Energy Statistics.http://www.iea.org/statistics/United States Agency for International Development (USAID) and Department for International Development
of the United Kingdom (UK DFID). 2014. Bangladesh Inclusive Growth Diagnostic. https://www.gov.uk/government/uploads/system/uploads/attachment_data/file/364930/Bangladesh_Inclusive_Growth_Diagnostic_-_Final_Report.pdf
USAID. 2004. Innovative Approaches to Slum Electrification. Washington, DC: http://pdf.usaid.gov/pdf_docs/PNADB219.pdf
_______. 2010. USAID Country Profile Property Rights and Resource Governance Bangladesh. Washington, DC. http://usaidlandtenure.net/sites/default/files/country-profiles/full-reports/USAID_Land_Tenure_Bangladesh_Profile.pdf
Vlachantoni, V. and J. Falkingham. 2013. Gender and Old-Age Pension Protection in Asia. Pension Watch. 4 December. http://www.pension-watch.net/blogs/athina-vlachantoni-and-jane-falkingham-21253/gender-and-oldage-pension-protection-in-asia-658/
Verhoef, E. T. 1998. An Integrated Model of Road Traffic Congestion Based on Simple Car-Following Theory. Discussion Paper TI 98–030/3. Amsterdam-Rotterdam: Tinbergen Institute.
_______. 2001. An Integrated Dynamic Model of Road Traffic Congestion Based on Simple Car-Following Theory: Exploring Hypercongestion. Journal of Urban Economics. 49 (3). pp. 505–542.
Wang, Z., S. Wei, and K. Zhu. 2014. Quantifying International Production Sharing at the Bilateral and Sector Levels. Office of Economics Working Paper No 2014-04A. Washington, DC: US International Trade Commission.
Wijayatunga, P. and P. N. Fernando. 2013. An Overview of Energy Cooperation in South Asia. Manila: ADB.Wijayatunga, P., D. Chattopadhaya, and P. N. Fernando. 2015. Cross-Border Power Trading in South Asia: A
Techno Economic Rationale. ADB South Asia Working Paper Series. Manila: ADB.Winter, A. and V. Govindajaran. 2015. Engineering Reverse Innovations. Harvard Business Review. July-August 2015.
pp. 80–89.World Bank. Commodity Markets database. http://www.worldbank.org/en/research/commodity-markets_______. World Development Indicators database. http://databank.worldbank.org/data/home.aspx_______. Worldwide Governance Indicators database. http://data.worldbank.org/data-catalog/worldwide-
governance-indicators_______. 2005. Improving Trade and Transport Efficiency—Understanding the Political Economy of Chittagong
Port. Bangladesh Development Series Paper No. 6. Dhaka: World Bank. _______. 2006. Bangladesh Country Environmental Analysis. Bangladesh Development Series Paper No. 12. Dhaka:
World Bank.
186
References
_______. 2008a. Harnessing Competitiveness for Stronger Inclusive Growth. Bangladesh Second Investment Climate Assessment. Bangladesh Development Series Paper No. 25. Dhaka: World Bank.
_______. 2008b. Potential and Prospects for Regional Energy Trade in the South Asia Region. ESMAP Formal Report 334/08. Washington, DC.
_______. 2008c. Public and Private Sector Approaches to Improving Pharmaceutical Quality in Bangladesh. Bangladesh Development Series Paper No. 23. Washington, DC: World Bank.
_______. 2009a. Bangladesh: Transport Policy Note. Washington, DC._______. 2009b. Dhaka: Improving Living Conditions for the Urban Poor. Bangladesh Development Series Paper No.
17. Washington, DC: World Bank._______. 2010a. Agricultural Insurance in Bangladesh Promoting Access to Small and Marginal Farmers.
Washington, DC._______. 2010b. Addressing the Electricity Access Gap: Background Paper for the World Bank Group Energy Sector
Strategy. Washington DC. June 2010._______. 2011. Access to Financial Services and the Financial Inclusion Agenda around the World, A Cross
Country Analysis with a New Data Set. Policy Research Working Papers. Washington, DC: World Bank._______. 2012a. Bangladesh: Towards Accelerated, Inclusive and Sustainable Growth–Opportunities and Challenges.
Volume 1. Dhaka: World Bank._______. 2012b. Bangladesh: Towards Accelerated, Inclusive and Sustainable Growth–Opportunities and Challenges.
Volume 2. Dhaka: World Bank._______. 2014. Project Performance Assessment Report: Bangladesh Rural Electrification and Renewal Energy
Development Project Washington, DC. _______. 2013a. Bangladesh Poverty Assessment: Assessing a Decade of Progress in Reducing Poverty, 2000–
2010. The World Bank Development Series Paper No. 31. Dhaka._______. 2013b. Bangladesh Enterprise Survey 2013. World Bank Enterprise Surveys. http://www.enterprisesurveys.
org/data/exploreeconomies/2013/bangladesh#finance--sector _______. 2014. Bangladesh Development Update. Poverty Reduction and Economic Management, South Asia
Region. Washington DC._______. 2015a. Doing Business 2015: Going Beyond Efficiency. Washington, DC: World Bank._______. 2015b. Bangladesh: More and Better Jobs to Accelerate Shared Growth and End Extreme Poverty: A Systemic
Country Diagnostic. South Asia Region. Washington DC. _______. 2016a. Doing Business 2016: Measuring Regulatory Quality and Efficiency. Washington, DC:
World Bank. _______. 2016b. Dynamics of Rural Growth in Bangladesh:Agriculture Global Practice. Report number 103244-BD.
Washington, DC: World Bank. _______. 2016c. Bangladesh - Country Partnership Framework for the Period FY16–20. Washington, DC.World Economic Forum. 2014. Global Competitiveness Report 2014–2015. Geneva. http://www3.weforum.org/docs/
WEF_GlobalCompetitivenessReport_2014–15.pdf _______. 2015a. Global Competitiveness Report 2015–2016. Geneva. http://www3.weforum.org/docs/gcr/2015–
2016/Global_Competitiveness_Report_2015–2016.pdf _______. 2015b. Human Capital Report 2015. Geneva._______. 2015c. The Travel and Tourism Competitiveness Report 2015. Geneva.World Health Organization (WHO). Global Health Observatory Data Repository database. http://apps.who.int/
gho/data/node.main_______. 2012. Spending on Health: A Global Overview. Media Centre. http://www.who.int/mediacentre/
factsheets/fs319/en/_______. Bangladesh: Neonatal and Child Health Profile. Department of Maternal, Newborn, Child and
Adolescent Health. WHO. http://www.who.int/maternal_child_adolescent/epidemiology/profiles/neonatal_child/bgd.pdf
WHO and UNDP. 2009. The Energy Access Situation in Developing Countries: A Review Focusing on the Least Developed Countries and Sub-Saharan Africa. New York. http://www.undp.org/content/dam/undp/library/Environment%20and%20Energy/Sustainable%20Energy/energy-access-situation-in-developing-countries.pdf
World Trade Organization Statistics database. http://stat.wto.org
187
References
Zahid, Z. and S. R. U. Ahmed. 2006. Groundwater Resources Development in Bangladesh: Contribution to Irrigation for Food Security and Constraints to Sustainability. Bangladesh Water Development Board Ground Water, Hydrology Division. Dhaka.
Zaman, S., S. Matin, and A. Kibria. 2014. A Study on Present Scenario of Child Labor in Bangladesh. IOSR Journal of Business and Management. 16 (6). pp. 25-36. http://iosrjournals.org/iosr-jbm/papers/Vol16-issue6/Version-3/C016632536.pdf
Zhuang, J. 2008. Inclusive Growth Toward a Harmonious Society in the People’s Republic of China: Policy Implications. Asian Development Review 25 (1 and 2). Manila: ADB.
Zhuang, J., R. Kanbur, and C. Rhee, eds. 2014. Inequality in Asia and the Pacific: Trends, Drivers and Policy Implications. Abingdon: Asian Development Bank and Routledge.

ASIAN DEVELOPMENT BANK6 ADB Avenue, Mandaluyong City1550 Metro Manila, Philippineswww.adb.org
BANGLADESH: Consolidating Export-led GrowthCountry Diagnostic Study
Bangladesh has transformed its economy over the last 2 decades, graduating to middle-income status as average annual growth remained strong at 5%–6%. The country’s goal to become an upper-middle-income country by 2021 will require even stronger annual growth of 7.5%–8%. This study finds that the most critical constraints to growth are (i) insufficient reliable energy supply, (ii) policies that indirectly stunt development of economic activities unrelated to ready-made garment exports, and (iii) insufficient security about property and land rights due in part to inadequate registry systems. If policies are designed to urgently tackle these constraints, Bangladesh will be free to harness its potential for inclusive and sustainable growth.
About the Asian Development Bank
ADB’s vision is an Asia and Pacific region free of poverty. Its mission is to help its developing member countries reduce poverty and improve the quality of life of their people. Despite the region’s many successes, it remains home to half of the world’s extreme poor. ADB is committed to reducing poverty through inclusive economic growth, environmentally sustainable growth, and regional integration.
Based in Manila, ADB is owned by 67 members, including 48 from the region. Its main instruments for helping its developing member countries are policy dialogue, loans, equity investments, guarantees, grants, and technical assistance.