Embed Size (px)
Citation preview

COPYRIGHT © 2013 ALCATEL-LUCENT. ALL RIGHTS RESERVED.
1 1
Ed Harstead & Randy Sharpe, members of Fixed Networks CTO, Alcatel-Lucent Ottawa IEEE 802.3 NGEPON Interim meeting 8 September 2014
Bandwidth demand forecasting (for TR section 4.2.2)
COPYRIGHT © 2013 ALCATEL-LUCENT. ALL RIGHTS RESERVED.
2 2
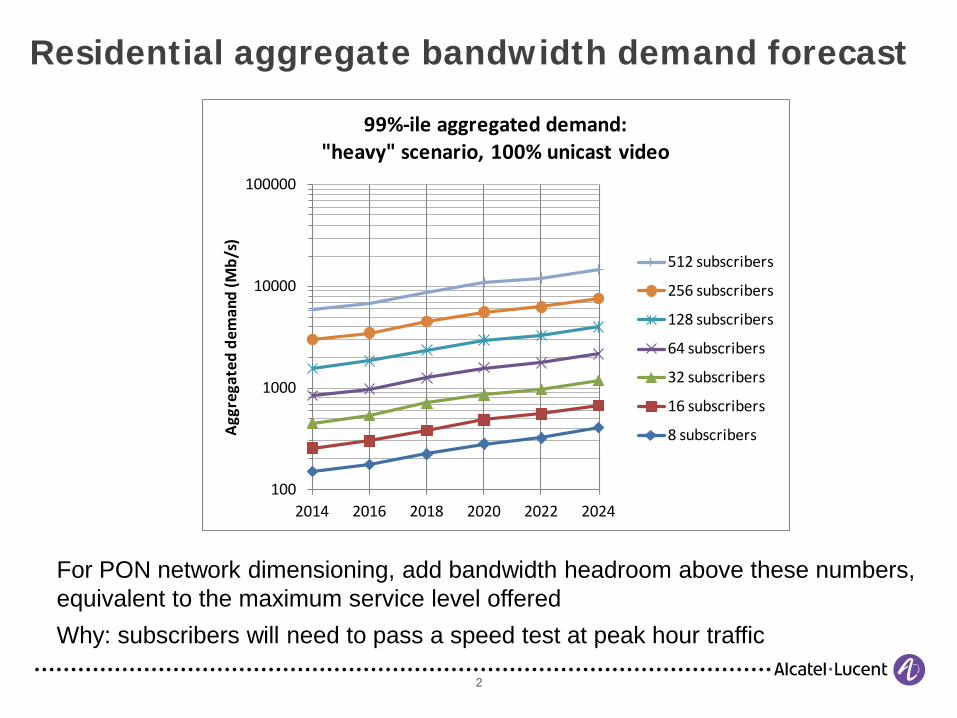
Residential aggregate bandwidth demand forecast
100
1000
10000
100000
2014 2016 2018 2020 2022 2024
Agg
rega
ted
dem
and
(Mb/
s)
99%-ile aggregated demand: "heavy" scenario, 100% unicast video
512 subscribers
256 subscribers
128 subscribers
64 subscribers
32 subscribers
16 subscribers
8 subscribers
For PON network dimensioning, add bandwidth headroom above these numbers, equivalent to the maximum service level offered Why: subscribers will need to pass a speed test at peak hour traffic
COPYRIGHT © 2013 ALCATEL-LUCENT. ALL RIGHTS RESERVED.
3 3
Aggregate bandwidth demand model
100
1000
10000
100000
2014 2016 2018 2020 2022 2024
Agg
rega
ted
dem
and
(Mb/
s)
99%-ile aggregated demand: "heavy" scenario, 100% unicast video
512 subscribers
256 subscribers
128 subscribers
64 subscribers
32 subscribers
16 subscribers
8 subscribers
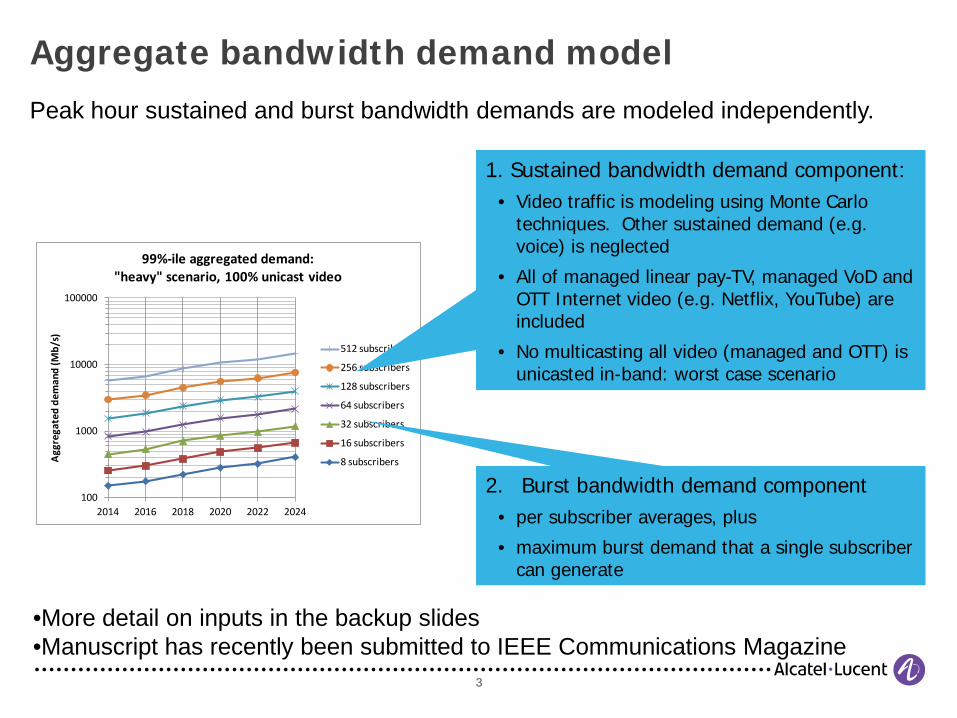
Peak hour sustained and burst bandwidth demands are modeled independently.
1. Sustained bandwidth demand component: • Video traffic is modeling using Monte Carlo
techniques. Other sustained demand (e.g. voice) is neglected
• All of managed linear pay-TV, managed VoD and OTT Internet video (e.g. Netflix, YouTube) are included
• No multicasting all video (managed and OTT) is unicasted in-band: worst case scenario
2. Burst bandwidth demand component • per subscriber averages, plus
• maximum burst demand that a single subscriber can generate
•More detail on inputs in the backup slides •Manuscript has recently been submitted to IEEE Communications Magazine
COPYRIGHT © 2013 ALCATEL-LUCENT. ALL RIGHTS RESERVED.
4 4
100
1000
10000
2014 2016 2018 2020 2022 2024
Band
wid
th (M
b/s)
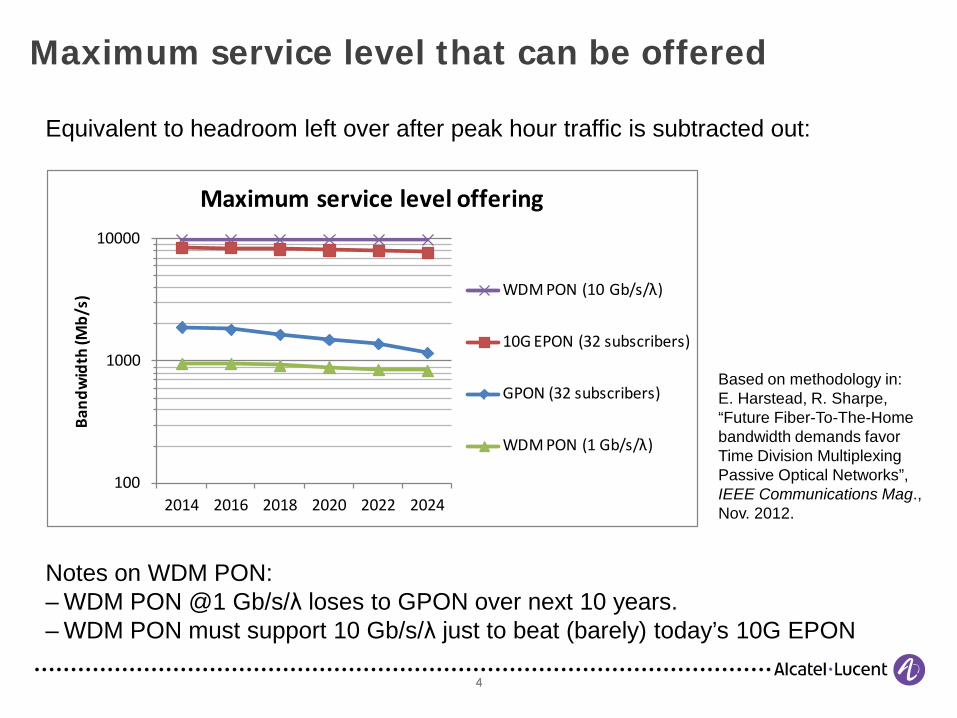
Maximum service level offering
WDM PON (10 Gb/s/λ)
10G EPON (32 subscribers)
GPON (32 subscribers)
WDM PON (1 Gb/s/λ)
Maximum service level that can be offered
Equivalent to headroom left over after peak hour traffic is subtracted out:
Notes on WDM PON: – WDM PON @1 Gb/s/λ loses to GPON over next 10 years. – WDM PON must support 10 Gb/s/λ just to beat (barely) today’s 10G EPON
Based on methodology in: E. Harstead, R. Sharpe, “Future Fiber-To-The-Home bandwidth demands favor Time Division Multiplexing Passive Optical Networks”, IEEE Communications Mag., Nov. 2012.
COPYRIGHT © 2013 ALCATEL-LUCENT. ALL RIGHTS RESERVED.
5 5
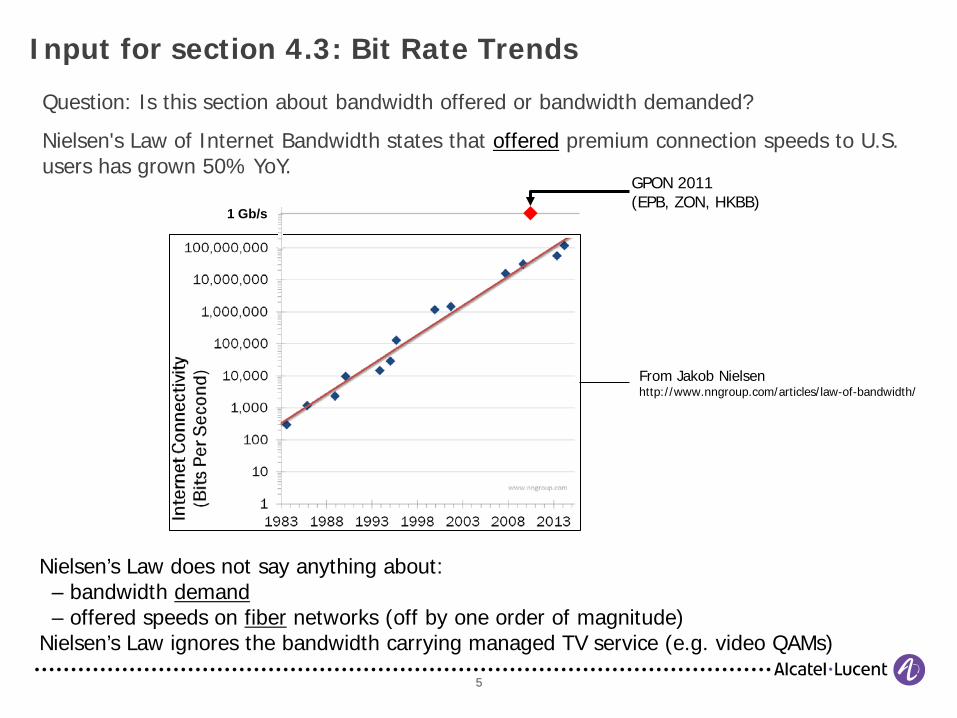
Input for section 4.3: Bit Rate Trends Question: Is this section about bandwidth offered or bandwidth demanded?
Nielsen's Law of Internet Bandwidth states that offered premium connection speeds to U.S. users has grown 50% YoY.
From Jakob Nielsen http://www.nngroup.com/articles/law-of-bandwidth/
Nielsen’s Law does not say anything about: – bandwidth demand – offered speeds on fiber networks (off by one order of magnitude)
Nielsen’s Law ignores the bandwidth carrying managed TV service (e.g. video QAMs)
1 Gb/s
GPON 2011 (EPB, ZON, HKBB)
COPYRIGHT © 2013 ALCATEL-LUCENT. ALL RIGHTS RESERVED.
6 6
Backup
COPYRIGHT © 2013 ALCATEL-LUCENT. ALL RIGHTS RESERVED.
7 7
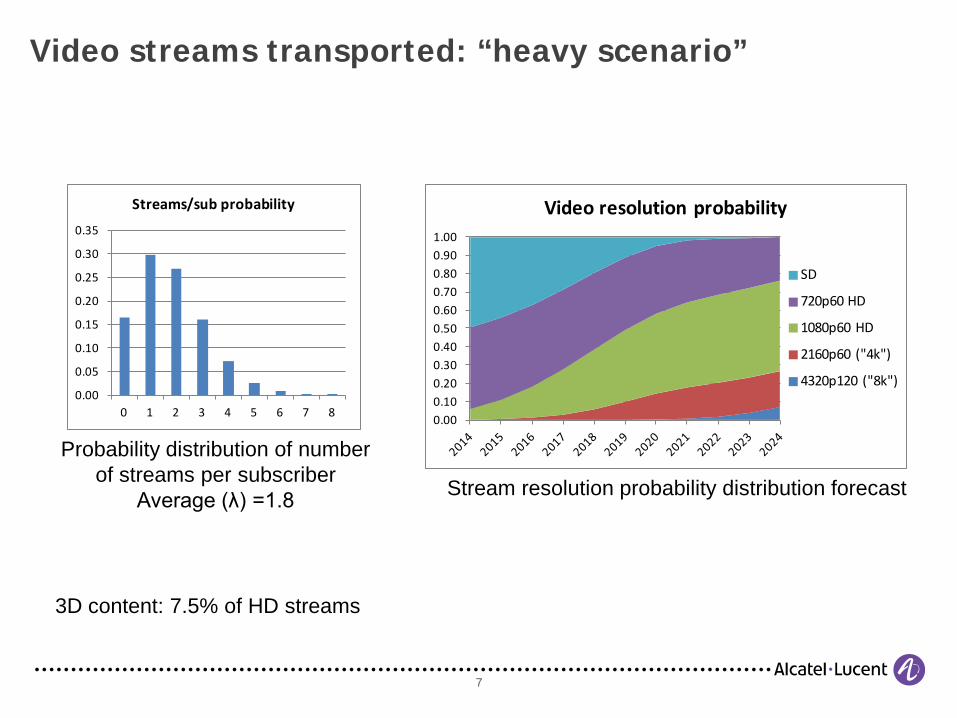
Video streams transported: “heavy scenario”
0.00
0.05
0.10
0.15
0.20
0.25
0.30
0.35
0 1 2 3 4 5 6 7 8
Streams/sub probability
Probability distribution of number of streams per subscriber
Average (λ) =1.8
0.000.100.200.300.400.500.600.700.800.901.00
Video resolution probability
SD
720p60 HD
1080p60 HD
2160p60 ("4k")
4320p120 ("8k")
Stream resolution probability distribution forecast
3D content: 7.5% of HD streams
COPYRIGHT © 2013 ALCATEL-LUCENT. ALL RIGHTS RESERVED.
8 8
0.000.100.200.300.400.500.600.700.800.901.00
Video resolution probability
SD
720p60 HD
1080p60 HD
2160p60 ("4k")
4320p120 ("8k")0.00
0.05
0.10
0.15
0.20
0.25
0.30
0.35
0.40
0 1 2 3 4 5 6 7 8
Streams/sub probability
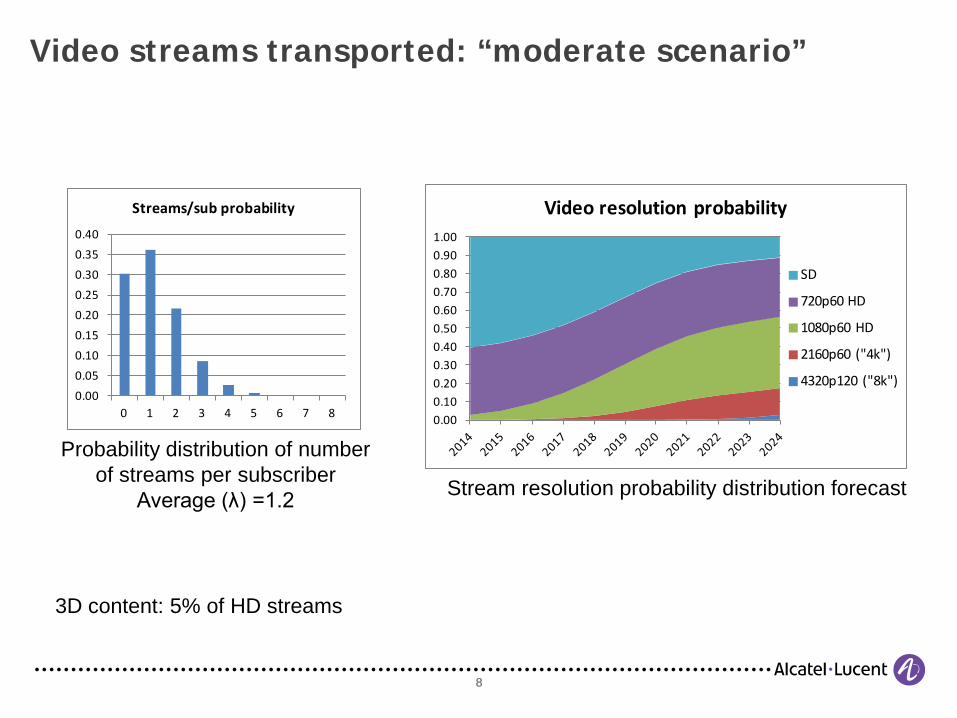
Video streams transported: “moderate scenario”
Probability distribution of number of streams per subscriber
Average (λ) =1.2 Stream resolution probability distribution forecast
3D content: 5% of HD streams
COPYRIGHT © 2013 ALCATEL-LUCENT. ALL RIGHTS RESERVED.
9 9
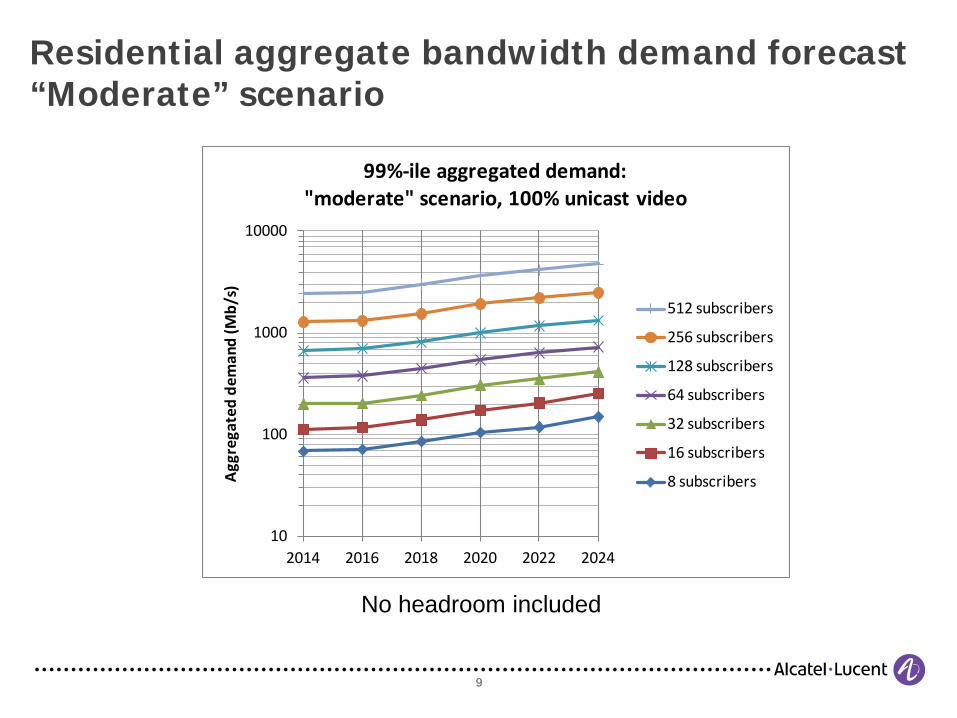
Residential aggregate bandwidth demand forecast “Moderate” scenario
10
100
1000
10000
2014 2016 2018 2020 2022 2024
Agg
rega
ted
dem
and
(Mb/
s)
99%-ile aggregated demand:"moderate" scenario, 100% unicast video
512 subscribers
256 subscribers
128 subscribers
64 subscribers
32 subscribers
16 subscribers
8 subscribers
No headroom included
COPYRIGHT © 2013 ALCATEL-LUCENT. ALL RIGHTS RESERVED.
10 10
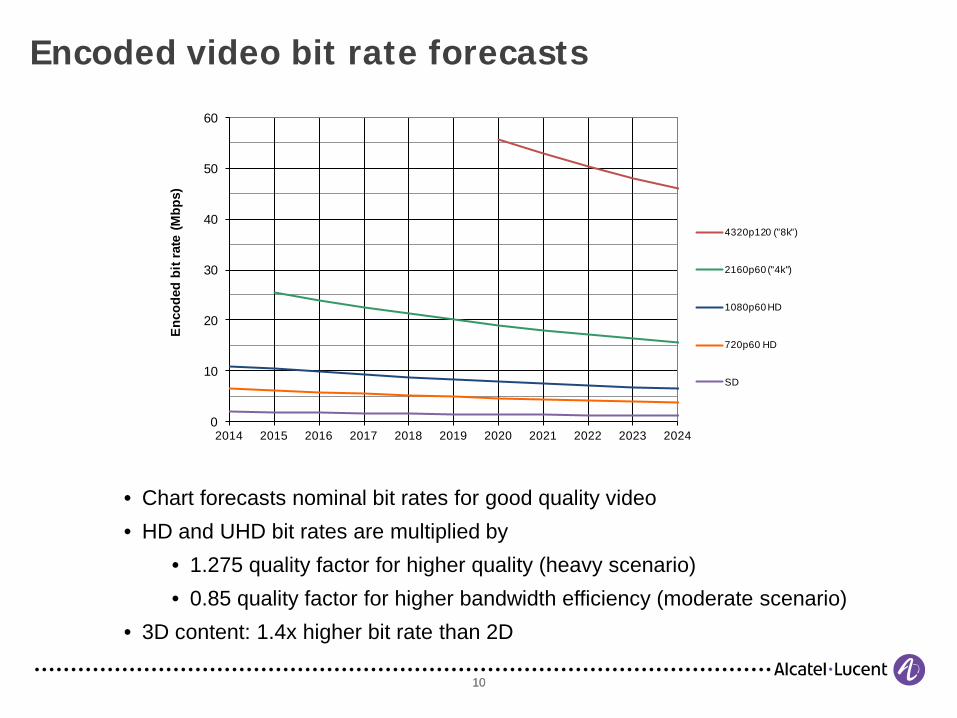
Encoded video bit rate forecasts
0
10
20
30
40
50
60
2014 2015 2016 2017 2018 2019 2020 2021 2022 2023 2024
Enco
ded
bit r
ate
(Mbp
s)
4320p120 ("8k")
2160p60 ("4k")
1080p60 HD
720p60 HD
SD
• Chart forecasts nominal bit rates for good quality video • HD and UHD bit rates are multiplied by
• 1.275 quality factor for higher quality (heavy scenario) • 0.85 quality factor for higher bandwidth efficiency (moderate scenario)
• 3D content: 1.4x higher bit rate than 2D
COPYRIGHT © 2013 ALCATEL-LUCENT. ALL RIGHTS RESERVED.
11 11
Burst traffic demand component
Cox reported an average of 400 kb/s of downstream DOCSIS traffic per subscriber during peak hour in 2014[1]. This is consistent with private data from other operators.
– Assume that to first order it is all Internet traffic (neglect managed VoD) – Based on Sandvine measurements[2] 36% of that traffic is bursty: 144
kb/s average peak hour bursty traffic per subscriber on a DOCSIS network.
– Traffic could be higher on fiber networks: multiply by 1.5x: 216 kb/s per subscriber
– We grow this number by 21% YoY based on inputs from the Cisco VNI[3] and Pyramid[4] and multiplying by 1.5x
[1] J. Finkelstein, A. Bernstein, S. Parikh, “SDN and NFV for Cable Networks”, 2014 Spring Technical Forum (NCTA, SCTE and CableLabs), Los Angeles, CA. [2] Sandvine, ”Global Internet Phenomena Report: 1H 2014”, https://www.sandvine.com/trends/global-internet-phenomena/ [3] Cisco, “Cisco Visual Networking Index: Forecast and Methodology, 2012–2017”, http://www.cisco.com/en/US/solutions/collateral/ns341/ns525/ns537/ns705/ns827/white_paper_c11-481360.pdf, May 2013. [4] Pyramid Research, “Western Europe Fixed Forecast Pack 2Q2013” and “North America Fixed Forecast Pack, 2Q2013”, June 2013.

COPYRIGHT © 2013 ALCATEL-LUCENT. ALL RIGHTS RESERVED.
12 12
Streaming video bandwidth demand, single subscriber: upper bound
0
50
100
150
200
250
2011 2012 2013 2014 2015 2016 2017 2018 2019 2020 2021 2022 2023 2024 2025
Ban
dwid
th d
eman
d (M
b/s)
15% YoY upper bound
4
1080p60
720p60
SD
2160p60
4320p120
Assumes no significant impact of 3D video
Based on methodology in: E. Harstead, R. Sharpe, “Future Fiber-To-The-Home bandwidth demands favor Time Division Multiplexing Passive Optical Networks”, IEEE Communications Mag., Nov. 2012.
COPYRIGHT © 2013 ALCATEL-LUCENT. ALL RIGHTS RESERVED.
13 13
0
100
200
300
400
500
600
700
800
900
1000
0
2000
4000
6000
8000
10000
12000
14000
16000
18000
20000
2012 2013 2014 2015 2016 2017
Traffic per subscriber (kb/s)
Tota
l Tra
ffic
(Cis
co V
NI)
(PB/
mon
th)
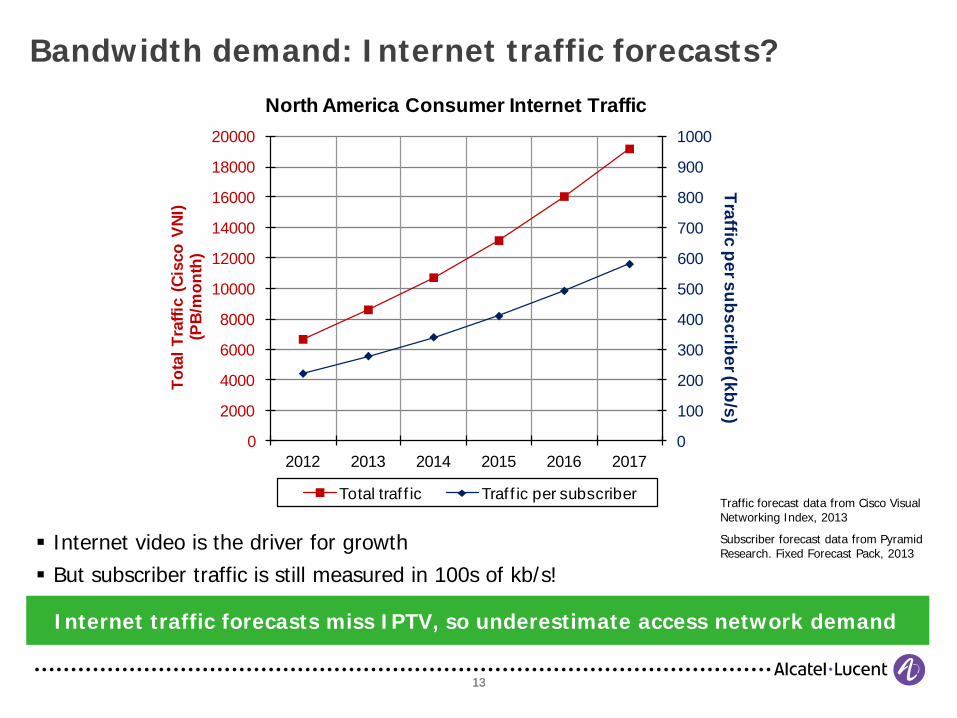
North America Consumer Internet Traffic
Total traf f ic Traf f ic per subscriber
Bandwidth demand: Internet traffic forecasts?
Internet traffic forecasts miss IPTV, so underestimate access network demand
Internet video is the driver for growth But subscriber traffic is still measured in 100s of kb/s!
Traffic forecast data from Cisco Visual Networking Index, 2013
Subscriber forecast data from Pyramid Research. Fixed Forecast Pack, 2013
COPYRIGHT © 2013 ALCATEL-LUCENT. ALL RIGHTS RESERVED.
14 14