Embed Size (px)
Citation preview
Significant presence in under-penetrated
markets
Largest microlender with best-in-class
asset quality
Superior profitability; initiate with BUY and
TP of INR 595
7 May 2018
INDIA | BANKING | COVERAGE INITIATION
Bandhan Bank Sui Generis: In a league of its own
JM Financial Institutional Securities Limited Page 2
RECENT INITIATIONS
Bandhan is India’s largest microfinance lender. After its successful transition to a universal banking franchise, it is now the most profitable universal bank in India. The strength of Bandhan’s unique micro-lending franchise is exhibited by its asset quality metrics, which are among the best in class, superior cost efficiencies and the rapid ramp-up in its liabilities franchise. With a dominant presence in Eastern India, Bandhan now intends to expand its geographical presence as well as product suite.
7 May 2018
INDIA | BANKING | COVERAGE INITIATION
GALAXY SURFACTANTS PARAG MILK FOODSAVENUE SUPERMARTS RELIANCE NIPPON LIFE
ASSET MANAGEMENTMID-SIZED
PRIVATE BANKS
T A B L E O F C O N T E N T S
Introduction
Key charts
Microfinance Industry – Baptism by fire
Micro-lending in the banking framework
Bandhan – An improvised micro-lender
A highly granular retail asset mix
Scale-up of deposits the real success story
The advantage of the East
Industry leader in terms of profitability
Valuation
Risks
3
4
5
14
21
27
29
31
40
43
44
Financial tables 47
JM Financial Institutional Securities Limited Page 3
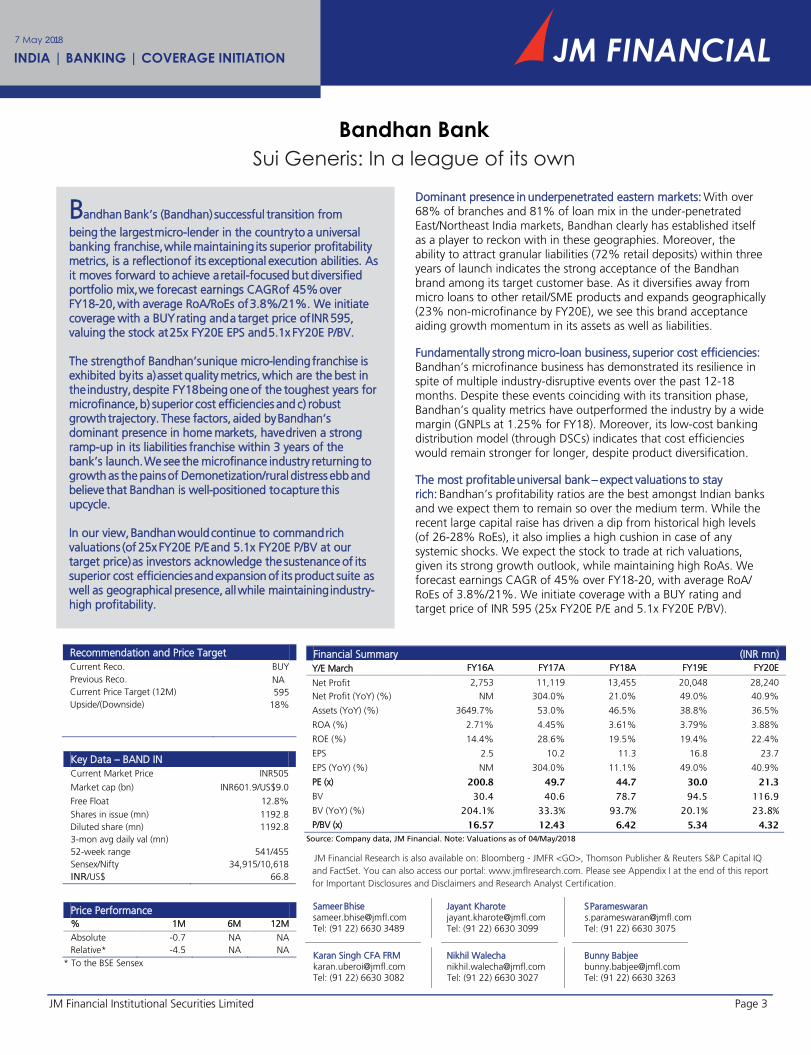
Dominant presence in underpenetrated eastern markets: With over 68% of branches and 81% of loan mix in the under-penetrated East/Northeast India markets, Bandhan clearly has established itself as a player to reckon with in these geographies. Moreover, the ability to attract granular liabilities (72% retail deposits) within three years of launch indicates the strong acceptance of the Bandhan brand among its target customer base. As it diversifies away from micro loans to other retail/SME products and expands geographically (23% non-microfinance by FY20E), we see this brand acceptance aiding growth momentum in its assets as well as liabilities.
Fundamentally strong micro-loan business, superior cost efficiencies: Bandhan’s microfinance business has demonstrated its resilience in spite of multiple industry-disruptive events over the past 12-18 months. Despite these events coinciding with its transition phase, Bandhan’s quality metrics have outperformed the industry by a wide margin (GNPLs at 1.25% for FY18). Moreover, its low-cost banking distribution model (through DSCs) indicates that cost efficiencies would remain stronger for longer, despite product diversification.
The most profitable universal bank – expect valuations to stay rich: Bandhan’s profitability ratios are the best amongst Indian banks and we expect them to remain so over the medium term. While the recent large capital raise has driven a dip from historical high levels (of 26-28% RoEs), it also implies a high cushion in case of any systemic shocks. We expect the stock to trade at rich valuations, given its strong growth outlook, while maintaining high RoAs. We forecast earnings CAGR of 45% over FY18-20, with average RoA/RoEs of 3.8%/21%. We initiate coverage with a BUY rating and target price of INR 595 (25x FY20E P/E and 5.1x FY20E P/BV).
Bandhan Bank’s (Bandhan) successful transition from
being the largest micro-lender in the country to a universal banking franchise, while maintaining its superior profitability metrics, is a reflection of its exceptional execution abilities. As it moves forward to achieve a retail-focused but diversified portfolio mix, we forecast earnings CAGR of 45% over FY18-20, with average RoA/RoEs of 3.8%/21%. We initiate coverage with a BUY rating and a target price of INR 595, valuing the stock at 25x FY20E EPS and 5.1x FY20E P/BV.
The strength of Bandhan’s unique micro-lending franchise is exhibited by its a) asset quality metrics, which are the best in the industry, despite FY18 being one of the toughest years for microfinance, b) superior cost efficiencies and c) robust growth trajectory. These factors, aided by Bandhan’s dominant presence in home markets, have driven a strong ramp-up in its liabilities franchise within 3 years of the bank’s launch. We see the microfinance industry returning to growth as the pains of Demonetization/rural distress ebb and believe that Bandhan is well-positioned to capture this upcycle.
In our view, Bandhan would continue to command rich valuations (of 25x FY20E P/E and 5.1x FY20E P/BV at our target price) as investors acknowledge the sustenance of its superior cost efficiencies and expansion of its product suite as well as geographical presence, all while maintaining industry-high profitability.
Bandhan Bank Sui Generis: In a league of its own
7 May 2018
INDIA | BANKING | COVERAGE INITIATION
JM Financial Research is also available on: Bloomberg - JMFR <GO>, Thomson Publisher & Reuters S&P Capital IQ and FactSet. You can also access our portal: www.jmflresearch.com. Please see Appendix I at the end of this report for Important Disclosures and Disclaimers and Research Analyst Certification.
Sameer Bhise [email protected] Tel: (91 22) 6630 3489
Jayant [email protected] Tel: (91 22) 6630 3099
S Parameswaran [email protected]: (91 22) 6630 3075
Karan Singh CFA [email protected] Tel: (91 22) 6630 3082
Nikhil [email protected] Tel: (91 22) 6630 3027
Bunny Babjee [email protected] Tel: (91 22) 6630 3263
Recommendation and Price Target BUY NA 595
18%
Current Reco. Previous Reco. Current Price Target (12M) Upside/(Downside)
Key Data – BAND IN INR505
INR601.9/US$9.0
12.8%
1192.8 1192.8
541/455 34,915/10,618
Current Market Price
Market cap (bn)
Free Float Shares in issue (mn) Diluted share (mn) 3-mon avg daily val (mn)52-week rangeSensex/Nifty INR/US$ 66.8
Price Performance % 1M 6M 12M
Absolute -0.7 NA NA Relative* -4.5 NA NA
* To the BSE Sensex
Financial Summary (INR mn)
Y/E March FY16A FY17A FY18A FY19E FY20E
Net Profit 2,753 11,119 13,455 20,048 28,240
Net Profit (YoY) (%) NM 304.0% 21.0% 49.0% 40.9%
Assets (YoY) (%) 3649.7% 53.0% 46.5% 38.8% 36.5%
ROA (%) 2.71% 4.45% 3.61% 3.79% 3.88%
ROE (%) 14.4% 28.6% 19.5% 19.4% 22.4%
EPS 2.5 10.2 11.3 16.8 23.7
EPS (YoY) (%) NM 304.0% 11.1% 49.0% 40.9%
PE (x) 200.8 49.7 44.7 30.0 21.3
BV 30.4 40.6 78.7 94.5 116.9
BV (YoY) (%) 204.1% 33.3% 93.7% 20.1% 23.8%
P/BV (x) 16.57 12.43 6.42 5.34 4.32
Source: Company data, JM Financial. Note: Valuations as of 04/May/2018
Bandhan Bank 07 May 2018
JM Financial Institutional Securities Limited Page 4
Key charts
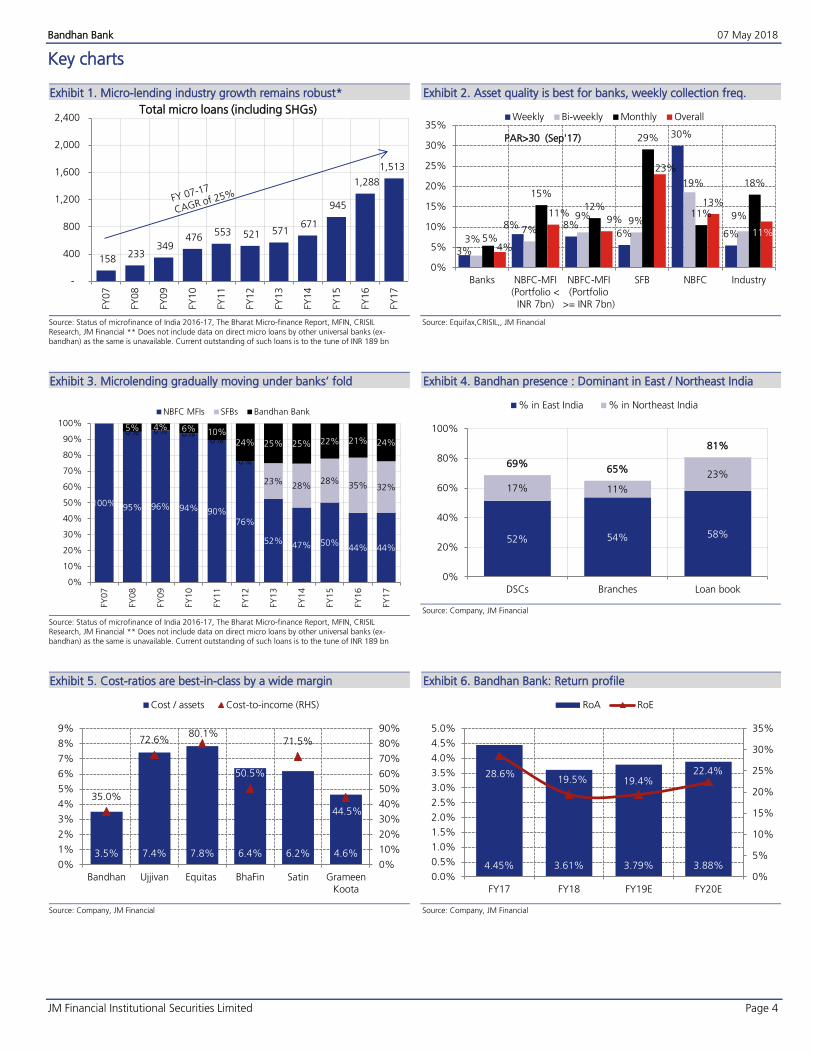
Micro-lending industry growth remains robust* Exhibit 1.
Source: Status of microfinance of India 2016-17, The Bharat Micro-finance Report, MFIN, CRISIL
Research, JM Financial ** Does not include data on direct micro loans by other universal banks (ex-bandhan) as the same is unavailable. Current outstanding of such loans is to the tune of INR 189 bn
Asset quality is best for banks, weekly collection freq. Exhibit 2.
Source: Equifax,CRISIL,, JM Financial
Microlending gradually moving under banks’ fold Exhibit 3.
Source: Status of microfinance of India 2016-17, The Bharat Micro-finance Report, MFIN, CRISIL Research, JM Financial ** Does not include data on direct micro loans by other universal banks (ex-bandhan) as the same is unavailable. Current outstanding of such loans is to the tune of INR 189 bn
Bandhan presence : Dominant in East / Northeast India Exhibit 4.
Source: Company, JM Financial
Cost-ratios are best-in-class by a wide margin Exhibit 5.
Source: Company, JM Financial
Bandhan Bank: Return profile Exhibit 6.
Source: Company, JM Financial
158 233
349 476
553 521 571 671
945
1,288
1,513
-
400
800
1,200
1,600
2,000
2,400FY
07
FY08
FY09
FY10
FY11
FY12
FY13
FY14
FY15
FY16
FY17
Total micro loans (including SHGs)
3%
8% 8%6%
30%
6%3%
7%
9%9%
19%
9%
5%
15%
12%
29%
11%
18%
4%
11%9%
23%
13%
11%
0%
5%
10%
15%
20%
25%
30%
35%
Banks NBFC-MFI(Portfolio <INR 7bn)
NBFC-MFI(Portfolio
>= INR 7bn)
SFB NBFC Industry
Weekly Bi-weekly Monthly Overall
PAR>30 (Sep'17)
100% 95% 96% 94% 90%76%
52% 47% 50%44% 44%
0% 0% 0%0%
0%
23%28%
28%35% 32%
5% 4% 6% 10%24% 25% 25% 22% 21% 24%
0%
10%
20%
30%
40%
50%
60%
70%
80%
90%
100%
FY07
FY08
FY09
FY10
FY11
FY12
FY13
FY14
FY15
FY16
FY17
NBFC MFIs SFBs Bandhan Bank
52% 54% 58%
17% 11%
23%69%
65%
81%
0%
20%
40%
60%
80%
100%
DSCs Branches Loan book
% in East India % in Northeast India
3.5% 7.4% 7.8% 6.4% 6.2% 4.6%
35.0%
72.6%80.1%
50.5%
71.5%
44.5%
0%
10%
20%
30%
40%
50%
60%
70%
80%
90%
0%
1%
2%
3%
4%
5%
6%
7%
8%
9%
Bandhan Ujjivan Equitas BhaFin Satin GrameenKoota
Cost / assets Cost-to-income (RHS)
4.45% 3.61% 3.79% 3.88%
28.6%19.5% 19.4%
22.4%
0%
5%
10%
15%
20%
25%
30%
35%
0.0%
0.5%
1.0%
1.5%
2.0%
2.5%
3.0%
3.5%
4.0%
4.5%
5.0%
FY17 FY18 FY19E FY20E
RoA RoE
Bandhan Bank 07 May 2018
JM Financial Institutional Securities Limited Page 5
Microfinance Industry – Baptism by fire
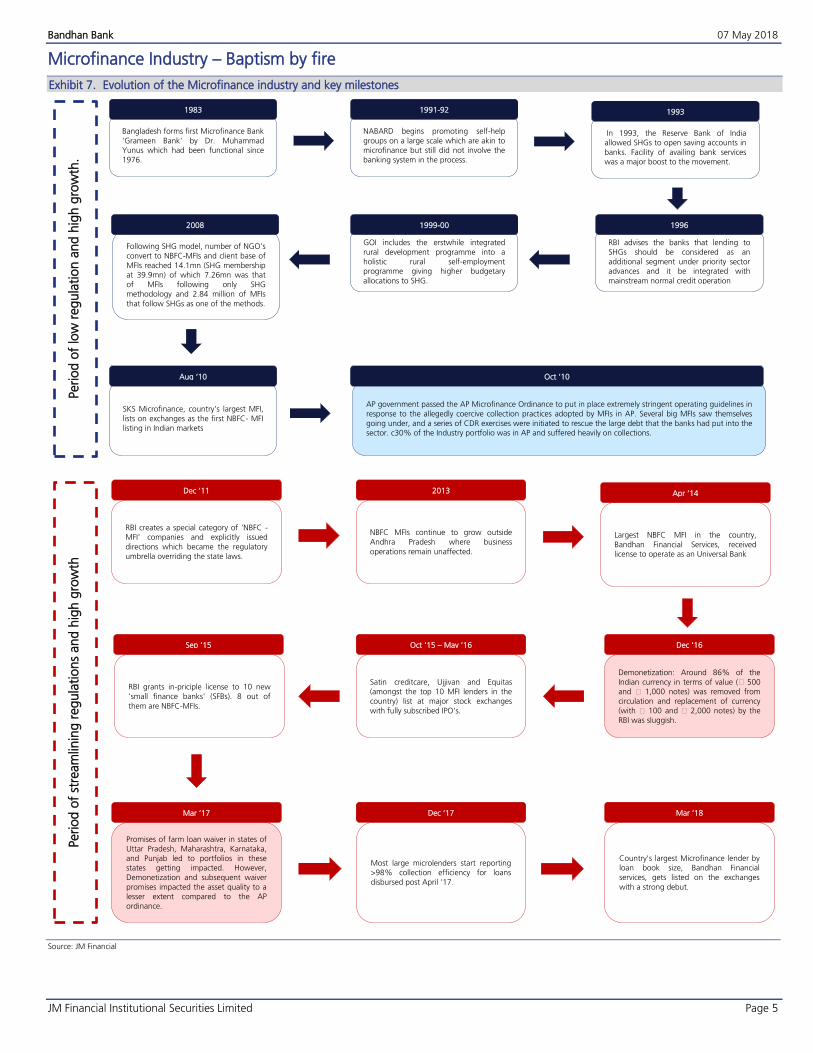
Evolution of the Microfinance industry and key milestones Exhibit 7.
Source: JM Financial
Bangladesh forms first Microfinance Bank
'Grameen Bank' by Dr. Muhammad Yunus which had been functional since
1976.
1983
NABARD begins promoting self-help
groups on a large scale which are akin to microfinance but still did not involve the
banking system in the process.
1991-92
In 1993, the Reserve Bank of India allowed SHGs to open saving accounts in
banks. Facility of availing bank services was a major boost to the movement.
1993
RBI advises the banks that lending to
SHGs should be considered as an additional segment under priority sector advances and it be integrated with
mainstream normal credit operation
1996
GOI includes the erstwhile integrated
rural development programme into a holistic rural self-employment programme giving higher budgetary
allocations to SHG.
1999-00
Following SHG model, number of NGO's convert to NBFC-MFIs and client base of
MFIs reached 14.1mn (SHG membership at 39.9mn) of which 7.26mn was that
of MFIs following only SHG methodology and 2.84 million of MFIs
that follow SHGs as one of the methods.
2008
SKS Microfinance, country’s largest MFI,
lists on exchanges as the first NBFC- MFI
listing in Indian markets
Aug ‘10
AP government passed the AP Microfinance Ordinance to put in place extremely stringent operating guidelines in response to the allegedly coercive collection practices adopted by MFIs in AP. Several big MFIs saw themselves
going under, and a series of CDR exercises were initiated to rescue the large debt that the banks had put into the sector. c30% of the Industry portfolio was in AP and suffered heavily on collections.
Oct ‘10
RBI creates a special category of 'NBFC - MFI' companies and explicitly issued
directions which became the regulatory umbrella overriding the state laws.
Dec ‘11
NBFC MFIs continue to grow outside
Andhra Pradesh where business
operations remain unaffected.
2013
Largest NBFC MFI in the country,
Bandhan Financial Services, received license to operate as an Universal Bank
Apr ‘14
Demonetization: Around 86% of the Indian currency in terms of value (₹ 500 and ₹ 1,000 notes) was removed from
circulation and replacement of currency (with ₹ 100 and ₹ 2,000 notes) by the
RBI was sluggish.
Dec ‘16
Satin creditcare, Ujjivan and Equitas (amongst the top 10 MFI lenders in the
country) list at major stock exchanges with fully subscribed IPO's.
Oct ‘15 – May ‘16
RBI grants in-priciple license to 10 new
'small finance banks' (SFBs). 8 out of
them are NBFC-MFIs.
Sep ‘15
Promises of farm loan waiver in states of Uttar Pradesh, Maharashtra, Karnataka,
and Punjab led to portfolios in these states getting impacted. However,
Demonetization and subsequent waiver
promises impacted the asset quality to a lesser extent compared to the AP
ordinance.
Mar ‘17
Most large microlenders start reporting >98% collection efficiency for loans
disbursed post April '17.
Dec ‘17
Country's largest Microfinance lender by loan book size, Bandhan Financial
services, gets listed on the exchanges
with a strong debut.
Mar ‘18
Period
of
low
reg
ula
tio
n a
nd
hig
h g
row
th.
Period
of
stre
am
linin
g r
eg
ula
tio
ns
an
d h
igh
gro
wth
Bandhan Bank 07 May 2018
JM Financial Institutional Securities Limited Page 6
Evolution of micro-lending in India
After micro lending was successfully executed in Bangladesh in 1983 – through the ‘Grameen
Bank’ by Dr. Muhammad Yunus – India decided to adopt the model in a modified form. In 1991-92, the National Bank for Agriculture and Rural Development (NABARD) started promoting self-help groups (SHGs) on a large scale, which was the real take-off point for the ‘SHG movement’. After FY01, SHGs began scaling up in size and loan book as they received impetus in the form of Government of India (GOI) budgetary allocations and policy push.
However, further extension of credit lines by banks to SHGs depended on the savings deposit pool, which could only grow slowly from these credit-deficient segments of the population.
Up to the mid-2000s some NBFCs had begun microfinance lending, but primarily using the SHG model barring the requirement of a savings balance. While a pilot with c.1000 groups was formed on the JLG model (joint group liability vs. individual liability in SHGs) by Germany’s Development Bank GTZ, the JLG model did not scale up meaningfully until 2007-08. It was during this time that many earlier NGOs operating in this segment began converting to NBFCs as they had scaled up their books and wanted to streamline their accounts and finance functions. Until this time, most micro lending in India followed NABARD guidelines in the absence of a clear regulator.
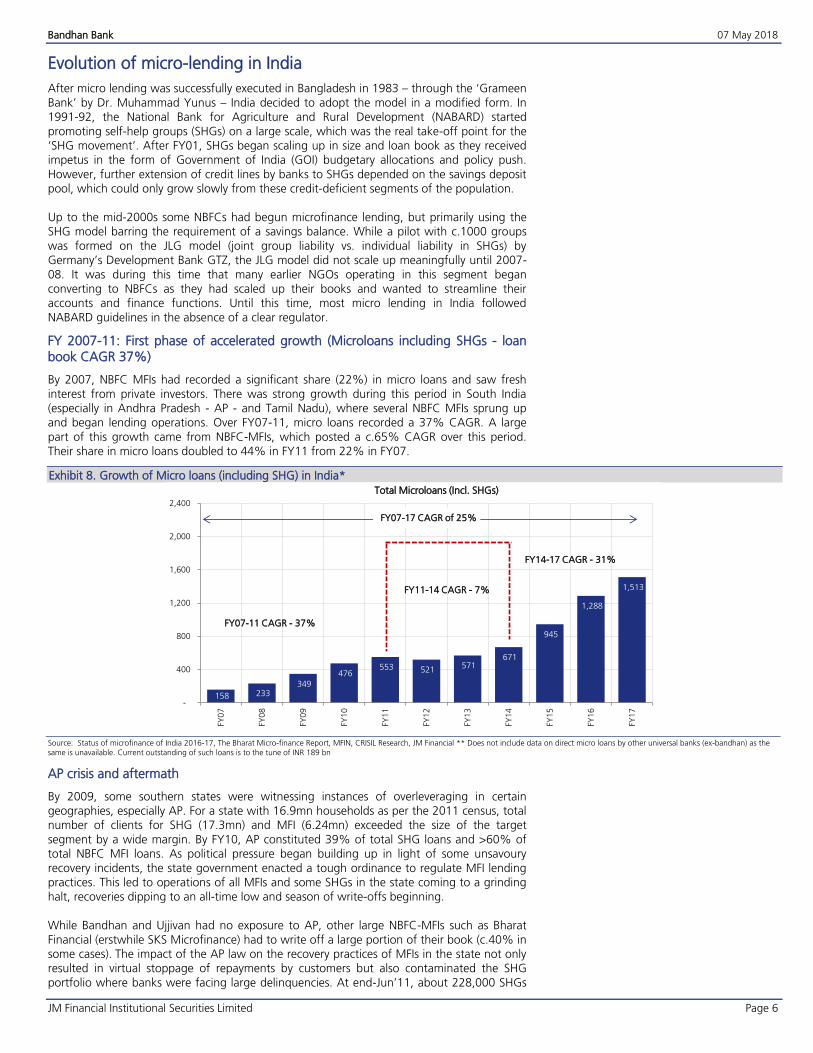
FY 2007-11: First phase of accelerated growth (Microloans including SHGs - loan book CAGR 37%)
By 2007, NBFC MFIs had recorded a significant share (22%) in micro loans and saw fresh
interest from private investors. There was strong growth during this period in South India (especially in Andhra Pradesh - AP - and Tamil Nadu), where several NBFC MFIs sprung up and began lending operations. Over FY07-11, micro loans recorded a 37% CAGR. A large
part of this growth came from NBFC-MFIs, which posted a c.65% CAGR over this period. Their share in micro loans doubled to 44% in FY11 from 22% in FY07.
Growth of Micro loans (including SHG) in India* Exhibit 8.
Source: Status of microfinance of India 2016-17, The Bharat Micro-finance Report, MFIN, CRISIL Research, JM Financial ** Does not include data on direct micro loans by other universal banks (ex-bandhan) as the
same is unavailable. Current outstanding of such loans is to the tune of INR 189 bn
AP crisis and aftermath
By 2009, some southern states were witnessing instances of overleveraging in certain geographies, especially AP. For a state with 16.9mn households as per the 2011 census, total number of clients for SHG (17.3mn) and MFI (6.24mn) exceeded the size of the target segment by a wide margin. By FY10, AP constituted 39% of total SHG loans and >60% of total NBFC MFI loans. As political pressure began building up in light of some unsavoury
recovery incidents, the state government enacted a tough ordinance to regulate MFI lending practices. This led to operations of all MFIs and some SHGs in the state coming to a grinding halt, recoveries dipping to an all-time low and season of write-offs beginning. While Bandhan and Ujjivan had no exposure to AP, other large NBFC-MFIs such as Bharat Financial (erstwhile SKS Microfinance) had to write off a large portion of their book (c.40% in some cases). The impact of the AP law on the recovery practices of MFIs in the state not only resulted in virtual stoppage of repayments by customers but also contaminated the SHG
portfolio where banks were facing large delinquencies. At end-Jun’11, about 228,000 SHGs
158 233 349
476 553 521
571 671
945
1,288
1,513
-
400
800
1,200
1,600
2,000
2,400
FY07
FY08
FY09
FY10
FY11
FY12
FY13
FY14
FY15
FY16
FY17
Total Microloans (Incl. SHGs)
FY11-14 CAGR - 7%
FY07-11 CAGR - 37%
FY07-17 CAGR of 25%
FY14-17 CAGR - 31%
Bandhan Bank 07 May 2018
JM Financial Institutional Securities Limited Page 7
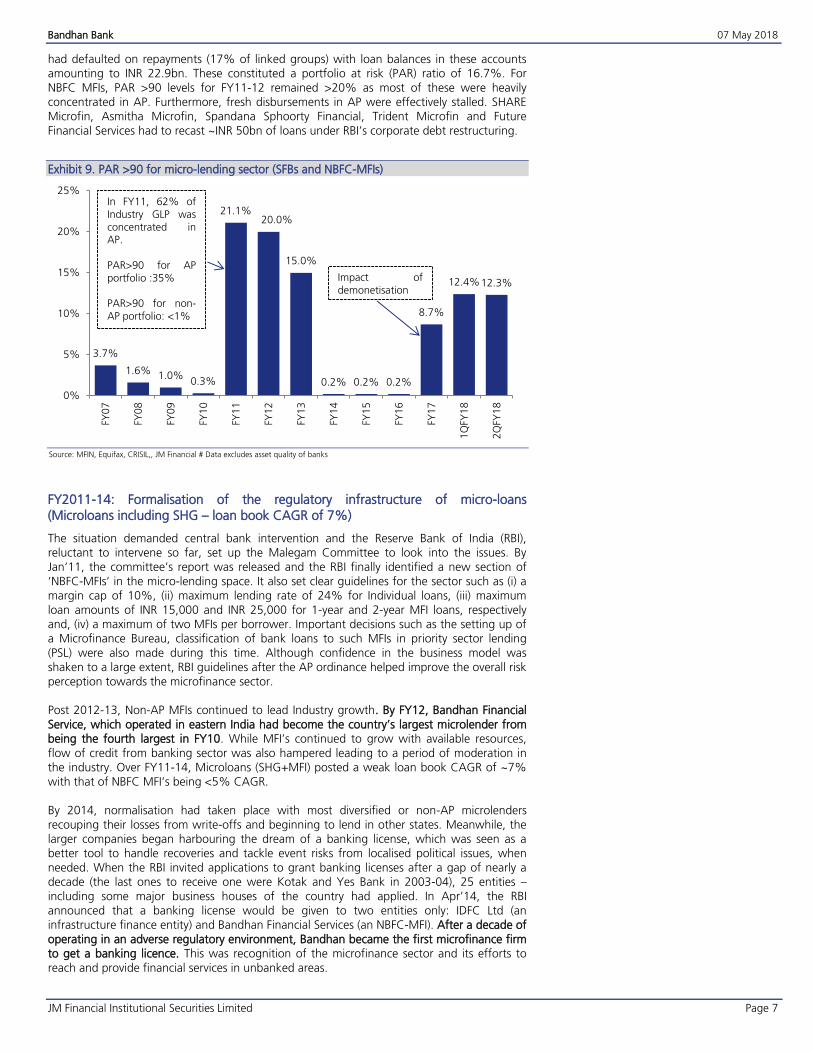
had defaulted on repayments (17% of linked groups) with loan balances in these accounts amounting to INR 22.9bn. These constituted a portfolio at risk (PAR) ratio of 16.7%. For NBFC MFIs, PAR >90 levels for FY11-12 remained >20% as most of these were heavily concentrated in AP. Furthermore, fresh disbursements in AP were effectively stalled. SHARE Microfin, Asmitha Microfin, Spandana Sphoorty Financial, Trident Microfin and Future
Financial Services had to recast ~INR 50bn of loans under RBI’s corporate debt restructuring.
PAR >90 for micro-lending sector (SFBs and NBFC-MFIs) Exhibit 9.
Source: MFIN, Equifax, CRISIL,, JM Financial # Data excludes asset quality of banks
FY2011-14: Formalisation of the regulatory infrastructure of micro-loans (Microloans including SHG – loan book CAGR of 7%)
The situation demanded central bank intervention and the Reserve Bank of India (RBI), reluctant to intervene so far, set up the Malegam Committee to look into the issues. By Jan’11, the committee’s report was released and the RBI finally identified a new section of
‘NBFC-MFIs’ in the micro-lending space. It also set clear guidelines for the sector such as (i) a margin cap of 10%, (ii) maximum lending rate of 24% for Individual loans, (iii) maximum loan amounts of INR 15,000 and INR 25,000 for 1-year and 2-year MFI loans, respectively and, (iv) a maximum of two MFIs per borrower. Important decisions such as the setting up of a Microfinance Bureau, classification of bank loans to such MFIs in priority sector lending (PSL) were also made during this time. Although confidence in the business model was shaken to a large extent, RBI guidelines after the AP ordinance helped improve the overall risk perception towards the microfinance sector. Post 2012-13, Non-AP MFIs continued to lead Industry growth. By FY12, Bandhan Financial
Service, which operated in eastern India had become the country’s largest microlender from being the fourth largest in FY10. While MFI’s continued to grow with available resources, flow of credit from banking sector was also hampered leading to a period of moderation in the industry. Over FY11-14, Microloans (SHG+MFI) posted a weak loan book CAGR of ~7% with that of NBFC MFI’s being <5% CAGR. By 2014, normalisation had taken place with most diversified or non-AP microlenders recouping their losses from write-offs and beginning to lend in other states. Meanwhile, the larger companies began harbouring the dream of a banking license, which was seen as a better tool to handle recoveries and tackle event risks from localised political issues, when needed. When the RBI invited applications to grant banking licenses after a gap of nearly a decade (the last ones to receive one were Kotak and Yes Bank in 2003-04), 25 entities – including some major business houses of the country had applied. In Apr’14, the RBI announced that a banking license would be given to two entities only: IDFC Ltd (an infrastructure finance entity) and Bandhan Financial Services (an NBFC-MFI). After a decade of operating in an adverse regulatory environment, Bandhan became the first microfinance firm to get a banking licence. This was recognition of the microfinance sector and its efforts to reach and provide financial services in unbanked areas.
3.7%
1.6% 1.0%0.3%
21.1%20.0%
15.0%
0.2% 0.2% 0.2%
8.7%
12.4%12.3%
0%
5%
10%
15%
20%
25%
FY07
FY08
FY09
FY10
FY11
FY12
FY13
FY14
FY15
FY16
FY17
1Q
FY18
2Q
FY18
In FY11, 62% ofIndustry GLP wasconcentrated inAP.
PAR>90 for APportfolio :35%
PAR>90 for non-AP portfolio: <1%
Impact ofdemonetisation
Bandhan Bank 07 May 2018
JM Financial Institutional Securities Limited Page 8
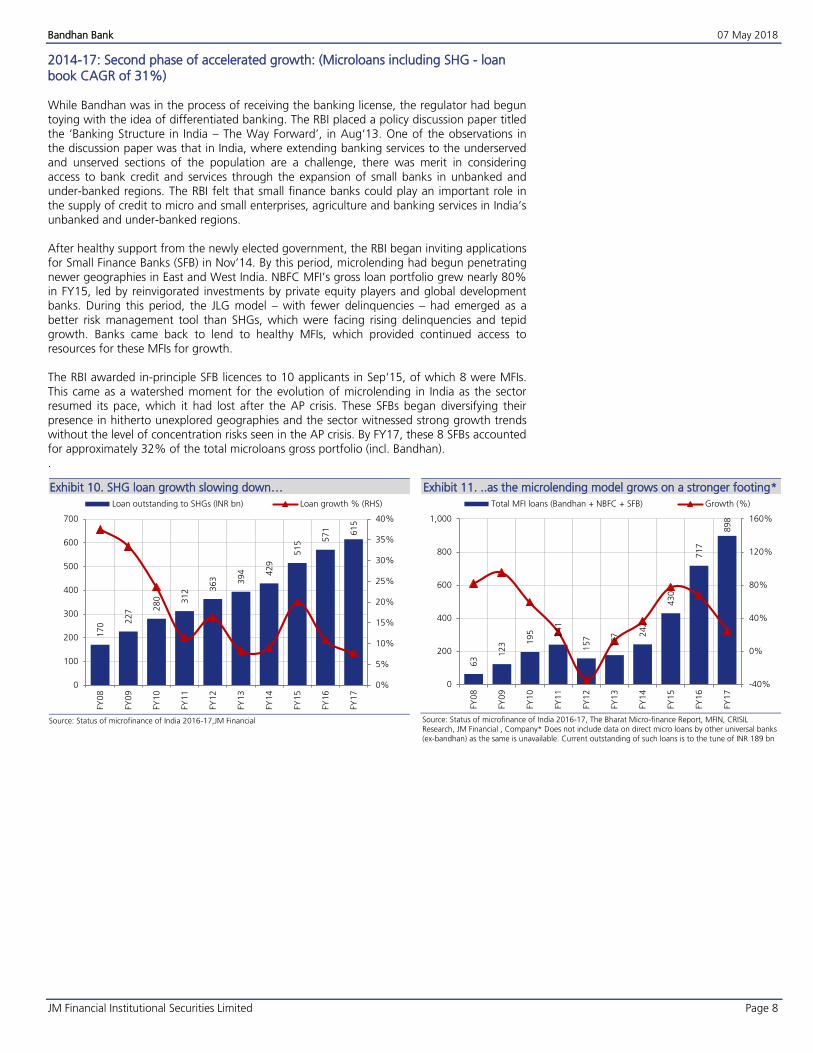
2014-17: Second phase of accelerated growth: (Microloans including SHG - loan book CAGR of 31%) While Bandhan was in the process of receiving the banking license, the regulator had begun toying with the idea of differentiated banking. The RBI placed a policy discussion paper titled the ‘Banking Structure in India – The Way Forward’, in Aug‘13. One of the observations in the discussion paper was that in India, where extending banking services to the underserved and unserved sections of the population are a challenge, there was merit in considering
access to bank credit and services through the expansion of small banks in unbanked and under-banked regions. The RBI felt that small finance banks could play an important role in the supply of credit to micro and small enterprises, agriculture and banking services in India’s unbanked and under-banked regions. After healthy support from the newly elected government, the RBI began inviting applications for Small Finance Banks (SFB) in Nov’14. By this period, microlending had begun penetrating
newer geographies in East and West India. NBFC MFI’s gross loan portfolio grew nearly 80% in FY15, led by reinvigorated investments by private equity players and global development banks. During this period, the JLG model – with fewer delinquencies – had emerged as a better risk management tool than SHGs, which were facing rising delinquencies and tepid growth. Banks came back to lend to healthy MFIs, which provided continued access to
resources for these MFIs for growth. The RBI awarded in-principle SFB licences to 10 applicants in Sep‘15, of which 8 were MFIs. This came as a watershed moment for the evolution of microlending in India as the sector resumed its pace, which it had lost after the AP crisis. These SFBs began diversifying their
presence in hitherto unexplored geographies and the sector witnessed strong growth trends without the level of concentration risks seen in the AP crisis. By FY17, these 8 SFBs accounted for approximately 32% of the total microloans gross portfolio (incl. Bandhan). .
SHG loan growth slowing down… Exhibit 10.
Source: Status of microfinance of India 2016-17,JM Financial
..as the microlending model grows on a stronger footing* Exhibit 11.
Source: Status of microfinance of India 2016-17, The Bharat Micro-finance Report, MFIN, CRISIL Research, JM Financial , Company* Does not include data on direct micro loans by other universal banks
(ex-bandhan) as the same is unavailable. Current outstanding of such loans is to the tune of INR 189 bn
170 2
27 2
80 312 3
63 394 429
515 5
71 615
0%
5%
10%
15%
20%
25%
30%
35%
40%
0
100
200
300
400
500
600
700
FY08
FY09
FY10
FY11
FY1
2
FY13
FY14
FY15
FY16
FY17
Loan outstanding to SHGs (INR bn) Loan growth % (RHS)
63
123 1
95 241
157
177 2
42
430
717
898
-40%
0%
40%
80%
120%
160%
0
200
400
600
800
1,000
FY08
FY09
FY10
FY11
FY12
FY1
3
FY1
4
FY1
5
FY1
6
FY1
7
Total MFI loans (Bandhan + NBFC + SFB) Growth (%)
Bandhan Bank 07 May 2018
JM Financial Institutional Securities Limited Page 9
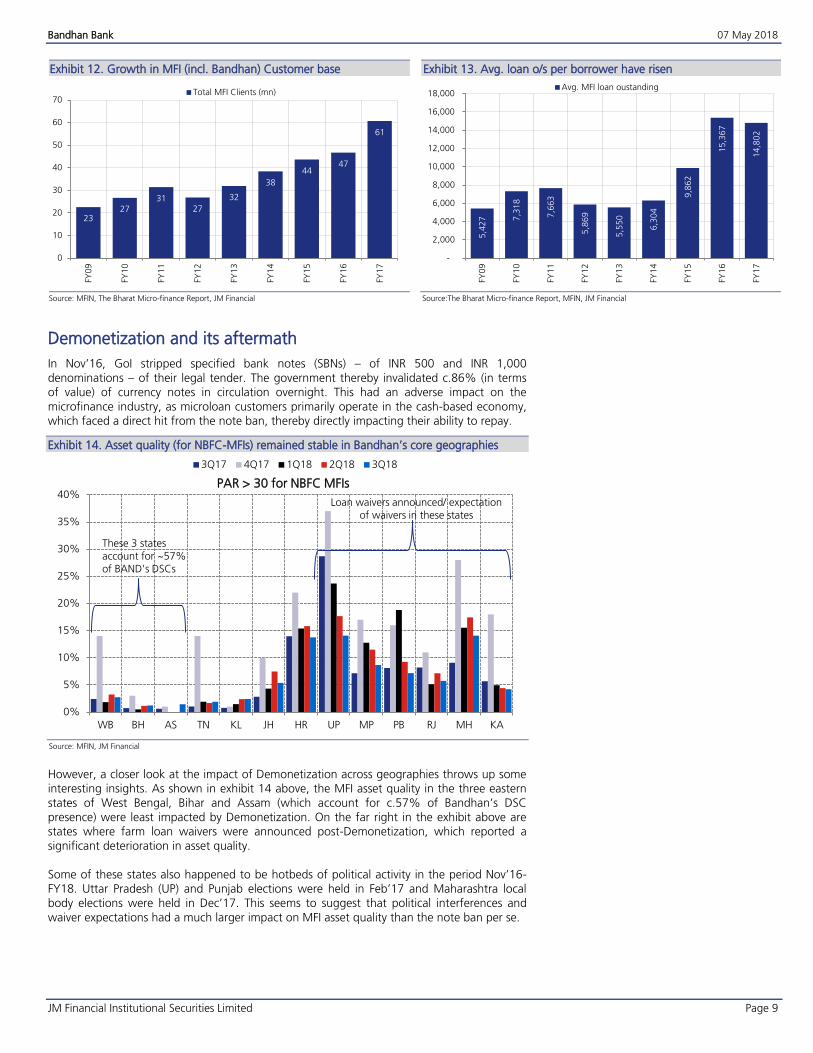
Growth in MFI (incl. Bandhan) Customer base Exhibit 12.
Source: MFIN, The Bharat Micro-finance Report, JM Financial
Avg. loan o/s per borrower have risen Exhibit 13.
Source:The Bharat Micro-finance Report, MFIN, JM Financial
Demonetization and its aftermath
In Nov’16, GoI stripped specified bank notes (SBNs) – of INR 500 and INR 1,000 denominations – of their legal tender. The government thereby invalidated c.86% (in terms of value) of currency notes in circulation overnight. This had an adverse impact on the microfinance industry, as microloan customers primarily operate in the cash-based economy, which faced a direct hit from the note ban, thereby directly impacting their ability to repay.
Asset quality (for NBFC-MFIs) remained stable in Bandhan’s core geographies Exhibit 14.
Source: MFIN, JM Financial
However, a closer look at the impact of Demonetization across geographies throws up some interesting insights. As shown in exhibit 14 above, the MFI asset quality in the three eastern states of West Bengal, Bihar and Assam (which account for c.57% of Bandhan’s DSC presence) were least impacted by Demonetization. On the far right in the exhibit above are states where farm loan waivers were announced post-Demonetization, which reported a
significant deterioration in asset quality. Some of these states also happened to be hotbeds of political activity in the period Nov’16-FY18. Uttar Pradesh (UP) and Punjab elections were held in Feb’17 and Maharashtra local body elections were held in Dec’17. This seems to suggest that political interferences and
waiver expectations had a much larger impact on MFI asset quality than the note ban per se.
2327
3127
32
38
4447
61
0
10
20
30
40
50
60
70
FY09
FY10
FY11
FY12
FY13
FY14
FY15
FY16
FY17
Total MFI Clients (mn)
5,4
27
7,3
18
7,6
63
5,8
69
5,5
50
6,3
04
9,8
62
15,3
67
14,8
02
-
2,000
4,000
6,000
8,000
10,000
12,000
14,000
16,000
18,000
FY09
FY10
FY11
FY12
FY13
FY14
FY15
FY16
FY17
Avg. MFI loan oustanding
0%
5%
10%
15%
20%
25%
30%
35%
40%
WB BH AS TN KL JH HR UP MP PB RJ MH KA
PAR > 30 for NBFC MFIs
3Q17 4Q17 1Q18 2Q18 3Q18
Loan waivers announced/ expectation of waivers in these states
These 3 states account for ~57% of BAND's DSCs
Bandhan Bank 07 May 2018
JM Financial Institutional Securities Limited Page 10
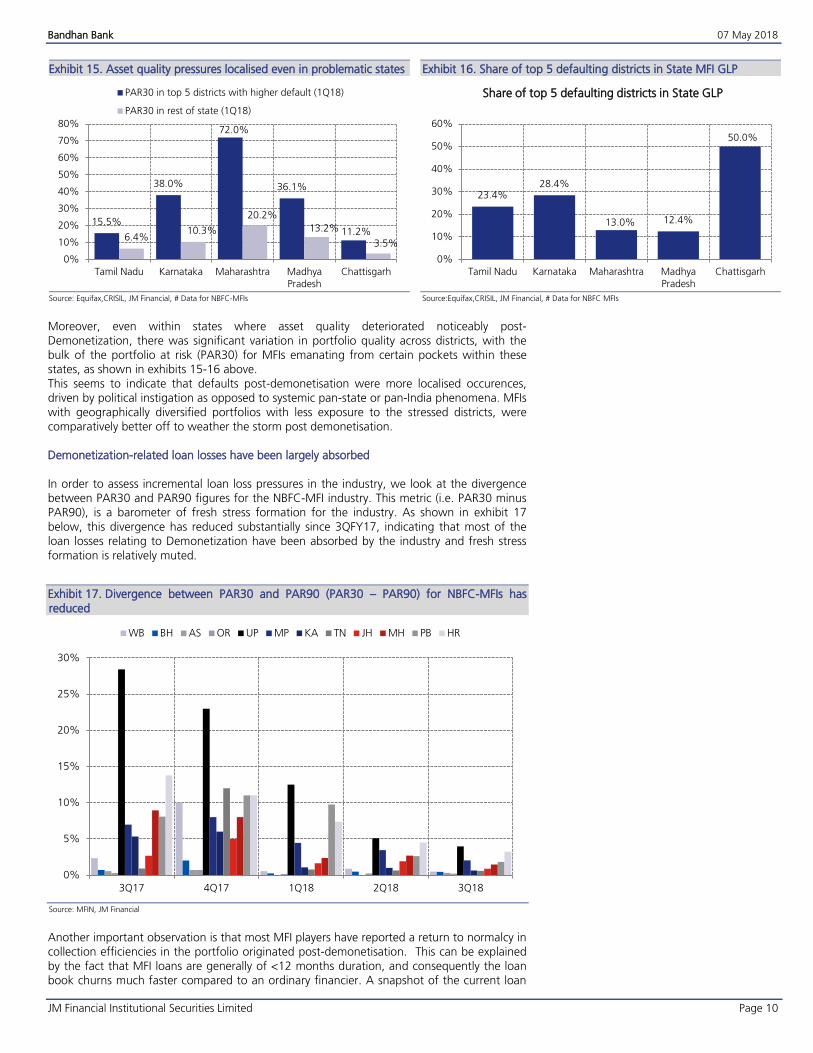
Asset quality pressures localised even in problematic states Exhibit 15.
Source: Equifax,CRISIL, JM Financial, # Data for NBFC-MFIs
Share of top 5 defaulting districts in State MFI GLP Exhibit 16.
Source:Equifax,CRISIL, JM Financial, # Data for NBFC MFIs
Moreover, even within states where asset quality deteriorated noticeably post-Demonetization, there was significant variation in portfolio quality across districts, with the bulk of the portfolio at risk (PAR30) for MFIs emanating from certain pockets within these states, as shown in exhibits 15-16 above. This seems to indicate that defaults post-demonetisation were more localised occurences, driven by political instigation as opposed to systemic pan-state or pan-India phenomena. MFIs with geographically diversified portfolios with less exposure to the stressed districts, were comparatively better off to weather the storm post demonetisation.
Demonetization-related loan losses have been largely absorbed
In order to assess incremental loan loss pressures in the industry, we look at the divergence between PAR30 and PAR90 figures for the NBFC-MFI industry. This metric (i.e. PAR30 minus PAR90), is a barometer of fresh stress formation for the industry. As shown in exhibit 17 below, this divergence has reduced substantially since 3QFY17, indicating that most of the loan losses relating to Demonetization have been absorbed by the industry and fresh stress formation is relatively muted.
Divergence between PAR30 and PAR90 (PAR30 – PAR90) for NBFC-MFIs has Exhibit 17.
reduced
Source: MFIN, JM Financial
Another important observation is that most MFI players have reported a return to normalcy in collection efficiencies in the portfolio originated post-demonetisation. This can be explained by the fact that MFI loans are generally of <12 months duration, and consequently the loan book churns much faster compared to an ordinary financier. A snapshot of the current loan
15.5%
38.0%
72.0%
36.1%
11.2%6.4%
10.3%
20.2%
13.2%
3.5%
0%
10%
20%
30%
40%
50%
60%
70%
80%
Tamil Nadu Karnataka Maharashtra MadhyaPradesh
Chattisgarh
PAR30 in top 5 districts with higher default (1Q18)
PAR30 in rest of state (1Q18)
23.4%28.4%
13.0% 12.4%
50.0%
0%
10%
20%
30%
40%
50%
60%
Tamil Nadu Karnataka Maharashtra MadhyaPradesh
Chattisgarh
Share of top 5 defaulting districts in State GLP
0%
5%
10%
15%
20%
25%
30%
3Q17 4Q17 1Q18 2Q18 3Q18
WB BH AS OR UP MP KA TN JH MH PB HR
Bandhan Bank 07 May 2018
JM Financial Institutional Securities Limited Page 11
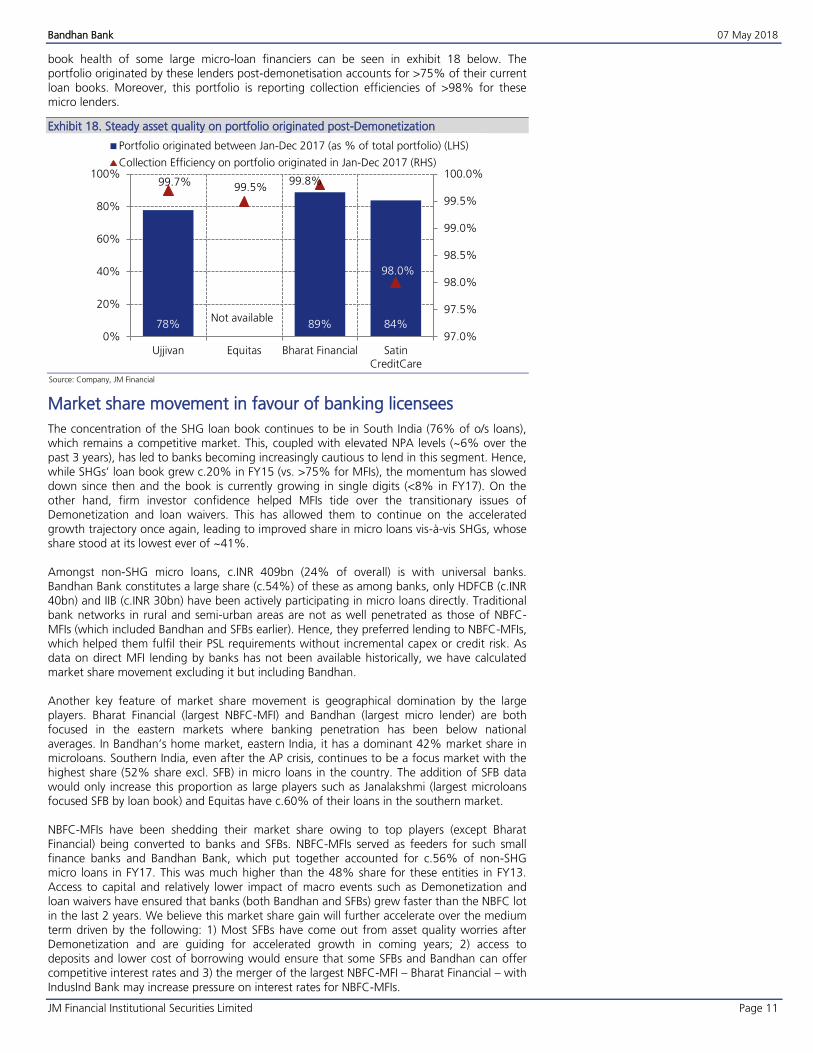
book health of some large micro-loan financiers can be seen in exhibit 18 below. The portfolio originated by these lenders post-demonetisation accounts for >75% of their current loan books. Moreover, this portfolio is reporting collection efficiencies of >98% for these micro lenders.
Steady asset quality on portfolio originated post-Demonetization Exhibit 18.
Source: Company, JM Financial
Market share movement in favour of banking licensees
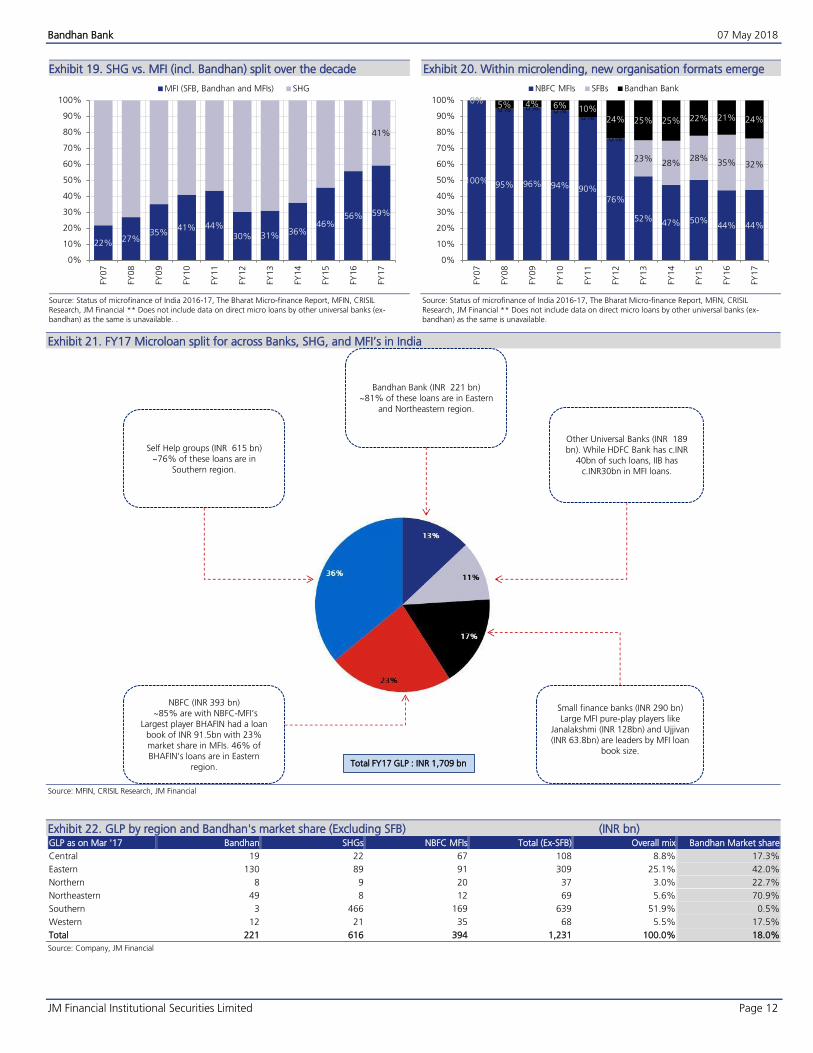
The concentration of the SHG loan book continues to be in South India (76% of o/s loans), which remains a competitive market. This, coupled with elevated NPA levels (~6% over the past 3 years), has led to banks becoming increasingly cautious to lend in this segment. Hence, while SHGs’ loan book grew c.20% in FY15 (vs. >75% for MFIs), the momentum has slowed down since then and the book is currently growing in single digits (<8% in FY17). On the other hand, firm investor confidence helped MFIs tide over the transitionary issues of Demonetization and loan waivers. This has allowed them to continue on the accelerated growth trajectory once again, leading to improved share in micro loans vis-à-vis SHGs, whose share stood at its lowest ever of ~41%.
Amongst non-SHG micro loans, c.INR 409bn (24% of overall) is with universal banks. Bandhan Bank constitutes a large share (c.54%) of these as among banks, only HDFCB (c.INR 40bn) and IIB (c.INR 30bn) have been actively participating in micro loans directly. Traditional bank networks in rural and semi-urban areas are not as well penetrated as those of NBFC-MFIs (which included Bandhan and SFBs earlier). Hence, they preferred lending to NBFC-MFIs, which helped them fulfil their PSL requirements without incremental capex or credit risk. As data on direct MFI lending by banks has not been available historically, we have calculated market share movement excluding it but including Bandhan.
Another key feature of market share movement is geographical domination by the large players. Bharat Financial (largest NBFC-MFI) and Bandhan (largest micro lender) are both focused in the eastern markets where banking penetration has been below national averages. In Bandhan’s home market, eastern India, it has a dominant 42% market share in microloans. Southern India, even after the AP crisis, continues to be a focus market with the highest share (52% share excl. SFB) in micro loans in the country. The addition of SFB data would only increase this proportion as large players such as Janalakshmi (largest microloans focused SFB by loan book) and Equitas have c.60% of their loans in the southern market.
NBFC-MFIs have been shedding their market share owing to top players (except Bharat Financial) being converted to banks and SFBs. NBFC-MFIs served as feeders for such small finance banks and Bandhan Bank, which put together accounted for c.56% of non-SHG micro loans in FY17. This was much higher than the 48% share for these entities in FY13. Access to capital and relatively lower impact of macro events such as Demonetization and loan waivers have ensured that banks (both Bandhan and SFBs) grew faster than the NBFC lot
in the last 2 years. We believe this market share gain will further accelerate over the medium term driven by the following: 1) Most SFBs have come out from asset quality worries after Demonetization and are guiding for accelerated growth in coming years; 2) access to deposits and lower cost of borrowing would ensure that some SFBs and Bandhan can offer competitive interest rates and 3) the merger of the largest NBFC-MFI – Bharat Financial – with IndusInd Bank may increase pressure on interest rates for NBFC-MFIs.
78% 89% 84%
99.7% 99.5%99.8%
98.0%
97.0%
97.5%
98.0%
98.5%
99.0%
99.5%
100.0%
0%
20%
40%
60%
80%
100%
Ujjivan Equitas Bharat Financial SatinCreditCare
Portfolio originated between Jan-Dec 2017 (as % of total portfolio) (LHS)
Collection Efficiency on portfolio originated in Jan-Dec 2017 (RHS)
Not available
Bandhan Bank 07 May 2018
JM Financial Institutional Securities Limited Page 12
SHG vs. MFI (incl. Bandhan) split over the decade Exhibit 19.
Source: Status of microfinance of India 2016-17, The Bharat Micro-finance Report, MFIN, CRISIL
Research, JM Financial ** Does not include data on direct micro loans by other universal banks (ex-bandhan) as the same is unavailable. .
Within microlending, new organisation formats emerge Exhibit 20.
Source: Status of microfinance of India 2016-17, The Bharat Micro-finance Report, MFIN, CRISIL
Research, JM Financial ** Does not include data on direct micro loans by other universal banks (ex-bandhan) as the same is unavailable.
FY17 Microloan split for across Banks, SHG, and MFI’s in India Exhibit 21.
Source: MFIN, CRISIL Research, JM Financial
GLP by region and Bandhan's market share (Excluding SFB) (INR bn) Exhibit 22.GLP as on Mar '17 Bandhan SHGs NBFC MFIs Total (Ex-SFB) Overall mix Bandhan Market share
(Ex-SFB)Central 19 22 67 108 8.8% 17.3%
Eastern 130 89 91 309 25.1% 42.0%
Northern 8 9 20 37 3.0% 22.7%
Northeastern 49 8 12 69 5.6% 70.9%
Southern 3 466 169 639 51.9% 0.5%
Western 12 21 35 68 5.5% 17.5%
Total 221 616 394 1,231 100.0% 18.0%
Source: Company, JM Financial
22% 27%35%
41% 44%
30% 31% 36%46%
56% 59%
41%
0%
10%
20%
30%
40%
50%
60%
70%
80%
90%
100%FY
07
FY08
FY09
FY10
FY11
FY12
FY13
FY14
FY15
FY16
FY17
MFI (SFB, Bandhan and MFIs) SHG
100% 95% 96% 94% 90%
76%
52%47% 50%
44% 44%
0%0% 0% 0%
0%
0%
23%28%
28%35% 32%
0% 5% 4% 6% 10%
24% 25% 25% 22% 21% 24%
0%
10%
20%
30%
40%
50%
60%
70%
80%
90%
100%
FY07
FY08
FY09
FY10
FY11
FY12
FY13
FY14
FY15
FY16
FY17
NBFC MFIs SFBs Bandhan Bank
Self Help groups (INR 615 bn)~76% of these loans are in
Southern region.
Bandhan Bank (INR 221 bn)
~81% of these loans are in Eastern and Northeastern region.
Other Universal Banks (INR 189 bn). While HDFC Bank has c.INR
40bn of such loans, IIB has c.INR30bn in MFI loans.
Small finance banks (INR 290 bn)Large MFI pure-play players like
Janalakshmi (INR 128bn) and Ujjivan(INR 63.8bn) are leaders by MFI loan
book size.
NBFC (INR 393 bn)~85% are with NBFC-MFI’s
Largest player BHAFIN had a loan book of INR 91.5bn with 23% market share in MFIs. 46% of BHAFIN’s loans are in Eastern
region. Total FY17 GLP : INR 1,709 bn
Bandhan Bank 07 May 2018
JM Financial Institutional Securities Limited Page 13
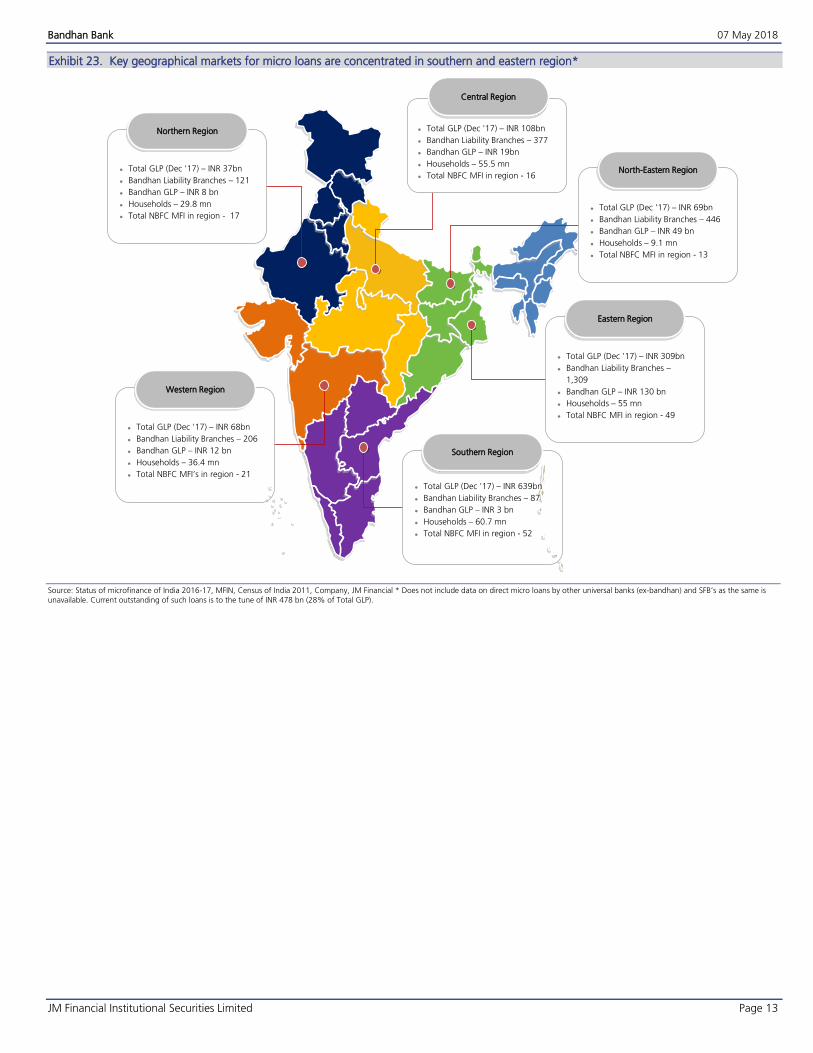
Key geographical markets for micro loans are concentrated in southern and eastern region* Exhibit 23.
Source: Status of microfinance of India 2016-17, MFIN, Census of India 2011, Company, JM Financial * Does not include data on direct micro loans by other universal banks (ex-bandhan) and SFB’s as the same is unavailable. Current outstanding of such loans is to the tune of INR 478 bn (28% of Total GLP).
Northern Region
Total GLP (Dec '17) – INR 37bn
Bandhan Liability Branches – 121
Bandhan GLP – INR 8 bn
Households – 29.8 mn
Total NBFC MFI in region - 17
Western Region
Total GLP (Dec '17) – INR 68bn
Bandhan Liability Branches – 206
Bandhan GLP – INR 12 bn
Households – 36.4 mn
Total NBFC MFI’s in region - 21
North-Eastern Region
Total GLP (Dec '17) – INR 69bn
Bandhan Liability Branches – 446
Bandhan GLP – INR 49 bn
Households – 9.1 mn
Total NBFC MFI in region - 13
Eastern Region
Total GLP (Dec '17) – INR 309bn
Bandhan Liability Branches –
1,309
Bandhan GLP – INR 130 bn
Households – 55 mn
Total NBFC MFI in region - 49
Southern Region
Total GLP (Dec '17) – INR 639bn
Bandhan Liability Branches – 87
Bandhan GLP – INR 3 bn
Households – 60.7 mn
Total NBFC MFI in region - 52
Total GLP (Dec '17) – INR 108bn
Bandhan Liability Branches – 377
Bandhan GLP – INR 19bn
Households – 55.5 mn
Total NBFC MFI in region - 16
Central Region
Bandhan Bank 07 May 2018
JM Financial Institutional Securities Limited Page 14
Micro-lending in the Banking framework – Significant
advantages
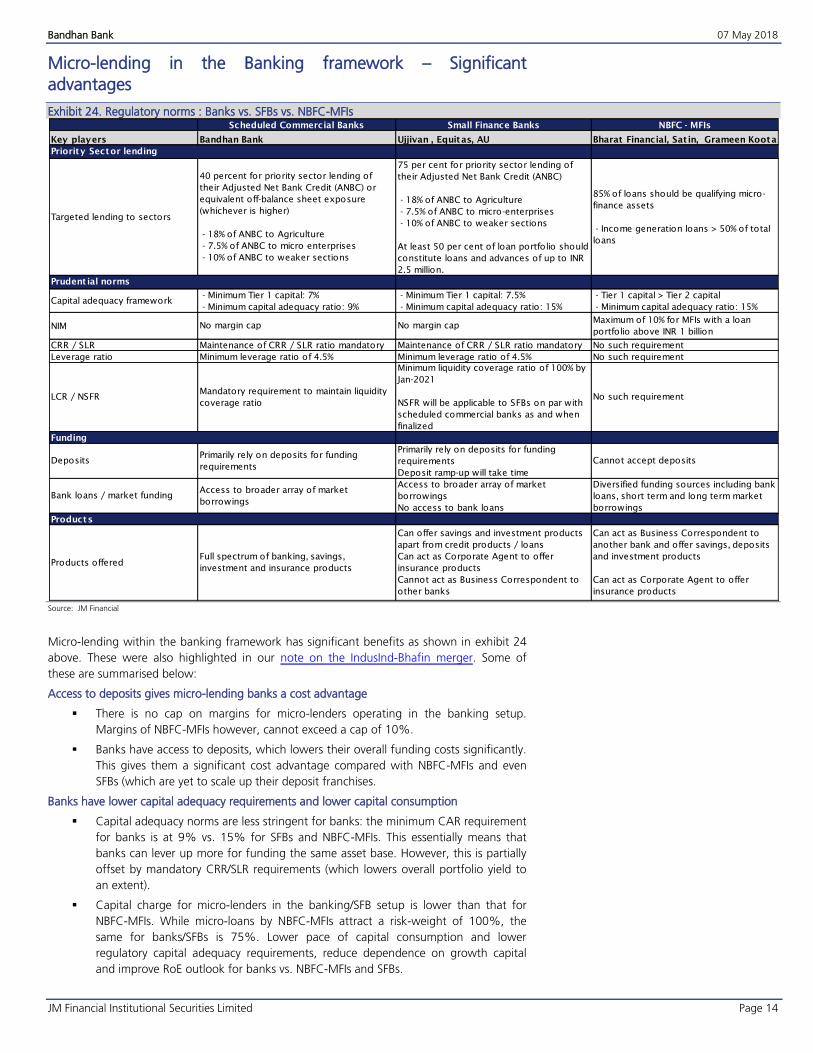
Regulatory norms : Banks vs. SFBs vs. NBFC-MFIs Exhibit 24.
Source: JM Financial
Micro-lending within the banking framework has significant benefits as shown in exhibit 24
above. These were also highlighted in our note on the IndusInd-Bhafin merger. Some of
these are summarised below:
Access to deposits gives micro-lending banks a cost advantage
There is no cap on margins for micro-lenders operating in the banking setup.
Margins of NBFC-MFIs however, cannot exceed a cap of 10%.
Banks have access to deposits, which lowers their overall funding costs significantly.
This gives them a significant cost advantage compared with NBFC-MFIs and even
SFBs (which are yet to scale up their deposit franchises.
Banks have lower capital adequacy requirements and lower capital consumption
Capital adequacy norms are less stringent for banks: the minimum CAR requirement
for banks is at 9% vs. 15% for SFBs and NBFC-MFIs. This essentially means that
banks can lever up more for funding the same asset base. However, this is partially
offset by mandatory CRR/SLR requirements (which lowers overall portfolio yield to
an extent).
Capital charge for micro-lenders in the banking/SFB setup is lower than that for
NBFC-MFIs. While micro-loans by NBFC-MFIs attract a risk-weight of 100%, the
same for banks/SFBs is 75%. Lower pace of capital consumption and lower
regulatory capital adequacy requirements, reduce dependence on growth capital
and improve RoE outlook for banks vs. NBFC-MFIs and SFBs.
Key players
Priority Sector lending
Prudent ial norms
NIM
CRR / SLR
Leverage ratio
Funding
Products
Scheduled Commercial Banks Small Finance Banks NBFC - MFIs
Targeted lending to sectors
40 percent for priority sector lending of
their Adjusted Net Bank Credit (ANBC) or
equivalent off-balance sheet exposure
(whichever is higher)
- 18% of ANBC to Agriculture
- 7.5% of ANBC to micro enterprises
- 10% of ANBC to weaker sections
75 per cent for priority sector lending of
their Adjusted Net Bank Credit (ANBC)
- 18% of ANBC to Agriculture
- 7.5% of ANBC to micro-enterprises
- 10% of ANBC to weaker sections
At least 50 per cent of loan portfolio should
constitute loans and advances of up to INR
2.5 million.
85% of loans should be qualifying micro-
finance assets
- Income generation loans > 50% of total
loans
Bandhan Bank Ujjivan , Equitas, AU Bharat Financial, Sat in, Grameen Koota etc
No margin cap
Maintenance of CRR / SLR ratio mandatory
No margin cap
Maintenance of CRR / SLR ratio mandatory
Capital adequacy framework- Minimum Tier 1 capital: 7%
- Minimum capital adequacy ratio: 9%
- Minimum Tier 1 capital: 7.5%
- Minimum capital adequacy ratio: 15%
Minimum leverage ratio of 4.5%
Mandatory requirement to maintain liquidity
coverage ratioLCR / NSFR
DepositsPrimarily rely on deposits for funding
requirements
Bank loans / market fundingAccess to broader array of market
borrowings
Access to broader array of market
borrowings
No access to bank loans
Diversified funding sources including bank
loans, short term and long term market
borrowings
Products offeredFull spectrum of banking, savings,
investment and insurance products
No such requirement
No such requirement
Can offer savings and investment products
apart from credit products / loans
Can act as Corporate Agent to offer
insurance products
Cannot act as Business Correspondent to
other banks
Can act as Business Correspondent to
another bank and offer savings, deposits
and investment products
Can act as Corporate Agent to offer
insurance products
Minimum leverage ratio of 4.5%
Minimum liquidity coverage ratio of 100% by
Jan-2021
NSFR will be applicable to SFBs on par with
scheduled commercial banks as and when
finalized
Primarily rely on deposits for funding
requirements
Deposit ramp-up will take time
Cannot accept deposits
Maximum of 10% for MFIs with a loan
portfolio above INR 1 billion
No such requirement
- Tier 1 capital > Tier 2 capital
- Minimum capital adequacy ratio: 15%
Bandhan Bank 07 May 2018
JM Financial Institutional Securities Limited Page 15
Micro-lending banks have option value to scale up retail/corporate businesses
A bank has a lower priority sector lending requirement, i.e. 40% of ANBC, as
compared with 75% for SFBs and 85% for NBFC-MFIs. Lower priority sector lending
requirement frees up regulatory headroom for fee-income generation by selling of
Priority Sector Lending Certificates (PSLCs).
Moreover, apart from less stringent priority sector lending requirements, in a
banking setup, there are no restrictions on ticket sizes. This provides a micro-lending
bank an option value for scaling up a retail/corporate franchise as well. Bandhan has
started utilising this advantage to scale up its retail/general banking business.
How is Bandhan’s micro-lending model different?
Group-based individual lending
All of Bandhan’s microloans are group-based individual loans. The group-based individual lending methodology is utilised to extend loans to women who have formed groups of approximately 30 members. The general requirement for forming a group is that the women must be from the same area and know each other, but not be related to one another. The groups are self-selected and each member is eligible to obtain loans individually.
The formation of the group serves as a protection against defaulting members and increases
credit discipline through mutual support within the group. It ensures that individual members
are prudent in conducting their financial affairs and prompt in repaying their loans, without
the need to take any formal collateral.
Bandhan extends microloans exclusively to women from low-income households, although
loan proceeds may be used for business activities that are run by the women's families,
including their husband.
Bandhan has several micro loan options with loan tenures up to 2 years with a maximum
loan amount of INR 150,000.
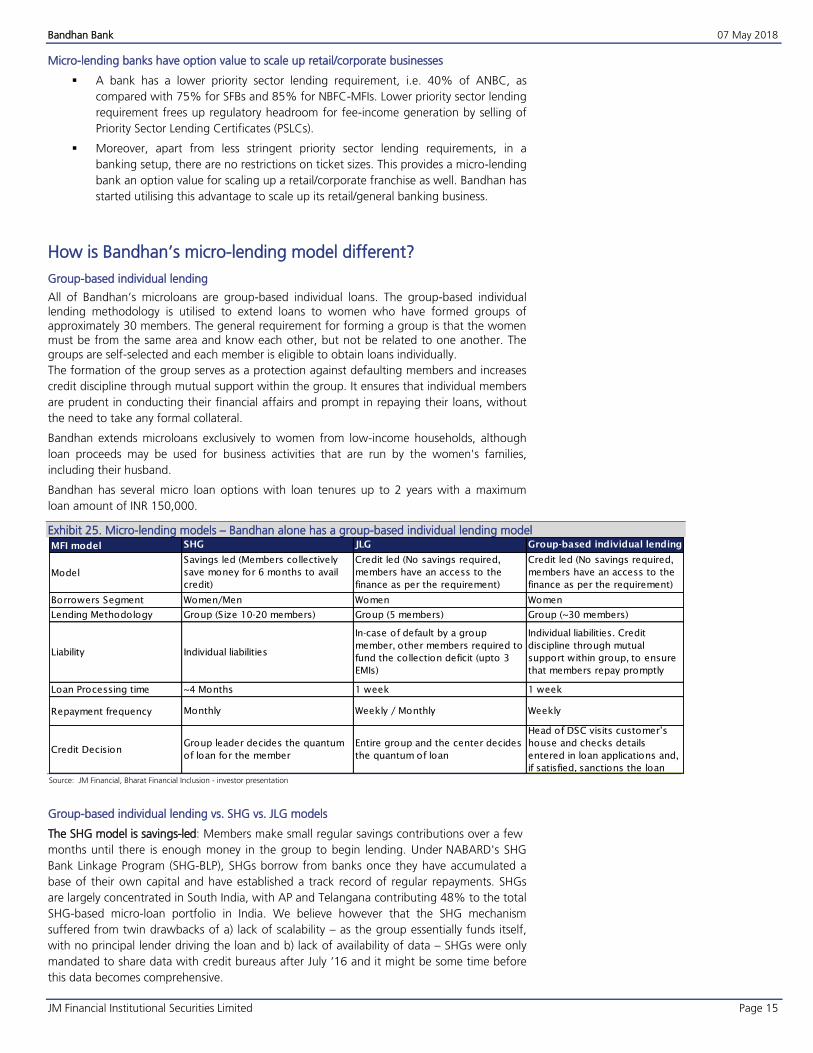
Micro-lending models – Bandhan alone has a group-based individual lending modelExhibit 25.
Source: JM Financial, Bharat Financial Inclusion - investor presentation
Group-based individual lending vs. SHG vs. JLG models
The SHG model is savings-led: Members make small regular savings contributions over a few
months until there is enough money in the group to begin lending. Under NABARD's SHG
Bank Linkage Program (SHG-BLP), SHGs borrow from banks once they have accumulated a
base of their own capital and have established a track record of regular repayments. SHGs
are largely concentrated in South India, with AP and Telangana contributing 48% to the total
SHG-based micro-loan portfolio in India. We believe however that the SHG mechanism
suffered from twin drawbacks of a) lack of scalability – as the group essentially funds itself,
with no principal lender driving the loan and b) lack of availability of data – SHGs were only
mandated to share data with credit bureaus after July ‘16 and it might be some time before
this data becomes comprehensive.
MFI model
Model
Borrowers Segment
Lending Methodology
Liability
Loan Processing time
Repayment frequency
Credit Decision
Monthly
Savings led (Members collectively
save money for 6 months to avail
credit)
Women/Men
Group (Size 10-20 members)
Individual liabilities
~4 Months
Group (5 members)
In-case of default by a group
member, other members required to
fund the collection deficit (upto 3
EMIs)
1 week
Weekly / Monthly
Entire group and the center decides
the quantum of loan
Head of DSC visits customer’s
house and checks details
entered in loan applications and,
if satisfied, sanctions the loan
SHG JLG Group-based individual lending
Credit led (No savings required,
members have an access to the
finance as per the requirement)
Women
Group (~30 members)
Individual liabilities. Credit
discipline through mutual
support within group, to ensure
that members repay promptly
1 week
Weekly
Group leader decides the quantum
of loan for the member
Credit led (No savings required,
members have an access to the
finance as per the requirement)
Women
Bandhan Bank 07 May 2018
JM Financial Institutional Securities Limited Page 16
Micro-lenders have, as a result, avoided the SHG model as well as geographies associated
with the model after the AP crisis and preferred the JLG route. The JLG model is not savings-
led, the groups are much smaller (5 members) and in the case of a default by a member in
the group, the other members are liable to fund the deficit for 2-3 EMIs.
Bandhan is unique in pioneering the group-based individual lending model. In this model, the
loan liabilities are individual-based (and not for the entire group). Credit discipline is enforced
through mutual support within the group, which ensures that individual members repay
overdues promptly. We believe this lending methodology, coupled with a weekly collection
policy, has helped keep Bandhan’s asset quality in good health.
Moreover, our interactions with industry professionals lead us to believe that a number of
micro-lenders are increasingly leaning towards a similar model to Bandhan’s, albeit within the
JLG framework. In the period of widespread defaults after Demonetization, many lenders felt
that the JLG rule, which stipulated that the rest of the group had to fund 2-3 EMIs of
defaulting members, was onerous on the remaining group members and they have
withdrawn it since.
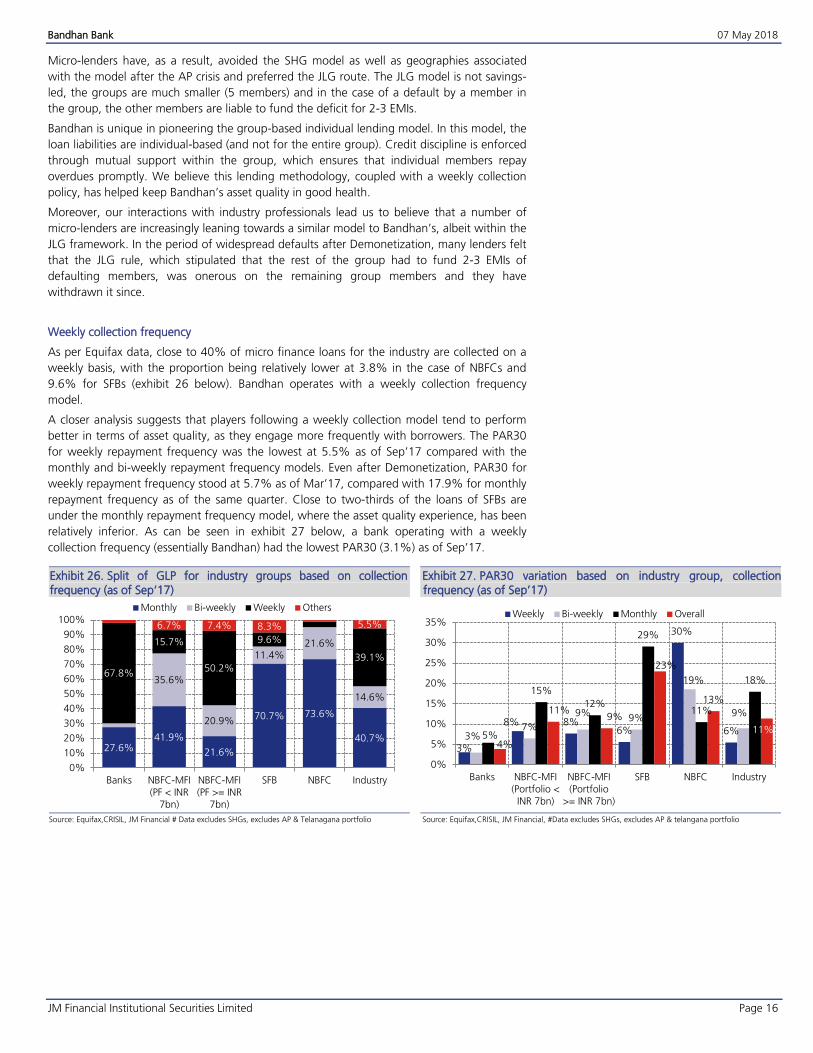
Weekly collection frequency
As per Equifax data, close to 40% of micro finance loans for the industry are collected on a
weekly basis, with the proportion being relatively lower at 3.8% in the case of NBFCs and
9.6% for SFBs (exhibit 26 below). Bandhan operates with a weekly collection frequency
model.
A closer analysis suggests that players following a weekly collection model tend to perform
better in terms of asset quality, as they engage more frequently with borrowers. The PAR30
for weekly repayment frequency was the lowest at 5.5% as of Sep’17 compared with the
monthly and bi-weekly repayment frequency models. Even after Demonetization, PAR30 for
weekly repayment frequency stood at 5.7% as of Mar’17, compared with 17.9% for monthly
repayment frequency as of the same quarter. Close to two-thirds of the loans of SFBs are
under the monthly repayment frequency model, where the asset quality experience, has been
relatively inferior. As can be seen in exhibit 27 below, a bank operating with a weekly
collection frequency (essentially Bandhan) had the lowest PAR30 (3.1%) as of Sep’17.
Split of GLP for industry groups based on collection Exhibit 26.frequency (as of Sep‘17)
Source: Equifax,CRISIL, JM Financial # Data excludes SHGs, excludes AP & Telanagana portfolio
PAR30 variation based on industry group, collection Exhibit 27.frequency (as of Sep’17)
Source: Equifax,CRISIL, JM Financial, #Data excludes SHGs, excludes AP & telangana portfolio
27.6%41.9%
21.6%
70.7% 73.6%
40.7%
35.6%
20.9%
11.4%21.6%
14.6%
67.8%
15.7%
50.2%
9.6%
39.1%
6.7% 7.4% 8.3% 5.5%
0%
10%
20%
30%
40%
50%
60%
70%
80%
90%
100%
Banks NBFC-MFI(PF < INR
7bn)
NBFC-MFI(PF >= INR
7bn)
SFB NBFC Industry
Monthly Bi-weekly Weekly Others
3%
8% 8%6%
30%
6%3%
7%
9%9%
19%
9%
5%
15%
12%
29%
11%
18%
4%
11%9%
23%
13%
11%
0%
5%
10%
15%
20%
25%
30%
35%
Banks NBFC-MFI(Portfolio <INR 7bn)
NBFC-MFI(Portfolio
>= INR 7bn)
SFB NBFC Industry
Weekly Bi-weekly Monthly Overall
Bandhan Bank 07 May 2018
JM Financial Institutional Securities Limited Page 17
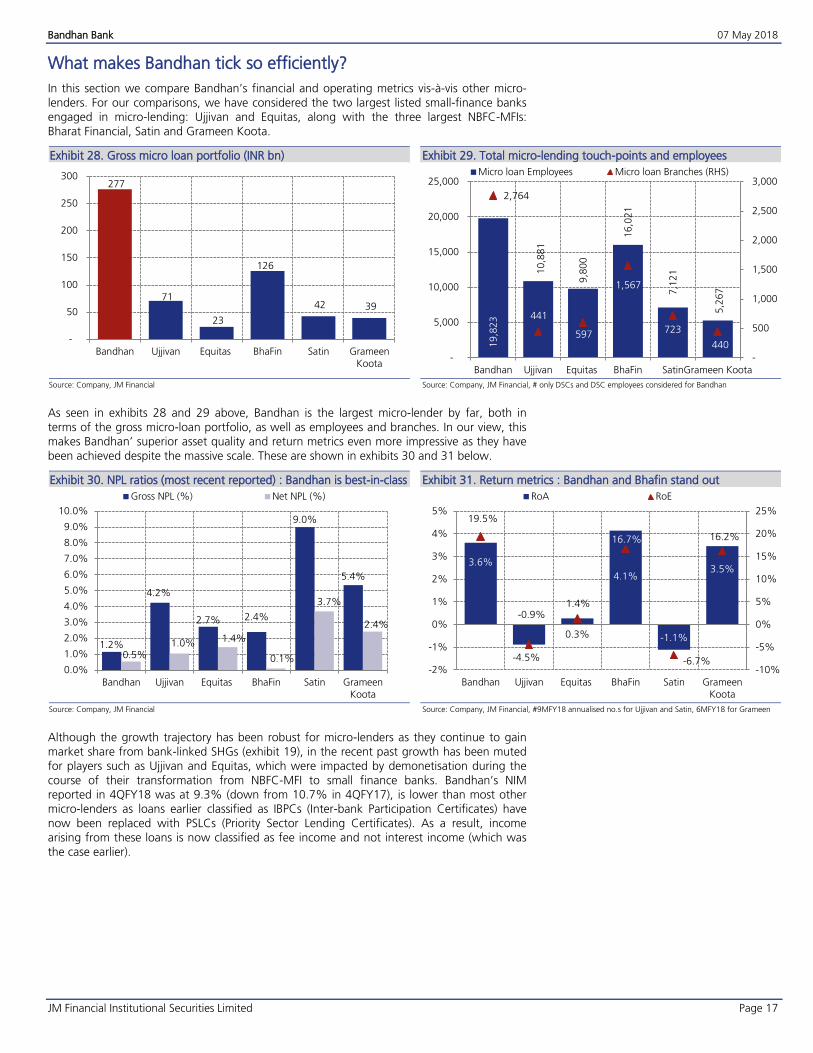
What makes Bandhan tick so efficiently?
In this section we compare Bandhan’s financial and operating metrics vis-à-vis other micro-
lenders. For our comparisons, we have considered the two largest listed small-finance banks engaged in micro-lending: Ujjivan and Equitas, along with the three largest NBFC-MFIs: Bharat Financial, Satin and Grameen Koota.
Gross micro loan portfolio (INR bn) Exhibit 28.
Source: Company, JM Financial
Total micro-lending touch-points and employees Exhibit 29.
Source: Company, JM Financial, # only DSCs and DSC employees considered for Bandhan
As seen in exhibits 28 and 29 above, Bandhan is the largest micro-lender by far, both in
terms of the gross micro-loan portfolio, as well as employees and branches. In our view, this makes Bandhan’ superior asset quality and return metrics even more impressive as they have
been achieved despite the massive scale. These are shown in exhibits 30 and 31 below.
NPL ratios (most recent reported) : Bandhan is best-in-class Exhibit 30.
Source: Company, JM Financial
Return metrics : Bandhan and Bhafin stand out Exhibit 31.
Source: Company, JM Financial, #9MFY18 annualised no.s for Ujjivan and Satin, 6MFY18 for Grameen
Although the growth trajectory has been robust for micro-lenders as they continue to gain market share from bank-linked SHGs (exhibit 19), in the recent past growth has been muted for players such as Ujjivan and Equitas, which were impacted by demonetisation during the
course of their transformation from NBFC-MFI to small finance banks. Bandhan’s NIM reported in 4QFY18 was at 9.3% (down from 10.7% in 4QFY17), is lower than most other micro-lenders as loans earlier classified as IBPCs (Inter-bank Participation Certificates) have now been replaced with PSLCs (Priority Sector Lending Certificates). As a result, income arising from these loans is now classified as fee income and not interest income (which was the case earlier).
277
71
23
126
42 39
-
50
100
150
200
250
300
Bandhan Ujjivan Equitas BhaFin Satin GrameenKoota
19,8
23
10,8
81
9,8
00
16,0
21
7,1
21
5,2
67
2,764
441
597
1,567
723
440
-
500
1,000
1,500
2,000
2,500
3,000
-
5,000
10,000
15,000
20,000
25,000
Bandhan Ujjivan Equitas BhaFin SatinGrameen Koota
Micro loan Employees Micro loan Branches (RHS)
1.2%
4.2%
2.7% 2.4%
9.0%
5.4%
0.5%1.0% 1.4%
0.1%
3.7%
2.4%
0.0%
1.0%
2.0%
3.0%
4.0%
5.0%
6.0%
7.0%
8.0%
9.0%
10.0%
Bandhan Ujjivan Equitas BhaFin Satin GrameenKoota
Gross NPL (%) Net NPL (%)
3.6%
-0.9%
0.3%
4.1%
-1.1%
3.5%
19.5%
-4.5%
1.4%
16.7%
-6.7%
16.2%
-10%
-5%
0%
5%
10%
15%
20%
25%
-2%
-1%
0%
1%
2%
3%
4%
5%
Bandhan Ujjivan Equitas BhaFin Satin GrameenKoota
RoA RoE
Bandhan Bank 07 May 2018
JM Financial Institutional Securities Limited Page 18
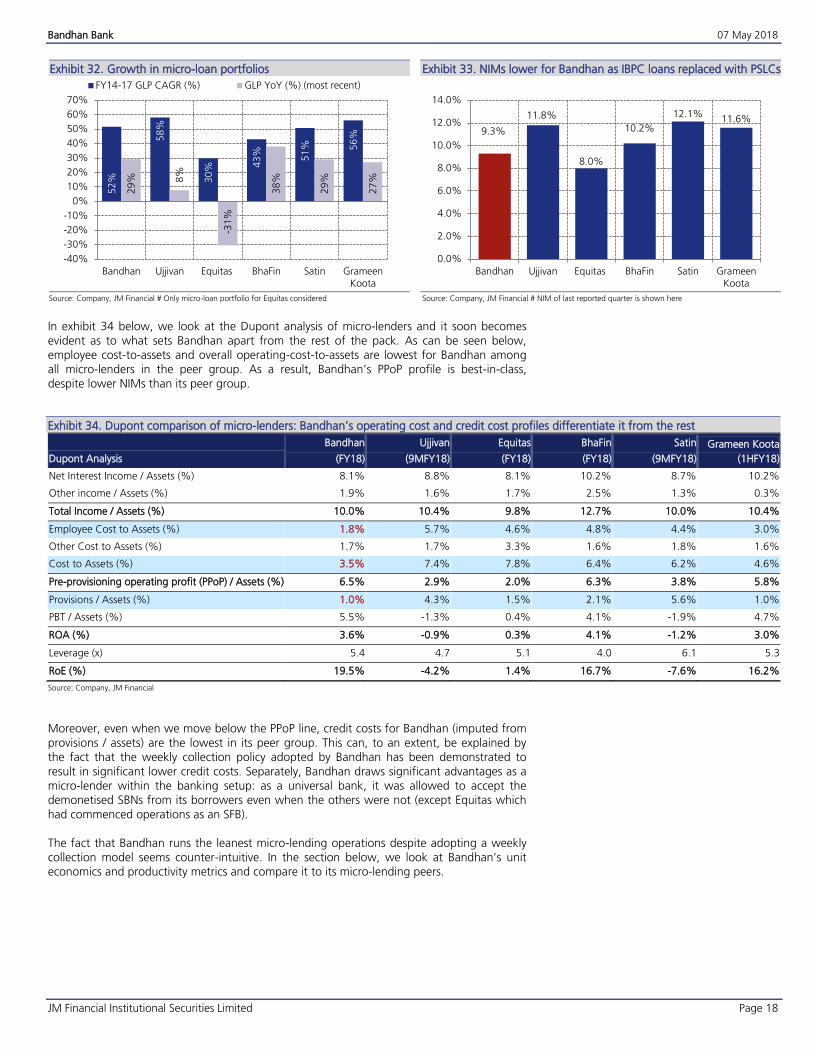
Growth in micro-loan portfolios Exhibit 32.
Source: Company, JM Financial # Only micro-loan portfolio for Equitas considered
NIMs lower for Bandhan as IBPC loans replaced with PSLCs Exhibit 33.
Source: Company, JM Financial # NIM of last reported quarter is shown here
In exhibit 34 below, we look at the Dupont analysis of micro-lenders and it soon becomes
evident as to what sets Bandhan apart from the rest of the pack. As can be seen below, employee cost-to-assets and overall operating-cost-to-assets are lowest for Bandhan among all micro-lenders in the peer group. As a result, Bandhan’s PPoP profile is best-in-class, despite lower NIMs than its peer group.
Dupont comparison of micro-lenders: Bandhan’s operating cost and credit cost profiles differentiate it from the rest Exhibit 34.
Dupont Analysis
Bandhan
(FY18)
Ujjivan
(9MFY18)
Equitas
(FY18)
BhaFin
(FY18)
Satin
(9MFY18)
Grameen Koota
(1HFY18)
Net Interest Income / Assets (%) 8.1% 8.8% 8.1% 10.2% 8.7% 10.2%
Other income / Assets (%) 1.9% 1.6% 1.7% 2.5% 1.3% 0.3%
Total Income / Assets (%) 10.0% 10.4% 9.8% 12.7% 10.0% 10.4%
Employee Cost to Assets (%) 1.8% 5.7% 4.6% 4.8% 4.4% 3.0%
Other Cost to Assets (%) 1.7% 1.7% 3.3% 1.6% 1.8% 1.6%
Cost to Assets (%) 3.5% 7.4% 7.8% 6.4% 6.2% 4.6%
Pre-provisioning operating profit (PPoP) / Assets (%) 6.5% 2.9% 2.0% 6.3% 3.8% 5.8%
Provisions / Assets (%) 1.0% 4.3% 1.5% 2.1% 5.6% 1.0%
PBT / Assets (%) 5.5% -1.3% 0.4% 4.1% -1.9% 4.7%
ROA (%) 3.6% -0.9% 0.3% 4.1% -1.2% 3.0%
Leverage (x) 5.4 4.7 5.1 4.0 6.1 5.3
RoE (%) 19.5% -4.2% 1.4% 16.7% -7.6% 16.2%
Source: Company, JM Financial
Moreover, even when we move below the PPoP line, credit costs for Bandhan (imputed from provisions / assets) are the lowest in its peer group. This can, to an extent, be explained by the fact that the weekly collection policy adopted by Bandhan has been demonstrated to result in significant lower credit costs. Separately, Bandhan draws significant advantages as a micro-lender within the banking setup: as a universal bank, it was allowed to accept the demonetised SBNs from its borrowers even when the others were not (except Equitas which
had commenced operations as an SFB). The fact that Bandhan runs the leanest micro-lending operations despite adopting a weekly collection model seems counter-intuitive. In the section below, we look at Bandhan’s unit economics and productivity metrics and compare it to its micro-lending peers.
52%
58%
30% 4
3% 51% 56%
29% 8
%
-31%
38%
29%
27%
-40%
-30%
-20%
-10%
0%
10%
20%
30%
40%
50%
60%
70%
Bandhan Ujjivan Equitas BhaFin Satin GrameenKoota
FY14-17 GLP CAGR (%) GLP YoY (%) (most recent)
9.3%
11.8%
8.0%
10.2%
12.1%11.6%
0.0%
2.0%
4.0%
6.0%
8.0%
10.0%
12.0%
14.0%
Bandhan Ujjivan Equitas BhaFin Satin GrameenKoota
Bandhan Bank 07 May 2018
JM Financial Institutional Securities Limited Page 19
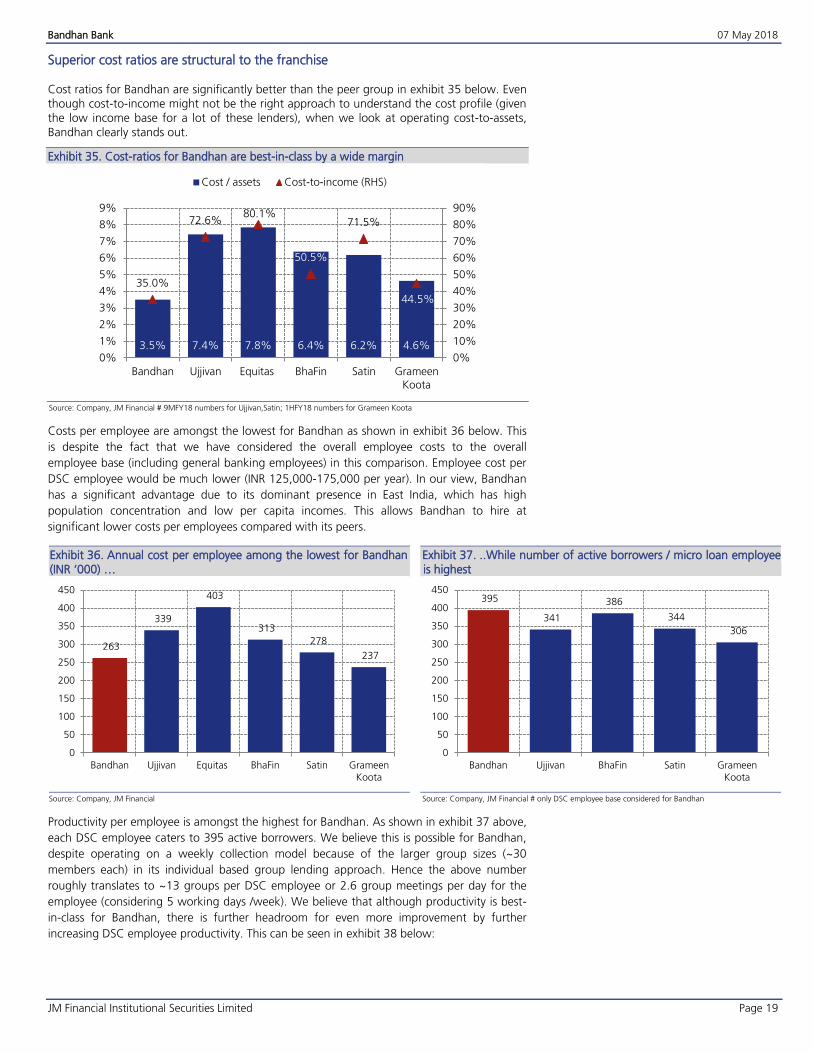
Superior cost ratios are structural to the franchise Cost ratios for Bandhan are significantly better than the peer group in exhibit 35 below. Even though cost-to-income might not be the right approach to understand the cost profile (given the low income base for a lot of these lenders), when we look at operating cost-to-assets, Bandhan clearly stands out.
Cost-ratios for Bandhan are best-in-class by a wide margin Exhibit 35.
Source: Company, JM Financial # 9MFY18 numbers for Ujjivan,Satin; 1HFY18 numbers for Grameen Koota
Costs per employee are amongst the lowest for Bandhan as shown in exhibit 36 below. This
is despite the fact that we have considered the overall employee costs to the overall
employee base (including general banking employees) in this comparison. Employee cost per
DSC employee would be much lower (INR 125,000-175,000 per year). In our view, Bandhan
has a significant advantage due to its dominant presence in East India, which has high
population concentration and low per capita incomes. This allows Bandhan to hire at
significant lower costs per employees compared with its peers.
Annual cost per employee among the lowest for Bandhan Exhibit 36.(INR ‘000) …
Source: Company, JM Financial
..While number of active borrowers / micro loan employee Exhibit 37.is highest
Source: Company, JM Financial # only DSC employee base considered for Bandhan
Productivity per employee is amongst the highest for Bandhan. As shown in exhibit 37 above,
each DSC employee caters to 395 active borrowers. We believe this is possible for Bandhan,
despite operating on a weekly collection model because of the larger group sizes (~30
members each) in its individual based group lending approach. Hence the above number
roughly translates to ~13 groups per DSC employee or 2.6 group meetings per day for the
employee (considering 5 working days /week). We believe that although productivity is best-
in-class for Bandhan, there is further headroom for even more improvement by further
increasing DSC employee productivity. This can be seen in exhibit 38 below:
3.5% 7.4% 7.8% 6.4% 6.2% 4.6%
35.0%
72.6%80.1%
50.5%
71.5%
44.5%
0%
10%
20%
30%
40%
50%
60%
70%
80%
90%
0%
1%
2%
3%
4%
5%
6%
7%
8%
9%
Bandhan Ujjivan Equitas BhaFin Satin GrameenKoota
Cost / assets Cost-to-income (RHS)
263
339
403
313
278
237
0
50
100
150
200
250
300
350
400
450
Bandhan Ujjivan Equitas BhaFin Satin GrameenKoota
395
341
386
344
306
0
50
100
150
200
250
300
350
400
450
Bandhan Ujjivan BhaFin Satin GrameenKoota
Bandhan Bank 07 May 2018
JM Financial Institutional Securities Limited Page 20
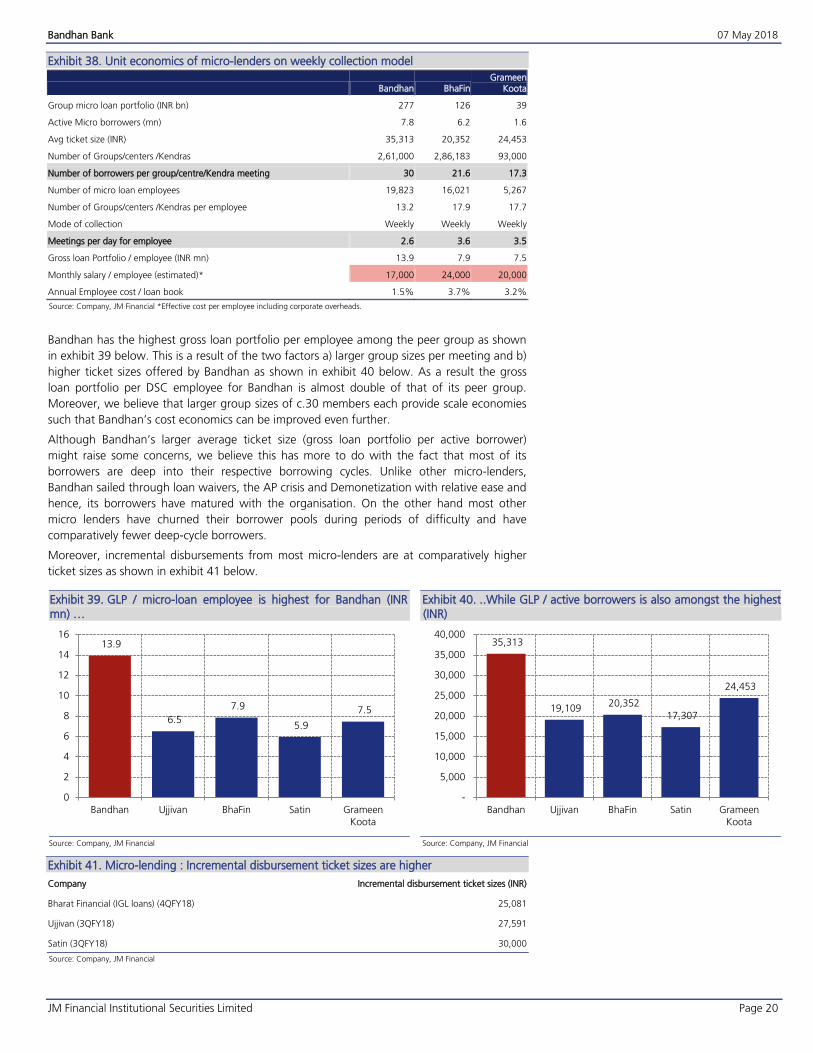
Unit economics of micro-lenders on weekly collection model Exhibit 38.
Bandhan BhaFin Grameen
Koota
Group micro loan portfolio (INR bn) 277 126 39
Active Micro borrowers (mn) 7.8 6.2 1.6
Avg ticket size (INR) 35,313 20,352 24,453
Number of Groups/centers /Kendras 2,61,000 2,86,183 93,000
Number of borrowers per group/centre/Kendra meeting 30 21.6 17.3
Number of micro loan employees 19,823 16,021 5,267
Number of Groups/centers /Kendras per employee 13.2 17.9 17.7
Mode of collection Weekly Weekly Weekly
Meetings per day for employee 2.6 3.6 3.5
Gross loan Portfolio / employee (INR mn) 13.9 7.9 7.5
Monthly salary / employee (estimated)* 17,000 24,000 20,000
Annual Employee cost / loan book 1.5% 3.7% 3.2%
Source: Company, JM Financial *Effective cost per employee including corporate overheads.
Bandhan has the highest gross loan portfolio per employee among the peer group as shown
in exhibit 39 below. This is a result of the two factors a) larger group sizes per meeting and b)
higher ticket sizes offered by Bandhan as shown in exhibit 40 below. As a result the gross
loan portfolio per DSC employee for Bandhan is almost double of that of its peer group.
Moreover, we believe that larger group sizes of c.30 members each provide scale economies
such that Bandhan’s cost economics can be improved even further.
Although Bandhan’s larger average ticket size (gross loan portfolio per active borrower)
might raise some concerns, we believe this has more to do with the fact that most of its
borrowers are deep into their respective borrowing cycles. Unlike other micro-lenders,
Bandhan sailed through loan waivers, the AP crisis and Demonetization with relative ease and
hence, its borrowers have matured with the organisation. On the other hand most other
micro lenders have churned their borrower pools during periods of difficulty and have
comparatively fewer deep-cycle borrowers.
Moreover, incremental disbursements from most micro-lenders are at comparatively higher
ticket sizes as shown in exhibit 41 below.
GLP / micro-loan employee is highest for Bandhan (INR Exhibit 39.mn) …
Source: Company, JM Financial
..While GLP / active borrowers is also amongst the highest Exhibit 40.(INR)
Source: Company, JM Financial
Micro-lending : Incremental disbursement ticket sizes are higher Exhibit 41.
Company Incremental disbursement ticket sizes (INR)
Bharat Financial (IGL loans) (4QFY18) 25,081
Ujjivan (3QFY18) 27,591
Satin (3QFY18) 30,000
Source: Company, JM Financial
13.9
6.5
7.9
5.9
7.5
0
2
4
6
8
10
12
14
16
Bandhan Ujjivan BhaFin Satin GrameenKoota
35,313
19,109 20,352
17,307
24,453
-
5,000
10,000
15,000
20,000
25,000
30,000
35,000
40,000
Bandhan Ujjivan BhaFin Satin GrameenKoota
Bandhan Bank 07 May 2018
JM Financial Institutional Securities Limited Page 21
Bandhan– An improvised microlender
Bandhan has had a relatively unique trajectory in terms of its evolution, right from its
beginning as an NGO (Bandhan Konnagar) followed by its transformation into a microfinance
lender (earlier NBFC and then NBFC-MFI) under Bandhan Financial Services Ltd (BFSL) –
eventually leading to its current form of a universal bank.
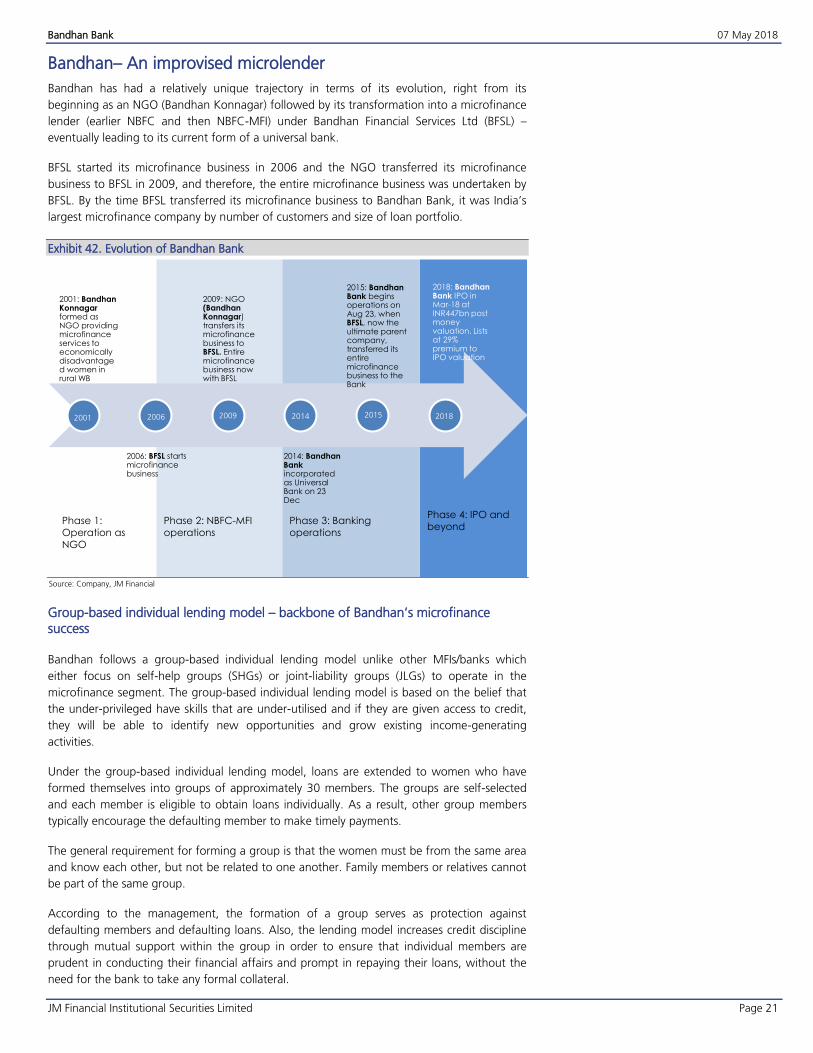
BFSL started its microfinance business in 2006 and the NGO transferred its microfinance
business to BFSL in 2009, and therefore, the entire microfinance business was undertaken by
BFSL. By the time BFSL transferred its microfinance business to Bandhan Bank, it was India’s
largest microfinance company by number of customers and size of loan portfolio.
Evolution of Bandhan Bank Exhibit 42.
Source: Company, JM Financial
Group-based individual lending model – backbone of Bandhan’s microfinance success Bandhan follows a group-based individual lending model unlike other MFIs/banks which
either focus on self-help groups (SHGs) or joint-liability groups (JLGs) to operate in the
microfinance segment. The group-based individual lending model is based on the belief that
the under-privileged have skills that are under-utilised and if they are given access to credit,
they will be able to identify new opportunities and grow existing income-generating
activities.
Under the group-based individual lending model, loans are extended to women who have
formed themselves into groups of approximately 30 members. The groups are self-selected
and each member is eligible to obtain loans individually. As a result, other group members
typically encourage the defaulting member to make timely payments.
The general requirement for forming a group is that the women must be from the same area
and know each other, but not be related to one another. Family members or relatives cannot
be part of the same group.
According to the management, the formation of a group serves as protection against
defaulting members and defaulting loans. Also, the lending model increases credit discipline
through mutual support within the group in order to ensure that individual members are
prudent in conducting their financial affairs and prompt in repaying their loans, without the
need for the bank to take any formal collateral.
Phase 4: IPO and
beyondPhase 3: Banking
operations
Phase 2: NBFC-MFI
operations
2001: BandhanKonnagarformed as NGO providing microfinance services to economically disadvantaged women in rural WB
2006: BFSL starts microfinance business
2009: NGO (BandhanKonnagar) transfers its microfinance business to BFSL. Entire microfinance business now with BFSL
2014: BandhanBank incorporatedas Universal Bank on 23 Dec
2015: BandhanBank beginsoperations on Aug 23, when BFSL, now the ultimate parent company, transferred its entire microfinance business to the Bank
2018: BandhanBank IPO in Mar-18 at INR447bn post money valuation. Lists at 29% premium to IPO valuation
Phase 1:
Operation as
NGO
2001 2006 2009 2014 2015 2018
Bandhan Bank 07 May 2018
JM Financial Institutional Securities Limited Page 22
However, unlike the JLG model where the group members have the repayment responsibility
in case of the default by one of the group members, the group-based individual lending
model places the repayment responsibility on the individual at all points in time. Thus, it also
shields “good” borrowers from subsidising the “bad” borrowers. However, sometimes in
case of default in payment by any customer, the group members offer to help the customer
in repaying the loan, although they are under no obligation to do so.
Bandhan extends microloans exclusively to women borrowers, although loan proceeds may
be used for business activities that are run by the women’s families, including the husband.
Management believes that extending loans to women borrowers improves the portfolio
quality given that a) they are generally more risk averse b) cooperate better in groups and c)
are generally more accessible than their working husbands and can meet regularly at group
meetings to administer the repayment of their loans.
Bandhan places significant importance on attendance at group meetings and absenteeism at
group meetings is considered as an early warning indicator for potential problem customers.
Bandhan Bank: Key stats Exhibit 43.
Source: Company, JM Financial
Bandhan’s operating model – Microbanking vs. General banking
As Bandhan transformed into a universal bank in 2015, it ensured that its microbanking set-
up remained largely untouched from an operational perspective except from being connected
to the core banking system.
While microbanking customers were onboarded to the banking platform through savings
accounts, Bandhan ensured that the customer experience for these customers remained
almost the same from a positioning and process perspective. At the same time, Bandhan’s
branch rollout for general banking customers ensured that the bank competed with other
universal private sector banks on customer experience, product suite, etc without carrying its
“microlender” baggage.
Microbanking distribution architecture
Bandhan reaches out to its microfinance customers through its Doorstep Service Centre (DSC)
network which ensures credit origination and management of micro loans. The DSCs are
strategically located in close proximity to customers to provide them customised services in a
timely manner. About 3-4 DSCs are linked to a single bank branch, and the network of DSCs
and branches operate under this “hub and spoke” model.
Each DSC is staffed with 6-7 personnel who are equipped with handheld devices connected
to the core banking system. However, DSC is a low-cost banking outlet and has bare minimal
operational infrastructure – typically 1 internet-enabled computer, 5-6 chairs, 2-3 tables and
few handheld devices for on-field personnel – and are located in remote areas even within
Tier2/Tier3 towns, away from main streets. This ensures low operating as well as fixed costs
and without compromising on proximity to the customer base.
As on Mar '18
AUM (INR bn) 323.4
Number of Customers (mn) 13.01
Number of active MFI borrowers (mn) 7.83
MFI GLP / Active borrower 35,313
Avg. Cycle of customers 5.5
Products offered Max. Ticket size Interest rate
MFI loans (with both 1 year and 2 year tenor) 0.1 mn 18.4%
Small enterprise loans (SEL) 1.0 mn 16.0%
SME loans > 1mn
Retail loans - housing and mortgage loans, two wheeler loans, personal loans,
loans against property, loans against term deposits and gold loans
Bandhan Bank 07 May 2018
JM Financial Institutional Securities Limited Page 23
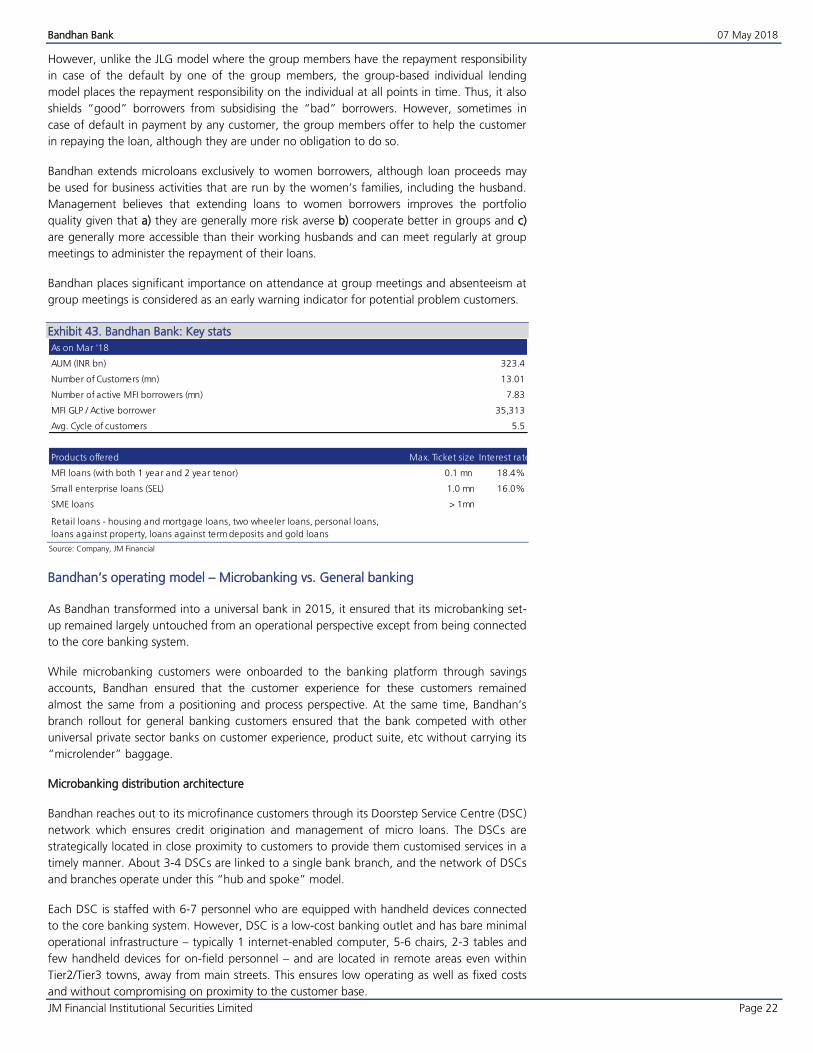
Bandhan DSCs are basic structures to support DBOs in centre activities Exhibit 44.
Source: JM Financial
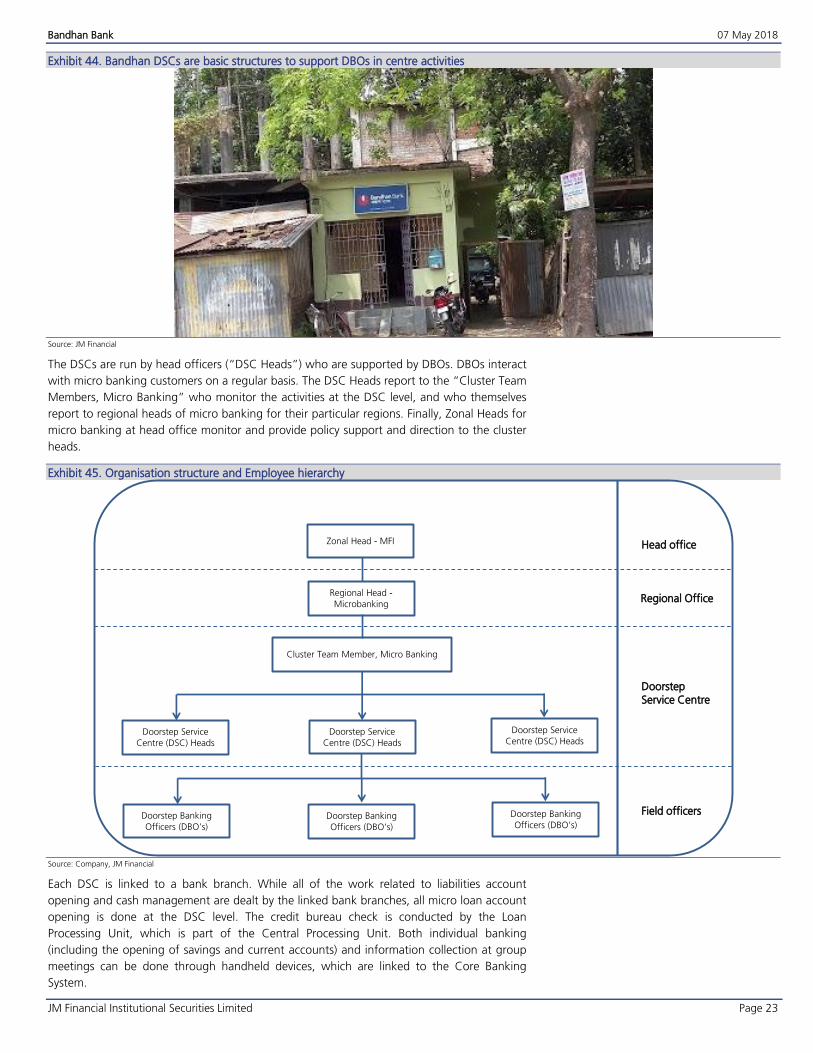
The DSCs are run by head officers (“DSC Heads”) who are supported by DBOs. DBOs interact
with micro banking customers on a regular basis. The DSC Heads report to the “Cluster Team
Members, Micro Banking” who monitor the activities at the DSC level, and who themselves
report to regional heads of micro banking for their particular regions. Finally, Zonal Heads for
micro banking at head office monitor and provide policy support and direction to the cluster
heads.
Organisation structure and Employee hierarchy Exhibit 45.
Source: Company, JM Financial
Each DSC is linked to a bank branch. While all of the work related to liabilities account
opening and cash management are dealt by the linked bank branches, all micro loan account
opening is done at the DSC level. The credit bureau check is conducted by the Loan
Processing Unit, which is part of the Central Processing Unit. Both individual banking
(including the opening of savings and current accounts) and information collection at group
meetings can be done through handheld devices, which are linked to the Core Banking
System.
Cluster Team Member, Micro Banking
Doorstep Service
Centre (DSC) Heads
Doorstep Service
Centre (DSC) Heads
Doorstep Service
Centre (DSC) Heads
Regional Head -
Microbanking
Zonal Head - MFI
Doorstep Banking
Officers (DBO’s)Doorstep Banking
Officers (DBO’s)
Doorstep Banking
Officers (DBO’s)
Head office
Regional Office
Doorstep
Service Centre
Field officers
Bandhan Bank 07 May 2018
JM Financial Institutional Securities Limited Page 24
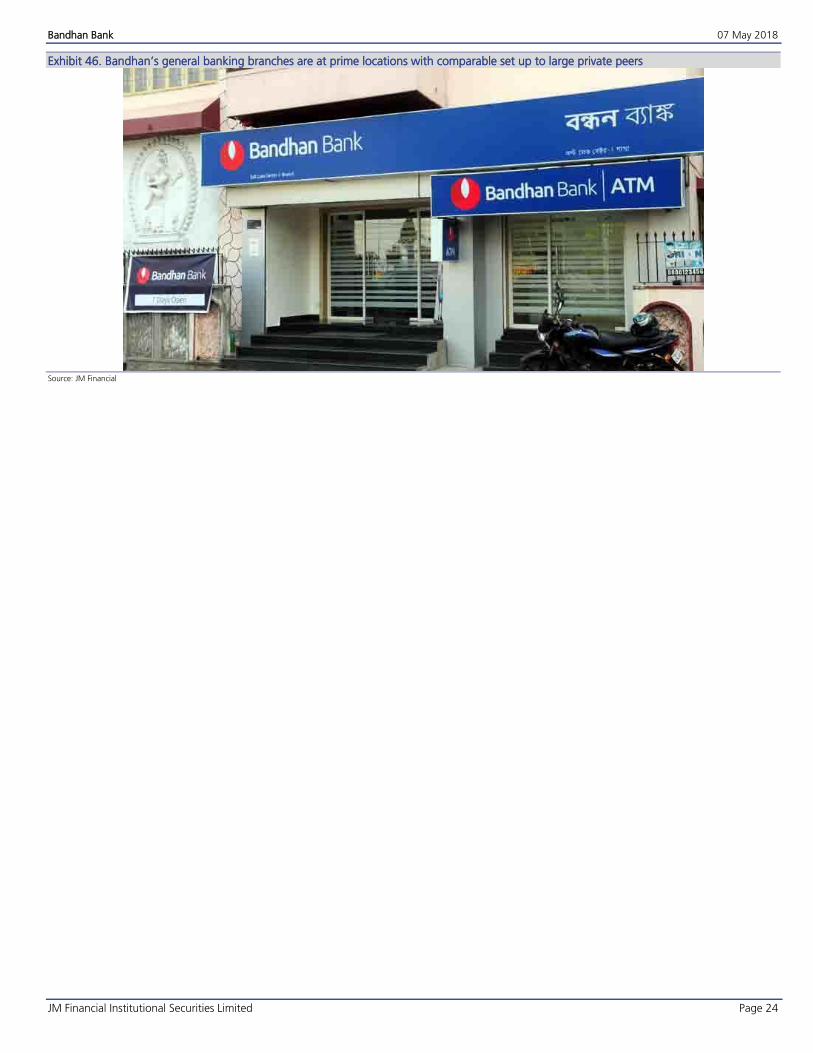
Bandhan’s general banking branches are at prime locations with comparable set up to large private peers Exhibit 46.
Source: JM Financial
Bandhan Bank 07 May 2018
JM Financial Institutional Securities Limited Page 25
In Focus : Bandhan’s micro-banking process
Group formation
In order to select clients and promote the formation of borrower groups, an initial survey is
conducted by the DBO and DSC Head. After a visit and discussions with the potential
customers, the DBOs and/or DSC Head facilitate formation of groups of interested women
from the locality in question.
Savings account opening
After formation of a group, a common place is selected where the group members meet at
regular intervals. Simultaneously, the bank provide savings bank account forms and conduct
know-your-client (“KYC”) verification, as well as house visits to the customers, before
sending the customer information to the linked bank branch. The bank branch, after being
satisfied with the completeness of the application, sends the report to our central processing
unit (“CPU”) for opening the account. The CPU checks the completeness of the application
along with KYC documents and opens the account. The savings account of the customer
resides with the linked bank branch.
Loan applications
Loan applications are filled out during the group meeting based on the recommendation of
the group members. The DSC Head is empowered to sanction loans to customers after
physical verification of the original KYC documentation, place of business, and the filled-in
loan forms. The sanctioned loan amount is disbursed to the savings account of the customer
maintained with the linked bank branch and the customer withdraws the amount from the
savings account after due biometric authentication on handheld devices. Typical turnaround
time from loan application to disbursement is around a week.
Loan sanctions
For microloans, doorstep banking officers (“DBOs”) source loan applications, conduct the
primary appraisal and customer visits and make loan recommendations to the head of the
applicable DSC. The head of the DSC then visits the customer’s house and checks the details
entered in the loan applications and, if satisfied, sanctions the loan. The appraisal criteria for
micro loans are primarily qualitative, and include factors such as customer profile, age,
current enterprise, income, surplus income and Credit Bureau report on past performance.
Loan recovery
Daily, the DBO starts at the DSC by downloading of a list of customers from whom an
amount is to be collected during the day. Collection of payments due happens at a close
vicinity to the customers. Group meetings are held at the relevant location, and collection of
due amounts is done using the handheld device. The printed acknowledgement receipt is
handed over to the customer as well as manually entered in the group register. The
collected amount is credited into the savings account of the customer and the due amount
is transferred to the loan account of the respective customer. Each DBO handles four to five
such groups daily. In each group, there is a group resolution register where customers’
attendance as well as the total collection for the day is recorded. After completion of all the
groups, the DBO returns to the DSC and hands the cash to the cashier. The DSC picks up
the cash from the group itself and deposits it in the DSC at a stipulated time on the same
day. The surplus cash beyond the prescribed cash retention limit, if any, is sent to the linked
bank branch through the DSC officials.
Bandhan Bank 07 May 2018
JM Financial Institutional Securities Limited Page 26
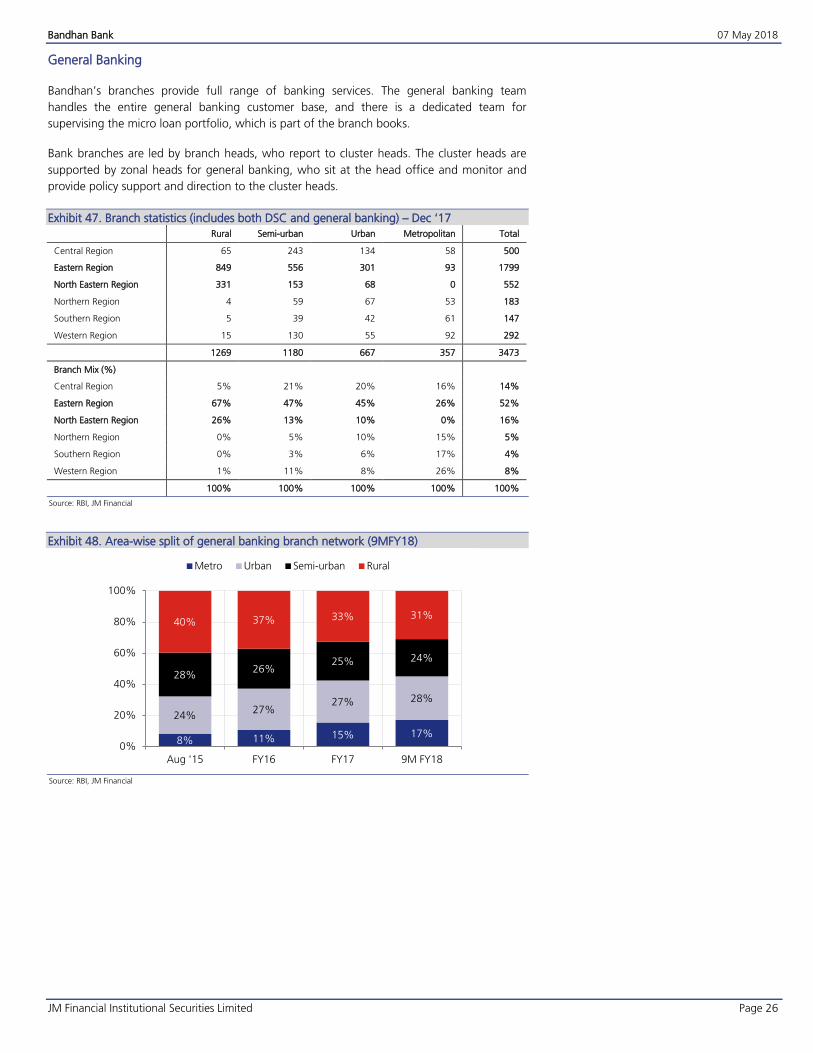
General Banking
Bandhan’s branches provide full range of banking services. The general banking team
handles the entire general banking customer base, and there is a dedicated team for
supervising the micro loan portfolio, which is part of the branch books.
Bank branches are led by branch heads, who report to cluster heads. The cluster heads are
supported by zonal heads for general banking, who sit at the head office and monitor and
provide policy support and direction to the cluster heads.
Branch statistics (includes both DSC and general banking) – Dec ‘17 Exhibit 47.
Rural Semi-urban Urban Metropolitan Total
Central Region 65 243 134 58 500
Eastern Region 849 556 301 93 1799
North Eastern Region 331 153 68 0 552
Northern Region 4 59 67 53 183
Southern Region 5 39 42 61 147
Western Region 15 130 55 92 292
1269 1180 667 357 3473
Branch Mix (%)
Central Region 5% 21% 20% 16% 14%
Eastern Region 67% 47% 45% 26% 52%
North Eastern Region 26% 13% 10% 0% 16%
Northern Region 0% 5% 10% 15% 5%
Southern Region 0% 3% 6% 17% 4%
Western Region 1% 11% 8% 26% 8%
100% 100% 100% 100% 100%
Source: RBI, JM Financial
Area-wise split of general banking branch network (9MFY18) Exhibit 48.
Source: RBI, JM Financial
8% 11% 15% 17%
24%27%
27% 28%
28%26%
25% 24%
40% 37% 33% 31%
0%
20%
40%
60%
80%
100%
Aug '15 FY16 FY17 9M FY18
Metro Urban Semi-urban Rural
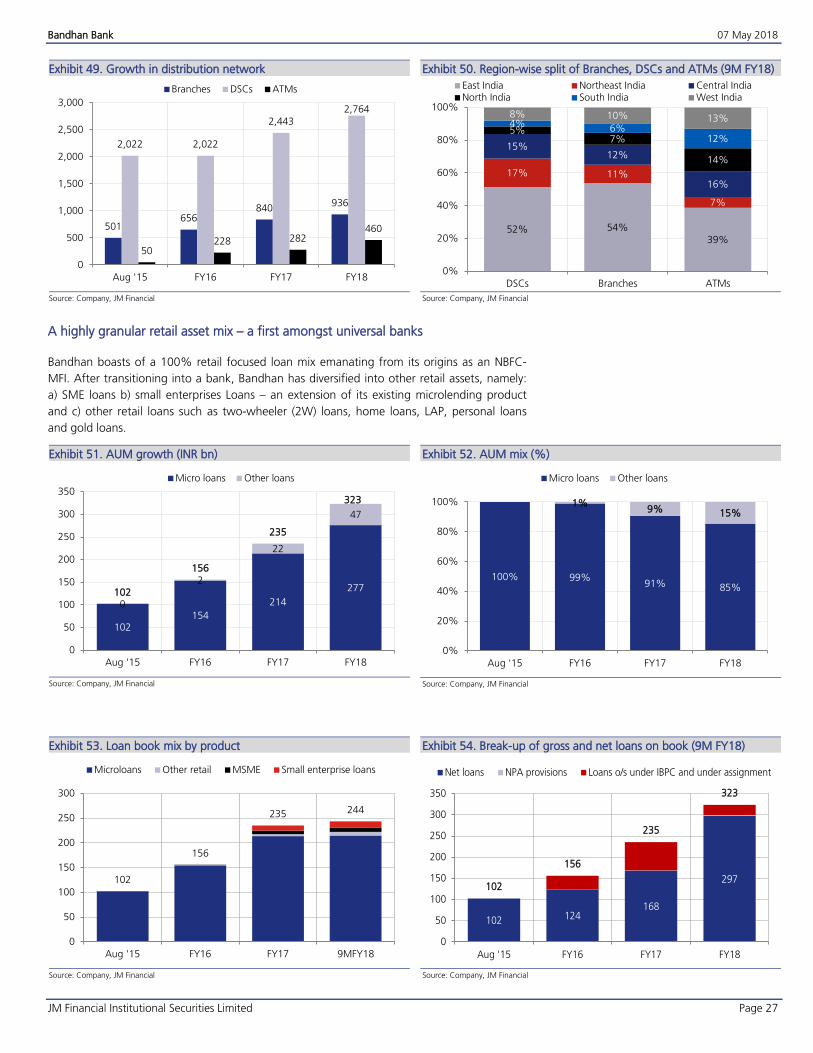
Bandhan Bank 07 May 2018
JM Financial Institutional Securities Limited Page 27
Growth in distribution network Exhibit 49.
Source: Company, JM Financial
Region-wise split of Branches, DSCs and ATMs (9M FY18) Exhibit 50.
Source: Company, JM Financial
A highly granular retail asset mix – a first amongst universal banks
Bandhan boasts of a 100% retail focused loan mix emanating from its origins as an NBFC-
MFI. After transitioning into a bank, Bandhan has diversified into other retail assets, namely:
a) SME loans b) small enterprises Loans – an extension of its existing microlending product
and c) other retail loans such as two-wheeler (2W) loans, home loans, LAP, personal loans
and gold loans.
AUM growth (INR bn) Exhibit 51.
Source: Company, JM Financial
AUM mix (%) Exhibit 52.
Source: Company, JM Financial
Loan book mix by product Exhibit 53.
Source: Company, JM Financial
Break-up of gross and net loans on book (9M FY18) Exhibit 54.
Source: Company, JM Financial
501656
840936
2,022 2,022
2,443
2,764
50228 282
460
0
500
1,000
1,500
2,000
2,500
3,000
Aug '15 FY16 FY17 FY18
Branches DSCs ATMs
52% 54%
39%
17% 11%
7%
15%12%
16%
5%7%
14%
4% 6%12%
8% 10% 13%
0%
20%
40%
60%
80%
100%
DSCs Branches ATMs
East India Northeast India Central IndiaNorth India South India West India
102154
214
277
0
2
22
47
102
156
235
323
0
50
100
150
200
250
300
350
Aug '15 FY16 FY17 FY18
Micro loans Other loans
100% 99%91% 85%
1%9% 15%
0%
20%
40%
60%
80%
100%
Aug '15 FY16 FY17 FY18
Micro loans Other loans
102
156
235 244
0
50
100
150
200
250
300
Aug '15 FY16 FY17 9MFY18
Microloans Other retail MSME Small enterprise loans
102 124168
297102
156
235
323
0
50
100
150
200
250
300
350
Aug '15 FY16 FY17 FY18
Net loans NPA provisions Loans o/s under IBPC and under assignment
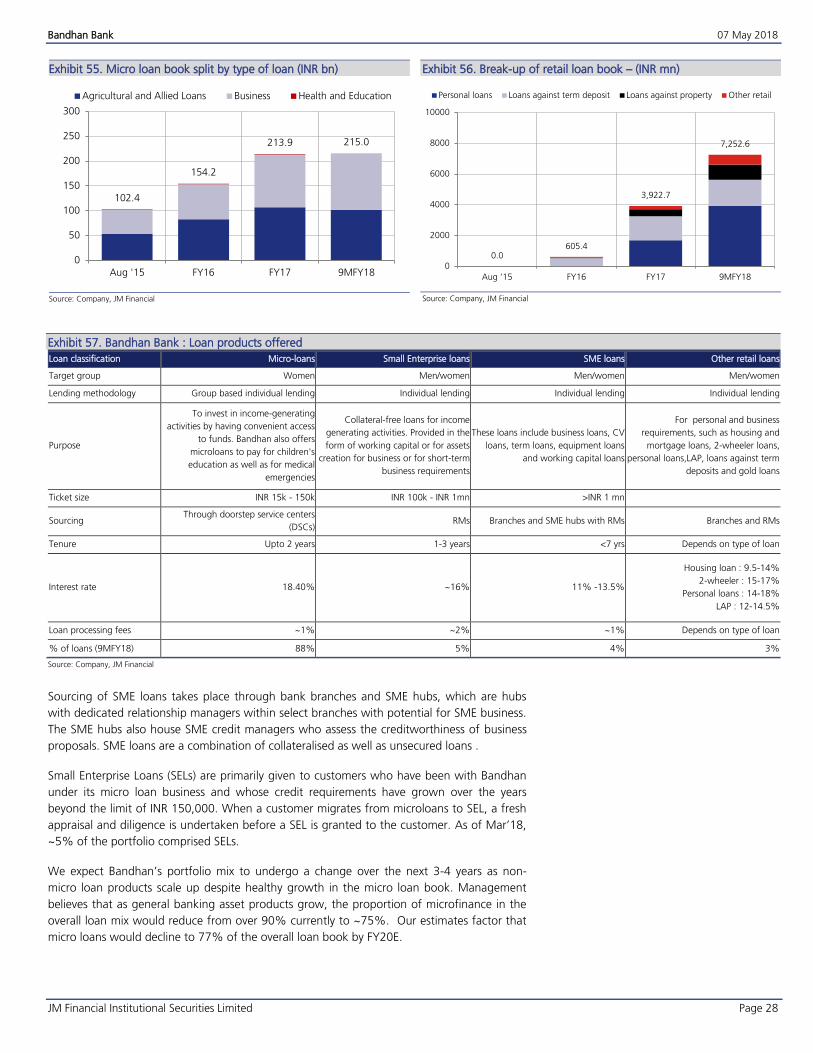
Bandhan Bank 07 May 2018
JM Financial Institutional Securities Limited Page 28
Micro loan book split by type of loan (INR bn) Exhibit 55.
Source: Company, JM Financial
Break-up of retail loan book – (INR mn) Exhibit 56.
Source: Company, JM Financial
Bandhan Bank : Loan products offered Exhibit 57.
Loan classification Micro-loans Small Enterprise loans SME loans Other retail loans
Target group Women Men/women Men/women Men/women
Lending methodology Group based individual lending Individual lending Individual lending Individual lending
Purpose
To invest in income-generating
activities by having convenient access
to funds. Bandhan also offers
microloans to pay for children's
education as well as for medical
emergencies
Collateral-free loans for income
generating activities. Provided in the
form of working capital or for assets
creation for business or for short-term
business requirements
These loans include business loans, CV
loans, term loans, equipment loans
and working capital loans
For personal and business
requirements, such as housing and
mortgage loans, 2-wheeler loans,
personal loans,LAP, loans against term
deposits and gold loans
Ticket size INR 15k - 150k INR 100k - INR 1mn >INR 1 mn
Sourcing Through doorstep service centers
(DSCs) RMs Branches and SME hubs with RMs Branches and RMs
Tenure Upto 2 years 1-3 years <7 yrs Depends on type of loan
Interest rate 18.40% ~16% 11% -13.5%
Housing loan : 9.5-14%
2-wheeler : 15-17%
Personal loans : 14-18%
LAP : 12-14.5%
Loan processing fees ~1% ~2% ~1% Depends on type of loan
% of loans (9MFY18) 88% 5% 4% 3%
Source: Company, JM Financial
Sourcing of SME loans takes place through bank branches and SME hubs, which are hubs
with dedicated relationship managers within select branches with potential for SME business.
The SME hubs also house SME credit managers who assess the creditworthiness of business
proposals. SME loans are a combination of collateralised as well as unsecured loans .
Small Enterprise Loans (SELs) are primarily given to customers who have been with Bandhan
under its micro loan business and whose credit requirements have grown over the years
beyond the limit of INR 150,000. When a customer migrates from microloans to SEL, a fresh
appraisal and diligence is undertaken before a SEL is granted to the customer. As of Mar’18,
~5% of the portfolio comprised SELs.
We expect Bandhan’s portfolio mix to undergo a change over the next 3-4 years as non-
micro loan products scale up despite healthy growth in the micro loan book. Management
believes that as general banking asset products grow, the proportion of microfinance in the
overall loan mix would reduce from over 90% currently to ~75%. Our estimates factor that
micro loans would decline to 77% of the overall loan book by FY20E.
102.4
154.2
213.9 215.0
0
50
100
150
200
250
300
Aug '15 FY16 FY17 9MFY18
Agricultural and Allied Loans Business Health and Education
0.0605.4
3,922.7
7,252.6
0
2000
4000
6000
8000
10000
Aug '15 FY16 FY17 9MFY18
Personal loans Loans against term deposit Loans against property Other retail
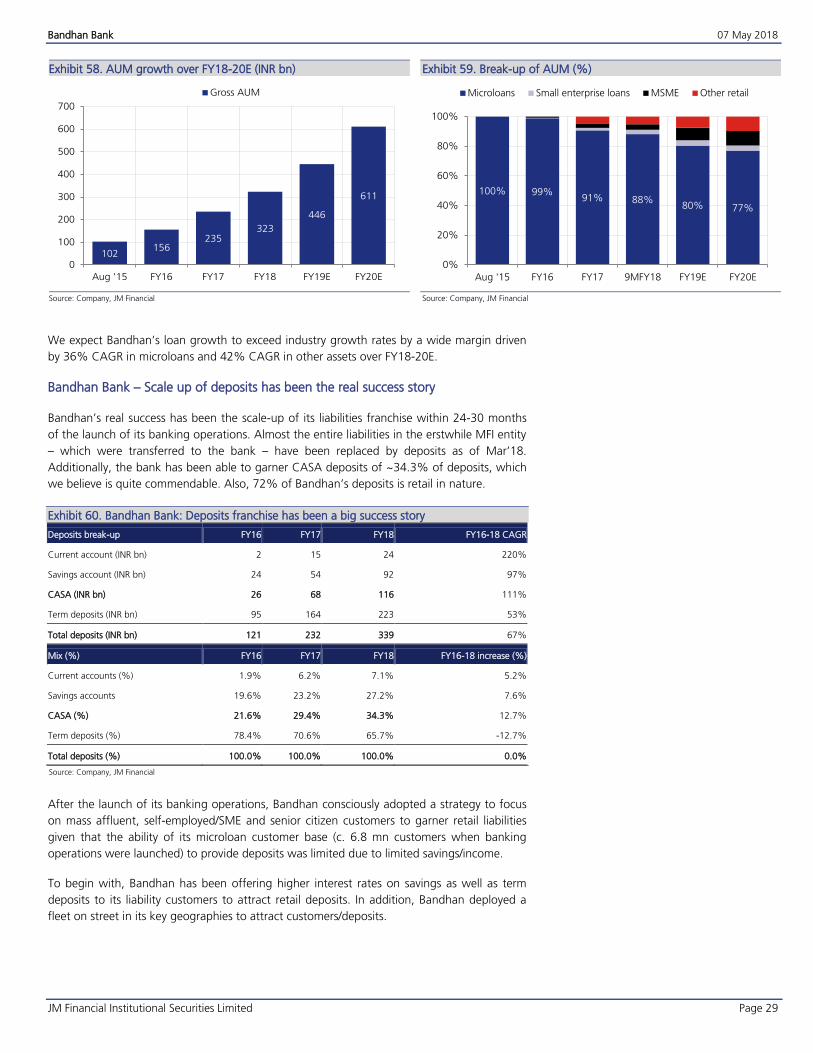
Bandhan Bank 07 May 2018
JM Financial Institutional Securities Limited Page 29
AUM growth over FY18-20E (INR bn) Exhibit 58.
Source: Company, JM Financial
Break-up of AUM (%) Exhibit 59.
Source: Company, JM Financial
We expect Bandhan’s loan growth to exceed industry growth rates by a wide margin driven
by 36% CAGR in microloans and 42% CAGR in other assets over FY18-20E.
Bandhan Bank – Scale up of deposits has been the real success story
Bandhan’s real success has been the scale-up of its liabilities franchise within 24-30 months
of the launch of its banking operations. Almost the entire liabilities in the erstwhile MFI entity
– which were transferred to the bank – have been replaced by deposits as of Mar’18.
Additionally, the bank has been able to garner CASA deposits of ~34.3% of deposits, which
we believe is quite commendable. Also, 72% of Bandhan’s deposits is retail in nature.
Bandhan Bank: Deposits franchise has been a big success story Exhibit 60.
Deposits break-up FY16 FY17 FY18 FY16-18 CAGR
Current account (INR bn) 2 15 24 220%
Savings account (INR bn) 24 54 92 97%
CASA (INR bn) 26 68 116 111%
Term deposits (INR bn) 95 164 223 53%
Total deposits (INR bn) 121 232 339 67%
Mix (%) FY16 FY17 FY18 FY16-18 increase (%)
Current accounts (%) 1.9% 6.2% 7.1% 5.2%
Savings accounts 19.6% 23.2% 27.2% 7.6%
CASA (%) 21.6% 29.4% 34.3% 12.7%
Term deposits (%) 78.4% 70.6% 65.7% -12.7%
Total deposits (%) 100.0% 100.0% 100.0% 0.0%
Source: Company, JM Financial
After the launch of its banking operations, Bandhan consciously adopted a strategy to focus
on mass affluent, self-employed/SME and senior citizen customers to garner retail liabilities
given that the ability of its microloan customer base (c. 6.8 mn customers when banking
operations were launched) to provide deposits was limited due to limited savings/income.
To begin with, Bandhan has been offering higher interest rates on savings as well as term
deposits to its liability customers to attract retail deposits. In addition, Bandhan deployed a
fleet on street in its key geographies to attract customers/deposits.
102156
235323
446
611
0
100
200
300
400
500
600
700
Aug '15 FY16 FY17 FY18 FY19E FY20E
Gross AUM
100% 99%91% 88%
80% 77%
0%
20%
40%
60%
80%
100%
Aug '15 FY16 FY17 9MFY18 FY19E FY20E
Microloans Small enterprise loans MSME Other retail
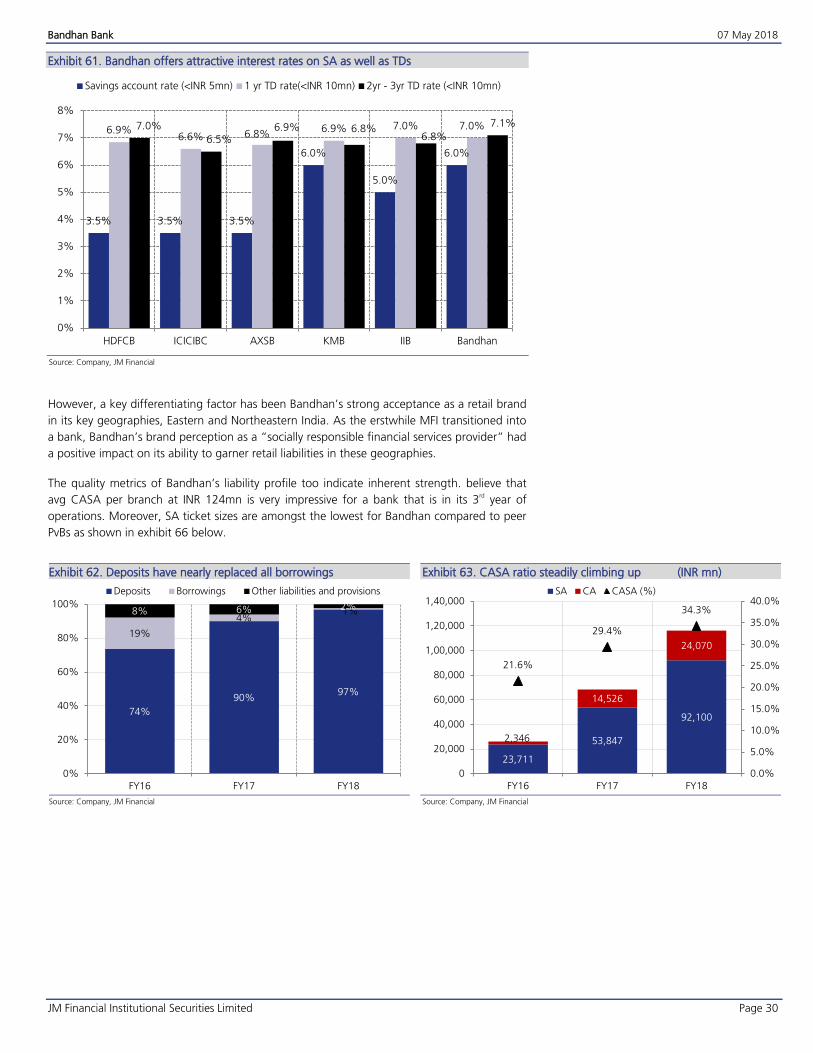
Bandhan Bank 07 May 2018
JM Financial Institutional Securities Limited Page 30
Bandhan offers attractive interest rates on SA as well as TDs Exhibit 61.
Source: Company, JM Financial
However, a key differentiating factor has been Bandhan’s strong acceptance as a retail brand
in its key geographies, Eastern and Northeastern India. As the erstwhile MFI transitioned into
a bank, Bandhan’s brand perception as a “socially responsible financial services provider” had
a positive impact on its ability to garner retail liabilities in these geographies.
The quality metrics of Bandhan’s liability profile too indicate inherent strength. believe that
avg CASA per branch at INR 124mn is very impressive for a bank that is in its 3rd year of
operations. Moreover, SA ticket sizes are amongst the lowest for Bandhan compared to peer
PvBs as shown in exhibit 66 below.
Deposits have nearly replaced all borrowings Exhibit 62.
Source: Company, JM Financial
CASA ratio steadily climbing up (INR mn) Exhibit 63.
Source: Company, JM Financial
3.5% 3.5% 3.5%
6.0%
5.0%
6.0%
6.9%6.6% 6.8%
6.9% 7.0% 7.0%7.0%
6.5%6.9% 6.8%
6.8%
7.1%
0%
1%
2%
3%
4%
5%
6%
7%
8%
HDFCB ICICIBC AXSB KMB IIB Bandhan
Savings account rate (<INR 5mn) 1 yr TD rate(<INR 10mn) 2yr - 3yr TD rate (<INR 10mn)
74%
90%97%
19%
4%1%8% 6% 2%
0%
20%
40%
60%
80%
100%
FY16 FY17 FY18
Deposits Borrowings Other liabilities and provisions
23,711
53,847
92,100
2,346
14,526
24,070
21.6%
29.4%
34.3%
0.0%
5.0%
10.0%
15.0%
20.0%
25.0%
30.0%
35.0%
40.0%
0
20,000
40,000
60,000
80,000
1,00,000
1,20,000
1,40,000
FY16 FY17 FY18
SA CA CASA (%)
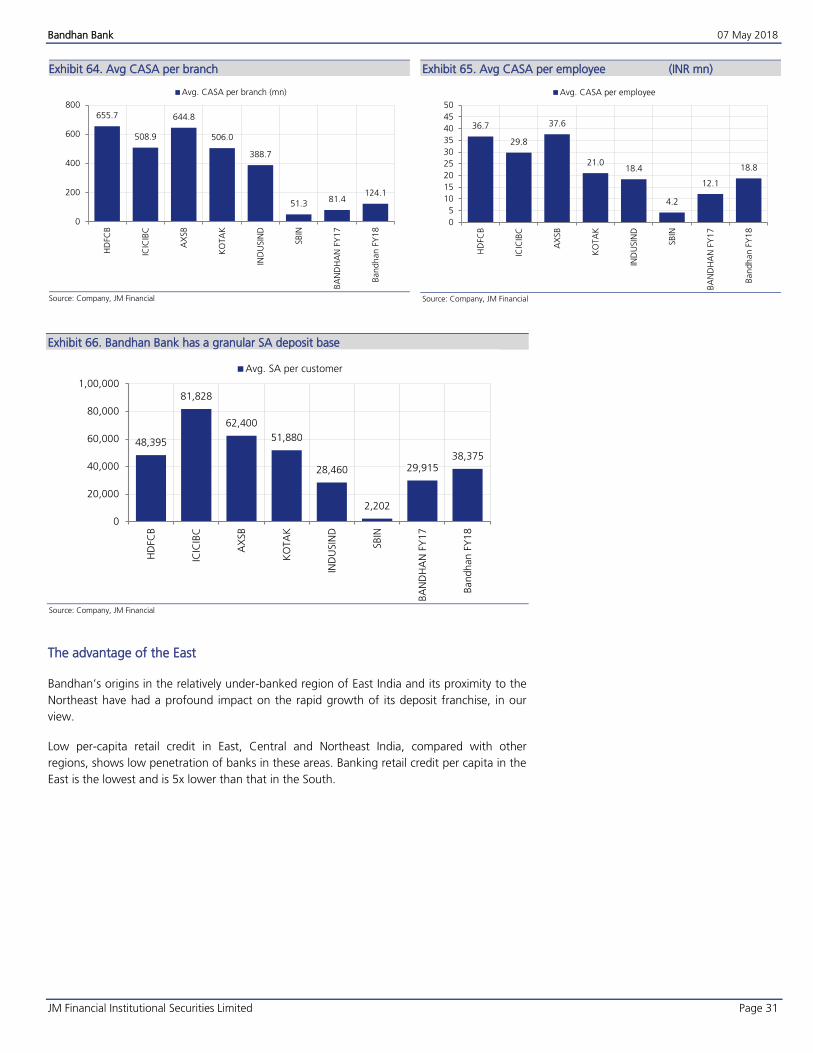
Bandhan Bank 07 May 2018
JM Financial Institutional Securities Limited Page 31
Avg CASA per branch Exhibit 64.
Source: Company, JM Financial
Avg CASA per employee (INR mn) Exhibit 65.
Source: Company, JM Financial
Bandhan Bank has a granular SA deposit base Exhibit 66.
Source: Company, JM Financial
The advantage of the East
Bandhan’s origins in the relatively under-banked region of East India and its proximity to the
Northeast have had a profound impact on the rapid growth of its deposit franchise, in our
view.
Low per-capita retail credit in East, Central and Northeast India, compared with other
regions, shows low penetration of banks in these areas. Banking retail credit per capita in the
East is the lowest and is 5x lower than that in the South.
655.7
508.9
644.8
506.0
388.7
51.381.4
124.1
0
200
400
600
800H
DFC
B
ICIC
IBC
AX
SB
KO
TA
K
IND
USIN
D
SB
IN
BA
ND
HA
N F
Y17
Bandh
an F
Y1
8
Avg. CASA per branch (mn)
36.7
29.8
37.6
21.018.4
4.2
12.1
18.8
0
5
10
15
20
25
30
35
40
45
50
HD
FCB
ICIC
IBC
AX
SB
KO
TA
K
IND
USIN
D
SB
IN
BA
ND
HA
N F
Y17
Bandh
an F
Y1
8
Avg. CASA per employee
48,395
81,828
62,400
51,880
28,460
2,202
29,91538,375
0
20,000
40,000
60,000
80,000
1,00,000
HD
FCB
ICIC
IBC
AX
SB
KO
TA
K
IND
USIN
D
SB
IN
BA
ND
HA
N F
Y17
Bandh
an F
Y1
8
Avg. SA per customer
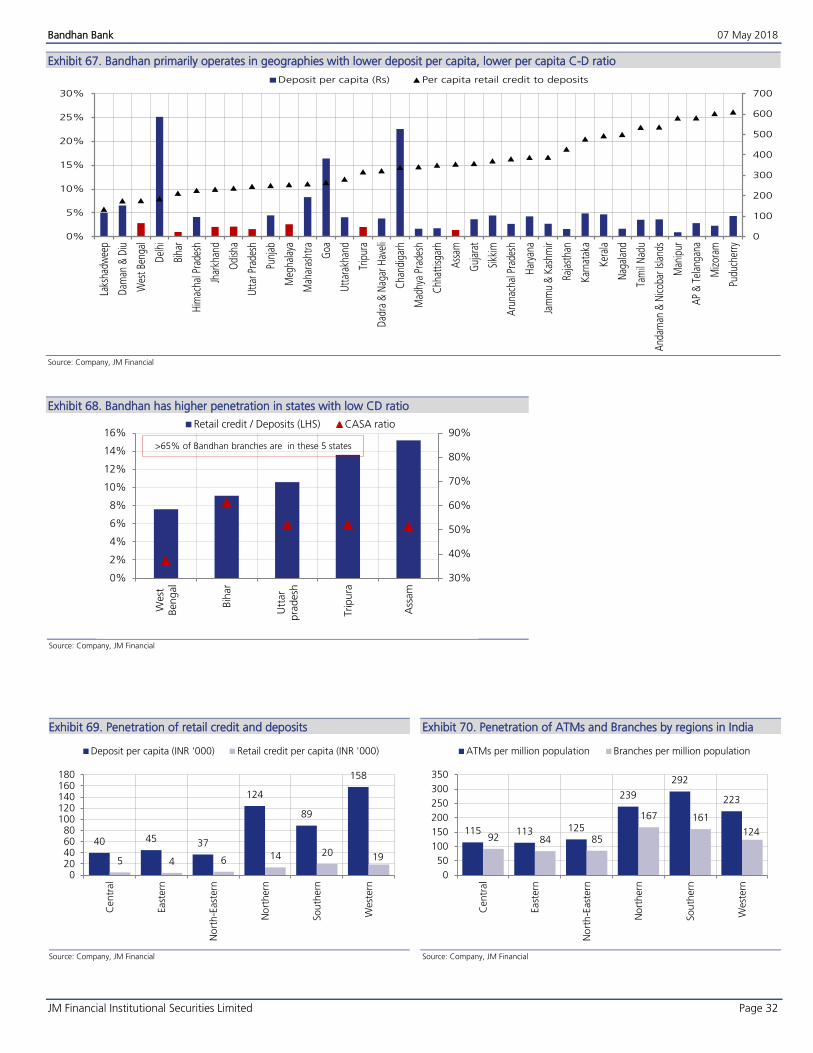
Bandhan Bank 07 May 2018
JM Financial Institutional Securities Limited Page 32
Bandhan primarily operates in geographies with lower deposit per capita, lower per capita C-D ratio Exhibit 67.
Source: Company, JM Financial
Bandhan has higher penetration in states with low CD ratio Exhibit 68.
Source: Company, JM Financial
Penetration of retail credit and deposits Exhibit 69.
Source: Company, JM Financial
Penetration of ATMs and Branches by regions in India Exhibit 70.
Source: Company, JM Financial
0
100
200
300
400
500
600
700
0%
5%
10%
15%
20%
25%
30%
Laks
hadw
eep
Dam
an &
Diu
Wes
t Be
ngal
Del
hi
Biha
r
Him
acha
l Pra
desh
Jhar
khan
d
Odi
sha
Utt
ar P
rade
sh
Punj
ab
Meg
hala
ya
Mah
aras
htra
Goa
Utt
arak
hand
Trip
ura
Dad
ra &
Nag
ar H
avel
i
Cha
ndig
arh
Mad
hya
Prad
esh
Chh
attis
garh
Ass
am
Guj
arat
Sikk
im
Aru
nach
al P
rade
sh
Har
yana
Jam
mu
& K
ashm
ir
Raja
stha
n
Kar
nata
ka
Ker
ala
Nag
alan
d
Tam
il N
adu
And
aman
& N
icob
ar Is
land
s
Man
ipur
AP
& T
elan
gana
Miz
oram
Pudu
cher
ry
Deposit per capita (Rs) Per capita retail credit to deposits
30%
40%
50%
60%
70%
80%
90%
0%
2%
4%
6%
8%
10%
12%
14%
16%
West
Ben
gal
Bih
ar
Utt
ar
pra
desh
Tripu
ra
Ass
am
Retail credit / Deposits (LHS) CASA ratio
>65% of Bandhan branches are in these 5 states
40 45 37
124
89
158
5 4 6 14 20 19
020406080
100120140160180
Centr
al
East
ern
No
rth-E
ast
ern
No
rthern
Sou
thern
West
ern
Deposit per capita (INR '000) Retail credit per capita (INR '000)
115 113 125
239
292
223
92 84 85
167 161
124
0
50
100
150
200
250
300
350
Centr
al
East
ern
No
rth-E
ast
ern
No
rthern
Sou
thern
West
ern
ATMs per million population Branches per million population
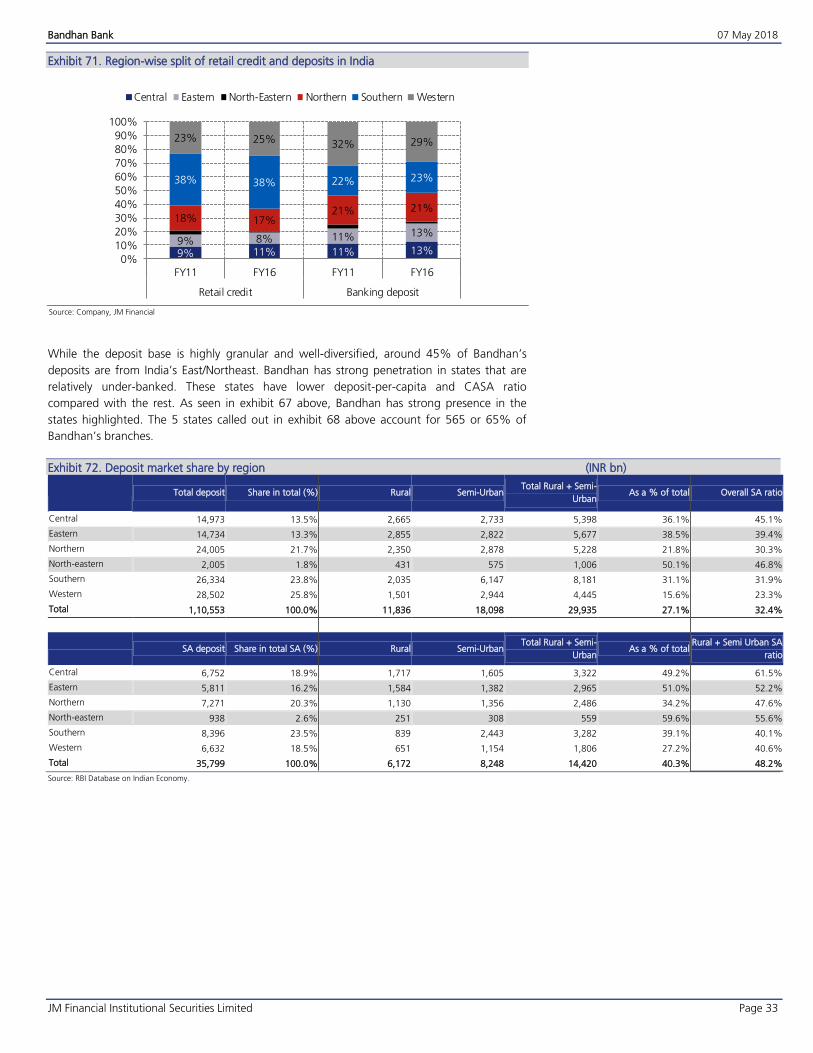
Bandhan Bank 07 May 2018
JM Financial Institutional Securities Limited Page 33
Region-wise split of retail credit and deposits in India Exhibit 71.
9% 11% 11% 13%9% 8% 11% 13%
18% 17%21% 21%
38% 38% 22% 23%
23% 25% 32% 29%
0%
10%
20%
30%
40%
50%
60%
70%
80%
90%
100%
FY11 FY16 FY11 FY16
Retail credit Banking deposit
Central Eastern North-Eastern Northern Southern Western
Source: Company, JM Financial
While the deposit base is highly granular and well-diversified, around 45% of Bandhan’s
deposits are from India’s East/Northeast. Bandhan has strong penetration in states that are
relatively under-banked. These states have lower deposit-per-capita and CASA ratio
compared with the rest. As seen in exhibit 67 above, Bandhan has strong presence in the
states highlighted. The 5 states called out in exhibit 68 above account for 565 or 65% of
Bandhan’s branches.
Deposit market share by region (INR bn) Exhibit 72.
Total deposit Share in total (%) Rural Semi-Urban Total Rural + Semi-
Urban As a % of total Overall SA ratio
Central 14,973 13.5% 2,665 2,733 5,398 36.1% 45.1%
Eastern 14,734 13.3% 2,855 2,822 5,677 38.5% 39.4%
Northern 24,005 21.7% 2,350 2,878 5,228 21.8% 30.3%
North-eastern 2,005 1.8% 431 575 1,006 50.1% 46.8%
Southern 26,334 23.8% 2,035 6,147 8,181 31.1% 31.9%
Western 28,502 25.8% 1,501 2,944 4,445 15.6% 23.3%
Total 1,10,553 100.0% 11,836 18,098 29,935 27.1% 32.4%
SA deposit Share in total SA (%) Rural Semi-Urban Total Rural + Semi-
Urban As a % of total
Rural + Semi Urban SA
ratio
Central 6,752 18.9% 1,717 1,605 3,322 49.2% 61.5%
Eastern 5,811 16.2% 1,584 1,382 2,965 51.0% 52.2%
Northern 7,271 20.3% 1,130 1,356 2,486 34.2% 47.6%
North-eastern 938 2.6% 251 308 559 59.6% 55.6%
Southern 8,396 23.5% 839 2,443 3,282 39.1% 40.1%
Western 6,632 18.5% 651 1,154 1,806 27.2% 40.6%
Total 35,799 100.0% 6,172 8,248 14,420 40.3% 48.2%
Source: RBI Database on Indian Economy.
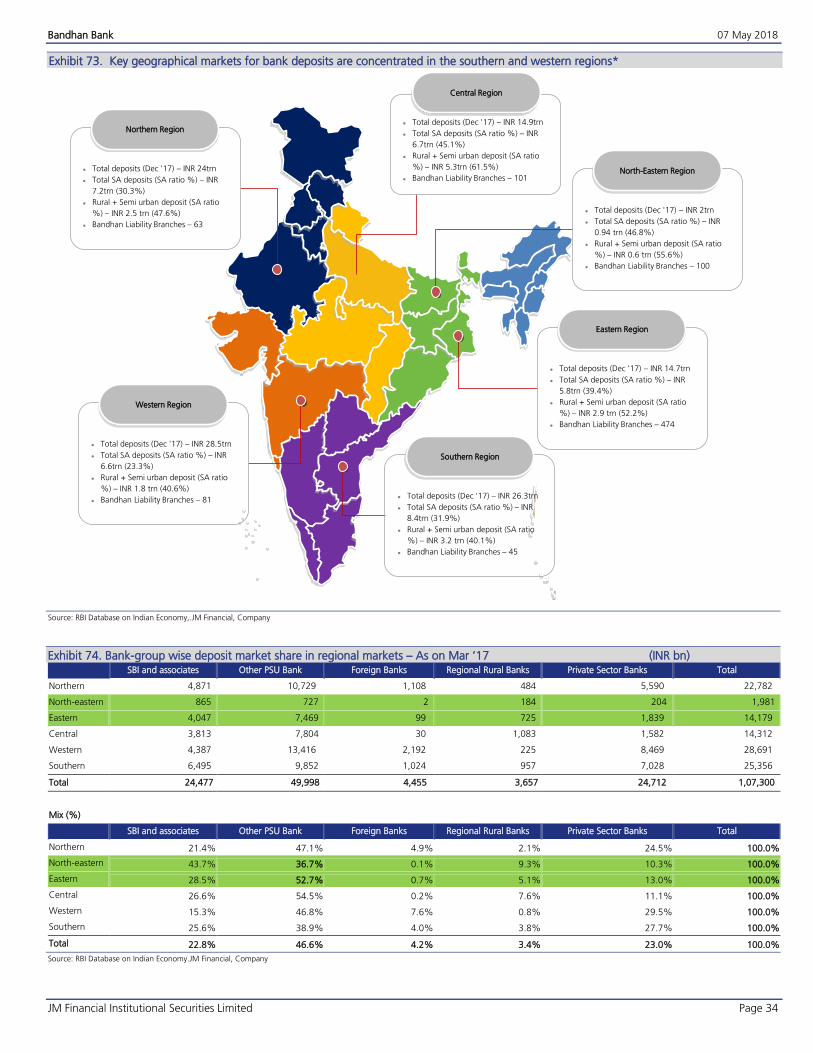
Bandhan Bank 07 May 2018
JM Financial Institutional Securities Limited Page 34
Key geographical markets for bank deposits are concentrated in the southern and western regions* Exhibit 73.
Source: RBI Database on Indian Economy,.JM Financial, Company
Bank-group wise deposit market share in regional markets – As on Mar ’17 (INR bn) Exhibit 74.SBI and associates Other PSU Bank Foreign Banks Regional Rural Banks Private Sector Banks Total
Northern 4,871 10,729 1,108 484 5,590 22,782
North-eastern 865 727 2 184 204 1,981
Eastern 4,047 7,469 99 725 1,839 14,179
Central 3,813 7,804 30 1,083 1,582 14,312
Western 4,387 13,416 2,192 225 8,469 28,691
Southern 6,495 9,852 1,024 957 7,028 25,356
Total 24,477 49,998 4,455 3,657 24,712 1,07,300
Mix (%)
SBI and associates Other PSU Bank Foreign Banks Regional Rural Banks Private Sector Banks Total
Northern 21.4% 47.1% 4.9% 2.1% 24.5% 100.0%
North-eastern 43.7% 36.7% 0.1% 9.3% 10.3% 100.0%
Eastern 28.5% 52.7% 0.7% 5.1% 13.0% 100.0%
Central 26.6% 54.5% 0.2% 7.6% 11.1% 100.0%
Western 15.3% 46.8% 7.6% 0.8% 29.5% 100.0%
Southern 25.6% 38.9% 4.0% 3.8% 27.7% 100.0%
Total 22.8% 46.6% 4.2% 3.4% 23.0% 100.0%
Source: RBI Database on Indian Economy.JM Financial, Company
Northern Region
Total deposits (Dec '17) – INR 24trn
Total SA deposits (SA ratio %) – INR
7.2trn (30.3%)
Rural + Semi urban deposit (SA ratio
%) – INR 2.5 trn (47.6%)
Bandhan Liability Branches – 63
Western Region
Total deposits (Dec '17) – INR 28.5trn
Total SA deposits (SA ratio %) – INR
6.6trn (23.3%)
Rural + Semi urban deposit (SA ratio
%) – INR 1.8 trn (40.6%)
Bandhan Liability Branches – 81
North-Eastern Region
Total deposits (Dec '17) – INR 2trn
Total SA deposits (SA ratio %) – INR
0.94 trn (46.8%)
Rural + Semi urban deposit (SA ratio
%) – INR 0.6 trn (55.6%)
Bandhan Liability Branches – 100
Eastern Region
Total deposits (Dec '17) – INR 14.7trn
Total SA deposits (SA ratio %) – INR
5.8trn (39.4%)
Rural + Semi urban deposit (SA ratio
%) – INR 2.9 trn (52.2%)
Bandhan Liability Branches – 474
Southern Region
Total deposits (Dec '17) – INR 26.3trn
Total SA deposits (SA ratio %) – INR
8.4trn (31.9%)
Rural + Semi urban deposit (SA ratio
%) – INR 3.2 trn (40.1%)
Bandhan Liability Branches – 45
Central Region
Total deposits (Dec '17) – INR 14.9trn
Total SA deposits (SA ratio %) – INR
6.7trn (45.1%)
Rural + Semi urban deposit (SA ratio
%) – INR 5.3trn (61.5%)
Bandhan Liability Branches – 101
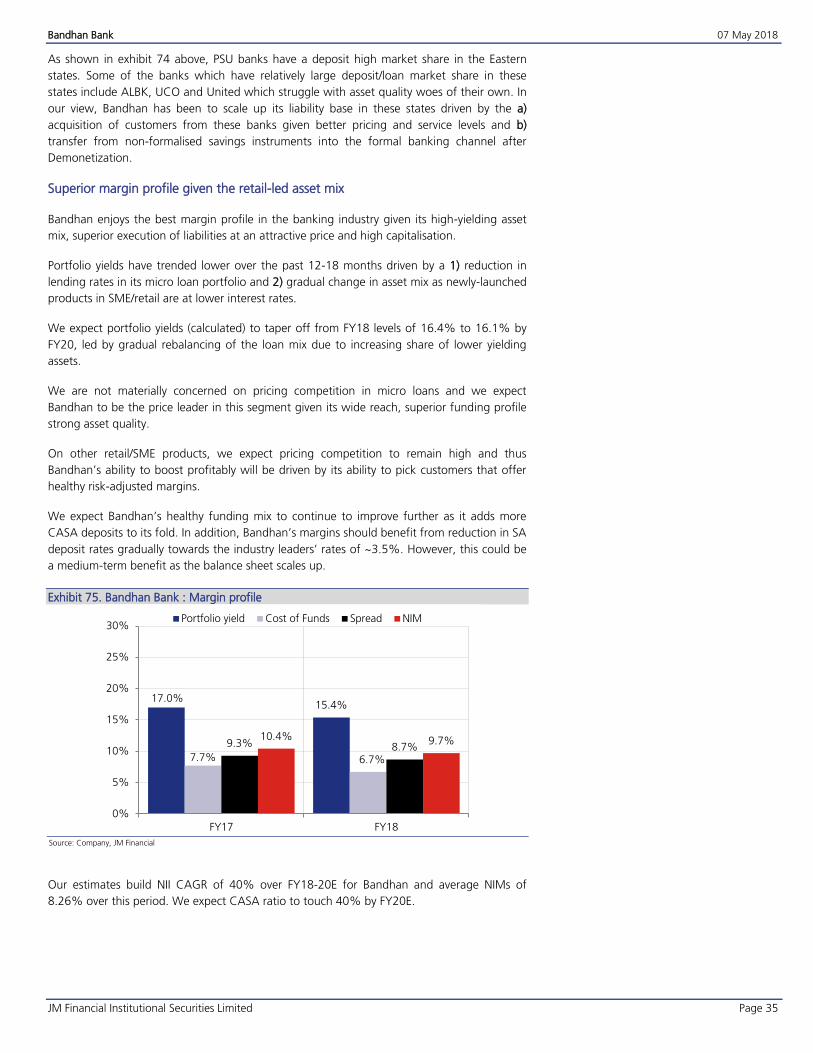
Bandhan Bank 07 May 2018
JM Financial Institutional Securities Limited Page 35
As shown in exhibit 74 above, PSU banks have a deposit high market share in the Eastern
states. Some of the banks which have relatively large deposit/loan market share in these
states include ALBK, UCO and United which struggle with asset quality woes of their own. In
our view, Bandhan has been to scale up its liability base in these states driven by the a)
acquisition of customers from these banks given better pricing and service levels and b)
transfer from non-formalised savings instruments into the formal banking channel after
Demonetization.
Superior margin profile given the retail-led asset mix
Bandhan enjoys the best margin profile in the banking industry given its high-yielding asset
mix, superior execution of liabilities at an attractive price and high capitalisation.
Portfolio yields have trended lower over the past 12-18 months driven by a 1) reduction in
lending rates in its micro loan portfolio and 2) gradual change in asset mix as newly-launched
products in SME/retail are at lower interest rates.
We expect portfolio yields (calculated) to taper off from FY18 levels of 16.4% to 16.1% by
FY20, led by gradual rebalancing of the loan mix due to increasing share of lower yielding
assets.
We are not materially concerned on pricing competition in micro loans and we expect
Bandhan to be the price leader in this segment given its wide reach, superior funding profile
strong asset quality.
On other retail/SME products, we expect pricing competition to remain high and thus
Bandhan’s ability to boost profitably will be driven by its ability to pick customers that offer
healthy risk-adjusted margins.
We expect Bandhan’s healthy funding mix to continue to improve further as it adds more
CASA deposits to its fold. In addition, Bandhan’s margins should benefit from reduction in SA
deposit rates gradually towards the industry leaders’ rates of ~3.5%. However, this could be
a medium-term benefit as the balance sheet scales up.
Bandhan Bank : Margin profile Exhibit 75.
Source: Company, JM Financial
Our estimates build NII CAGR of 40% over FY18-20E for Bandhan and average NIMs of
8.26% over this period. We expect CASA ratio to touch 40% by FY20E.
17.0%15.4%
7.7% 6.7%
9.3% 8.7%10.4% 9.7%
0%
5%
10%
15%
20%
25%
30%
FY17 FY18
Portfolio yield Cost of Funds Spread NIM
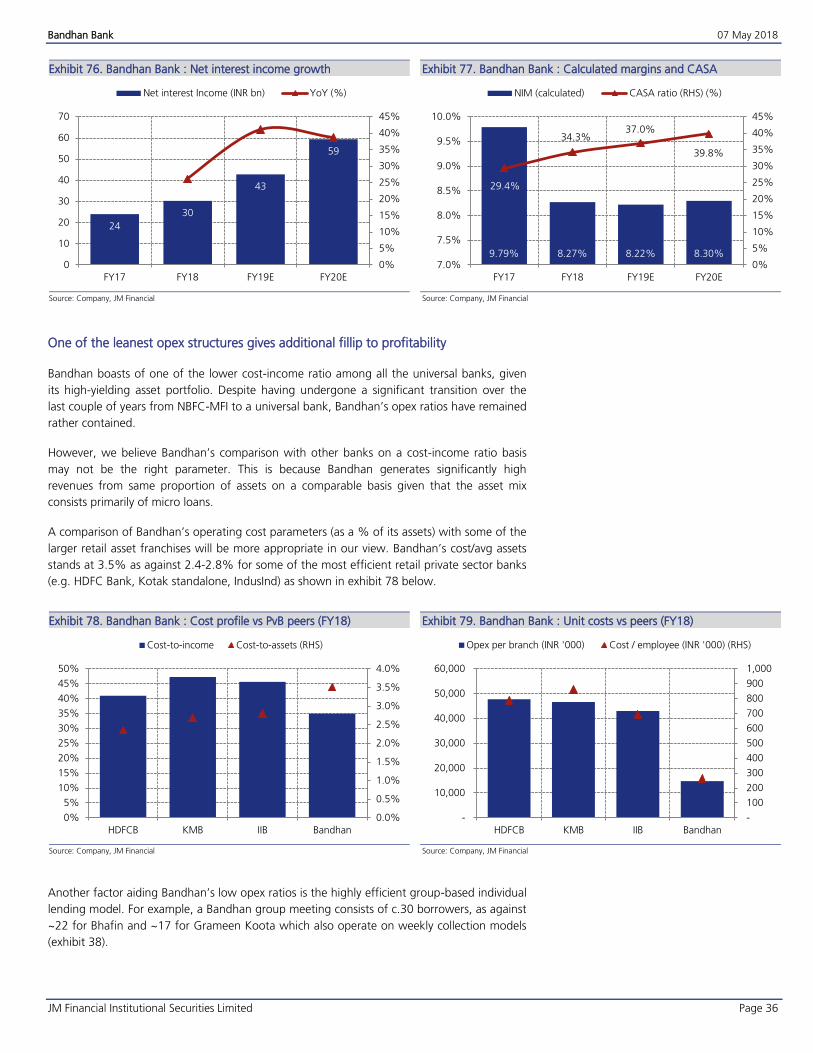
Bandhan Bank 07 May 2018
JM Financial Institutional Securities Limited Page 36
Bandhan Bank : Net interest income growth Exhibit 76.
Source: Company, JM Financial
Bandhan Bank : Calculated margins and CASA Exhibit 77.
Source: Company, JM Financial
One of the leanest opex structures gives additional fillip to profitability
Bandhan boasts of one of the lower cost-income ratio among all the universal banks, given
its high-yielding asset portfolio. Despite having undergone a significant transition over the
last couple of years from NBFC-MFI to a universal bank, Bandhan’s opex ratios have remained
rather contained.
However, we believe Bandhan’s comparison with other banks on a cost-income ratio basis
may not be the right parameter. This is because Bandhan generates significantly high
revenues from same proportion of assets on a comparable basis given that the asset mix
consists primarily of micro loans.
A comparison of Bandhan’s operating cost parameters (as a % of its assets) with some of the
larger retail asset franchises will be more appropriate in our view. Bandhan’s cost/avg assets
stands at 3.5% as against 2.4-2.8% for some of the most efficient retail private sector banks
(e.g. HDFC Bank, Kotak standalone, IndusInd) as shown in exhibit 78 below.
Bandhan Bank : Cost profile vs PvB peers (FY18) Exhibit 78.
Source: Company, JM Financial
Bandhan Bank : Unit costs vs peers (FY18) Exhibit 79.
Source: Company, JM Financial
Another factor aiding Bandhan’s low opex ratios is the highly efficient group-based individual
lending model. For example, a Bandhan group meeting consists of c.30 borrowers, as against
~22 for Bhafin and ~17 for Grameen Koota which also operate on weekly collection models
(exhibit 38).
24
30
43
59
0%
5%
10%
15%
20%
25%
30%
35%
40%
45%
0
10
20
30
40
50
60
70
FY17 FY18 FY19E FY20E
Net interest Income (INR bn) YoY (%)
9.79% 8.27% 8.22% 8.30%
29.4%
34.3%37.0%
39.8%
0%
5%
10%
15%
20%
25%
30%
35%
40%
45%
7.0%
7.5%
8.0%
8.5%
9.0%
9.5%
10.0%
FY17 FY18 FY19E FY20E
NIM (calculated) CASA ratio (RHS) (%)
0.0%
0.5%
1.0%
1.5%
2.0%
2.5%
3.0%
3.5%
4.0%
0%
5%
10%
15%
20%
25%
30%
35%
40%
45%
50%
HDFCB KMB IIB Bandhan
Cost-to-income Cost-to-assets (RHS)
-
100
200
300
400
500
600
700
800
900
1,000
-
10,000
20,000
30,000
40,000
50,000
60,000
HDFCB KMB IIB Bandhan
Opex per branch (INR '000) Cost / employee (INR '000) (RHS)
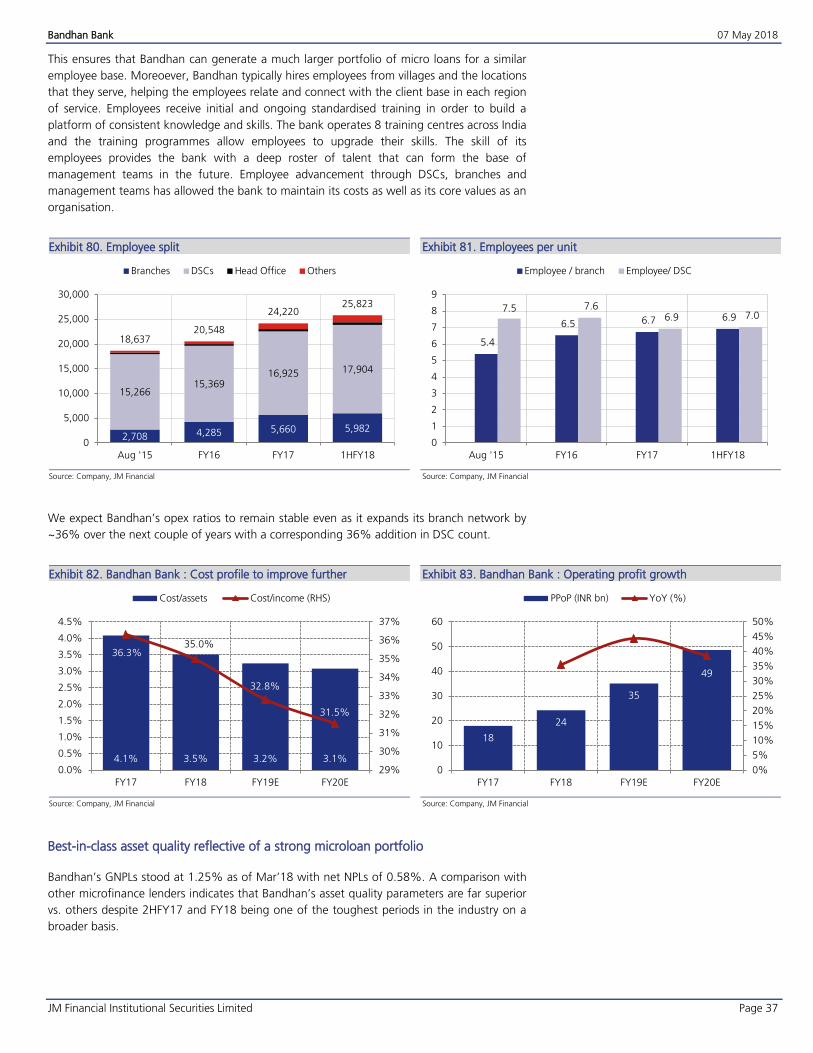
Bandhan Bank 07 May 2018
JM Financial Institutional Securities Limited Page 37
This ensures that Bandhan can generate a much larger portfolio of micro loans for a similar
employee base. Moreoever, Bandhan typically hires employees from villages and the locations
that they serve, helping the employees relate and connect with the client base in each region
of service. Employees receive initial and ongoing standardised training in order to build a
platform of consistent knowledge and skills. The bank operates 8 training centres across India
and the training programmes allow employees to upgrade their skills. The skill of its
employees provides the bank with a deep roster of talent that can form the base of
management teams in the future. Employee advancement through DSCs, branches and
management teams has allowed the bank to maintain its costs as well as its core values as an
organisation.
Employee split Exhibit 80.
Source: Company, JM Financial
Employees per unit Exhibit 81.
Source: Company, JM Financial
We expect Bandhan’s opex ratios to remain stable even as it expands its branch network by
~36% over the next couple of years with a corresponding 36% addition in DSC count.
Bandhan Bank : Cost profile to improve further Exhibit 82.
Source: Company, JM Financial
Bandhan Bank : Operating profit growth Exhibit 83.
Source: Company, JM Financial
Best-in-class asset quality reflective of a strong microloan portfolio
Bandhan’s GNPLs stood at 1.25% as of Mar’18 with net NPLs of 0.58%. A comparison with
other microfinance lenders indicates that Bandhan’s asset quality parameters are far superior
vs. others despite 2HFY17 and FY18 being one of the toughest periods in the industry on a
broader basis.
2,708 4,285 5,660 5,982
15,26615,369
16,925 17,904
18,63720,548
24,22025,823
0
5,000
10,000
15,000
20,000
25,000
30,000
Aug '15 FY16 FY17 1HFY18
Branches DSCs Head Office Others
5.4
6.5 6.7 6.9 7.5 7.6
6.9 7.0
0
1
2
3
4
5
6
7
8
9
Aug '15 FY16 FY17 1HFY18
Employee / branch Employee/ DSC
4.1% 3.5% 3.2% 3.1%
36.3%35.0%
32.8%
31.5%
29%
30%
31%
32%
33%
34%
35%
36%
37%
0.0%
0.5%
1.0%
1.5%
2.0%
2.5%
3.0%
3.5%
4.0%
4.5%
FY17 FY18 FY19E FY20E
Cost/assets Cost/income (RHS)
18
24
35
49
0%
5%
10%
15%
20%
25%
30%
35%
40%
45%
50%
0
10
20
30
40
50
60
FY17 FY18 FY19E FY20E
PPoP (INR bn) YoY (%)
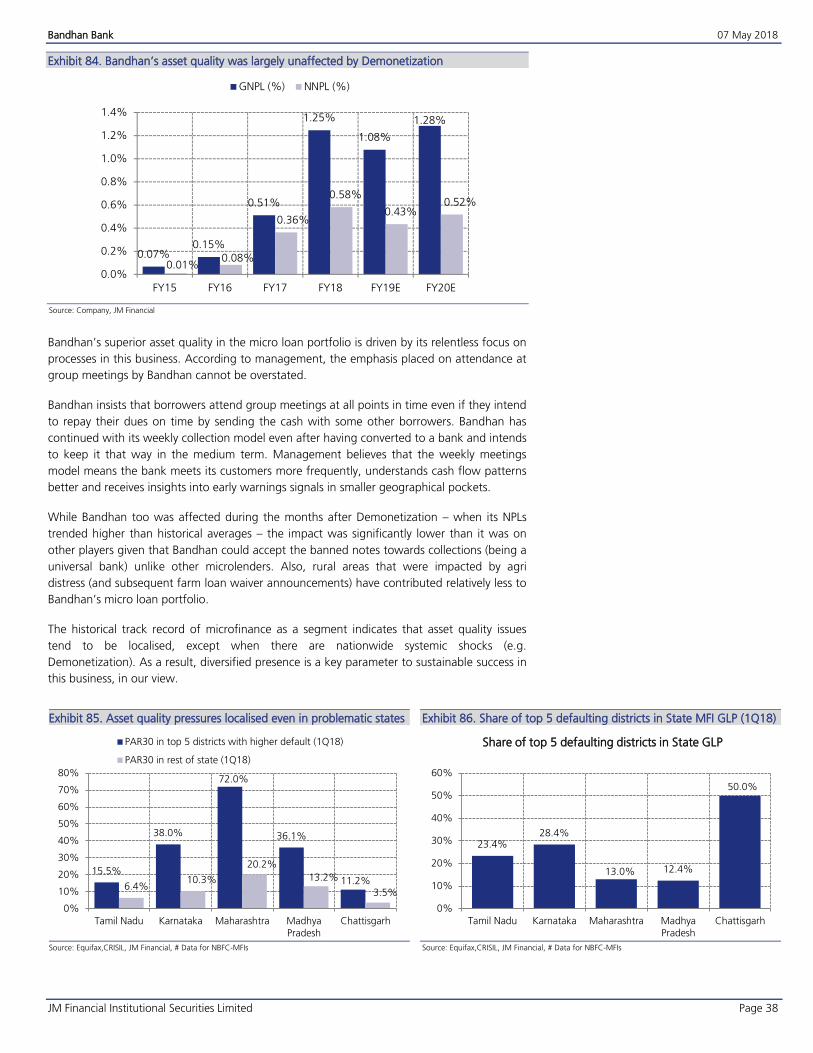
Bandhan Bank 07 May 2018
JM Financial Institutional Securities Limited Page 38
Bandhan’s asset quality was largely unaffected by Demonetization Exhibit 84.
Source: Company, JM Financial
Bandhan’s superior asset quality in the micro loan portfolio is driven by its relentless focus on
processes in this business. According to management, the emphasis placed on attendance at
group meetings by Bandhan cannot be overstated.
Bandhan insists that borrowers attend group meetings at all points in time even if they intend
to repay their dues on time by sending the cash with some other borrowers. Bandhan has
continued with its weekly collection model even after having converted to a bank and intends
to keep it that way in the medium term. Management believes that the weekly meetings
model means the bank meets its customers more frequently, understands cash flow patterns
better and receives insights into early warnings signals in smaller geographical pockets.
While Bandhan too was affected during the months after Demonetization – when its NPLs
trended higher than historical averages – the impact was significantly lower than it was on
other players given that Bandhan could accept the banned notes towards collections (being a
universal bank) unlike other microlenders. Also, rural areas that were impacted by agri
distress (and subsequent farm loan waiver announcements) have contributed relatively less to
Bandhan’s micro loan portfolio.
The historical track record of microfinance as a segment indicates that asset quality issues
tend to be localised, except when there are nationwide systemic shocks (e.g.
Demonetization). As a result, diversified presence is a key parameter to sustainable success in
this business, in our view.
Asset quality pressures localised even in problematic states Exhibit 85.
Source: Equifax,CRISIL, JM Financial, # Data for NBFC-MFIs
Share of top 5 defaulting districts in State MFI GLP (1Q18) Exhibit 86.
Source: Equifax,CRISIL, JM Financial, # Data for NBFC-MFIs
0.07%0.15%
0.51%
1.25%
1.08%
1.28%
0.01%0.08%
0.36%
0.58%
0.43%0.52%
0.0%
0.2%
0.4%
0.6%
0.8%
1.0%
1.2%
1.4%
FY15 FY16 FY17 FY18 FY19E FY20E
GNPL (%) NNPL (%)
15.5%
38.0%
72.0%
36.1%
11.2%6.4%
10.3%
20.2%
13.2%
3.5%
0%
10%
20%
30%
40%
50%
60%
70%
80%
Tamil Nadu Karnataka Maharashtra MadhyaPradesh
Chattisgarh
PAR30 in top 5 districts with higher default (1Q18)
PAR30 in rest of state (1Q18)
23.4%28.4%
13.0% 12.4%
50.0%
0%
10%
20%
30%
40%
50%
60%
Tamil Nadu Karnataka Maharashtra MadhyaPradesh
Chattisgarh
Share of top 5 defaulting districts in State GLP
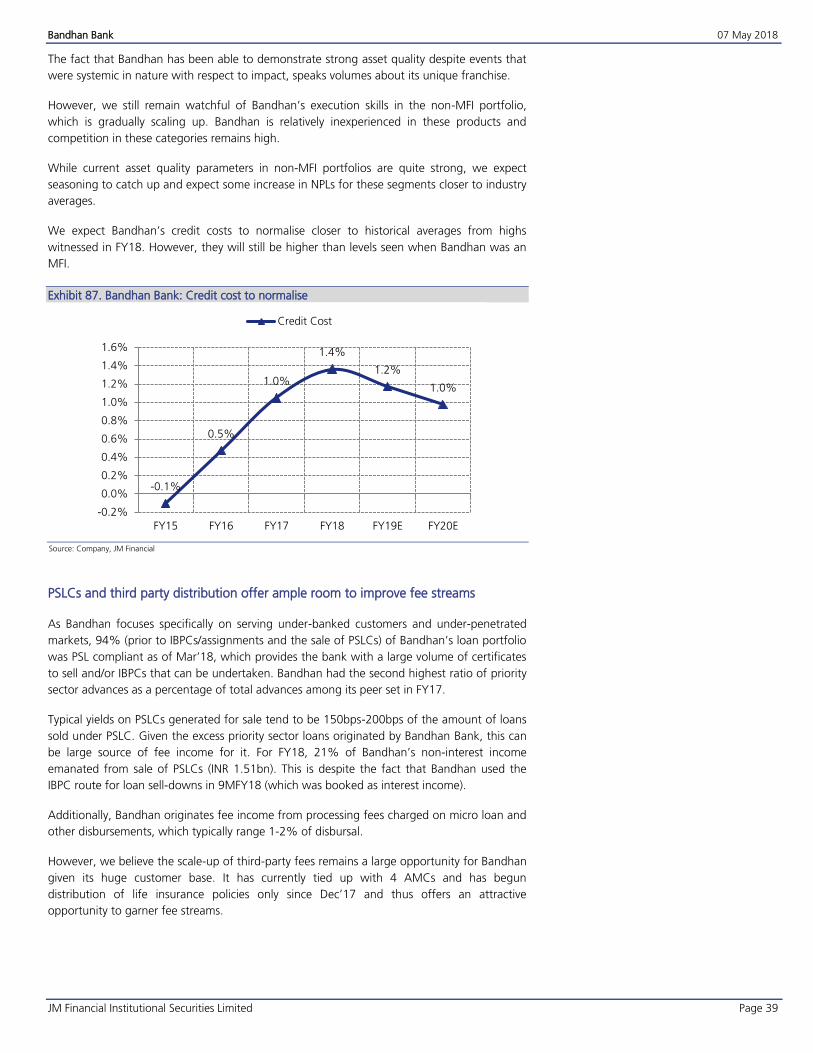
Bandhan Bank 07 May 2018
JM Financial Institutional Securities Limited Page 39
The fact that Bandhan has been able to demonstrate strong asset quality despite events that
were systemic in nature with respect to impact, speaks volumes about its unique franchise.
However, we still remain watchful of Bandhan’s execution skills in the non-MFI portfolio,
which is gradually scaling up. Bandhan is relatively inexperienced in these products and
competition in these categories remains high.
While current asset quality parameters in non-MFI portfolios are quite strong, we expect
seasoning to catch up and expect some increase in NPLs for these segments closer to industry
averages.
We expect Bandhan’s credit costs to normalise closer to historical averages from highs
witnessed in FY18. However, they will still be higher than levels seen when Bandhan was an
MFI.
Bandhan Bank: Credit cost to normalise Exhibit 87.
Source: Company, JM Financial
PSLCs and third party distribution offer ample room to improve fee streams
As Bandhan focuses specifically on serving under-banked customers and under-penetrated
markets, 94% (prior to IBPCs/assignments and the sale of PSLCs) of Bandhan’s loan portfolio
was PSL compliant as of Mar’18, which provides the bank with a large volume of certificates
to sell and/or IBPCs that can be undertaken. Bandhan had the second highest ratio of priority
sector advances as a percentage of total advances among its peer set in FY17.
Typical yields on PSLCs generated for sale tend to be 150bps-200bps of the amount of loans
sold under PSLC. Given the excess priority sector loans originated by Bandhan Bank, this can
be large source of fee income for it. For FY18, 21% of Bandhan’s non-interest income
emanated from sale of PSLCs (INR 1.51bn). This is despite the fact that Bandhan used the
IBPC route for loan sell-downs in 9MFY18 (which was booked as interest income).
Additionally, Bandhan originates fee income from processing fees charged on micro loan and
other disbursements, which typically range 1-2% of disbursal.
However, we believe the scale-up of third-party fees remains a large opportunity for Bandhan
given its huge customer base. It has currently tied up with 4 AMCs and has begun
distribution of life insurance policies only since Dec’17 and thus offers an attractive
opportunity to garner fee streams.
-0.1%
0.5%
1.0%
1.4%
1.2%
1.0%
-0.2%
0.0%
0.2%
0.4%
0.6%
0.8%
1.0%
1.2%
1.4%
1.6%
FY15 FY16 FY17 FY18 FY19E FY20E
Credit Cost
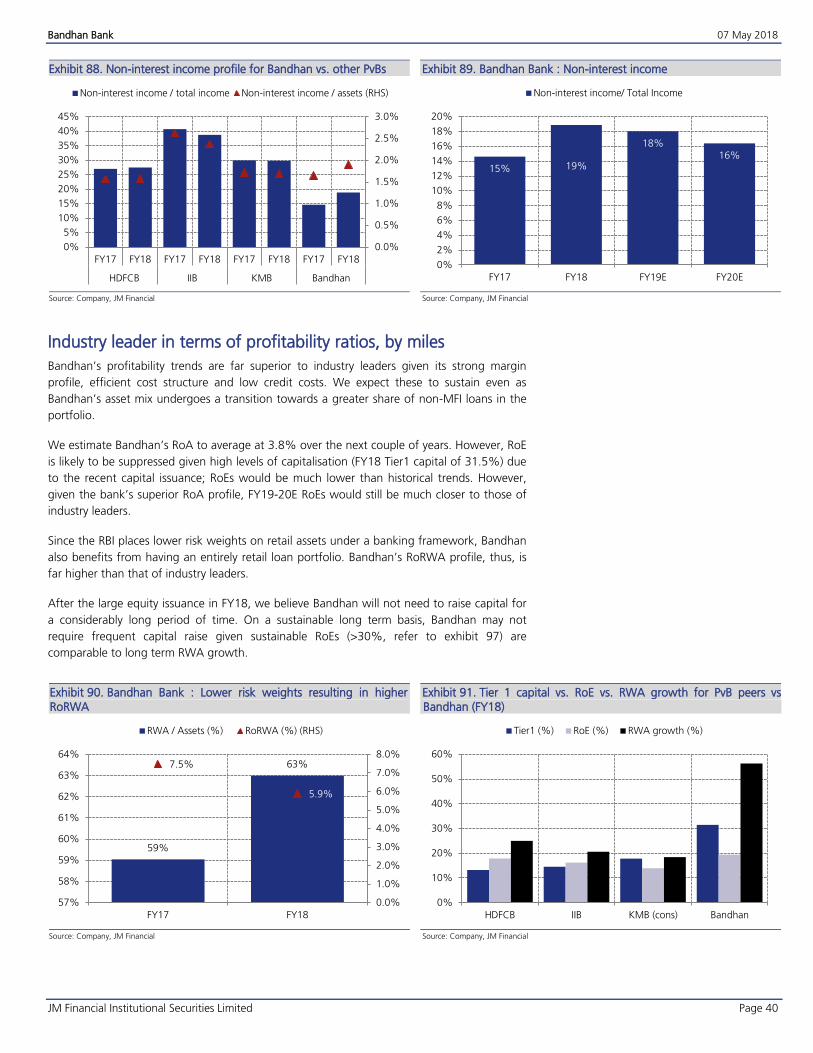
Bandhan Bank 07 May 2018
JM Financial Institutional Securities Limited Page 40
Non-interest income profile for Bandhan vs. other PvBs Exhibit 88.
Source: Company, JM Financial
Bandhan Bank : Non-interest income Exhibit 89.
Source: Company, JM Financial
Industry leader in terms of profitability ratios, by miles
Bandhan’s profitability trends are far superior to industry leaders given its strong margin
profile, efficient cost structure and low credit costs. We expect these to sustain even as
Bandhan’s asset mix undergoes a transition towards a greater share of non-MFI loans in the
portfolio.
We estimate Bandhan’s RoA to average at 3.8% over the next couple of years. However, RoE
is likely to be suppressed given high levels of capitalisation (FY18 Tier1 capital of 31.5%) due
to the recent capital issuance; RoEs would be much lower than historical trends. However,
given the bank’s superior RoA profile, FY19-20E RoEs would still be much closer to those of
industry leaders.
Since the RBI places lower risk weights on retail assets under a banking framework, Bandhan
also benefits from having an entirely retail loan portfolio. Bandhan’s RoRWA profile, thus, is
far higher than that of industry leaders.
After the large equity issuance in FY18, we believe Bandhan will not need to raise capital for
a considerably long period of time. On a sustainable long term basis, Bandhan may not
require frequent capital raise given sustainable RoEs (>30%, refer to exhibit 97) are
comparable to long term RWA growth.
Bandhan Bank : Lower risk weights resulting in higher Exhibit 90.RoRWA
Source: Company, JM Financial
Tier 1 capital vs. RoE vs. RWA growth for PvB peers vs Exhibit 91.Bandhan (FY18)
Source: Company, JM Financial
0.0%
0.5%
1.0%
1.5%
2.0%
2.5%
3.0%
0%
5%
10%
15%
20%
25%
30%
35%
40%
45%
FY17 FY18 FY17 FY18 FY17 FY18 FY17 FY18
HDFCB IIB KMB Bandhan
Non-interest income / total income Non-interest income / assets (RHS)
15% 19%
18%16%
0%
2%
4%
6%
8%
10%
12%
14%
16%
18%
20%
FY17 FY18 FY19E FY20E
Non-interest income/ Total Income
59%
63%7.5%
5.9%
0.0%
1.0%
2.0%
3.0%
4.0%
5.0%
6.0%
7.0%
8.0%
57%
58%
59%
60%
61%
62%
63%
64%
FY17 FY18
RWA / Assets (%) RoRWA (%) (RHS)
0%
10%
20%
30%
40%
50%
60%
HDFCB IIB KMB (cons) Bandhan
Tier1 (%) RoE (%) RWA growth (%)
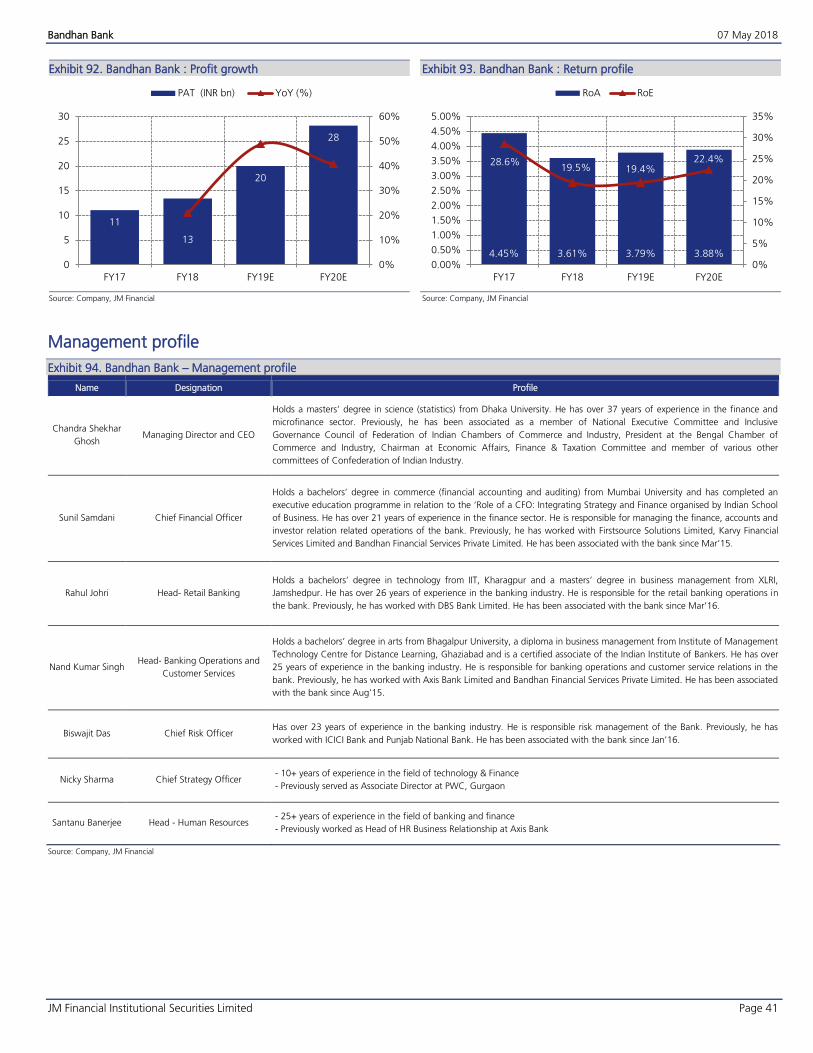
Bandhan Bank 07 May 2018
JM Financial Institutional Securities Limited Page 41
Bandhan Bank : Profit growth Exhibit 92.
Source: Company, JM Financial
Bandhan Bank : Return profile Exhibit 93.
Source: Company, JM Financial
Management profile
Bandhan Bank – Management profile Exhibit 94.
Name Designation Profile
Chandra Shekhar
Ghosh Managing Director and CEO
Holds a masters’ degree in science (statistics) from Dhaka University. He has over 37 years of experience in the finance and
microfinance sector. Previously, he has been associated as a member of National Executive Committee and Inclusive
Governance Council of Federation of Indian Chambers of Commerce and Industry, President at the Bengal Chamber of
Commerce and Industry, Chairman at Economic Affairs, Finance & Taxation Committee and member of various other
committees of Confederation of Indian Industry.
Sunil Samdani Chief Financial Officer
Holds a bachelors’ degree in commerce (financial accounting and auditing) from Mumbai University and has completed an
executive education programme in relation to the ‘Role of a CFO: Integrating Strategy and Finance organised by Indian School
of Business. He has over 21 years of experience in the finance sector. He is responsible for managing the finance, accounts and
investor relation related operations of the bank. Previously, he has worked with Firstsource Solutions Limited, Karvy Financial
Services Limited and Bandhan Financial Services Private Limited. He has been associated with the bank since Mar’15.
Rahul Johri Head- Retail Banking
Holds a bachelors’ degree in technology from IIT, Kharagpur and a masters’ degree in business management from XLRI,
Jamshedpur. He has over 26 years of experience in the banking industry. He is responsible for the retail banking operations in
the bank. Previously, he has worked with DBS Bank Limited. He has been associated with the bank since Mar’16.
Nand Kumar Singh Head- Banking Operations and
Customer Services
Holds a bachelors’ degree in arts from Bhagalpur University, a diploma in business management from Institute of Management
Technology Centre for Distance Learning, Ghaziabad and is a certified associate of the Indian Institute of Bankers. He has over
25 years of experience in the banking industry. He is responsible for banking operations and customer service relations in the
bank. Previously, he has worked with Axis Bank Limited and Bandhan Financial Services Private Limited. He has been associated
with the bank since Aug’15.
Biswajit Das Chief Risk Officer Has over 23 years of experience in the banking industry. He is responsible risk management of the Bank. Previously, he has
worked with ICICI Bank and Punjab National Bank. He has been associated with the bank since Jan’16.
Nicky Sharma Chief Strategy Officer - 10+ years of experience in the field of technology & Finance
- Previously served as Associate Director at PWC, Gurgaon
Santanu Banerjee Head - Human Resources - 25+ years of experience in the field of banking and finance
- Previously worked as Head of HR Business Relationship at Axis Bank
Source: Company, JM Financial
11
13
20
28
0%
10%
20%
30%
40%
50%
60%
0
5
10
15
20
25
30
FY17 FY18 FY19E FY20E
PAT (INR bn) YoY (%)
4.45% 3.61% 3.79% 3.88%
28.6%19.5% 19.4%
22.4%
0%
5%
10%
15%
20%
25%
30%
35%
0.00%
0.50%
1.00%
1.50%
2.00%
2.50%
3.00%
3.50%
4.00%
4.50%
5.00%
FY17 FY18 FY19E FY20E
RoA RoE
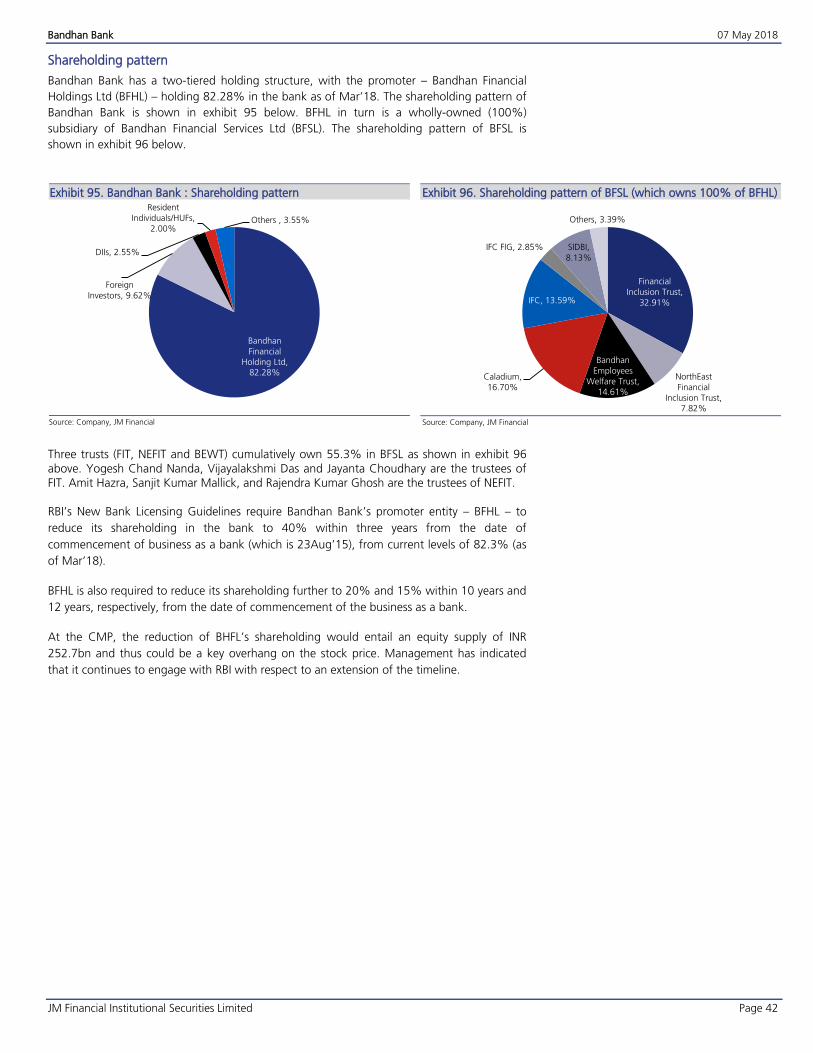
Bandhan Bank 07 May 2018
JM Financial Institutional Securities Limited Page 42
Shareholding pattern
Bandhan Bank has a two-tiered holding structure, with the promoter – Bandhan Financial
Holdings Ltd (BFHL) – holding 82.28% in the bank as of Mar’18. The shareholding pattern of
Bandhan Bank is shown in exhibit 95 below. BFHL in turn is a wholly-owned (100%)
subsidiary of Bandhan Financial Services Ltd (BFSL). The shareholding pattern of BFSL is
shown in exhibit 96 below.
Bandhan Bank : Shareholding pattern Exhibit 95.
Source: Company, JM Financial
Shareholding pattern of BFSL (which owns 100% of BFHL) Exhibit 96.
Source: Company, JM Financial
Three trusts (FIT, NEFIT and BEWT) cumulatively own 55.3% in BFSL as shown in exhibit 96 above. Yogesh Chand Nanda, Vijayalakshmi Das and Jayanta Choudhary are the trustees of FIT. Amit Hazra, Sanjit Kumar Mallick, and Rajendra Kumar Ghosh are the trustees of NEFIT. RBI’s New Bank Licensing Guidelines require Bandhan Bank’s promoter entity – BFHL – to
reduce its shareholding in the bank to 40% within three years from the date of
commencement of business as a bank (which is 23Aug’15), from current levels of 82.3% (as
of Mar’18).
BFHL is also required to reduce its shareholding further to 20% and 15% within 10 years and
12 years, respectively, from the date of commencement of the business as a bank.
At the CMP, the reduction of BHFL’s shareholding would entail an equity supply of INR
252.7bn and thus could be a key overhang on the stock price. Management has indicated
that it continues to engage with RBI with respect to an extension of the timeline.
Bandhan
Financial
Holding Ltd, 82.28%
Foreign
Investors, 9.62%
DIIs, 2.55%
Resident
Individuals/HUFs,
2.00%Others , 3.55%
Financial
Inclusion Trust,
32.91%
NorthEast
Financial
Inclusion Trust, 7.82%
Bandhan
Employees
Welfare Trust, 14.61%
Caladium,
16.70%
IFC, 13.59%
IFC FIG, 2.85% SIDBI,
8.13%
Others, 3.39%
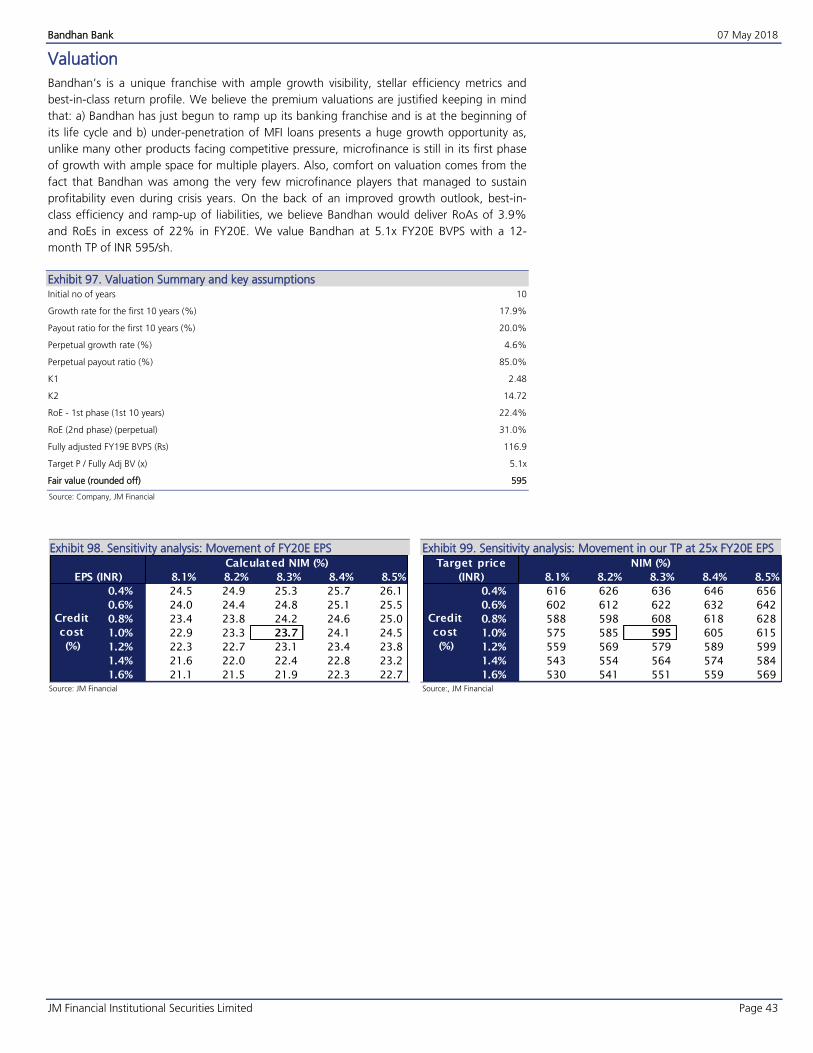
Bandhan Bank 07 May 2018
JM Financial Institutional Securities Limited Page 43
Valuation
Bandhan’s is a unique franchise with ample growth visibility, stellar efficiency metrics and
best-in-class return profile. We believe the premium valuations are justified keeping in mind
that: a) Bandhan has just begun to ramp up its banking franchise and is at the beginning of
its life cycle and b) under-penetration of MFI loans presents a huge growth opportunity as,
unlike many other products facing competitive pressure, microfinance is still in its first phase
of growth with ample space for multiple players. Also, comfort on valuation comes from the
fact that Bandhan was among the very few microfinance players that managed to sustain
profitability even during crisis years. On the back of an improved growth outlook, best-in-
class efficiency and ramp-up of liabilities, we believe Bandhan would deliver RoAs of 3.9%
and RoEs in excess of 22% in FY20E. We value Bandhan at 5.1x FY20E BVPS with a 12-
month TP of INR 595/sh.
Valuation Summary and key assumptions Exhibit 97.Initial no of years 10
Growth rate for the first 10 years (%) 17.9%
Payout ratio for the first 10 years (%) 20.0%
Perpetual growth rate (%) 4.6%
Perpetual payout ratio (%) 85.0%
K1 2.48
K2 14.72
RoE - 1st phase (1st 10 years) 22.4%
RoE (2nd phase) (perpetual) 31.0%
Fully adjusted FY19E BVPS (Rs) 116.9
Target P / Fully Adj BV (x) 5.1x
Fair value (rounded off) 595
Source: Company, JM Financial
Sensitivity analysis: Movement of FY20E EPS Exhibit 98.
Source: JM Financial
Sensitivity analysis: Movement in our TP at 25x FY20E EPS Exhibit 99.
Source:, JM Financial
8.1% 8.2% 8.3% 8.4% 8.5%
0.4% 24.5 24.9 25.3 25.7 26.1
0.6% 24.0 24.4 24.8 25.1 25.5
0.8% 23.4 23.8 24.2 24.6 25.0
1.0% 22.9 23.3 23.7 24.1 24.5
1.2% 22.3 22.7 23.1 23.4 23.8
1.4% 21.6 22.0 22.4 22.8 23.2
1.6% 21.1 21.5 21.9 22.3 22.7
Calculated NIM (%)
Credit
cost
(%)
EPS (INR) 8.1% 8.2% 8.3% 8.4% 8.5%
0.4% 616 626 636 646 656
0.6% 602 612 622 632 642
0.8% 588 598 608 618 628
1.0% 575 585 595 605 615
1.2% 559 569 579 589 599
1.4% 543 554 564 574 584
1.6% 530 541 551 559 569
Credit
cost
(%)
Target price
(INR)
NIM (%)
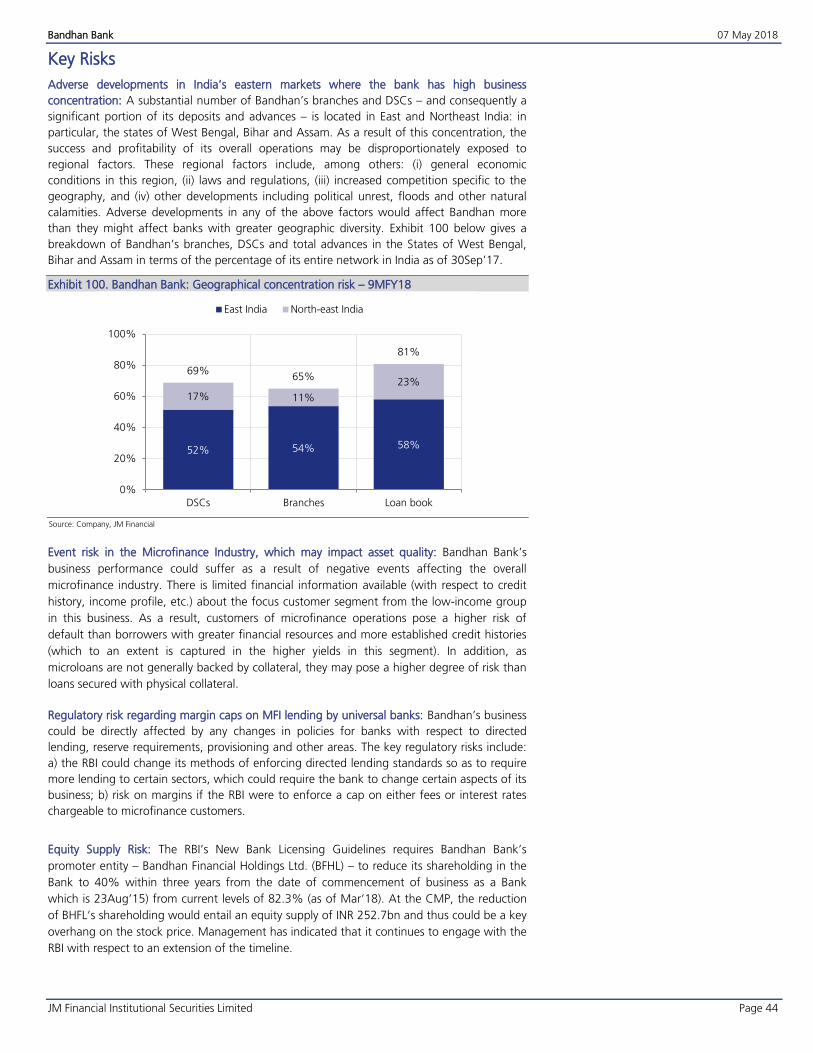
Bandhan Bank 07 May 2018
JM Financial Institutional Securities Limited Page 44
Key Risks
Adverse developments in India’s eastern markets where the bank has high business
concentration: A substantial number of Bandhan’s branches and DSCs – and consequently a
significant portion of its deposits and advances – is located in East and Northeast India: in
particular, the states of West Bengal, Bihar and Assam. As a result of this concentration, the
success and profitability of its overall operations may be disproportionately exposed to
regional factors. These regional factors include, among others: (i) general economic
conditions in this region, (ii) laws and regulations, (iii) increased competition specific to the
geography, and (iv) other developments including political unrest, floods and other natural
calamities. Adverse developments in any of the above factors would affect Bandhan more
than they might affect banks with greater geographic diversity. Exhibit 100 below gives a
breakdown of Bandhan’s branches, DSCs and total advances in the States of West Bengal,
Bihar and Assam in terms of the percentage of its entire network in India as of 30Sep’17.
Bandhan Bank: Geographical concentration risk – 9MFY18 Exhibit 100.
Source: Company, JM Financial
Event risk in the Microfinance Industry, which may impact asset quality: Bandhan Bank’s
business performance could suffer as a result of negative events affecting the overall
microfinance industry. There is limited financial information available (with respect to credit
history, income profile, etc.) about the focus customer segment from the low-income group
in this business. As a result, customers of microfinance operations pose a higher risk of
default than borrowers with greater financial resources and more established credit histories
(which to an extent is captured in the higher yields in this segment). In addition, as
microloans are not generally backed by collateral, they may pose a higher degree of risk than
loans secured with physical collateral.
Regulatory risk regarding margin caps on MFI lending by universal banks: Bandhan’s business
could be directly affected by any changes in policies for banks with respect to directed
lending, reserve requirements, provisioning and other areas. The key regulatory risks include:
a) the RBI could change its methods of enforcing directed lending standards so as to require
more lending to certain sectors, which could require the bank to change certain aspects of its
business; b) risk on margins if the RBI were to enforce a cap on either fees or interest rates
chargeable to microfinance customers.
Equity Supply Risk: The RBI’s New Bank Licensing Guidelines requires Bandhan Bank’s
promoter entity – Bandhan Financial Holdings Ltd. (BFHL) – to reduce its shareholding in the
Bank to 40% within three years from the date of commencement of business as a Bank
which is 23Aug’15) from current levels of 82.3% (as of Mar’18). At the CMP, the reduction
of BHFL’s shareholding would entail an equity supply of INR 252.7bn and thus could be a key
overhang on the stock price. Management has indicated that it continues to engage with the
RBI with respect to an extension of the timeline.
52% 54% 58%
17% 11%
23%69%
65%
81%
0%
20%
40%
60%
80%
100%
DSCs Branches Loan book
East India North-east India
Bandhan Bank 07 May 2018
JM Financial Institutional Securities Limited Page 45
Key man risk: Mr. C S Ghosh is the MD & CEO of the bank and has over 37 years of
experience in the finance and microfinance sector. As such, without Mr. C S Ghosh at the
helm, execution risk for Bandhan will be higher and may hamper implementation of growth
plans. If one or more of key personnel at Bandhan are unwilling or unable to continue in their
present positions, Bandhan may not be able to replace them with persons of comparable
skills and expertise and this key person risk is one of the important ones for Bandhan.
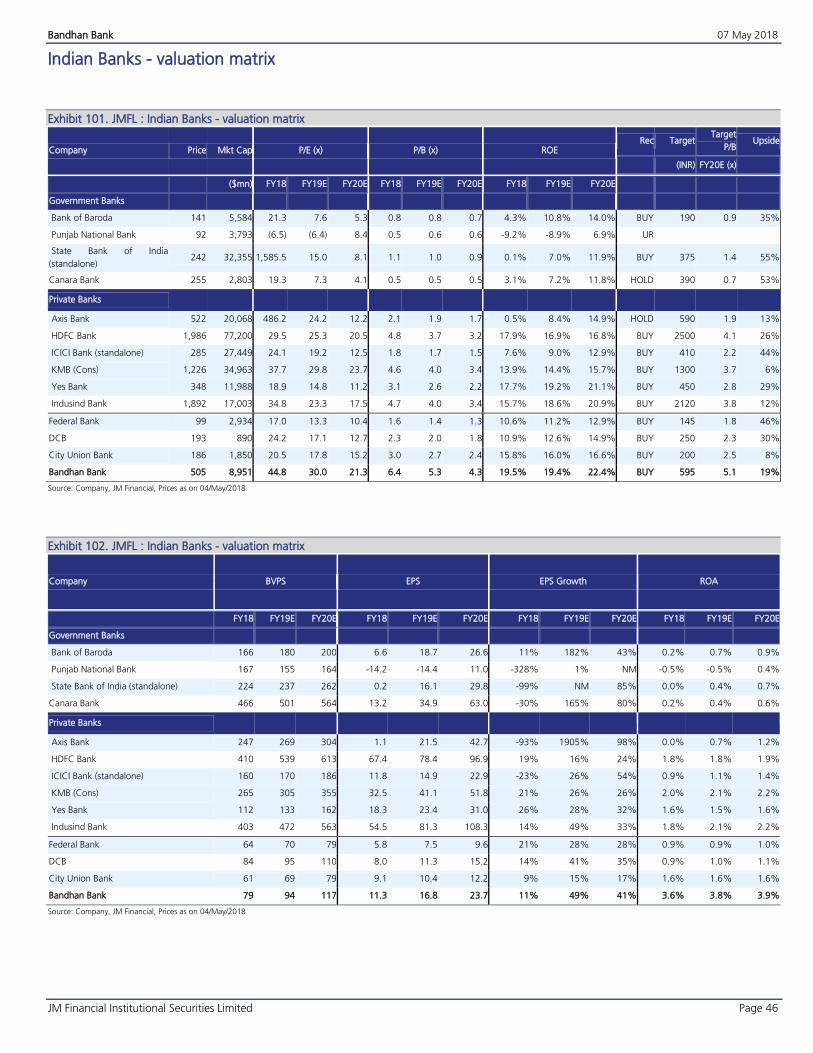
Bandhan Bank 07 May 2018
JM Financial Institutional Securities Limited Page 46
Indian Banks - valuation matrix
JMFL : Indian Banks - valuation matrix Exhibit 101.
Company Price Mkt Cap P/E (x) P/B (x) ROE Rec Target
Target
P/B Upside
(INR) FY20E (x)
($mn) FY18 FY19E FY20E FY18 FY19E FY20E FY18 FY19E FY20E
Government Banks
Bank of Baroda 141 5,584 21.3 7.6 5.3 0.8 0.8 0.7 4.3% 10.8% 14.0% BUY 190 0.9 35%
Punjab National Bank 92 3,793 (6.5) (6.4) 8.4 0.5 0.6 0.6 -9.2% -8.9% 6.9% UR
State Bank of India
(standalone) 242 32,355 1,585.5 15.0 8.1 1.1 1.0 0.9 0.1% 7.0% 11.9% BUY 375 1.4 55%
Canara Bank 255 2,803 19.3 7.3 4.1 0.5 0.5 0.5 3.1% 7.2% 11.8% HOLD 390 0.7 53%
Private Banks
Axis Bank 522 20,068 486.2 24.2 12.2 2.1 1.9 1.7 0.5% 8.4% 14.9% HOLD 590 1.9 13%
HDFC Bank 1,986 77,200 29.5 25.3 20.5 4.8 3.7 3.2 17.9% 16.9% 16.8% BUY 2500 4.1 26%
ICICI Bank (standalone) 285 27,449 24.1 19.2 12.5 1.8 1.7 1.5 7.6% 9.0% 12.9% BUY 410 2.2 44%
KMB (Cons) 1,226 34,963 37.7 29.8 23.7 4.6 4.0 3.4 13.9% 14.4% 15.7% BUY 1300 3.7 6%
Yes Bank 348 11,988 18.9 14.8 11.2 3.1 2.6 2.2 17.7% 19.2% 21.1% BUY 450 2.8 29%
Indusind Bank 1,892 17,003 34.8 23.3 17.5 4.7 4.0 3.4 15.7% 18.6% 20.9% BUY 2120 3.8 12%
Federal Bank 99 2,934 17.0 13.3 10.4 1.6 1.4 1.3 10.6% 11.2% 12.9% BUY 145 1.8 46%
DCB 193 890 24.2 17.1 12.7 2.3 2.0 1.8 10.9% 12.6% 14.9% BUY 250 2.3 30%
City Union Bank 186 1,850 20.5 17.8 15.2 3.0 2.7 2.4 15.8% 16.0% 16.6% BUY 200 2.5 8%
Bandhan Bank 505 8,951 44.8 30.0 21.3 6.4 5.3 4.3 19.5% 19.4% 22.4% BUY 595 5.1 19%
Source: Company, JM Financial, Prices as on 04/May/2018
JMFL : Indian Banks - valuation matrix Exhibit 102.
Company BVPS EPS EPS Growth ROA
FY18 FY19E FY20E FY18 FY19E FY20E FY18 FY19E FY20E FY18 FY19E FY20E
Government Banks
Bank of Baroda 166 180 200 6.6 18.7 26.6 11% 182% 43% 0.2% 0.7% 0.9%
Punjab National Bank 167 155 164 -14.2 -14.4 11.0 -328% 1% NM -0.5% -0.5% 0.4%
State Bank of India (standalone) 224 237 262 0.2 16.1 29.8 -99% NM 85% 0.0% 0.4% 0.7%
Canara Bank 466 501 564 13.2 34.9 63.0 -30% 165% 80% 0.2% 0.4% 0.6%
Private Banks
Axis Bank 247 269 304 1.1 21.5 42.7 -93% 1905% 98% 0.0% 0.7% 1.2%
HDFC Bank 410 539 613 67.4 78.4 96.9 19% 16% 24% 1.8% 1.8% 1.9%
ICICI Bank (standalone) 160 170 186 11.8 14.9 22.9 -23% 26% 54% 0.9% 1.1% 1.4%
KMB (Cons) 265 305 355 32.5 41.1 51.8 21% 26% 26% 2.0% 2.1% 2.2%
Yes Bank 112 133 162 18.3 23.4 31.0 26% 28% 32% 1.6% 1.5% 1.6%
Indusind Bank 403 472 563 54.5 81.3 108.3 14% 49% 33% 1.8% 2.1% 2.2%
Federal Bank 64 70 79 5.8 7.5 9.6 21% 28% 28% 0.9% 0.9% 1.0%
DCB 84 95 110 8.0 11.3 15.2 14% 41% 35% 0.9% 1.0% 1.1%
City Union Bank 61 69 79 9.1 10.4 12.2 9% 15% 17% 1.6% 1.6% 1.6%
Bandhan Bank 79 94 117 11.3 16.8 23.7 11% 49% 41% 3.6% 3.8% 3.9%
Source: Company, JM Financial, Prices as on 04/May/2018
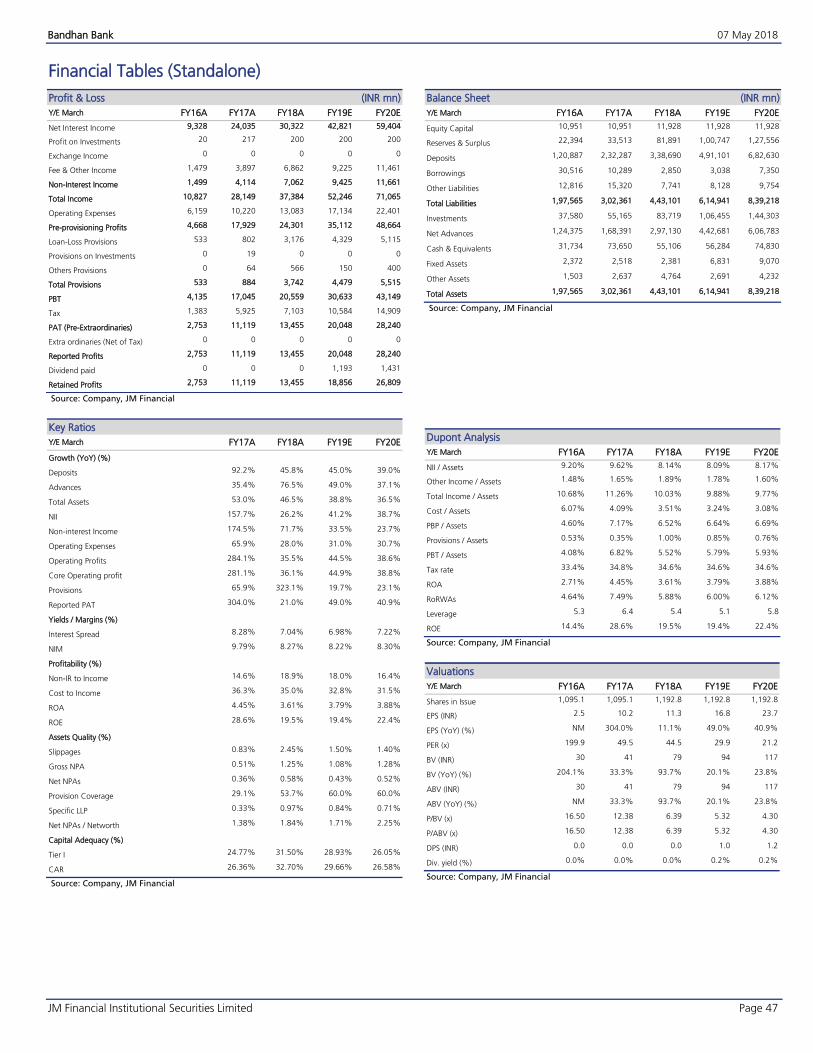
Bandhan Bank 07 May 2018
JM Financial Institutional Securities Limited Page 47
Financial Tables (Standalone)
Profit & Loss (INR mn)
Y/E March FY16A FY17A FY18A FY19E FY20E
Net Interest Income 9,328 24,035 30,322 42,821 59,404
Profit on Investments 20 217 200 200 200
Exchange Income 0 0 0 0 0
Fee & Other Income 1,479 3,897 6,862 9,225 11,461
Non-Interest Income 1,499 4,114 7,062 9,425 11,661
Total Income 10,827 28,149 37,384 52,246 71,065
Operating Expenses 6,159 10,220 13,083 17,134 22,401
Pre-provisioning Profits 4,668 17,929 24,301 35,112 48,664
Loan-Loss Provisions 533 802 3,176 4,329 5,115
Provisions on Investments 0 19 0 0 0
Others Provisions 0 64 566 150 400
Total Provisions 533 884 3,742 4,479 5,515
PBT 4,135 17,045 20,559 30,633 43,149
Tax 1,383 5,925 7,103 10,584 14,909
PAT (Pre-Extraordinaries) 2,753 11,119 13,455 20,048 28,240
Extra ordinaries (Net of Tax) 0 0 0 0 0
Reported Profits 2,753 11,119 13,455 20,048 28,240
Dividend paid 0 0 0 1,193 1,431
Retained Profits 2,753 11,119 13,455 18,856 26,809
Source: Company, JM Financial
Key Ratios
Y/E March FY17A FY18A FY19E FY20E
Growth (YoY) (%)
Deposits 92.2% 45.8% 45.0% 39.0%
Advances 35.4% 76.5% 49.0% 37.1%
Total Assets 53.0% 46.5% 38.8% 36.5%
NII 157.7% 26.2% 41.2% 38.7%
Non-interest Income 174.5% 71.7% 33.5% 23.7%
Operating Expenses 65.9% 28.0% 31.0% 30.7%
Operating Profits 284.1% 35.5% 44.5% 38.6%
Core Operating profit 281.1% 36.1% 44.9% 38.8%
Provisions 65.9% 323.1% 19.7% 23.1%
Reported PAT 304.0% 21.0% 49.0% 40.9%
Yields / Margins (%)
Interest Spread 8.28% 7.04% 6.98% 7.22%
NIM 9.79% 8.27% 8.22% 8.30%
Profitability (%)
Non-IR to Income 14.6% 18.9% 18.0% 16.4%
Cost to Income 36.3% 35.0% 32.8% 31.5%
ROA 4.45% 3.61% 3.79% 3.88%
ROE 28.6% 19.5% 19.4% 22.4%
Assets Quality (%)
Slippages 0.83% 2.45% 1.50% 1.40%
Gross NPA 0.51% 1.25% 1.08% 1.28%
Net NPAs 0.36% 0.58% 0.43% 0.52%
Provision Coverage 29.1% 53.7% 60.0% 60.0%
Specific LLP 0.33% 0.97% 0.84% 0.71%
Net NPAs / Networth 1.38% 1.84% 1.71% 2.25%
Capital Adequacy (%)
Tier I 24.77% 31.50% 28.93% 26.05%
CAR 26.36% 32.70% 29.66% 26.58%
Source: Company, JM Financial
Balance Sheet (INR mn)
Y/E March FY16A FY17A FY18A FY19E FY20E
Equity Capital 10,951 10,951 11,928 11,928 11,928
Reserves & Surplus 22,394 33,513 81,891 1,00,747 1,27,556
Deposits 1,20,887 2,32,287 3,38,690 4,91,101 6,82,630
Borrowings 30,516 10,289 2,850 3,038 7,350
Other Liabilities 12,816 15,320 7,741 8,128 9,754
Total Liabilities 1,97,565 3,02,361 4,43,101 6,14,941 8,39,218
Investments 37,580 55,165 83,719 1,06,455 1,44,303
Net Advances 1,24,375 1,68,391 2,97,130 4,42,681 6,06,783
Cash & Equivalents 31,734 73,650 55,106 56,284 74,830
Fixed Assets 2,372 2,518 2,381 6,831 9,070
Other Assets 1,503 2,637 4,764 2,691 4,232
Total Assets 1,97,565 3,02,361 4,43,101 6,14,941 8,39,218
Source: Company, JM Financial
Dupont Analysis
Y/E March FY16A FY17A FY18A FY19E FY20E
NII / Assets 9.20% 9.62% 8.14% 8.09% 8.17%
Other Income / Assets 1.48% 1.65% 1.89% 1.78% 1.60%
Total Income / Assets 10.68% 11.26% 10.03% 9.88% 9.77%
Cost / Assets 6.07% 4.09% 3.51% 3.24% 3.08%
PBP / Assets 4.60% 7.17% 6.52% 6.64% 6.69%
Provisions / Assets 0.53% 0.35% 1.00% 0.85% 0.76%
PBT / Assets 4.08% 6.82% 5.52% 5.79% 5.93%
Tax rate 33.4% 34.8% 34.6% 34.6% 34.6%
ROA 2.71% 4.45% 3.61% 3.79% 3.88%
RoRWAs 4.64% 7.49% 5.88% 6.00% 6.12%
Leverage 5.3 6.4 5.4 5.1 5.8
ROE 14.4% 28.6% 19.5% 19.4% 22.4%
Source: Company, JM Financial
Valuations
Y/E March FY16A FY17A FY18A FY19E FY20E
Shares in Issue 1,095.1 1,095.1 1,192.8 1,192.8 1,192.8
EPS (INR) 2.5 10.2 11.3 16.8 23.7
EPS (YoY) (%) NM 304.0% 11.1% 49.0% 40.9%
PER (x) 199.9 49.5 44.5 29.9 21.2
BV (INR) 30 41 79 94 117
BV (YoY) (%) 204.1% 33.3% 93.7% 20.1% 23.8%
ABV (INR) 30 41 79 94 117
ABV (YoY) (%) NM 33.3% 93.7% 20.1% 23.8%
P/BV (x) 16.50 12.38 6.39 5.32 4.30
P/ABV (x) 16.50 12.38 6.39 5.32 4.30
DPS (INR) 0.0 0.0 0.0 1.0 1.2
Div. yield (%) 0.0% 0.0% 0.0% 0.2% 0.2%
Source: Company, JM Financial
Bandhan Bank 07 May 2018
JM Financial Institutional Securities Limited Page 48
APPENDIX I
JM Financial Inst itut ional Securit ies Limited ( fo rmer l y known as JM F inanc i a l Secu r i t i e s L im i ted )
Corporate Identity Number: U67100MH2017PLC296081 Member of BSE Ltd., National Stock Exchange of India Ltd. and Metropolitan Stock Exchange of India Ltd.
SEBI Registration Nos.: Stock Broker - INZ000163434, Research Analyst – INH000000610 Registered Office: 7th Floor, Cnergy, Appasaheb Marathe Marg, Prabhadevi, Mumbai 400 025, India.
Board: +9122 6630 3030 | Fax: +91 22 6630 3488 | Email: [email protected] | www.jmfl.com
Compliance Officer: Mr. Sunny Shah | Tel: +91 22 6630 3383 | Email: [email protected]
Definition of ratings
Rating Meaning
Buy Total expected returns of more than 15%. Total expected return includes dividend yields.
Hold Price expected to move in the range of 10% downside to 15% upside from the current market price.
Sell Price expected to move downwards by more than 10%
Research Analyst(s) Certification
The Research Analyst(s), with respect to each issuer and its securities covered by them in this research report, certify that:
All of the views expressed in this research report accurately reflect his or her or their personal views about all of the issuers and their securities; and
No part of his or her or their compensation was, is, or will be directly or indirectly related to the specific recommendations or views expressed in this research
report. Important Disclosures
This research report has been prepared by JM Financial Institutional Securities Limited (JM Financial Institutional Securities) to provide information about the
company(ies) and sector(s), if any, covered in the report and may be distributed by it and/or its associates solely for the purpose of information of the select
recipient of this report. This report and/or any part thereof, may not be duplicated in any form and/or reproduced or redistributed without the prior written
consent of JM Financial Institutional Securities. This report has been prepared independent of the companies covered herein.
JM Financial Institutional Securities is registered with the Securities and Exchange Board of India (SEBI) as a Research Analyst and a Stock Broker having trading
memberships of the BSE Ltd. (BSE), National Stock Exchange of India Ltd. (NSE) and Metropolitan Stock Exchange of India Ltd. (MSEI). No material disciplinary
action has been taken by SEBI against JM Financial Institutional Securities in the past two financial years which may impact the investment decision making of
the investor.
JM Financial Institutional Securities renders stock broking services primarily to institutional investors and provides the research services to its institutional
clients/investors. JM Financial Institutional Securities and its associates are part of a multi-service, integrated investment banking, investment management,
brokerage and financing group. JM Financial Institutional Securities and/or its associates might have provided or may provide services in respect of managing
offerings of securities, corporate finance, investment banking, mergers & acquisitions, broking, financing or any other advisory services to the company(ies)
covered herein. JM Financial Institutional Securities and/or its associates might have received during the past twelve months or may receive compensation from
the company(ies) mentioned in this report for rendering any of the above services.
JM Financial Institutional Securities and/or its associates, their directors and employees may; (a) from time to time, have a long or short position in, and buy or
sell the securities of the company(ies) mentioned herein or (b) be engaged in any other transaction involving such securities and earn brokerage or other
compensation or act as a market maker in the financial instruments of the company(ies) covered under this report or (c) act as an advisor or lender/borrower to,
or may have any financial interest in, such company(ies) or (d) considering the nature of business/activities that JM Financial Institutional Securities is engaged
in, it may have potential conflict of interest at the time of publication of this report on the subject company(ies).
Neither JM Financial Institutional Securities nor its associates or the Research Analyst(s) named in this report or his/her relatives individually own one per cent or
more securities of the company(ies) covered under this report, at the relevant date as specified in the SEBI (Research Analysts) Regulations, 2014.
The Research Analyst(s) principally responsible for the preparation of this research report and members of their household are prohibited from buying or selling
debt or equity securities, including but not limited to any option, right, warrant, future, long or short position issued by company(ies) covered under this report.
The Research Analyst(s) principally responsible for the preparation of this research report or their relatives (as defined under SEBI (Research Analysts)
Regulations, 2014); (a) do not have any financial interest in the company(ies) covered under this report or (b) did not receive any compensation from the
company(ies) covered under this report, or from any third party, in connection with this report or (c) do not have any other material conflict of interest at the
time of publication of this report. Research Analyst(s) are not serving as an officer, director or employee of the company(ies) covered under this report.
While reasonable care has been taken in the preparation of this report, it does not purport to be a complete description of the securities, markets or
developments referred to herein, and JM Financial Institutional Securities does not warrant its accuracy or completeness. JM Financial Institutional Securities
may not be in any way responsible for any loss or damage that may arise to any person from any inadvertent error in the information contained in this report.
This report is provided for information only and is not an investment advice and must not alone be taken as the basis for an investment decision.
Bandhan Bank 07 May 2018
JM Financial Institutional Securities Limited Page 49
The investment discussed or views expressed or recommendations/opinions given herein may not be suitable for all investors. The user assumes the entire risk
of any use made of this information. The information contained herein may be changed without notice and JM Financial Institutional Securities reserves the
right to make modifications and alterations to this statement as they may deem fit from time to time.
This report is neither an offer nor solicitation of an offer to buy and/or sell any securities mentioned herein and/or not an official confirmation of any
transaction.
This report is not directed or intended for distribution to, or use by any person or entity who is a citizen or resident of or located in any locality, state, country
or other jurisdiction, where such distribution, publication, availability or use would be contrary to law, regulation or which would subject JM Financial
Institutional Securities and/or its affiliated company(ies) to any registration or licensing requirement within such jurisdiction. The securities described herein may
or may not be eligible for sale in all jurisdictions or to a certain category of investors. Persons in whose possession this report may come, are required to inform
themselves of and to observe such restrictions.
Persons who receive this report from JM Financial Singapore Pte Ltd may contact Mr. Ruchir Jhunjhunwala ([email protected]) on +65 6422 1888
in respect of any matters arising from, or in connection with, this report.
Additional disclosure only for U.S. persons: JM Financial Institutional Securities has entered into an agreement with JM Financial Securities, Inc. ("JM Financial
Securities"), a U.S. registered broker-dealer and member of the Financial Industry Regulatory Authority ("FINRA") in order to conduct certain business in the
United States in reliance on the exemption from U.S. broker-dealer registration provided by Rule 15a-6, promulgated under the U.S. Securities Exchange Act of
1934 (the "Exchange Act"), as amended, and as interpreted by the staff of the U.S. Securities and Exchange Commission ("SEC") (together "Rule 15a-6").
This research report is distributed in the United States by JM Financial Securities in compliance with Rule 15a-6, and as a "third party research report" for
purposes of FINRA Rule 2241. In compliance with Rule 15a-6(a)(3) this research report is distributed only to "major U.S. institutional investors" as defined in
Rule 15a-6 and is not intended for use by any person or entity that is not a major U.S. institutional investor. If you have received a copy of this research report
and are not a major U.S. institutional investor, you are instructed not to read, rely on, or reproduce the contents hereof, and to destroy this research or return it
to JM Financial Institutional Securities or to JM Financial Securities.
This research report is a product of JM Financial Institutional Securities, which is the employer of the research analyst(s) solely responsible for its content. The
research analyst(s) preparing this research report is/are resident outside the United States and are not associated persons or employees of any U.S. registered
broker-dealer. Therefore, the analyst(s) are not subject to supervision by a U.S. broker-dealer, or otherwise required to satisfy the regulatory licensing
requirements of FINRA and may not be subject to the Rule 2241 restrictions on communications with a subject company, public appearances and trading
securities held by a research analyst account.
JM Financial Institutional Securities only accepts orders from major U.S. institutional investors. Pursuant to its agreement with JM Financial Institutional
Securities, JM Financial Securities effects the transactions for major U.S. institutional investors. Major U.S. institutional investors may place orders with JM
Financial Institutional Securities directly, or through JM Financial Securities, in the securities discussed in this research report.
Additional disclosure only for U.K. persons: Neither JM Financial Institutional Securities nor any of its affiliates is authorised in the United Kingdom (U.K.) by the
Financial Conduct Authority. As a result, this report is for distribution only to persons who (i) have professional experience in matters relating to investments
falling within Article 19(5) of the Financial Services and Markets Act 2000 (Financial Promotion) Order 2005 (as amended, the "Financial Promotion Order"), (ii)
are persons falling within Article 49(2)(a) to (d) ("high net worth companies, unincorporated associations etc.") of the Financial Promotion Order, (iii) are
outside the United Kingdom, or (iv) are persons to whom an invitation or inducement to engage in investment activity (within the meaning of section 21 of the
Financial Services and Markets Act 2000) in connection with the matters to which this report relates may otherwise lawfully be communicated or caused to be
communicated (all such persons together being referred to as "relevant persons"). This report is directed only at relevant persons and must not be acted on or
relied on by persons who are not relevant persons. Any investment or investment activity to which this report relates is available only to relevant persons and
will be engaged in only with relevant persons.
Additional disclosure only for Canadian persons: This report is not, and under no circumstances is to be construed as, an advertisement or a public offering of
the securities described herein in Canada or any province or territory thereof. Under no circumstances is this report to be construed as an offer to sell securities
or as a solicitation of an offer to buy securities in any jurisdiction of Canada. Any offer or sale of the securities described herein in Canada will be made only
under an exemption from the requirements to file a prospectus with the relevant Canadian securities regulators and only by a dealer properly registered under
applicable securities laws or, alternatively, pursuant to an exemption from the registration requirement in the relevant province or territory of Canada in which
such offer or sale is made. This report is not, and under no circumstances is it to be construed as, a prospectus or an offering memorandum. No securities
commission or similar regulatory authority in Canada has reviewed or in any way passed upon these materials, the information contained herein or the merits
of the securities described herein and any representation to the contrary is an offence. If you are located in Canada, this report has been made available to you
based on your representation that you are an “accredited investor” as such term is defined in National Instrument 45-106 Prospectus Exemptions and a
“permitted client” as such term is defined in National Instrument 31-103 Registration Requirements, Exemptions and Ongoing Registrant Obligations. Under
no circumstances is the information contained herein to be construed as investment advice in any province or territory of Canada nor should it be construed as
being tailored to the needs of the recipient. Canadian recipients are advised that JM Financial Securities, Inc., JM Financial Institutional Securities Limited, their
affiliates and authorized agents are not responsible for, nor do they accept, any liability whatsoever for any direct or consequential loss arising from any use of
this research report or the information contained herein.