Embed Size (px)
Citation preview
RESEARCH DEPARTMENT
BAND III EXPERIMENTAL TRANSMISSIONS FROM HOLME MOSS
B. Davis L F. Tagholm, A. M. I. E. E. P.T,W. Yance, B.Sc. C.R. East C.S. Dobson
Report No. (-Ill
( UII8/13)
(W. Proctor Wilson)
•
This Report is the property of the British Broadcasting Corporation and may not be without the Corpor at Ion.
reproduced in any form written permission of the
Report No. K-111
BAND III EXPERIMENTAL TRANSMISSIONS FROM HOLME MOSS
Section
1
2
3
4
5
6
7
8
Title
SUMMARY •• ,
INTRODUCTION
GENERAL.
RESULTS.
3.1. Field Strength Contour Maps.
3.2. Local Variation Factor
3.3. Multipath Interference
COMPARISON BETWEEN HORIZONTAL AND VERTICAL POLARISATION.
4.1. Measurements in Towns.
4.2. Multipath Interference
4.3. Horizontal/Vertical Polarisation Discrimination of
Receiving Aerials
COMPARISON BETWEEN BAND I AND BAND III
5.1. Service Area • • • • •
5.2. Multipath Interference
RECEIVING AERIAL HEIGHT-GAINS.
CONCLUSIONS.
REFERENCES •
Page
1
1
1
2
2
14
15
17
18
19
20
20
20
21
22
22
23

May 1956 Report No. K-111
(1956/13)
BAND III EXPERIMENTAL TRANSMISSIONS FROM HOLME MOSS
SUMMARY
The report shows the results of a field strength survey from an experimental Band III transmitter at Holme Moss using a frequency of 187"5 Mc/s.
It is shown that up to distances of from approximately 40 to 65 miles (65-100 km), with an e.r.p. of 100 kW and depending on the ground profile, the median field strength values on Band III would tend to be higher than those for the same e.r.p. on Band I. Beyond these distances the reverse would be the case. The field strength for which the Band I and III values were the same was approximately 0'5 mY/m.
A comparison between hcrizontal and vertical polarisation in Band III showed that, although the positions of the median field strength contours were the same, the range of variation of field strength was, in most cases, less when using vertical polarisation.
Measurements and observations of multipath interference have been made and this interference appears to be more widespread than on Band I. It is expected that the reduction of the interference will be less difficult than on Band I because more directional receiving aerials can conveniently be erected.
1. INTRODUCTION"
This report has been compiled from the results of a field strength survey of a Band III transmitter sited at Holme Moss.
As this was the first survey to be undertaken in this band by the B.B.C. Research Department, measurements were made in rather more detail than has been usual on v.h.f. surveys. Measurements were included of both horiZontally and vertically polarised transmissions over a limited area and of multipath interference in some of the principal towns in the area.
Although the primary object of this survey was to determine the service area, additional information was' obtained on the general propagation effects in Band Ill. This information will be of use in estimating the service from future Band III transmitter sites.
2. GENERAL.
The transmitter used for the measurements described in this report was installed at the Band I television transmitter site at Holme Moss with the aerial on the existing mast at a height of 700 ft (213'6 m) above ground level.
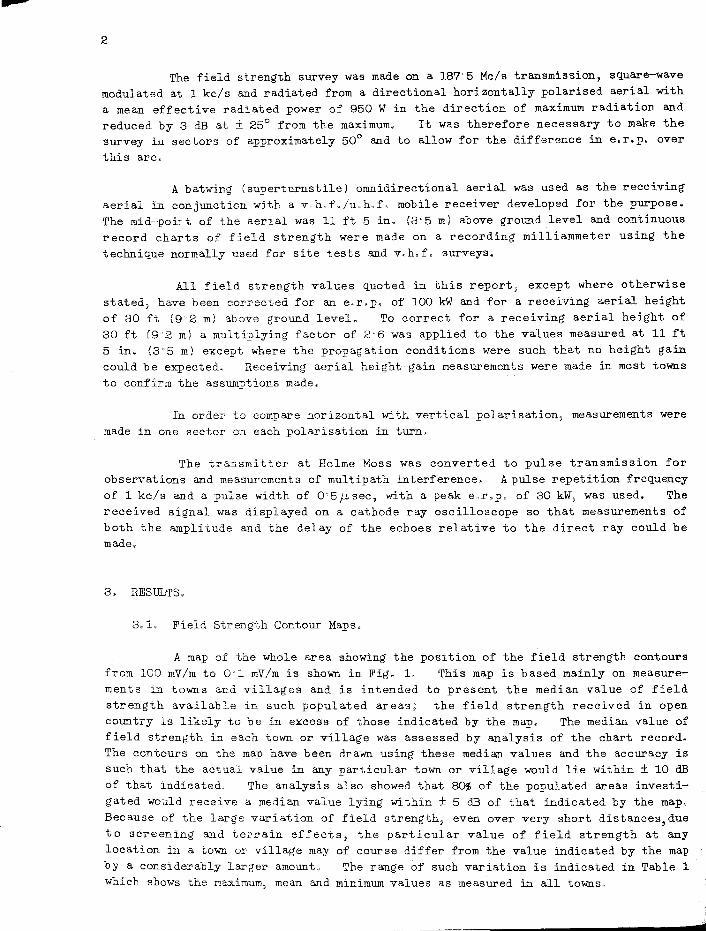
2
The field strength survey was made on a 187'5 Mc/s transmission, square-wave modulated at 1 kc/s and radiated from a directional hori30ntally polarised aerial with a mean effective radiated power of 950 W in the direction of maximum radiation and reduced by 3 dB at ± 25 0 from the maximum. It was therefore necessary to make the survey in sectors of approximately 500 and to allow for the difference in e.r.p. over this arc.
A batwing (superturnstile) omnidirectional aerial was used as the receiving aerial in conjunction with a v~h,f .. ,/u~h,fc mobile receiver developed for the purpose. The mid~--po:iJt of the aerial was 11 ft 5 in, C3'5 m) above ground level and continuous record charts of field strength were made on a recording milliammeter using the technique normally used for site tests and v,h,f, surveys.
All field strength values quoted in this report, except where otherwise stated, have been corrected for an e,r,p, of 100 kW and for a receiving aerial height of 30 ft (9'2 m) above ground leveL To correct for a receiving aerial height of 30 ft (9 2 m) a mUltiplying factor of 2'6 was applied to the values measured at 11 ft 5 in. (3'5 m) except where the propagation conditions were such that no height gain could be expected.. Receiving aerial height-~gain measurements were made in most towns to confirm the assumptions made.
In order to compare horizontal with vertical polarisation, measurements were made in one sector on each polarisation in turn,
The transmitter at Holme Moss was converted to pulse transmission for observations and measurements of multipath interference, A pulse repetition frequency of 1 kc/s and a pulse width of 0'5j.Lsec, with a peak e,r.p, of 30 kW; was used. The received signal was displayed on a cathode ray oscilloscope so that measurements of both the amplitude and the delay of the echoes relative to the direct ray could be made.
3. L Field Strength Contour Maps,
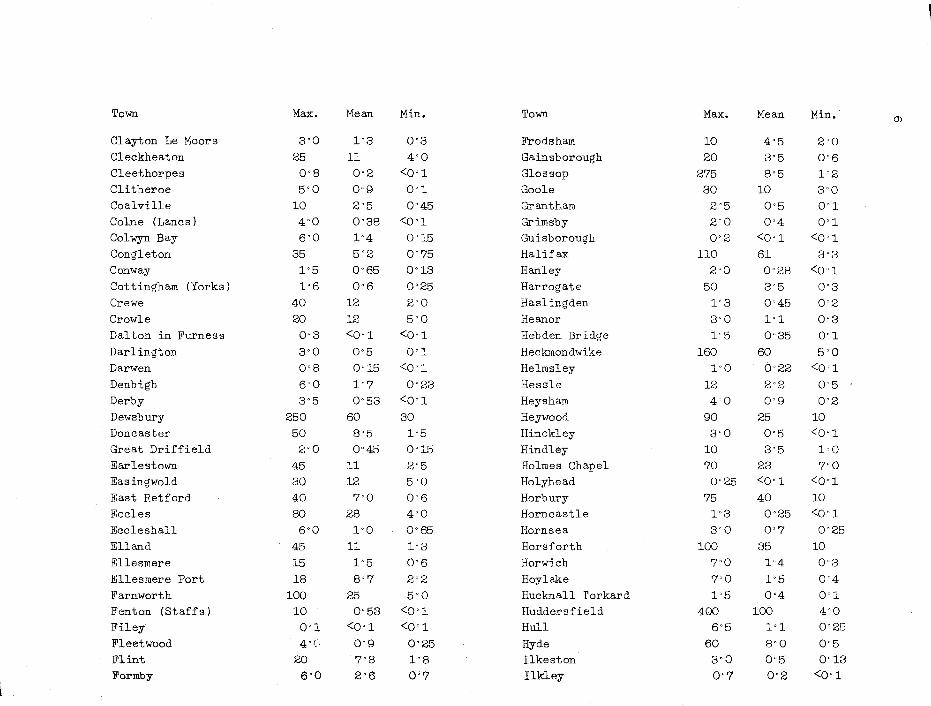
A map of the whole area showing the position of the field strength contours from 100 mV Im to 0'1 mV Im is shown in Fig., L This map is based mainly on measure-ments in towns and villages and is intended to present the median value of field strength available in such populated areas; the field strength received in open country is likely to be in excess of those indicated by the map. The median value of field strength in each town or village was assessed by analysis of the chart record. The contours on the map have been drawn using these median values and the accuracy is such that the actual value in any particular town or village would lie within ± 10 dB of that indicated. The analysis also showed that 8~ of the populated areas investigated would receive a median value lying within ± 5 dB of that indicated by the map. Because of the large variation of field strength, even over very short distances,due to screening and terrain effects, the particular value of field strength at any location in a town or village may of course differ from the value indicated by the map by a considerably larger amount, The range of such variation is indicated in Table 1 which shows the maximum, mean and minimum values as measured in all towns.
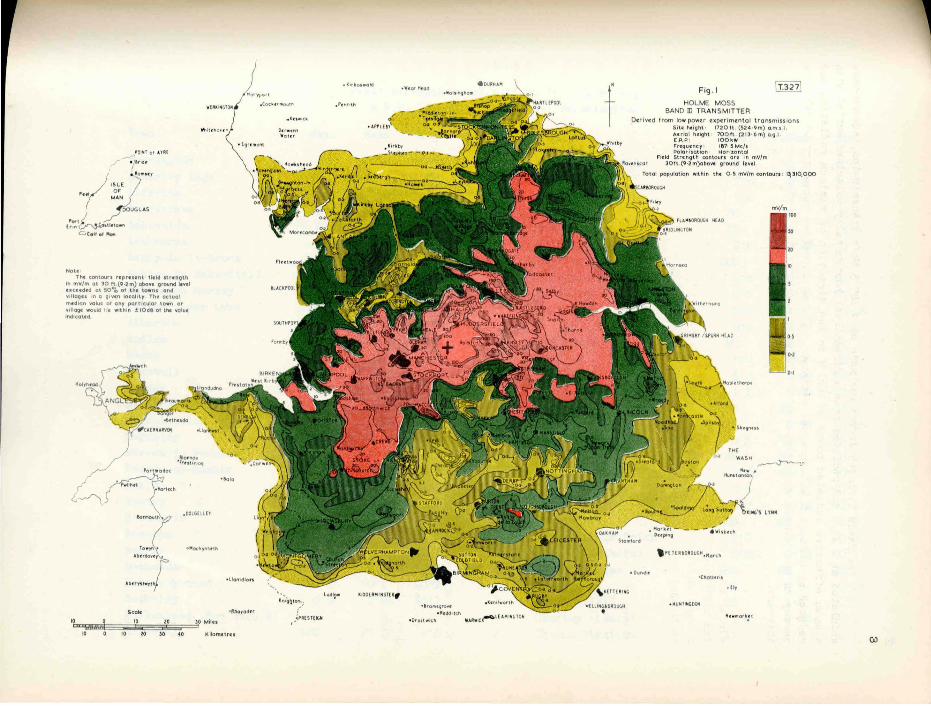
NOtt:
' Ol tj T 0 1 Hilt
· l'rtd~ ( ~g ",uy
The contours n prucn t fit:ld st rt:noth In mY/m at 30 It (9 .2 m) obovt: ground 'evel ucccdcd at 50°4 of the town , a nd vIUages In 0 gnllln localit y The ac tua l median valu.: of any partic ular l own o r vlllo9' would He Wit hin ± IOd& of t he value Indicated.
Scolt:
&lor noy '~Iulln'o,
. DOlGtll£\'
. llonll,lon
1O~:!iI&!1i!1!rr.i1ii!=~:o-'l1;0~=~2:t;0~;;=~1.0 1.41lu 10 0 10 lO 10 40 Kltomuru
", ", I( n 'Q~IO;;
i ' RUfEfGlI
"
f
" lrom,~ro~.
f orOII .. lth f Rr aa,tch .... h·lC~lE .. MIII C.TOH
Fig . 1
HOLME MOSS BAND m TRAN SMITTER
D~rlv( d from low powu upulm(nto l tronsm(u ioos Sitt: ht: ig M ' 1720 1l (52 4 ·9m) CI.m, .!. Aerial height , 100 ft (213 ' 6 m) o .g I E.RP ' 100 kW
f Oynd lc
~~~~~rs~~r~n ~e:; I~~~~1 Fie ld Stre ngth contours o re In mY/ m
30 fl (9'2 m)obove ground level
LYIIII
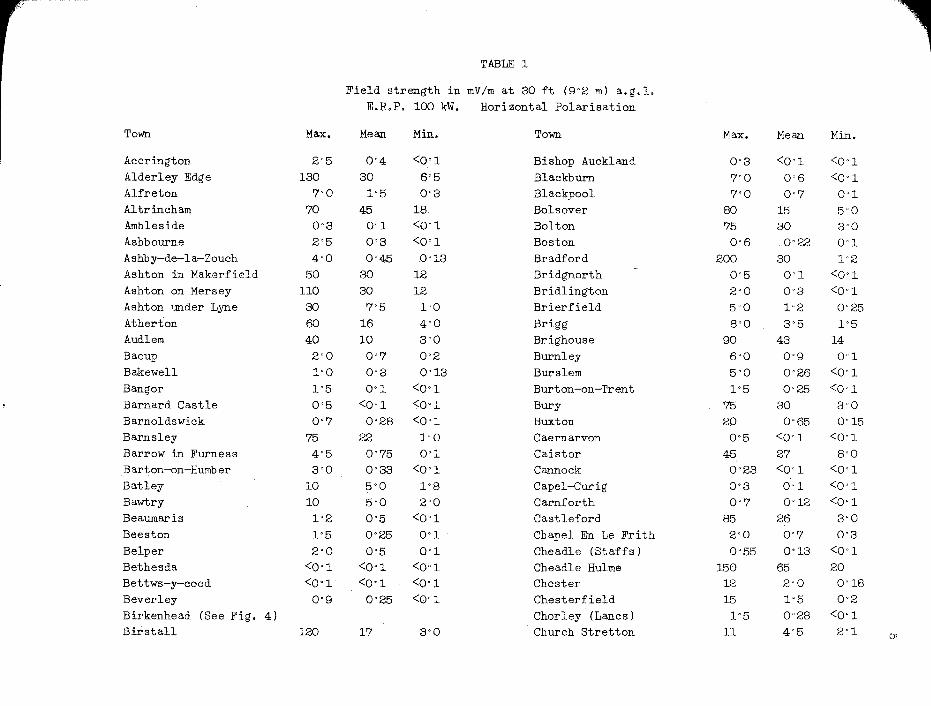
-., TABLE 1
Field strength in mY/m at 30 ft (9'2 m) a.g.l. E.R.P. 100 kW. Horizontal Polarisation
Town Max. Mean Min. Town Max. Mean Min.
Accrington 2'5 0'4 <0'1 Bishop Auckland 0'3 <0'1 <0'1 Alderley Edge 130 30 6'5 Blackburn 7'0 0'6 <0'1 Alfreton 7'0 1'5 0'3 Blackpool 7'0 0'7 0'1 Altrincham 70 45 18 Bolsover 80 15 5'0 Ambleside 0'3 0'1 <0'1 Bolton 75 30 3'0 Ashbourne 2'5 0'3 <0'1 Boston 0'6 0'22 0'1 Ashby-de-la-Zouch 4'0 0'45 0'13 Bradford 200 30 1'2 Ashton in Makerfield 50 30 12 Bridgnorth 0'5 0'1 <0'1 Ashton on Mersey 110 30 12 Bridlington 2'0 0'3 <0'1 Ashton under Lyne 30 7'5 1'0 Brierfield 5'0 1'2 0'25 Atherton 60 16 4'0 Brigg 8'0 3'5 1'5 Audlem 40 10 3'0 Brighouse 90 43 14 Bacup 2'0 0'7 0'2 Burnley 6'0 0'9 0'1 Bakewell 1'0 0'3 0'13 Burslem 5'0 0'26 <0'1 Bangor 1'5 0'1 <0'1 Burton-on-Trent 1'5 0'25 <0'1 Barnard Castle 0'5 <0'1 <0'1 Bury 75 30 3'0 Barnoldswick 0'7 0'28 <0'1 Buxton 20 0'65 0'15 Barnsley 75 22 1'0 Caernarvon 0'5 <0'1 <0'1 Barrow in Furness 4'5 0'75 0'1 Caistor 45 27 8'0 Barton-on-Humber 3'0 0'33 <0'1 Cannock 0'23 <0'1 <0'1 Batley 10 5'0 1'8 Capel-Curig 0'3 0'1 <0'1 Bawtry 10 5'0 2'0 Carnforth 0'7 0'12 <0'1 Beaumaris 1'2 0'5 <0'1 Castleford 85 26 3'0 Beeston 1'5 0'25 0'1 Chapel En Le Frith 2'0 0'7 0'3 Belper 2'0 0'5 0'1 Cheadle (Staffs) 0'55 0'13 <0'1 Bethesda <0'1 <0'1 <0'1 Cheadle Hulme 150 65 20 Bettws-y-coed <0'1 <0'1 <0'1 Chester 12 2'0 0'18 Beverley 0'9 0'25 <0'1 Chesterfield 15 1'5 0'2 Birkenhead (See Fig. 4) Chorley (Lancs) 1'5 0'28 <0'1 Birstall 120 17 3'0 Church Stretton 11 4'5 2'1 U1
Town Max. Mean Min. Town Max. Mean Min. Cll
Clayton Le Moors 3'0 1'3 0'3 Frodsham 10 4'5 2'0 Cleckheaton 25 11 4'0 Gainsborough 20 3'5 0'6 Cleethorpes 0'8 0'2 <0'1 Glossop 275 8'5 1'2 Clitheroe 5'0 0'9 0'1 Goole 30 10 3'0 Coalville 10 2'5 0'45 Grantham 2'5 0'5 0'1 Colne (Lanes) 4'0 0'38 <0'1 Grimsby 2'0 0'4 0'1 Colwyn Bay 6'0 1'4 0'15 Guisborough 0'2 <0'1 <0'1 Congleton 35 5'2 0'75 Halifax 110 61 3'3 Conway 1'5 0'65 0'13 Hanley 2'0 0'28 <0'1 Cottingham (Yorksl 1'6 0'6 0'25 Harrogate 50 3'5 0'3 Crewe 40 12 2'0 Haslingden 1'3 0'45 0'2 Crowle 20 12 5'0 Heanor 3'0 1'1 0'3 Dalton in Furness 0'3 <0'1 <0'1 Hebden Bridge 1'5 0'35 0'1 Darlington 3'0 0'5 0'1 Heckmondwike 160 60 5'0 Darwen 0'8 0'15 <0'1 Helmsley 1'0 0'22 <0'1
Denbigh 6'0 1'7 0'23 Hessle 12 2'2 0'5 Derby 3'5 0'53 <0'1 Heysham 4'0 0'9 0'2 Dewsbury 250 60 30 Heywood 90 25 10 Doncaster 50 8'5 1'5 Hinckley 3'0 0'5 <0'1
Great Driffield 2'0 0'45 0'15 Hindley 10 3'5 1'0 Earlestown 45 11 2'5 Holmes Chapel 70 23 7'0 Easingwold 30 12 5'0 Holyhead 0'25 <0'1 <0'1
East Retford 40 7'0 0'6 Horbury 75 40 10 Eccles 80 28 4'0 Horncastle 1'3 0'25 <0'1
Eccleshall 6'0 1'0 0'65 Hornsea 3'0 0'7 0'25 Elland 45 11 1'3 Horsforth 100 35 10 Ellesmere 15 1'5 0'6 Horwich 7'0 1'4 0'3
Ellesmere Port 18 8'7 2'2 Hoylake 7'0 1'5 0'4 Farnworth 100 25 5'0 Hucknall Torkard 1'5 0'4 0'1 Fenton (Staffs) 10 0'53 <0'1 Huddersfield 400 100 4'0 Filey 0'1 <0'1 <0'1 Hull 6'5 1'1 0'25
Fleetwood 4'( 0'9 0'25 Hyde 60 8'0 0'5 Flint 20 7'8 1'8 Ilkeston 3'0 0'5 0'13 Formby 6'0 2'6 0'7 Ilkley 0'7 0'2 <0'1
~ Town Max. Mean Min. Town Max. Mean Min.
Keighley 6'0 0'6 0'1 Market Harborough 0'35 0'23 <0'1
Kendal 0'15 <0'1 <0'1 Market Rasen 9'0 1'3 0'3
Kirkham (Lanes) 6'3 1'3 0'25 Market Weighton 20 7'0 2'0
Kirton in Lindsey 50 18 5'0 Marple 140 50 5'0
Knaresborough 8'0 1'9 0"5 Matlock 1'0 0'33 0'12
Knottingley 20 7'0 2'5 Melbourne (Derby 7'0 0'9 0'35
Knutsford 70 30 10 Melton Mowbray 0'25 <0'1 <0'1
Lancaster 1'0 <0'1 <0'1 Menai Bridge 0'23 0'18 0'12
Leeds (See Fig. 5) Mexborough 50 12 3'0
Leek 5'5 0'8 0'12 Middleton (Lanes) 40 14 5'0
Leicester 1'6 0'25 <0'1 Middlesborough 1'0 0'2 <0'1
Leigh (Lanes l 50 8"0 2'0 Middlewich 35 11 4'0
Lincoln 40 2'4 0'2 Millom 0'7 0'22 <0'1
Li ttleborough (Lanes) 2'0 0"7 0'3 Mirfield 50 20 4"0
Liverpool (See Fig. 4) Mold 8'0 3'7 0"6
Liversedge 240 63 26 Morecambe 4'0 0'5 0'1
Llanberis <0'1 <0'1 <0'1 Morley (Yorksl 20 4'0 1"0
Llandudno 1'5 0'7 0'15 Nantwich 45 1? 2"0
Llanfair-P.G, 0'42 0'2 <0'1 Nelson 5'0 0"3 <0'1
Llanfyllin 0'2 <0'1 <0'1 Newark 7'0 1'1 0'25
Llangollen 0'6 0'18 <0'1 Newcastle under Lyme 50 1"2 <0'1
Long Eaton 3'0 0'4 0'1 New Mills (Derby) 100 17 3"5
Longridge 40 10 1'5 Newport (Salop) 0'85 0"35 0'12
Longton (Staffs) 3'5 0'5 <0'1 Northallerton 6'0 1'6 0"6
Loughborough 5'0 0'8 0'3 Northwich 50 10 2'0
Louth 0'3 0'1 <0"1 Nottingham 6'0 0'33 <0"1
Lytham St. Annes 4'0 1'0 0'25 Nuneaton 1'0 017 <0'1
Mablethorpe 0'6 0'2 <0'1 Oakengates 6'0 1'5 <0'1
Macclesfield 60 4'0 0'5 Oakham 0'15 <0'1 <0'1
Malpas 21 8'0 3'5 Oldham 100 24 4'0
Malton 3'0 1'3 0'5 Ollerton (Notts) 20 10 2'0
Manchester (See Fig. 3) Ormskirk 7'0 1'5 0'3
Mansfield 5'0 2'0 0'2 Ossett 180 60 10
Market Drayton 7'0 2'5 1'0 Oswaldtwi stle 3'0 0'25 <0'1
Town Max. Mean Min. Town Max. Mean Min.
Oswestry 6'0 1'7 0'6 Sandbach 30 11 6'0
Otley 2'0 0"7 0'15 Scarborough 1'0 0'13 <0'1
Overton (Flint) 10 3'0 1'0 SClIDthorpe 30 18 1'5
Padiham 4'0 0'5 0'15 Selby 45 7'0 2'0
Penistone 100 45 15 Settle 2'5 0'35 <0'1
Penmaen Mawr 0'35 0'26 0'1 Shaw 12 2'8 1'2
Pentraeth . <0'1 <0'1 <0'1 Sheffield (See Fig. 2)
Pickering 12 3'0 0'6 Shifnal 1'4 0'3 <0'1
PockliIl:gton 25 9'0 3'0 Shipley (Yorksl 7'0 1'4 0'4
Pontefract 30 9'0 2'0 Shrewsbury 6'5 1'6 0'2
Poulton Le Fylde 5'0 1'6 0'6 Skegness 0'3 0'1 <0'1
Prescot 14 3'2 0'7 Skipton 3'0 0'9 0'2
Prestatyn 8'0 2'0 1'2 Sleaford 1'6 0'3 <0'1
Preston 7 0 0'66 0'1 Snaith 50 12 3'0
Pudsey 75 22 8'0 Southport 9 0 1'8 0'2
Queensferry 15 6'7 4'2 Spilsby 0'5 025 <0'1
Radcliffe 60 14 2'0 Stafford 0'9 0'25 <0'1
Ramsbottom 10 3'0 0'6 Stalybridge 10 2'5 0'5
Rawtenstall 4'5 08 0'15 Stockton-on-Tees 1'5 C'4 <0'1
Redcar 0'6 <0'1 <0'1 Stocksbridge 200 30 1'0
Rhyl 9'0 1'1 0'2 Stoke-on-Trent 9'0 0'52 <0'1
Richmond 1'0 0'15 <0'1 Stokesley 1'3 0'55 0'2
Ripley (Derby) 5'0 2'2 0'55 Stone (Staffs) 0'17 <0'1 <0'1
Ripon 4'5 1'2 0'25 Stretford 50 18 10
Rishton 7'0 2'0 0'40 Sutton in Ashfield 7'0 1'5 0'2
Rochdale 100 10 1'0 Swadlincote 19 4'5 0'5
,Rotherham 80 5'0 05 Swinton (Lancs) 50 21 6'0
Royton 30 9'0 3'5 Swinton (Yorksl 20 10 3'0
Rugby 0'5 0'12 <0'1 Tadcaster 15 4'5 1'0
Rugeley 1"5 0'25 <0'1 Tamworth 2'0 0'13 <0'1
RlIDcorn 40 19 3'5 Thirsk 14 3'0 0'6
St. Asaph 0'7 0'4 0'1 Thornaby on Tees 1'5 03 <0'1
St. Helens 60 7'5 0'8 Thorne 35 13 4'0
Sale 150 40 10 Todmorden 4'0 0'5 0'15
Town Max. Mean Min. Town Max, Mean Min,
Tunstall (Staffs) 12 1'2 <0'1 Whitby 0'7 <0'1 <01 Tuxford 25 5'0 1'0 Whitehureh 19 3'7 045 Tyldesley 40 12 2"0 Whitworth 4'0 1'2 0'5 Ulverston 2"0 0'5 0'1 Widnes 22 12 3'6 Upping-ham 0'7 0'2 01 Wig-an 15 3'7 0'6 Uttoxeter 2'3 0'5 0'1 Wilmslow 35 18 7'0 Wainfleet All Saints 0'5 0'15 <0'1 Windermere 0'2 <0'1 <0'1 Wakefield 120 27 6 0 Winsford 60 12 3 0 Warrington 100 20 3'2 Winterton 70 2'5 1'0 Wath-upon-Dearne 40 8 1'5 Wirksworth 2'0 0'5 0'1 Wellington 5'3 1'5 0'4 Withernsea 2'0 0'55 0'12 Welshpool 5'0 0'45 <0'1 Worksop 15 5'0 2'0 Wem 8'0 2'6 0'8 Wragby (Lines) 5'0 1'2 0'4 West Hartlepool 1'5 0'15 <0'1 Wrexham 7'0 2'2 0'4 Wetherby 9'0 2'2 0'4 Yeadon 120 35 5'0 Whaley Bridge 34 7'5 2'2 York 30 5'0 0'7
<0
---. 10.
Hollam
, / ........ _--
I
! ' .. >
;' \
,-v
, , , , \:-----
1T.2501
I (> FIELD STRENGT:~~~TOtJRS IN SHEFFIELD
_J-' /V FROM HOLME MOSS BAND m TRANSMITTER ,/'-~'" __ J---- t-"/ Derived from low power experimental transmissions
" Site hcight: 1720 ft.(524·9m) o.m.s.!. (-'.r' Aerial hcight: 700ft.(213·6m) o.g.l.
e'V" E.R.P.: 100 kW J Frequency, I 87· 5 Mc/. ( Polarisation: Horizontal
--"'_/ Field Strength contours ore in mY/m 30ft. (9·2 m) above ground I.vel.
- -- - Municipal boundari~s
Areas whe .. interference from echoes will b. serious (at least 2 ochocs Icss than 10d!!> below the direct signa\.)
TO BURY
"TO BenON
~'~' =--..-, ,-, f ",~
TO WARRlNGTON ,\~ S) ___ ~r '0
j) ! ",~RINCHAM
" , TO WIlM5l0W
'"
\ \
,; \ \ \ \ ' ... )
TO A5HTON UNDER lYNE
K "o,,~~ \~I
i I '" TO BUXTON
TO MACClE5F1ElD I t \ Fig.3
11
FIELD STRENGTH CONT tROM HOLME MOSS B~~~ IN MANCHESTER
cz:rlvtZd from low po~r Cl:xperim rn TRANSMITTER Sitcr: height: 1720 ~ntt transmissions Aerial hllight: 700f~' (~~j:zm) a.m.s.1. E.R.P.: 100 kW m) o.g.1.
. ~~i~~is~Ct~~n' 187;5 MC!S FltZld Str«n th . Horizontal 30ft(9'2m~ab~ontours are in mY/m
~ Are,as whue int~~f:~nund [evtZl. ~ ~~rtO~~ (at Icz:.ost 2 tZcho~: I
from echoES will b\Z
I'l Ireet signal.) IZSS than 10 dB bl2low
, --- , I~.-
--~'~~':<.-"~~=-==~==::= • "'.m .... --'==~
) Hiic5
TO WARRINGTON &
MANCHESTER
,
50
\ T.287\
1 TO WETHERBY
~~ADCASTER
/' (~" F;g.5 LEEDS
n I CONTOURS '~SM'TTER 5 10~50 V(j" '" FIELD STR~~6~ BAND mot;?,'~m",m;,,,on'
FROM HOL~ow power experr~:.(524.9m) a.m.s.l. Derived from Site height: . 1~;~ft.(213m) a.g.1.
\. Aerial height. 100 kW I ."\. E.R.P.: '. IS7.5 Mc 5
'\ F~q",oo,.. ""';'""',"' mVlm "\. I risat Ion. ore ,n c-J "\. Po 0 th contours d level ~ ~ 30ft~~m ~ Field Streng )above groun
~~ \
i Miles ~~~~sc:al'~~::::~ L- ---~~b====4===f Kilomttru L
14
More detailed field strength contour maps have been made for each of the larger cities in the area and are shown in Figs. 2, 3, 4 and 5. These contours show the median field strength value ~ any locality in the city although local variation may amount to ± 6 dB in the extreme cases.
3.2. Local Variation Factor.
At v.h.f. the value of field strength at any location may be appreciably affected by comparatively small obstructions, such as trees, houses, etc., and by small variations in ground level in the vicinity of the receiving site. To obtain an accurate estimate of the service provided by a transmitter at these frequencies the variation of field strength due to these factors must be taken into account. In any area throughout which no large changes of propagation path occur the scatter around the median value of field strength is due to the above causes and follows very closely a log normal distribution. The degree of scatter is, of course, dependent on the size and incidence of occurrence of the obstacles, etc., in the immediate vicinity. It has been suggested by a Working Party of Study Group V of the C.C.I.R. that this value shall be called the "local variation factor" and defined "the local variation factor for a given area is the ratio (normally expressed in decibels) between the values of field strength exceeded at 50~ and at 90~ of all the individual receiving points within that area".
In the following two examples the values of local variation factor were obtained from field strength measurements taken in open country and in a built-up area from a continuous "cruise" of 1'25 miles (2 km) over which no large change in propagation path occurs.
E so >~ ........ '" "0
t 75
" .. t; "0 ¥ "1i, 70
----:---- --~ ----- ;...,- loc.al variation factor%2·ldB ~ i--
-......; r--r----0000000 N ....... _-o~.,
o ... on ... ", locatio"5 where st'a'tcd valul: of fit Id st"rrng'th is Ixetlded
'" ... ... ... co ...
~ 8:
Fig. 6 - Field strength variations in open flat country. Values obtained from I '25 mile (2km) cruise along Newark to Grantham road between Balderton
and Long Bennington
Fig. 6 represents the field strength distribution in a stretch of very flat open country between Newark and Grantham and it will be seen that the local variation factor is approximately 2 dB.
In the built-up area of the adjoining town of Newark the local variation factor is approximately 6 dB, as shown in Fig. 7.
75
f 70 :;: :-., -CD ..., .., 'C. 65
" ~ .. .. ..., .. ....
60
55
I
I i ., o
""" I
I I I
'" t ~ I ~
I I I
I I i I I
I 1
I
~I i I
'~_- -- ---
I
I I o ,..,
I
11
o ..,.
I i T i
f'i,,1 i J _local variation tactor.5.8~8
I I~ I t
<> ... o .,.
. I
'" ['... ... .,. ... .,. 0" locations where stQtld valut: of field strengTh is (xcttdtd
15
Fig. 7 - Field strength variations in built up area. Values obtained from I '25 mile (2km) cruise through Newark
3.3. Multipath Interference.
The two most important factors in determining the degree of multipath interference ("ghosts") at any location within the service area of a television transmitter are the number of echoes received and their amplitudes relative to the direct signal. -Echoes become most apparent as "ghosts" when the delay time is greater than about 2f.Lsec a;nd become somewhat disturbing when the amplitude is greater tha;n .1_ of the direct signal. The interference is defined as "serious" in Band 111 when tgere are at least two echoes of amplitude greater than ~ that of the direct
3 signal. The areas where this occurs in the principal towns are shown shaded in Figs. 2, 3 and 4 and in these areas it will be difficult or impossible to overcome the effect of the interference by the use of directional receiving aerials.
In Sheffield (Fig. 2), where many areas are severely screened in the direction of Holme Moss a;nd the direct signal is highly attenuated, multipath interference occurred due to reflection from surrounding hills. Echoes were observed with delay times of up to 40 f.L sec suggesting reflecting ob jects at distances of 4 miles (6'5 km) or more. In the city centre and industrial area echoes from large buildings, factory chimneys and cooling towers, etc., were prominent but were not usually serious unless the reflecting objects were within about 0'2 miles (0'32 km) of the receiving site. In such cases, however, the delays would be not greater than 2f.Lsec.
In Manchester (Fig. 3) the median field strength would be greater than 2 mV/m in all areas and multipath interference is very much less serious than in Sheffield. Nevertheless there are some small areas where interference would be serious. buildings. lation and
In the centra.l area echoes were mainly due to reflections from large In the eastern area the echoes were caused by a large gas works instal
in the area indicated north of Salford adjacent hills were responsible for some serious echoes.
---16
'" '0
0'
~
+10
+5
: -s '" ] ..
J>
~ ... -10
g .. " -g
,!::
~ -15
"
-20
-25
I I I
I !
I I I
,
i
! ,
I 1 1 5h.f~i.l,d ___ f\
\ I 1
MQnChC$tt~ I <>
,I !I_ ~, LI"trpool I X 1 I 1
~ Warrington ___ 't;
,I ,
~ 8 Irk _nh_ad ____ . , ,
,
I
i I
I
I
I I
~
\~ \ I
'\ i\ " \
,
"- I~'~ ,\! ~, '\:\ i~
I
I
o N
""
I
I
\ '\ , ,
", \~ 1', \
,"
I I
o ..
~~ ~, ~\
I
1
I ,
I I
I
! 1
"
~ "-~
,
,
~,
"
I
" "'-I ,
\ " .\~, .~ \
o '"
I
I
"0 locations whtrt largut le ho txcud, stat(d valut
1
... ...
I i
I I
I
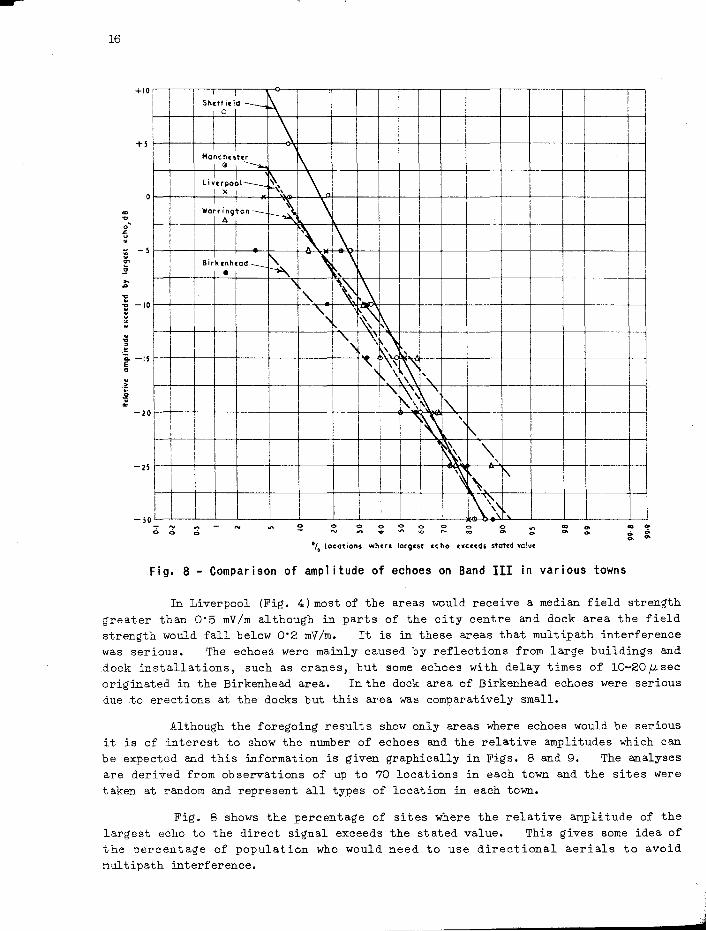
Fig. 8 - Comparison of amp! itude of echoes on Band III in various towns
In Liverpool (Fig. 4) most of the areas would receive a median field strength greater than 0'5 my/m although in parts of the city centre and dock area the field strength would fall below 0'2 mY/m. It is in these areas that multipath interference was serious. The echoes were mainly caused by reflections from large buildings and dock installations, such as cranes, but some echoes with delay times of lO-20~sec originated in the Birkenhead area. Inthe dock area of Birkenhead echoes were serious due to erections at the docks but this area was comparatively small.
Although the foregoing results show only areas where echoes would be serious it is of interest to show the number of echoes and the relative amplitudes which can be expected and this information is given graphically in Figs, 8 and 9, The analyses are derived from observations of up to 70 locations in each town and the sites were taken at random and represent all types of location in each town.
Fig. 8 shows the percentage of sites where the relative amplitude of the largest echo to the direct signal exceeds the stated value. This gives some idea of the percentage of population who would need to use directional aerials to avoid multipath interference.
.~ j
h
• I
100 (0) . Warrangton H.P lIirkenhead H.P. Liverpool H.P. ManchesterH.P. Sheffield H.P. Sheffield v. P.
7S~----------~-----------+------------~----------~----------~----------~
£ (b) ~ 100 Warrington H.I'
• 75 }$
~ 50
I~~ w (C)
0
Birkenhead H.P. Li verpool H.P. Manchester H.P. She ff ield H.P.
A~ ~l1 I m~ I r:J I'A '" n "" f;I 012 012 012 012341
HlImbu at tchou at amplitude gnat.r than S of direct signal
,; 10 Sheftield(i) Shllff ield(ii)
o ~75
~ ~ , 0
S
0
H.P. I
I ~ ~ pj "" o I 234 5
V.P. H.P. V.P.
I ~ ~ P1 11 r::d1 lA ~ I fin El rJ o I 2 3 4 S 01234S5012345
Numb,r 01 uhoCl at amplitude gnotcr than To of direct signol (i)With dtlays at less than ')'S (ii) Ddays of grcat"cf than 5pos
Fig. 9
I 2 3 4 5 >5
Sheffield V.P .
1~F1r3~n o I 2 3 4 S
17
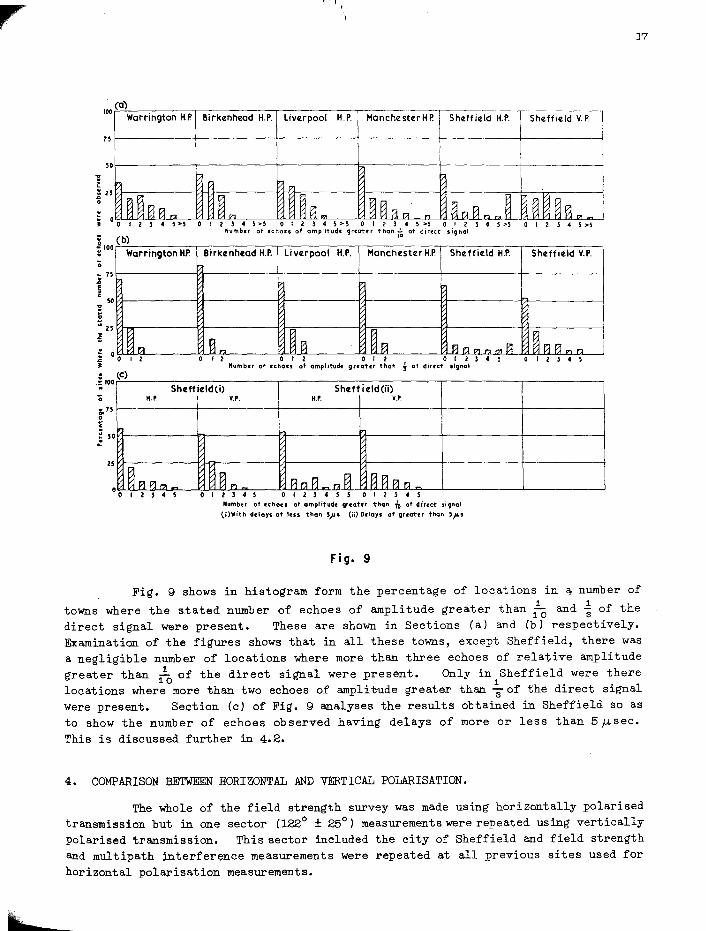
Fig. 9 shows in histogram form the percentage of locations in ~ number of
towns where the stated number of echoes of amplitude greater than :0 and ~ of the direct signal were present. These are shown in Sections (a) and (b) respectively. Examination of the figures shows that in all these towns, except Sheffield, there was a negligible number of locations where more than three echoes of relative amplitude greater than :0 of the direct signal were present. Only in Sheffield were there locations where more than two echoes of ampli~ude greater than ~ of the direct signal were present. Section (c) of Fig. 9 analyses the results obtained in Sheffield so as to show the number of echoes observed having delays of more or less than 5~sec. This is discussed further in 4.2.
4. COMPARISON BETWEEN HORIZONTAL AND VERTICAL POLARISATION.
The whole of the field strength survey was made using horizontally polarised transmission but in one sector (122° ± 25°) measurements were repeated using vertically polarised transmission. This sector included the city of Sheffield and field strength and multipath interference measurements were repeated at all previous sites used for horizontal polarisation measurements.
18
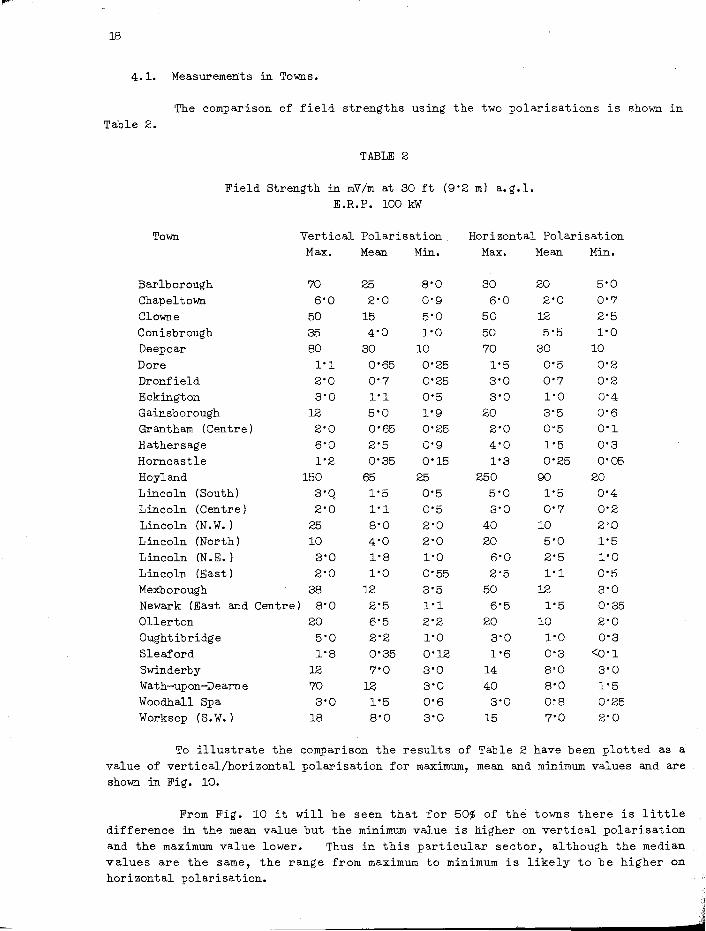
4.1. Measurements in Towns.
The comparison of field strengths using the two polarisations is shown in Table 2.
TABLE 2
Field Strength in mV/m at 30 ft (9'2 m) a.g.l.
Town
Barlborough Chapeltown Clowne Conisbrough Deepcar Dore Dronfield Eckington Gainsborough Grantham (Centre) Hathersage Horncastle Hoyland Lincoln (South) Lincoln (Centre) Lincoln (N. W. ) Lincoln (North) Lincoln (N .E. ) Lincoln (East) Mexborough Newark (East and Centre) Ollerton Oughtibridge Sleaford Swinderby Wath-upon-Dearne Woodhall Spa Worksop (S. W. )
E.R.P. 100 kW
Vertical Polarisation Max. Mean Min.
70 6'0
50 35
80 1'1 2'0 3'0
12
2'0
6'0 1'2
150 3'Q 2'0
25 10 3'0 2'0
38 8'0
20 5'0
1'8
12
70 3'0
18
25 2'0
15
4'0 30 0'65 0'7 1'1 5'0 0'65 2'5 0'35
65 1'5 1'1 8'0 4'0 1'8 1'0
12
2'5
6'5 2'2 0'35
7'0 12
1'5
8'0
8'0 0'9 5'0 1'0
10 0'25 0'25 0'5 1'9
0'25
0'9 0'15
25 0'5 0'5 2'0 2'0 1'0
0'55
3'5 1'1 2'2 1'0 0'12
3'0 3'0 0'6 3'0
Horizontal Polarisation Max, Mean Min,
30 6'0
50 50 70
1'5
3'0 3'0
20 2'0
4'0 1'3
250
5'0 3'0
40 20 6'0
2°5 50 6'5
20 3'0 1'6
14 40 3'0
15
20 2'0
12
5'5
30 0'5
0'7 1'0 3'5 0'5 1'5
0'25
90 1'5
0'7
10
5'0 2'5 1'1
12
1'5
10 1'0
0'3
8°0 8'0 0'8 7'0
5'0 0'7
2'5 1'0
10 0'2
0'2 0'4 0'6 0'1
0'3 0'05
20 0'4 0'2
2°0 1'5
1'0 0'5
3'0 0'35 2'0 0'3
<0'1
3'0 1'5
0'25 2'0
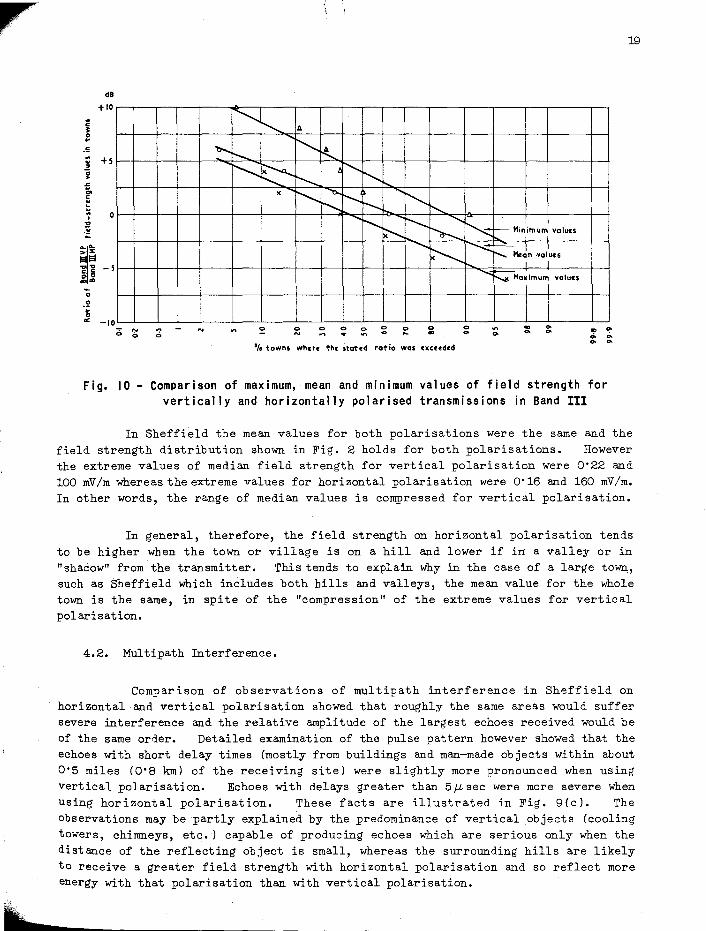
To illustrate the comparison the results of Table 2 have been plotted as a value of vertical/horizontal polarisation for maximum, mean and minimum values and are shown in Fig, 10,
From Fig. 10 it will be seen that for 50% of the towns there is little difference in the mean value but the minimum value is higher on vertical polarisation and the maximum value lower. Thus in this particular sector, although the median values are the same, the range from maximum to minimum is likely to be higher on horizontal polarisation.
.. c: J 0 ..
.5 .. .. ~
~ .<: Q.
~ I .., ~ -~~ >%
l=l ...... c: c:
" " ...... "0 .2 .. " «:
dB
+10
+s
0
-s
-10
"" o
~
~
I'-........ ............
t'---... fj.
~ ~ ~ j'-.... ~r'---
................ r--.... x i'--- ".,.
'-.: ~ ~ ,.........
t'--.... .......... ........... ...............
~ ~ ~
o N
o .., o 0 ... ~
j
o ., o ...
........
~
o ... o ...
......
........
0,. towns where the stated ra'tio was rxcrrdrd
, r--- Minimum values
........ M.2n .YOIIUCS
I I ~MQximum valucl
I 1
... ... .. ... ... ... ... ...
Fig. 10 - Comparison of maximum, mean and minimum values of field strength for vertically and horizontally polarised transmissions in Band 111
19
In Sheffield the mean values for both polarisations were the same and the field strength distribution shown in Fig. 2 holds for both polarisations. However the extreme values of median field strength for vertical polarisation were 0'22 and 100 mV Im whereas the extreme values for horizontal polarisation were 0'16 and 160 mV Im. In other words, the range of median values is compressed for vertical polarisation.
In general, therefore, the field strength on horizontal polarisation tends to be higher when the town or village is on a hill and lower if in a valley or in "shadow" from the transmitter. This tends to explain why in the case of a large town, such as Sheffield which includes both hills and valleys, the mean value for the whole town is the same, in spite of the "compression" of the extreme values for vertical polarisation.
4.2. Multipath Interference.
Comparison of observations of multipath interference in Sheffield on horizontal and vertical polarisation showed that roughly the same areas would suffer severe interference and the relative amplitude of the largest echoes received would be of the same order. Detailed examination of the pulse pattern however showed that the echoes with short delay times (mostly from buildings and man-made objects within about 0'5 miles (O'S km) of the receiving site} were slightly more pronounced when using vertical polarisation. Echoes with delays greater than 5 f.1- sec were more severe when Using horizontal polarisation. These facts are illustrated in Fig. g(c). The observations may be partly explained by the predominance of vertical objects (cooling towers, chimneys, etc.) capable of producing echoes which are serious only when the distance of the reflecting object is small, whereas the surrounding hills are likely to receive a greater field strength with horizontal polarisation and so reflect more energy with that polarisation than with vertical polarisation.
-
I c
~ ~ ~ ;;; c . E
l .... c c .. .... .2
~
41
+ZO x
+IS
. x . x +10 x -x i x . x x ~
..:0- Ji - S
x , . , i x .
~ - , / i . x
x x x i/ -; I-
...... x x
"'- xx! ~ Colc.ulatcd best fit line: ! x x x
x x ! i "~
x x x I x I X -r- x
x
x -- x x )<
- S ~
x x
x X X
x I x xX
" x x x
x x x x
x -10
x ~ x I x
-IS L x I
I .,. ~ 0 o 6 6 6 ~ 6 :;~, "'" eo 0. 2 ~ ~ ~ ~ ~ ~ a ~ ~
Hean land m fit:ld strcnoth in towns .. mV/m at 10' o.g.l. for 100 kW E.Po.P. (Horil.Ontal polarisation)
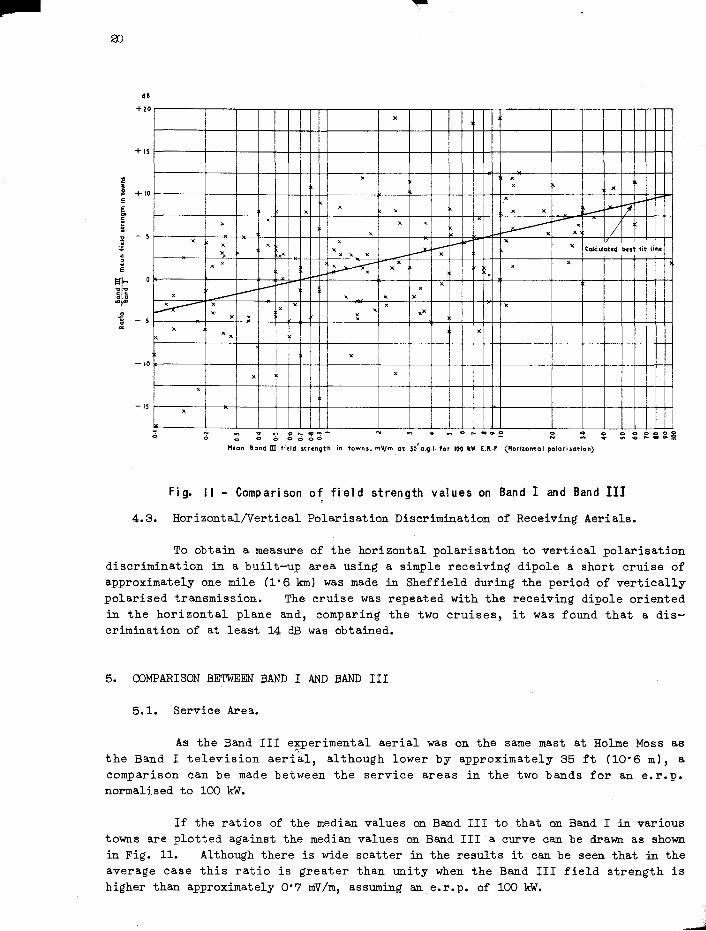
Fig. 11 - Comparison o~ field strength values on Band 1 and Band II1
4.3. Horizontal/Vertical Polarisation Discrimination of Receiving Aerials.
To obtain a measure of the horizontal polarisation to vertical polarisation discrimination in a built-up area using a simple receiving dipole a short cruise of approximately one mile (1'6 km) was made in Sheffield during the period of vertically polarised transmission. The cruise was repeated with the receiving dipole oriented in the horizontal plane and, comparing the two cruises, it was found that a discrimination of at least 14 dB was obtained.
5. COMPARISON BETWEEN BAND I AND BAND HI
5.1. Service Area.
As the Band III e~perimental aerial was on the same mast at Holme Moss as the Band I television aerial, although lower by approximately 35 ft (10'6 m), a comparison can be made between the service areas in the two bands for an e.r.p. normalised to 100 kW.
If the ratios of the median values on Band III to that on Band I in various towns are plotted against the median values on Band III a curve can be drawn as shown in Fig. 11. Although there is wide scatter in the results it can be seen that in the average case this ratio is greater than unity when the Band III field strength is higher than approximately 0'7 mV/m, assuming an e.r.p. of 100 kW.
-~
I"
14
I Z
10
... "8 " '0 r .. ~
,~ .. ~
6 o
-2
-
"~ "\
]\..
~
~ ~
Ratio of aerial heigh~. for measur<m.nt~ ------------1---- ---
o '"
I
-'
~
"
o 0 ... ~
'\~
I
I
~
o ...
I I
~
I
o ..
'\
I I
]'\..
o ...
-T-
~ 1'\
~
'f, locations wht:rt: stottd yalue: of l\«ight-90i n was rxcltdtd
I
I I
0-.
-... • ... ...
I
..... : :
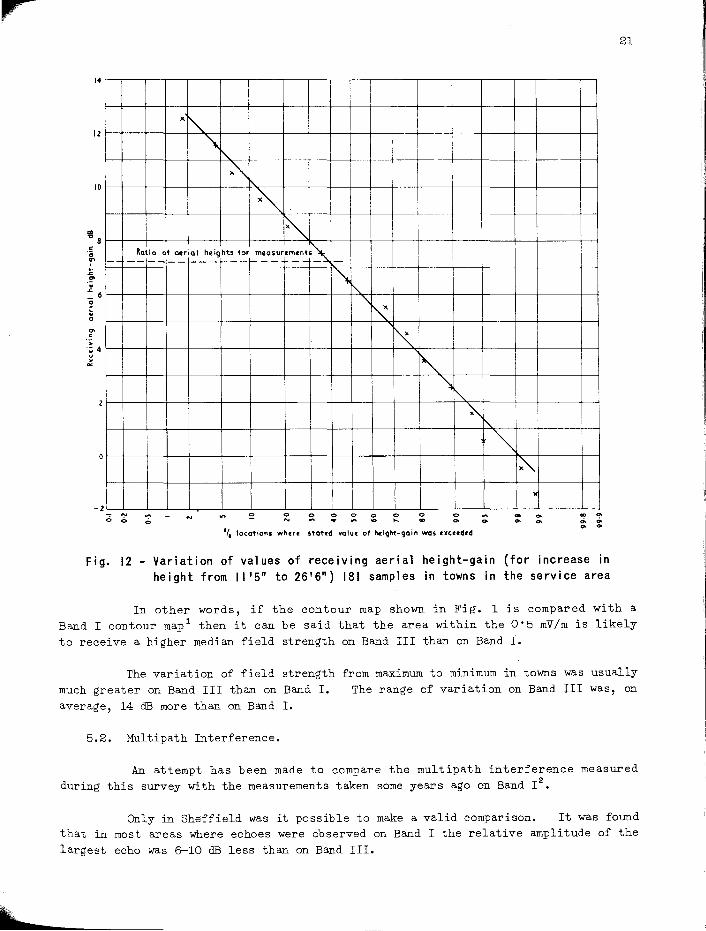
Fig. 12 - Variation of values of receiving aerial height-gain (for increase in height from 11'5" to 26'6") 181 samples in towns in the service area
21
In other words, if the contour map shown in Fig. 1 is compared with a Band I contour mapl then it can be said that the area within the 0'5 mV/m is likely to receive a higher median field strength on Band III than on Band I.
The variation of field strength much greater on Band III than on Band I. average, 14 dB more than on Band I.
5.2. Multipath Interference.
from maximum to minimum in towns was usually The range of variation on Band III was, on
An attempt has been made to compare the multipath interference measured during this survey with the measurements taken some years ago on Band 12.
Only in Sheffield was it possible to make a valid comparison. It was found that in most areas where echoes were observed on Band I the relative amplitude of the largest echo was 6-10 dB less than on Band Ill.
, I
I I
,"
»
22
6. RECEIVING AERIAL HEIGHT GAINS.
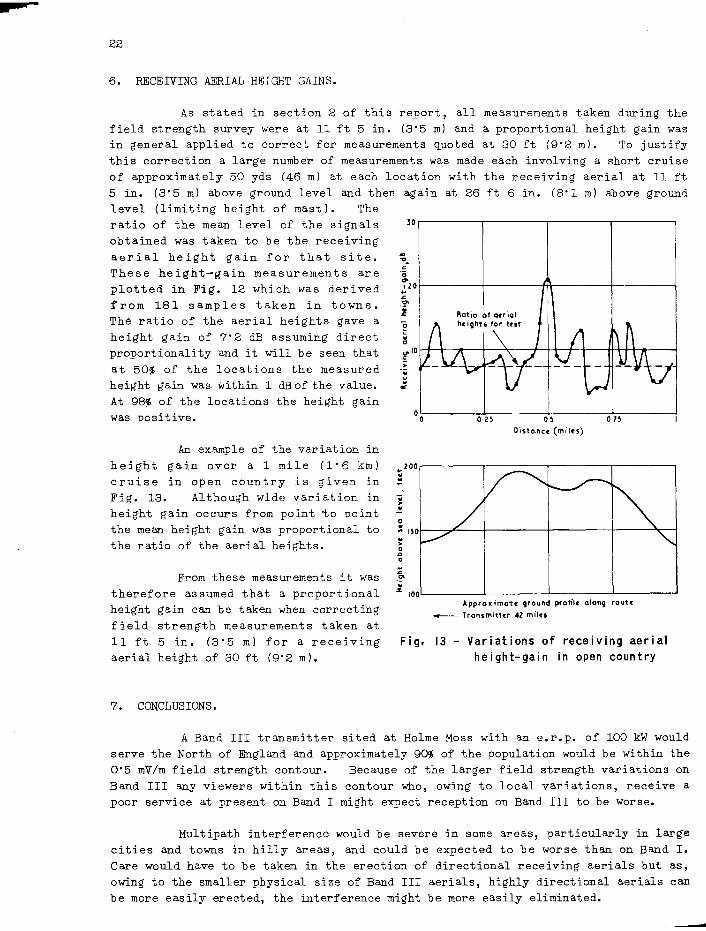
As stated in section 2 of this report, all measurements taken during the field strength survey were at 11 ft 5 in. (3'5 m) and a proportional height gain was in general applied to correct for measurements quoted at 30 ft (9'2 m). To justify this correction a large number of measurements was made each involving a short cruise of approximately 50 yds (46 m) at each location with the receiving aerial at 11 ft 5 in. (3' 5 m) above ground level and then again at 26 ft 6 in. (8'1 m) above ground level (limiting height of mast). The ratio of the mean level of the signals obtained was taken to be the receiving aerial height gain for that site. These height-gain measurements are plotted in Fig. 12 which was derived from 181 samples taken in towns. The ratio of the aerial heights gave a height gain of 7'2 dB assuming direct proportionality and it will be seen that at 50% of the locations the measured height gain was· within 1 dB of the value. At 98% of the locations the height gain was positive.
An example of the variation in height gain over a 1 mile (1'6 km) cruise in open country is given in Fig. 13. Although wide variation in height gain occurs from point to point the mean height gain was proportional to the ratio of the aerial heights.
From these measurements it was therefore assumed that a proportional height gain can be taken when correcting field strength measurements taken at 11 ft 5 in. (3'5 m) for a receiving aerial height of 30 ft (9'2 m).
7. CONCLUSIONS.
lO~------~---------r--------'-------~
... "V,
" (;
!2or--------+--------~--------~------__1 .I: go
i g :! "'IO~_+_.~~--~--_+_++-+-+_--~~~--__1
" > -.. ::
GC
°O~------~O~.2~S------~O~.S--------O~7~S------~
Distance Cmil .. )
~200r--------.---------r--------,---------, .. !
.. > o .0 o
.I:
.~ .. % IOO~-------J---------L--------~------~
Approx imat't ground profile: along ro",tc:
.......- Transmitter 42 miles
Fig. 13 - Variations of receiving aerial height-gain in open country
A Band III transmitter sited at Holme Moss with an e.r.p. of 100 kW would serve the North of England and approximately 90% of the population would be within the 0'5 mV/m field strength contour. Because of the larger field strength variations on Band III any viewers within this contour who, owing to local variations, receive a poor service at present on Band I might expect reception on Band III to be worse.
Multipath interference would be severe in some areas, particularly in large cities and towns in hilly areas, and c.ould be expected to be worse than on Band I. Care would have to be taken in the erection of directional receiving aerials but as, owing to the smaller physical size of Band III aerials, highly directional aerials can be more easily erected, the interference might be more easily eliminated.
.J
8. REFERENCES. 23
1. Research Department Report No. K-095 (1954/2). "The Service Area of the Holme Moss Transmitter".
2. Research Department Report No. K-086 (1952/4). "Investigation of Television Service from Holme Moss in Sheffield".
EGF Printed by B.B.C. Research Department, Kingsyood Tarren, Tadworth, Surrey