Embed Size (px)
Citation preview

FEMALE LABOR FORCE PARTICIPATION AND INFORMAL CARE OF ADULTS: EVIDENCE FOR A MIDDLE-INCOME COUNTRY
Autores: David Bravo y Esteban Puentes
Santiago, Abril de 2012
SDT 353

1
Female Labor Force Participation and Informal Care of Adults: Evidence for a
middle-income country1
April 2012
David Bravo - Esteban Puentes
1 We thank the comments of Jere Behrman, Antonio Trujillo, Claudia Piras and Andrea Betancor.
We appreciate the invaluable assistance of Alejandra Abufhele. We thank Comunidad Mujer for
allowing us to access the Voz de Mujer del Bicentenario database (2010). We also want to thank
the Gender and Diversity Unit of the Inter-American Development Bank for the financial support
for this research. Finally, we acknowledge the funding provided by the Iniciativa Científica
Milenio to the Centro de Microdatos, Project NS100041.
2
Abstract
The provision of elderly care is an issue of increasing importance in Latin American countries
because of a aging population, decrease in household size, and increased complexity of care.
Thus, it is important to analyze how the provision of informal care of other adults affects the
welfare of women since they are usually responsible for this type of care. We analyze in this
paper the relationship between providing informal care to adults and labor outcomes for a
middle-income country with a rapidly aging population. This is one of the first studies to focus
on middle-income countries and in Latin America. The results of this research show the
importance of considering the endogeneity that exists between informal care and female labor
participation. A partial correlation analysis shows a strong negative relationship between
providing care and labor participation, however, when we use methods for endogeneity
correction, the correlation does not hold. Additionally, we found that poor households are more
likely to be involved in care giving activities, and that the presence of a spouse reduces the
likelihood of provision of care.
JEL Codes: J22, J10, C26
Key Words: Female labor participation, informal caregivers, Home care
David Bravo
Centro de Microdatos.
Departament of Economics
Universidad de Chile
Esteban Puentes
Centro de Microdatos.
Department of Economics
Universidad de Chile

3
1. Introduction.
There has been increased attention in Chile and throughout Latin America on the aging
population. It was estimated that in 2010, 9.2% of the population in Chile would be older than
65, while in the rest of Latin America the average is 6.9%. Additionally, it is expected that by
2030, the population over 65 will reach a 17% of the population in Chile and 12.2% on average
for the rest Latin America (ECLAC, 2009). This aging population creates increased demands for
care of the elderly and chronically ill. Arriagada (2009) argues that there are several factors that
increase problems about care in Chile. Among them, increasing life expectancy of people with
chronic illness or disability increases the complexity of care, while at the same time, changes in
family structure, especially having fewer children, limits the availability of caregivers.
Results for Chile show that women assume the role of taking care of the elderly (SENAMA,
2010). In the 2009 "National Study of the Elderly,” 86% of caregivers are women, most of them
a daughter or a spouse. For these women the care of an elderly is an important burden, which
may have several effects. First, it decreases the chance of employment since only 25% of female
caregivers have a paid job. At the same time, only 8% of caregivers receive some monetary
compensation. Second, it has a negative impact on leisure; two thirds of these women have not
taken a vacation in five years. Third, it can have a negative impact on their pensions as their
work lives are interrupted. Finally, the care of others affects low-income households more
because they not have the option of paying for care2 increasing the loss of household income
with the female head of household leaving the labor market.
2 In general, households can pay for care in private institutions or with maids providing care at
home.

4
These figures show the importance of research related to the subject of informal care giving. We
analyzed the relationship between the care of others and the female labor supply. Despite its
importance, this is the one of the first studies that addresses this issue in a middle-income
country like Chile and for a Latin American country, with the exception of Trujillo et al. (2010),
which addressed the case of Mexico.3 The data provided by Voz de Mujer Survey for 2009
shows that 16% of women provide informal care for the care of the elderly, chronically ill, or
disabled living at home. Of women who do not provide such care, 64% are employed, 5% are
unemployed, and 31% are inactive. Comparatively, women who are these types of caregivers,
only 28% are employed and 9% are looking for work, while the remaining 63% are inactive.
Moreover, more than 50% of the women who provide informal care spend more than 20 hours a
week in this task.
The previous numbers show that there is a potential link between informal care and labor supply
decisions, however, it is necessary to consider the endogeneity of these variables. As mentioned
by Wolf and Soldo (1994), the decision to provide informal care might depend on the
opportunity cost of the potential care-givers’ time, given the hourly wage available. At the same
time, the hourly wage affects the employment decisions, thus informal care and labor supply are
simultaneously determined. Estimating the effect of informal care on employment using OLS or
a probit model will most likely lead to biased parameters. Several papers have dealt with this
issue using structural estimation and instrumental variables: however there is no definitive
evidence on the effect of informal care on employment after considering endogeneity. The work
of Wolf and Soldo (1994), Stern (1995), and Heitmueller (2007) show that when considering the 3 Most of the international evidence has been from the US, UK and recently Canada, China, and
a sample of European countries.
5
simultaneity of the two variables, the effect of caring for others on the labor supply can be very
small or zero. Other papers like Crespo (2007), Bloin et al. (2008), and Trujillo et al. (2010)
show that even after correcting for endogeneity, the care of others decreases the probability of
employment of women.
In this paper we consider the effects of informal care on labor market participation, employment,
and hours worked. We use two methods of correction of endogeneity: the first is a biprobit
estimation and the second is instrumental variables. The exclusion variables we use are the
number of daughters and sons in the home where the woman lived at age 15. These variables
affect the availability of caregivers for older adults, especially in the case of a woman’s parents.
We included them separately because, as mentioned before, women do the majority of informal
care giving. Thus we expect a higher effect from the presence of daughters than the presence of
brothers. Number of siblings has also been used by Wolf and Soldo (1994), Bolin et. al (2008),
and Trujillo et. al (2010).
Our results show that the negative relationship between the care of others and female labor
supply is not robust to different corrections of endogeneity. Additionally, the results show that
women living in households with lower incomes are more likely to provide informal care,
increasing their vulnerability, which can be addressed by specific public policies regarding the
care of others. Currently in Chile there is not a public health networks that welcomes adults who
are chronically ill or disabled. The only options are private industry.
The paper is divided into seven sections. The first is this introduction; the second presents a
summary of informal care provisions in Chile and relevant studies on the subject. The third part
is a theoretical model describing the care of others and female labor supply. The fourth part
presents the data used in the estimates. The fifth is the descriptive statistics. The sixth part shows

6
the results; and the seventh and last discusses the results and recommendations emerging from
this study.
2. Care of the elderly in Chile
The countries of Latin America and the Caribbean have experienced profound demographic
changes, particularly an aging population and decreased population growth. This is due to the
rapid decline in fertility and increased life expectancy (ECLAC, 2004).
As a result of its ageing population, Chilean society is showing signs of a transformation in the
care of elderly, chronically ill, and disabled. It is very important to understand the needs of this
population in order to generate social policies that aim to provide solutions especially for the
most vulnerable families.
Recently the "National Study for the Elderly" (SENAMA, 2010) showed that 24.1% of people
over 60 are dependent in some degree.4 Of the population, 12.4% present severe dependence
(individuals prostrate, with dementia of any degree, and/or unable to perform basic activities of
daily living), 5% are moderately dependent (individuals who have an inability to take a bath on
their own and need help with the basic activities of daily living), and 6.6% are mildly dependent
(sometimes requires assistance for basic activities of daily living). The majority of this dependant
population is female (66% of total dependents are female).
4 The definition of dependency used in the survey was analyzed through the functionality of the
person and the amount, type, and level of outside help. The two components of this definition are
the functional limitations and the need for help to address these limitations. The functionality of
the individual was measured through self-reported functional limitation. Functional limitation
and degree of severity was defined according to criteria based on number and type of difficulty
or inability to perform certain activities of daily living.

7
Moreover, this study shows that the dependence is closely related to the education of the person,
where more dependent individuals have fewer years of schooling. In terms of income, nearly
65% of dependent elderly adults earn less than US $260 a month. More importantly, of all people
older than 60, 85.3% live with someone and, for people with severe dependence, this percentage
is 92.1%. The survey shows that in 36.1% of cases, caregivers of older adults are daughters or
sons, 27.9% are spouses, and 13.3% of caregivers are sons or daughters in law. The remaining
cases are other family members, other non-family, or maids. About 86% of these caregivers are
women.
The provision of care it is mostly unpaid, only an 8% of caregivers receive a monetary
compensation; there are several costs associated with providing informal care, especially for
women. For instance, only 24.8% of female caregivers perform any paid work in addition to their
care work. It seems fair to assume that many of these women, in addition to providing care for
dependent adults, perform other domestic duties, however this care takes more than 12 hours per
day.
These results show that it is mainly women who take care of the elderly, chronically ill, and
disabled in Chile. Because of this, one might infer that it directly affects labor participation and
work performance of women. However, there is no empirical evidence in Chile or for most Latin
American countries, which could explain the effects of elderly care on labor force participation.
For the case of Chile, only the work of Contreras and Ruiz-Tagle (2008) finds that the presence
of disabled persons in the home decreases the likelihood that others in the household work. The
effect is greater on women, suggesting that there is a negative correlation between caring for
others and participation in the labor market.

8
Internationally, the evidence for the effect of informal care on labor outcomes of women is
mixed. Lilly et al. (2010) and Bolin et al. (2008) find that informal care negatively affects labor
outcomes of women in the case of Canada and 11 European countries, respectively. Heitmuller
(2007) finds for the UK that co-residential care tends to decrease employment, however extra-
residential care is not related to employment. At the same time, Leigh (2010), shows that
informal care has very small or non-existent effect on employment of women in Australia.
Finally, Maurer-Fazio et al. (2011) shows that the presence of people aged 75 or older increases
labor force participation of married women in China. All these papers correct for the endogeneity
of informal care and labor outcomes, with the exception of Lilly et al. The endogenity correction
uses several instrumental variables, for instance: number of sick or disabled people in a
household, the age of the respondent’s three closest friends (Heitmuller, 2007); parental age and
health (Crespo, 2007 and Boiln et. al, 2008); number of siblings (Crespo, 2007 and Trujillo et al.,
2011); and presence of parents (Trujillo et al., 2011). Lastly, Leigh (2010) uses a panel of
individuals to correct for individual heterogeneity and endogeneity.
3. Methodology.
3.1 Equations.
We use a simultaneous model to identify the effect of informal care of the elderly, chronically ill,
or disabled on female labor force participation. We write a simple model that describes both
decisions. The equations are:
€
D* = F Xβ +Cδ +ε( ) (1)C* = G Xλ+ Zγ +η( ) (2)

9
A woman decides to enter into the labor market (D=1) and she decides to provide informal care
(C = 1) if:
€
D = 1 D* > 0( )C = 1 C* > 0( )
The X variables affect the decision to participate and the decision to provide care simultaneously.
The Z variables correspond to the exclusion variables that only affect the provision of care and
identify the model. The effect of care on labor force participation is given by
€
δ .
This theoretical model is consistent with the Becker model of resource allocation at home
(1965). In his model household utility depends on consumption of commodities, such as caring
for others. These commodities require time of household members and resources that can be
purchased on the market. According to the model, households can produce care of others using
different inputs, one is buying care in the market (using nurses or maids), and the other is
producing care with time of household members. It therefore presents a dilemma between
allocating time to work, which allows you to buy care in the market, and allocating that time
directly to care. As mentioned by Wolf and Soldo (1994), there is a complex bargaining process
that includes spouses and siblings to determine how parental care will be provided. At the same
time, parents themselves could behave strategically. A model that would capture all the
complexities of parental care is beyond the scope of our research.
According to the model equations (1) and (2), provision of care directly affects the probability of
women participating in the labor market, and if the error terms of equations are correlated, then
there is an endogeneity problem that must be considered when estimating both equations. The
error terms can measure preferences for work and for the provision of informal care, as well as
skills in both sectors. For example, women with lower labor skills have a lower chance of being
employed, but also have lower opportunity costs of caring for another adult (Trujillo et al. 2010).

10
This generates endogeneity in care and employment and if we do not consider that endogeneity
problem in our estimation method, we will have biased estimates of
€
δ .
Angrist (2001) and Carrasco (2001) show that the endogeneity problem can be corrected using a
biprobit estimation, where the first equation attempts to explain the participation decision with
one of the explanatory variables being the care of others, the second equation of the biprobit
corresponds to the decision to care for another adult. We call this method biprobit or structural
estimation.
Angrist (2001) argues that a two stage least squared would be informative on the effect of caring
for others and on labor market participation; we also use it to correct endogeneity. We call this
method instrumental variables.
The effect of informal care on participation or employment can be positive or negative.
Providing care for others can increase labor participation if additional resources are needed to
fund this care; however, providing care for other can also negatively impact labor opportunities
if care is intensive in the use of a woman’s time. In that case, a woman may choose not work or
search for jobs with high degrees of flexibility. We study the correlation between the provision
of care and labor force participation and employment.
Additionally, we perform sensitivity analysis using Ordered Probit and Tobit models. In the case
of the Ordered Probit model, we want to analyze if informal care affects the decision between
part-time work and full-time work instead of the working vs. not-working decision. Thus we
decided to create categories that divide the decisions into: not working, working part-time,
working full time, and working overtime. The four categories are defined as: the first one is
working zero hours weekly, the second one is for women working more than zero and less than
30 hours a week a week, the third is women working between 30 and 48 hours a week, and the

11
fourth category is women working more than 48 hours a week. Finally, we consider a truncated
model to analyze if there is an effect on hours worked last week, without imposing the categories
of part-time, full time, and overtime.
3.2 Exclusion Variables.
The identification of the model requires the existence of exclusion variables affecting the
decision to care for an adult, but not the participation in the labor market. The previous literature
has used variables with parental data such as education, health status, and their simple existence.
The number of daughters and sons have also been considered as an exclusion variable. These
variables attempt to measure the relative demand for informal care that women and, in the case
of number of daughters and sons, other available caregivers face. Additionally, the sickest
parents can more greatly affect the availability of women's time. Since there is not always health
information for parents, education of parents is used as a proxy variable. The number of
daughters and sons could decrease the demands of time and care from sick parents for any one
individual since these demands can be distributed among more individuals. The existence of
parents is an important indicator of demand for informal care, since deceased parents obviously
do not demand any care.
However, parental education variables have been criticized as exclusion variables since parental
education affects the conditions in the home where women grew up, for example, more educated
parents spend more resources in the formation of human capital of their daughters, increasing the
likelihood that they participate in the labor market. A similar criticism has been made for health
of parents and the presence of parents in the home where women grew up. All these variables
could affect the formation of women's human capital (Trujillo et al 2010). Additionally, Lilly et

12
al. (2010) discuss that most instruments are either weak or do not pass endogeneity tests, which
leads them to estimate a model without correcting for endogeneity.
We use two exclusion variables in this paper: the number of sisters and the number of brothers of
the respondents.5 These variables affect the amount of time women need to devote to care of
their parents since the responsibilities can be distributed among the whole sibship. Moreover
since women are the principal caregivers of adults, we expect that the number of sisters has a
negative effect on informal care, but we expect a smaller effect for the number of brothers. Van
Houtven and Norton (2004) use the number of siblings as an instrument for studying the use of
formal care and Trujillo et al. (2010) also include number of siblings on the set of exclusion
variables, but they do not distinguish between sisters and brothers.
Arguably, the number of sisters and brothers may also affect the formation of women's human
capital; however, we include in the participation equation variables that adequately measure the
socioeconomic conditions of the childhood home. This implies that number of brothers and
sister will impact the participation decision only through informal care. The variables measuring
socio-economic conditions of the childhood home are: parental education, parental presence, and
employment information from parents previous to the woman turning 15.
3.3 Estimation methodology.
To study the effect of endogeneity in the estimation of equations (1) and (2) we follow several
steps. First, we estimate probit and linear probability models on decisions to participate in the
labor market and be employed, but not including the provision of care in the estimation of labor
variables. This allows us analyze the behavior of the estimates when attempting to control for the
endogeneity problem. 5 There is no information about presence of parents or health of parents in the survey.

13
Second, we estimate participation and employment models including information on the care of
others. These equations will give us a biased parameter of the effect of caring for others on the
labor variables, but allow us to analyze the changes that occur in the parameters when we include
a potentially endogenous variable.
Third, we analyze the relevance of the exclusion variables. Unfortunately, traditional statistical
test of weak instruments are not strictly appropriate for models with discrete independent
variables, but they still may be informative. Additionally, the structural model test does not
require us to test for weak instruments, they rely only on the statistical significance of the
exclusion variable. We also test for endogeneity using the Hausman test.
Fourth, we estimate models that correct for endogeneity and analyze the effects of this correction
on the estimates.
Fifth, for the Ordered Probit and Tobit models, we also include a correction for endogeneity in
the decision of informal care. For the Ordered Probit we estimate two models: first we assume
normality in the error terms and use likelihood estimation and second we estimate the Ordered
Probit model using 2SLS. For the Tobit model we assume normality of the error terms and
estimate only using maximum likelihood.6
4. Data.
The data used are provided by Comunidad Mujer and its survey Voz de Mujer. The target
population for this survey is women living in urban areas in all regions of the country. We use
information from 2,992 women between 18 and 65 years old. There is also information from all
members of their households, thus we have a total of data for 11,618 people. The great advantage
6 Maximum likelihood models were estimated using de CMP command in STATA.

14
of this survey is that only women are interviewed, increasing the quality of the information
contained.7
The selection of the women interviewed was conducted through a multistage probability
sampling design, stratified geographically and by population size. Fieldwork was conducted
between September and November 2009.
We did not include in our estimates women belonging to individual households, i.e. living
alone.8 We also only considered women between 25 and 59 years old, since most women bellow
25 may be in college, not the workforce, and the retirement age for women in Chile is 60 years
old.
Additionally, there some variables that are not available for all observations. This is the case for
educational variables. Of the 2,132 women interviewed, 2,076 reported her educational level, we
decided to estimate our model only considering women that reported their educational level;
however, when women do not report information on other variables, we use a dummy variable to
indicate missing information. It is noteworthy that for all the analysis, the corresponding
weighting factor is used.9
The questionnaire collects information about job access, working conditions, and the process of
determining work/life balance. The survey is structured in 12 thematic modules, which contain
7 Unlike traditional surveys of households where one member of the household can respond for
all household members where the information about women can have a measurement error.
8 We excluded women living alone because they do not face the decision to provide care for
somebody in the household.
9 The weighting factor considers post stratification of the sample by geographical sectors, age,
and sex. It also considers refusal to the survey.
15
extensive and varied information on the work and family situation of women. The first four
modules are applied to all household members (household composition, education, work status,
and household income) and the following 8 modules collect information only about the women
interviewed (current employment status, working conditions, training and employment, family
care, home finance, distribution and roles within the household, individual history, health and
perception, and opinions about social programs).
Specifically, in Module C: Employment Situation, the questions are about the employment
situation of each household member (employed, unemployed, number of hours, under contract,
fees, etc.). To measure labor force participation, the questions we use in this paper are:
• "Last week, did you work at least an hour regardless of your household chores?"
• "Although you did not work last week, did you carry out any activity for wages or
remuneration, in your company, to a relative without receiving payment or money, as an
apprentice or making a practice?"
• "Although you did not worked last week, did you have job from which you were temporarily
absent because of a strike, illness, vacation or other reasons?"
A woman is considered employed if she answered yes to any of these questions. She was
considered unemployed if she was looking for a job during the past four weeks. A woman
participates in the labor market if she is working or looking for work.
In Module H: Family care, the woman was asked about the care of children or adults. The
relevant question was:
• "Are you responsible for the care of children (who are not your children), elderly, chronically
ill or disabled people living in your home?"

16
In she answered yes, the woman specified whether the care was of a minor, an elder, someone
disabled, or chronically ill. Unfortunately, there is no information on the relationship with the
person they are responsible for; so we do not know if the care is for a parent or a spouse,
however the evidence we provide in Section 6 suggests that most of the informal care is to
parents. We also do not have information on whether they receive any monetary compensation.
However, as discussed earlier, the evidence for Chile indicates that most of this type of care is
unpaid. One of the advantages of this question is that we can consider the care of children
separately from other types of care. Other questions followed, which were about how this care
affects employment opportunities of women and job performance.
5. Descriptive Statistics.
The Voz de Mujer survey allows us to describe women and their households in terms of their
socioeconomic characteristics. In this section we present the main characteristics of women in
the sample.
The survey includes a special section related to the care that women provide, asking about care
provided for someone else’s children, the elderly, chronically ill, or disabled. This provision
takes at place at the woman’s home. In Table 1, we see that 16% of women provide this type of
care; 5.9% are caring for children who are not theirs, 5.4% for the elderly, 3.3% chronically ill,
and 1.7% disabled.
Table 2 shows the interaction between labor participation and provision of care, 70% of women
who do not provide care participate in the labor market, while for women who do provide care
for adults, the percentage is 57.3%. These figures show that there is a negative correlation
between the care of others and labor participation.

17
Table 3 shows that providing caring can dominate a woman’s day; over 50% of respondents
mentioned that they devote more than 20 hours a week caring for others.
Finally, table 4 shows that more than 50% of women who provide care mentioned health
problems associated with this care, particularly stress and depression.
5.1 Variables used in the econometric estimation.
We include dummy regional variables due to variations in relative prices in labor market
conditions. The regional dummies divide Chile into four areas: the Northern Regions I, II, III, IV
and XV; the Central zone, Regions V, VI, and VII; the Southern area which includes Regions
VIII, IX, X, XI, XII, and XIV; and finally the Metropolitan Region (RM).
We also consider household composition variables: a dummy variable indicating if the woman
has a partner (married or cohabiting) and one for the number of children in the household under
15. Additionally, we include other household income per capita, which is measured in hundreds
of thousands of Chilean pesos.10 Other household income includes all household income,
excluding the woman’s income. Then we divide the other household income by the number of
people in the household. In addition, we include variables related to the home where the women
lived when they were 15. These variables are: presence of the biological mother and father,
number of daughters and sons, and level of education achieved by parents of the respondent. We
did not include the respondent’s perceptions about her health because, as shown in Table 4, 50%
of women mentioned that their health is affected by caring for another person, which makes
health an endogenous variable.
Table 5 shows that for the sample we used in the estimations, labor participation is 67% and the
employment rate reached 60%. Since we are interested in analyzing the care of adults and not
10 The exchange rate in November 2009 was 508 pesos per U.S. dollar.

18
children, we separate these two types of cases. In Table 6 we can see that 37% of women
providing care for children who are not theirs participate in the labor market, whereas 57% of
women providing care for adults participate in the labor market. This result shows that the issue
of child-care should be studied in depth given its potentially large negative effect on participation
and employment. Table 7 shows that women that participate in the labor market have higher
educational levels, are younger and are less involve in caregiving activities than women that do
not particpatate.
We include in our estimations a measure of gender role attitudes, which as found by Vella, 1994
and Farré and Vella, 2007 could affect employment decision of women. We also investigate if
these attitudes affect informal care. The survey included a special module to capture women's
perceptions about the relationship among women, work, and family. From these questions we
constructed an index of gender roles or attitudes; this indicator reflects the difference in
perceptions and attitudes of women in relation to gender roles.
Questions about gender roles in the Voz de Mujer Survey are divided into three types. The first
type is on the role of women in life, and the statements that women have to evaluate are: "A
woman should earn a wage and care for her family," "A working mother can have a relationship
as solid and affectionate with their children as a woman who does not work," and "The
dedication of the father are equally important for cognitive and emotional development of their
children.” For each of these statements, women have to respond if they strongly agree, agree,
neither agree nor disagree, disagree, or strongly disagree. We considered a woman to have a
traditional view if she answered neither agree nor disagree, disagree, or strongly disagree to the
statements. Otherwise a woman was considered as having a modern view.

19
The second group of questions is related to household chores that the woman would relegate to
her daughters and sons. The chores are: food preparation; washing, ironing, or cleaning; and
minor home repairs. We considered a woman with a traditional view if she chooses only sons or
only daughters to do one of the chores, irrespective of the chore.
The third type corresponds to the compatibility between working and being married. The
relevant question set is: “Would you agree that your daughter, when she is married (or with a
partner), should work in the following cases: With no children, with children in preschool,
school age children, with children of school age.” A woman was coded with a traditional view if
she answered that her daughter shouldn’t work.
Table 8 shows that women who participate in the labor market tend to be less conservative or
traditional than women who do not work. At the same time, women who do not work
differentiate the tasks entrusted to their sons versus their daughters. The vast majority of women
believe that a woman can work if she does not have children or if children have graduated from
school. Additionally, women believe that the dedication of both the father and mother are
equally important for the development of children.
In the case of attitudes 1, 2, 5, and 6 there are important differences between the responses of
women who participate and do not participate in the labor market. Working women are more
likely to agree that women with children in preschool and school can work and also can maintain
just as solid and loving relationship with their children as women who do not work.
In terms of the tasks they assign to their male children and female children, it appears that those
involved in the labor market are less likely to assign chores based on sex.
We conduct the same analysis but based on whether or not the woman provides care for another
adult. The results are less evident. From Table 8, it can be observed that in the case of questions
20
7, 8 and 9, women who care for adults are more traditional in their views of gender roles,
however, the opposite is found for attitudes 2, 5, and 11. Thus the relationship between
traditional attitudes and informal care is not clear.
From these 11 variables we generate an index of role perception, which is the sum of all binary
variables; the index that can take any integer value between 0 and 11.11
6. Estimates.
6.1. Main equations.
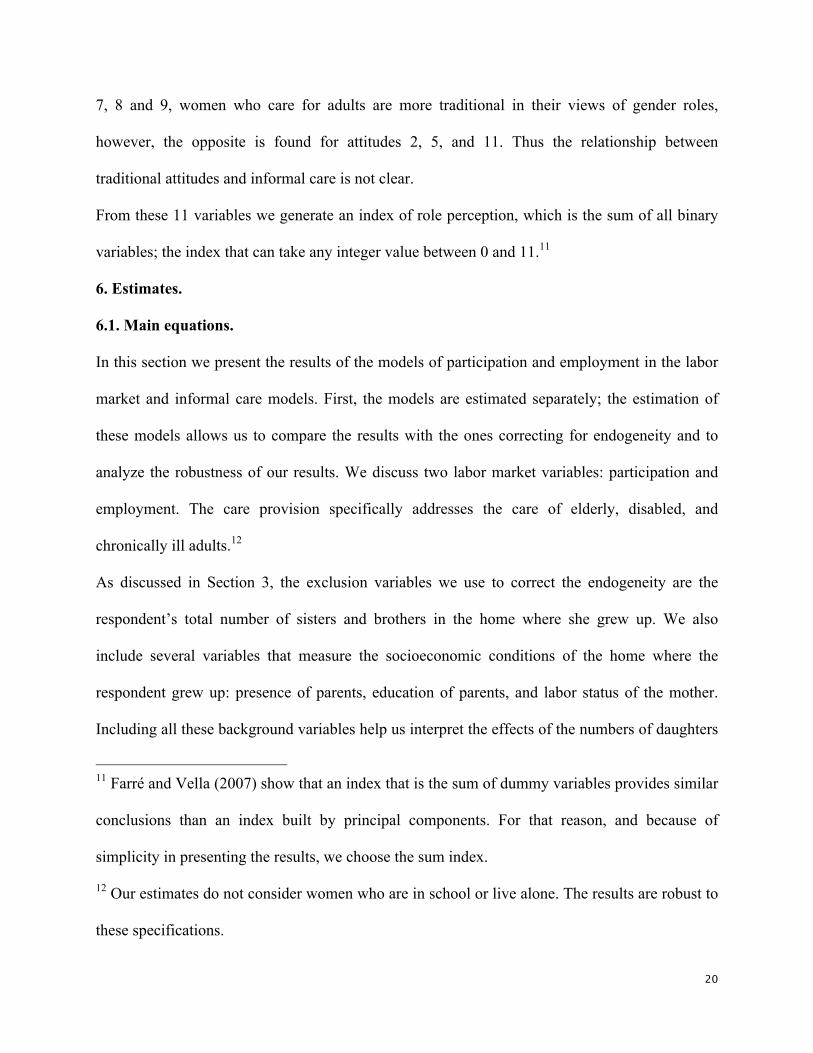
In this section we present the results of the models of participation and employment in the labor
market and informal care models. First, the models are estimated separately; the estimation of
these models allows us to compare the results with the ones correcting for endogeneity and to
analyze the robustness of our results. We discuss two labor market variables: participation and
employment. The care provision specifically addresses the care of elderly, disabled, and
chronically ill adults.12
As discussed in Section 3, the exclusion variables we use to correct the endogeneity are the
respondent’s total number of sisters and brothers in the home where she grew up. We also
include several variables that measure the socioeconomic conditions of the home where the
respondent grew up: presence of parents, education of parents, and labor status of the mother.
Including all these background variables help us interpret the effects of the numbers of daughters
11 Farré and Vella (2007) show that an index that is the sum of dummy variables provides similar
conclusions than an index built by principal components. For that reason, and because of
simplicity in presenting the results, we choose the sum index.
12 Our estimates do not consider women who are in school or live alone. The results are robust to
these specifications.

21
and sons as availability of caregivers and not as an indirect measure of socio-economic
conditions of the childhood home.
Table 9 shows the results for participation, employment, and provision of care. The results show
that more educated woman are more likely to participate in the labor market and to be employed.
The number of children under 15 decreases the probability of participating and being employed.
This result indicates that women are providing in-home care, which could significantly affect
their choices of work.
Having a partner also decreases the probability of participating in the labor market and of being
employed. This may occur because of role division, where women are involved in domestic work
and men in paid work. At the same time, we also find that women with more traditional
behaviors and perceptions are less likely to participate in the labor market. Similar results are
found by Farre and Vella (2007) for the U.S. and Contreras and Plaza (2010) for Chile. One
important issue when using a variable that measures gender roles attitudes is the potential
endogeneity between labor participation and attitudes. However, a recent paper by Puentes and
Ruiz-Tagle (2011) shows that there is not evidence of endogeneity between participation and
roles. Thus our estimates should not be biased because of that potential endogeneity.
Participation and employment move concave with age, indicating that women’s work cycle
peaks around age 34.13 The mother's education level positively affects participation and
employment, but only when the mother has a college education. This result suggests that the use
of variables of parental education may be a poor variable exclusion, since it is highly correlated
with participation and employment. In the participation and employment models, the exclusion 13 The peak at 34 is a mix of age and cohort effect. Only the use of longitudinal data can provide
a better understanding of both effects.

22
variables are not correlated with the probability of participating in the labor market or being
employed.
In the case of the equation of care provision, there is a concave relationship between age and
informal care, while having a partner reduces the likelihood of care giving. This result suggests
that women are not taking care of their spouses, but probably their parents. We also found that
women living in households with lower incomes are more likely to provide informal care,
suggesting that the care giving activities can be paid if the household has sufficient means.
Finally, the variable of number of sisters is negatively correlated with the provision of care,
while number of brothers is not, which suggests that a greater supply of caregivers decreases the
likelihood of care provision by women and that informal care is provided by women. It is also
consistent with the concept is that they are taking care of parents, not spouses.
Table 10 shows estimates of participation and employment and care, but using OLS. The results
are similar to those mentioned above.
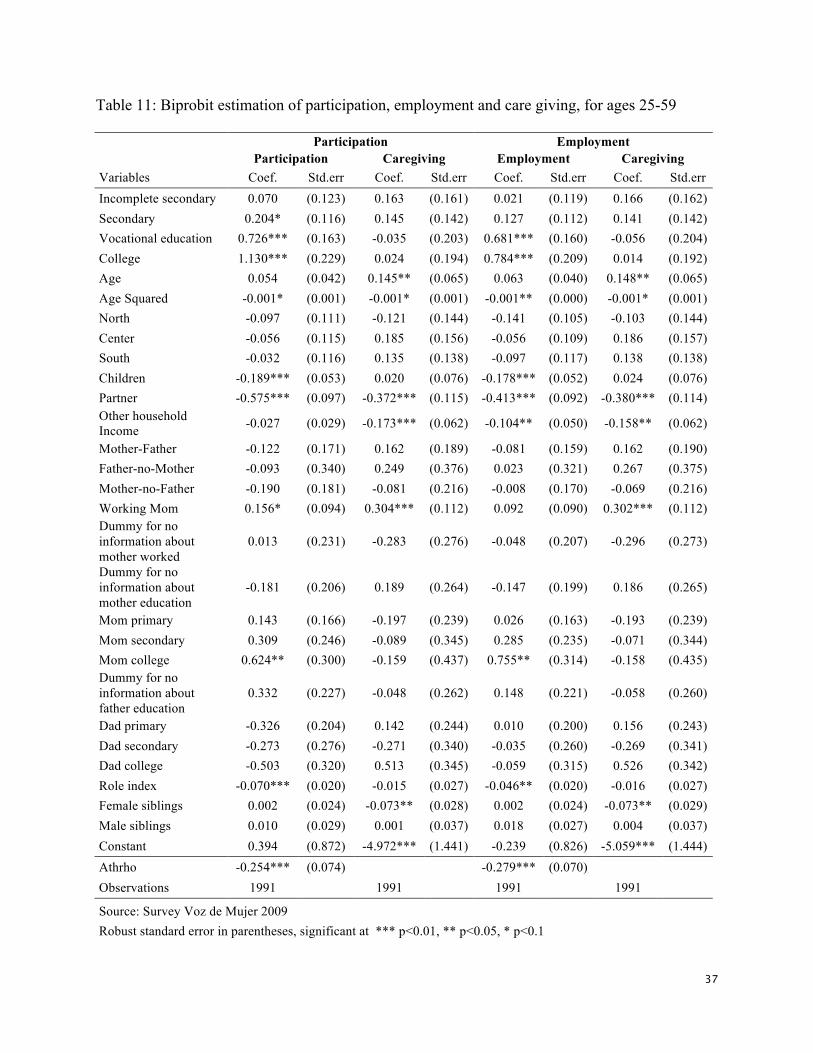
Table 11 shows two biprobit models, one for the decision to participate and another to be
employed. Each of these variables of labor supply is estimated jointly with the decision to
provide care. These models are only illustrative and do not analyze the effect of care giving on
work decisions. Estimates show that the number of sisters is negatively correlated with care. The
biprobit model results are similar to the results of the univariate estimates, showing that the
specifications are highly robust to the estimation methodology used.
Table 12 and Table 13 show the probit and OLS estimates for participation and employment,
which includes the care giving decision as independent variables, but there is no control for
endogeneity of this variable. The results show that there is a negative correlation between both
variables, in particular care giving decreases the probability of labor market participation by 16%

23
and decrease the probability of being employed by 20%. The results of these estimates show that
provision of care could have an effect on labor force participation similar to having three
children under the age of 15. This may indicate that the burden of caring responsibilities to a
third party may be as important as the care of their own children.
The inclusion of care giving activities does not change the significance of the remaining
variables in probit or linear probability model.
Table 14 and Table 15 show the models that attempt to correct the endogeneity between
participation/employment and informal care. We used a structural model and an instrumental
variable approach. Table 10 shows the first stage of the Two Stage Least Squared method. The
results of the estimation show that informal care has no relationship with labor outcomes when
we correct for endogeneity. Similar results are found by Wolf and Soldo (1994), Heitmueller
(2007) for extra-residential care, and Leigh (2010), which highlights the importance of taking
endogeneity into account when estimating these models.
The main concern with the correction is whether the exclusion variables have enough variation to
properly identify the effect of informal care on labor outcomes. In the case of the biprobit models
we observe that the number of sisters is significant at a 5% level. The fact that number of
brothers is not significant does not affect the identification strategy, since it was expected that
informal care was carried out mostly by women. Moreover, the result of number of brothers
adds evidence that number of sisters can be interpreted as a measure of caregiving availability. 14
14 Additionally we observe that the correlation coefficient is significant at the 10% level in the
case of the participation model, which is evidence in favor of the endogeneity model. For the
employment model, the correlation coefficient is not significant, however likelihood models
based upon normality assumptions have difficulties estimating correlation coefficients.

24
In the case of the linear estimation, we use the Durbin-Hausman-Wu test of endogeneity and the
F-test to identify endogeneity and weak instruments, respectively. However, given the discrete
nature of the explanatory variable, it is important to note that these test are not strictly
appropriate, but nevertheless suggestive. The Durbin-Hausman-Wu test indicates the presence of
endogeneity in the informal care variable and Table 18 reports the F-Test for both parameters,
number of sisters and number of brothers, is 2.67, which implies that those variables are weak
instruments. This result suggests that more exclusion variables are needed to properly identify
the causal effect of informal care on labor force participation or employment, however the results
in Table 14 suggest that the apparently negative impact of informal care on labor outcomes is not
robust to endogeneity correction models.
The result that providing informal care does not affect female labor supply can happen if women
have the flexibility to both work and care for another adult. As described by Wolf and Soldo
(1994), women dedicate more hours to domestic work than men and have to simultaneously
coordinate employment, informal care, and household work. Additionally, we can expect that
low-skilled women who have difficulty finding a job, or those who decide to retire tend to
provide informal care. Then there is no causality of informal care on employment, and informal
care basically reflects employability problems (Heitmueller, 2007).
It is important to note that the rest of the explanatory variables maintain their significance and
magnitude over the model without correction, suggesting that the change in the sign and
statistical significance of care provision are the results of the simultaneous correction.
6.2 Robustness.
In this section we analyze two additional models for labor market outcomes. First we divide the
employment decision into four different categories, giving more flexibility to the model since we

25
do not divide the sample between working and non-working women, but also add data for part-
time, full-time, and overtime work. The four categories we define are: women working zero
hours a week, women working between 1 and 29 hours a week, women working between 30 and
48 hours a week, and women working more than 48 hours a week. We estimate this model using
2SLS and IV-Oprobit model, assuming joint normality of the error terms.
Finally, we consider a truncated model to analyze if there is an effect on hours worked in the past
week, without imposing categories of part-time, full time, and overtime. We estimate this model
using an IV-Tobit approach assuming again joint normality of the error terms.
Table 16 shows that informal care does not affect the different categories of hours worked and,
again, the number of sisters negatively affects the probability of informal care, while the number
of brothers is not statistically significant. In the equation of hours of work, the rest of the
variables have a similar relationship with hours of work: more educated women tend to work
more, women that live with a partner or spouse tend to work less, and a higher attitude index is
also negatively correlated with working longer hours.
Table 18 shows the OLS results for the same model of categories of hours of work, also finding
no relationship between informal care and hours of work.
In Table 17 we can observe the IV-Tobit model that again shows no relationship between
informal care and hours of work measured continuously. The model shows that more educated
women work more and that higher other household income tends to decrease hours of work.
Additionally, the index of attitudes shows that women with traditional views tend to participate
less in the labor market and when they do, they tend to work shorter hours.
The results of the robustness analysis confirm the previous findings that, once correcting for
endogeneity, there is not a relationship between informal care and hours of work, and show the

26
importance of explicitly considering the relationship between care provision and work behavior
of women.
7. Conclusions and Implications.
The population of Latin American countries, including Chile, is rapidly aging. This will have
several effects on health, public finance, and the labor market. We study informal care and its
effect on women’s employment decisions and find evidence that informal care does not affect the
decision to work or hours of work. These results indicate, as suggested by Heitmuller (2007) and
Leigh (2010), that women who provide informal care have low levels of employability or low
attachment to labor force, if so, the correct policy should focus on improving the human capital
of informal providers.
Our estimates show the importance of correcting for endogenity, since we find a negative
correlation between informal care and labor outcomes; however, this relationship is not robust
when we use endogeneity correction methods.
The results show that number of sisters is negatively related to informal care, but number of
brothers does not have any relationship with informal care. Additionally, we find that women
are more likely to provide care for an adult and that if a woman has a partner, she is less likely to
provide care. Along with the result that number of sisters decreases informal care, this indicates
that adult care giving is of parents and not spouses.
Further research should focus on the intensity of informal care on labor, separately considering
the care provided to parents and spouses. Additionally, it is important to analyze the effect of
informal care on the health of the caregivers, as discussed in our paper, women who provide
informal care tend to have high levels of stress,. Since this affects mostly to low income
households, it may increase their vulnerability.

27
References
Angrist, J. (2001). "Estimation of Limited Dependent Variable Models With Dummy
Endogenous regressors." Journal of Business and Economic Statistics. January 1, 19 (1): 2-28.
Arriagada, I. (2009) "The Care Crisis in Chile" CEM-Chile project and INSTRAW "Building
Networks: Latin American Women in global care chains."
Becker, G. (1965): "A Theory of the Allocation of Time." Gary S. Becker. The Economic
Journal, Vol 75, No. 299. pp. 493-517.
Bolin, K., Lindgren, B. and Lundborg, P (2008): “Your next of kin or your own career? Caring
and working among the 50+ of Europe”. Journal of Health Economics, 27, 718-738.
Carrasco, R. (2001). "Binary Choice with Binary Endogenous regressors in Panel Data: The
Effect of Fertility on Female Labour Force Participation", Journal of Business and Economics
Statistics, 19 (4), 385-394.
Comunidad Mujer (2010): Encuesta Voz de Mujer.
Contreras, D. and G. Plaza (2010): "Cultural Factors in Women's Labor Force Participation in
Chile." Feminist Economics 16 (2), 27-46.
Contreras, D. and J. Ruiz-Tagle (2008): "Socio-Economic Impact of Disability in Chile."
Mimeo.
Crespo, L. (2007): “Caring for parents and employment status of European mid-life women”
CEMFI Working Paper, No 0615.
ECLAC (2004): Social Panorama of Latin America.
ECLAC (2009): Population Projection. Latin America and the Caribbean Demographic
Observatory. Year IV, Number 7.

28
Farré, L. and F. Vella, (2007). "The Intergenerational Transmission of Gender Role Attitudes
and Its Implications for Female Labor Force Participation," IZA Discussion Papers 2802.
Heitmueller, A. (2007). "The Chicken or the Egg? Endogeneity in Labour market participation of
informal carers in England. "Journal of Health Economics 26 (3): 536-59.
Leigh, A. (2010): “Informal care and labor market participation.” Labour Economics 17: 140-
149.
Lilly, M.B., Larporte, A. and Coyte P.C: (2010): “Do they care too much to work? The influence
of caregiving intensity on the labor force participation of unpaid caregivers in Canada”. Journal
of Health Economics, 29, 895-903.
National Senior Service, SENAMA (2009): "National Study of the Elderly Unit."
Puentes, E and Ruiz-Tagle, J (2011): “Female labor participation and the distribution of gender
roles within the household”. Mimeo
Stern, S. (1995). "Estimating family long-term care Decisions in the Presence of endogenous
child characteristics." Journal of Human Resources 30 (3): 551-580.
Trujillo, AJ, TA Mroz, C. Piras, N. Tran, and L. Steinhardt. (2010) "Parent` s health, informal
care and female labor force participation in Mexico. " Draft Manuscript.
Van Houtven, C. and EC Norton (2005): "Informal care and health care use of Other adults."
Journal of Health Economics 23 (6): 1159-80.
Wolf, DA and BJ Soldo (1994). "Married women's allocation of time to employment screening
and care of elderly parents." Journal of Human Resources 29 (4): 1259-1276.

29
Annexes
Table 1: Care giving by Type of Care for ages 25-59
Care giving %
Yes, children without considering her children 5.92
Yes, elderly 5.39
Yes, chronically ill 3.28
Yes, disabled 1.69
No 83.72
Total 100.0
Observations 2132
Source: Survey Voz de Mujer 2009
Table 2: Care giving and Labor Participation for ages 25-59
Labor Participation
Care Giving Yes No Total
Yes, children without considering her children 36.52 63.48 100,0
Yes, informal care on adults 57.25 42.75 100,0
No 69.91 30.09 100,0
Total 66.62 33.38 100,0
Observations 1359 773 2132
Source: Survey Voz de Mujer 2009

30
Table 3: How many hours a week dedicated to the care of these people?15
Hours per week
(N=195) %
Less than 2 4.51
Between 2 and 5 17.48
Between 5 and 10 14.04
Between 10 and 20 9.49
Over 20 54.15
Total 100.0
Source: Survey Voz de Mujer 2009
Table 4: What feeling is caused by care giving activities?17
Feeling
(N=195) %
Depression 18.66
Stress 20.53
Rage 4.75
Impotence 7.54
No Feeling 38.93
Other health problems 9.26
Total 100.0
Source: Survey Voz de Mujer 2009
15 For people taking care of a third and between ages 25-59

31
Table 5: Descriptive Statistics, for ages 25-59.
Variables Mean Std. Dev Description N Dependent Variables Participation 0.67 - 1 participates in the labor market; 0 otherwise. 2133 Employment 0.60 - 1 employed; 0 otherwise. 2133 Hours 21.69 22.33 Hours worked weekly. 2133 Independent Variables Primary 0.20 - 1 primary education or less; 0 otherwise. 2076 Incomplete secondary 0.17 - 1 incomplete secondary education; 0 otherwise. 2076 Secondary 0.36 - 1 complete secondary education; 0 otherwise. 2076 Vocational education 0.12 - 1vocational training; 0 otherwise. 2076 College 0.16 - 1 has college education; 0 otherwise. 2076 Age 41.82 9.50 Age. 2133 North 0.12 - 1 lives in the north; 0 en otherwise. 2133 Center 0.19 - 1 lives in the central region; 0 otherwise. 2133 South 0.24 - 1 lives in the south; 0 otherwise. 2133 Metropolitan Region 0.45 - 1 lives in the metropolitan region; 0 otherwise. 2133 Children 0.79 0.93 Number of children less than 15 years old. 2133 Partner 0.63 - 1 has a spouse or partner; 0 otherwise. 2132
Other household Income 0.96 1.57
Per capita total income of the household, less the labor income of the woman (in thousand Chilean Pesos, exchange rate 1US$508 $ Chilean pesos)*
2133
Mother-Father 0.75 - 1 lived with mother and father before she was 15 years old; 0 otherwise. 2133
Father-no-mother 0.03 - 1 lived with father, but not mother before she was 15 years old; 0 otherwise 2133
Mother-no-father 0.13 - 1 lived with mother but not father before she was 15 years old; 0 otherwise 2133
Working mom 0.45 - 1 mother worked before she was 15 years old; 0 otherwise 2133
Mom primary 0.60 - 1 mother some primary education; 0 otherwise 2090 Mom secondary 0.09 - 1 mother some secondary education; 0 otherwise 2090 Mom college 0.07 - 1 mother some tertiary education; 0 otherwise 2090 Dad primary 0.52 - 1 father some primary education; 0 otherwise 2088 Dad secondary 0.09 - 1 father some secondary education; 0 otherwise 2088 Dad college 0.09 - 1 father some tertiary education; 0 otherwise 2088 Role Index 2.23 1.89 Attitude index 2133 Female siblings 2.09 1.93 Number of female siblings 2126 Male siblings 1.83 1.69 Number of male siblings 2125
Source: Survey Voz de Mujer 2009

32
Table 6: Descriptive statistics by type of care provision, for ages 25-59
Care giver of Children Care giver adults Does not provide care
Variables Mean Std. Dev Obs Mean Std. Dev Obs Mean Std. Dev Obs Dependent Variables Participation 0.37 - 109 0.57 - 195 0.69 - 1828 Employment 0.28 - 109 0.48 - 195 0.64 - 1828 Hours 8.94 18.29 109 15.70 19.92 195 23.34 22.47 1828 Independent Variables Primary 0.26 - 106 0.19 - 187 0.19 - 1782 Incomplete secondary 0.19 - 106 0.20 - 187 0.17 - 1782 Secondary 0.41 - 106 0.35 - 187 0.36 - 1782 Vocational education 0.03 - 106 0.09 - 187 0.13 - 1782 College 0.10 - 106 0.18 - 187 0.16 - 1782 Age 46.83 9.12 109 45.78 8.07 195 40.97 9.47 1828 North 0.11 - 109 0.08 - 195 0.12 - 1828 Center 0.09 - 109 0.25 - 195 0.19 - 1828 South 0.15 - 109 0.28 - 195 0.24 - 1828 Metropolitan Region 0.65 - 109 0.39 - 195 0.45 - 1828 Children 0.54 0.88 109 0.62 0.85 195 0.82 0.93 1828 Partner 0.70 - 109 0.48 - 195 0.64 - 1827 Other household Income 0.96 1.22 109 0.77 0.68 195 0.98 1.67 1828
Mother-Father 0.72 - 109 0.80 - 195 0.74 - 1828 Father-no-Mother 0.08 - 109 0.03 - 195 0.03 - 1828 Mother-no-Father 0.07 - 109 0.10 - 195 0.13 - 1828 Working Mom 0.44 - 109 0.58 - 195 0.44 - 1828 Mom primary 0.70 - 109 0.58 - 195 0.60 - 1785 Mom secondary 0.04 - 109 0.07 - 195 0.10 - 1785 Mom college 0.01 - 109 0.09 - 195 0.07 - 1785 Dad primary 0.62 - 109 0.55 - 194 0.50 - 1784 Dad secondary 0.08 - 109 0.04 - 194 0.10 - 1784 Dad college 0.04 - 109 0.15 - 194 0.08 - 1784 Role Index 2.05 1.80 109 2.08 1.82 195 2.26 1.90 1828 Female siblings 2.49 2.04 109 1.95 1.67 195 2.07 1.95 1821 Male siblings 2.24 1.85 109 1.83 1.82 194 1.80 1.66 1821 Source: Survey Voz de Mujer 2009

33
Table 7: Descriptive statistics by labor participation, for ages 25-59.
Participates Inactive
Variables Mean Std. Dev Obs Mean Std. Dev Obs Dependent Variables Employed 0.90 0.30 1360 - - 773 Involved in Care Giving activities 0.09 0.28 1360 0.13 0.34 773 Hours 32.56 19.87 1360 - - 773 Independent Variables Primary 0.16 - 1332 0.28 - 744 Incomplete secondary 0.15 - 1332 0.22 - 744 Secondary 0.34 - 1332 0.39 - 744 Vocational education 0.15 - 1332 0.06 - 744 College 0.21 - 1332 0.04 - 744 Age 40.74 9.40 1360 43.97 9.35 773 North 0.11 - 1360 0.14 - 773 Center 0.19 - 1360 0.18 - 773 South 0.24 - 1360 0.24 - 773 Metropolitan Region 0.46 - 1360 0.44 - 773 Children 0.76 0.89 1360 0.83 1.00 773 Partner 0.55 - 1359 0.78 - 773 Other household Income 0.95 1.79 1360 0.96 1.00 773 Mother-Father 0.75 - 1360 0.73 - 773 Father-no-Mother 0.03 - 1360 0.03 - 773 Mother-no-Father 0.12 - 1360 0.14 - 773 Working Mom 0.48 - 1360 0.40 - 773 Mom primary 0.58 - 1330 0.64 - 760 Mom secondary 0.11 - 1330 0.06 - 760 Mom college 0.09 - 1330 0.01 - 760 Dad primary 0.50 - 1328 0.56 - 760 Dad secondary 0.10 - 1328 0.07 - 760 Dad college 0.11 - 1328 0.04 - 760 Role Index 2.03 1.74 1360 2.64 2.10 773 Female siblings 1.99 1.87 1357 2.27 2.04 769 Male siblings 1.75 1.66 1356 1.99 1.74 769
Source: Survey Voz de Mujer 2009

34
Table 8: Perceptions of women by Labor Force Participation and Adult Care, for ages 25-59.
Participates in the Labor
Market Caregiver
Yes No Yes No
Variable Mean Mean Mean Mean Obs. Description Agrees or Disagrees
Attitude 1 0.46 0.54 0.5 0.49 2112 "= 0 Agrees with "A woman should earn a wage and care for her family"; = 1 Disagrees
Attitude 2 0.24 0.4 0.22 0.3 2110
"= 0 Agrees with "A working mother can have a relationship as solid and affectionate with their children as a woman who does not work "; = 1 Disagrees
Attitude 3 0.06 0.07 0.05 0.07 2111
"= 0 Agrees with "The dedication of the father and mother are equally important for cognitive and emotional development of their children"; = 1 Disagrees
Would you agree that your daughter, when she is married (or with a partner), works in the following cases:
Attitude 4 0.02 0.03 0.02 0.02 2088 She does not have Children ( = 0 Yes; = 1 No)
Attitude 5 0.31 0.39 0.24 0.34 2087 She has children of preschool age ( = 0 Yes; = 1 No)
Attitude 6 0.2 0.31 0.21 0.24 2089 She has children of school age ( = 0 Yes; = 1 No)
Attitude 7 0.05 0.07 0.09 0.05 2087 She has children that finish high school ( = 0 Yes; = 1 No)
Chores allocated to daughters and sons
Attitude 8 0.16 0.2 0.21 0.17 2074
" =1 You would ask your daughter to prepare a meal, but not to your son, Or would you ask to your son to prepare a meal, but not to your daughter, =0 Otherwise"
Attitude 9 0.17 0.21 0.22 0.18 2077
" =1 You would ask your daughter to do the laundry and iron, but not to your son, Or would you ask to your son to do the laundry and iron, but not to your daughter, =0 Otherwise"
Attitude 10 0.2 0.27 0.22 0.23 2080
" =1 You would ask your daughter to make small repairs at home, but not to your son, Or would you ask to your son make small repairs at home, but not to your daughter, =0 Otherwise"
Attitude 11 0.17 0.19 0.14 0.18 2068
" =1 You would ask your daughter wash the car, but not to your son, Or would you ask to your son to wash the car, but not to your daughter, =0 Otherwise"
Source: Survey Voz de Mujer 2009

35
Table 9: Probit estimates on participation, employment and caregiving (Marginal Effects), for
ages 25-59
Participation Employment Caregiving Variables Coef. Std.err Coef. Std.err Coef. Std.err
Incomplete secondary 0.023 (0.041) 0.007 (0.045) 0.030 (0.029) Secondary 0.068* (0.038) 0.047 (0.042) 0.024 (0.024) Vocational education 0.200*** (0.034) 0.223*** (0.044) -0.002 (0.030) College 0.289*** (0.035) 0.261*** (0.054) 0.007 (0.031) Age 0.020 (0.014) 0.025* (0.015) 0.024** (0.010) Age Squared -0.000* (0.000) -0.000** (0.000) -0.000* (0.000) North -0.032 (0.039) -0.053 (0.041) -0.015 (0.020) Center -0.014 (0.040) -0.017 (0.042) 0.029 (0.028) South -0.009 (0.040) -0.037 (0.045) 0.021 (0.023) Children -0.064*** (0.018) -0.067*** (0.020) 0.003 (0.012) Partner -0.187*** (0.029) -0.154*** (0.033) -0.063*** (0.021) Other household income -0.009 (0.010) -0.039** (0.019) -0.024*** (0.009) Mother-Father -0.041 (0.057) -0.031 (0.060) 0.022 (0.026) Father-no-mother -0.033 (0.122) 0.008 (0.121) 0.050 (0.078) Mother-no-father -0.068 (0.066) -0.004 (0.065) -0.011 (0.030) Working mom 0.056* (0.031) 0.037 (0.034) 0.047*** (0.018) Dummy for no information about working mom 0.006 (0.079) -0.021 (0.080) -0.035 (0.030)
Dummy for no information about mother education -0.060 (0.065) -0.055 (0.072) 0.024 (0.035)
Mom primary 0.049 (0.057) 0.010 (0.061) -0.031 (0.040) Mom secondary 0.100 (0.071) 0.104 (0.081) -0.015 (0.048) Mom college 0.176*** (0.067) 0.242*** (0.078) -0.022 (0.055) Dummy for no information about father education 0.118 (0.083) 0.058 (0.086) -0.009 (0.042)
Dad primary -0.112 (0.069) 0.002 (0.076) 0.024 (0.038) Dad secondary -0.102 (0.104) -0.015 (0.100) -0.029 (0.040) Dad college -0.177 (0.125) -0.015 (0.121) 0.104 (0.089) Role index -0.024*** (0.007) -0.017** (0.008) -0.003 (0.004) Female siblings 0.000 (0.008) 0.000 (0.009) -0.011*** (0.004)
Male siblings 0.003 (0.010) 0.006 (0.010) 0.001 (0.006)
Chi2 167.6 134.9 68.31 Pseudo R2 0.146 0.111 0.107 Observations 1991 1991 1991 Source: Survey Voz de Mujer 2009 Robust standard error in parentheses, significant at *** p<0.01, ** p<0.05, * p<0.1

36
Table 10: OLS estimation for Participation, Employment and Care Giving, for ages 25-59
Participation Employment Caregiving Variables Coef. Std.err Coef. Std.err Coef. Std.err
Incomplete secondary 0.024 (0.046) 0.007 (0.046) 0.030 (0.031) Secondary 0.078* (0.042) 0.048 (0.043) 0.025 (0.026) Vocational education 0.238*** (0.047) 0.229*** (0.050) -0.008 (0.033) College 0.313*** (0.053) 0.253*** (0.061) 0.003 (0.033) Age 0.024* (0.013) 0.028** (0.014) 0.019 (0.012) Age Squared -0.000** (0.000) -0.000** (0.000) -0.000 (0.000) North -0.025 (0.036) -0.041 (0.037) -0.007 (0.021) Center -0.008 (0.036) -0.011 (0.037) 0.043 (0.039) South -0.012 (0.037) -0.031 (0.040) 0.029 (0.027) Children -0.052*** (0.016) -0.054*** (0.017) 0.010 (0.013) Partner -0.169*** (0.029) -0.145*** (0.031) -0.073*** (0.024) Other household Income -0.012 (0.013) -0.018** (0.009) -0.009 (0.006) Mother-Father -0.047 (0.058) -0.038 (0.059) 0.022 (0.029) Father-no-Mother -0.021 (0.121) 0.011 (0.118) 0.046 (0.073) Mother-no-Father -0.059 (0.059) -0.005 (0.061) -0.017 (0.031) Working Mom 0.050* (0.030) 0.036 (0.032) 0.061*** (0.023) Dummy for no information about mother worked -0.001 (0.077) -0.017 (0.074) -0.026 (0.038)
Dummy for no information about mother education -0.062 (0.073) -0.053 (0.074) 0.040 (0.056)
Mom primary 0.053 (0.059) 0.014 (0.061) -0.040 (0.055) Mom secondary 0.086 (0.079) 0.090 (0.083) -0.020 (0.069) Mom college 0.106 (0.075) 0.161* (0.087) -0.040 (0.092) Dummy for no information about father education 0.116 (0.076) 0.055 (0.084) -0.007 (0.050)
Dad primary education -0.115* (0.069) -0.003 (0.077) 0.022 (0.049) Dad secondary -0.096 (0.087) -0.013 (0.095) -0.019 (0.057) Dad college -0.158* (0.090) -0.027 (0.102) 0.095 (0.079) Role index -0.025*** (0.007) -0.018** (0.007) -0.003 (0.005) Female siblings 0.000 (0.008) 0.001 (0.008) -0.010** (0.005) Male siblings 0.004 (0.010) 0.007 (0.010) -0.001 (0.007) Constant 0.461* (0.270) 0.265 (0.285) -0.416* (0.244) R2 0.158 0.131 0.068 Observations 1991 1991 1991 Source: Survey Voz de Mujer 2009 Robust standard error in parentheses, significant at *** p<0.01, ** p<0.05, * p<0.1
37
Table 11: Biprobit estimation of participation, employment and care giving, for ages 25-59
Participation Employment Participation Caregiving Employment Caregiving Variables Coef. Std.err Coef. Std.err Coef. Std.err Coef. Std.err Incomplete secondary 0.070 (0.123) 0.163 (0.161) 0.021 (0.119) 0.166 (0.162) Secondary 0.204* (0.116) 0.145 (0.142) 0.127 (0.112) 0.141 (0.142) Vocational education 0.726*** (0.163) -0.035 (0.203) 0.681*** (0.160) -0.056 (0.204) College 1.130*** (0.229) 0.024 (0.194) 0.784*** (0.209) 0.014 (0.192) Age 0.054 (0.042) 0.145** (0.065) 0.063 (0.040) 0.148** (0.065) Age Squared -0.001* (0.001) -0.001* (0.001) -0.001** (0.000) -0.001* (0.001) North -0.097 (0.111) -0.121 (0.144) -0.141 (0.105) -0.103 (0.144) Center -0.056 (0.115) 0.185 (0.156) -0.056 (0.109) 0.186 (0.157) South -0.032 (0.116) 0.135 (0.138) -0.097 (0.117) 0.138 (0.138) Children -0.189*** (0.053) 0.020 (0.076) -0.178*** (0.052) 0.024 (0.076) Partner -0.575*** (0.097) -0.372*** (0.115) -0.413*** (0.092) -0.380*** (0.114) Other household Income -0.027 (0.029) -0.173*** (0.062) -0.104** (0.050) -0.158** (0.062)
Mother-Father -0.122 (0.171) 0.162 (0.189) -0.081 (0.159) 0.162 (0.190) Father-no-Mother -0.093 (0.340) 0.249 (0.376) 0.023 (0.321) 0.267 (0.375) Mother-no-Father -0.190 (0.181) -0.081 (0.216) -0.008 (0.170) -0.069 (0.216) Working Mom 0.156* (0.094) 0.304*** (0.112) 0.092 (0.090) 0.302*** (0.112) Dummy for no information about mother worked
0.013 (0.231) -0.283 (0.276) -0.048 (0.207) -0.296 (0.273)
Dummy for no information about mother education
-0.181 (0.206) 0.189 (0.264) -0.147 (0.199) 0.186 (0.265)
Mom primary 0.143 (0.166) -0.197 (0.239) 0.026 (0.163) -0.193 (0.239) Mom secondary 0.309 (0.246) -0.089 (0.345) 0.285 (0.235) -0.071 (0.344) Mom college 0.624** (0.300) -0.159 (0.437) 0.755** (0.314) -0.158 (0.435) Dummy for no information about father education
0.332 (0.227) -0.048 (0.262) 0.148 (0.221) -0.058 (0.260)
Dad primary -0.326 (0.204) 0.142 (0.244) 0.010 (0.200) 0.156 (0.243) Dad secondary -0.273 (0.276) -0.271 (0.340) -0.035 (0.260) -0.269 (0.341) Dad college -0.503 (0.320) 0.513 (0.345) -0.059 (0.315) 0.526 (0.342) Role index -0.070*** (0.020) -0.015 (0.027) -0.046** (0.020) -0.016 (0.027) Female siblings 0.002 (0.024) -0.073** (0.028) 0.002 (0.024) -0.073** (0.029) Male siblings 0.010 (0.029) 0.001 (0.037) 0.018 (0.027) 0.004 (0.037) Constant 0.394 (0.872) -4.972*** (1.441) -0.239 (0.826) -5.059*** (1.444) Athrho -0.254*** (0.074) -0.279*** (0.070) Observations 1991 1991 1991 1991 Source: Survey Voz de Mujer 2009 Robust standard error in parentheses, significant at *** p<0.01, ** p<0.05, * p<0.1

38
Table 12: Probit estimates with no correction for endogeneity (Marginal Effects), for ages 25-59.
Participation Employment Variables Coef. Std.err Coef. Std.err Informal care -0.160*** (0.057) -0.199*** (0.056) Incomplete secondary 0.028 (0.041) 0.014 (0.046) Secondary 0.072* (0.038) 0.053 (0.042) Vocational education 0.203*** (0.034) 0.228*** (0.043) College 0.289*** (0.036) 0.263*** (0.055) Age 0.021 (0.015) 0.027* (0.016) Age Squared -0.000* (0.000) -0.000** (0.000) North -0.035 (0.039) -0.057 (0.041) Center -0.013 (0.041) -0.014 (0.043) South -0.006 (0.040) -0.032 (0.045) Children -0.064*** (0.018) -0.067*** (0.020) Partner -0.198*** (0.030) -0.167*** (0.033) Other household Income -0.010 (0.010) -0.044** (0.019) Mother-Father -0.038 (0.058) -0.026 (0.061) Father-no-Mother -0.025 (0.123) 0.018 (0.123) Mother-no-Father -0.071 (0.067) -0.006 (0.065) Working Mom 0.063** (0.032) 0.047 (0.034) Dummy for no information about mother worked 0.001 (0.079) -0.024 (0.079)
Dummy for no information about mother education -0.055 (0.066) -0.048 (0.074)
Mom primary 0.043 (0.058) 0.003 (0.062) Mom secondary 0.095 (0.072) 0.101 (0.083) Mom college 0.172** (0.067) 0.239*** (0.080) Dummy for no information about father education 0.118 (0.084) 0.056 (0.086)
Dad primary -0.108 (0.070) 0.008 (0.076) Dad secondary -0.103 (0.106) -0.018 (0.101) Dad college -0.171 (0.124) -0.003 (0.120) Role index -0.024*** (0.007) -0.018** (0.008) Female siblings -0.001 (0.008) -0.001 (0.009) Male siblings 0.003 (0.010) 0.007 (0.010) Wald Chi2 172.1 139.9 Pseudo R2 0.153 0.121 Observations 1991 1991 Source: Survey Voz de Mujer 2009 Robust standard error in parentheses, significant at *** p<0.01, ** p<0.05, * p<0.1

39
Table 13: OLS estimates with no correction for endogeneity, for ages 25-59.
Participation Employment
Variables Coef. Std.err Coef. Std.err Informal care -0.144*** (0.049) -0.178*** (0.049) Incomplete secondary 0.028 (0.046) 0.012 (0.046) Secondary 0.081* (0.042) 0.052 (0.042) Vocational education 0.237*** (0.047) 0.227*** (0.050) College 0.314*** (0.053) 0.254*** (0.060) Age 0.027* (0.014) 0.032** (0.015) Age Squared -0.000** (0.000) -0.000** (0.000) North -0.026 (0.035) -0.042 (0.036) Center -0.002 (0.037) -0.004 (0.038) South -0.008 (0.036) -0.025 (0.040) Children -0.050*** (0.016) -0.053*** (0.017) Partner -0.179*** (0.029) -0.158*** (0.031) Other household Income -0.014 (0.013) -0.019** (0.009) Mother-Father -0.044 (0.058) -0.034 (0.060) Father-no-Mother -0.014 (0.121) 0.019 (0.118) Mother-no-Father -0.061 (0.059) -0.008 (0.061) Working Mom 0.059* (0.030) 0.047 (0.032) Dummy for no information about mother worked -0.005 (0.077) -0.022 (0.073) Dummy for no information about mother education -0.056 (0.073) -0.046 (0.074)
Mom primary 0.048 (0.058) 0.007 (0.061) Mom secondary 0.083 (0.079) 0.087 (0.083) Mom college 0.101 (0.074) 0.154* (0.087) Dummy for no information about father education 0.114 (0.076) 0.053 (0.084)
Dad primary -0.111 (0.069) 0.001 (0.076) Dad secondary -0.099 (0.088) -0.016 (0.095) Dad college -0.144 (0.089) -0.010 (0.100) Role index -0.025*** (0.007) -0.018** (0.007) Female siblings -0.001 (0.008) -0.001 (0.008) Male siblings 0.004 (0.009) 0.007 (0.010) Constant 0.401 (0.277) 0.191 (0.294) R-squared 0.167 0.143 Observations 1991 1991 Source: Survey Voz de Mujer 2009 Robust standard error in parentheses, significant at *** p<0.01, ** p<0.05, * p<0.1

40
Table 14: Biprobit estimation with correction for endogeneity, for ages 25-59.
Participation Employment
Participation Caregiving Employment Caregiving Variables Coef. Std.err Coef. Std.err Coef. Std.err Coef. Std.err Informal Care 0.528 (0.490) 0.168 (0.543) Incomplete secondary 0.050 (0.121) 0.139 (0.158) 0.013 (0.118) 0.161 (0.160) Secondary 0.179 (0.118) 0.134 (0.138) 0.116 (0.113) 0.138 (0.142) Vocational education 0.700*** (0.165) -0.064 (0.206) 0.669*** (0.162) -0.069 (0.217) College 1.076*** (0.221) -0.005 (0.199) 0.764*** (0.210) 0.005 (0.197) Age 0.043 (0.043) 0.131* (0.070) 0.060 (0.043) 0.145** (0.067) Age Squared -0.001 (0.001) -0.001 (0.001) -0.001* (0.001) -0.001* (0.001) North -0.092 (0.111) -0.144 (0.149) -0.142 (0.106) -0.103 (0.143) Center -0.079 (0.112) 0.190 (0.156) -0.065 (0.108) 0.189 (0.158) South -0.050 (0.117) 0.142 (0.137) -0.100 (0.118) 0.141 (0.139) Children -0.187*** (0.053) 0.024 (0.074) -0.180*** (0.052) 0.026 (0.076) Partner -0.505*** (0.126) -0.360*** (0.116) -0.395*** (0.108) -0.379*** (0.114) Other household Income -0.024 (0.027) -0.189*** (0.070) -0.101** (0.051) -0.158** (0.062)
Mother-Father -0.105 (0.158) 0.169 (0.191) -0.057 (0.153) 0.160 (0.192) Father-no-Mother -0.105 (0.327) 0.208 (0.389) 0.028 (0.319) 0.259 (0.378) Mother-no-Father -0.156 (0.173) -0.089 (0.217) 0.011 (0.167) -0.069 (0.217) Working Mom 0.107 (0.098) 0.300*** (0.111) 0.074 (0.098) 0.302*** (0.111) Dummy for no information about mother worked
0.024 (0.229) -0.290 (0.270) -0.049 (0.211) -0.301 (0.271)
Dummy for no information about mother education
-0.193 (0.201) 0.209 (0.261) -0.147 (0.198) 0.189 (0.264)
Mom primary 0.155 (0.164) -0.192 (0.233) 0.027 (0.164) -0.190 (0.238) Mom secondary 0.306 (0.240) -0.069 (0.334) 0.278 (0.232) -0.059 (0.348) Mom college 0.620** (0.300) -0.156 (0.435) 0.748** (0.312) -0.155 (0.434) Dummy for no information about father education
0.323 (0.220) -0.041 (0.259) 0.147 (0.221) -0.058 (0.259)
Dad primary -0.330 (0.201) 0.127 (0.240) 0.002 (0.201) 0.157 (0.243) Dad secondary -0.256 (0.268) -0.321 (0.344) -0.042 (0.260) -0.282 (0.348) Dad college -0.548* (0.319) 0.508 (0.340) -0.085 (0.323) 0.529 (0.340) Role index -0.066*** (0.021) -0.012 (0.028) -0.045** (0.021) -0.016 (0.027) Female siblings -0.069** (0.028) -0.072** (0.028) Male siblings -0.001 (0.035) 0.007 (0.036) Constant 0.609 (0.888) -4.690*** (1.535) -0.168 (0.876) -5.008*** (1.469) Athrho -0.562* (0.321) -0.371 (0.293) Observations 1991 1991 1991 1991 Source: Survey Voz de Mujer 2009 Robust standard error in parentheses, significant at *** p<0.01, ** p<0.05, * p<0.1

41
Table 15: 2SLS estimation correcting for endogeneity, for ages 25-59
Participation Employment
Variables Coef. Std.err Coef. Std.err Informal Care -0.152 (0.776) -0.320 (0.812) Incomplete secondary 0.027 (0.053) 0.015 (0.054) Secondary 0.081 (0.049) 0.054 (0.049) Vocational education 0.236*** (0.046) 0.224*** (0.050) College 0.312*** (0.053) 0.250*** (0.060) Age 0.027 (0.020) 0.034 (0.022) Age Squared -0.000* (0.000) -0.000** (0.000) North -0.027 (0.036) -0.044 (0.037) Center -0.002 (0.049) 0.002 (0.053) South -0.007 (0.044) -0.020 (0.050) Children -0.050*** (0.017) -0.052*** (0.018) Partner -0.179*** (0.063) -0.168*** (0.064) Other household Income -0.014 (0.014) -0.020* (0.012) Mother-Father -0.041 (0.056) -0.026 (0.058) Father-no-Mother -0.012 (0.120) 0.029 (0.120) Mother-no-Father -0.060 (0.062) -0.008 (0.064) Working Mom 0.058 (0.057) 0.054 (0.059) Dummy for no information about mother worked -0.007 (0.078) -0.028 (0.076) Dummy for no information about mother education -0.055 (0.078) -0.038 (0.079)
Mom primary 0.047 (0.065) -0.000 (0.068) Mom secondary 0.081 (0.078) 0.082 (0.085) Mom college 0.099 (0.077) 0.145 (0.092) Dummy for no information about father education 0.114 (0.076) 0.051 (0.084) Dad primary -0.111 (0.068) 0.004 (0.077) Dad secondary -0.100 (0.090) -0.021 (0.098) Dad college -0.143 (0.112) 0.003 (0.125) Role index -0.026*** (0.007) -0.019** (0.008) Constant 0.401 (0.430) 0.138 (0.458) Durbin-Hausman-Wu chi-square 0.0002 0.0643 R2 0.167 0.134 Observations 1991 1991 Source: Survey Voz de Mujer 2009 Robust standard error in parentheses, significant at *** p<0.01, ** p<0.05, * p<0.1

42
Table 16: IV OProbit estimations for worked hours decisions, for ages 25-59. IV Oprobit Hours (Discrete) Caregiving Variables Coef. Std.err Coef. Std.err Informal Care 0.538 (0.532) Incomplete secondary 0.027 (0.107) 0.141 (0.156) Secondary 0.140 (0.105) 0.128 (0.140) Vocational education 0.466*** (0.141) -0.118 (0.225) College 0.633*** (0.154) -0.007 (0.185) Age 0.063* (0.037) 0.134** (0.066) Age Squared -0.001** (0.000) -0.001 (0.001) North -0.061 (0.099) -0.118 (0.141) Center -0.058 (0.091) 0.200 (0.156) South -0.179* (0.098) 0.150 (0.134) Children -0.147*** (0.044) 0.026 (0.074) Partner -0.219** (0.092) -0.368*** (0.107) Other household Income -0.070 (0.047) -0.162** (0.065) Mother-Father 0.010 (0.130) 0.171 (0.189) Father-no-Mother -0.122 (0.225) 0.293 (0.365) Mother-no-Father 0.048 (0.139) -0.078 (0.216) Working Mom -0.003 (0.083) 0.303*** (0.108) Dummy for no information about mother worked -0.055 (0.188) -0.283 (0.258) Dummy for no information about mother education -0.186 (0.171) 0.241 (0.260) Mom primary 0.078 (0.146) -0.212 (0.231) Mom secondary 0.116 (0.189) -0.015 (0.335) Mom college 0.161 (0.279) -0.166 (0.421) Dummy for no information about father education 0.272 (0.217) -0.096 (0.260) Dad primary -0.231 (0.197) 0.189 (0.245) Dad secondary -0.232 (0.233) -0.262 (0.334) Dad college -0.313 (0.268) 0.573* (0.344) Role index -0.051*** (0.019) -0.008 (0.027) Female siblings -0.062** (0.028) Male siblings 0.002 (0.034) Constant -4.801*** (1.443) Chi2 118.14 (p-value) (0.000) Athrho -0.591* (0.340) Observations 1991 1991 Source: Survey Voz de Mujer 2009 Robust standard error in parentheses, significant at *** p<0.01, ** p<0.05, * p<0.1

43
Table 17: IV Tobit estimations for worked hours decisions, for ages 25-59. IV Tobit Hours (Discrete) Caregiving Variables Coef. Std.err Coef. Std.err Informal Care -0.093 (11.631) Incomplete secondary 0.932 (3.594) 0.166 (0.161) Secondary 4.786 (3.320) 0.141 (0.143) Vocational education 17.255*** (4.495) -0.065 (0.217) College 22.504*** (4.762) 0.025 (0.189) Age 2.581** (1.199) 0.147** (0.066) Age Squared -0.035** (0.014) -0.001* (0.001) North -2.979 (3.078) -0.109 (0.145) Center -0.028 (2.929) 0.188 (0.159) South -4.738 (3.189) 0.135 (0.138) Children -4.815*** (1.478) 0.024 (0.076) Partner -8.029*** (2.610) -0.383*** (0.114) Other household Income -2.266* (1.355) -0.160** (0.062) Mother-Father -1.297 (4.534) 0.170 (0.193) Father-no-Mother -2.629 (8.030) 0.285 (0.374) Mother-no-Father -0.255 (4.693) -0.070 (0.217) Working Mom 1.731 (2.457) 0.306*** (0.112) Dummy for no information about mother worked -3.238 (6.316) -0.278 (0.273) Dummy for no information about mother education -3.791 (5.649) 0.202 (0.267) Mom primary 1.143 (4.691) -0.207 (0.240) Mom secondary 2.776 (6.191) -0.068 (0.349) Mom college 2.838 (9.113) -0.157 (0.432) Dummy for no information about father education 6.366 (6.646) -0.063 (0.261) Dad primary -5.021 (6.021) 0.163 (0.245) Dad secondary -5.308 (7.262) -0.259 (0.344) Dad college -4.856 (8.302) 0.525 (0.342) Role index -1.691*** (0.604) -0.014 (0.027) Female siblings -0.070** (0.029) Male siblings 0.003 (0.037) Constant -22.029 (24.281) -5.055*** (1.452) Chi2 143.69 (p-value) (0.000) Athrho -0.246 (0.160) Observations 1991 1991 Source: Survey Voz de Mujer 2009 Robust standard error in parentheses, significant at *** p<0.01, ** p<0.05, * p<0.1

44
Table 18: 2SLS estimations on hours worked, for ages 25-59.
Hours (Discrete) Informal Care (First Stage)
Variables Coef. Std.err Coef. Std.err Informal Care -1.002 (1.701) Incomplete secondary 0.070 (0.110) 0.030 (0.031) Secondary 0.162 (0.102) 0.025 (0.026) Vocational education 0.428*** (0.128) -0.008 (0.033) College 0.612*** (0.138) 0.003 (0.033) Age 0.087* (0.048) 0.019 (0.012) Age Squared -0.001** (0.001) -0.000 (0.000) North -0.062 (0.085) -0.007 (0.021) Center 0.031 (0.121) 0.043 (0.039) South -0.112 (0.108) 0.029 (0.027) Children -0.110*** (0.042) 0.010 (0.013) Partner -0.312** (0.141) -0.073*** (0.024) Other household Income -0.041 (0.026) -0.009 (0.006) Mother-Father 0.032 (0.124) 0.022 (0.029) Father-no-Mother -0.066 (0.220) 0.046 (0.073) Mother-no-Father 0.001 (0.136) -0.017 (0.031) Working Mom 0.096 (0.128) 0.061*** (0.023) Dummy for no information about mother worked -0.088 (0.168) -0.026 (0.038) Dummy for no information about mother education -0.099 (0.163) 0.040 (0.056)
Mom primary 0.013 (0.142) -0.040 (0.055) Mom secondary 0.081 (0.180) -0.020 (0.069) Mom college 0.069 (0.294) -0.040 (0.092) Dummy for no information about father education 0.195 (0.187) -0.007 (0.050)
Dad primary -0.158 (0.171) 0.022 (0.049) Dad secondary -0.210 (0.210) -0.019 (0.057) Dad college -0.107 (0.292) 0.095 (0.079) Role index -0.048*** (0.016) -0.003 (0.005) Female siblings -0.010** (0.005) Male siblings -0.001 (0.007) Constant 0.745 (1.019) -0.416* (0.244) Durbin-Hausman-Wu Chi-square 0.251 F-test 2.671 R-squared 0.082 0.068 Observations 1991 1991 Source: Survey Voz de Mujer 2009 Robust standard error in parentheses, significant at *** p<0.01, ** p<0.05, * p<0.1