Embed Size (px)
Citation preview

BANCA TRANSILVANIAQ1 2017 Financial Results
1

DISCLAIMER
The information contained in the present document has not been independently verified and norepresentation or warranty expressed or implied is made as to, and no reliance should be placedon the fairness, accuracy, completeness or correctness of this information or opinions containedherein.
Banca Transilvania cautions readers that no forward-looking statement that may be contained inthe present document is a guarantee of future performance and that actual results could differmaterially from those contained in the forward-looking statements. Forward-looking statementsspeak only as of the date they are made, and Banca Transilvania undertakes no obligation toupdate publicly any of them in light of new information or future events.
None of Banca Transilvania or any of its affiliates, advisors or representatives shall have anyliability for any loss howsoever arising from any use of this document or its content or otherwisearising in connection with this document.
The present document does not constitute a public offer under any applicable legislation or anoffer to sell or solicitation of any offer to buy any securities or financial instruments or any adviceor recommendation with respect to such securities or other financial instruments.
2

AGENDA
Banking Sector Dynamics
Q1 2017 Highlights
Performance in Q1 2017
Overview of Business Lines
BT Financial Group
Financial Statements
1
2
3
4
5
A
3

BANK ASSETS drawing near the RON 400bn benchmark
362
353 352 351
364
361363
360
377
370
380378
394
-0.9% -1.0%-0.7% -0.6%
0.5%
2.4%
3.1%
2.3%
3.6%
2.5%
4.6%
5.1%
4.4%
320
330
340
350
360
370
380
390
-3%
-1%
1%
3%
5%
7%
9%
11%
4Q13 2Q14 4Q14 2Q15 4Q15 2Q16 4Q16
total bank net assets source: NBR
20.7%20.2%
16.2%15.7%
13.5% 13.5%
11.3%
10.0%9.5%
4Q14 1Q15 2Q15 3Q15 4Q15 1Q16 2Q16 3Q16 4Q16
NPL ratio, % source: NBR
Bank assets reach record levels NPL ratio below 10% threshold
BANKING SECTOR DYNAMICS
Q1 2017 highlights PERFORMANCE IN Q1 2017OVERVIEW OF BUSINESS
LINESBT FINANCIAL GROUP
net assets
%YoY
net assets
in RONbn
4

LCY LOANS TO HOUSEHOLDSsupporting the credit activity troughout the whole year
-3.3
% -2.7
%
-3.9
%
-4.5
%
-3.3
%
-3.4
%
-0.1
%
0.6
%
3.0
%
2.8
%
1.1
6%
1.1
7%
1.2
4%
-5%
-4%
-3%
-2%
-1%
0%
1%
2%
3%
4%
4Q13 2Q14 4Q14 2Q15 4Q15 2Q16 4Q16
loans non-government , %YoY source: NBR
110
114
119
122
126
107
102
99
95 94
6000%
7000%
8000%
9000%
10000%
11000%
12000%
13000%
4Q15 1Q16 2Q16 3Q16 4Q16
loans non-government , RONbn source: NBR
RO
N l
oans
FCY l
oans
The rise in credit to households offsetting the decline in corporate loans
Loans in LCY amounting to 57% oftotal loans at 2016-end
BANKING SECTOR DYNAMICS
Q1 2017 highlights PERFORMANCE IN Q1 2017OVERVIEW OF BUSINESS
LINESBT FINANCIAL GROUP
5
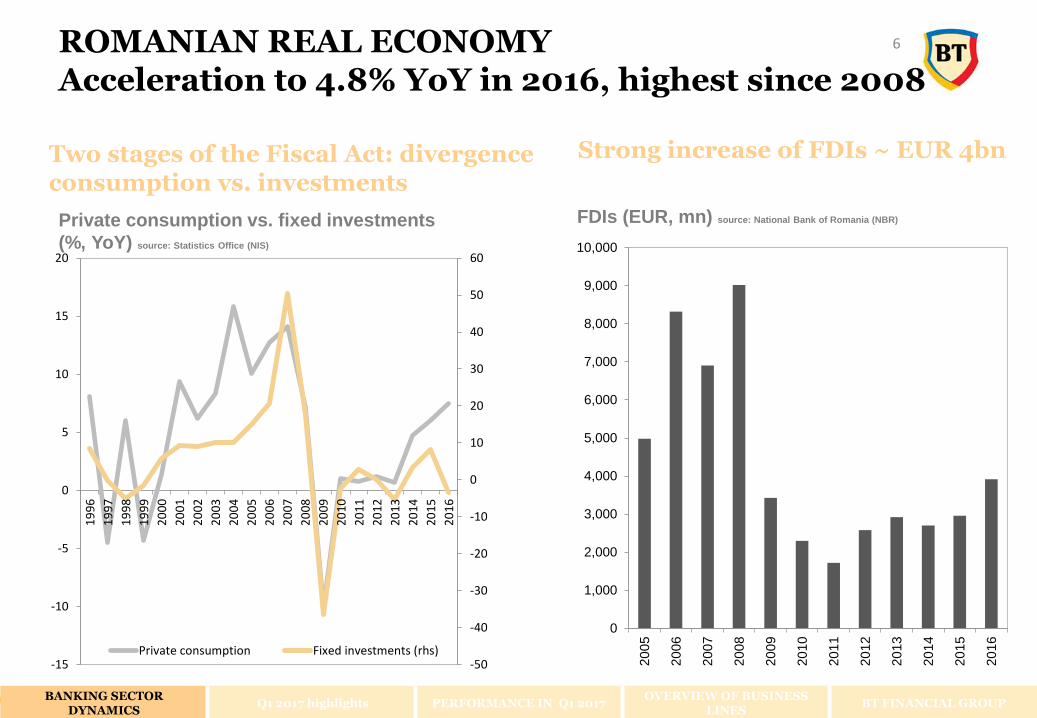
ROMANIAN REAL ECONOMY Acceleration to 4.8% YoY in 2016, highest since 2008
Two stages of the Fiscal Act: divergence consumption vs. investments
Strong increase of FDIs ~ EUR 4bn
BANKING SECTOR DYNAMICS
Q1 2017 highlights PERFORMANCE IN Q1 2017OVERVIEW OF BUSINESS
LINESBT FINANCIAL GROUP
6
0
1,000
2,000
3,000
4,000
5,000
6,000
7,000
8,000
9,000
10,000
20
05
20
06
20
07
20
08
20
09
20
10
20
11
20
12
20
13
20
14
20
15
20
16
FDIs (EUR, mn) source: National Bank of Romania (NBR)
-50
-40
-30
-20
-10
0
10
20
30
40
50
60
-15
-10
-5
0
5
10
15
20
19
96
19
97
19
98
19
99
20
00
20
01
20
02
20
03
20
04
20
05
20
06
20
07
20
08
20
09
20
10
20
11
20
12
20
13
20
14
20
15
20
16
Private consumption Fixed investments (rhs)
Private consumption vs. fixed investments
(%, YoY) source: Statistics Office (NIS)

FINANCIAL ECONOMYhigher global financing costs vs. twin deficits and political risks in Romania
The impact of the VAT cuts is fading out … HICP YoY changing the trend
Huge volatility and high pressure on bonds and FX markets
BANKING SECTOR DYNAMICS
Q1 2017 highlights PERFORMANCE IN Q1 2017OVERVIEW OF BUSINESS
LINESBT FINANCIAL GROUP
-4%
-3%
-2%
-1%
0%
1%
2%
3%
Jan-1
4
Jun-1
4
No
v-1
4
Apr-
15
Sep-1
5
Feb
-16
Jul-1
6
De
c-1
6
HICP (YoY) source: Statistics Office (NIS)
2.0
2.2
2.4
2.6
2.8
3.0
3.2
3.4
3.6
3.8
4.4
4.4
4.4
4.4
4.5
4.5
4.5
4.5
4.5
4.6
Jan-1
6
Feb
-16
Ma
r-1
6
Apr-
16
Ma
y-1
6
Jun-1
6
Jul-1
6
Aug-1
6
Sep-1
6
Oct-
16
No
v-1
6
De
c-1
6
EUR/RON vs. 10 YR T-Bonds yield (%)source: National Bank of Romania (NBR)
EUR/RON 10 YR Bonds yield (%) (rhs.)
7

Banca Transilvania’sBusiness Development and Financial Performance Q1 2017
8

Q1 2017 HIGHLIGHTSP
RO
FIT
AB
ILIT
Y
Mil. RON Q1 2017 Q1 2016 ∆
Operating income RONmn 586.6 600.2 -2.3%
Operating expenses RONmn (300.0) (270.8) 10.8%
Gross profit before provisions RONmn 286.7 329.3 -13.0%
Net profit RONmn 246.2 228.5 7.7%
Cost of risk, net (%) -0.08% 0.87% -109.0%
NIM 3.26% 3.56% -0.3 pp
NIM* 3.15% 3.15% 0.0 pp
ROE 17.08% 15.31% 1.8 pp
Cost-to-income ratio 51.13% 45.13% 6.0 pp
CR
ED
IT
AC
TIV
ITY
Mar-17 Dec-16 ∆
Gross loans to customers RONmn 30,324.7 29,379.7 3.2%
Deposits from customers RONmn 41,754.0 41,851.8 -0.2%
Gross Loans-to-deposits ratio 72.63% 70.20% 2.4 pp
NPL ratio 4.90% 4.62% 0.3 pp
CA
PIT
AL Mar-17 Dec-16 ∆
Total equity RONmn 6,263.9 5,984.1 4.7%
Tier 1 capital ratio (profit included) 17.52% 17.14% 2.2%
Total capital ratio (profit included) 18.60% 18.30% 1.7%
*without one-off adjustments (PPA adjustments : incurred loss and expected loss)
DYNAMICSBANKING SECTOR
Q1 2017 highlights PERFORMANCE IN Q1 2017OVERVIEW OF BUSINESS
LINESBT FINANCIAL GROUP
9

BUSINESS PERFORMANCE Q1 2017at a glance
Total assets at RON 51.9 bn ● Enhanced ALM for higher efficiency
Capital adequacy ratio at 18.6%
● Strong capital base, supporting organic and non organic growth
Net fees and commissions at RON 129.4 mn 11.1% Y/Y
● Driven by increased number of operations and additional cross-sell
CoR, net ● CoR at -0.08%, including releases and recoveries
Net profit at RON 246.2 mn
● Net profit positively influenced by increase in interest income, fees and commissions and decrease in provisions
Cost/income at 51.13%● Cost to income at a comfortable level, with some expenses booked in
advance for the whole year
BANKING SECTOR DYNAMICS
Q1 2917 highlights PERFORMANCE IN Q1 2017OVERVIEW OF BUSINESS
LINESBT FINANCIAL GROUP
10

TRENDS IN INCOME STRUCTURE
BANKING SECTOR DYNAMICS
Q1 2917 highlights PERFORMANCE IN Q1 2017OVERVIEW OF BUSINESS
LINESBT FINANCIAL GROUP
271
37
117
429
300
51
129
456
Operating expensesNet trading incomeNet fee and commission income
Net interest income
+6,5%
+11,1%
+36,8%
+10,8%
11
Q1 2016
Q1 2017
VBRO loans adjustments
63
66
366
390

Loans to Households, RONbn
Mar’17
15,4
8,1
7,3
0,0
Dec’16
15,1
8,1
6,9
0,1
ConsumptionHousingOther
Mar’17
14,9
11,1
3,9
Dec’16
14,3
11,1
3,2
Large corporatesSMEs
28%72%
RON FX
20%80%
RON FX
LOAN STRUCTURE
*SMEs identified according to internal classification rules
BANKING SECTOR DYNAMICS
Q1 2917 highlights PERFORMANCE IN Q1 2017OVERVIEW OF BUSINESS
LINESBT FINANCIAL GROUP
Loans to Companies, RONbn
Loans to Households Loans to Companies
12

Mar’17
27,2
18,5
8,6
Dec’16
26,4
18,4
7,9
DepositsCurrent accounts
15,5
10,1
5,4
Mar’17
14,6
8,5
6,1
Dec’16
Large corporatesSMEs
42%58%
RON FX
26%74%
RON FX
DEPOSIT STRUCTURE
BANKING SECTOR DYNAMICS
Q1 2917 highlights PERFORMANCE IN Q1 2017OVERVIEW OF BUSINESS
LINESBT FINANCIAL GROUP
*SMEs identified according to internal classification rules
Deposits from Households, RONbn Deposits from Companies, RONbn
Deposits from CompaniesDeposits from Households
13

6,4
NPL RATIO AT 4.90%
● Banca Transilvania continued to provide a sound coverage ratio for its PAR 90 portfolio
BANKING SECTOR DYNAMICS
Q1 2917 highlights PERFORMANCE IN Q1 2017OVERVIEW OF BUSINESS
LINESBT FINANCIAL GROUP
*For Financial Statements purposes the gross loans are netted by the unwinding adjustment; For coverage ratio purposes the respective adjustment is included in the total stock of provisions
NPL coverage with mortgage collaterals
NPL coverage with provisions
33%
45%46% 40%
54%45%
12
108%
75%
33%
119%
79%
40%
14
127%
81%
46%
13
122%
77%
Q1’1716
117%
74%
43%
15
113%
73%
39%
NPL coverage with provisions
NPL coverage with mortgage collaterals
14

BANKING SECTOR DYNAMICS
Q1 2917 highlights PERFORMANCE IN Q1 2017OVERVIEW OF BUSINESS
LINESBT FINANCIAL GROUP
Retail Banking
Retail loan portfolio reached RON 15.4 bn as at Mar’17
15,000 non-card retail loans disbursed in Q1 2017
Market share for retail loans at December 2016 -
14.25%
Internet banking users: over 820,000
Mobile banking users: over 300,000
2.9 mn active cards, of which more than 330,000
credit cards; BT is the market leader, both in terms
of number of cards, as well as volume of
transactions generated by its cards, with a market
share of almost 20%.
15
10.3
15.415.1
7.56.8
6.3
3.3
20132012 Q1 201720162015
13.6
2014
Loans transferred from VBRO
Retail loans

SME Banking
● Banca Transilvania continued its specific focus on the SME business sector, offering almost 4,000 new loans in Q1 2017
BT launched a new platform to support the small
and micro companies
BT continued its partnership with DFIs, offering
special loan and guarantee products to its SME
clients
● Agriculture, Healthcare and European Structural Funds are on BT radar as specialized sectorial approaches
SME loan portfolio at RON 3.9 bnand 214,700 active clients
BANKING SECTOR DYNAMICS
Q1 2917 highlights PERFORMANCE IN Q1 2017OVERVIEW OF BUSINESS
LINESBT FINANCIAL GROUP
16
2.8
3.9
3.2
2.62.52.5
0.3
Q1 201720162015
3.1
201420132012
SME Loans
Loans transferred form VBRO

Corporate Banking
● The reorganizational process was concluded, including client new segmentation & deeper sectorial specialization
BT was present with lending facilities especially in
the industrial manufacturing and agribusiness
segments
BT continued to play an important role as co-lender
of EU structural funds eligible projects
Corporate loan portfolio aboveRON 11.1 bn
BANKING SECTOR DYNAMICS
Q1 2917 highlights PERFORMANCE IN Q1 2017OVERVIEW OF BUSINESS
LINESBT FINANCIAL GROUP
17
10.1
11.111.1
10.09.9
8.7
0.9
Q1 201720162015
11.0
20142012 2013
SME Loans
Loans transferred form VBRO

Banca Transilvania Financial Group
As of 31.03.2017*:
BANKING SECTOR DYNAMICS
Q1 2017 highlights PERFORMANCE IN Q1 2017OVERVIEW OF BUSINESS
LINESBT FINANCIAL GROUP
Total assets: 51.9 RON bn
Total assets: 72 RON mn. Total assets: 139 RON mn.
AuM: 3,509 RON mn.Total assets: 605 RON mn.
Total assets: 145 RON mn.
*Total assets for subsidiaries are presented under RAS rules
18

Q1 2017 HIGHLIGHTS – Consolidated FiguresP
RO
FIT
AB
ILIT
Y
Mil. RON Q1 2017 Q1 2016 ∆
Operating income 647.5 621.8 4.1%
Operating expenses (332.4) (288.4) 15.3%
Gross profit before provisions 315.1 333.4 -5.5%
Net income 266.9 231.1 15.5%
EPS RON 0.0615 0.0632 -2.8%
Cost of risk, net (%) 0.00% 0.86% -100.5%
NIM 3.27% 3.57% -8.4%
NIM* 3.16% 3.17% -0.1%
ROE (%) 18.07% 15.32% 17.9%
Cost-to-income ratio (%) 51.33% 46.38% 10.7%
CR
ED
IT
AC
TIV
ITY Mar-17 Dec-16
Gross loans to customers RONmn 30,412.8 29,477.9 3.2%
Deposits from customers RONmn 41,555.6 41,681.5 -0.3%
Loans-to-deposits ratio 73.19% 70.72% 3.5%
CA
PIT
AL
Mar-17 Dec-16
Total equity RONmn 6,440.3 6,152.7 4.7%
Tier 1 capital ratio (Profit included) 17.73% 17.36% 2.2%
Total capital ratio (Profit included) 18.81% 18.50% 1.7%
BANKING SECTOR DYNAMICS
Q1 2017 highlights PERFORMANCE IN Q1 2017OVERVIEW OF BUSINESS
LINESBT FINANCIAL GROUP
19
*without one-off adjustments (PPA adjustments : incurred loss and expected loss)

ANNEX I INCOME STATEMENT YTD Q1 2017 - Individual
IFRS, individual, RONmn Q1 2017 Q1 2016 ∆
Net interest income 456.3 428.6 6.5%
Net fee and commission income 129.4 116.5 11.1%
Net trading income 50.5 36.9 36.8%
Other net income (49.7) 18.1 -373.8%
Operating income 586.6 600.2 -2.3%
Personnel expenses (165.0) (151.5) 8.9%
D&A (19.6) (17.6) 11.4%
Other operating expenses (115.4) (101.7) 13.5%
Operating expenses (300.0) (270.8) 10.8%
Cost of risk 5.92 (60.6)
Bargaining gain 0.0 0.0
Net income before taxation 292.6 268.7 8.9%
Income tax expense (46.4) (40.2) 15.3%
Net income after taxation 246.2 228.5 7.7%
20
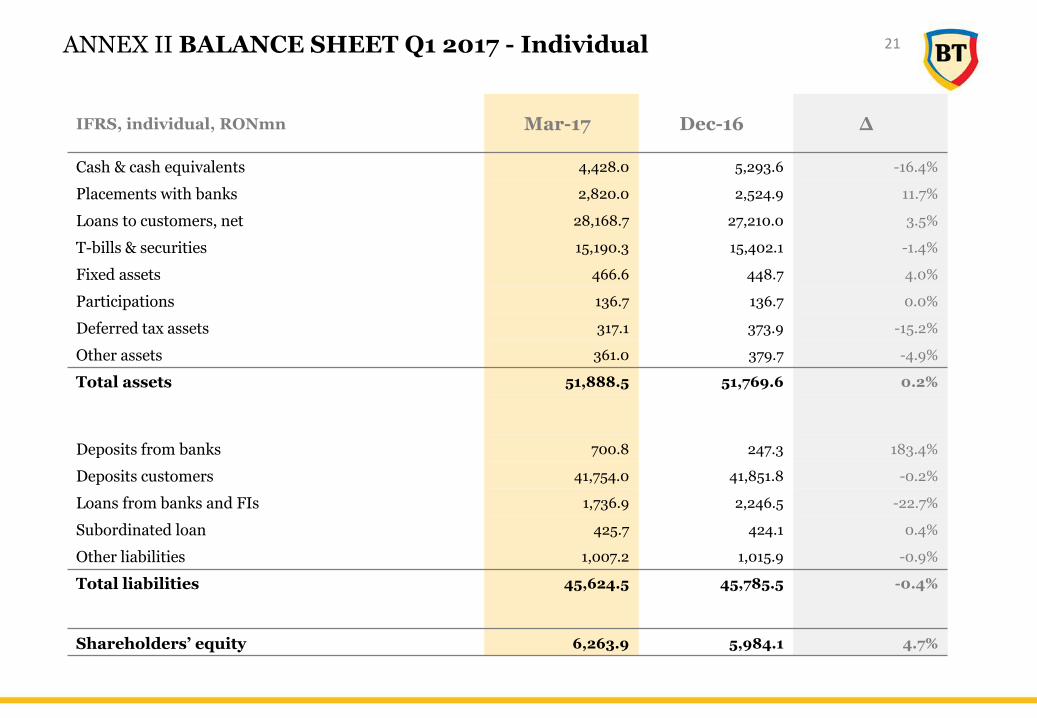
ANNEX II BALANCE SHEET Q1 2017 - Individual
IFRS, individual, RONmn Mar-17 Dec-16 ∆
Cash & cash equivalents 4,428.0 5,293.6 -16.4%
Placements with banks 2,820.0 2,524.9 11.7%
Loans to customers, net 28,168.7 27,210.0 3.5%
T-bills & securities 15,190.3 15,402.1 -1.4%
Fixed assets 466.6 448.7 4.0%
Participations 136.7 136.7 0.0%
Deferred tax assets 317.1 373.9 -15.2%
Other assets 361.0 379.7 -4.9%
Total assets 51,888.5 51,769.6 0.2%
Deposits from banks 700.8 247.3 183.4%
Deposits customers 41,754.0 41,851.8 -0.2%
Loans from banks and FIs 1,736.9 2,246.5 -22.7%
Subordinated loan 425.7 424.1 0.4%
Other liabilities 1,007.2 1,015.9 -0.9%
Total liabilities 45,624.5 45,785.5 -0.4%
Shareholders’ equity 6,263.9 5,984.1 4.7%
21
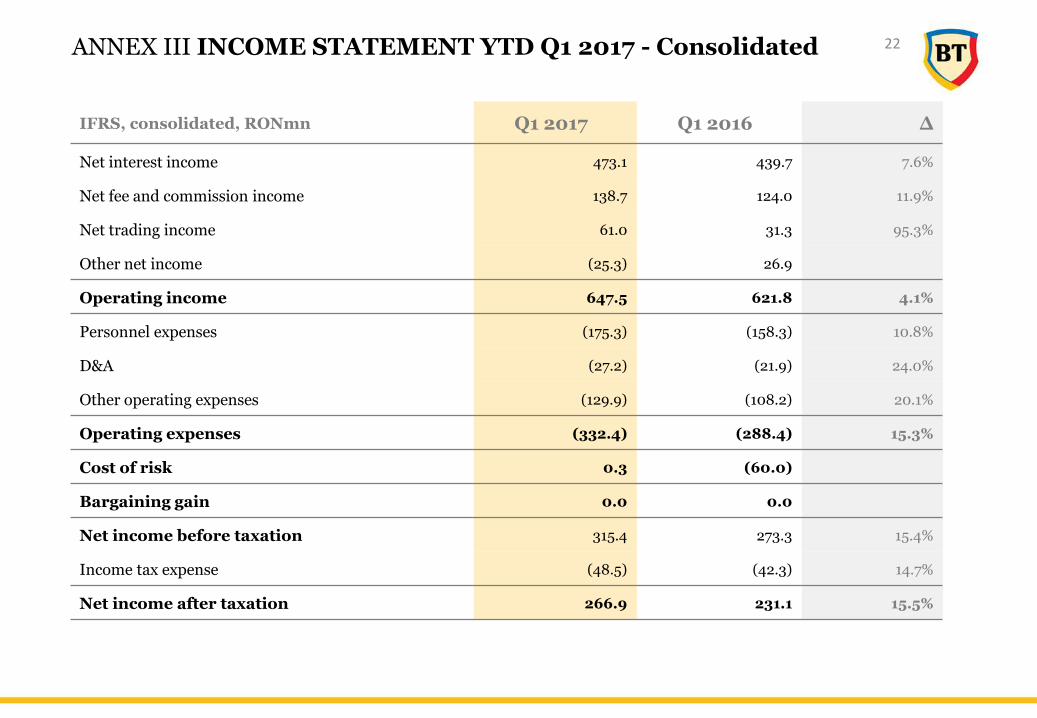
ANNEX III INCOME STATEMENT YTD Q1 2017 - Consolidated
IFRS, consolidated, RONmn Q1 2017 Q1 2016 ∆
Net interest income 473.1 439.7 7.6%
Net fee and commission income 138.7 124.0 11.9%
Net trading income 61.0 31.3 95.3%
Other net income (25.3) 26.9
Operating income 647.5 621.8 4.1%
Personnel expenses (175.3) (158.3) 10.8%
D&A (27.2) (21.9) 24.0%
Other operating expenses (129.9) (108.2) 20.1%
Operating expenses (332.4) (288.4) 15.3%
Cost of risk 0.3 (60.0)
Bargaining gain 0.0 0.0
Net income before taxation 315.4 273.3 15.4%
Income tax expense (48.5) (42.3) 14.7%
Net income after taxation 266.9 231.1 15.5%
22

ANNEX IV BALANCE SHEET 2016 - Consolidated
IFRS, consolidated, RONmn Mar-17 Dec-16 ∆
4,428.0 5,293.7 -16.4%
Cash & cash equivalents 2,878.2 2,563.8 12.3%
Placements with banks 28,175.1 27,234.0 3.5%
Loans to customers, net 15,176.4 15,399.7 -1.5%
T-bills & securities 670.9 645.3 4.0%
Fixed assets 323.9 378.7 -14.5%
Deferred tax assets 414.3 428.9 -3.4%
Other assets 52,066.9 51,944.2 0.2%
Total assets
700.8 247.3 183.4%
Deposits from banks 41,555.6 41,681.5 -0.3%
Deposits customers 1,780.3 2,304.9 -22.8%
Loans from banks and FIs 425.7 424.1 0.4%
Subordinated loan 0.0 0.0
Other liabilities 1,164.2 1,133.8 2.7%
Total liabilities 45,626.6 45,791.5 -0.4%
Total equity 6,440.3 6,152.7 4.7%
Total liabilities and equity 52,066.9 51,944.2 0.2%
23

Banca Transilvania HQ8, G. Baritiu Street, Cluj-Napoca 400027, Romania
+ 40 264 407 150+ 40 264 407 179 /FAX
www.bancatransilvania.ro/en/investor-relationswww.bancatransilvania.rowww.bt24.ro
facebook.com/BancaTransilvaniatwitter.com/b_Transilvanialinkedin.com/company/banca-transilvania
#
24