Embed Size (px)
Citation preview

Due Diligence Report on Environment Safeguards
February 2016
BAN: Railway Sector Investment Program –
Tranches 1, 2 and 3
Prepared by Bangladesh Railway for People’s Republic of Bangladesh and the Asian Development Bank.
CURRENCY EQUIVALENTS (as of February 2016)
Currency unit – Bangladesh Taka (BDT) BDT1.00 = $.012874
$1.00 = BDT 77.67500
ABBREVIATIONS AND ACRONYMS ADB - Asian Development Bank ADF - Asian Development Fund BG - Broad Gauge railway track where distance between rails is
1.676 metres BOD - Biological Oxygen Demand (Biochemical Oxygen Demand) BOQ - Bill of Quantities BR - Bangladesh Railway BRSIP - Bangladesh Railway Sector Improvement Program BUET - Bangladesh University of Engineering and Technology BWQS - Bangladesh Water Quality Standard CBI - Computer Based Interlocking CO - Carbon Monoxide COD - Chemical Oxygen Demand CREC - China Railway Group Ltd (Contractor) CSC - Construction Supervision Consultant DFID - Department for International Development (UK) DO - Dissolved Oxygen DOE - Department of Environment DORP - Development Organisation of the Rural Poor (NGO) DPP - Development Project Proforma/Proposal ECNEC - Executive Committee of National Economic Council EMP - Environmental Management Plan EMR - Environmental Monitoring Report EMWS - Environmental Management Implementation Works Schedule FC - Faecal Coliform GCC - General Conditions of Contract GM/PD - General Manager/Project Director, Bangladesh Railway GOB - Government of Bangladesh IA - Implementing Agency IEC - Impacted Environmental Components IPC - Interim Payment Certificate JICA - Japan International Cooperation Agency KMC - Knowledge Management Consultants Ltd (NGO) MFF - Multitranche Financing Facility MG - Metre Gauge railway track where distance between rails is
1 metre NGO/INGO - Non Governmental Organisation OCR - Ordinary Capital Resources OFC - Optical Fibre Cable PCC - Particular Conditions of Contract PD - Project Director RDPP - Revised Development Project Proforma/Proposal PFR - Project Financing Request
PM - Project Manager PM10 - Particulate Matter (≤ 10 micrometers or less) PSC - Pre-stressed Concrete ROW - Right of Way RDC - Rural Development Council (HIV/AIDS NGO) RP - Resettlement Plan SIEE - Summary Initial Environmental Examination SMEC - SMEC International Pty Ltd, Australia TBDLP - Tongi-Bhairab Bazar Double Line Project TDS - Total Dissolved Solids TP - Total Phosphates TSS - Total Suspended Solids WHO - World Health Organisation
This due diligence report on environment safeguards is a document of the borrower. The views expressed herein do not necessarily represent those of ADB's Board of Directors, Management, or staff, and may be preliminary in nature. In preparing any country program or strategy, financing any project, or by making any designation of or reference to a particular territory or geographic area in this document, the Asian Development Bank does not intend to make any judgments as to the legal or other status of any territory or area.
CONTENTS
I. INTRODUCTION 1
A. Report Purpose and Rationale 1 B. The Bangladesh Railway Sector Investment Program 1 C. Project Location and Scope 2 D. Implementation Progress as of December 2015 5 E. Environmental Categorization, Assessments, and Reporting 5 F. Institutional Setup and Responsibilities 6 G. Compliance with ADB Guidelines, Environmental Assessment Review
Framework (EARF) 7
II. STATUS OF EMP IMPLEMENTATION AND MONITORING REQUIREMENTS 13
A. The Environmental Management Plan 13 B. Environmental Monitoring Plan 14 1. Tranche 1 14 2. Tranche 2 18
III. FINDINGS AND RECOMMENDATIONS 21
APPENDIX 1: STATUS OF EMP IMPLEMENTATIONOF TRANCHE 2 24
1
I. INTRODUCTION
A. Report Purpose and Rationale
1. Environmental due diligence of ongoing tranches is a requirement of the Asian Development Bank (ADB) for a multi-tranche financing facility (MFF) during processing of subsequent tranches, as provided in Para 29, Section H, Multitranche Financing Facility, OM Section D14/OP issued on 17 February 2015. This EDD is a requirement for the processing of the Periodic Financial Request 4 (PFR4). Environmental due diligence (EDD) is a process of identifying environmental problems to avoid or manage risks that could result in increased costs for making the project comply with environmental regulations and address third-party damages. EDD helps ADB to determine whether the investments are ready for financing by allowing the early identification of potential sources of environmental risks and liabilities and avoid damage to corporate’s reputation.
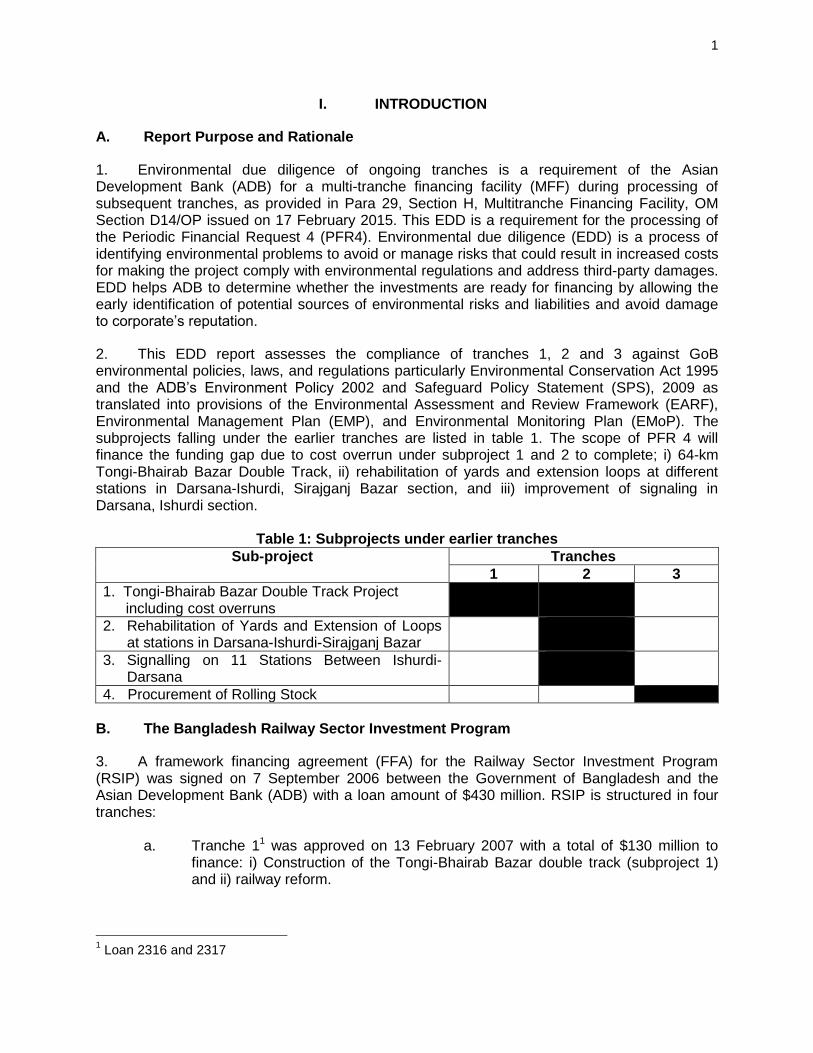
2. This EDD report assesses the compliance of tranches 1, 2 and 3 against GoB environmental policies, laws, and regulations particularly Environmental Conservation Act 1995 and the ADB’s Environment Policy 2002 and Safeguard Policy Statement (SPS), 2009 as translated into provisions of the Environmental Assessment and Review Framework (EARF), Environmental Management Plan (EMP), and Environmental Monitoring Plan (EMoP). The subprojects falling under the earlier tranches are listed in table 1. The scope of PFR 4 will finance the funding gap due to cost overrun under subproject 1 and 2 to complete; i) 64-km Tongi-Bhairab Bazar Double Track, ii) rehabilitation of yards and extension loops at different stations in Darsana-Ishurdi, Sirajganj Bazar section, and iii) improvement of signaling in Darsana, Ishurdi section.
Table 1: Subprojects under earlier tranches
Sub-project Tranches
1 2 3
1. Tongi-Bhairab Bazar Double Track Project including cost overruns
2. Rehabilitation of Yards and Extension of Loops at stations in Darsana-Ishurdi-Sirajganj Bazar
3. Signalling on 11 Stations Between Ishurdi-Darsana
4. Procurement of Rolling Stock
B. The Bangladesh Railway Sector Investment Program
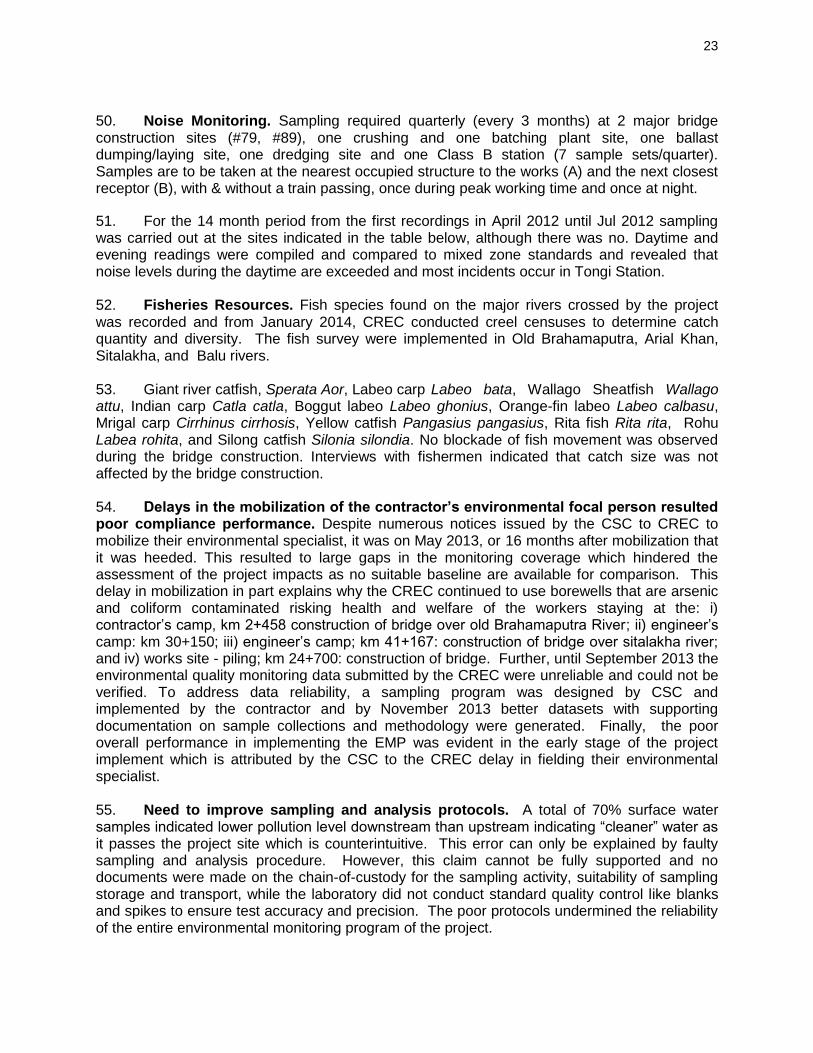
3. A framework financing agreement (FFA) for the Railway Sector Investment Program (RSIP) was signed on 7 September 2006 between the Government of Bangladesh and the Asian Development Bank (ADB) with a loan amount of $430 million. RSIP is structured in four tranches:
a. Tranche 11 was approved on 13 February 2007 with a total of $130 million to finance: i) Construction of the Tongi-Bhairab Bazar double track (subproject 1) and ii) railway reform.
1 Loan 2316 and 2317
2
b. Tranche 22 with a loan for $150 million was approved on 22 December 2011 for financing i) funding gap due to cost overrun under subproject 1, ii) rehabilitation of yards and extension of Loops at Different Stations in the Darsana-IshurdiSirajganj Bazar Section (subproject 2), (ii) upgrading of Signaling at 11 stations between Ishurdi and Darsana (subproject 3), and (iii) construction supervision consulting services for subprojects 2 and 3.
c. Tranche 33 with a loan for $100 million was approved on 9 December 2013 for financing the procurement of rolling stock.
C. Project Location and Scope
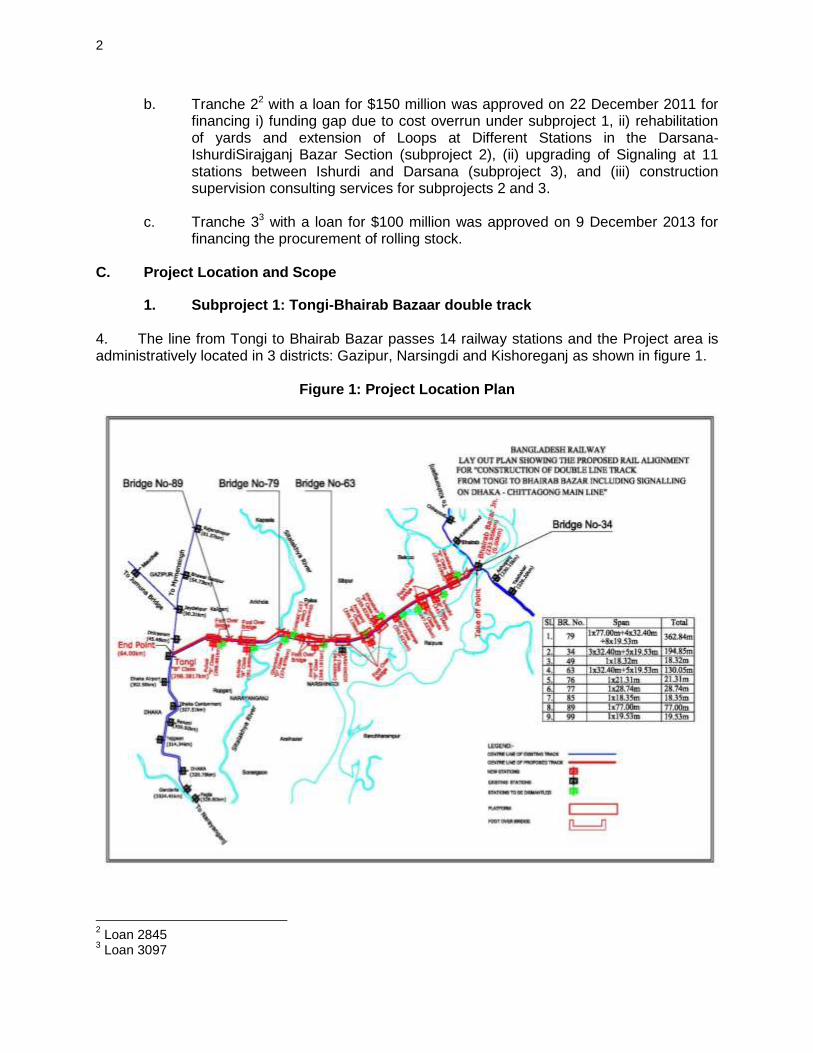
1. Subproject 1: Tongi-Bhairab Bazaar double track 4. The line from Tongi to Bhairab Bazar passes 14 railway stations and the Project area is administratively located in 3 districts: Gazipur, Narsingdi and Kishoreganj as shown in figure 1.
Figure 1: Project Location Plan
2 Loan 2845
3 Loan 3097

3
5. The scope of the Tongi-Bhairab Bazar Double Line Project (TBDLP) and the major project activities are summarized as follows:
(i) Construction of 64 km of main line and 22 km of loops and sidings involving widening of embankment and construction of new embankment for bridge approaches alongside the existing operating main line. The embankment is to be constructed to accommodate future broad gauge (BG) tracks.
(ii) About 2 million cubic metres of new embankment from the ROW and river dredging).
(iii) Construction of new Metre Gauge (MG) track with 90A rails for the down-line including new loops and sidings at stations involving 64 km of main line and 22 km of loops and sidings.
(iv) Construction of 40 new bridges and 31 new culverts.
(v) Construction of 10 station buildings, platforms, platform sheds, several foot overbridges and remodelling of station yards.
(vi) Modernisation of signalling systems of 12 stations involving the Supply and installation of computer based interlocking (CBI) signalling system with associated telecommunications facilities at these stations.
(vii) Relocation of overhead electricity wire crossings and underground utility crossings affecting construction works. Construction of 37 Level Crossings including Gate Goomties and Equipment Rooms for Signalling.
(viii) Construction and upgrading of access roads to the stations
2. Subproject 2: Rehabilitation of yards and extension of loops Lines at Darsana-Ishurdi-Siraganj Bazar BG Section
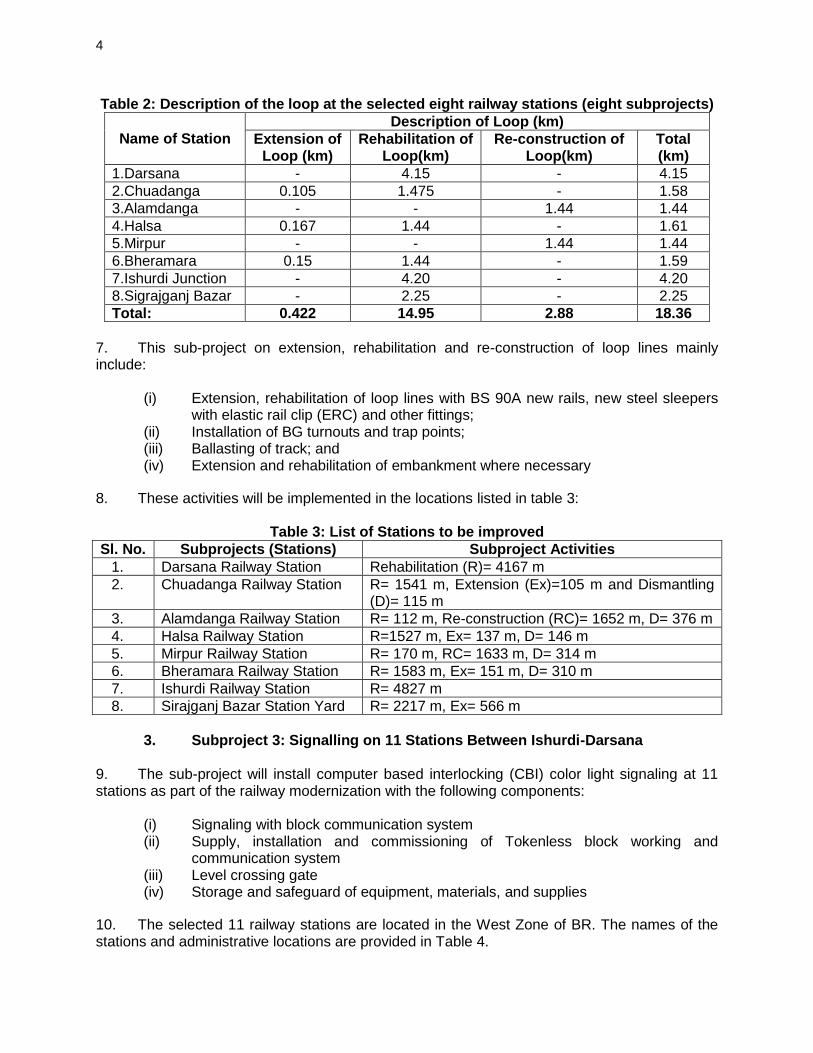
6. The scope of this subproject include the rehabilitation of yards, increasing lengths of the loops and siding lines of a priority list of 8 stations (Table 2) that lie in Darsana-Ishurdi-Sirajganj Bazar for strengthening the holding capacity of the stations, and for increasing the throughput capacity of the section (Table 3). The following works are proposed:
1. Darsana-Ishurdi Junction Section:
Loops to be extended/reconstructed: 9 loops at 5 stations;
Rehabilitation of the loops involved in extension; and
Rehabilitation of yard lines: Darsana 4, Ishurdi Junction 6.
2. Ishurdi-Sirajganj Section:
Rehabilitation of yard lines: 3 lines (Sirajganj Bazar yard)
4
Table 2: Description of the loop at the selected eight railway stations (eight subprojects)
Name of Station Description of Loop (km)
Extension of Loop (km)
Rehabilitation of Loop(km)
Re-construction of Loop(km)
Total (km)
1.Darsana - 4.15 - 4.15
2.Chuadanga 0.105 1.475 - 1.58
3.Alamdanga - - 1.44 1.44
4.Halsa 0.167 1.44 - 1.61
5.Mirpur - - 1.44 1.44
6.Bheramara 0.15 1.44 - 1.59
7.Ishurdi Junction - 4.20 - 4.20
8.Sigrajganj Bazar - 2.25 - 2.25
Total: 0.422 14.95 2.88 18.36
7. This sub-project on extension, rehabilitation and re-construction of loop lines mainly include:
(i) Extension, rehabilitation of loop lines with BS 90A new rails, new steel sleepers with elastic rail clip (ERC) and other fittings;
(ii) Installation of BG turnouts and trap points; (iii) Ballasting of track; and (iv) Extension and rehabilitation of embankment where necessary
8. These activities will be implemented in the locations listed in table 3:
Table 3: List of Stations to be improved
Sl. No. Subprojects (Stations) Subproject Activities
1. Darsana Railway Station Rehabilitation (R)= 4167 m
2. Chuadanga Railway Station R= 1541 m, Extension (Ex)=105 m and Dismantling (D)= 115 m
3. Alamdanga Railway Station R= 112 m, Re-construction (RC)= 1652 m, D= 376 m
4. Halsa Railway Station R=1527 m, Ex= 137 m, D= 146 m
5. Mirpur Railway Station R= 170 m, RC= 1633 m, D= 314 m
6. Bheramara Railway Station R= 1583 m, Ex= 151 m, D= 310 m
7. Ishurdi Railway Station R= 4827 m
8. Sirajganj Bazar Station Yard R= 2217 m, Ex= 566 m
3. Subproject 3: Signalling on 11 Stations Between Ishurdi-Darsana
9. The sub-project will install computer based interlocking (CBI) color light signaling at 11 stations as part of the railway modernization with the following components:
(i) Signaling with block communication system (ii) Supply, installation and commissioning of Tokenless block working and
communication system (iii) Level crossing gate (iv) Storage and safeguard of equipment, materials, and supplies
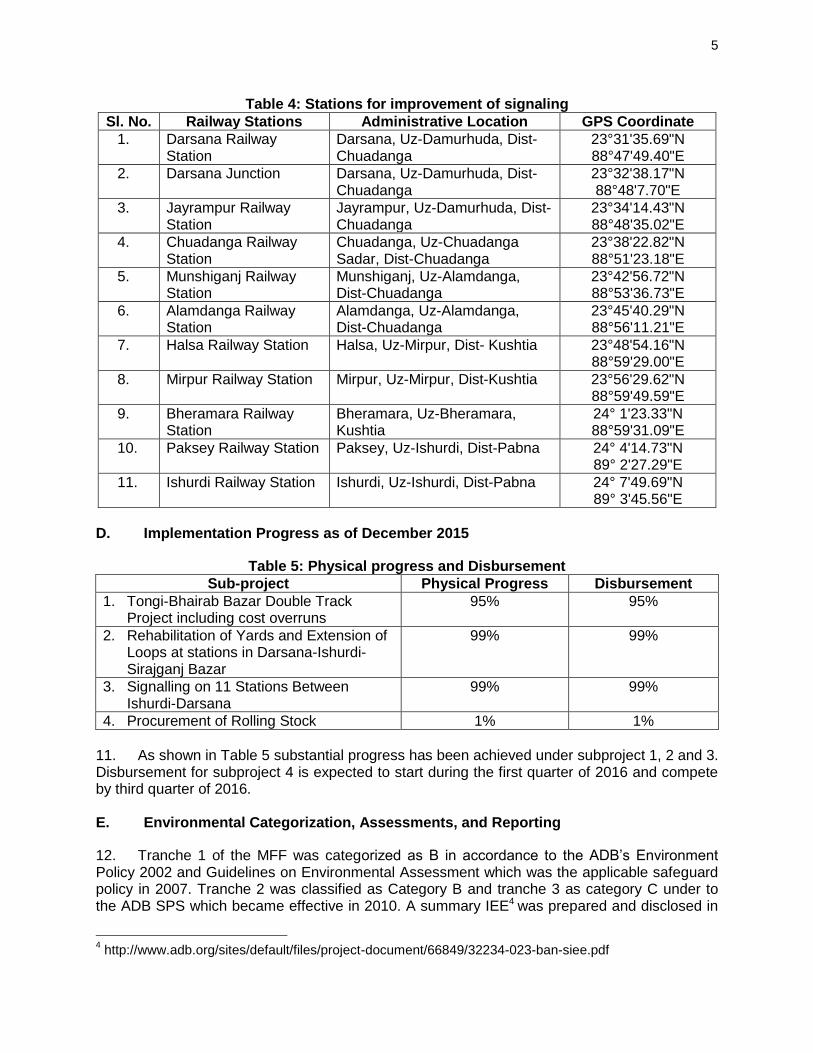
10. The selected 11 railway stations are located in the West Zone of BR. The names of the stations and administrative locations are provided in Table 4.
5
Table 4: Stations for improvement of signaling
Sl. No. Railway Stations Administrative Location GPS Coordinate
1. Darsana Railway Station
Darsana, Uz-Damurhuda, Dist-Chuadanga
23°31'35.69"N 88°47'49.40"E
2. Darsana Junction Darsana, Uz-Damurhuda, Dist-Chuadanga
23°32'38.17"N 88°48'7.70"E
3. Jayrampur Railway Station
Jayrampur, Uz-Damurhuda, Dist-Chuadanga
23°34'14.43"N 88°48'35.02"E
4. Chuadanga Railway Station
Chuadanga, Uz-Chuadanga Sadar, Dist-Chuadanga
23°38'22.82"N 88°51'23.18"E
5. Munshiganj Railway Station
Munshiganj, Uz-Alamdanga, Dist-Chuadanga
23°42'56.72"N 88°53'36.73"E
6. Alamdanga Railway Station
Alamdanga, Uz-Alamdanga, Dist-Chuadanga
23°45'40.29"N 88°56'11.21"E
7. Halsa Railway Station Halsa, Uz-Mirpur, Dist- Kushtia 23°48'54.16"N 88°59'29.00"E
8. Mirpur Railway Station Mirpur, Uz-Mirpur, Dist-Kushtia 23°56'29.62"N 88°59'49.59"E
9. Bheramara Railway Station
Bheramara, Uz-Bheramara, Kushtia
24° 1'23.33"N 88°59'31.09"E
10. Paksey Railway Station Paksey, Uz-Ishurdi, Dist-Pabna 24° 4'14.73"N 89° 2'27.29"E
11. Ishurdi Railway Station Ishurdi, Uz-Ishurdi, Dist-Pabna 24° 7'49.69"N 89° 3'45.56"E
D. Implementation Progress as of December 2015
Table 5: Physical progress and Disbursement
Sub-project Physical Progress Disbursement
1. Tongi-Bhairab Bazar Double Track Project including cost overruns
95% 95%
2. Rehabilitation of Yards and Extension of Loops at stations in Darsana-Ishurdi-Sirajganj Bazar
99% 99%
3. Signalling on 11 Stations Between Ishurdi-Darsana
99% 99%
4. Procurement of Rolling Stock 1% 1%
11. As shown in Table 5 substantial progress has been achieved under subproject 1, 2 and 3. Disbursement for subproject 4 is expected to start during the first quarter of 2016 and compete by third quarter of 2016. E. Environmental Categorization, Assessments, and Reporting
12. Tranche 1 of the MFF was categorized as B in accordance to the ADB’s Environment Policy 2002 and Guidelines on Environmental Assessment which was the applicable safeguard policy in 2007. Tranche 2 was classified as Category B and tranche 3 as category C under to the ADB SPS which became effective in 2010. A summary IEE4 was prepared and disclosed in
4 http://www.adb.org/sites/default/files/project-document/66849/32234-023-ban-siee.pdf
6
September 2006 for Subproject 1, Tranche 1 on Tongi-Bhairab Bazar Double Track Project. Under Tranche 2 an IEE report5 for Subproject 2 on the Rehabilitation of Yards and Extension of Loops at Different Stations in Darsana — Ishurdi — Sirajganj Bazar Section was prepared and disclosed in October 2011 in compliance to SPS 2009. Subproject 3, Tranche 2 Signalling on 11 Stations Between Ishurdi-Darsana, and Subproject 4, Tranche 3, Procurement of Rolling Stock were categorized as C. 13. A total of 6 annual and semi-annual monitoring reports have been prepared for the subproject 1 and disclosed on the ADB website in compliance to EARF and loan covenants These monitoring reports cover the periods of: December 2011 - October 20126, November 2012 - August 20137, September 2013 - June 20148, July – December 20149, January – June 201510 and July – December 201511. One annual environmental monitoring report covering the period of January – December 2015 has been prepared for subproject 2 and disclosed on the ADB website. 14. Mainly due to the time gap between the IEE review and approval and the start of construction, the environmental management plans (EMPs) of Tranches 1 and 2 were updated by the CSC to better guide the Contractor implement the needed mitigation and monitoring measures. These EMPs for the 2 category B sub-projects substantially expanded the previous EMP. The revised EMPs were incorporated into the detailed design and the tender documents and have then become a part of the civil works contract. The cost for the implementation of the EMP has been included in the Contract and the approved Revised Development Project Proforma/Proposal (RDPP). The updated EMP for Tranche 1 was approved by ADB in 2008 and was included in the tender documentation in 2008. The updated EMP for Tranche 2 subproject 2 was revised in May 2014. F. Institutional Setup and Responsibilities
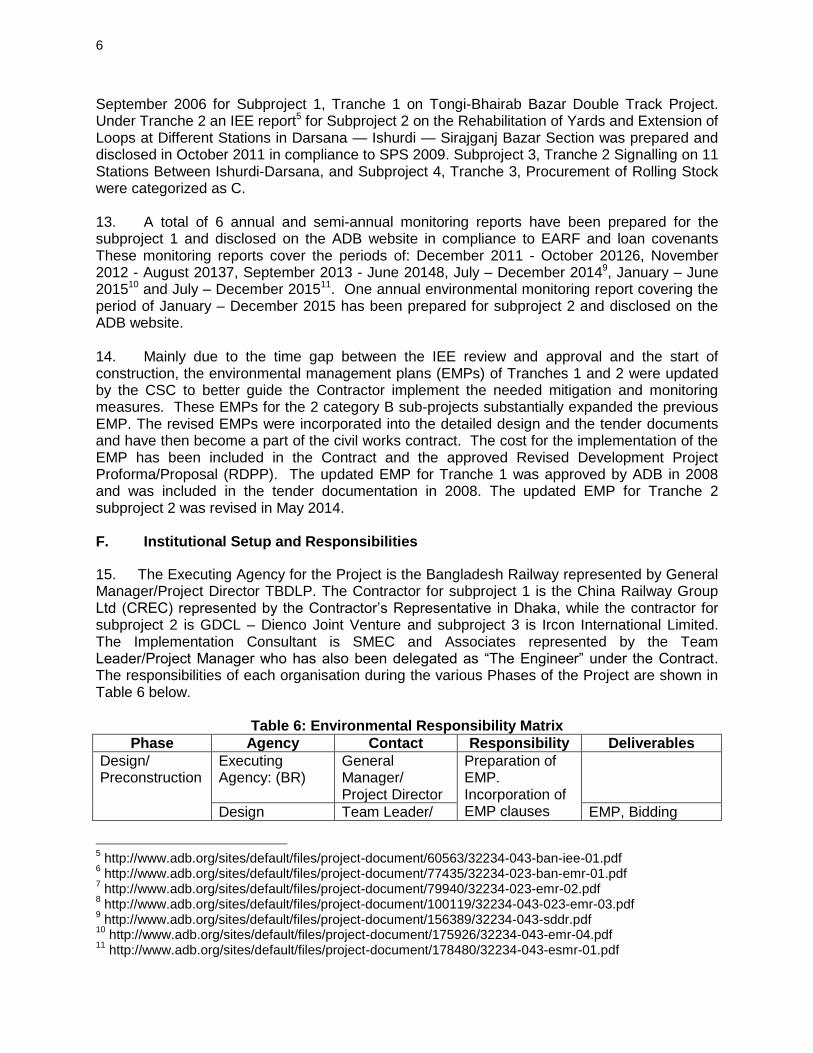
15. The Executing Agency for the Project is the Bangladesh Railway represented by General Manager/Project Director TBDLP. The Contractor for subproject 1 is the China Railway Group Ltd (CREC) represented by the Contractor’s Representative in Dhaka, while the contractor for subproject 2 is GDCL – Dienco Joint Venture and subproject 3 is Ircon International Limited. The Implementation Consultant is SMEC and Associates represented by the Team Leader/Project Manager who has also been delegated as “The Engineer” under the Contract. The responsibilities of each organisation during the various Phases of the Project are shown in Table 6 below.
Table 6: Environmental Responsibility Matrix
Phase Agency Contact Responsibility Deliverables
Design/ Preconstruction
Executing Agency: (BR)
General Manager/ Project Director
Preparation of EMP. Incorporation of EMP clauses
Design Team Leader/ EMP, Bidding
5 http://www.adb.org/sites/default/files/project-document/60563/32234-043-ban-iee-01.pdf
6 http://www.adb.org/sites/default/files/project-document/77435/32234-023-ban-emr-01.pdf
7 http://www.adb.org/sites/default/files/project-document/79940/32234-023-emr-02.pdf
8 http://www.adb.org/sites/default/files/project-document/100119/32234-043-023-emr-03.pdf
9 http://www.adb.org/sites/default/files/project-document/156389/32234-043-sddr.pdf
10 http://www.adb.org/sites/default/files/project-document/175926/32234-043-emr-04.pdf
11 http://www.adb.org/sites/default/files/project-document/178480/32234-043-esmr-01.pdf

7
Phase Agency Contact Responsibility Deliverables
Consultant: SMEC & Associates
Project Manager into bidding documents. Reporting to ADB.
Documents
Construction Executing Agency: (BR)
General Manager/ Project Director
Monitoring of EMP Implementation, Audit and Reporting to ADB.
Monthly, Quarterly Reports. Semi-Annual Reports to ADB. Implementation
Consultant: SMEC & Associates
Team Leader/ Project Manager
Contractor: China Railway Group Ltd (CREC) for Tranche 1, and subproject 2 is GDCL – Dienco Joint Venture and subproject 3 is Ircon International Limited, Tranche 2
CREC Representative
Implementation of Mitigation Measures and internal monitoring & reporting
Monthly Reports
INGO: DORP DORP Team Leader
Execution of RP Monthly Reports
NGO: RDC RDC Team Leader
Delivery of HIV/AIDS Awareness Program
Monthly Reports
Independent 3rd Party RP monitor:
KMC Managing Director
Monitoring of execution & Compliance of UFRP
Inception Report, Bi-Annual Report, Final Report.
Operation / Post Construction
Executing Agency: (BR)
General Manager/ Project Director
Monitoring of EMP Implementation,
G. Compliance with ADB Guidelines, Environmental Assessment Review Framework
(EARF)
16. The BRSIP complied with the ADB Environmental Assessment (EA) Policy 200212 and ADB SPS 2009 environmental safeguards requirements:
Tranche 1 was classified as environment category B as it involved substantial physical works for double tracking of the rail line between Tongi and Bhairab
12
At the time of the approval of Tranche 1 the applicable environment safeguard policy was the ADB Environmental Assessment Policy 2002. The ADB Safeguard Policy Statement 2009 governs safeguards requirements for Tranche 2
8
Bazaar, but did not involve encroachment on any protected area or other forms of environmentally sensitive areas. An SIEE as required by the EA Policy 2002 was prepared and disclosed on the ADB website.
Tranche 2 was screened using appropriate REA checklist and based on potential impacts the Rehabilitation of Loop Lines at Darsana-Ishurdi-Siraganj Bazar BG Section (sub-project 2) was considered as Category B while the Computer Based Interlocking Colour Light Signalling System on Turnkey Basis at 11 Stations in Ishurdi-Darsana Section of Bangladesh Railway (sub-project 3) was Category C. An IEE report was prepared for the Rehabilitation of Loop Lines at Darsana-Ishurdi-Siraganj Bazar BG Section (sub-project 2) reviewed, and disclosed in the ADB and BR websites
Sub-project 4, Tranche 3 Procurement of Rolling Stock was classified as environment category C.
The bid document for the Rehabilitation of Loop Lines sub-project included the EMP
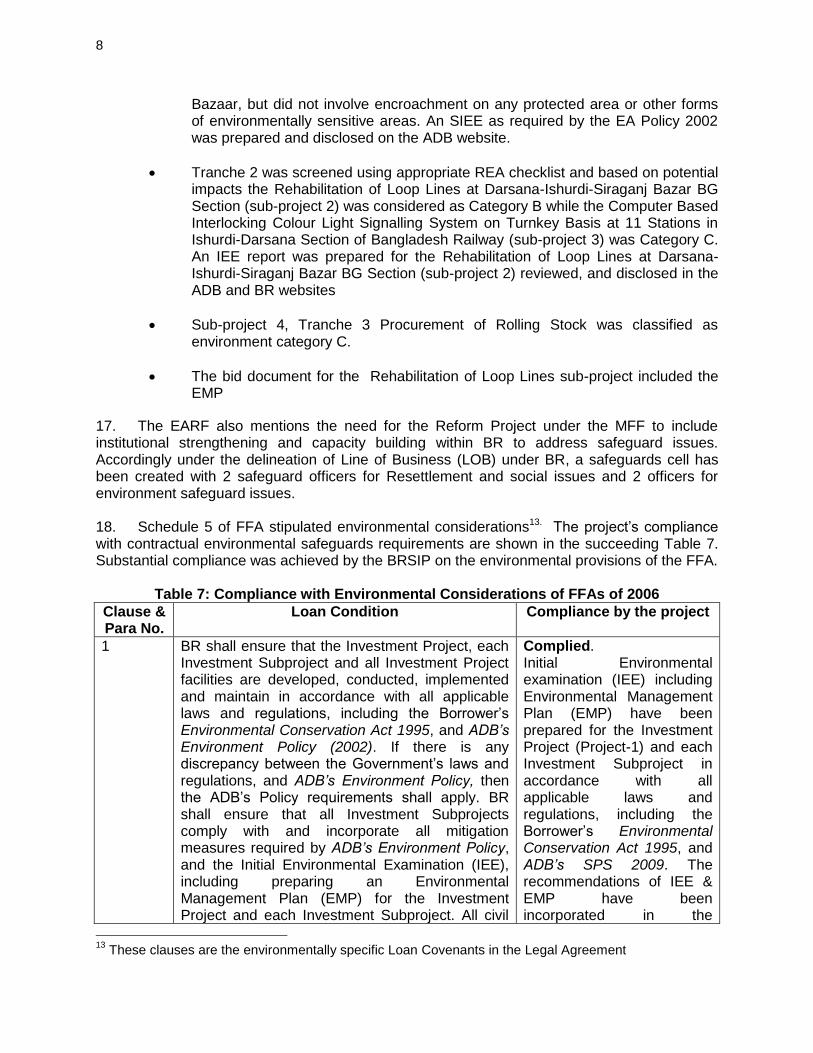
17. The EARF also mentions the need for the Reform Project under the MFF to include institutional strengthening and capacity building within BR to address safeguard issues. Accordingly under the delineation of Line of Business (LOB) under BR, a safeguards cell has been created with 2 safeguard officers for Resettlement and social issues and 2 officers for environment safeguard issues. 18. Schedule 5 of FFA stipulated environmental considerations13. The project’s compliance with contractual environmental safeguards requirements are shown in the succeeding Table 7. Substantial compliance was achieved by the BRSIP on the environmental provisions of the FFA.
Table 7: Compliance with Environmental Considerations of FFAs of 2006
Clause & Para No.
Loan Condition Compliance by the project
1 BR shall ensure that the Investment Project, each Investment Subproject and all Investment Project facilities are developed, conducted, implemented and maintain in accordance with all applicable laws and regulations, including the Borrower’s Environmental Conservation Act 1995, and ADB’s Environment Policy (2002). If there is any discrepancy between the Government’s laws and regulations, and ADB’s Environment Policy, then the ADB’s Policy requirements shall apply. BR shall ensure that all Investment Subprojects comply with and incorporate all mitigation measures required by ADB’s Environment Policy, and the Initial Environmental Examination (IEE), including preparing an Environmental Management Plan (EMP) for the Investment Project and each Investment Subproject. All civil
Complied. Initial Environmental examination (IEE) including Environmental Management Plan (EMP) have been prepared for the Investment Project (Project-1) and each Investment Subproject in accordance with all applicable laws and regulations, including the Borrower’s Environmental Conservation Act 1995, and ADB’s SPS 2009. The recommendations of IEE & EMP have been incorporated in the
13
These clauses are the environmentally specific Loan Covenants in the Legal Agreement
9
Clause & Para No.
Loan Condition Compliance by the project
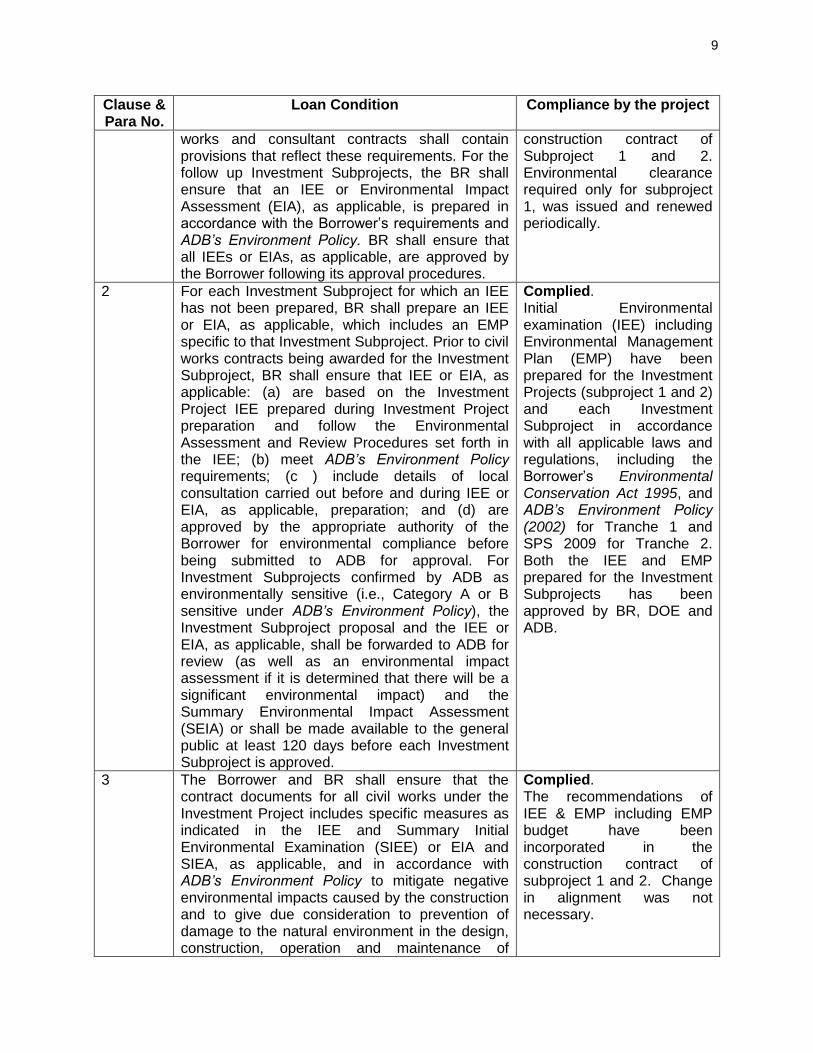
works and consultant contracts shall contain provisions that reflect these requirements. For the follow up Investment Subprojects, the BR shall ensure that an IEE or Environmental Impact Assessment (EIA), as applicable, is prepared in accordance with the Borrower’s requirements and ADB’s Environment Policy. BR shall ensure that all IEEs or EIAs, as applicable, are approved by the Borrower following its approval procedures.
construction contract of Subproject 1 and 2. Environmental clearance required only for subproject 1, was issued and renewed periodically.
2 For each Investment Subproject for which an IEE has not been prepared, BR shall prepare an IEE or EIA, as applicable, which includes an EMP specific to that Investment Subproject. Prior to civil works contracts being awarded for the Investment Subproject, BR shall ensure that IEE or EIA, as applicable: (a) are based on the Investment Project IEE prepared during Investment Project preparation and follow the Environmental Assessment and Review Procedures set forth in the IEE; (b) meet ADB’s Environment Policy requirements; (c ) include details of local consultation carried out before and during IEE or EIA, as applicable, preparation; and (d) are approved by the appropriate authority of the Borrower for environmental compliance before being submitted to ADB for approval. For Investment Subprojects confirmed by ADB as environmentally sensitive (i.e., Category A or B sensitive under ADB’s Environment Policy), the Investment Subproject proposal and the IEE or EIA, as applicable, shall be forwarded to ADB for review (as well as an environmental impact assessment if it is determined that there will be a significant environmental impact) and the Summary Environmental Impact Assessment (SEIA) or shall be made available to the general public at least 120 days before each Investment Subproject is approved.
Complied. Initial Environmental examination (IEE) including Environmental Management Plan (EMP) have been prepared for the Investment Projects (subproject 1 and 2) and each Investment Subproject in accordance with all applicable laws and regulations, including the Borrower’s Environmental Conservation Act 1995, and ADB’s Environment Policy (2002) for Tranche 1 and SPS 2009 for Tranche 2. Both the IEE and EMP prepared for the Investment Subprojects has been approved by BR, DOE and ADB.
3 The Borrower and BR shall ensure that the contract documents for all civil works under the Investment Project includes specific measures as indicated in the IEE and Summary Initial Environmental Examination (SIEE) or EIA and SIEA, as applicable, and in accordance with ADB’s Environment Policy to mitigate negative environmental impacts caused by the construction and to give due consideration to prevention of damage to the natural environment in the design, construction, operation and maintenance of
Complied. The recommendations of IEE & EMP including EMP budget have been incorporated in the construction contract of subproject 1 and 2. Change in alignment was not necessary.

10
Clause & Para No.
Loan Condition Compliance by the project
Investment Project facilities. If there are any changes in the specific locations or alignments or infrastructure or Invest Project facilities after the IEE or EIA, as applicable, is completed, for either already approved Investment Subprojects or for proposed Investment Subprojects, an additional environmental assessment shall be completed and a process similar to that used for an IEE or SIEE, as applicable, and acceptable to ADB, shall be undertaken.
4 BR shall: (a) prepare an Investment Project Environment Management Plan to monitor the contractor’s implementation of the EMPs;
Complied.
(b) ensure that specific provisions are included for the preparation, implementation, and monitoring of EMPs in civil works and consulting services contracts;
Complied.
(c ) ensure that the environmental mitigation measures in the IEE or EIA, as applicable, are adequately implemented by the contractors; and
Complied. Contractor is progressing with the works and is following the requirements in the EMP for mitigation and monitoring. CSC is monitoring these activities with regular site inspections, audits and advice to the Contractor and providing timely reports to BR.
(d) provide adequate budgetary allocation for this activity.
Complied.
5 The Borrower and BR shall ensure that the contract documents for all civil works under the Investment Project includes specific measures as indicated in the SIEE and IEE or EIA and SIEA, as applicable, and in accordance with ADB’s Environment Policy to mitigate negative environmental impacts caused by the construction and to give due consideration to prevention of damage to the natural environment in the design, construction, operation and maintenance of Investment Project facilities. Such mitigation measures may include, but not limited to, rerouting traffic, maintaining moisture content during soil handling, controlling noise and vibration during construction, pumping stagnant water and providing adequate drainage, restricting placement of construction materials and
Complied. The recommendations of IEE & EMP have been incorporated in the construction contract of subproject 1 and 2. Mitigation measures have been implemented by the contractor.
11
Clause & Para No.
Loan Condition Compliance by the project
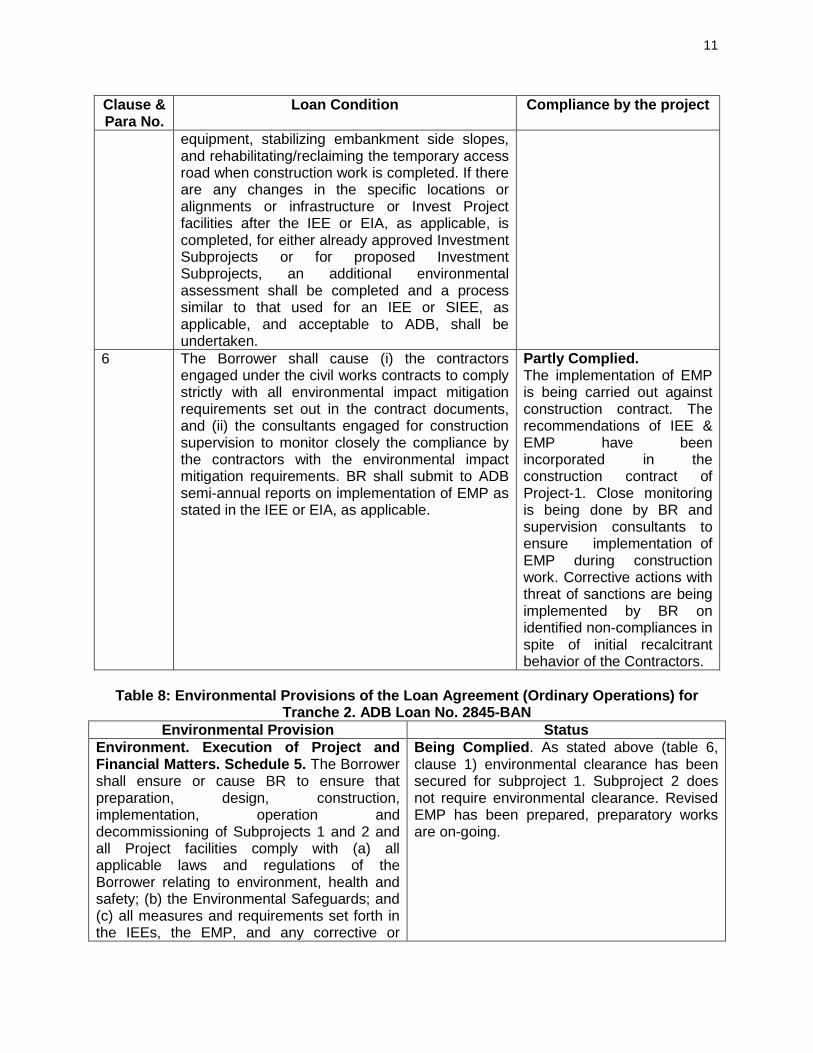
equipment, stabilizing embankment side slopes, and rehabilitating/reclaiming the temporary access road when construction work is completed. If there are any changes in the specific locations or alignments or infrastructure or Invest Project facilities after the IEE or EIA, as applicable, is completed, for either already approved Investment Subprojects or for proposed Investment Subprojects, an additional environmental assessment shall be completed and a process similar to that used for an IEE or SIEE, as applicable, and acceptable to ADB, shall be undertaken.
6 The Borrower shall cause (i) the contractors engaged under the civil works contracts to comply strictly with all environmental impact mitigation requirements set out in the contract documents, and (ii) the consultants engaged for construction supervision to monitor closely the compliance by the contractors with the environmental impact mitigation requirements. BR shall submit to ADB semi-annual reports on implementation of EMP as stated in the IEE or EIA, as applicable.
Partly Complied. The implementation of EMP is being carried out against construction contract. The recommendations of IEE & EMP have been incorporated in the construction contract of Project-1. Close monitoring is being done by BR and supervision consultants to ensure implementation of EMP during construction work. Corrective actions with threat of sanctions are being implemented by BR on identified non-compliances in spite of initial recalcitrant behavior of the Contractors.
Table 8: Environmental Provisions of the Loan Agreement (Ordinary Operations) for
Tranche 2. ADB Loan No. 2845-BAN
Environmental Provision Status
Environment. Execution of Project and Financial Matters. Schedule 5. The Borrower shall ensure or cause BR to ensure that preparation, design, construction, implementation, operation and decommissioning of Subprojects 1 and 2 and all Project facilities comply with (a) all applicable laws and regulations of the Borrower relating to environment, health and safety; (b) the Environmental Safeguards; and (c) all measures and requirements set forth in the IEEs, the EMP, and any corrective or
Being Complied. As stated above (table 6, clause 1) environmental clearance has been secured for subproject 1. Subproject 2 does not require environmental clearance. Revised EMP has been prepared, preparatory works are on-going.
12
Environmental Provision Status
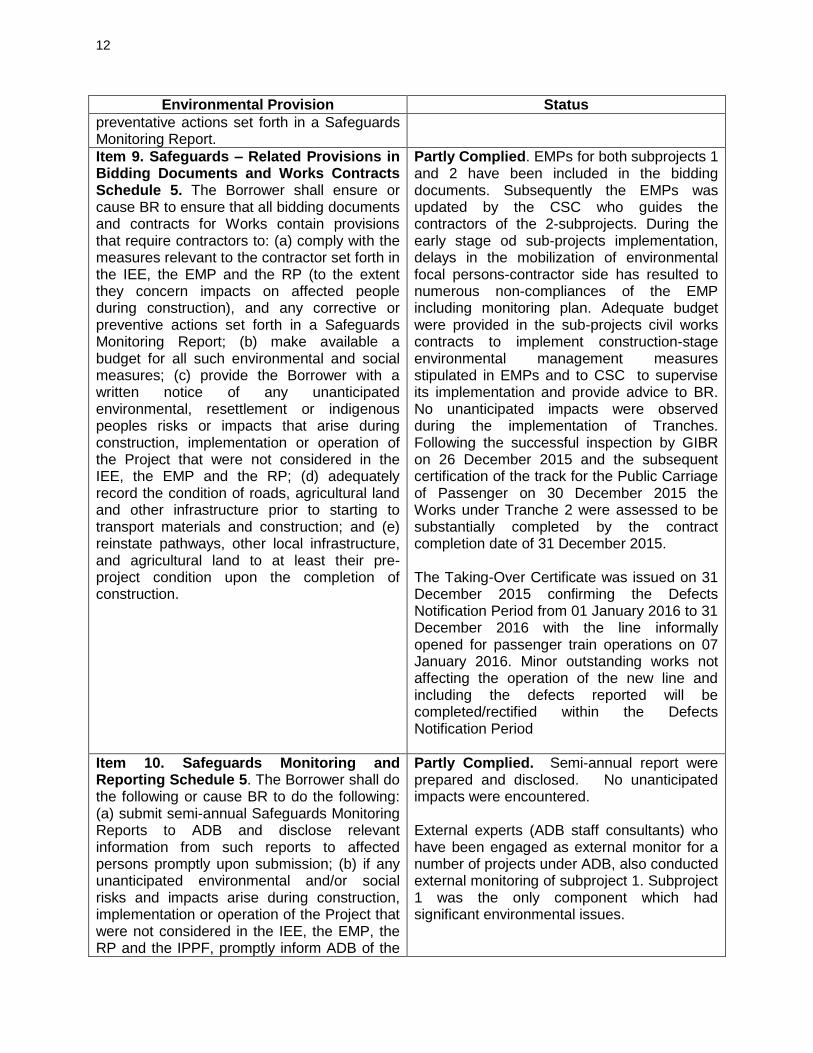
preventative actions set forth in a Safeguards Monitoring Report.
Item 9. Safeguards – Related Provisions in Bidding Documents and Works Contracts Schedule 5. The Borrower shall ensure or cause BR to ensure that all bidding documents and contracts for Works contain provisions that require contractors to: (a) comply with the measures relevant to the contractor set forth in the IEE, the EMP and the RP (to the extent they concern impacts on affected people during construction), and any corrective or preventive actions set forth in a Safeguards Monitoring Report; (b) make available a budget for all such environmental and social measures; (c) provide the Borrower with a written notice of any unanticipated environmental, resettlement or indigenous peoples risks or impacts that arise during construction, implementation or operation of the Project that were not considered in the IEE, the EMP and the RP; (d) adequately record the condition of roads, agricultural land and other infrastructure prior to starting to transport materials and construction; and (e) reinstate pathways, other local infrastructure, and agricultural land to at least their pre-project condition upon the completion of construction.
Partly Complied. EMPs for both subprojects 1 and 2 have been included in the bidding documents. Subsequently the EMPs was updated by the CSC who guides the contractors of the 2-subprojects. During the early stage od sub-projects implementation, delays in the mobilization of environmental focal persons-contractor side has resulted to numerous non-compliances of the EMP including monitoring plan. Adequate budget were provided in the sub-projects civil works contracts to implement construction-stage environmental management measures stipulated in EMPs and to CSC to supervise its implementation and provide advice to BR. No unanticipated impacts were observed during the implementation of Tranches. Following the successful inspection by GIBR on 26 December 2015 and the subsequent certification of the track for the Public Carriage of Passenger on 30 December 2015 the Works under Tranche 2 were assessed to be substantially completed by the contract completion date of 31 December 2015. The Taking-Over Certificate was issued on 31 December 2015 confirming the Defects Notification Period from 01 January 2016 to 31 December 2016 with the line informally opened for passenger train operations on 07 January 2016. Minor outstanding works not affecting the operation of the new line and including the defects reported will be completed/rectified within the Defects Notification Period
Item 10. Safeguards Monitoring and Reporting Schedule 5. The Borrower shall do the following or cause BR to do the following: (a) submit semi-annual Safeguards Monitoring Reports to ADB and disclose relevant information from such reports to affected persons promptly upon submission; (b) if any unanticipated environmental and/or social risks and impacts arise during construction, implementation or operation of the Project that were not considered in the IEE, the EMP, the RP and the IPPF, promptly inform ADB of the
Partly Complied. Semi-annual report were prepared and disclosed. No unanticipated impacts were encountered. External experts (ADB staff consultants) who have been engaged as external monitor for a number of projects under ADB, also conducted external monitoring of subproject 1. Subproject 1 was the only component which had significant environmental issues.
13
Environmental Provision Status
occurrence of such risks or impacts, with detailed description of the event and proposed corrective action plan; (c) engage qualified and experienced external expert[s] or qualified NGO[s] under a selection process and terms of reference acceptable to ADB, to verify information produced through the Project monitoring process, and facilitate the carrying out of any verification activities by such external experts; (d) no later than 6 months after the Effective Date engage an independent advisory panel to monitor and report upon Project implementation, and facilitate the carrying out of any monitoring activities by such panel; and (e) report any actual or potential breach of compliance with the measures and requirements set forth in the EMP and the RP promptly after becoming aware of the breach.
II. STATUS OF EMP IMPLEMENTATION AND MONITORING REQUIREMENTS
A. The Environmental Management Plan
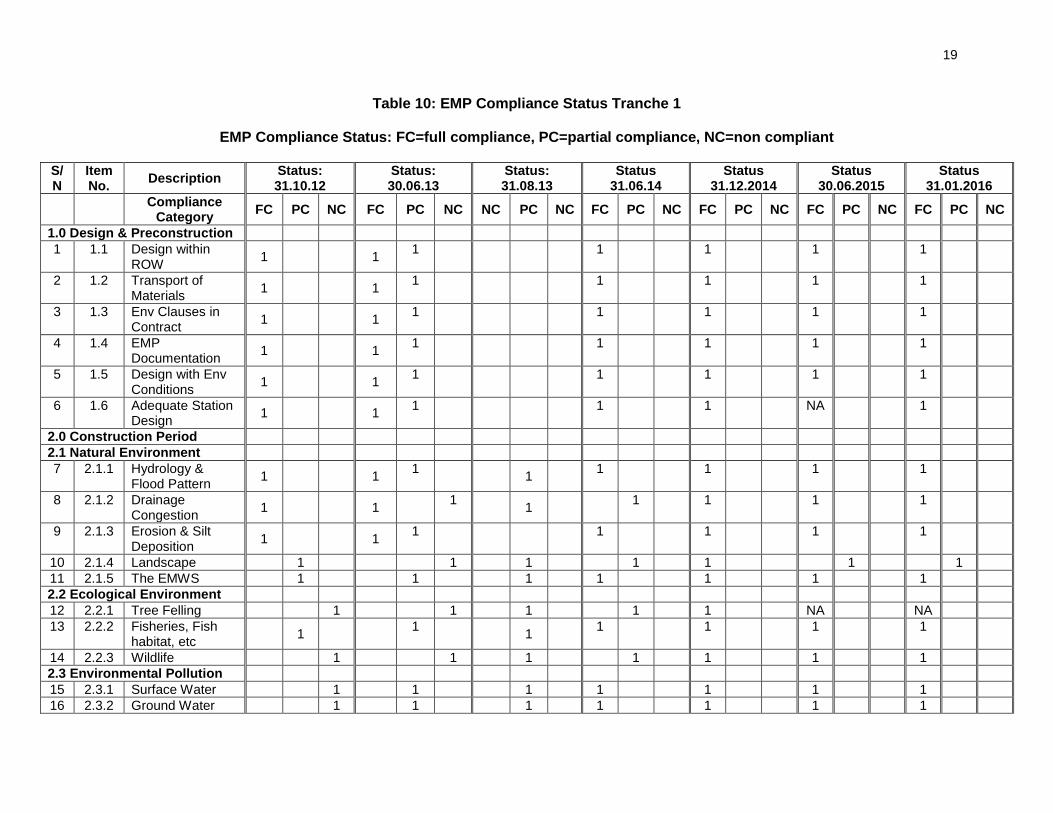
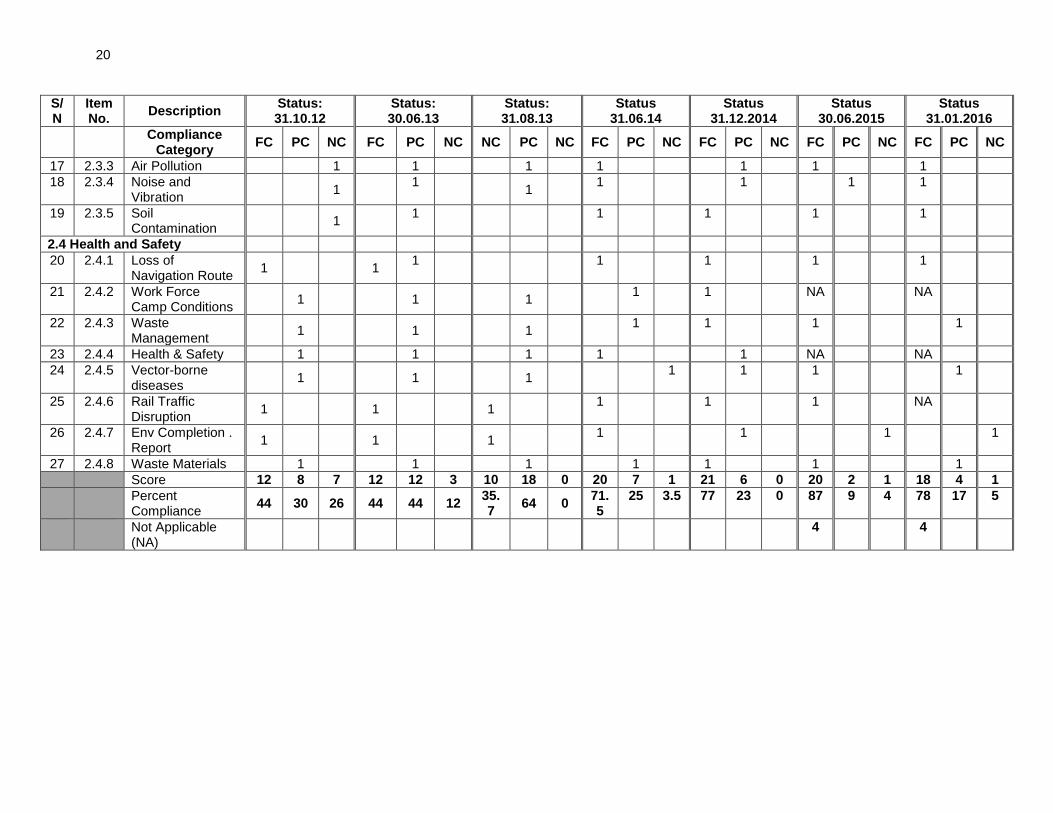
19. The revised EMP for Subproject 1, Tranche 1 contains 34 preconstruction, construction, and operation mitigation measures. Of this 27 pertain to pre-construction and construction stage. Table 10 presents the compliance performance of subproject 1 from 31.10.12 to 30.11.15 which demonstrates continuous improvement in overall compliance rate. Of the 27 pre-construction and construction mitigation measures, TBDL sub-project registered full compliance on 78% of the EMP requirements as of the last reporting. Full compliances were achieved on the design and preconstruction, natural environment, ecological environment, and environmental pollution aspects of the EMP. Partial compliance were not improved in the area of health and safety and waste management with the lack of waste bins in the station facilities, and dirty work and camp sites. However, a continuing non-compliance all throughout the project implementation is the delay in the submission of timely environmental monitoring report. Figure 2 clearly depicts the continuous improvement towards environmental compliance of Tranche 1.

14
Figure 2: Line graph of environmental compliance performance, Tranche 1
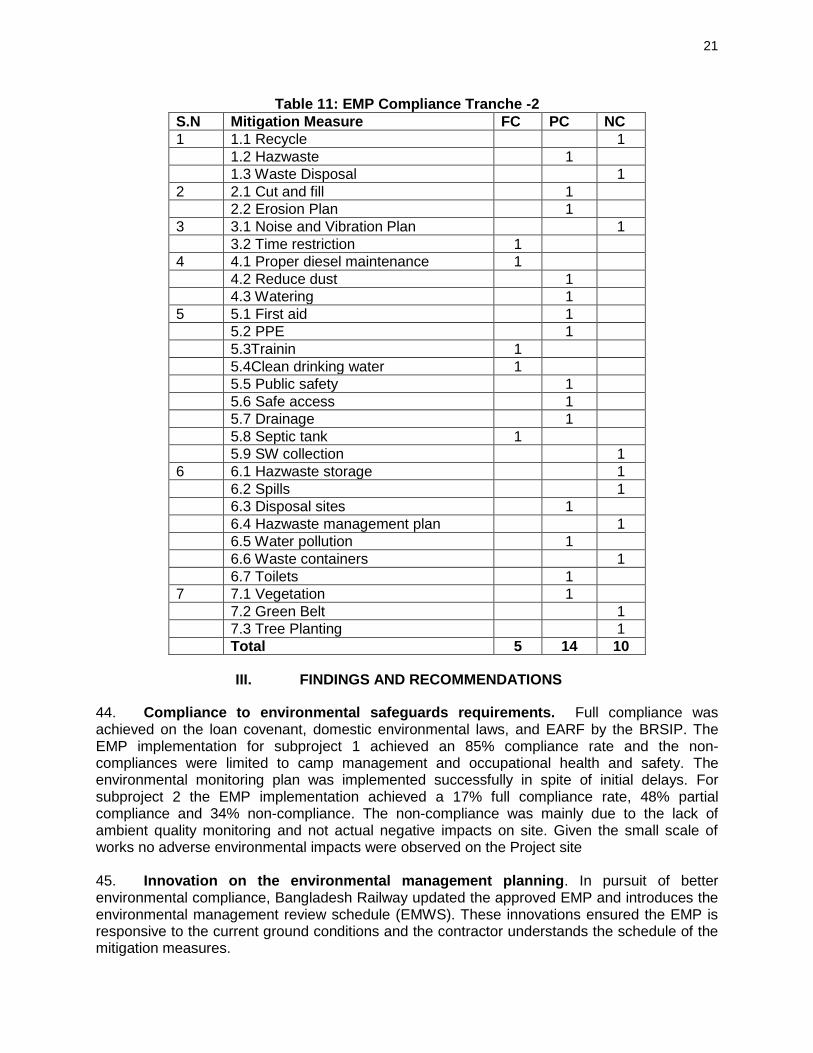
20. The EMP for the Extension, Rehabilitation and Reconstruction of Loop Lines at Darsana-Ishurdi-Siraganj Bazar BG Section (subproject 2) has 29 construction-phase environmental management measures to be implemented by the contractor. As of January 2016, the subproject has performed poorly with 5 measures achieving full compliances, 14 partial compliances, and 10 non-compliances. Non-compliance recorded pertains to camp and construction debris management. Appendix 1 presents the Status of EMP implementation of Tranche 2. B. Environmental Monitoring Plan
1. Tranche 1 21. Surface Water Quality Monitoring. The environmental monitoring plan for subproject 1 comes in two parts, monitoring of impact and mitigation measures, and environmental quality. BR exceeded the require number of locations required. 22. The monitoring of impacts and mitigation measures included the management of ballast waste cleaning, local fish movement and migration, tree planting and re-vegetation, management of carried earth collection process, construction related plan, improvement of safety crossings and upgrading stations. While the monitoring of environmental quality included air, noise, and water quality on at least 3 stations. 23. The surface water quality focused on following 5 locations covering pH, total suspended solids (TSS), biochemical oxygen demand (BOD5), dissolved oxygen (DO), total phosphates (TP), Oil and Grease, and fecal coliform (FC) parameters. The succeeding Table 9 summarizes the results of the surface water quality monitoring of TDBL from April 2012-December 2015 that was carried out in the five locations.
i) Br#34: Old Brahamaputra River at Km 2+458 ii) Br#63: Arialkhan River at km 27+193 iii) Br#79: Sitalakha River at Km 41+167 iv) Br#89: Balu River at Km 54+522 v) Active Dredging Site: Khal River
0
10
20
30
40
50
60
70
80
90
100
Oct 12 Jun-13 Sep-13 Jun-14 Dec-14 Jun-15 Dec 15
Pe
rce
nt
Co
mp
lian
ce
Survey periods ending
Com
PC
NC
15
24. In the absence of applicable Bangladesh standards for aquatic life the reference standard of Canadian Water Quality Guidelines for the Protection of Aquatic Organisms (2003) has been applied. In particular the limit of faecal coliform for aquatic harvesting where applicable has been referenced. 25. A total of 150 surface water samples were collected and 900 laboratory analysis were conducted. The poor water quality of the receiving waters was evident with 393 of the 900 analysis results indicated above the applicable ambient standard representing 44%. All upstream faecal coliform and oil and grease ambient concentrations exceed standards. The impacts of the project on water quality which is defined as samples taken from downstream is more contaminated than the upstream waters was registered at 19%, of which total phosphates registered the highest project related contamination with 35% of the total downstream ambient levels higher than upstream. The elevated total phosphate downstream ambient levels recorded between January and June 2014 mostly at the dredging area is anticipated as the sediments are resuspended. 26. Results and analysis of surface water quality monitoring revealed the following:
Between June and Dec. 2014 when no work was being undertaken on bridges 34, 63, and 89 BOD5, TP, and oil and grease concentrations of all downstream (D/S) exceeded standards indicating land-based sources outside the project scope but near the bridges contributes to the water quality deterioration.
None use of bentonite during pile placement and instead use of autochthonous mud ensures water quality is protected.
The lack of quality control and assurances of local laboratories in water sampling and analysis cast doubt on the accuracy and precision of the water quality monitoring. After Dec 2014 sampling period, the CSC has implemented protocols to minimize errors due to sampling.
Between 2013-2014, TP levels D/S of the river dredging site were eleven times higher than upstream, confirming that dredging disturbs bottom sediments, putting nutrients back into suspension. The CSC adviced the contactor to revised the dredging operation to reduce water quality deterioration. Interestingly, the TSS levels were not significantly elevated downstream of the dredger operations. Further sampling at sand dredging sites were undertaken to evaluate the revision in dredge operation which peaked at 123 mg/li for TSS in Sept. 2013. This level has returned below standard at 20 mg/li and 20 mg/li by Oct. 2013 and Nov. 2013. DO levels remain around 6 mg/l, except nearing the end of the dry season when they drop to very low levels. Parameters like pH, and biological oxygen demand the majority of the results are within the acceptable limits, with upstream and downstream readings varying little, suggesting no significant impact by the project.
Similarly between July 2014 – December 2014, with little or no construction TSS, BOD5, DO, TP and Oil and Grease readings all had a significant number of higher D/S readings due to highly contaminated (concluded based on visual observations and odour) tributaries discharging into the main channel both upstream and downstream of the sampling stations. It is very likely these discharges or contaminants from upstream industrial discharges resulted in higher downstream readings. BOD5, TP, Oil and Grease and Faecal Coliform up-and down-stream samples exceeded permissible GoB standards for fishery waters (waters were fish can safely be eaten without “clearing”. The data clearly
16
show that the construction work had a marginal and temporary impact on the surface water quality and clear differences related to the work could only be detected at the dredge site, which was not active after November 2013.
From January 2015 – June 2015 BOD5, TP, Oil and Grease up- and down-stream samples exceeded applicable standards. Minor construction are being undertaken but all had no impact on surface water quality.
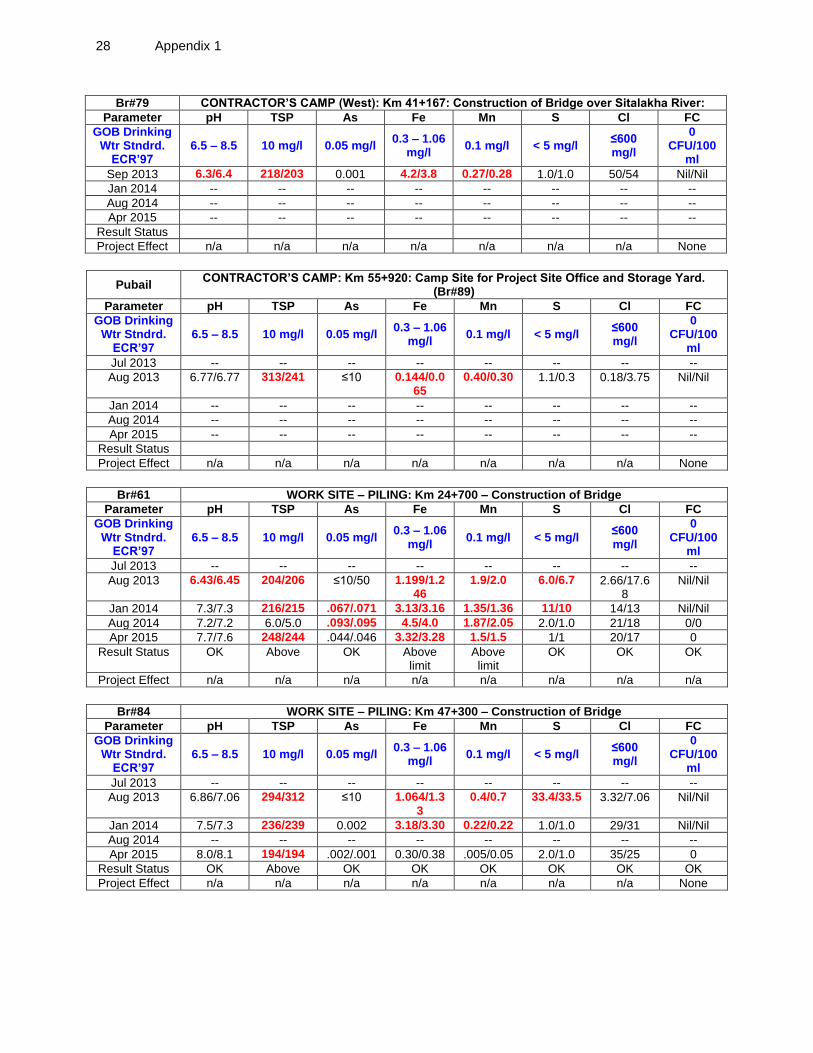
27. Ground Water Quality Monitoring. Groundwater quality was monitored at 6 locations namely: i) Br#34: Contractor’s Camp Km 2+458 (Construction Of Bridge Over Old Brahamaputra River), ii) Narsingdi Engineer’s Camp: Km 30+150, iii) Br#79 Engineer’s Camp, Km 41+167(Construction of Bridge over Sitalakha River), iv) Br#89 Contractor’s Pubail Camp, Km 54+522 (Construction of Bridge over Balu River), v) Br#61 Works Site - Piling Km 24+700 (Construction of Bridge), and vi) Br#84 Works Site - Piling Km 47+300 (Construction of Bridge). Water quality parameters monitored are pH, TSP, arsenic (As), iron (Fe), manganese (Mn), Sulphur (S), chlorine (Cl), and fecal coliform (FC). 28. Sampling is required every 6 months at new wells bored for camp water supplies and at existing tube wells within 150 metres of pile boring (5 samples/6 months). Following an assessment of the results to date during the Environmental Audit update done in January 2015 it was decided that after the sampling that is carried out in March 2015 further sampling will not be necessary. 29. A total of 22 monthly groundwater monitoring conducted on all stations at different periods between April 2012 and April 2015. A total of 321 samples were taken and 42% (135/321) registered higher than GoB standards. Important findings include presence of Arsenic in Br#34 camp and Br#61 worksite and high levels of faecal coliform also in BR#34, Narsingdi Engineer’s camp, and BR#79 Engineer’s camp. Immediately orders were issued by the CSC to discontinue sourcing water for domestic use and instead use of bottled water. 30. Results and analysis of groundwater water quality monitoring revealed the following:
From start of project to June 2013 majority of parameters tested showed results exceeding the GOB drinking water standards underscoring the need to provide alternative sources of drinking water at camps. This has been addressed by the use of bottled water as drinking water at project site offices and some camps with local staff using drinking water from nearby houses. The Contractor has also taken note of the high arsenic levels in the water at the Br#34 camp and has prohibited all staff from using it as drinking water and is providing alternative potable water sources. The high TSP level would also suggest that the tubewell water has been contaminated from a surface water source. The contractor inspected all tubewell sites to insure that they are sealed and that no contaminated water enters the system and signboards were installed at each tubewell instructing users not to wash, brush teeth or otherwise use the water from contaminated tubewell.
From January 2015 to date no new tubewells were dug. All active water sources complied with drinking water standards.
31. Air Quality Monitoring. Sampling is required quarterly (every 3 months) at 4 main bridge construction sites, one crushing plant site, 2 active works sites and 3 stations (10 samples/quarter). One sample within 50m of active works site (A) and one sample at closest boundary to the community (B).
17
32. 10 stations were established for air quality monitoring namely: i) Br#34 Km 2+458, Old Brahamaputra River, ii) Br#63 Km 27+193, Arialkhan River, iii) Br#79 Km 41+167: Sitalakha River, iv) Br#89 Km 54+522: Balu River, v) Methikanda Stn, vi) Pubail Station, vii) Tongi Station, viii) Work Site #1, ix) Br#85 – Km, x) Work Site #2, xi) Br#82, and xii) Work Site #3 Crusher at Bhairab Bazar. 33. Air quality parameters monitored were TPM, SO2, NO2, and CO. A total of 1,592 samples were taken from June 2013 to March 2015 of which 477 or 30% were beyond applicable standards. 34. Of all stations monitored, Sitalakha registered the most number of exceedance (67/192), followed by Tongi (51/160) and Crusher at Bhairab (51/128). TPM and NO2 are the most exceeded parameters. 35. Results and analysis of air quality monitoring revealed the following:
For Br#34, TPM, SO2, and NO2 exceedances of standard started to increase dramatically on April 2014 with all minimum and maximum and NO2, and all maximum readings SO2 exceeding 150, 100, and 365 ug/m3 ambient standards. Starting Sept. 2014-Oct. 2015, only maximum readings of TPM and NO2 exceeds standards while SO2 minimum and maximum are lower than standard.
For Br#63 similar trend was observed with maximum concentrations observed in April 2014 after which only 14% of the SO2 samples exceeded standards
For Br#79, elevated ambient concentrations of TPM, SO2, NO2 drastically increased from Nov.2013-March 2015 and by Oct. 2015, only maximum readings of TMP and NO2 breached standards.
For Br#89, exceedances were prevalent between April-Sept 2014 and by October 2015 all samples were below standards
For Worksites 1, 2, and 3 similar trend were recorded with increase in TPM, SO2, and NO2 on April 2014 and has returned to baseline with no SO2 observation exceeding standards afterwards.
However, Tongi and Methikanda stations being major hubs, the air quality have remained deteriorated since Nov. 2013 indicating the increase in induced traffic from the double tracking.
36. Noise Monitoring. Sampling required quarterly (every 3 months) at 2 major bridge construction sites (#79, #89), one crushing and one batching plant site, one ballast dumping/laying site, one dredging site and one Class B station (7 sample sets/quarter). Samples are to be taken at the nearest occupied structure to the works (A) and the next closest receptor (B), with & without a train passing, once during peak working time and once at night. 37. For the 14 month period from the first recordings in April 2012 until Jul 2012 sampling was carried out at the sites indicated in the table below, although there was no. Daytime and evening readings were compiled and compared to mixed zone standards and revealed that noise levels during the daytime are exceeded and most incidents occur in Tongi Station. 38. Results of noise monitoring revealed the following distinct trend of increase starting around Sept 2013-April 2014 and subsequent decrease below standards.

18
39. Fisheries Resources. Fish species found on the major rivers crossed by the project was recorded and from January 2014, CREC conducted creel censuses to determine catch quantity and diversity. The fish survey were implemented in Old Brahamaputra, Arial Khan, Sitalakha, and Balu rivers. 40. Giant river catfish, Sperata Aor, Labeo carp Labeo bata, Wallago Sheatfish Wallago attu, Indian carp Catla catla, Boggut labeo Labeo ghonius, Orange-fin labeo Labeo calbasu, Mrigal carp Cirrhinus cirrhosis, Yellow catfish Pangasius pangasius, Rita fish Rita rita, Rohu Labea rohita, and Silong catfish Silonia silondia. No blockade of fish movement was observed during the bridge construction. Interviews with fishermen indicated that catch size was not affected by the bridge construction.
Table 9: Summary of Surface Water Quality Monitoring Result Status Tranche 1
2. Tranche 2
41. For sub-project 2 Tranche 2, monitoring plans for the environment, health and safety for the loop for Darsana, Chuadanga, Alamdanga, Halsha, Mirpur, Bheramara, Ishurdi, ans Siarajganj railway stations were prepared. These monitoring plans covers air and dust pollution, noise pollution, drinking water quality, community safety, surface water pollution, tree planting, occupational health and safety, stocking of materials, and erosion and siltation as deemed applicable to each station. 42. For the sub-project 3 Tranche 2, monitoring parameters are limied to occupational health and safety, tree planning, clearing and demolition of old structures, and drinking water quality. 43. For tranche 2, all monitoring parameters with the exception of air and water quality have been accomplished to date.
Location/ detail
Monitoring Period
No of Months
No of samples gathered and analyzed
TSS BOD5 DO TP Oil &
Grease FC
Br#34 Jan. –Oct.2015
10 8 8 8 8 8 8
Br#63 10 8 8 8 8 8 8
Br#79 10 8 8 8 8 8 8
Br#89 10 8 8 8 8 8 8
Br#34 Apr.2012-Dec.2014
14 28 28 28 28 28 28
Br#63 13 26 26 26 26 26 26
Br#79 14 28 28 28 28 28 28
Br#89 14 28 28 28 28 28 28
Dredge Site Jul 2013-Nov 2013
4 8 8 8 8 8 8
Total No of Samples 150 150 150 150 150 150
No. of samples upstream > than standards
No. of samples where downstream> upstream
21 25 30 39 23 27
19
Table 10: EMP Compliance Status Tranche 1
EMP Compliance Status: FC=full compliance, PC=partial compliance, NC=non compliant
S/N
Item No.
Description Status: 31.10.12
Status: 30.06.13
Status: 31.08.13
Status 31.06.14
Status 31.12.2014
Status 30.06.2015
Status 31.01.2016
Compliance
Category FC PC NC FC PC NC NC PC NC FC PC NC FC PC NC FC PC NC FC PC NC
1.0 Design & Preconstruction
1 1.1 Design within ROW
1 1 1
1 1 1 1
2 1.2 Transport of Materials
1 1 1
1 1 1 1
3 1.3 Env Clauses in Contract
1 1 1
1 1 1 1
4 1.4 EMP Documentation
1 1 1
1 1 1 1
5 1.5 Design with Env Conditions
1 1 1
1 1 1 1
6 1.6 Adequate Station Design
1 1 1
1 1 NA 1
2.0 Construction Period
2.1 Natural Environment
7 2.1.1 Hydrology & Flood Pattern
1 1 1
1 1 1 1 1
8 2.1.2 Drainage Congestion
1 1 1
1 1 1 1 1
9 2.1.3 Erosion & Silt Deposition
1 1 1
1 1 1 1
10 2.1.4 Landscape 1 1 1 1 1 1 1
11 2.1.5 The EMWS 1 1 1 1 1 1 1
2.2 Ecological Environment
12 2.2.1 Tree Felling 1 1 1 1 1 NA NA
13 2.2.2 Fisheries, Fish habitat, etc
1 1
1 1 1 1 1
14 2.2.3 Wildlife 1 1 1 1 1 1 1
2.3 Environmental Pollution
15 2.3.1 Surface Water 1 1 1 1 1 1 1
16 2.3.2 Ground Water 1 1 1 1 1 1 1
20
S/N
Item No.
Description Status: 31.10.12
Status: 30.06.13
Status: 31.08.13
Status 31.06.14
Status 31.12.2014
Status 30.06.2015
Status 31.01.2016
Compliance
Category FC PC NC FC PC NC NC PC NC FC PC NC FC PC NC FC PC NC FC PC NC
17 2.3.3 Air Pollution 1 1 1 1 1 1 1
18 2.3.4 Noise and Vibration
1 1
1 1 1 1 1
19 2.3.5 Soil Contamination
1 1
1 1 1 1
2.4 Health and Safety
20 2.4.1 Loss of Navigation Route
1 1 1
1 1 1 1
21 2.4.2 Work Force Camp Conditions
1 1 1 1 1 NA NA
22 2.4.3 Waste Management
1 1 1 1 1 1 1
23 2.4.4 Health & Safety 1 1 1 1 1 NA NA
24 2.4.5 Vector-borne diseases
1 1 1 1 1 1 1
25 2.4.6 Rail Traffic Disruption
1 1 1 1 1 1 NA
26 2.4.7 Env Completion . Report
1 1 1 1 1 1 1
27 2.4.8 Waste Materials 1 1 1 1 1 1 1
Score 12 8 7 12 12 3 10 18 0 20 7 1 21 6 0 20 2 1 18 4 1
Percent Compliance
44 30 26 44 44 12 35.7
64 0 71.5
25 3.5 77 23 0 87 9 4 78 17 5
Not Applicable (NA)
4 4
21
Table 11: EMP Compliance Tranche -2
S.N Mitigation Measure FC PC NC
1 1.1 Recycle 1
1.2 Hazwaste 1
1.3 Waste Disposal 1
2 2.1 Cut and fill 1
2.2 Erosion Plan 1
3 3.1 Noise and Vibration Plan 1
3.2 Time restriction 1
4 4.1 Proper diesel maintenance 1
4.2 Reduce dust 1
4.3 Watering 1
5 5.1 First aid 1
5.2 PPE 1
5.3Trainin 1
5.4Clean drinking water 1
5.5 Public safety 1
5.6 Safe access 1
5.7 Drainage 1
5.8 Septic tank 1
5.9 SW collection 1
6 6.1 Hazwaste storage 1
6.2 Spills 1
6.3 Disposal sites 1
6.4 Hazwaste management plan 1
6.5 Water pollution 1
6.6 Waste containers 1
6.7 Toilets 1
7 7.1 Vegetation 1
7.2 Green Belt 1
7.3 Tree Planting 1
Total 5 14 10
III. FINDINGS AND RECOMMENDATIONS
44. Compliance to environmental safeguards requirements. Full compliance was achieved on the loan covenant, domestic environmental laws, and EARF by the BRSIP. The EMP implementation for subproject 1 achieved an 85% compliance rate and the non-compliances were limited to camp management and occupational health and safety. The environmental monitoring plan was implemented successfully in spite of initial delays. For subproject 2 the EMP implementation achieved a 17% full compliance rate, 48% partial compliance and 34% non-compliance. The non-compliance was mainly due to the lack of ambient quality monitoring and not actual negative impacts on site. Given the small scale of works no adverse environmental impacts were observed on the Project site 45. Innovation on the environmental management planning. In pursuit of better environmental compliance, Bangladesh Railway updated the approved EMP and introduces the environmental management review schedule (EMWS). These innovations ensured the EMP is responsive to the current ground conditions and the contractor understands the schedule of the mitigation measures.
22
46. Leveraging Compliance. Bangladesh Railways (BR) has demonstrated its sincerity to bring the project back to compliance through a series of notices and later with a threat of sanction. During the environmental audit by CSC on 30 October to 1 Nov 2012, several non-conformances were noted including occupational health and safety. Weekly reporting by CREC was required and on 15 Dec 2012 an inspection was made with dismal findings. Bangladesh Railway through the CSC invoked FIDIC GCC provision 7.6 on the need to rectify works with a threat of sanction authorized in FIDIC Sub-Clause 2.5 on corrective measures by 3rd party at the expense of the Contractor. This also points out the need to strengthen the monitoring and enforcement capability of MoEF and highlights the need for information sharing by the BR. 47. Comprehensive environmental quality monitoring data supports no long term adverse impacts. . A total of 150 surface water, 321 groundwater, 1,592 air, and 295 noise samples were taken in the course of the project implementation for Tranche 1. Tranche 2 has yet to establish the monitoring stations. Surface water quality assessment indicated that of the 44%, groundwater 42%, air quality 30%, and noise 20% compliance rates. No long term adverse impacts has resulted in the implementation of Tranche 1 as supported by the following:
Between the 2013-2014, TP levels D/S of the river dredging site were eleven times higher than upstream, confirming that dredging disturbs bottom sediments, putting nutrients back into suspension. The CSC adviced the contactor to revised the dredging operation to reduce water quality deterioration. Interestingly, the TSS levels were not significantly elevated downstream of the dredger operations. Further sampling at sand dredging sites were undertake to evaluate the revision in dredge operation which peaked at 123 mg/li for TSS in Sept. 2013. This level has returned below standard at 20 mg/li and 20 mg/li by Oct. 2013 and Nov. 2013.
Groundwater quality was monitored at 6 locations revealed presence of Arsenic in Br#34 camp and Br#61 worksite and high levels of faecal coliform also in BR#34, Narsingdi Engineer’s camp, and BR#79 Engineer’s camp. Immediately orders were issued by the CSC to discontinue sourcing water and the contractor use bottled water as drinking water at project site offices and some camps with local staff using drinking water from nearby houses. The Contractor has also taken note of the high arsenic levels in the water at the Br#34 camp and has prohibited all staff from using it as drinking water and is providing alternative potable water sources. The high TSP level would also suggest that the tubewell water has been contaminated from a surface water source. The contractor inspected all tubewell sites to insure that they are sealed and that no contaminated water enters the system and signboards were installed at each tubewell instructing users not to wash, brush teeth or otherwise use the water from contaminated tubewell.
48. Air quality parameters monitored were TPM, SO2, NO2, and CO. A total of 1,592 samples were taken from June 2013 to March 2015 of which 477 or 30% were beyond applicable standards. 49. Of all stations monitored, Sitalakha registered the most number of exceedance (67/192), followed by Tongi (51/160) and Crusher at Bhairab (51/128). TPM and NO2 are the most exceeded parameters.
23
50. Noise Monitoring. Sampling required quarterly (every 3 months) at 2 major bridge construction sites (#79, #89), one crushing and one batching plant site, one ballast dumping/laying site, one dredging site and one Class B station (7 sample sets/quarter). Samples are to be taken at the nearest occupied structure to the works (A) and the next closest receptor (B), with & without a train passing, once during peak working time and once at night.
51. For the 14 month period from the first recordings in April 2012 until Jul 2012 sampling was carried out at the sites indicated in the table below, although there was no. Daytime and evening readings were compiled and compared to mixed zone standards and revealed that noise levels during the daytime are exceeded and most incidents occur in Tongi Station. 52. Fisheries Resources. Fish species found on the major rivers crossed by the project was recorded and from January 2014, CREC conducted creel censuses to determine catch quantity and diversity. The fish survey were implemented in Old Brahamaputra, Arial Khan, Sitalakha, and Balu rivers. 53. Giant river catfish, Sperata Aor, Labeo carp Labeo bata, Wallago Sheatfish Wallago attu, Indian carp Catla catla, Boggut labeo Labeo ghonius, Orange-fin labeo Labeo calbasu, Mrigal carp Cirrhinus cirrhosis, Yellow catfish Pangasius pangasius, Rita fish Rita rita, Rohu Labea rohita, and Silong catfish Silonia silondia. No blockade of fish movement was observed during the bridge construction. Interviews with fishermen indicated that catch size was not affected by the bridge construction. 54. Delays in the mobilization of the contractor’s environmental focal person resulted poor compliance performance. Despite numerous notices issued by the CSC to CREC to mobilize their environmental specialist, it was on May 2013, or 16 months after mobilization that it was heeded. This resulted to large gaps in the monitoring coverage which hindered the assessment of the project impacts as no suitable baseline are available for comparison. This delay in mobilization in part explains why the CREC continued to use borewells that are arsenic and coliform contaminated risking health and welfare of the workers staying at the: i) contractor’s camp, km 2+458 construction of bridge over old Brahamaputra River; ii) engineer’s camp: km 30+150; iii) engineer’s camp; km 41+167: construction of bridge over sitalakha river; and iv) works site - piling; km 24+700: construction of bridge. Further, until September 2013 the environmental quality monitoring data submitted by the CREC were unreliable and could not be verified. To address data reliability, a sampling program was designed by CSC and implemented by the contractor and by November 2013 better datasets with supporting documentation on sample collections and methodology were generated. Finally, the poor overall performance in implementing the EMP was evident in the early stage of the project implement which is attributed by the CSC to the CREC delay in fielding their environmental specialist. 55. Need to improve sampling and analysis protocols. A total of 70% surface water samples indicated lower pollution level downstream than upstream indicating “cleaner” water as it passes the project site which is counterintuitive. This error can only be explained by faulty sampling and analysis procedure. However, this claim cannot be fully supported and no documents were made on the chain-of-custody for the sampling activity, suitability of sampling storage and transport, while the laboratory did not conduct standard quality control like blanks and spikes to ensure test accuracy and precision. The poor protocols undermined the reliability of the entire environmental monitoring program of the project.
24 Appendix 1
APPENDIX 1: STATUS OF EMP IMPLEMENTATIONOF TRANCHE 2
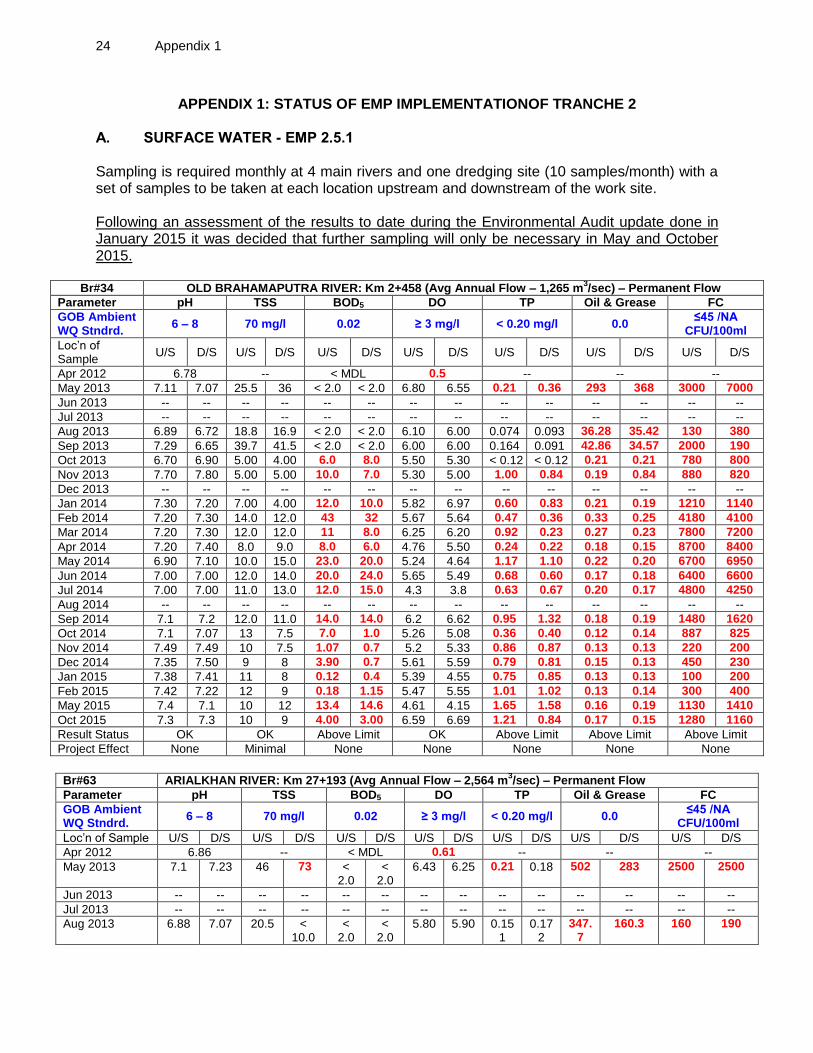
A. SURFACE WATER - EMP 2.5.1 Sampling is required monthly at 4 main rivers and one dredging site (10 samples/month) with a set of samples to be taken at each location upstream and downstream of the work site. Following an assessment of the results to date during the Environmental Audit update done in January 2015 it was decided that further sampling will only be necessary in May and October 2015.
Br#34 OLD BRAHAMAPUTRA RIVER: Km 2+458 (Avg Annual Flow – 1,265 m3/sec) – Permanent Flow
Parameter pH TSS BOD5 DO TP Oil & Grease FC
GOB Ambient WQ Stndrd.
6 – 8 70 mg/l 0.02 ≥ 3 mg/l < 0.20 mg/l 0.0 ≤45 /NA
CFU/100ml
Loc’n of Sample
U/S D/S U/S D/S U/S D/S U/S D/S U/S D/S U/S D/S U/S D/S
Apr 2012 6.78 -- < MDL 0.5 -- -- --
May 2013 7.11 7.07 25.5 36 < 2.0 < 2.0 6.80 6.55 0.21 0.36 293 368 3000 7000
Jun 2013 -- -- -- -- -- -- -- -- -- -- -- -- -- --
Jul 2013 -- -- -- -- -- -- -- -- -- -- -- -- -- --
Aug 2013 6.89 6.72 18.8 16.9 < 2.0 < 2.0 6.10 6.00 0.074 0.093 36.28 35.42 130 380
Sep 2013 7.29 6.65 39.7 41.5 < 2.0 < 2.0 6.00 6.00 0.164 0.091 42.86 34.57 2000 190
Oct 2013 6.70 6.90 5.00 4.00 6.0 8.0 5.50 5.30 < 0.12 < 0.12 0.21 0.21 780 800
Nov 2013 7.70 7.80 5.00 5.00 10.0 7.0 5.30 5.00 1.00 0.84 0.19 0.84 880 820
Dec 2013 -- -- -- -- -- -- -- -- -- -- -- -- -- --
Jan 2014 7.30 7.20 7.00 4.00 12.0 10.0 5.82 6.97 0.60 0.83 0.21 0.19 1210 1140
Feb 2014 7.20 7.30 14.0 12.0 43 32 5.67 5.64 0.47 0.36 0.33 0.25 4180 4100
Mar 2014 7.20 7.30 12.0 12.0 11 8.0 6.25 6.20 0.92 0.23 0.27 0.23 7800 7200
Apr 2014 7.20 7.40 8.0 9.0 8.0 6.0 4.76 5.50 0.24 0.22 0.18 0.15 8700 8400
May 2014 6.90 7.10 10.0 15.0 23.0 20.0 5.24 4.64 1.17 1.10 0.22 0.20 6700 6950
Jun 2014 7.00 7.00 12.0 14.0 20.0 24.0 5.65 5.49 0.68 0.60 0.17 0.18 6400 6600
Jul 2014 7.00 7.00 11.0 13.0 12.0 15.0 4.3 3.8 0.63 0.67 0.20 0.17 4800 4250
Aug 2014 -- -- -- -- -- -- -- -- -- -- -- -- -- --
Sep 2014 7.1 7.2 12.0 11.0 14.0 14.0 6.2 6.62 0.95 1.32 0.18 0.19 1480 1620
Oct 2014 7.1 7.07 13 7.5 7.0 1.0 5.26 5.08 0.36 0.40 0.12 0.14 887 825
Nov 2014 7.49 7.49 10 7.5 1.07 0.7 5.2 5.33 0.86 0.87 0.13 0.13 220 200
Dec 2014 7.35 7.50 9 8 3.90 0.7 5.61 5.59 0.79 0.81 0.15 0.13 450 230
Jan 2015 7.38 7.41 11 8 0.12 0.4 5.39 4.55 0.75 0.85 0.13 0.13 100 200
Feb 2015 7.42 7.22 12 9 0.18 1.15 5.47 5.55 1.01 1.02 0.13 0.14 300 400
May 2015 7.4 7.1 10 12 13.4 14.6 4.61 4.15 1.65 1.58 0.16 0.19 1130 1410
Oct 2015 7.3 7.3 10 9 4.00 3.00 6.59 6.69 1.21 0.84 0.17 0.15 1280 1160
Result Status OK OK Above Limit OK Above Limit Above Limit Above Limit
Project Effect None Minimal None None None None None
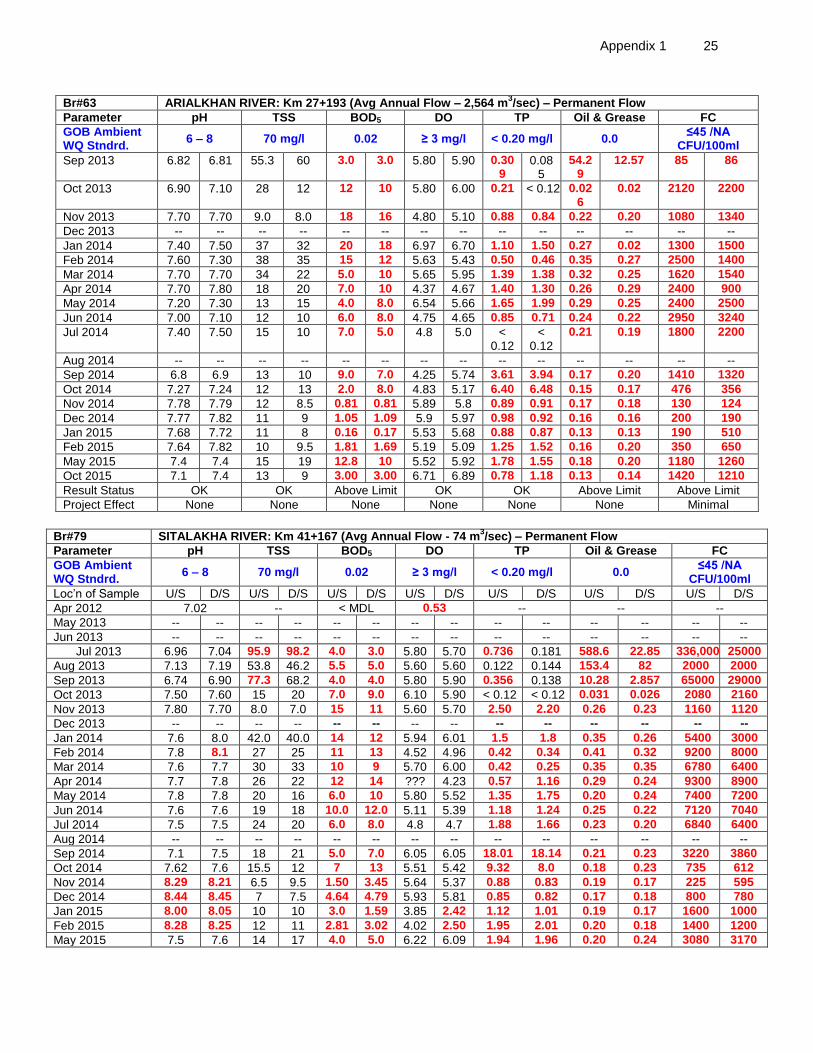
Br#63 ARIALKHAN RIVER: Km 27+193 (Avg Annual Flow – 2,564 m
3/sec) – Permanent Flow
Parameter pH TSS BOD5 DO TP Oil & Grease FC
GOB Ambient WQ Stndrd.
6 – 8 70 mg/l 0.02 ≥ 3 mg/l < 0.20 mg/l 0.0 ≤45 /NA
CFU/100ml
Loc’n of Sample U/S D/S U/S D/S U/S D/S U/S D/S U/S D/S U/S D/S U/S D/S
Apr 2012 6.86 -- < MDL 0.61 -- -- --
May 2013 7.1 7.23 46 73 < 2.0
< 2.0
6.43 6.25 0.21 0.18 502 283 2500 2500
Jun 2013 -- -- -- -- -- -- -- -- -- -- -- -- -- --
Jul 2013 -- -- -- -- -- -- -- -- -- -- -- -- -- --
Aug 2013 6.88 7.07 20.5 < 10.0
< 2.0
< 2.0
5.80 5.90 0.151
0.172
347.7
160.3 160 190
Appendix 1 25
Br#63 ARIALKHAN RIVER: Km 27+193 (Avg Annual Flow – 2,564 m3/sec) – Permanent Flow
Parameter pH TSS BOD5 DO TP Oil & Grease FC
GOB Ambient WQ Stndrd.
6 – 8 70 mg/l 0.02 ≥ 3 mg/l < 0.20 mg/l 0.0 ≤45 /NA
CFU/100ml
Sep 2013 6.82 6.81 55.3 60 3.0 3.0 5.80 5.90 0.309
0.085
54.29
12.57 85 86
Oct 2013 6.90 7.10 28 12 12 10 5.80 6.00 0.21 < 0.12 0.026
0.02 2120 2200
Nov 2013 7.70 7.70 9.0 8.0 18 16 4.80 5.10 0.88 0.84 0.22 0.20 1080 1340
Dec 2013 -- -- -- -- -- -- -- -- -- -- -- -- -- --
Jan 2014 7.40 7.50 37 32 20 18 6.97 6.70 1.10 1.50 0.27 0.02 1300 1500
Feb 2014 7.60 7.30 38 35 15 12 5.63 5.43 0.50 0.46 0.35 0.27 2500 1400
Mar 2014 7.70 7.70 34 22 5.0 10 5.65 5.95 1.39 1.38 0.32 0.25 1620 1540
Apr 2014 7.70 7.80 18 20 7.0 10 4.37 4.67 1.40 1.30 0.26 0.29 2400 900
May 2014 7.20 7.30 13 15 4.0 8.0 6.54 5.66 1.65 1.99 0.29 0.25 2400 2500
Jun 2014 7.00 7.10 12 10 6.0 8.0 4.75 4.65 0.85 0.71 0.24 0.22 2950 3240
Jul 2014 7.40 7.50 15 10 7.0 5.0 4.8 5.0 < 0.12
< 0.12
0.21 0.19 1800 2200
Aug 2014 -- -- -- -- -- -- -- -- -- -- -- -- -- --
Sep 2014 6.8 6.9 13 10 9.0 7.0 4.25 5.74 3.61 3.94 0.17 0.20 1410 1320
Oct 2014 7.27 7.24 12 13 2.0 8.0 4.83 5.17 6.40 6.48 0.15 0.17 476 356
Nov 2014 7.78 7.79 12 8.5 0.81 0.81 5.89 5.8 0.89 0.91 0.17 0.18 130 124
Dec 2014 7.77 7.82 11 9 1.05 1.09 5.9 5.97 0.98 0.92 0.16 0.16 200 190
Jan 2015 7.68 7.72 11 8 0.16 0.17 5.53 5.68 0.88 0.87 0.13 0.13 190 510
Feb 2015 7.64 7.82 10 9.5 1.81 1.69 5.19 5.09 1.25 1.52 0.16 0.20 350 650
May 2015 7.4 7.4 15 19 12.8 10 5.52 5.92 1.78 1.55 0.18 0.20 1180 1260
Oct 2015 7.1 7.4 13 9 3.00 3.00 6.71 6.89 0.78 1.18 0.13 0.14 1420 1210
Result Status OK OK Above Limit OK OK Above Limit Above Limit
Project Effect None None None None None None Minimal
Br#79 SITALAKHA RIVER: Km 41+167 (Avg Annual Flow - 74 m
3/sec) – Permanent Flow
Parameter pH TSS BOD5 DO TP Oil & Grease FC
GOB Ambient WQ Stndrd.
6 – 8 70 mg/l 0.02 ≥ 3 mg/l < 0.20 mg/l 0.0 ≤45 /NA
CFU/100ml
Loc’n of Sample U/S D/S U/S D/S U/S D/S U/S D/S U/S D/S U/S D/S U/S D/S
Apr 2012 7.02 -- < MDL 0.53 -- -- --
May 2013 -- -- -- -- -- -- -- -- -- -- -- -- -- --
Jun 2013 -- -- -- -- -- -- -- -- -- -- -- -- -- --
Jul 2013 6.96 7.04 95.9 98.2 4.0 3.0 5.80 5.70 0.736 0.181 588.6 22.85 336,000 25000
Aug 2013 7.13 7.19 53.8 46.2 5.5 5.0 5.60 5.60 0.122 0.144 153.4 82 2000 2000
Sep 2013 6.74 6.90 77.3 68.2 4.0 4.0 5.80 5.90 0.356 0.138 10.28 2.857 65000 29000
Oct 2013 7.50 7.60 15 20 7.0 9.0 6.10 5.90 < 0.12 < 0.12 0.031 0.026 2080 2160
Nov 2013 7.80 7.70 8.0 7.0 15 11 5.60 5.70 2.50 2.20 0.26 0.23 1160 1120
Dec 2013 -- -- -- -- -- -- -- -- -- -- -- -- -- --
Jan 2014 7.6 8.0 42.0 40.0 14 12 5.94 6.01 1.5 1.8 0.35 0.26 5400 3000
Feb 2014 7.8 8.1 27 25 11 13 4.52 4.96 0.42 0.34 0.41 0.32 9200 8000
Mar 2014 7.6 7.7 30 33 10 9 5.70 6.00 0.42 0.25 0.35 0.35 6780 6400
Apr 2014 7.7 7.8 26 22 12 14 ??? 4.23 0.57 1.16 0.29 0.24 9300 8900
May 2014 7.8 7.8 20 16 6.0 10 5.80 5.52 1.35 1.75 0.20 0.24 7400 7200
Jun 2014 7.6 7.6 19 18 10.0 12.0 5.11 5.39 1.18 1.24 0.25 0.22 7120 7040
Jul 2014 7.5 7.5 24 20 6.0 8.0 4.8 4.7 1.88 1.66 0.23 0.20 6840 6400
Aug 2014 -- -- -- -- -- -- -- -- -- -- -- -- -- --
Sep 2014 7.1 7.5 18 21 5.0 7.0 6.05 6.05 18.01 18.14 0.21 0.23 3220 3860
Oct 2014 7.62 7.6 15.5 12 7 13 5.51 5.42 9.32 8.0 0.18 0.23 735 612
Nov 2014 8.29 8.21 6.5 9.5 1.50 3.45 5.64 5.37 0.88 0.83 0.19 0.17 225 595
Dec 2014 8.44 8.45 7 7.5 4.64 4.79 5.93 5.81 0.85 0.82 0.17 0.18 800 780
Jan 2015 8.00 8.05 10 10 3.0 1.59 3.85 2.42 1.12 1.01 0.19 0.17 1600 1000
Feb 2015 8.28 8.25 12 11 2.81 3.02 4.02 2.50 1.95 2.01 0.20 0.18 1400 1200
May 2015 7.5 7.6 14 17 4.0 5.0 6.22 6.09 1.94 1.96 0.20 0.24 3080 3170

26 Appendix 1
Br#79 SITALAKHA RIVER: Km 41+167 (Avg Annual Flow - 74 m3/sec) – Permanent Flow
Parameter pH TSS BOD5 DO TP Oil & Grease FC
GOB Ambient WQ Stndrd.
6 – 8 70 mg/l 0.02 ≥ 3 mg/l < 0.20 mg/l 0.0 ≤45 /NA
CFU/100ml
Loc’n of Sample U/S D/S U/S D/S U/S D/S U/S D/S U/S D/S U/S D/S U/S D/S
Oct 2015 7.8 7.8 12 9 5.0 4.0 6.08 6.19 0.79 0.89 0.18 0.13 890 760
Result Status OK OK Above Limit OK Above Limit Above Limit Above Limit
Project Effect None None None None None None None
Br#89 BALU RIVER: Km 54+522 (Avg Annual Flow 60 m
3/sec) – Permanent Flow
Parameter pH TSS BOD5 DO TP Oil & Grease FC
GOB Ambient WQ Stndrd.
6 – 8 70 mg/l 0.02 ≥ 3 mg/l < 0.20 mg/l 0.0 ≤45 /NA
CFU/100ml
Loc’n of Sample
U/S D/S U/S D/S U/S D/S U/S D/S U/S D/S U/S D/S U/S D/S
Apr 2012 7.22 -- < MDL 0.78 -- -- --
May 2013 -- -- -- -- -- -- -- -- -- -- -- -- -- --
Jun 2013 -- -- -- -- -- -- -- -- -- -- -- -- -- --
Jul 2013 7.04 7.01 73.1 69.1 ≤2.0 ≤2.0 5.90 5.90 0.345 0.421 40.85 5.714 22000 18000
Aug 2013 6.99 6.75 22.8 33.0 ≤2.0 ≤2.0 5.80 5.70 0.186 0.099 260 122.5 8000 10000
Sep 2013 6.82 6.86 41.2 38.2 < 2.0 < 2.0 5.60 5.70 0.049 0.058 4.857 1.429 15 285
Oct 2013 7.20 7.00 4.0 8.0 6.0 9.0 5.50 5.70 < 0.12 < 0.12 0.025 0.024 1180 1300
Nov 2013 7.50 7.50 6.0 7.0 8.0 10 5.40 5.60 0.78 0.95 0.21 0.19 1540 1480
Dec 2013 -- -- -- -- -- -- -- -- -- -- -- -- -- --
Jan 2014 7.50 7.50 26.0 27.0 20 16 7.03 6.70 2.10 1.90 0.25 0.21 2000 3500
Feb 2014 7.90 7.80 39 34 12 11 4.80 4.74 1.12 1.4 0.29 0.24 3500 3400
Mar 2014 7.85 7.85 49 53 26 20 1.90 3.83 10.87 10.62 0.40 0.31 2480 2340
Apr 2014 7.70 7.80 47 44 35 31 ??? 4.42 13.9 19.0 0.37 0.35 5300 5000
May 2014 7.60 7.70 88 38 16 23 2.34 4.20 14.3 6.97 0.43 0.25 7800 8100
Jun 2014 7.20 7.20 30 27 16 14 3.14 3.37 1.37 1.49 0.31 0.28 8280 8410
Jul 2014 7.40 7.40 35 33 6 7 4.60 4.60 0.83 0.63 0.27 0.23 6100 5800
Aug 2014 -- -- -- -- -- -- -- -- -- -- -- -- -- --
Sep 2014 7.5 7.4 23 23 10 8 6.65 6.30 1.08 1.12 0.25 0.27 1220 1280
Oct 2014 7.15 7.06 4 11 7 6 5.54 5.63 5.47 5.43 21 0.25 575 540
Nov 2014 7.79 7.75 13.5 12.5 0.2 3.49 4.15 4.25 1.65 2.04 0.19 0.20 2200 2010
Dec 2014 7.9 7.84 13 13 4.41 4 5.34 5.64 1.12 1.82 0.21 0.22 2400 2000
Jan 2015 8.03 8.01 12 13 2.98 3.09 3.86 3.88 2.11 2.50 0.22 0.25 2300 2400
Feb 2015 8.33 8.21 13 12.5 5.95 5.87 6.24 6.22 2.44 2.35 0.23 0.24 1800 1500
May 2015 7.6 7.6 21 24 7.1 9.0 5.69 5.55 2.24 2.17 0.24 0.27 970 1040
Oct 2015 7.1 7.0 12 10 4.0 3.0 6.37 6.42 0.73 0.67 0.19 0.17 1040 980
Result Status OK OK Above Limit OK Above Above Limit Above Limit
Project Effect None None None None Minimal None Minimal
ACTIVE DREDGING SITE: Khal River – Permanent Flow
Parameter pH TSS BOD5 DO TP Oil & Grease FC
GOB Ambient WQ Stndrd.
6 – 8 70 mg/l 0.02 ≥ 3 mg/l < 0.20 mg/l 0.0 ≤45 /NA
CFU/100ml
Loc’n of Sample
U/S D/S U/S D/S U/S D/S U/S D/S U/S D/S U/S D/S U/S D/S
Jul 2013 -- -- -- -- -- -- -- -- -- -- -- -- -- --
Aug 2013 6.86 6.81 47.7 33.5 4.5 4.5 5.90 5.90 0.074 0.825 59.14 14.29 54000 32000
Sep 2013 6.79 6.86 223.8 123.6 6.0 5.0 5.60 5.70 0.742 0.185 28.57 12.86 76000 119000
Oct 2013 7.00 7.10 18.0 20.0 6.0 5.0 5.60 5.50 0.750 0.230 0.075 0.055 2600 2660
Nov 2013 7.20 7.20 23.0 28.0 12.0 10.0 5.30 5.00 3.70 3.90 0.310 0.260 2160 2480
Dec 2013 -- -- -- -- -- -- -- -- -- -- -- -- -- --
Result Status
Project Effect None None None None None None None
Appendix 1 27
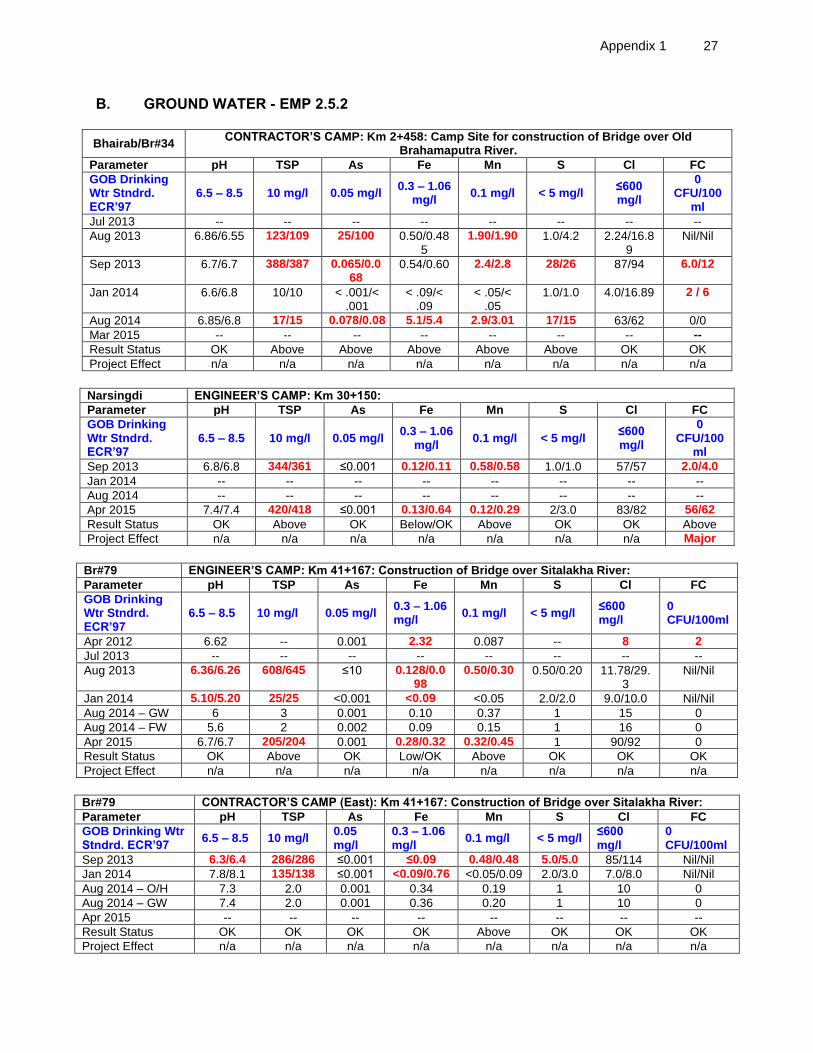
B. GROUND WATER - EMP 2.5.2
Bhairab/Br#34 CONTRACTOR’S CAMP: Km 2+458: Camp Site for construction of Bridge over Old
Brahamaputra River.
Parameter pH TSP As Fe Mn S Cl FC
GOB Drinking Wtr Stndrd. ECR’97
6.5 – 8.5 10 mg/l 0.05 mg/l 0.3 – 1.06
mg/l 0.1 mg/l < 5 mg/l
≤600 mg/l
0 CFU/100
ml
Jul 2013 -- -- -- -- -- -- -- --
Aug 2013 6.86/6.55 123/109 25/100 0.50/0.485
1.90/1.90 1.0/4.2 2.24/16.89
Nil/Nil
Sep 2013 6.7/6.7 388/387 0.065/0.068
0.54/0.60 2.4/2.8 28/26 87/94 6.0/12
Jan 2014 6.6/6.8 10/10 < .001/< .001
< .09/< .09
< .05/< .05
1.0/1.0 4.0/16.89 2 / 6
Aug 2014 6.85/6.8 17/15 0.078/0.08 5.1/5.4 2.9/3.01 17/15 63/62 0/0
Mar 2015 -- -- -- -- -- -- -- --
Result Status OK Above Above Above Above Above OK OK
Project Effect n/a n/a n/a n/a n/a n/a n/a n/a
Narsingdi ENGINEER’S CAMP: Km 30+150:
Parameter pH TSP As Fe Mn S Cl FC
GOB Drinking Wtr Stndrd. ECR’97
6.5 – 8.5 10 mg/l 0.05 mg/l 0.3 – 1.06
mg/l 0.1 mg/l < 5 mg/l
≤600 mg/l
0 CFU/100
ml
Sep 2013 6.8/6.8 344/361 ≤0.001 0.12/0.11 0.58/0.58 1.0/1.0 57/57 2.0/4.0
Jan 2014 -- -- -- -- -- -- -- --
Aug 2014 -- -- -- -- -- -- -- --
Apr 2015 7.4/7.4 420/418 ≤0.001 0.13/0.64 0.12/0.29 2/3.0 83/82 56/62
Result Status OK Above OK Below/OK Above OK OK Above
Project Effect n/a n/a n/a n/a n/a n/a n/a Major
Br#79 ENGINEER’S CAMP: Km 41+167: Construction of Bridge over Sitalakha River:
Parameter pH TSP As Fe Mn S Cl FC
GOB Drinking Wtr Stndrd. ECR’97
6.5 – 8.5 10 mg/l 0.05 mg/l 0.3 – 1.06 mg/l
0.1 mg/l < 5 mg/l ≤600 mg/l
0 CFU/100ml
Apr 2012 6.62 -- 0.001 2.32 0.087 -- 8 2
Jul 2013 -- -- -- -- -- -- -- --
Aug 2013 6.36/6.26 608/645 ≤10 0.128/0.098
0.50/0.30 0.50/0.20 11.78/29.3
Nil/Nil
Jan 2014 5.10/5.20 25/25 <0.001 <0.09 <0.05 2.0/2.0 9.0/10.0 Nil/Nil
Aug 2014 – GW 6 3 0.001 0.10 0.37 1 15 0
Aug 2014 – FW 5.6 2 0.002 0.09 0.15 1 16 0
Apr 2015 6.7/6.7 205/204 0.001 0.28/0.32 0.32/0.45 1 90/92 0
Result Status OK Above OK Low/OK Above OK OK OK
Project Effect n/a n/a n/a n/a n/a n/a n/a n/a
Br#79 CONTRACTOR’S CAMP (East): Km 41+167: Construction of Bridge over Sitalakha River:
Parameter pH TSP As Fe Mn S Cl FC
GOB Drinking Wtr Stndrd. ECR’97
6.5 – 8.5 10 mg/l 0.05 mg/l
0.3 – 1.06 mg/l
0.1 mg/l < 5 mg/l ≤600 mg/l
0 CFU/100ml
Sep 2013 6.3/6.4 286/286 ≤0.001 ≤0.09 0.48/0.48 5.0/5.0 85/114 Nil/Nil
Jan 2014 7.8/8.1 135/138 ≤0.001 <0.09/0.76 <0.05/0.09 2.0/3.0 7.0/8.0 Nil/Nil
Aug 2014 – O/H 7.3 2.0 0.001 0.34 0.19 1 10 0
Aug 2014 – GW 7.4 2.0 0.001 0.36 0.20 1 10 0
Apr 2015 -- -- -- -- -- -- -- --
Result Status OK OK OK OK Above OK OK OK
Project Effect n/a n/a n/a n/a n/a n/a n/a n/a
28 Appendix 1
Br#79 CONTRACTOR’S CAMP (West): Km 41+167: Construction of Bridge over Sitalakha River:
Parameter pH TSP As Fe Mn S Cl FC
GOB Drinking Wtr Stndrd.
ECR’97 6.5 – 8.5 10 mg/l 0.05 mg/l
0.3 – 1.06 mg/l
0.1 mg/l < 5 mg/l ≤600 mg/l
0 CFU/100
ml
Sep 2013 6.3/6.4 218/203 0.001 4.2/3.8 0.27/0.28 1.0/1.0 50/54 Nil/Nil
Jan 2014 -- -- -- -- -- -- -- --
Aug 2014 -- -- -- -- -- -- -- --
Apr 2015 -- -- -- -- -- -- -- --
Result Status
Project Effect n/a n/a n/a n/a n/a n/a n/a None
Pubail CONTRACTOR’S CAMP: Km 55+920: Camp Site for Project Site Office and Storage Yard.
(Br#89)
Parameter pH TSP As Fe Mn S Cl FC
GOB Drinking Wtr Stndrd.
ECR’97 6.5 – 8.5 10 mg/l 0.05 mg/l
0.3 – 1.06 mg/l
0.1 mg/l < 5 mg/l ≤600 mg/l
0 CFU/100
ml
Jul 2013 -- -- -- -- -- -- -- --
Aug 2013 6.77/6.77 313/241 ≤10 0.144/0.065
0.40/0.30 1.1/0.3 0.18/3.75 Nil/Nil
Jan 2014 -- -- -- -- -- -- -- --
Aug 2014 -- -- -- -- -- -- -- --
Apr 2015 -- -- -- -- -- -- -- --
Result Status
Project Effect n/a n/a n/a n/a n/a n/a n/a None
Br#61 WORK SITE – PILING: Km 24+700 – Construction of Bridge
Parameter pH TSP As Fe Mn S Cl FC
GOB Drinking Wtr Stndrd.
ECR’97 6.5 – 8.5 10 mg/l 0.05 mg/l
0.3 – 1.06 mg/l
0.1 mg/l < 5 mg/l ≤600 mg/l
0 CFU/100
ml
Jul 2013 -- -- -- -- -- -- -- --
Aug 2013 6.43/6.45 204/206 ≤10/50 1.199/1.246
1.9/2.0 6.0/6.7 2.66/17.68
Nil/Nil
Jan 2014 7.3/7.3 216/215 .067/.071 3.13/3.16 1.35/1.36 11/10 14/13 Nil/Nil
Aug 2014 7.2/7.2 6.0/5.0 .093/.095 4.5/4.0 1.87/2.05 2.0/1.0 21/18 0/0
Apr 2015 7.7/7.6 248/244 .044/.046 3.32/3.28 1.5/1.5 1/1 20/17 0
Result Status OK Above OK Above limit
Above limit
OK OK OK
Project Effect n/a n/a n/a n/a n/a n/a n/a n/a
Br#84 WORK SITE – PILING: Km 47+300 – Construction of Bridge
Parameter pH TSP As Fe Mn S Cl FC
GOB Drinking Wtr Stndrd.
ECR’97 6.5 – 8.5 10 mg/l 0.05 mg/l
0.3 – 1.06 mg/l
0.1 mg/l < 5 mg/l ≤600 mg/l
0 CFU/100
ml
Jul 2013 -- -- -- -- -- -- -- --
Aug 2013 6.86/7.06 294/312 ≤10 1.064/1.33
0.4/0.7 33.4/33.5 3.32/7.06 Nil/Nil
Jan 2014 7.5/7.3 236/239 0.002 3.18/3.30 0.22/0.22 1.0/1.0 29/31 Nil/Nil
Aug 2014 -- -- -- -- -- -- -- --
Apr 2015 8.0/8.1 194/194 .002/.001 0.30/0.38 .005/0.05 2.0/1.0 35/25 0
Result Status OK Above OK OK OK OK OK OK
Project Effect n/a n/a n/a n/a n/a n/a n/a None
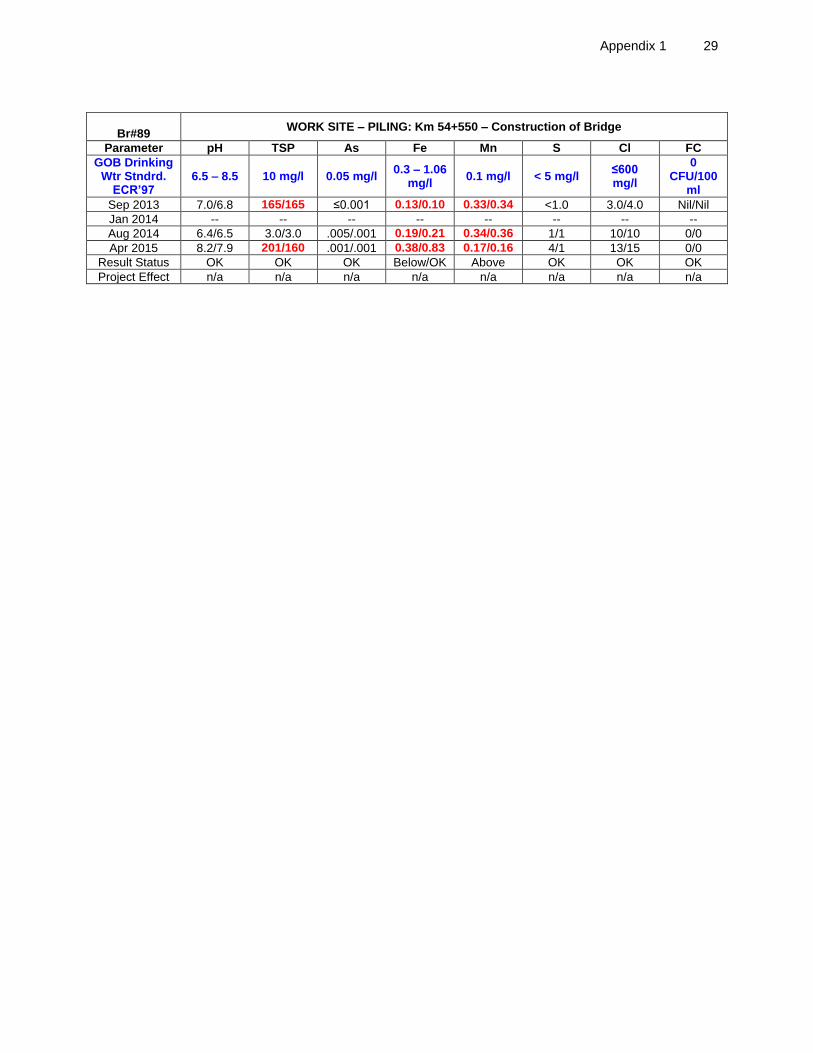
Appendix 1 29
Br#89 WORK SITE – PILING: Km 54+550 – Construction of Bridge
Parameter pH TSP As Fe Mn S Cl FC
GOB Drinking Wtr Stndrd.
ECR’97 6.5 – 8.5 10 mg/l 0.05 mg/l
0.3 – 1.06 mg/l
0.1 mg/l < 5 mg/l ≤600 mg/l
0 CFU/100
ml
Sep 2013 7.0/6.8 165/165 ≤0.001 0.13/0.10 0.33/0.34 <1.0 3.0/4.0 Nil/Nil
Jan 2014 -- -- -- -- -- -- -- --
Aug 2014 6.4/6.5 3.0/3.0 .005/.001 0.19/0.21 0.34/0.36 1/1 10/10 0/0
Apr 2015 8.2/7.9 201/160 .001/.001 0.38/0.83 0.17/0.16 4/1 13/15 0/0
Result Status OK OK OK Below/OK Above OK OK OK
Project Effect n/a n/a n/a n/a n/a n/a n/a n/a
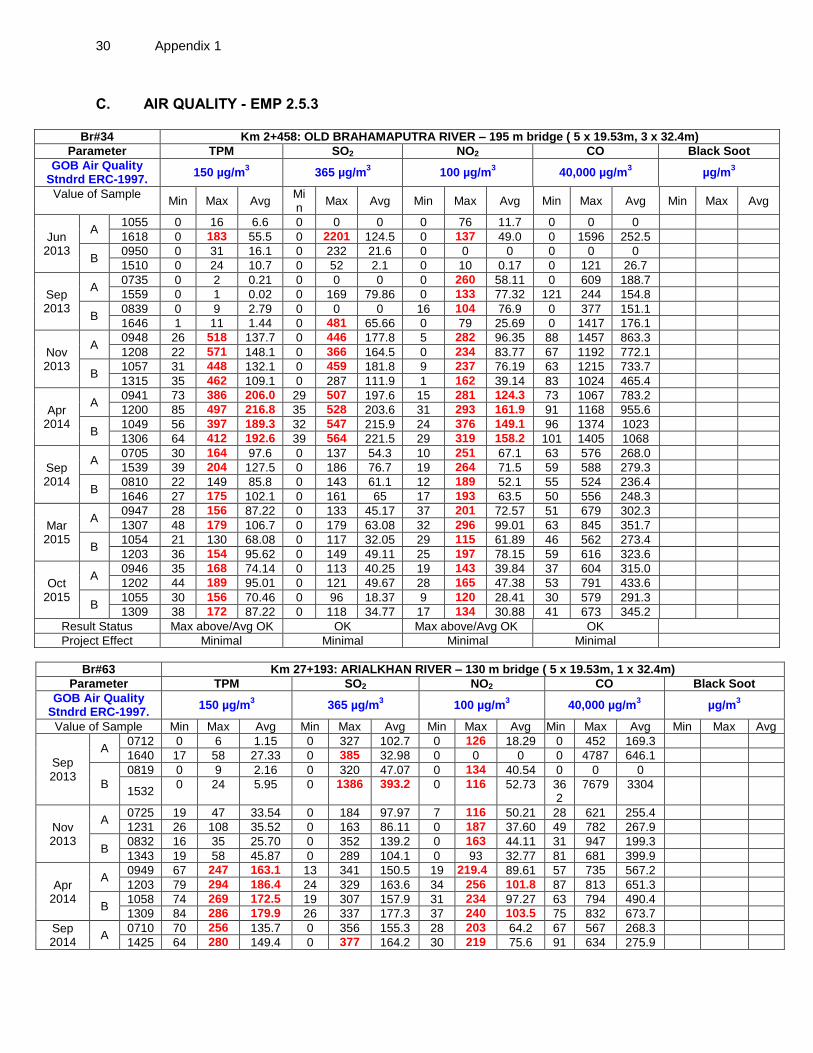
30 Appendix 1
C. AIR QUALITY - EMP 2.5.3
Br#34 Km 2+458: OLD BRAHAMAPUTRA RIVER – 195 m bridge ( 5 x 19.53m, 3 x 32.4m)
Parameter TPM SO2 NO2 CO Black Soot
GOB Air Quality Stndrd ERC-1997.
150 µg/m3 365 µg/m
3 100 µg/m
3 40,000 µg/m
3 µg/m
3
Value of Sample Min Max Avg
Min
Max Avg Min Max Avg Min Max Avg Min Max Avg
Jun 2013
A 1055 0 16 6.6 0 0 0 0 76 11.7 0 0 0
1618 0 183 55.5 0 2201 124.5 0 137 49.0 0 1596 252.5
B 0950 0 31 16.1 0 232 21.6 0 0 0 0 0 0
1510 0 24 10.7 0 52 2.1 0 10 0.17 0 121 26.7
Sep 2013
A 0735 0 2 0.21 0 0 0 0 260 58.11 0 609 188.7
1559 0 1 0.02 0 169 79.86 0 133 77.32 121 244 154.8
B 0839 0 9 2.79 0 0 0 16 104 76.9 0 377 151.1
1646 1 11 1.44 0 481 65.66 0 79 25.69 0 1417 176.1
Nov 2013
A 0948 26 518 137.7 0 446 177.8 5 282 96.35 88 1457 863.3
1208 22 571 148.1 0 366 164.5 0 234 83.77 67 1192 772.1
B 1057 31 448 132.1 0 459 181.8 9 237 76.19 63 1215 733.7
1315 35 462 109.1 0 287 111.9 1 162 39.14 83 1024 465.4
Apr 2014
A 0941 73 386 206.0 29 507 197.6 15 281 124.3 73 1067 783.2
1200 85 497 216.8 35 528 203.6 31 293 161.9 91 1168 955.6
B 1049 56 397 189.3 32 547 215.9 24 376 149.1 96 1374 1023
1306 64 412 192.6 39 564 221.5 29 319 158.2 101 1405 1068
Sep 2014
A 0705 30 164 97.6 0 137 54.3 10 251 67.1 63 576 268.0
1539 39 204 127.5 0 186 76.7 19 264 71.5 59 588 279.3
B 0810 22 149 85.8 0 143 61.1 12 189 52.1 55 524 236.4
1646 27 175 102.1 0 161 65 17 193 63.5 50 556 248.3
Mar 2015
A 0947 28 156 87.22 0 133 45.17 37 201 72.57 51 679 302.3
1307 48 179 106.7 0 179 63.08 32 296 99.01 63 845 351.7
B 1054 21 130 68.08 0 117 32.05 29 115 61.89 46 562 273.4
1203 36 154 95.62 0 149 49.11 25 197 78.15 59 616 323.6
Oct 2015
A 0946 35 168 74.14 0 113 40.25 19 143 39.84 37 604 315.0
1202 44 189 95.01 0 121 49.67 28 165 47.38 53 791 433.6
B 1055 30 156 70.46 0 96 18.37 9 120 28.41 30 579 291.3
1309 38 172 87.22 0 118 34.77 17 134 30.88 41 673 345.2
Result Status Max above/Avg OK OK Max above/Avg OK OK
Project Effect Minimal Minimal Minimal Minimal
Br#63 Km 27+193: ARIALKHAN RIVER – 130 m bridge ( 5 x 19.53m, 1 x 32.4m)
Parameter TPM SO2 NO2 CO Black Soot
GOB Air Quality Stndrd ERC-1997.
150 µg/m3 365 µg/m
3 100 µg/m
3 40,000 µg/m
3 µg/m
3
Value of Sample Min Max Avg Min Max Avg Min Max Avg Min Max Avg Min Max Avg
Sep 2013
A 0712 0 6 1.15 0 327 102.7 0 126 18.29 0 452 169.3
1640 17 58 27.33 0 385 32.98 0 0 0 0 4787 646.1
B
0819 0 9 2.16 0 320 47.07 0 134 40.54 0 0 0
1532 0 24 5.95 0 1386 393.2 0 116 52.73 36
2 7679 3304
Nov 2013
A 0725 19 47 33.54 0 184 97.97 7 116 50.21 28 621 255.4
1231 26 108 35.52 0 163 86.11 0 187 37.60 49 782 267.9
B 0832 16 35 25.70 0 352 139.2 0 163 44.11 31 947 199.3
1343 19 58 45.87 0 289 104.1 0 93 32.77 81 681 399.9
Apr 2014
A 0949 67 247 163.1 13 341 150.5 19 219.4 89.61 57 735 567.2
1203 79 294 186.4 24 329 163.6 34 256 101.8 87 813 651.3
B 1058 74 269 172.5 19 307 157.9 31 234 97.27 63 794 490.4
1309 84 286 179.9 26 337 177.3 37 240 103.5 75 832 673.7
Sep 2014
A 0710 70 256 135.7 0 356 155.3 28 203 64.2 67 567 268.3
1425 64 280 149.4 0 377 164.2 30 219 75.6 91 634 275.9

Appendix 1 31
Br#63 Km 27+193: ARIALKHAN RIVER – 130 m bridge ( 5 x 19.53m, 1 x 32.4m)
Parameter TPM SO2 NO2 CO Black Soot
GOB Air Quality Stndrd ERC-1997.
150 µg/m3 365 µg/m
3 100 µg/m
3 40,000 µg/m
3 µg/m
3
Value of Sample Min Max Avg Min Max Avg Min Max Avg Min Max Avg Min Max Avg
B 0815 59 278 130.1 0 311 126.3 26 231 71.6 69 541 247.1
1320 49 276 139.8 0 319 132.5 35 225 69.9 72 610 258.5
Mar 2015
A 0754 53 154 93.55 0 274 121.0 19 194 87.09 52 569 278.3
1303 70 252 132.3 0 378 217.6 37 243 104.3 61 713 296.1
B 0648 47 136 88.42 0 248 99.74 22 168 59.4 46 482 246.8
1407 65 240 117.8 0 359 143.4 31 197 88.95 55 667 279.4
Oct 2015
A 0631 42 131 88.19 0 92 28.5 17 106 49.88 31 557 233.9
1552 65 188 119.0 0 100 51.79 26 141 58.76 45 766 381.4
B 0737 38 118 76.51 0 78 22.73 11 97 43.76 21 532 224.4
1659 48 146 87.26 0 90 39.84 20 116 48.22 34 603 260.4
Result Status Max above/Avg OK OK Max above/Avg OK OK
Project Effect Minimal n/a Minimal Minimal
Br#79 Km 41+167: SITALAKHA RIVER – 360 m bridge ( 1 x 21.78, 1 x 14.62, 6 x 19.53, 4 x 32.4, 1 x 77 m)
Parameter TPM SO2 NO2 CO Black Soot
GOB Air Quality Stndrd
ERC-1997. 150 µg/m
3 365 µg/m
3 100 µg/m
3 40,000 µg/m
3 µg/m
3
Value of Sample Min Max Avg Min Max Avg Min Max Avg Min Max Avg Min Max Avg
Oct 2012 104 63 42 -- --
Jun 2013
A 0944 19 46 36.3 0 123 7.8 0 0 0 0 126 18.0
1440 0 24 11.0 0 39 6.0 0 0 0 0 218 72.2
B 1053 1 40 23.4 0 50 7.3 0 115 13.1 0 0 0
1202 1 52 27.2 0 0 0 0 89 13.5 0 0 0
Sep 2013
A 0721 0 23 5.67 0 792 121.4 0 96 6.40 0 1110 209.3
1602 5 34 17.49 0 0 0 18 125 99.56 378 603 508.5
B 0827 0 31 12.38 0 4485 84.63 114 248 186.2 0 18539 393.1
1715 0 148 36.21 0 175 22.79 0 226 91.41 85 605 254.6
Nov 2013
A 0704 27 93 69.18 0 330 161.3 9 209 71.20 21 1064 284.4
1642 72 1297 214.9 0 1574 333.7 0 291 92.46 117 3872 478.5
B 0810 46 185 82.28 0 451 306 0 403 52.11 2 1119 295.9
1750 58 667 157.7 0 659 247.9 0 278 85.27 778 2469 1039
Apr 2014
A 0710 50 249 164.1 16 307 117.2 31 351 118.7 68 1073 713.9
1551 83 328 217.8 32 397 217.2 43 510 134.8 106 1682 1264
B 0816 59 219 137.2 27 312 133.0 28 287 79.39 60 981 641.1
1703 78 311 194.7 45 468 209.5 37 491 103.6 97 1353 1074
Sep 2014
A 0913 44 152 96.2 0 431 159.3 20 248 83.5 38 689 273.5
1204 60 189 132.4 0 423 174.1 20 264 132.9 79 748 439.3
B 1020 53 186 117.6 0 511 119.6 16 25.6 103.5 30 657 294.3
1310 67 231 144.2 0 443 156.7 19 250 110.8 62 698 289.3
Mar 2015
A 0715 62 176 109.3 0 394 144.9 22 258 89.66 39 629 289.1
1630 56 286 146.3 0 399 160.3 40 298 113.7 69 712 356.6
B 0820 66 214 138.1 0 417 157.1 20 275 98.42 46 661 317.6
1738 98 292 162.9 0 341 179.3 34 357 127.0 78 806 387.1
Oct 2015
A 0701 82 187 121.2 0 175 51.4 28 177 79.06 49 736 518.0
1611 86 191 133.6 0 187 67.74 33 191 88.64 64 892 586.3
B 0807 72 156 101.2 0 166.1 44.36 22 154 61.77 42 697 430.8
1719 82 174 127.0 0 167 58.09 25 160 69.87 51 716 527.9
Result Status Max high/Avg OK Max high/Avg OK Max above/Avg OK OK
Project Effect Minimal Minimal Minimal Minimal
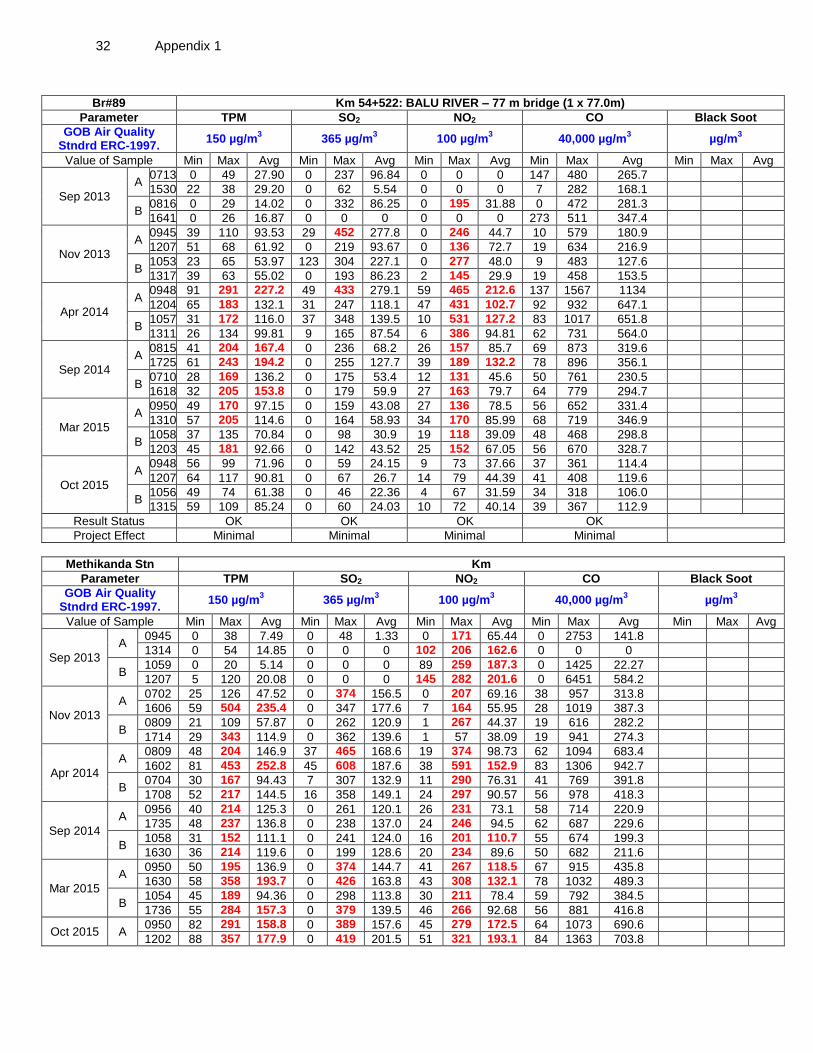
32 Appendix 1
Br#89 Km 54+522: BALU RIVER – 77 m bridge (1 x 77.0m)
Parameter TPM SO2 NO2 CO Black Soot
GOB Air Quality Stndrd ERC-1997.
150 µg/m3 365 µg/m
3 100 µg/m
3 40,000 µg/m
3 µg/m
3
Value of Sample Min Max Avg Min Max Avg Min Max Avg Min Max Avg Min Max Avg
Sep 2013
A 0713 0 49 27.90 0 237 96.84 0 0 0 147 480 265.7
1530 22 38 29.20 0 62 5.54 0 0 0 7 282 168.1
B 0816 0 29 14.02 0 332 86.25 0 195 31.88 0 472 281.3
1641 0 26 16.87 0 0 0 0 0 0 273 511 347.4
Nov 2013
A 0945 39 110 93.53 29 452 277.8 0 246 44.7 10 579 180.9
1207 51 68 61.92 0 219 93.67 0 136 72.7 19 634 216.9
B 1053 23 65 53.97 123 304 227.1 0 277 48.0 9 483 127.6
1317 39 63 55.02 0 193 86.23 2 145 29.9 19 458 153.5
Apr 2014
A 0948 91 291 227.2 49 433 279.1 59 465 212.6 137 1567 1134
1204 65 183 132.1 31 247 118.1 47 431 102.7 92 932 647.1
B 1057 31 172 116.0 37 348 139.5 10 531 127.2 83 1017 651.8
1311 26 134 99.81 9 165 87.54 6 386 94.81 62 731 564.0
Sep 2014
A 0815 41 204 167.4 0 236 68.2 26 157 85.7 69 873 319.6
1725 61 243 194.2 0 255 127.7 39 189 132.2 78 896 356.1
B 0710 28 169 136.2 0 175 53.4 12 131 45.6 50 761 230.5
1618 32 205 153.8 0 179 59.9 27 163 79.7 64 779 294.7
Mar 2015
A 0950 49 170 97.15 0 159 43.08 27 136 78.5 56 652 331.4
1310 57 205 114.6 0 164 58.93 34 170 85.99 68 719 346.9
B 1058 37 135 70.84 0 98 30.9 19 118 39.09 48 468 298.8
1203 45 181 92.66 0 142 43.52 25 152 67.05 56 670 328.7
Oct 2015
A 0948 56 99 71.96 0 59 24.15 9 73 37.66 37 361 114.4
1207 64 117 90.81 0 67 26.7 14 79 44.39 41 408 119.6
B 1056 49 74 61.38 0 46 22.36 4 67 31.59 34 318 106.0
1315 59 109 85.24 0 60 24.03 10 72 40.14 39 367 112.9
Result Status OK OK OK OK
Project Effect Minimal Minimal Minimal Minimal
Methikanda Stn Km
Parameter TPM SO2 NO2 CO Black Soot
GOB Air Quality Stndrd ERC-1997.
150 µg/m3 365 µg/m
3 100 µg/m
3 40,000 µg/m
3 µg/m
3
Value of Sample Min Max Avg Min Max Avg Min Max Avg Min Max Avg Min Max Avg
Sep 2013
A 0945 0 38 7.49 0 48 1.33 0 171 65.44 0 2753 141.8
1314 0 54 14.85 0 0 0 102 206 162.6 0 0 0
B 1059 0 20 5.14 0 0 0 89 259 187.3 0 1425 22.27
1207 5 120 20.08 0 0 0 145 282 201.6 0 6451 584.2
Nov 2013
A 0702 25 126 47.52 0 374 156.5 0 207 69.16 38 957 313.8
1606 59 504 235.4 0 347 177.6 7 164 55.95 28 1019 387.3
B 0809 21 109 57.87 0 262 120.9 1 267 44.37 19 616 282.2
1714 29 343 114.9 0 362 139.6 1 57 38.09 19 941 274.3
Apr 2014
A 0809 48 204 146.9 37 465 168.6 19 374 98.73 62 1094 683.4
1602 81 453 252.8 45 608 187.6 38 591 152.9 83 1306 942.7
B 0704 30 167 94.43 7 307 132.9 11 290 76.31 41 769 391.8
1708 52 217 144.5 16 358 149.1 24 297 90.57 56 978 418.3
Sep 2014
A 0956 40 214 125.3 0 261 120.1 26 231 73.1 58 714 220.9
1735 48 237 136.8 0 238 137.0 24 246 94.5 62 687 229.6
B 1058 31 152 111.1 0 241 124.0 16 201 110.7 55 674 199.3
1630 36 214 119.6 0 199 128.6 20 234 89.6 50 682 211.6
Mar 2015
A 0950 50 195 136.9 0 374 144.7 41 267 118.5 67 915 435.8
1630 58 358 193.7 0 426 163.8 43 308 132.1 78 1032 489.3
B 1054 45 189 94.36 0 298 113.8 30 211 78.4 59 792 384.5
1736 55 284 157.3 0 379 139.5 46 266 92.68 56 881 416.8
Oct 2015 A 0950 82 291 158.8 0 389 157.6 45 279 172.5 64 1073 690.6
1202 88 357 177.9 0 419 201.5 51 321 193.1 84 1363 703.8

Appendix 1 33
Methikanda Stn Km
Parameter TPM SO2 NO2 CO Black Soot
GOB Air Quality Stndrd ERC-1997.
150 µg/m3 365 µg/m
3 100 µg/m
3 40,000 µg/m
3 µg/m
3
Value of Sample Min Max Avg Min Max Avg Min Max Avg Min Max Avg Min Max Avg
B 0958 56 209 131.5 0 327 112.0 31 237 108.4 51 829 396.1
1315 63 234 139.6 0 347 152.7 49 272 139.6 61 947 467.8
Result Status Max above/Avg high
Max above/Avg OK
Max above/Avg high
OK
Project Effect Minimal Minimal Minimal Minimal
Pubail Station Km
Parameter TPM SO2 NO2 CO Black Soot
GOB Air Quality Stndrd ERC-1997.
150 µg/m3 365 µg/m
3 100 µg/m
3 40,000 µg/m
3 µg/m
3
Value of Sample Min Max Avg Min Max Avg Min Max Avg Min Max Avg Min Max Avg
Sep 2013
A 0950 14 57 26.12 0 182 55.74 0 0 0 242 594 403.6
1205 0 19 10.78 0 126 39.36 0 0 0 317 864 460.1
B 1055 15 120 49.84 0 274 85.18 0 0 0 325 1540 740.8
1310 4 84 30.92 0 16 0.41 0 0 0 370 1367 625.5
Nov 2013
A 0705 16 44 36.97 0 531 267.7 0 197 44.9 42 971 515.0
1932 39 324 183.5 0 673 157.9 0 288 79.4 1699 2639 2212
B 0816 25 64 43.04 0 674 219.2 0 319 60.5 34 852 546.8
2035 32 296 154.9 0 336 162.7 0 165 67.2 1350 2701 1983
Apr 2014
A 0947 31 105 65.43 51 387 249.2 27 289 94.73 67 867 497.3
1205 67 325 189.6 41 587 307.6 47 355 228.5 861 1748 1385
B 1056 44 167 96.09 7 319 226.0 31 382 197.2 79 932 691.9
1312 90 314 198.2 47 429 281.5 64 395 288.1 1019 2014 1536
Sep 2014
A 0710 33 161 65.4 0 268 169.3 21 133 115.4 67 973 574.2
1643 49 180 97.2 0 304 275.8 18 212 157.8 101 1238 649.8
B 0816 14 138 59.5 0 197 143.7 10 128 92.0 55 892 538.8
1749 20 144 65.6 0 201 147.3 15 150 97.3 92 1034 594.7
Mar 2015
A 0700 98 274 142.5 0 167 95.55 30 354 132.0 57 814 491.7
1720 80 235 151.3 0 412 214.8 48 421 210.9 80 984 752.2
B 0806 82 221 125.9 0 301 124.2 27 240 152.8 70 1033 553.3
1615 87 230 137.1 0 356 251.9 19 314 200.8 61 1134 738.3
Oct 2015
A 0915 67 193 117.9 0 151 73.3 19 241 116.7 43 819 637.3
1022 69 207 139.6 0 169 88.7 31 279 152.0 73 1066 844.3
B 1201 81 214 125.9 0 178 76.66 23 254 122.9 51 1013 724.7
1310 87 235 143.6 0 193 95.3 36 291 150.0 76 1179 867.4
Result Status Max above/Avg OK
OK Max above/Avg above
OK
Project Effect Minimal Minimal Minimal Minimal
Tongi Station Km
Parameter TPM SO2 NO2 CO Black Soot
GOB Air Quality Stndrd ERC-1997.
150 µg/m3 365 µg/m
3 100 µg/m
3 40,000 µg/m
3 µg/m
3
Value of Sample Min Max Avg Min Max Avg Min Max Avg Min Max Avg Min Max Avg
Sep 2013
A 0710 17 52 30.55 0 141 24.62 0 0 0 0 959 580.7
1515 21 222 41.25 0 195 57.57 31 126 62.82 573 1926 1139
B 0815 0 47 17.67 0 67 3.26 18 142 94.62 0 999 630.5
1630 22 53 36.66 0 380 171.4 0 152 32.68 168 1134 623.6
Nov 2013
A 0950 15 62 49.61 0 369 137.9 0 212 40.98 21 561 328.6
1320 107 186 139.1 0 332 166.8 0 319 87.50 674 1344 918.1
B 1058 23 88 34.18 0 341 174.5 0 262 65.79 24 784 220.8
1205 19 97 56.32 0 226 106.1 0 187 58.87 11.5 536 158.2
Apr 2014
A 0701 34 153 96.3 17 345 103.7 19 262 153.8 112 1019 541.3
1541 87 255 186.3 74 374 185.8 34 241 181.4 359 1545 1035
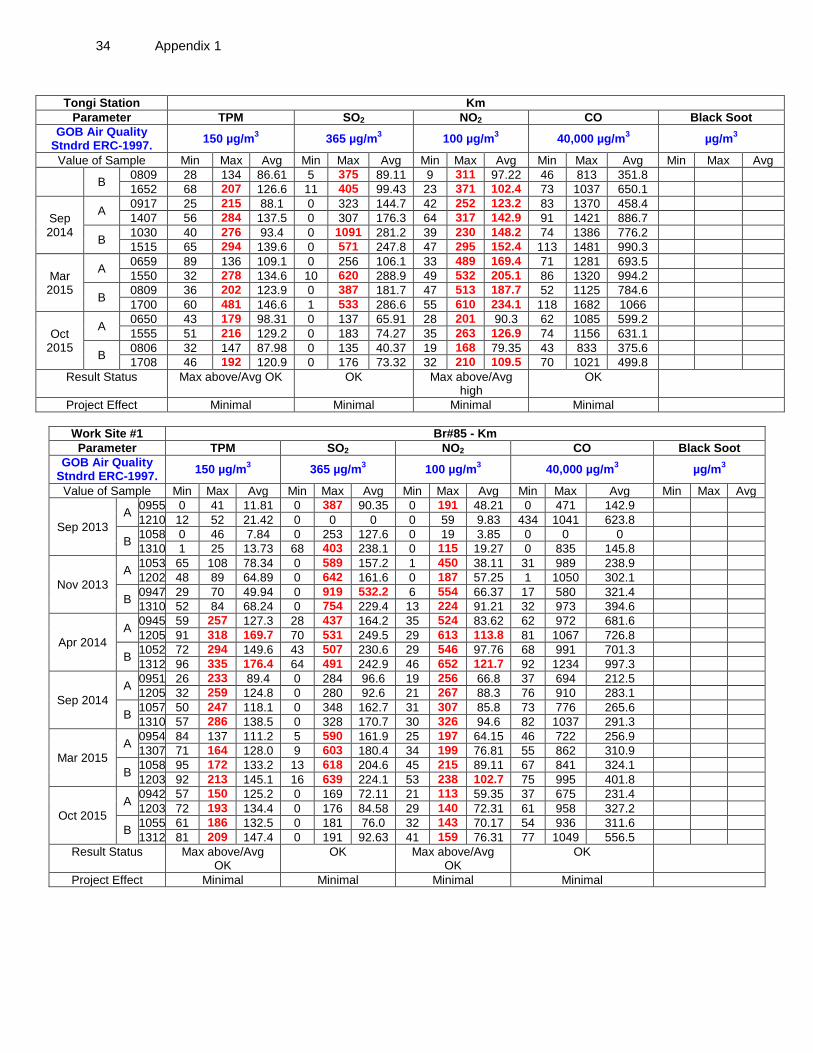
34 Appendix 1
Tongi Station Km
Parameter TPM SO2 NO2 CO Black Soot
GOB Air Quality Stndrd ERC-1997.
150 µg/m3 365 µg/m
3 100 µg/m
3 40,000 µg/m
3 µg/m
3
Value of Sample Min Max Avg Min Max Avg Min Max Avg Min Max Avg Min Max Avg
B 0809 28 134 86.61 5 375 89.11 9 311 97.22 46 813 351.8
1652 68 207 126.6 11 405 99.43 23 371 102.4 73 1037 650.1
Sep 2014
A 0917 25 215 88.1 0 323 144.7 42 252 123.2 83 1370 458.4
1407 56 284 137.5 0 307 176.3 64 317 142.9 91 1421 886.7
B 1030 40 276 93.4 0 1091 281.2 39 230 148.2 74 1386 776.2
1515 65 294 139.6 0 571 247.8 47 295 152.4 113 1481 990.3
Mar 2015
A 0659 89 136 109.1 0 256 106.1 33 489 169.4 71 1281 693.5
1550 32 278 134.6 10 620 288.9 49 532 205.1 86 1320 994.2
B 0809 36 202 123.9 0 387 181.7 47 513 187.7 52 1125 784.6
1700 60 481 146.6 1 533 286.6 55 610 234.1 118 1682 1066
Oct 2015
A 0650 43 179 98.31 0 137 65.91 28 201 90.3 62 1085 599.2
1555 51 216 129.2 0 183 74.27 35 263 126.9 74 1156 631.1
B 0806 32 147 87.98 0 135 40.37 19 168 79.35 43 833 375.6
1708 46 192 120.9 0 176 73.32 32 210 109.5 70 1021 499.8
Result Status Max above/Avg OK OK Max above/Avg high
OK
Project Effect Minimal Minimal Minimal Minimal
Work Site #1 Br#85 - Km
Parameter TPM SO2 NO2 CO Black Soot
GOB Air Quality Stndrd ERC-1997.
150 µg/m3 365 µg/m
3 100 µg/m
3 40,000 µg/m
3 µg/m
3
Value of Sample Min Max Avg Min Max Avg Min Max Avg Min Max Avg Min Max Avg
Sep 2013
A 0955 0 41 11.81 0 387 90.35 0 191 48.21 0 471 142.9
1210 12 52 21.42 0 0 0 0 59 9.83 434 1041 623.8
B 1058 0 46 7.84 0 253 127.6 0 19 3.85 0 0 0
1310 1 25 13.73 68 403 238.1 0 115 19.27 0 835 145.8
Nov 2013
A 1053 65 108 78.34 0 589 157.2 1 450 38.11 31 989 238.9
1202 48 89 64.89 0 642 161.6 0 187 57.25 1 1050 302.1
B 0947 29 70 49.94 0 919 532.2 6 554 66.37 17 580 321.4
1310 52 84 68.24 0 754 229.4 13 224 91.21 32 973 394.6
Apr 2014
A 0945 59 257 127.3 28 437 164.2 35 524 83.62 62 972 681.6
1205 91 318 169.7 70 531 249.5 29 613 113.8 81 1067 726.8
B 1052 72 294 149.6 43 507 230.6 29 546 97.76 68 991 701.3
1312 96 335 176.4 64 491 242.9 46 652 121.7 92 1234 997.3
Sep 2014
A 0951 26 233 89.4 0 284 96.6 19 256 66.8 37 694 212.5
1205 32 259 124.8 0 280 92.6 21 267 88.3 76 910 283.1
B 1057 50 247 118.1 0 348 162.7 31 307 85.8 73 776 265.6
1310 57 286 138.5 0 328 170.7 30 326 94.6 82 1037 291.3
Mar 2015
A 0954 84 137 111.2 5 590 161.9 25 197 64.15 46 722 256.9
1307 71 164 128.0 9 603 180.4 34 199 76.81 55 862 310.9
B 1058 95 172 133.2 13 618 204.6 45 215 89.11 67 841 324.1
1203 92 213 145.1 16 639 224.1 53 238 102.7 75 995 401.8
Oct 2015
A 0942 57 150 125.2 0 169 72.11 21 113 59.35 37 675 231.4
1203 72 193 134.4 0 176 84.58 29 140 72.31 61 958 327.2
B 1055 61 186 132.5 0 181 76.0 32 143 70.17 54 936 311.6
1312 81 209 147.4 0 191 92.63 41 159 76.31 77 1049 556.5
Result Status Max above/Avg OK
OK Max above/Avg OK
OK
Project Effect Minimal Minimal Minimal Minimal
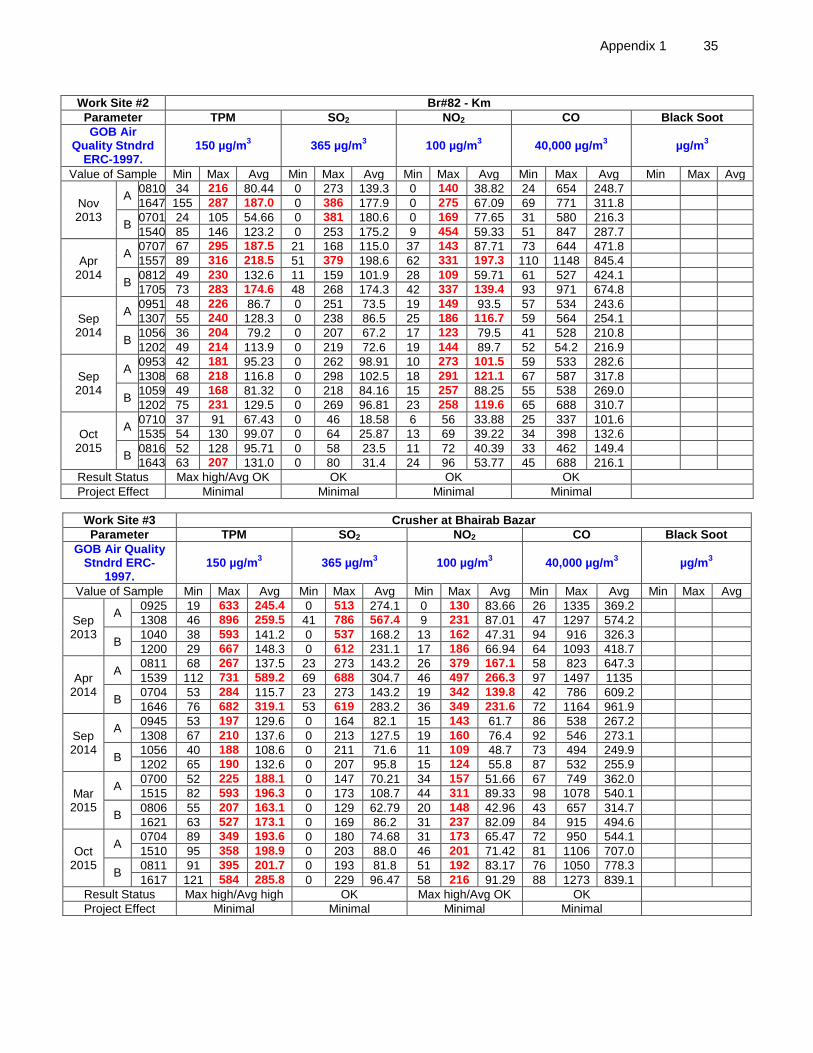
Appendix 1 35
Work Site #2 Br#82 - Km
Parameter TPM SO2 NO2 CO Black Soot
GOB Air Quality Stndrd
ERC-1997. 150 µg/m
3 365 µg/m
3 100 µg/m
3 40,000 µg/m
3 µg/m
3
Value of Sample Min Max Avg Min Max Avg Min Max Avg Min Max Avg Min Max Avg
Nov 2013
A 0810 34 216 80.44 0 273 139.3 0 140 38.82 24 654 248.7
1647 155 287 187.0 0 386 177.9 0 275 67.09 69 771 311.8
B 0701 24 105 54.66 0 381 180.6 0 169 77.65 31 580 216.3
1540 85 146 123.2 0 253 175.2 9 454 59.33 51 847 287.7
Apr 2014
A 0707 67 295 187.5 21 168 115.0 37 143 87.71 73 644 471.8
1557 89 316 218.5 51 379 198.6 62 331 197.3 110 1148 845.4
B 0812 49 230 132.6 11 159 101.9 28 109 59.71 61 527 424.1
1705 73 283 174.6 48 268 174.3 42 337 139.4 93 971 674.8
Sep 2014
A 0951 48 226 86.7 0 251 73.5 19 149 93.5 57 534 243.6
1307 55 240 128.3 0 238 86.5 25 186 116.7 59 564 254.1
B 1056 36 204 79.2 0 207 67.2 17 123 79.5 41 528 210.8
1202 49 214 113.9 0 219 72.6 19 144 89.7 52 54.2 216.9
Sep 2014
A 0953 42 181 95.23 0 262 98.91 10 273 101.5 59 533 282.6
1308 68 218 116.8 0 298 102.5 18 291 121.1 67 587 317.8
B 1059 49 168 81.32 0 218 84.16 15 257 88.25 55 538 269.0
1202 75 231 129.5 0 269 96.81 23 258 119.6 65 688 310.7
Oct 2015
A 0710 37 91 67.43 0 46 18.58 6 56 33.88 25 337 101.6
1535 54 130 99.07 0 64 25.87 13 69 39.22 34 398 132.6
B 0816 52 128 95.71 0 58 23.5 11 72 40.39 33 462 149.4
1643 63 207 131.0 0 80 31.4 24 96 53.77 45 688 216.1
Result Status Max high/Avg OK OK OK OK
Project Effect Minimal Minimal Minimal Minimal
Work Site #3 Crusher at Bhairab Bazar
Parameter TPM SO2 NO2 CO Black Soot
GOB Air Quality Stndrd ERC-
1997. 150 µg/m
3 365 µg/m
3 100 µg/m
3 40,000 µg/m
3 µg/m
3
Value of Sample Min Max Avg Min Max Avg Min Max Avg Min Max Avg Min Max Avg
Sep 2013
A 0925 19 633 245.4 0 513 274.1 0 130 83.66 26 1335 369.2
1308 46 896 259.5 41 786 567.4 9 231 87.01 47 1297 574.2
B 1040 38 593 141.2 0 537 168.2 13 162 47.31 94 916 326.3
1200 29 667 148.3 0 612 231.1 17 186 66.94 64 1093 418.7
Apr 2014
A 0811 68 267 137.5 23 273 143.2 26 379 167.1 58 823 647.3
1539 112 731 589.2 69 688 304.7 46 497 266.3 97 1497 1135
B 0704 53 284 115.7 23 273 143.2 19 342 139.8 42 786 609.2
1646 76 682 319.1 53 619 283.2 36 349 231.6 72 1164 961.9
Sep 2014
A 0945 53 197 129.6 0 164 82.1 15 143 61.7 86 538 267.2
1308 67 210 137.6 0 213 127.5 19 160 76.4 92 546 273.1
B 1056 40 188 108.6 0 211 71.6 11 109 48.7 73 494 249.9
1202 65 190 132.6 0 207 95.8 15 124 55.8 87 532 255.9
Mar 2015
A 0700 52 225 188.1 0 147 70.21 34 157 51.66 67 749 362.0
1515 82 593 196.3 0 173 108.7 44 311 89.33 98 1078 540.1
B 0806 55 207 163.1 0 129 62.79 20 148 42.96 43 657 314.7
1621 63 527 173.1 0 169 86.2 31 237 82.09 84 915 494.6
Oct 2015
A 0704 89 349 193.6 0 180 74.68 31 173 65.47 72 950 544.1
1510 95 358 198.9 0 203 88.0 46 201 71.42 81 1106 707.0
B 0811 91 395 201.7 0 193 81.8 51 192 83.17 76 1050 778.3
1617 121 584 285.8 0 229 96.47 58 216 91.29 88 1273 839.1
Result Status Max high/Avg high OK Max high/Avg OK OK
Project Effect Minimal Minimal Minimal Minimal
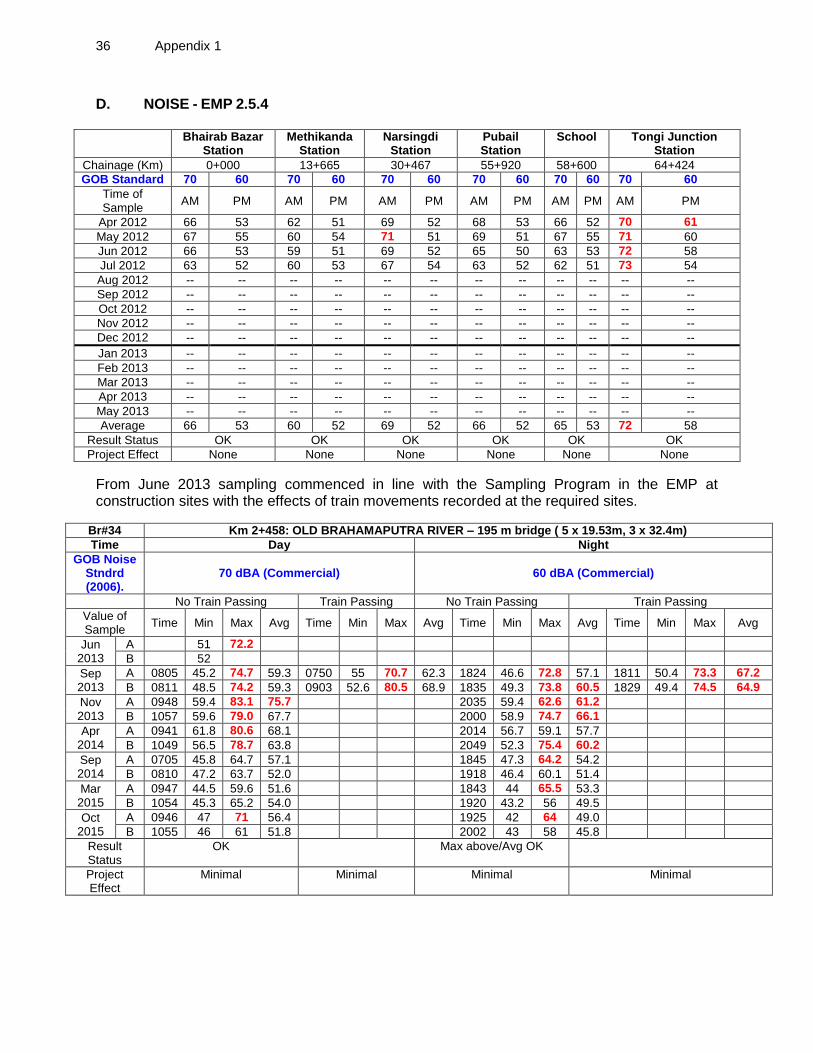
36 Appendix 1
D. NOISE - EMP 2.5.4
Bhairab Bazar
Station Methikanda
Station Narsingdi
Station Pubail Station
School Tongi Junction Station
Chainage (Km) 0+000 13+665 30+467 55+920 58+600 64+424
GOB Standard 70 60 70 60 70 60 70 60 70 60 70 60
Time of Sample
AM PM AM PM AM PM AM PM AM PM AM PM
Apr 2012 66 53 62 51 69 52 68 53 66 52 70 61
May 2012 67 55 60 54 71 51 69 51 67 55 71 60
Jun 2012 66 53 59 51 69 52 65 50 63 53 72 58
Jul 2012 63 52 60 53 67 54 63 52 62 51 73 54
Aug 2012 -- -- -- -- -- -- -- -- -- -- -- --
Sep 2012 -- -- -- -- -- -- -- -- -- -- -- --
Oct 2012 -- -- -- -- -- -- -- -- -- -- -- --
Nov 2012 -- -- -- -- -- -- -- -- -- -- -- --
Dec 2012 -- -- -- -- -- -- -- -- -- -- -- --
Jan 2013 -- -- -- -- -- -- -- -- -- -- -- --
Feb 2013 -- -- -- -- -- -- -- -- -- -- -- --
Mar 2013 -- -- -- -- -- -- -- -- -- -- -- --
Apr 2013 -- -- -- -- -- -- -- -- -- -- -- --
May 2013 -- -- -- -- -- -- -- -- -- -- -- --
Average 66 53 60 52 69 52 66 52 65 53 72 58
Result Status OK OK OK OK OK OK
Project Effect None None None None None None
From June 2013 sampling commenced in line with the Sampling Program in the EMP at construction sites with the effects of train movements recorded at the required sites.
Br#34 Km 2+458: OLD BRAHAMAPUTRA RIVER – 195 m bridge ( 5 x 19.53m, 3 x 32.4m)
Time Day Night
GOB Noise Stndrd (2006).
70 dBA (Commercial) 60 dBA (Commercial)
No Train Passing Train Passing No Train Passing Train Passing
Value of Sample
Time Min Max Avg Time Min Max Avg Time Min Max Avg Time Min Max Avg
Jun 2013
A 51 72.2
B 52
Sep 2013
A 0805 45.2 74.7 59.3 0750 55 70.7 62.3 1824 46.6 72.8 57.1 1811 50.4 73.3 67.2
B 0811 48.5 74.2 59.3 0903 52.6 80.5 68.9 1835 49.3 73.8 60.5 1829 49.4 74.5 64.9
Nov 2013
A 0948 59.4 83.1 75.7 2035 59.4 62.6 61.2
B 1057 59.6 79.0 67.7 2000 58.9 74.7 66.1
Apr 2014
A 0941 61.8 80.6 68.1 2014 56.7 59.1 57.7
B 1049 56.5 78.7 63.8 2049 52.3 75.4 60.2
Sep 2014
A 0705 45.8 64.7 57.1 1845 47.3 64.2 54.2
B 0810 47.2 63.7 52.0 1918 46.4 60.1 51.4
Mar 2015
A 0947 44.5 59.6 51.6 1843 44 65.5 53.3
B 1054 45.3 65.2 54.0 1920 43.2 56 49.5
Oct 2015
A 0946 47 71 56.4 1925 42 64 49.0
B 1055 46 61 51.8 2002 43 58 45.8
Result Status
OK Max above/Avg OK
Project Effect
Minimal Minimal Minimal Minimal

Appendix 1 37
Br#79 Km 41+167: SITALAKHA RIVER – 360 m bridge ( 1 x 21.78, 1 x 14.62, 6 x 19.53, 4 x 32.4, 1 x 77 m)
Time Day Night
GOB Noise Stndrd (2006).
70 dBA (Commercial) 60 dBA (Commercial)
No Train Passing Train Passing No Train Passing Train Passing
Value of Sample
Time Min Max Avg Time Min Max Avg Time Min Max Avg Time Min Max Avg
Sep 2013
A 0808 49.2 64 53.8 0917 50.7 78.5 62.7 1834 56.7 60.5 58.2 1857 57.9 90.8 74.8
B 0814 44.7 82 61.6 0826 53.3 94 77.5 1815 50.5 73 58.7 1819 54.3 73.1 67.2
Nov 2013
A 0704 51.5 64.2 59.5 2000 50.1 68.0 57.9
B 0810 48.0 74.3 63.1 2037 50.7 71.5 60.4
Apr 2014
A 0710 48.1 92.9 71.2 1901 47.8 84.7 67.0
B 0816 43.4 90.1 58.8 1935 46.7 57.0 51.9
Sep 2014
A 0913 45.8 84.2 68.6 1840 44.4 74.2 62.2
B 1020 52.3 66.8 61.9 1915 48.0 63.2 52.8
Mar 2015
A 0715 46.9 104 86.1 1835 44.3 91.9 76.7
B 0820 47 86.9 68.6 1916 44.7 82.2 64.8
Oct 2015
A 0701 48.7 78.6 67.3 1845 44.9 68.3 59.6
B 0807 47.2 71.8 64.5 1925 43.8 65.4 56.6
Result Status
A Above Limit/ B Above Max Above Limit/ Av OK
Project Effect
Minimal Minimal Minimal Minimal
Crushing Plant
Bhairab Bazar-Stopped operation in August 2015-BR leased to coal storage yard
Time Day Night
GOB Noise Stndrd (2006).
70 dBA (Commercial) 60 dBA (Commercial)
No Train Passing Train Passing No Train Passing Train Passing
Value of Sample
Time Min Max Avg Time Min Max Avg Time Min Max Avg Time Min Max Avg
Sep 2013
A 1031 43.2 71 57.3 1027 46.5 74.6 63.1 1845 45 64 52.8 1842 58.3 75.2 65.9
B 1037 42.6 75.3 61.8 1114 41.2 75 58.9 1908 45.3 69.1 58.7 1935 46.1 73.7 62.6
Nov 2013
A 0925 66.7 77.8 73.1 2000 69.7 75.7 73.1
B 1040 45.8 58.6 50.7 2033 45.3 61.1 52.2
Apr 2014 A 0811 51.9 83.7 67.9 1845 53.2 79.7 74.2
B 0704 47.7 60.5 49.9 1918 63.5 87.0 83.2
Sep 2014
A 0945 43.8 63.0 53.0 2050 43.0 56.9 47.1
B 1055 43.5 60.1 48.7 2123 42.9 53.3 46.2
Mar 2015
A 0700 44 65.5 53.3 2012 42 56.4 46.9
B 0806 43.9 60.6 51.5 2049 41.8 54.8 44.6
Oct 2015 A 0704 47.1 65.2 58.8 1815 42 51 46.7
B 0811 46.9 67.3 59.4 1848 44 53 48.4
Result Status
OK OK
Project Effect
Minimal Minimal Minimal Minimal
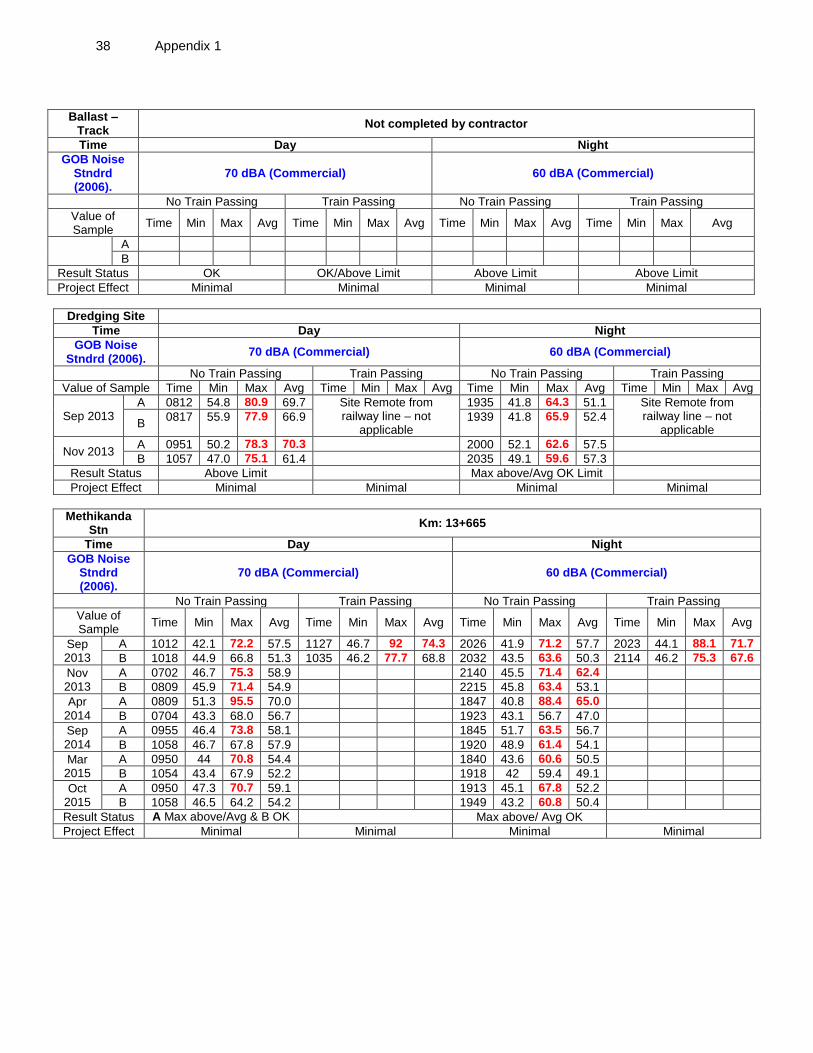
38 Appendix 1
Ballast – Track
Not completed by contractor
Time Day Night
GOB Noise Stndrd (2006).
70 dBA (Commercial) 60 dBA (Commercial)
No Train Passing Train Passing No Train Passing Train Passing
Value of Sample
Time Min Max Avg Time Min Max Avg Time Min Max Avg Time Min Max Avg
A
B
Result Status OK OK/Above Limit Above Limit Above Limit
Project Effect Minimal Minimal Minimal Minimal
Dredging Site
Time Day Night
GOB Noise Stndrd (2006).
70 dBA (Commercial) 60 dBA (Commercial)
No Train Passing Train Passing No Train Passing Train Passing
Value of Sample Time Min Max Avg Time Min Max Avg Time Min Max Avg Time Min Max Avg
Sep 2013 A 0812 54.8 80.9 69.7 Site Remote from
railway line – not applicable
1935 41.8 64.3 51.1 Site Remote from railway line – not
applicable B
0817 55.9 77.9 66.9 1939 41.8 65.9 52.4
Nov 2013 A 0951 50.2 78.3 70.3 2000 52.1 62.6 57.5
B 1057 47.0 75.1 61.4 2035 49.1 59.6 57.3
Result Status Above Limit Max above/Avg OK Limit
Project Effect Minimal Minimal Minimal Minimal
Methikanda Stn
Km: 13+665
Time Day Night
GOB Noise Stndrd (2006).
70 dBA (Commercial) 60 dBA (Commercial)
No Train Passing Train Passing No Train Passing Train Passing
Value of Sample
Time Min Max Avg Time Min Max Avg Time Min Max Avg Time Min Max Avg
Sep 2013
A 1012 42.1 72.2 57.5 1127 46.7 92 74.3 2026 41.9 71.2 57.7 2023 44.1 88.1 71.7
B 1018 44.9 66.8 51.3 1035 46.2 77.7 68.8 2032 43.5 63.6 50.3 2114 46.2 75.3 67.6
Nov 2013
A 0702 46.7 75.3 58.9 2140 45.5 71.4 62.4
B 0809 45.9 71.4 54.9 2215 45.8 63.4 53.1
Apr 2014
A 0809 51.3 95.5 70.0 1847 40.8 88.4 65.0
B 0704 43.3 68.0 56.7 1923 43.1 56.7 47.0
Sep 2014
A 0955 46.4 73.8 58.1 1845 51.7 63.5 56.7
B 1058 46.7 67.8 57.9 1920 48.9 61.4 54.1
Mar 2015
A 0950 44 70.8 54.4 1840 43.6 60.6 50.5
B 1054 43.4 67.9 52.2 1918 42 59.4 49.1
Oct 2015
A 0950 47.3 70.7 59.1 1913 45.1 67.8 52.2
B 1058 46.5 64.2 54.2 1949 43.2 60.8 50.4
Result Status A Max above/Avg & B OK Max above/ Avg OK
Project Effect Minimal Minimal Minimal Minimal
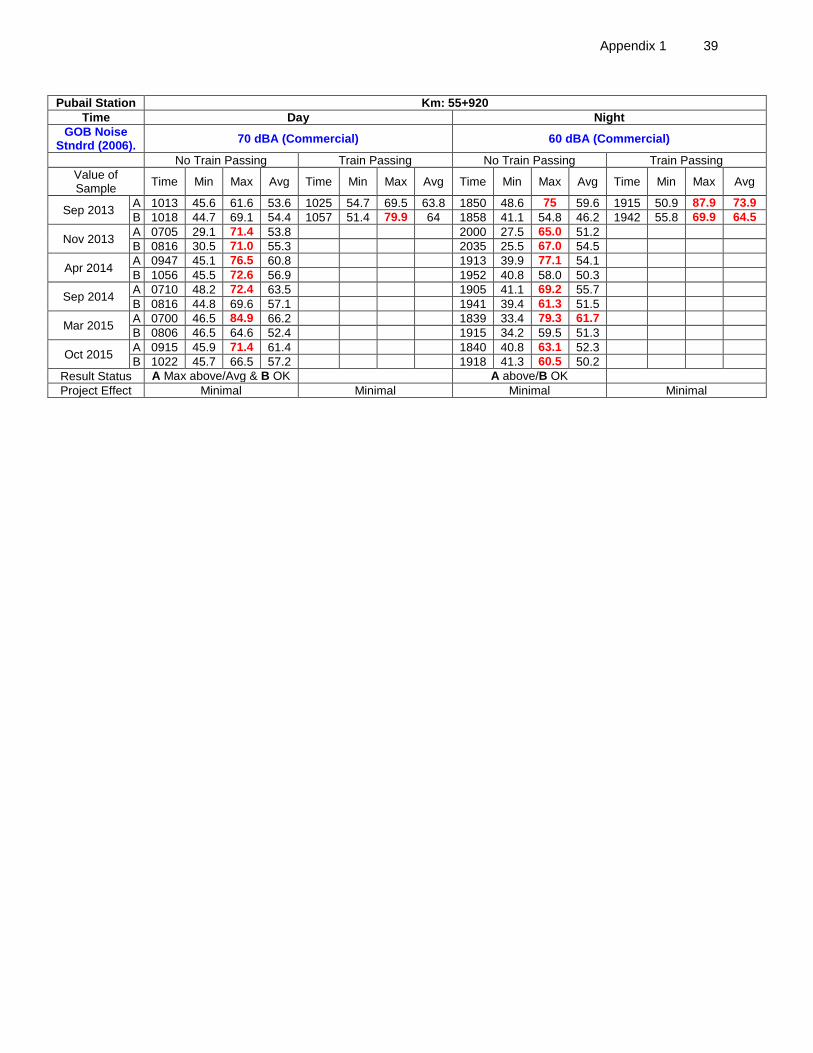
Appendix 1 39
Pubail Station Km: 55+920
Time Day Night
GOB Noise Stndrd (2006).
70 dBA (Commercial) 60 dBA (Commercial)
No Train Passing Train Passing No Train Passing Train Passing
Value of Sample
Time Min Max Avg Time Min Max Avg Time Min Max Avg Time Min Max Avg
Sep 2013 A 1013 45.6 61.6 53.6 1025 54.7 69.5 63.8 1850 48.6 75 59.6 1915 50.9 87.9 73.9
B 1018 44.7 69.1 54.4 1057 51.4 79.9 64 1858 41.1 54.8 46.2 1942 55.8 69.9 64.5
Nov 2013 A 0705 29.1 71.4 53.8 2000 27.5 65.0 51.2
B 0816 30.5 71.0 55.3 2035 25.5 67.0 54.5
Apr 2014 A 0947 45.1 76.5 60.8 1913 39.9 77.1 54.1
B 1056 45.5 72.6 56.9 1952 40.8 58.0 50.3
Sep 2014 A 0710 48.2 72.4 63.5 1905 41.1 69.2 55.7
B 0816 44.8 69.6 57.1 1941 39.4 61.3 51.5
Mar 2015 A 0700 46.5 84.9 66.2 1839 33.4 79.3 61.7
B 0806 46.5 64.6 52.4 1915 34.2 59.5 51.3
Oct 2015 A 0915 45.9 71.4 61.4 1840 40.8 63.1 52.3
B 1022 45.7 66.5 57.2 1918 41.3 60.5 50.2
Result Status A Max above/Avg & B OK A above/B OK
Project Effect Minimal Minimal Minimal Minimal
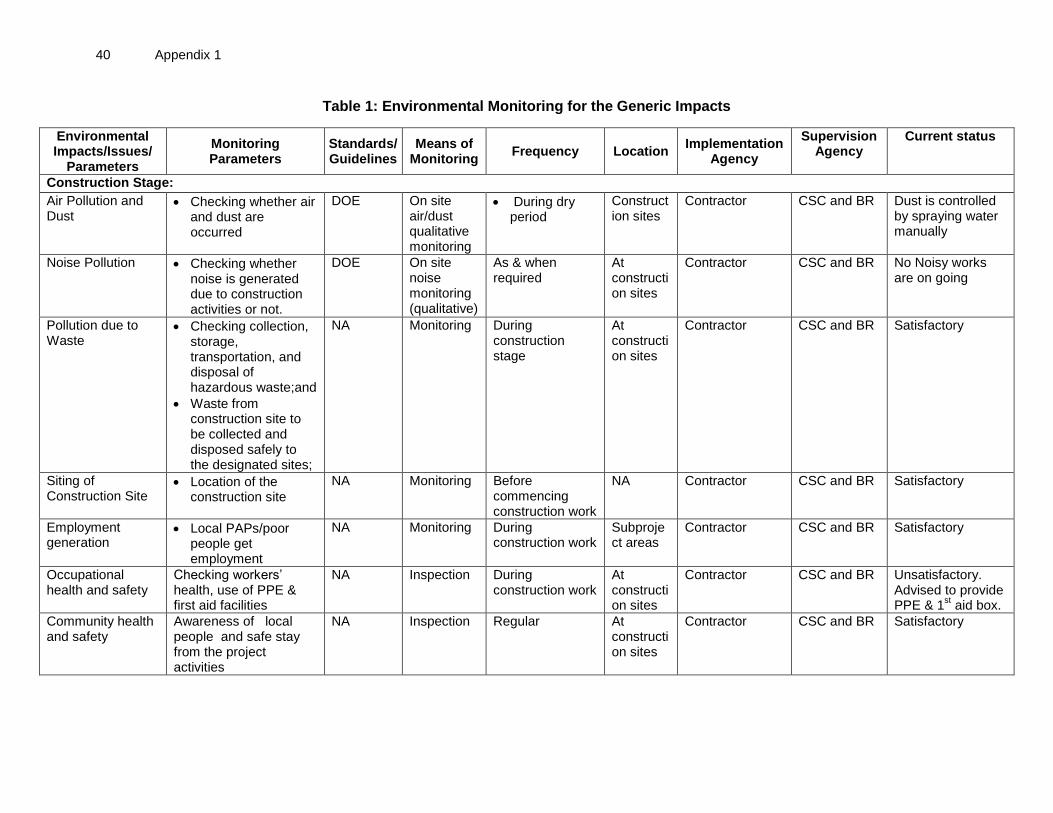
40 Appendix 1
Table 1: Environmental Monitoring for the Generic Impacts
Environmental Impacts/Issues/
Parameters
Monitoring Parameters
Standards/ Guidelines
Means of Monitoring
Frequency Location Implementation
Agency
Supervision Agency
Current status
Construction Stage:
Air Pollution and Dust
Checking whether air and dust are occurred
DOE On site air/dust qualitative monitoring
During dry period
Construction sites
Contractor CSC and BR Dust is controlled by spraying water manually
Noise Pollution Checking whether noise is generated due to construction activities or not.
DOE On site noise monitoring (qualitative)
As & when required
At construction sites
Contractor CSC and BR No Noisy works are on going
Pollution due to Waste
Checking collection, storage, transportation, and disposal of hazardous waste;and
Waste from construction site to be collected and disposed safely to the designated sites;
NA Monitoring During construction stage
At construction sites
Contractor CSC and BR Satisfactory
Siting of Construction Site
Location of the construction site
NA Monitoring Before commencing construction work
NA Contractor CSC and BR Satisfactory
Employment generation
Local PAPs/poor people get employment
NA Monitoring During construction work
Subproject areas
Contractor CSC and BR Satisfactory
Occupational health and safety
Checking workers’ health, use of PPE & first aid facilities
NA Inspection During construction work
At construction sites
Contractor CSC and BR Unsatisfactory. Advised to provide PPE & 1
st aid box.
Community health and safety
Awareness of local people and safe stay from the project activities
NA Inspection Regular At construction sites
Contractor CSC and BR Satisfactory
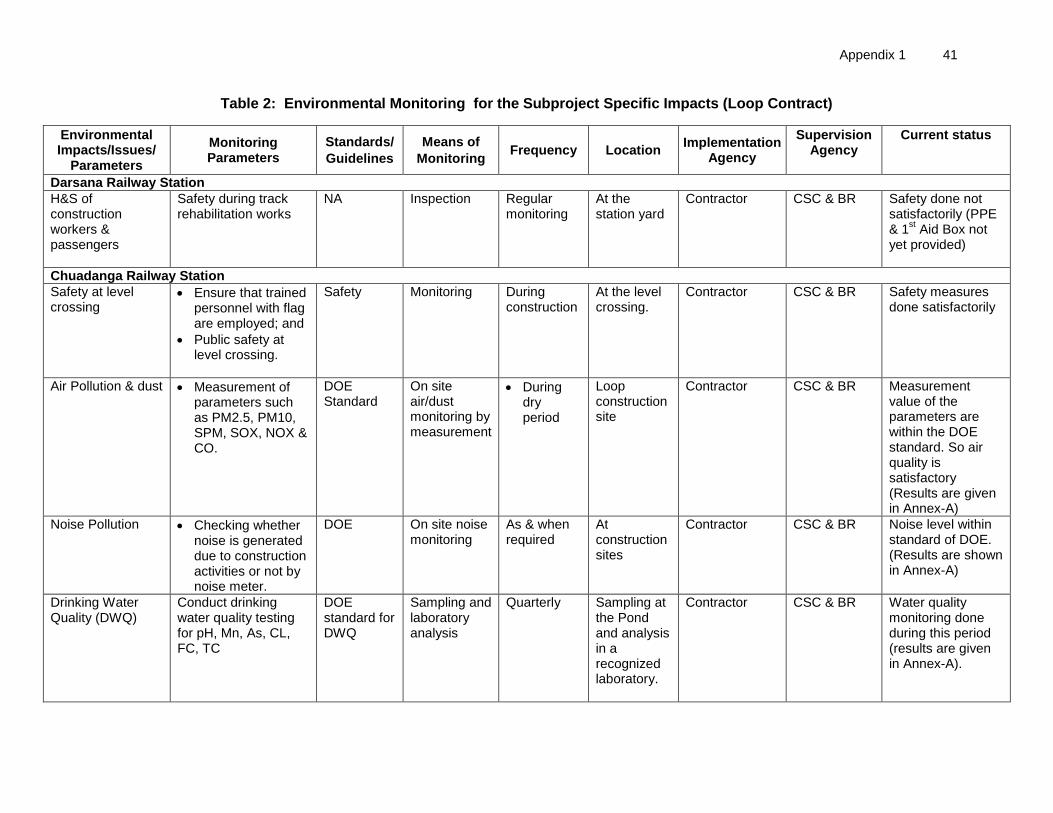
Appendix 1 41
Table 2: Environmental Monitoring for the Subproject Specific Impacts (Loop Contract)
Environmental Impacts/Issues/
Parameters
Monitoring Parameters
Standards/
Guidelines
Means of
Monitoring Frequency Location
Implementation Agency
Supervision Agency
Current status
Darsana Railway Station
H&S of construction workers & passengers
Safety during track rehabilitation works
NA Inspection Regular monitoring
At the station yard
Contractor CSC & BR Safety done not satisfactorily (PPE & 1
st Aid Box not
yet provided)
Chuadanga Railway Station
Safety at level crossing
Ensure that trained personnel with flag are employed; and
Public safety at level crossing.
Safety Monitoring During construction
At the level crossing.
Contractor CSC & BR Safety measures done satisfactorily
Air Pollution & dust Measurement of parameters such as PM2.5, PM10, SPM, SOX, NOX & CO.
DOE Standard
On site air/dust monitoring by measurement
During dry period
Loop construction site
Contractor CSC & BR Measurement value of the parameters are within the DOE standard. So air quality is satisfactory (Results are given in Annex-A)
Noise Pollution Checking whether noise is generated due to construction activities or not by noise meter.
DOE On site noise monitoring
As & when required
At construction sites
Contractor CSC & BR Noise level within standard of DOE. (Results are shown in Annex-A)
Drinking Water Quality (DWQ)
Conduct drinking water quality testing for pH, Mn, As, CL, FC, TC
DOE standard for DWQ
Sampling and laboratory analysis
Quarterly Sampling at the Pond and analysis in a recognized laboratory.
Contractor CSC & BR Water quality monitoring done during this period (results are given in Annex-A).
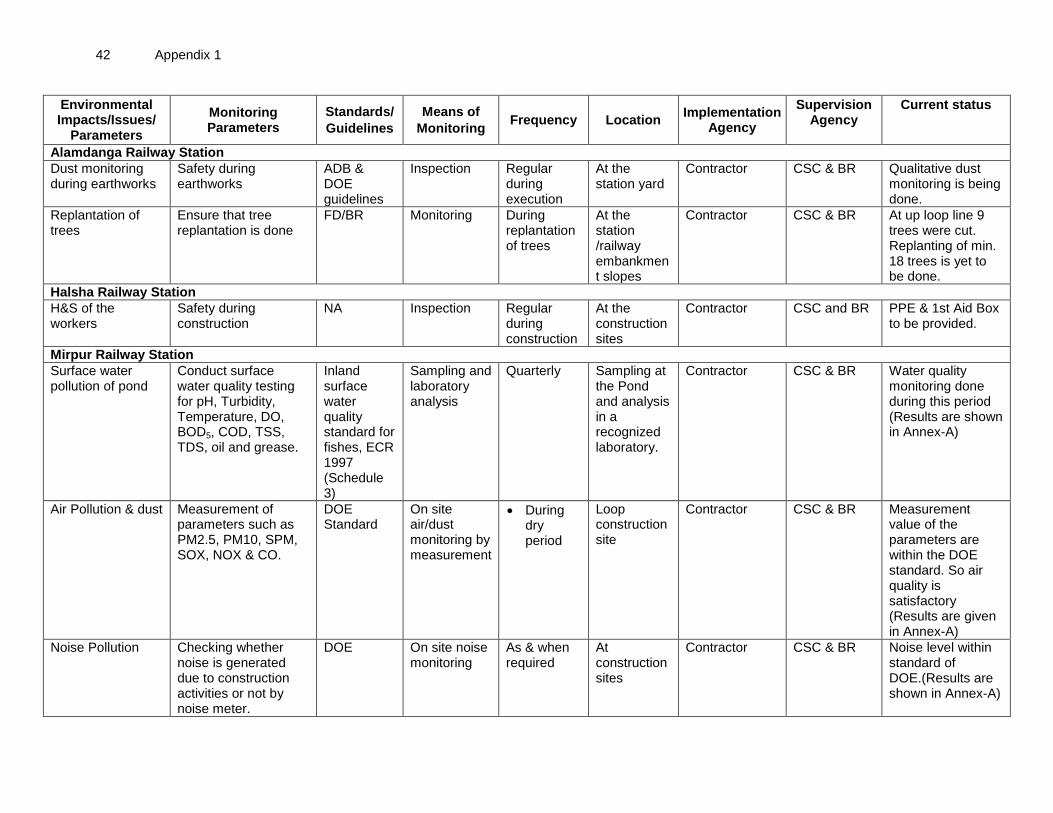
42 Appendix 1
Environmental Impacts/Issues/
Parameters
Monitoring Parameters
Standards/
Guidelines
Means of
Monitoring Frequency Location
Implementation Agency
Supervision Agency
Current status
Alamdanga Railway Station
Dust monitoring during earthworks
Safety during earthworks
ADB & DOE guidelines
Inspection Regular during execution
At the station yard
Contractor CSC & BR Qualitative dust monitoring is being done.
Replantation of trees
Ensure that tree replantation is done
FD/BR Monitoring During replantation of trees
At the station /railway embankment slopes
Contractor CSC & BR At up loop line 9 trees were cut. Replanting of min. 18 trees is yet to be done.
Halsha Railway Station
H&S of the workers
Safety during construction
NA Inspection Regular during construction
At the construction sites
Contractor CSC and BR PPE & 1st Aid Box to be provided.
Mirpur Railway Station
Surface water pollution of pond
Conduct surface water quality testing for pH, Turbidity, Temperature, DO, BOD5, COD, TSS, TDS, oil and grease.
Inland surface water quality standard for fishes, ECR 1997 (Schedule 3)
Sampling and laboratory analysis
Quarterly Sampling at the Pond and analysis in a recognized laboratory.
Contractor CSC & BR Water quality monitoring done during this period (Results are shown in Annex-A)
Air Pollution & dust Measurement of parameters such as PM2.5, PM10, SPM, SOX, NOX & CO.
DOE Standard
On site air/dust monitoring by measurement
During dry period
Loop construction site
Contractor CSC & BR Measurement value of the parameters are within the DOE standard. So air quality is satisfactory (Results are given in Annex-A)
Noise Pollution Checking whether noise is generated due to construction activities or not by noise meter.
DOE On site noise monitoring
As & when required
At construction sites
Contractor CSC & BR Noise level within standard of DOE.(Results are shown in Annex-A)
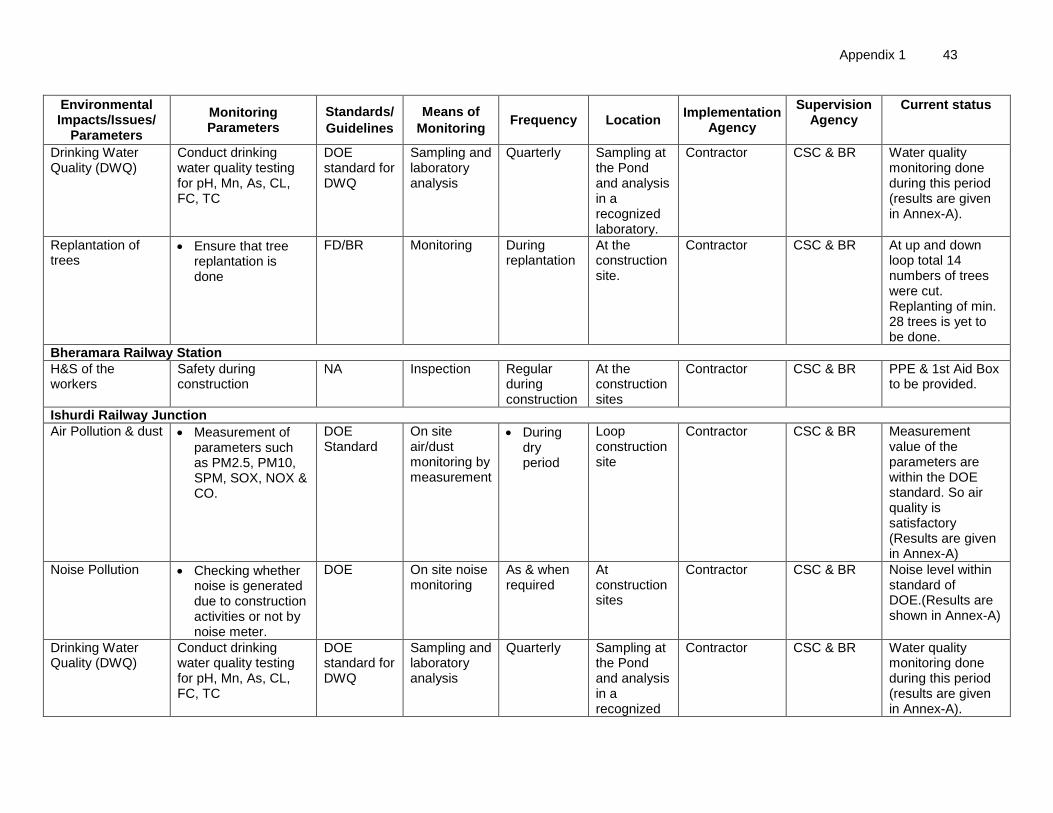
Appendix 1 43
Environmental Impacts/Issues/
Parameters
Monitoring Parameters
Standards/
Guidelines
Means of
Monitoring Frequency Location
Implementation Agency
Supervision Agency
Current status
Drinking Water Quality (DWQ)
Conduct drinking water quality testing for pH, Mn, As, CL, FC, TC
DOE standard for DWQ
Sampling and laboratory analysis
Quarterly Sampling at the Pond and analysis in a recognized laboratory.
Contractor CSC & BR Water quality monitoring done during this period (results are given in Annex-A).
Replantation of trees
Ensure that tree replantation is done
FD/BR
Monitoring During replantation
At the construction site.
Contractor CSC & BR At up and down loop total 14 numbers of trees were cut. Replanting of min. 28 trees is yet to be done.
Bheramara Railway Station
H&S of the workers
Safety during construction
NA Inspection Regular during construction
At the construction sites
Contractor CSC & BR PPE & 1st Aid Box to be provided.
Ishurdi Railway Junction
Air Pollution & dust Measurement of parameters such as PM2.5, PM10, SPM, SOX, NOX & CO.
DOE Standard
On site air/dust monitoring by measurement
During dry period
Loop construction site
Contractor CSC & BR Measurement value of the parameters are within the DOE standard. So air quality is satisfactory (Results are given in Annex-A)
Noise Pollution Checking whether noise is generated due to construction activities or not by noise meter.
DOE On site noise monitoring
As & when required
At construction sites
Contractor CSC & BR Noise level within standard of DOE.(Results are shown in Annex-A)
Drinking Water Quality (DWQ)
Conduct drinking water quality testing for pH, Mn, As, CL, FC, TC
DOE standard for DWQ
Sampling and laboratory analysis
Quarterly Sampling at the Pond and analysis in a recognized
Contractor CSC & BR Water quality monitoring done during this period (results are given in Annex-A).
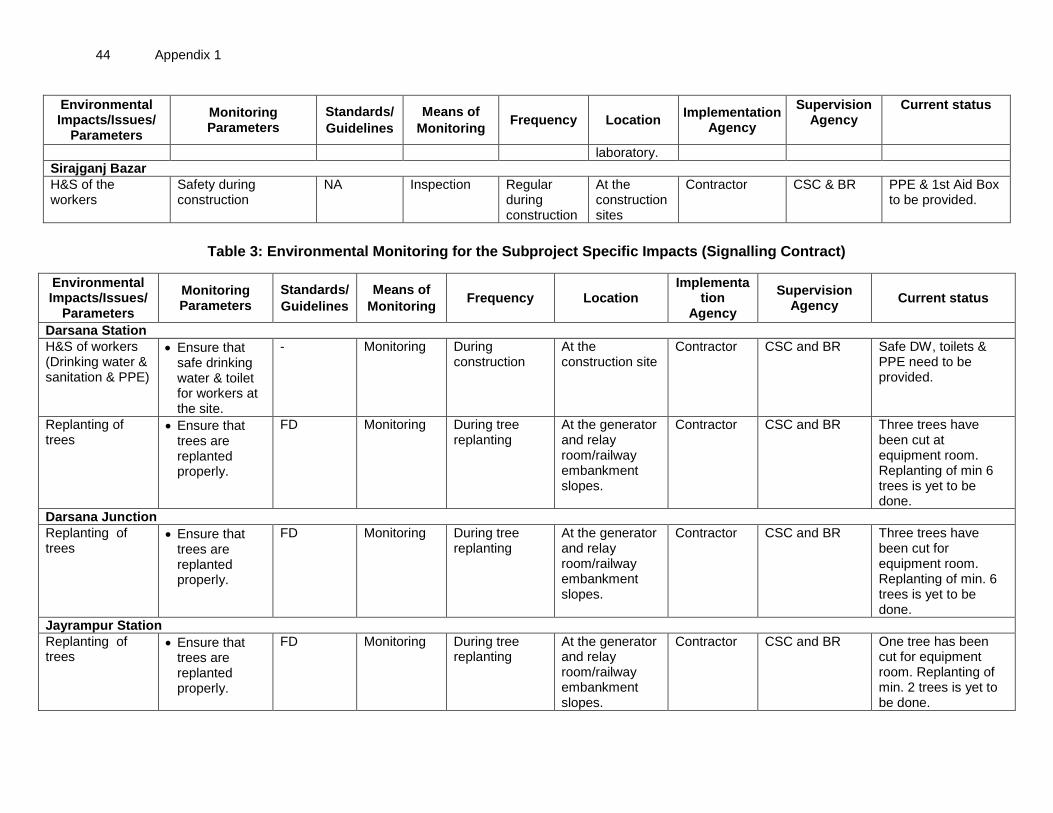
44 Appendix 1
Environmental Impacts/Issues/
Parameters
Monitoring Parameters
Standards/
Guidelines
Means of
Monitoring Frequency Location
Implementation Agency
Supervision Agency
Current status
laboratory.
Sirajganj Bazar
H&S of the workers
Safety during construction
NA Inspection Regular during construction
At the construction sites
Contractor CSC & BR PPE & 1st Aid Box to be provided.
Table 3: Environmental Monitoring for the Subproject Specific Impacts (Signalling Contract)
Environmental Impacts/Issues/
Parameters
Monitoring Parameters
Standards/
Guidelines
Means of
Monitoring Frequency Location
Implementation
Agency
Supervision Agency
Current status
Darsana Station
H&S of workers (Drinking water & sanitation & PPE)
Ensure that safe drinking water & toilet for workers at the site.
- Monitoring During construction
At the construction site
Contractor CSC and BR Safe DW, toilets & PPE need to be provided.
Replanting of trees
Ensure that trees are replanted properly.
FD Monitoring During tree replanting
At the generator and relay room/railway embankment slopes.
Contractor CSC and BR Three trees have been cut at equipment room. Replanting of min 6 trees is yet to be done.
Darsana Junction
Replanting of trees
Ensure that trees are replanted properly.
FD Monitoring During tree replanting
At the generator and relay room/railway embankment slopes.
Contractor CSC and BR Three trees have been cut for equipment room. Replanting of min. 6 trees is yet to be done.
Jayrampur Station
Replanting of trees
Ensure that trees are replanted properly.
FD Monitoring During tree replanting
At the generator and relay room/railway embankment slopes.
Contractor CSC and BR One tree has been cut for equipment room. Replanting of min. 2 trees is yet to be done.
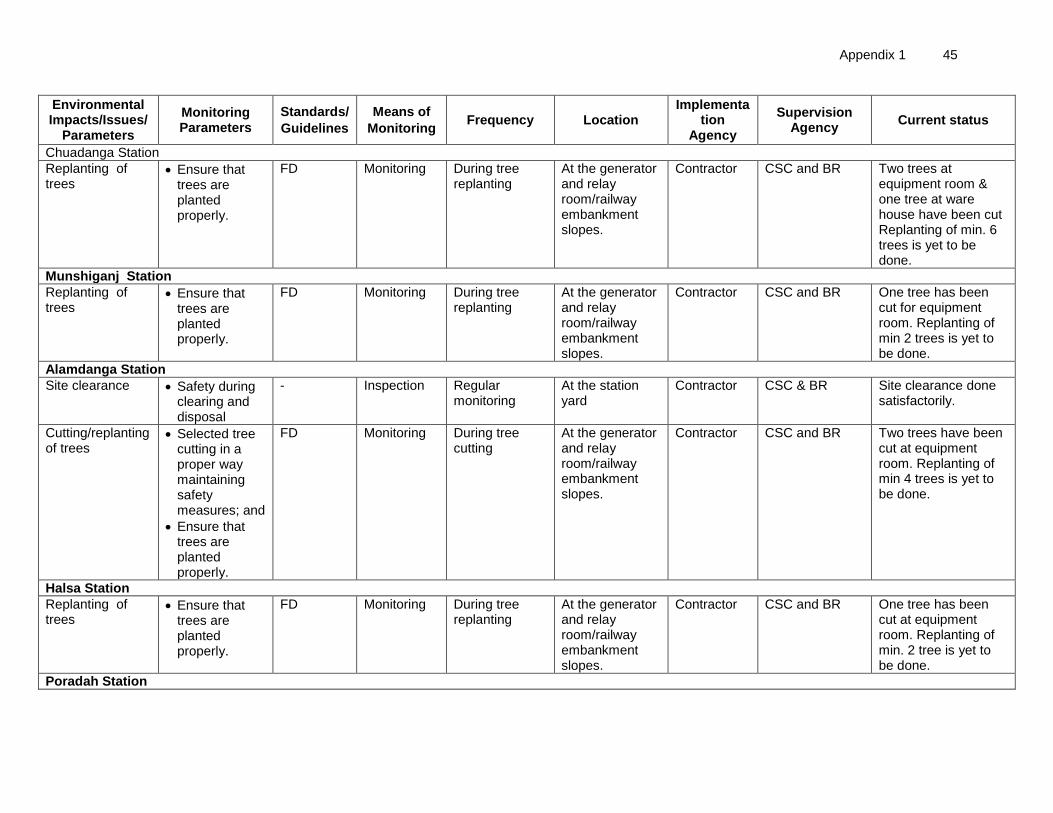
Appendix 1 45
Environmental Impacts/Issues/
Parameters
Monitoring Parameters
Standards/
Guidelines
Means of
Monitoring Frequency Location
Implementation
Agency
Supervision Agency
Current status
Chuadanga Station
Replanting of trees
Ensure that trees are planted properly.
FD Monitoring During tree replanting
At the generator and relay room/railway embankment slopes.
Contractor CSC and BR Two trees at equipment room & one tree at ware house have been cut Replanting of min. 6 trees is yet to be done.
Munshiganj Station
Replanting of trees
Ensure that trees are planted properly.
FD Monitoring During tree replanting
At the generator and relay room/railway embankment slopes.
Contractor CSC and BR One tree has been cut for equipment room. Replanting of min 2 trees is yet to be done.
Alamdanga Station
Site clearance Safety during clearing and disposal
- Inspection Regular monitoring
At the station yard
Contractor CSC & BR Site clearance done satisfactorily.
Cutting/replanting of trees
Selected tree cutting in a proper way maintaining safety measures; and
Ensure that trees are planted properly.
FD Monitoring During tree cutting
At the generator and relay room/railway embankment slopes.
Contractor CSC and BR Two trees have been cut at equipment room. Replanting of min 4 trees is yet to be done.
Halsa Station
Replanting of trees
Ensure that trees are planted properly.
FD Monitoring During tree replanting
At the generator and relay room/railway embankment slopes.
Contractor CSC and BR One tree has been cut at equipment room. Replanting of min. 2 tree is yet to be done.
Poradah Station
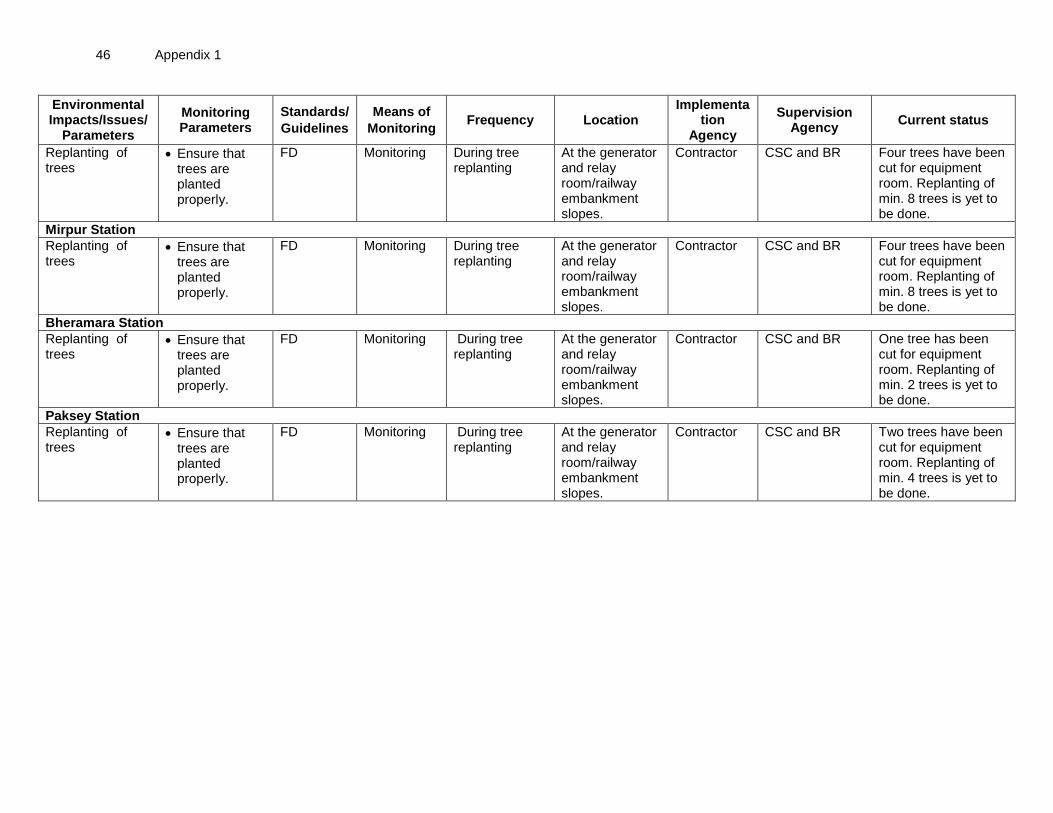
46 Appendix 1
Environmental Impacts/Issues/
Parameters
Monitoring Parameters
Standards/
Guidelines
Means of
Monitoring Frequency Location
Implementation
Agency
Supervision Agency
Current status
Replanting of trees
Ensure that trees are planted properly.
FD Monitoring During tree replanting
At the generator and relay room/railway embankment slopes.
Contractor CSC and BR Four trees have been cut for equipment room. Replanting of min. 8 trees is yet to be done.
Mirpur Station
Replanting of trees
Ensure that trees are planted properly.
FD Monitoring During tree replanting
At the generator and relay room/railway embankment slopes.
Contractor CSC and BR Four trees have been cut for equipment room. Replanting of min. 8 trees is yet to be done.
Bheramara Station
Replanting of trees
Ensure that trees are planted properly.
FD Monitoring During tree replanting
At the generator and relay room/railway embankment slopes.
Contractor CSC and BR One tree has been cut for equipment room. Replanting of min. 2 trees is yet to be done.
Paksey Station
Replanting of trees
Ensure that trees are planted properly.
FD Monitoring During tree replanting
At the generator and relay room/railway embankment slopes.
Contractor CSC and BR Two trees have been cut for equipment room. Replanting of min. 4 trees is yet to be done.