Embed Size (px)
Citation preview
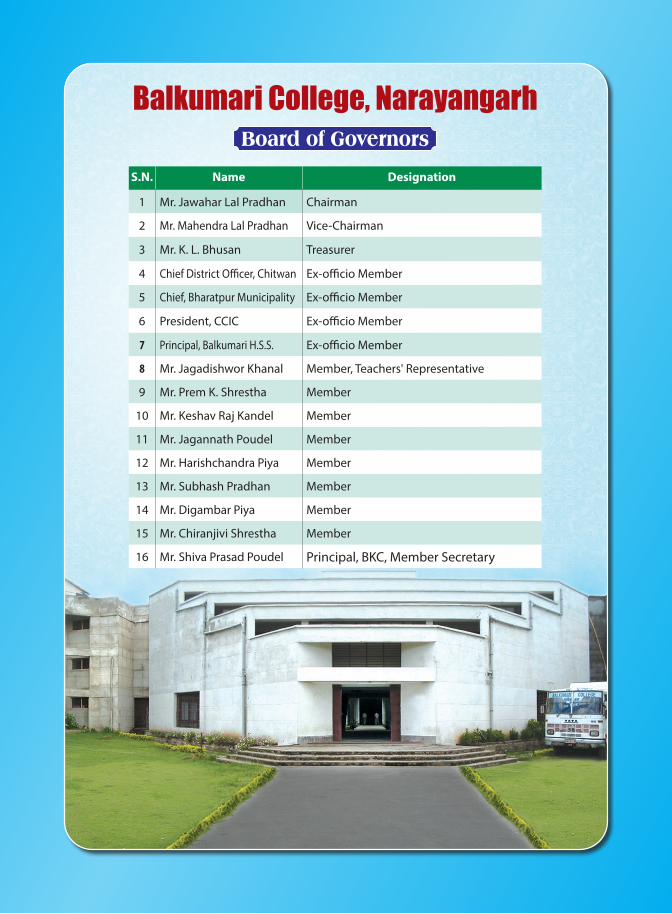
Balkumari College, NarayangarhBoard of Governors
S.N. Name Designation
1 Mr. Jawahar Lal Pradhan Chairman
2 Mr. Mahendra Lal Pradhan Vice-Chairman
3 Mr. K. L. Bhusan Treasurer
4 Chief District Officer, Chitwan Ex-officio Member
5 Chief, Bharatpur Municipality Ex-officio Member
6 President, CCIC Ex-officio Member
7 Principal, Balkumari H.S.S. Ex-officio Member
8 Mr. Jagadishwor Khanal Member, Teachers' Representative
9 Mr. Prem K. Shrestha Member
10 Mr. Keshav Raj Kandel Member
11 Mr. Jagannath Poudel Member
12 Mr. Harishchandra Piya Member
13 Mr. Subhash Pradhan Member
14 Mr. Digambar Piya Member
15 Mr. Chiranjivi Shrestha Member
16 Mr. Shiva Prasad Poudel Principal, BKC, Member Secretary
11Journal of Balkumari College
Journal of Balkumari College(Containing Research Papers and related articles)
Volume V30th Ashadh, 2073 (14th July, 2016)
Published by:
Public Information CellPublication Division
Balkumari College, Narayangarh Website: http://www.balkumaricollege.edu.np
Email: [email protected], [email protected]
Patron :Jawahar Lal Pradhan
Chairman, BOD
Advisors:Shiva Prasad Poudel, Principal
Chun Narayan Shrestha, Vice Principal
Chief Editor:Dr. Guna Raj Chhetri
Editors:Dr. Shyam Prasad SedaiDr. Bijay Lal PradhanGanga Prasad Sapkota
Bala Nath SigdelBishnu Kumar ShresthaAnup Muni Bajracharya
2 2 Journal of Balkumari College
Printed at:Quality Press, BharatpurPh: 056-526701
Published by:
Public Information CellPublication Division Balkumari College, Narayangarh Website: http://www.balkumaricollege.edu.npEmail: [email protected], [email protected]
Journal of Balkumari College(Containing Research Papers and related articles)Volume V30th Ashadh, 2073 (14th July, 2016)
33Journal of Balkumari College
E ver since its establishment in 1986, Balkumari College has been making efforts for further development in its performances in the delivery of
education. Determined to incorporate gradual progression in its actions, the college has evaluated itself and concluded that higher education, in real sense, needs to link teaching learning with research. Education remains incomplete and worthless without it. With this view in mind, Balkumari College has founded a section namely council for research and development (R& D), which not only encourages teachers & students in research but it also create an environment for researchers by supporting them both with research techniques and resources needed.
The present journal reveals the research activities of the college. The articles are research based and prepared in the framework of research methodology. Most are contributed by experienced researchers, however, a few are written
by new ones. Above all, they are all research based and exposed level of performances. We expect comments and feedback from professors and scholars.
Best regards,
The editors
The editors’ note
4 4 Journal of Balkumari College
Table of Contents
S.N. Topics Author Page No.1. Challenges Facing Physical Education Teachers
in Chitwan from Perspective of the Teachers Themselves
Dr. Shyam Prasad Sedai 5
2. Dividend policy and practices as perceived by shareholders in Nepal
Dr. Guna Raj Chhetri 16
3. Tole-wise cross sectional study of effect of EFLGP program of Nepal Government with reference to Bharatpur Sub Metropolitan City
Dr. Bijay Lal Pradhan 26
4. Students Satisfaction Survey of Balkumari College
Ganga Prasad Sapkota 35
5. Effectiveness of Training and Development towards Human Resource Practices on Performance and Job Satisfaction in Commercial Bank of Nepal
Bala Nath Sigdel 41
6. Extrinsic Motivation Audit in Balkumari College: A Study of Employees Satisfaction
Ramesh Khanal,Radhika Sigdel
53
7. Perspectives on Leadership: A study of leadership on its theory and practice
Ananta Dhungana 63
8. Enumeration and Threats of Invasive Alien Plant Species in Barndabar Community Forest
Dr. Manoj K.L. Das 70
9 Factors Influencing Investment Decisions in Capital Market: A Study of Individual Investors in Nepal
Kul Chandra Pandit 78
10. Customers Attitude on e-Security to Smart Cards at Narayangarh: Technology Satisfaction
Ramesh Khanal 94
11. Relationship of Market Price of Share with Dividends and Retained Earnings: A Case of Nepal
Dr. Guna Raj Chhetri 104
12. Prevalence of Parasitic and Bacterial Infections Among Children in Orphanage Home and School of Chitwan District
Anup Muni Bajracharya 111
13. Efficient Market Hypothesis: An Empirical Test of Nepalese Stock Market
Rashesh Vaidya 118
55Journal of Balkumari College
Abstract This study aims at identifying the challenges facing Physical Education Teachers (PETs) in Chitwan public schools. The researcher utilized the descriptive method; and the study sample consisted of 150 male and female PETs who worked in public schools in Chitwan district during the 2013/2014 academic year. The study sample was chosen by the intentional method. The researcher developed a special questionnaire about the challenges facing the PETs in Chitwan public schools. It consisted of five main domains (i.e., increased numbers of the students in the classroom; abilities, devices/instruments, and equipment; content of the academic curriculum; the school environment; and the school management). The validity of the instrument was verified by presenting it to arbitrators, whereas the reliability coefficient was calculated using Cronbach Alpha (0.89). The primary results showed a variance at the challenges level facing the PETs; as the most were related to the increased numbers of the students in the classroom. On the other hand, the least were those related to the school management. In addition, the results did not show statistically significant differences in the challenges degree facing the PETs according to the gender and years of experience variables. The researcher recommended providing the decision makers in the Nepalese Ministry of Education with an overview of the primary results to find the appropriate solutions for the challenges which the PETs faced.
Keywords: Challenges, Physical Education Teacher, Physical Education
1. Introduction Workers in the educational field, in general, and physical education teachers (PETs) in particular, face many problems, which vary by the differences of the factors causing them. These factors are related to stress, putting them in front of wide responsibilities and challenges which need to face (Faedi et al, 2010). The school is one of the most important educational institutions that achieves integrated growth to the individuals from all physical, psychological, mental, social and health aspects; because of the different and various cognitive and skillful programs provided by the school, so that the individual will be able to adapt to his surrounding environment to achieve the objectives of the family and the community (BalSevich, 2005). Additionally, the school is the first spring of all the scientific, physical, and cultural talents. It represents the first point from which the student starts to wider and larger prospects (Albert et al, 2006). It is an educational system that refines the individual’s mental and intellectual powers,
Challenges Facing Physical Education Teachers in Chitwan from Perspective of the Teachers Themselves
Dr. Shyam Prasad SedaiLecturer (M.Ed., M.Phil., Ph.d.)
Department of Health and Physical Education, Balkumari College

6 6 Journal of Balkumari College
controls his/her emotional and psychological features, adjusts his/her childhood attitudes and trends, and orients his/her primary motivations with the acceptable principles and social values (Al-Shorman, 2009). The school is the first academy of the stars, which discovers the talents of the athletes since early ages. Through the school, every young person can practice his/her physical hobbies in healthy and sound atmospheres. Therefore, the sports activities become a fundamental component in forming the integrated personality of the individual, as well as in modifying the faulty behaviors to reach the highest levels, as it is the basic structure for the sports movement (Al-Sayeh, 2007).
Sports activities in the schools are considered as the spine in educating and cultivating the students through the various cultural and recreational activities. These sports activities encourage investing the leisure time, appreciating the responsibility, respecting self and others, and developing the ability to make the right decision. School sport is an educational and economical system that pumps cadres of the young people for the competitive sports and opening to the international markets (Oudat et al, 2009). Physical education is one of the important aspects of the educational and teaching processes, especially in the current era, in which high values are set for the physical activity, as it has many positive effects on the individual. The PET is one of the basic pillars of the educational process, which its level and status in the community depends, to a wide extent, on the role and level of the teacher’s performance and his/her achievement of the tasks and educational responsibilities that he had to accomplish (Husain et al, 1999). In many countries, teaching the physical education is facing several challenges (Hardman, 2009), such as decreasing in the teaching time, curriculum, shortage in equipment, negative view of the teachers as well as students and guardians about physical education (Nyakweba, 2005). PET is one of the prominent members at the school, who has influence on the development of the students’ personalities, and supporting their high values. The role of PET lies in matching the students’ trends and abilities with the school abilities to do the educational duties in sport framework. This could be achieved only by overcoming all the barriers and difficulties that prevent achievement of the aspired objectives he/she seeks to accomplish. PETs in Jordan face many challenges due to the challenges the school education itself is facing such as shortage of the resources and abilities, overcrowded classrooms, and shortage in the curricular, organizational and executive structure (Makhamreh, 2012). After the researcher reviewed the professional literature, the researcher noticed a shortage in the studies that addressed the challenges facing the PETs in the Chitwan public schools from perspective of the teachers themselves. As far the knowledge of the researcher goes, this is the first study of its kind in Nepal, which comes to fill a gap in the literature related to these challenges, and to spot lights on some variables that may affect the challenges facing the PETs, such as gender and years of experience.
1.1. Study Objectives The primary objectives of this study are to:
1) Identify the most challenges facing the physical education teachers in the Chitwan public schools.
77Journal of Balkumari College
2) Identify the differences in the challenges facing the physical education teachers in the Chitwan public schools attributed to gender variable.
3) Identify the differences in the challenges facing the physical education teachers in the Chitwan public schools attributed to years of experience variable.
1.2. Study Questions
The primary study questions are:
1) What are the most challenges facing the physical education teachers in Chitwan district public schools?
2) Are there statistically significant differences at the significance level α ≤ 0.05 in the challenges facing the physical education teachers in Chitwan district public schools attributed to the gender variable?
3) Are there statistically significant differences at the significance level α ≤ 0.05 in the challenges facing the physical education teachers in Chitwan district public schools attributed to the years of experience variable?
2. Methodology 2.1. Study Design The researcher used a descriptive design using survey methodology due to its relevance to the nature of this study.
2.2. Study Population and Sample The study population consisted of all male and female PETs in the public schools located in Chitwan district in of Nepal (N = 175) during the academic year 2013/2014. The study sample was chosen by the intentional manner, and the sample consisted of (150) participants (i.e., 86% of the total study population); 78 male and 72 female teachers.
2.3. Study VariablesThe dependent variable is the challenges facing the PETs in the Chitwan district public schools, whereas the independent variables are gender (male, female) and years of experience in teaching (less than 5 years, 6 - 10 years, 11 - 15 years, and more than 16 years).
2.4. Study Instrument A special questionnaire was developed to identify the challenges facing the PETs in the Chitwan district public schools. The questionnaire included (25) items distributed over the following five domains: increased numbers of the students in the classroom; abilities, devices/instruments, and equipment; content of the academic curriculum, the school environment and the school management). The questionnaire was administered after obtaining the participants’ consent in advance. The field-training students helped in the process of distributing and collecting the questionnaires. To determine the problem degree, the researcher used the Likert-type scale, which is one of the most famous types and most commonly used for developing the
8 8 Journal of Balkumari College
measurements and psychological tests. Several studies, which addressed the challenges facing the teachers were reviewed in order to determine the following percentages of the problem degree:
80% and more: Very high problems degree, 70% - 79.9%: High problems degree, 60% - 69.9%: Medium problems degree, 50% - 59.9%: Low problems degree, 49.9% and less: Very low problems degree
2.5. Psychometric Properties The validity of the instrument was verified through presenting it to a panel of specialists in physical education teaching field. They were asked to review and provide feedback on the instrument concerning any need for changes in wording or additional items. The researcher modified the survey according to the specialists’ comments. The reliability coefficient was calculated using Cronbach Alpha; the reliability coefficient value was (0.89).
2.6. Statistical Analyses Data analyses were performed by using statistical Package for Social Sciences (SPSS). Descriptive statistics (i.e., means, standard deviations, and percentages) was computed to answer the first question; t-test was used to answer the second question; and One-way ANOVA was utilized to answer the third question.
3. Results and Discussion 3.1. Results and Discussion Related to the First Question The results related to the first question “What are the most challenges facing the physical education teachers in the Chitwan district public schools?” are presented in Tables 1-6.
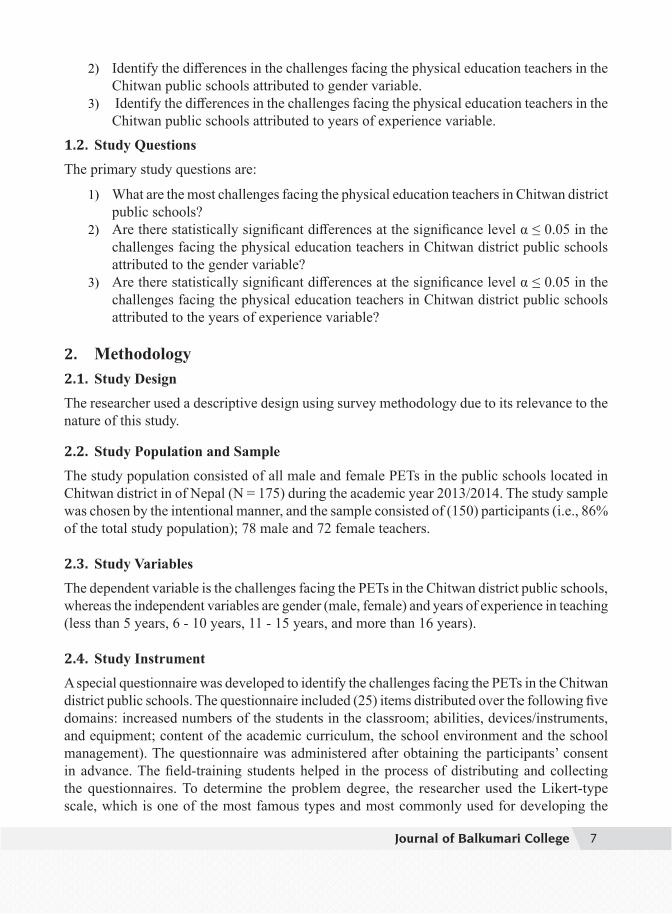
Table 1. Means, standard deviations, and percentages scores of the participants responses (n = 150) to the items of the first domain which is the challenges related to the increased numbers of the students in the classroom, arranged by the problem degree.
Items M* SD** % Problem Degree
I cannot teach the skills very well 4.83 1.62 96. 60 Very High The instruments are insufficient for the students 4.59 1.47 91.80 Very High Depriving some students from the participation 4.18 1.41 83.60 Very High Disorder prevails during the lesson 3.92 1.28 78.40 High It is difficult to divide and distribute the Students 3.50 1.23 70.00 High Overall mean 4.20 1.40 84.10 Very High
*Means; **Standard Deviations.
99Journal of Balkumari College
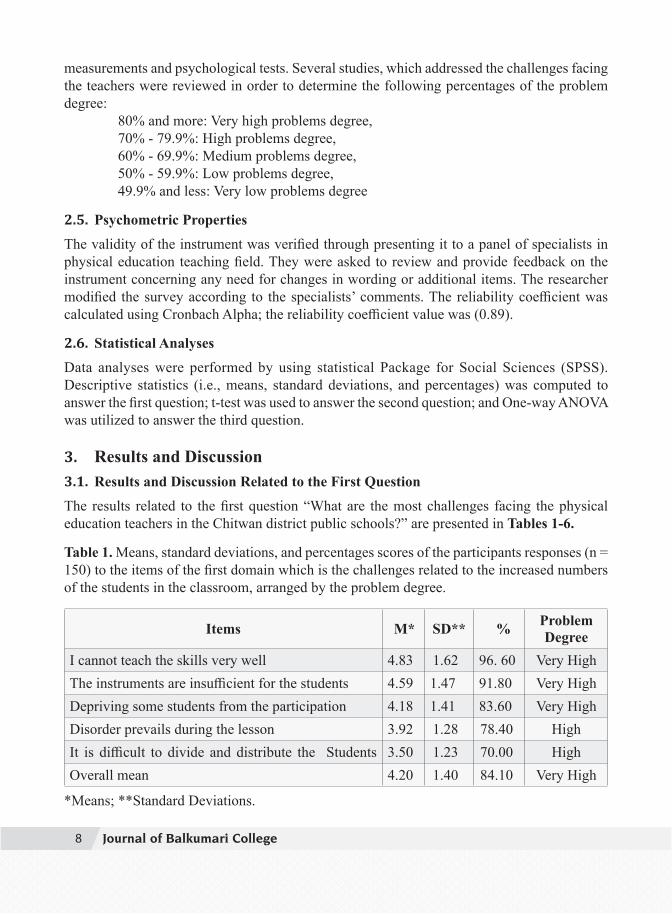
Table 2. Means, standard deviations, and percentages scores of the participants responses (n = 15 0) to the items of the second domain which is related to the challenges of the abilities, devices/instruments, and equipment; arranged by the problem degree.
Items M* SD** % Problem Degree
The instruments are not available for most of the sport games. 4.67 1.60 93.40 V.High
Places to store the instruments in a right manner are not available 4.58 1.51 91.60 V.High
The security and safety factors in the playgrounds are not available 4.32 1.48 86.40 V.High
The instruments and equipment in the schools are insufficient 3.78 1.19 75.60 High
Inability to maintain the instruments continuously. 3.32 1.12 66.40 Medium
Overall mean 4.13 1.38 82.70 V.High
*Means; **Standard Deviations.
Table 3. Means, standard deviations, and percentages scores of the participants responses (n = 150) to the items of the third domain which is the challenges related to the content of the academic curriculum, arranged by the problem degree.
Items M* SD** % Problem Degree
The curriculum doesn’t appropriate for the educational environment 4.72 1.57 94.40 V.High
The curriculum doesn’t keep up with the ongoing development 4.55 1.52 91.00 V.High
Curriculum objectives are unclear 3.83 1.35 76.60 High Professionals do not participate in preparing the content of the curriculum 3.52 1.08 70.40 High
The curriculum doesn’t take into account the students’ needs 2.98 1.50 59.60 Low
Overall mean 3.92 1.41 78.40 High
*Means; **Standard Deviations.
1010 Journal of Balkumari College
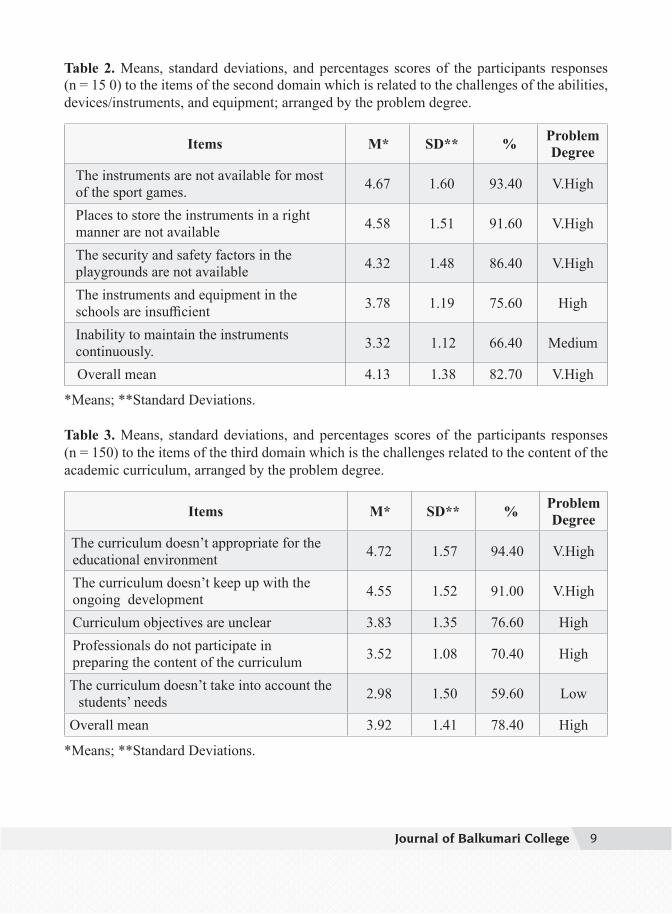
Table 4. Means, standard deviations, and percentages scores of the participants responses (n = 150) to the items of the fourth domain which is the challenges related to the school environment, arranged by the problem degree.
Items M* SD** % Problem Degree
Increasing numbers of the students in one classroom. 4.63 1.55 92.60 Very High
Practice time is short and unsuitable 4.50 1.28 90.00 Very High Playgrounds do not help playing in good manner 3.42 1.18 68.40 Medium
Very few incentives that encourage participation in sports 3.35 1.25 67.00 Medium
Students are unwilling to participate in the lesson. 2.85 1.38 57.00 Low
Overall mean 3.75 1.33 75.00 High
*Means; **Standard Deviations.
Table 5. Means, standard deviations, and percentages scores of the participants responses (n = 150) to the items of the fifth domain which is the challenges related to the school management, arranged by the problem degree.
Items M* SD** % Problem Degree
The school management looks negatively at the physical education
4.75 1.60 95.00 V. High
The school management infringes the physical education lesson
4.28 1.58 85.60 V. High
Lack of financial support from the school management for the activities and sport participation 3.83 1.48 76.60 High
Students are engaged in other things during the physical education lesson 3.12 1.45 62.40 Medium
The school management infringes on the special funds for the physical education 2.57 1.07 51.40 Low
Overall mean 3.71 1.44 74.20 High
*Means; **Standard Deviations.
1111Journal of Balkumari College
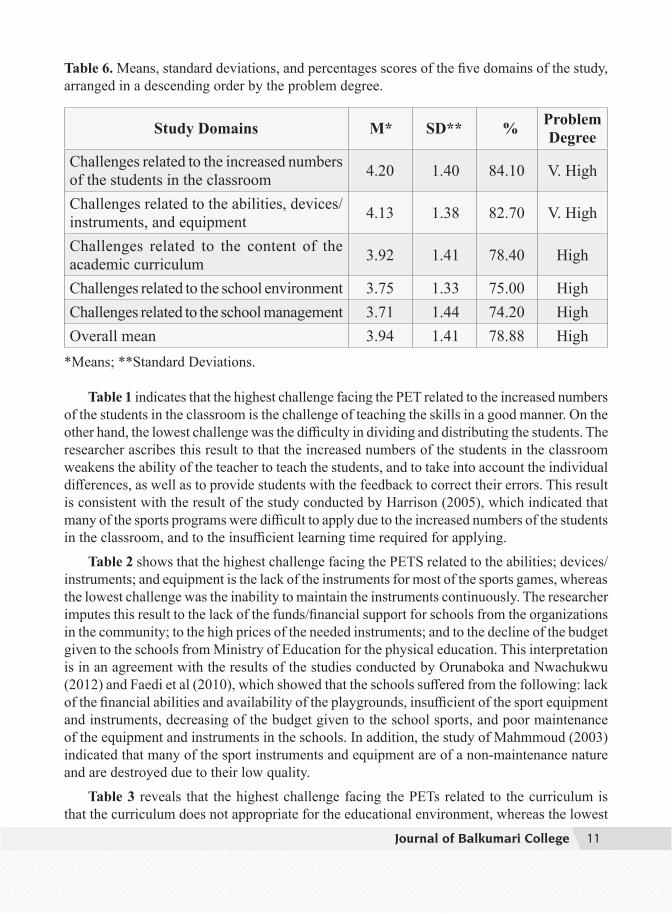
Table 6. Means, standard deviations, and percentages scores of the five domains of the study, arranged in a descending order by the problem degree.
Study Domains M* SD** % Problem Degree
Challenges related to the increased numbers of the students in the classroom 4.20 1.40 84.10 V. High
Challenges related to the abilities, devices/instruments, and equipment 4.13 1.38 82.70 V. High
Challenges related to the content of the academic curriculum 3.92 1.41 78.40 High
Challenges related to the school environment 3.75 1.33 75.00 High Challenges related to the school management 3.71 1.44 74.20 High Overall mean 3.94 1.41 78.88 High
*Means; **Standard Deviations.
Table 1 indicates that the highest challenge facing the PET related to the increased numbers of the students in the classroom is the challenge of teaching the skills in a good manner. On the other hand, the lowest challenge was the difficulty in dividing and distributing the students. The researcher ascribes this result to that the increased numbers of the students in the classroom weakens the ability of the teacher to teach the students, and to take into account the individual differences, as well as to provide students with the feedback to correct their errors. This result is consistent with the result of the study conducted by Harrison (2005), which indicated that many of the sports programs were difficult to apply due to the increased numbers of the students in the classroom, and to the insufficient learning time required for applying.
Table 2 shows that the highest challenge facing the PETS related to the abilities; devices/instruments; and equipment is the lack of the instruments for most of the sports games, whereas the lowest challenge was the inability to maintain the instruments continuously. The researcher imputes this result to the lack of the funds/financial support for schools from the organizations in the community; to the high prices of the needed instruments; and to the decline of the budget given to the schools from Ministry of Education for the physical education. This interpretation is in an agreement with the results of the studies conducted by Orunaboka and Nwachukwu (2012) and Faedi et al (2010), which showed that the schools suffered from the following: lack of the financial abilities and availability of the playgrounds, insufficient of the sport equipment and instruments, decreasing of the budget given to the school sports, and poor maintenance of the equipment and instruments in the schools. In addition, the study of Mahmmoud (2003) indicated that many of the sport instruments and equipment are of a non-maintenance nature and are destroyed due to their low quality.
Table 3 reveals that the highest challenge facing the PETs related to the curriculum is that the curriculum does not appropriate for the educational environment, whereas the lowest

1212 Journal of Balkumari College
challenge was that the curriculum does not take into account the students’ needs. The researcher ascribes this result to that the curriculum contains certain academic units that cannot be applied in some public schools due to the inexistence of a suitable educational environment to apply these units. This result is consistent with the study of Wanyama & Quay (2014), which indicated that implementing the curriculum content requires special playgrounds. In addition, some high schools had eliminated the lessons of the physical education from their lesson schedule, since this subject is uncountable in the general average of the marks obtained.
Table 4 shows that the highest challenge facing the PETs related to the school environment is the increasing numbers of the students in one classroom, whereas the lowest challenge was that the students unwilling to participate in the lesson. The researcher ascribes this result to the unavailability of the sufficient and suitable yards for the numbers of the students. Additionally, the increased numbers of the students in one classroom negatively affects the student’s participation in the physical education lesson, and makes the students feel that the practice time in the lesson is short. This result is consistent with the Wanyama’s study (2011), which showed that many sport programs were difficult to apply due to inappropriateness of the school environment.
Table 5 shows that the highest challenge facing the PETs related to the school administration is that the view of the administration to the physical education is a negative one, whereas the lowest challenge was the infringing of the school management on the special funds for the physical education. The researcher attributes this result to that some PETs do not commit themselves in applying the physical education curriculum based on the teacher’s guide which accredited by the Nepalese Ministry of Education, as well as the Media ignorance for the importance of the profession and its concentration only on the local and international championships. This result is consistent with a study conducted by Rainer et al (2012), which indicated that the school management has the main role in reducing the challenges facing the PETs at schools through providing the financial and moral support to the PETs.
Table 6 indicates that the responses of the study participants to the challenges were very high for both the first domain related to the increased numbers of the students in the classroom with (84.40%), and the second domain related to the abilities, devices/instruments, and equipment with (82.60%). In addition, the problem degree was high for the third domain related to the content of the academic curriculum; for the fourth related to the school environment; and for the fifth domain regarding the school management, with percentages of (74.20%, 75.00%, and 78.40%) respectively. The average mean of the participants responses on all the domains was (3.95) with a (78.92%), which indicates the high level of the challenges facing the PETs in the Chitwan public schools.
3.2. Results and Discussion Related to the Second Question
The results of the second question, “Are there statistically significant differences at the significance level α ≤ 0.05 in the challenges facing the physical education teachers in the Chitwan district public schools attributed to the gender variable?” are presented in Table 7.
1313Journal of Balkumari College
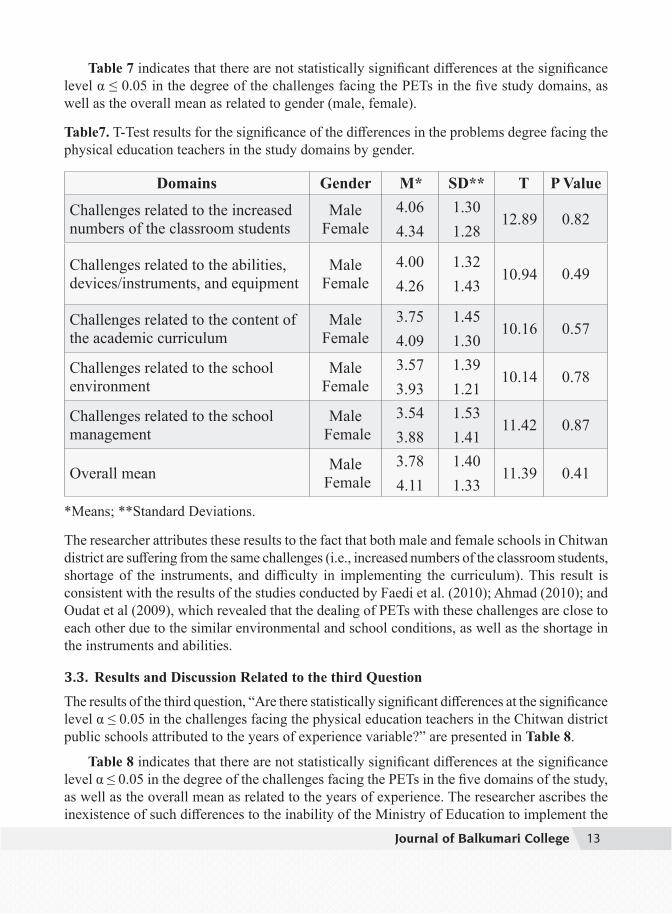
Table 7 indicates that there are not statistically significant differences at the significance level α ≤ 0.05 in the degree of the challenges facing the PETs in the five study domains, as well as the overall mean as related to gender (male, female).
Table7. T-Test results for the significance of the differences in the problems degree facing the physical education teachers in the study domains by gender.
Domains Gender M* SD** T P Value
Challenges related to the increased numbers of the classroom students
Male Female
4.06 4.34
1.30 1.28
12.89 0.82
Challenges related to the abilities, devices/instruments, and equipment
Male Female
4.00 4.26
1.32 1.43
10.94
0.49
Challenges related to the content of the academic curriculum
Male Female
3.75 4.09
1.45 1.30
10.16 0.57
Challenges related to the school environment
Male Female
3.57 3.93
1.39 1.21
10.14 0.78
Challenges related to the school management
Male Female
3.54 3.88
1.53 1.41
11.42 0.87
Overall mean Male Female
3.78 4.11
1.40 1.33
11.39 0.41
*Means; **Standard Deviations.
The researcher attributes these results to the fact that both male and female schools in Chitwan district are suffering from the same challenges (i.e., increased numbers of the classroom students, shortage of the instruments, and difficulty in implementing the curriculum). This result is consistent with the results of the studies conducted by Faedi et al. (2010); Ahmad (2010); and Oudat et al (2009), which revealed that the dealing of PETs with these challenges are close to each other due to the similar environmental and school conditions, as well as the shortage in the instruments and abilities.
3.3. Results and Discussion Related to the third Question
The results of the third question, “Are there statistically significant differences at the significance level α ≤ 0.05 in the challenges facing the physical education teachers in the Chitwan district public schools attributed to the years of experience variable?” are presented in Table 8.
Table 8 indicates that there are not statistically significant differences at the significance level α ≤ 0.05 in the degree of the challenges facing the PETs in the five domains of the study, as well as the overall mean as related to the years of experience. The researcher ascribes the inexistence of such differences to the inability of the Ministry of Education to implement the

1414 Journal of Balkumari College
solutions related to these challenges, which exist since several years ago. The reason of that may be related to the current crisis that the education in the Chitwan district public schools suffers from due to the situations surrounding the whole south Asian countries. These conditions have a negative effect on implementing the sport programs and activities, as the school sport became mere written programs and activities that are difficult to apply.
Table 8. One-way ANOVA results for the significance of the differences in the problems degree facing the physical education teachers in the study domains by years of experience.
Source of Variance
Sum of Squares
Degrees of Freedom
Mean Sum of Squares F P
Value Overall Degree of the Instrument
Between Groups Within Groups
0.73 27.74
3 181
0.24 0.15 1.58 0.194
Total 28.47 184 ----
4. Conclusion The results of this study show that there are differences in the challenges level facing the PETs. The largest challenge appeared in the first rank was the domain related to the increased numbers of the students in the classroom, especially in PETs’ inability to teach the skills in a good manner. The domain related to the abilities, devices/instruments, and equipment came in the second rank, with emphasis on the lack of the instruments for most of the sport games. The third rank was the domain related to the academic curriculum content, with emphasis on the inappropriateness of the curriculum content for the educational environment. The challenge of the school environment was in the fourth rank, with emphasis on the overcrowded students in one classroom. Finally, the domain related to the school management ranked fifth and last, with emphasis on the negative view of the school management about the physical education.
5. Recommendations The researcher recommends the necessity of briefing the decision makers in the Ministry of Education about the challenges facing the PETs in the Chitwan district public schools, for the purpose of finding suitable solutions. Some of these solutions are to improve the ability of the teachers in teaching skills in a good manner; to provide instruments for most of the sport games; to modify the curriculum to make it appropriate for the educational environment; to reduce the number of students in a one classroom; and to change the negative view of the school management about the physical education.
6. Limitations
The study has several limitations. First, bias existed due to the way the researcher chose the study sample which was by the intentional method. Second, the results are generalizable only to the target population and to the same setting (i.e., physical education teachers at schools). Finally, the results of the study were based on perspective of the participants themselves.

1515Journal of Balkumari College
References 1. Ahmad, N. (2010). Obstacles of Applied Instructional Media in Government Schools from the
Perspective of Principals and Teachers. Journal of Research and Studies, 14, 4-6.2. Albert, D., Terri, N., Wendy, K., Kevin, A., Elizabeth, H., & Aleta, L. (2006). Peer
School Problems in the Lives of Urban Adolescents: Frequency, Difficulty, and Relation to Adjustment. Journal of School Psychology, 44, 169-190. http://dx.doi.org/10.1016/j.jsp.2006.02.001
3. Al-Momani, Z., & Khasawnih, A. (2007). The Difficulties Which Face School Sports in Irbid First Education Directorate from the Viewpoint of Physical Education Teachers. Abhath AL-Yarmouk Research: Series of Humanities and Social Sciences, 23, 1333-1351.
4. Al-Sayeh, M. (2007). Sport in Sociology in Physical Education. Alexandria: Dar Al-Wafa. 5. Al-Shorman, A. (2009). The Problems That Face Scholastic Sport at Educational Directorates
in Zarqa Region. Dirasat: Educational Sciences, 36, 37-52. 6. Anmol (2015). Future Trends and Challenges in Physical Education and Sports Sciences.
International Journal of Physical Education, Sports and Health, 1(3), 59-60. 7. BalSevich, V. (2005). Physical Education in the Schools: Ways to Modernize the Instruction.
Russian Education and Society, 47, 82-91.8. Faedi, F., Jalal, H., & Erak, M. (2010). Occupational Stress of Physical Education Teacher.
Journal of Physical Education Sciences, 2, 220-247.9. Hardman, K. (2009). A Review of the Global Situation of Physical Education. International
Journal of Physical Education, 46, 2-21. 10. Harrison, M. (2005). Public Problems, Private Solutions: School Choice and Its Consequences.
Cato Journal, Cato Institute, 25, 197-215.11. Husain, H., Nahar, H., Salem, M., AL Anabtawi, H., AL Qatan, T., Mokhtar, S., & Jamal
aldeen, A. (1999). Problems which Face Physical Education Teachers in Qatar, Journal of Education Faculty, 15, 265-315.
12. Mahmmoud, M. (2003). Needs of Physical Education Teacher of Service Training. Unpublished Master Thesis, Helwan University, Greater Cairo.
13. Makhamreh, K. (2012). The Main Obstacles of Teaching Physical Education in Schools and Educational Directorate Hebron from the Teachers’ Point. Journal of Al-Azhar University: Sseries of Humanities Sciences, 14, 103-128.
14. Nyakweba, J. (2005). Status of PHYSICAL education in Butere Division Secondary Schools. Unpublished Master Thesis, Kenyatta University, Kahawa.
15. Orunaboka, T., & Nwachukwu, E. (2012). Management of Physical Education Facilities, Equipment, and Supplies in secondary Schools in Nigeria: Issues and Challenges. Journal of Education and Practice, 3, 43-47.
16. Oudat, M., Bader, F., & khasawneh, A. (2009). Analytical Studies for Challenges Which Face Physical Education Teacher in Nepalese public Primary School. Scientific Journal of Physical Education and Sport, 37, 21-36.
17. Rainer, P., Cropley, B., Jarvis, S., & Griffiths, R. (2012). The Challenges of Providing High Quality Physical Education and School Sport Faced by Head Teachers within Primary Schools. Physical Education and Sport Pedagogy, 17, 429-446. http://dx.doi.org/10.1080/17408989.2011.603125
18. Shihadi, R. (2012). The Problems that Facing the Teachers in the Coeducation Basic Governmental Schools. Unpublished Master Thesis. Nablus: An-Najah National University.
19. Wanyama, M. (2011). The Challenges of Teaching Physical Education: Juxtaposing the Experiences of Physical Education Teachers in Kenya and Victoria (Australia). Unpublished Master Thesis. Parkville: University of Melbourne.
20. Wanyama, M., & Quay, J. (2014). The Challenges of Teaching Physical Education: Juxtaposing the Experiences of Physical Education Teachers in Kenya and Victoria (Australia). African Journal for Physical, Health Education, Recreation and Dance, 20, 745-754.
1616 Journal of Balkumari College
AbstractThe study explores the shareholders’ view on corporate dividend policy and practices of Nepal. Shareholders are the prime investors in the corporate firms’ shares. So, how they react in terms of their feelings about dividend policy and practice is necessary to study. Corporate executives implement the dividend decision of the board of directors that significantly affects the shareholders’ expectations of dividend either in the form of cash dividend or bonus shares. Questionnaire survey was conducted to collect the primary data relating to know the opinions of shareholders regarding dividend policy and practice of sample corporate firms. The following are the main focuses of analysis:
• Shareholders’ perceptions of corporate dividend policy and practice.• Shareholders’ survey findings.• Dividend policy and practices culture in Nepalese firms.
Keywords: Dividend policy, cash dividend, stock dividend, Primary and secondary market, Investment in shares.
IntroductionThe dividend policy and practice of a corporate firm reflect its management’s attitude of rewarding its shareholders. It also affects investment policy in the short and long run, profitability pattern, expected growth in earnings, expected growth in market value, capital structure pattern and liquidity. Dividend policy also becomes a matter of interest to the shareholders.
In this research paper, an attempt has been made to assess shareholders’ views and perceptions on dividend policy and practice of corporate firms collected through the questionnaires and conducting direct interviews with some of the shareholders.The survey results are presented and analyzed here under along with mean values, percentages and ratios and other appropriate values to suit the particular response.
Literature ReviewDividends policy remains one of the key issues in corporate finance since it affects the firm’s value and shareholders wealth. The question of why firms pay dividends is still an unanswered question and hence dividends policy remains a controversial issue in finance. Although many
Dividend policy and practices as perceived by shareholders in Nepal
Dr. Guna Raj ChhetriLecturer of Finance, MBA, M.Phil., Ph. D.
Balkumari College, Narayangarh
1717Journal of Balkumari College
propositions have been advanced by financial economists over the last 50 years to explain dividend policies, the road to a more comprehensive explanation is still not yet fully paved. Finance scholars still have yet to answer the question of: "Why Firms Payout Dividends?" The first influential work on dividends contributed by Miller and Modigliani (1961), which claims that dividends policy has no affect on shareholders wealth reliant on holding investment policy constant.
Investigating the possible factors influencing dividends decision, Lintner (1962) found that different firms follow different strategic path in aligning dividends over time. This leads Black (1976) to question how firms settle on their dividends policies. Many empirical and theoretical explanations were advanced over time by financial economists to solve dividends puzzle. Bhattacharya (1979) provides a popular explanation refers to the signaling hypothesis as paying dividends signals future profitability. Another conventional explanation for dividends policy referred to by "bird-in-the-hand" provided by Bhattacharya (1979). Jensen (1986) and Gomes (2000) relate dividends policy to the agency problem. They evidence that, if dividends are not paid to shareholders, they tend to be exploited by firm managers on their benefits. As Robinson (2006) puts forth, dividends policy is the payout policy that is followed by a firm management in determining the size and the pattern of dividends to shareholders over time.The patterns of corporate dividend policies not only vary over time but also across countries, especially between developed, developing and emerging capital markets. Glen et al. (1995) found that dividend policies in emerging markets differed from those in developed markets. They reported that dividend payout ratios in developing countries were only about two thirds of that of developed countries. Ramcharran (2001) also observed low dividend yields for emerging markets. There has been emerging consensus that there is no single explanation of dividends. The “Bird in Hand” theory of Gordon (1961, 1962) argues that outside shareholders prefer a high dividend policy. They prefer a dividend today to a highly uncertain capital gain from a questionable future investment. Brealey and Myers [2005] argued that the dividend is one of the top ten vital unresolved problems in corporate finance. Three decades later the ball is still wandering among the courts. The dividend policy of a company should be compliant with nature of the firm and country. Dividend payments are favorable to the shareholder, as they cover agency costs. It is possible that managers may exploit the surplus money of the company; hence it is better to dispose of it as a dividend [Jensen & Meckling, 1976].
Agarawal & Jayaraman [1994] described the Indian scenario and seconded the agency theory of dividend policy, claiming that dividends and managerial ownerships are the controlling factors for reducing agency costs. Akbar & Stark [2003] conducted a study in England regarding dividend payments and the value of firms. They tested a new model and determined that R&D and dividend payments have a positive impact on corporate value.
Shareholders’ SurveyPrimary data was collected through questionnaire survey of shareholders during the October, November and December of 2014. Shareholders were selected particularly from the shareholders’
1818 Journal of Balkumari College
registers of listed companies. From the population of shareholders, judgmental cum random sampling was applied in selecting sample shareholders. Due attention was paid in selection of respondents who were literate and could understand the purposes of the study, understand the questions and ways of responding the questions, judiciously, altogether 130 shareholders were selected as respondents. Of the 130, 100 were male and 30 were female respondents to whom questionnaires were distributed. Of the 130 questionnaires distributed, 110 questionnaires were returned (89 from male and 21 from female respondents). Only 94 questionnaires were found with complete response (82 from male and 12 from female respondents) and 16 incomplete. Therefore, only 94 questionnaires were considered and tabulated for analysis.
Respondents’ ProfileThe profiles of the shareholders to which questionnaires were distributed and returned with complete responses are presented below.Sex: Among the respondents, 82 (87%) were male and 12(13%) female.Age: The numbers of respondents by the age group of less than 30 years were found 30 % and
70% above 40 years.Educational background: Of total respondents, 21 (22%) were post graduates, 45 (48%)
graduates and 28 (30%) undergraduates.
Presentation and Analysis of Survey ResultsStock Purchased35 percent of the respondents have bought the stock from the primary market. 25 percent from secondary market and 40 percent from both markets. The data revealed that majority of shareholders liked to purchase the stocks from primary as well as secondary market.
Holding of Stocks PreferredOf all respondents, 70 percent of them have held the stocks of banking and insurance, 10 percent have held the stocks of manufacturing firms and 20 percent have held the stocks of some of the corporate firms in banking, insurance, hydro and manufacturing sectors.
Number of Stocks BoughtAmong the respondents, 50 percent have bought more than 100 stocks. 20 percent have stocks in the range of 201 to 500. Likewise, 30 percent of the respondents have more than 500 shares.
Number of Stock Trading
Among the respondents, 60 percent transacted (bought and sold) their stocks 5 times or more in the stock market, 30 percent transacted less than 5 times and 10 percent has not transacted their stocks at all.
1919Journal of Balkumari College
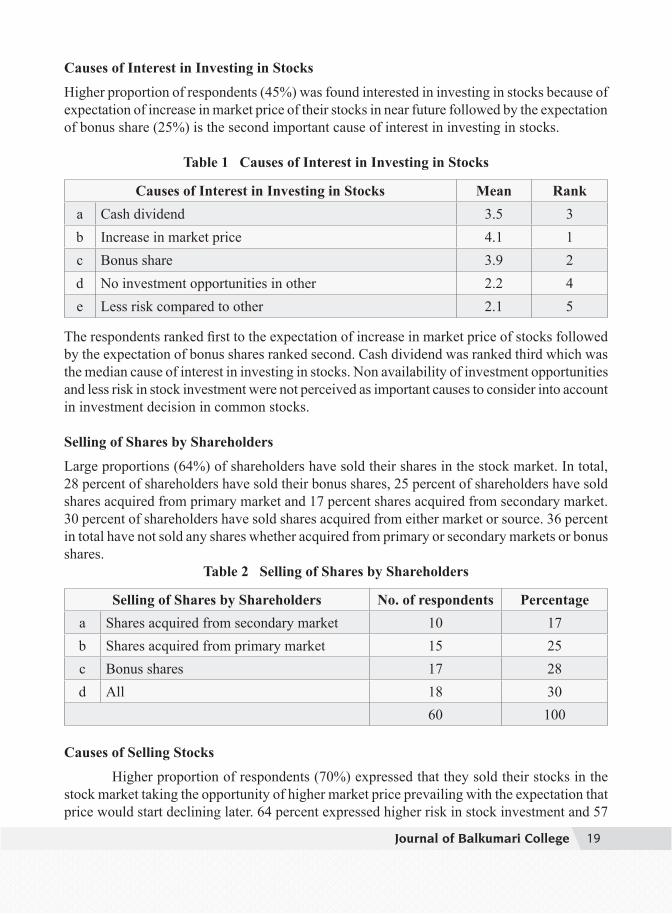
Causes of Interest in Investing in Stocks
Higher proportion of respondents (45%) was found interested in investing in stocks because of expectation of increase in market price of their stocks in near future followed by the expectation of bonus share (25%) is the second important cause of interest in investing in stocks.
Table 1 Causes of Interest in Investing in Stocks
Causes of Interest in Investing in Stocks Mean Ranka Cash dividend 3.5 3b Increase in market price 4.1 1c Bonus share 3.9 2d No investment opportunities in other 2.2 4e Less risk compared to other 2.1 5
The respondents ranked first to the expectation of increase in market price of stocks followed by the expectation of bonus shares ranked second. Cash dividend was ranked third which was the median cause of interest in investing in stocks. Non availability of investment opportunities and less risk in stock investment were not perceived as important causes to consider into account in investment decision in common stocks.
Selling of Shares by ShareholdersLarge proportions (64%) of shareholders have sold their shares in the stock market. In total, 28 percent of shareholders have sold their bonus shares, 25 percent of shareholders have sold shares acquired from primary market and 17 percent shares acquired from secondary market. 30 percent of shareholders have sold shares acquired from either market or source. 36 percent in total have not sold any shares whether acquired from primary or secondary markets or bonus shares.
Table 2 Selling of Shares by Shareholders
Selling of Shares by Shareholders No. of respondents Percentagea Shares acquired from secondary market 10 17b Shares acquired from primary market 15 25c Bonus shares 17 28d All 18 30
60 100
Causes of Selling Stocks
Higher proportion of respondents (70%) expressed that they sold their stocks in the stock market taking the opportunity of higher market price prevailing with the expectation that price would start declining later. 64 percent expressed higher risk in stock investment and 57

2020 Journal of Balkumari College
percent of the respondents expressed the practice of declaring lower cash dividend as the main cause of selling their stocks. 42 percent sold their stocks for meeting their cash requirement and 30 percent for not increasing the market price of their stocks as expected. Ranking of different causes of selling stocks are given in table 3 below.
Table 3 Causes of selling stocks by shareholders and ranking (n=60)
Causes of selling stocks Mean Ranka Cash dividend not up to expectation 3.3 3b Market price not increased 3.2 4c Market price reached maximum 3.9 1d Investment in stocks becoming risky 3.5 2e Meeting cash requirement 2.9 5
Table 3 revealed that shareholders liked to sell their stocks when they feel market price of stocks reached to maximum and it is high time to sell the stocks to realize the capital gain. The causes like investment in stocks becoming more risky and rate of dividend not up to their expectations were other causes for selling their stocks.
Causes of Holding Stocks80% of shareholders liked to hold their stocks in expectation of bonus shares or stock dividend followed by 65 percent in expectation of higher return in stock investment compared to other investment opportunities available to them and 60 percent in expectation of increased future return. They have not considered their investment risky. Ranking of the causes of holding stock are given in table 5 below.
Table 4 Causes of holding stocks by shareholders and ranking (n=34)
Causes of holding stocks Mean Ranka Expectation of increased future return 3.8 2b Expectation of increase in market price 3.4 4c Bonus shares 4.1 1d Decrease in risk 2.8 5e Higher return compared to other 3.7 3
Table 4 revealed that expectation of bonus shares issue or stock dividend, increase in future return and market price were the important reasons of holding stocks by shareholders. It made also clear that 36 percent of shareholders were very optimistic in the performance of the corporate firms in which they own the stocks.

2121Journal of Balkumari College
Shareholders’ satisfaction regarding return on Investment in stocksHalf of the respondents were found satisfied from the return on their investment in stocks and other half not satisfied. This reveals the fact that corporate management still has to make much more improvement in their performance through better financial management relating to investment, financing and dividend in order to meet shareholders’ growing expectation of return on their investment.
Dividend policy and shareholders’ satisfaction64 percent of the respondents opined that the corporate firms have the dividend policy in practice and 36 percent opined that they have not yet. Again, those expressed the existence of dividend policy in the corporate firm, only 20 percent rated the dividend policy as satisfied and 40 percent not satisfied while 40 percent have not responded to the question. Shareholders’ responses regarding dividend policy is presented in table b1 below:
Table 5 Responses regarding dividend policy (n=60)
Responses regarding dividend policy No. of respondents Percentagea Satisfied 12 20b Not satisfied 24 40c Don’t know 24 40
60 100
Table 5 revealed the fact that substantial proportion of shareholders was not satisfied and not interested in dividend policy followed by the corporate firms. It indicates that, on the one hand, there is need of following dividend policy by the corporate management that maximizes the value of the firm and on the other hand, there is also need of reviewing dividend policy from time to time and bring necessary changes in the management’s attitude towards rewarding shareholders through dividend to make them feel and satisfied.
Types of dividend payout policy preferredAs regard to the dividend payout policy, shareholders liked their corporate firms to follow; majority of the shareholders (48%) preferred stable and gradually increasing dividend payout policy and 25 percent preferred earning based dividend payout policy.
Table 6 Types of dividend payout policy preferred
Types of dividend payout policy preferred No. of respondents Percentagea Low dividend payout policy 8 8b High dividend payout policy 12 12c Earning based dividend payout policy 30 30d Stable and gradually increasing dividend payout policy 50 50
2222 Journal of Balkumari College
Table 6 revealed the fact that shareholders preferred their corporate firms to follow the stable and gradually increasing dividend payout policy. They wanted to be sure that there would not be decrease in dividend payout. They preferred to have at least the past dividend payout to maintain by the corporate management and it shout be increased gradually. 25 percent shareholders also preferred their corporate firms to announce dividend based on the earnings. They opined that corporate management should pay higher dividend if earning is high and low dividend if earnings is low 11percent and 16 percent preferred low and high dividend payout policy respectively. It shows that corporate firms should follow stable dividend payout policy and increased with the increase in earnings, if earning is found permanent.
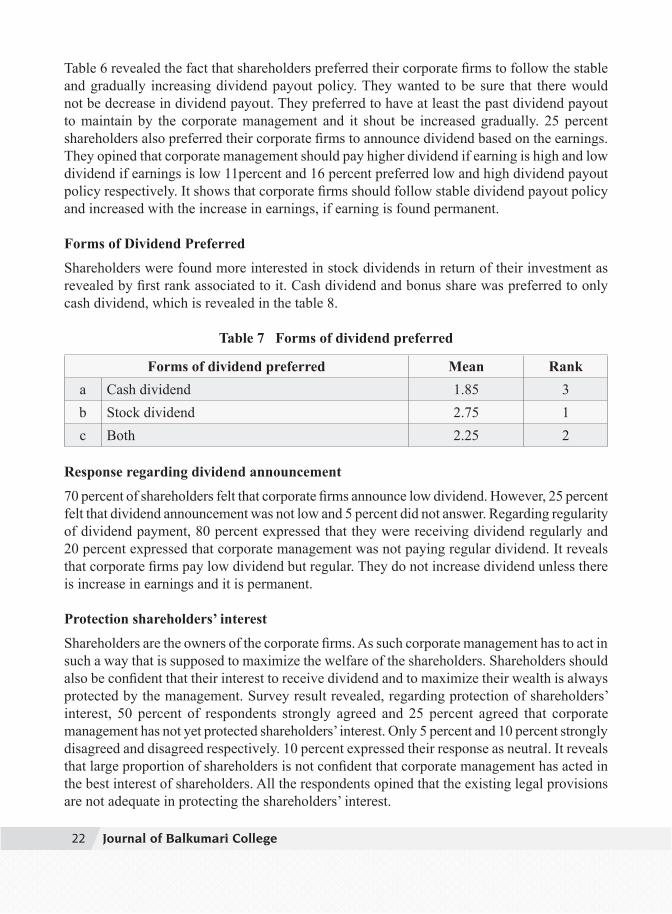
Forms of Dividend PreferredShareholders were found more interested in stock dividends in return of their investment as revealed by first rank associated to it. Cash dividend and bonus share was preferred to only cash dividend, which is revealed in the table 8.
Table 7 Forms of dividend preferred
Forms of dividend preferred Mean Ranka Cash dividend 1.85 3b Stock dividend 2.75 1c Both 2.25 2
Response regarding dividend announcement 70 percent of shareholders felt that corporate firms announce low dividend. However, 25 percent felt that dividend announcement was not low and 5 percent did not answer. Regarding regularity of dividend payment, 80 percent expressed that they were receiving dividend regularly and 20 percent expressed that corporate management was not paying regular dividend. It reveals that corporate firms pay low dividend but regular. They do not increase dividend unless there is increase in earnings and it is permanent.
Protection shareholders’ interest
Shareholders are the owners of the corporate firms. As such corporate management has to act in such a way that is supposed to maximize the welfare of the shareholders. Shareholders should also be confident that their interest to receive dividend and to maximize their wealth is always protected by the management. Survey result revealed, regarding protection of shareholders’ interest, 50 percent of respondents strongly agreed and 25 percent agreed that corporate management has not yet protected shareholders’ interest. Only 5 percent and 10 percent strongly disagreed and disagreed respectively. 10 percent expressed their response as neutral. It reveals that large proportion of shareholders is not confident that corporate management has acted in the best interest of shareholders. All the respondents opined that the existing legal provisions are not adequate in protecting the shareholders’ interest.
2323Journal of Balkumari College
ConclusionsLarge numbers of shareholders were found dissatisfied with the dividend policy and practice of the corporate management. They have emphasized on need of changing corporate dividend policy and corporate management attitude in paying dividend to their shareholders. Respondents realized that bonus share issue must be accompanied by higher dividend in the future years requiring effective and profitable use of increased capital from bonus share issue. Corporate dividend policy and practice has been a matter of considerable interest to shareholders of corporate firms in Nepal as revealed by their responses.
References1. Agarawal, A., & Jayaraman, N. 1994, ‘The Dividend Policy of all Equity Firms: A
Direct Test Free Cash Flow Theory’, Management and Decision Economics, Vol. 15, pp. 138–149.
2. Akbar, S., & Stark, A. 2003, ‘Deflators, Net Shareholder Cash Flows, Dividends, Capital’, Journal of Business Finance and Accounting, Vol. 30, No. 9, pp. 1211–1233.
3. Bhattacharya, S 1979, “Imperfect Information, Dividends Policy, and the "Bird-in-the-Hand" Fallacy”, Bell Journal of Economics, Vol. 10, pp. 259-270.
4. Black, F 1976, The Dividends Puzzle, Journal of Portfolio Management, Vol. 2, pp. 5-8.5. Brealey, R., & Myers, S. 2005, Principles of Corporate Finance. London: McGraw-
Hill, pp. 155–167.6. Glen, J.D., Karmokolias Y., Miller R.R, and Shah S. (1995), “Dividend policy and
behavior in emerging markets”, International Financial Corporation, Discussion Paper No. 26.
7. Gomes, A 2000, “Going Public without Governance: Managerial Reputation Effects”, Journal of Finance, Vol. 55, pp. 615-646.
8. Gordon M. (1962), “The savings, investment and valuation of a corporation”, Review of Economics and Statistics, 37-51.
9. Gordon, M. (1961), “The Investment, Financing, and Valuation of the Corporation”, Review of Economics and Statistics.
10. Jensen, & Michael., 1986, ‘Agency Costs of Free Cash Flow, Corporate Finance, and the Market For Takeovers’, American Economices Review, pp. 323–329.
11. Jensen, M 1986, “Agency Cost of Free Cash Flow, Corporate Finance, and Takeovers”, American Economic Review Studies and Proceeding, Vol. 76, pp. 323-329.
12. Lintner, J 1962, “Dividends, Earnings, Leverage, Stock Prices and the Supply of Capital to Corporations”, Review of Economics and Statistics, Vol. 4, No. 4, pp. 243-269.
13. Miller, M and F Modigliani. 1961, “Dividends Policy, Growth, and the Valuations of Shares”, Journal of Business, Vol. 3, No. 4, pp. 411-433.
14. Ramcharran, H. (2001), “An empirical model of dividend policy in emerging equity markets”, Emerging Markets Quarterly, 5, 39-49.
15. Robinson, J 2006, “Dividends Policy among Publicly Listed Firms in Barbados”, Journal of Eastern Caribbean Studies, Vol. 31, pp. 1-36.

2424 Journal of Balkumari College
Questionnaire to Shareholders
Name (optional) ……………………………..................... Sex: Male …….. Female …….Age: ……. Years Qualification: Bachelor or above ……. Below Bachelor ……..
1. Have you bought shares of the corporate firms? Tick one: Yes…... No…..2. From which market you have purchased shares?
(a) Primary market (b) Secondary market (c ) Both market3. Which company’s shares do you have?
(a) Financial institutions and Insurance(b) Manufacturing, Hydro etc.(c) Both
4. Have you attended Annual General Meeting of companies in which you hold the shares? Tick one: Yes…. No…..If yes, how many times in a year? Tick one:(a) 1 (b) 2 (c) 3 (d) 4 (e) 5 or more
5. How many shares in total you have now? Tick one:(a) Less than 50 (b) 50-100 (c) 101-200 (d) 201-500 (e) More than 500
6. How many times you have traded shares in the Nepal Stock Exchange Market? Tick one:
(a) 1 (b) 2 (c) 3 (d) 4 (e) 5 (f) more than 57. Why are you interested in investing in shares? Rank in order of importance
Lowest 1 2 3 4 5 Highest(a) Expectation of cash dividend ------ (b) Expectation of increased in market price ------(c) Expectation of bonus shares ------(d) All of the above ------(e) Because no opportunities to invest in other field ------
8. Have you sold the number of shares in Nepal Stock Exchange Market? Yes….. No…..If yes, which shares you have sold?(a) Shares purchased in primary market(b) Bonus shares(c) Shares bought in Secondary market(d) All
2525Journal of Balkumari College
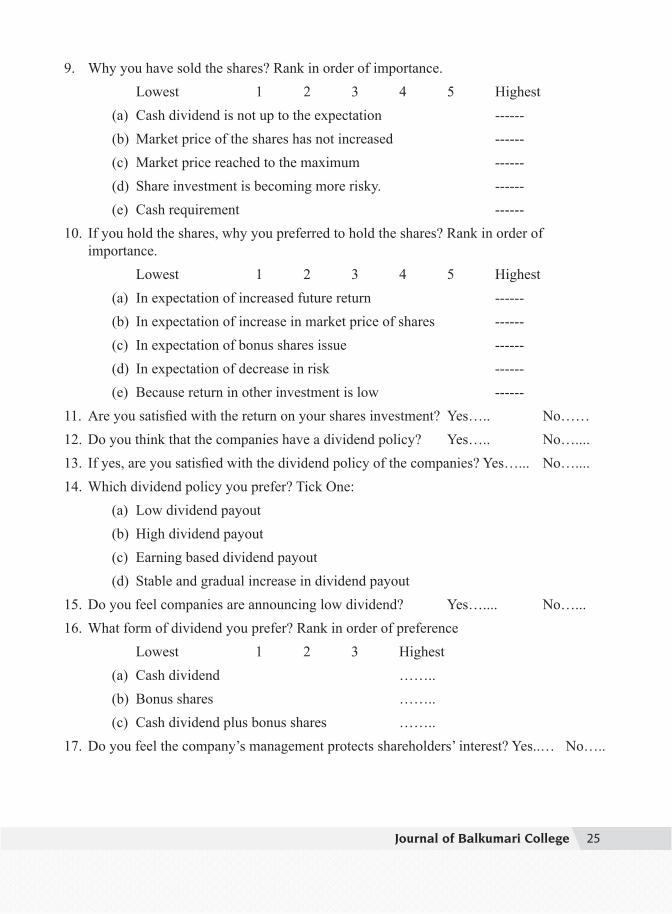
9. Why you have sold the shares? Rank in order of importance.Lowest 1 2 3 4 5 Highest
(a) Cash dividend is not up to the expectation ------(b) Market price of the shares has not increased ------(c) Market price reached to the maximum ------(d) Share investment is becoming more risky. ------(e) Cash requirement ------
10. If you hold the shares, why you preferred to hold the shares? Rank in order of importance.
Lowest 1 2 3 4 5 Highest(a) In expectation of increased future return ------(b) In expectation of increase in market price of shares ------(c) In expectation of bonus shares issue ------(d) In expectation of decrease in risk ------(e) Because return in other investment is low ------
11. Are you satisfied with the return on your shares investment? Yes….. No……12. Do you think that the companies have a dividend policy? Yes….. No…....13. If yes, are you satisfied with the dividend policy of the companies? Yes…... No…....14. Which dividend policy you prefer? Tick One:
(a) Low dividend payout(b) High dividend payout(c) Earning based dividend payout(d) Stable and gradual increase in dividend payout
15. Do you feel companies are announcing low dividend? Yes….... No…...16. What form of dividend you prefer? Rank in order of preference
Lowest 1 2 3 Highest(a) Cash dividend ……..(b) Bonus shares ……..(c) Cash dividend plus bonus shares ……..
17. Do you feel the company’s management protects shareholders’ interest? Yes..… No…..
2626 Journal of Balkumari College
Tole-wise cross sectional study of effect of EFLGP program of Nepal Government
With reference to Bharatpur Sub Metropolitan City Dr. Bijay Lal Pradhan
Assistant Professor, Tribhuvan University, Nepal
AbstractEverybody of us are well-known that today’s world is a victim of embarrassment of environmental obstacles ranging from global warming, ozone layer depletion to an alarming increase of pollution level in every part of the world (Basak, 2009). Like all underdeveloped countries Nepal also has facing serious environmental deterioration and has suffered from different kind of natural calamities. Especially we are facing different problems like solid waste disposal, sanitation, air and water pollution, landslide, soil erosion etc. So the Government of Nepal has taken landmark decision to implement environment friendly local government program in forty-four Municipality of Nepal through the Local Autonomy Governance Act 2055. This is the study concerning the environmental activities conducted in Bharatpur Sub-Metropolitan City in the tole level. Database regarding the environment are essential for sustainable development of society. Environmental data regarding cleaning programme, greenery of the locality, management of beauty of the tole and control over the sound pollution has collected and presented in this study.
IntroductionThe city is said to be a junction of different cities, since within 4 to 5 hours drive we can reach major cities of Nepal. Besides the excellent road facilities Bharatpur is connected to capital city Kathmandu through the regular air services having 3 to 5 flights per day through different flight companies (http://www.chitwantourism.com/travel-blog/bharatpur-city.php, 2016).The city is situated at an altitude of 251 meter from the sea level and its temperature ranges from 15oc to 40oc with annual average rainfall 2000 mm. The Landline, mobile telephone services with internet service is accessible to majority of the people of this locality. Many historical and cultural area is available in this area. Chitwan National Park, Bis hajari tal, Rhino tal, Saraichuli hill are the main historical and tourism place of chitwan. The Devghat is the internationally renouned holy place of chitwan and Narayani is the big river of Nepal. In the same way there are many cultural places located in this area. All these historical, cultural, tourism places should be protected from environmental degradation. Bharatpur Sub-Metropolitan city is located in the bank of Narayani river. The Municipality was established in 2048 BS. Almost all people, except some indigenous groups like Tharus, Darai, Kumals and Chepangs, are migrated from different part of the country. The migration
2727Journal of Balkumari College
had taken its root after the eradication of malaria.
The agricultural land of this area is converted into residential area and some portion is used for industrial area too. Bharatpur has huge number of small scale industries with small number of large industries. Similarly the city has large number of poultry industries which occupy almost 60% of the poultry demand of the country. The large number of population, concrete structure, industries and poultry along with different developmental factors are responsible for environmental pollution. The polluted surroundings deteriorate our quality of life. For survival of human civilization, the protection of environment is very much essential. We should live in harmony with nature and nature should be cured and prevent it from deterioration (Murthy, 2005). Most of the municipalities are facing different problems like solid waste disposal, sanitation, air and water pollution, etc. To control over these pollution, from every part of the society should be indulge in cleaner and greenery programs. Local Autonomy Governance Act 2055 has guided to implement environment friendly local government program in each Municipality of Nepal (Social Mobilizer Hand Book, 2015). The database regarding cleaning programme, greenery of the locality, management of beauty of the tole and control over the sound pollution has to be collected and should be reported to the Ministry of Local Development.
MethodologyThis is the study regarding status of the Environment Friendly Local Governance Program, which has been conducted in the Bharatpur Sub-Metropolitan City. The status was studies through the survey. The survey was done using questionnaire which is attached in annex-1. The questionnaire was made the help of social mobilizer hand book published by Environment Friendly Local Governance. Thorough discussion had held with the authority body of the Municipality along with the survey experts. The questionnaire was then finalized for the survey. The study was totally depends on primary data collection.There were 385 Tole Development Society (TDS) operating in Bharatpur Sub-Metropolitan City. These societies are responsible for the development of their respective locality. TDS are endlessly concerning about the environmental factor is one of the prominent factor for sustainable development of the society for future.
The finalized questionnaires were administered through five enumerators to those 385 TDS. The enumerators were trained to collect the information. The information collected from these 385 TDS were checked for its completeness. Then the collected data were entered into the computer software for analysis purpose. The analysis was performed using IBM SPSS 20. The data were logically interpreted with simple tables. The study was performed descriptively.
Result and DiscussionsThe result is segregated in to fundamental indicator and developed indicators. The data regarding different indicators were analyzed and presented below accordance to the different subheadings as guided by the hand book of EFLGP. The totals of 385 Tole Development Society (TDS) were studied. The study was design on the basis of explanation of the data observed. The data were compared and presented frequency and percentage basis.
2828 Journal of Balkumari College
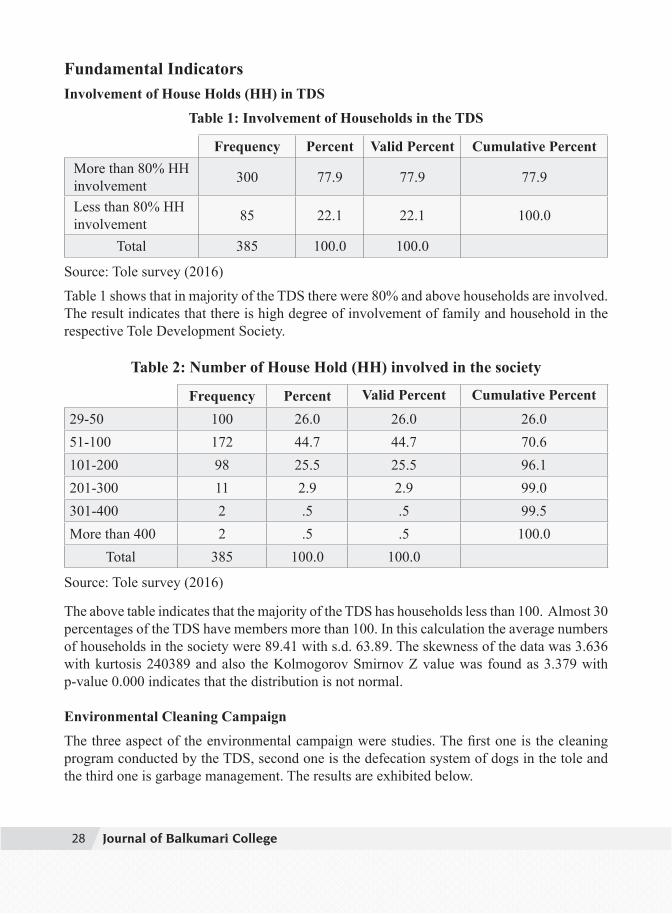
Fundamental IndicatorsInvolvement of House Holds (HH) in TDS
Table 1: Involvement of Households in the TDS
Frequency Percent Valid Percent Cumulative PercentMore than 80% HH involvement 300 77.9 77.9 77.9
Less than 80% HH involvement 85 22.1 22.1 100.0
Total 385 100.0 100.0
Source: Tole survey (2016)Table 1 shows that in majority of the TDS there were 80% and above households are involved. The result indicates that there is high degree of involvement of family and household in the respective Tole Development Society.
Table 2: Number of House Hold (HH) involved in the society
Frequency Percent Valid Percent Cumulative Percent29-50 100 26.0 26.0 26.051-100 172 44.7 44.7 70.6101-200 98 25.5 25.5 96.1201-300 11 2.9 2.9 99.0301-400 2 .5 .5 99.5More than 400 2 .5 .5 100.0
Total 385 100.0 100.0
Source: Tole survey (2016)
The above table indicates that the majority of the TDS has households less than 100. Almost 30 percentages of the TDS have members more than 100. In this calculation the average numbers of households in the society were 89.41 with s.d. 63.89. The skewness of the data was 3.636 with kurtosis 240389 and also the Kolmogorov Smirnov Z value was found as 3.379 with p-value 0.000 indicates that the distribution is not normal.
Environmental Cleaning Campaign
The three aspect of the environmental campaign were studies. The first one is the cleaning program conducted by the TDS, second one is the defecation system of dogs in the tole and the third one is garbage management. The results are exhibited below.
2929Journal of Balkumari College
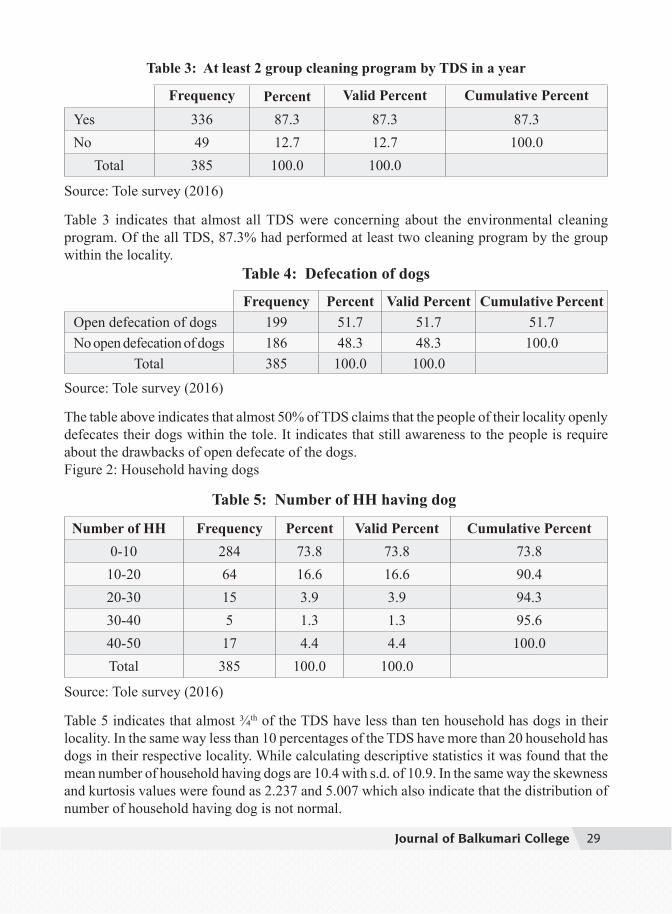
Table 3: At least 2 group cleaning program by TDS in a year
Frequency Percent Valid Percent Cumulative PercentYes 336 87.3 87.3 87.3No 49 12.7 12.7 100.0
Total 385 100.0 100.0
Source: Tole survey (2016)
Table 3 indicates that almost all TDS were concerning about the environmental cleaning program. Of the all TDS, 87.3% had performed at least two cleaning program by the group within the locality.
Table 4: Defecation of dogs
Frequency Percent Valid Percent Cumulative PercentOpen defecation of dogs 199 51.7 51.7 51.7No open defecation of dogs 186 48.3 48.3 100.0
Total 385 100.0 100.0
Source: Tole survey (2016)
The table above indicates that almost 50% of TDS claims that the people of their locality openly defecates their dogs within the tole. It indicates that still awareness to the people is require about the drawbacks of open defecate of the dogs. Figure 2: Household having dogs
Table 5: Number of HH having dog
Number of HH Frequency Percent Valid Percent Cumulative Percent0-10 284 73.8 73.8 73.810-20 64 16.6 16.6 90.420-30 15 3.9 3.9 94.330-40 5 1.3 1.3 95.640-50 17 4.4 4.4 100.0Total 385 100.0 100.0
Source: Tole survey (2016)
Table 5 indicates that almost ¾th of the TDS have less than ten household has dogs in their locality. In the same way less than 10 percentages of the TDS have more than 20 household has dogs in their respective locality. While calculating descriptive statistics it was found that the mean number of household having dogs are 10.4 with s.d. of 10.9. In the same way the skewness and kurtosis values were found as 2.237 and 5.007 which also indicate that the distribution of number of household having dog is not normal.

3030 Journal of Balkumari College
Table 6: Is the garbage from home directly kept into collection vehicle
Frequency Percent Valid Percent Cumulative PercentYes 271 70.4 70.4 70.4No 114 29.6 29.6 100.0
Total 385 100.0 100.0
Source: Tole survey (2016)
Table 6 indicates that more than two third of the TDS has kept their garbage directly to the collection vehicle whereas almost one third collect their garbage in open space which is collected latter by the collection vehicle. Good Environmental GovernanceUnder the topic good governance regarding environment the discussion has been done on the decision regarding the conservation of environment and the conduction of the program on the occasion of world environmental day. The data regarding above two segments is presented below.
Table 7: Discussion and decision regarding environmental protection program in a AGM
Frequency Percent Valid Percent Cumulative PercentYes 296 76.9 76.9 76.9No 89 23.1 23.1 100.0
Total 385 100.0 100.0
Source: Tole survey (2016)
Table 7 indicates that almost three forth of the TDS discussed on the conservation of environment on their respective AGM and decision has been taken. Which is indicates that Bharatpur Sub Metropolitan City has majority of TDS which are always concern about the environmental aspect of the tole.
Every Year our world is witnessing World Environment Day on June 5. The different organizations all over the world execute different activities regarding protection of environment. The TDS were asked whether they execute the program on the occasion of WED or not.
Table 8: Environmental Protection program on June 5
Frequency Percent Valid Percent Cumulative PercentYes 161 41.8 41.8 41.8No 224 58.2 58.2 100.0Total 385 100.0 100.0
Source: Tole survey (2016)
Table 8 shows that although three fourth of TDS were concerning about the environmental aspects and conducts the environmental protection program, majority of the TDS still does not
3131Journal of Balkumari College
celebrate WED performing the environmental protection programs.
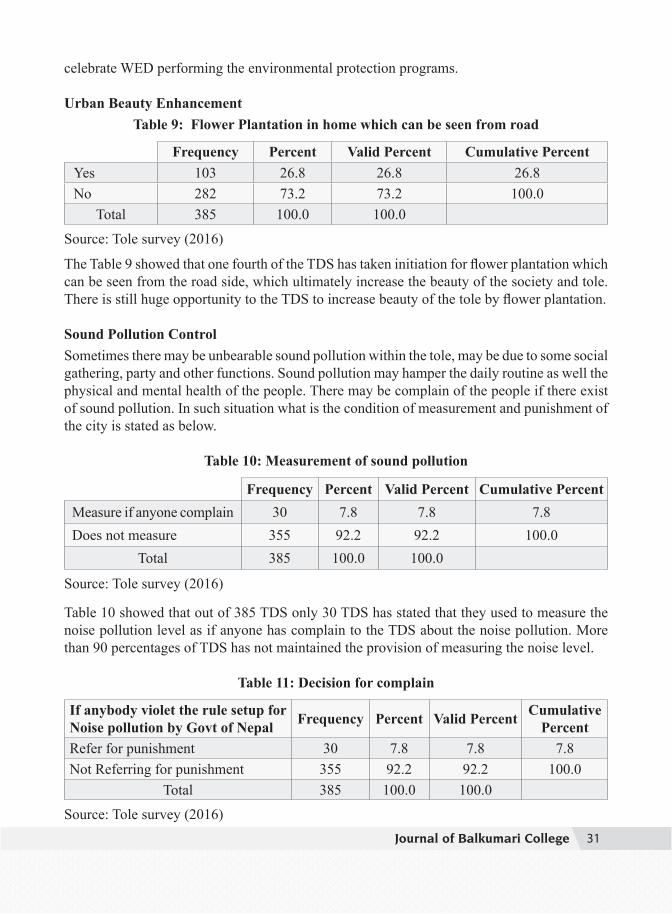
Urban Beauty EnhancementTable 9: Flower Plantation in home which can be seen from road
Frequency Percent Valid Percent Cumulative PercentYes 103 26.8 26.8 26.8No 282 73.2 73.2 100.0
Total 385 100.0 100.0
Source: Tole survey (2016)
The Table 9 showed that one fourth of the TDS has taken initiation for flower plantation which can be seen from the road side, which ultimately increase the beauty of the society and tole. There is still huge opportunity to the TDS to increase beauty of the tole by flower plantation.
Sound Pollution ControlSometimes there may be unbearable sound pollution within the tole, may be due to some social gathering, party and other functions. Sound pollution may hamper the daily routine as well the physical and mental health of the people. There may be complain of the people if there exist of sound pollution. In such situation what is the condition of measurement and punishment of the city is stated as below.
Table 10: Measurement of sound pollution
Frequency Percent Valid Percent Cumulative PercentMeasure if anyone complain 30 7.8 7.8 7.8Does not measure 355 92.2 92.2 100.0
Total 385 100.0 100.0
Source: Tole survey (2016)
Table 10 showed that out of 385 TDS only 30 TDS has stated that they used to measure the noise pollution level as if anyone has complain to the TDS about the noise pollution. More than 90 percentages of TDS has not maintained the provision of measuring the noise level.
Table 11: Decision for complain
If anybody violet the rule setup for Noise pollution by Govt of Nepal Frequency Percent Valid Percent Cumulative
PercentRefer for punishment 30 7.8 7.8 7.8Not Referring for punishment 355 92.2 92.2 100.0
Total 385 100.0 100.0
Source: Tole survey (2016)
3232 Journal of Balkumari College
Those who used to measure the noise pollution are also referring for the punished to those who has created the noise pollution as stated by the Government of Nepal.
Developed Indicators
Clean and green environment of the region is the developed indicator to measure the environmental condition of the region. In the same way there should be minimal noise level stated as the rule of Government of Nepal, for making our region environmental friendly.
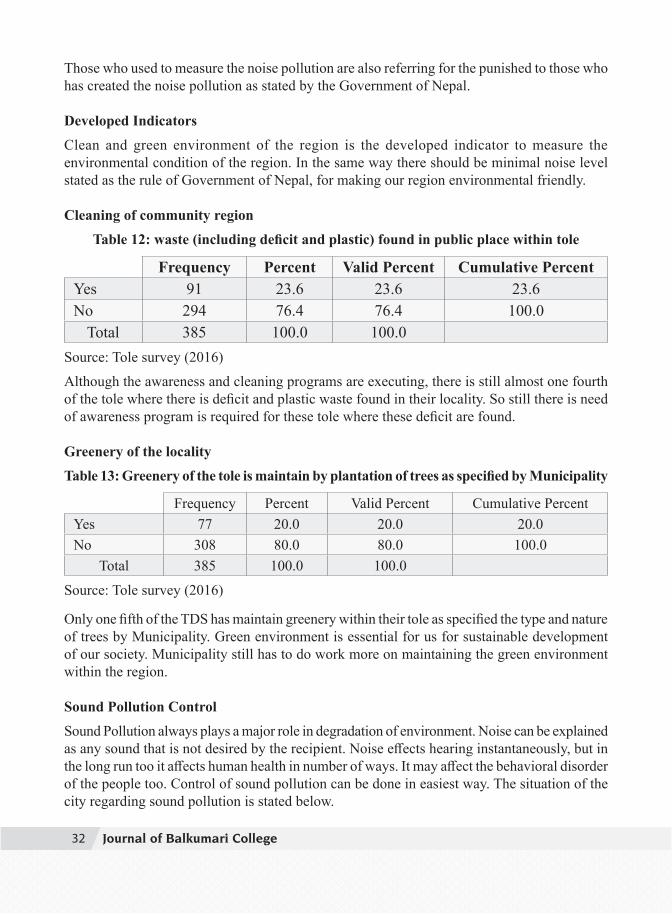
Cleaning of community regionTable 12: waste (including deficit and plastic) found in public place within tole
Frequency Percent Valid Percent Cumulative PercentYes 91 23.6 23.6 23.6No 294 76.4 76.4 100.0
Total 385 100.0 100.0Source: Tole survey (2016)Although the awareness and cleaning programs are executing, there is still almost one fourth of the tole where there is deficit and plastic waste found in their locality. So still there is need of awareness program is required for these tole where these deficit are found.
Greenery of the localityTable 13: Greenery of the tole is maintain by plantation of trees as specified by Municipality
Frequency Percent Valid Percent Cumulative PercentYes 77 20.0 20.0 20.0No 308 80.0 80.0 100.0
Total 385 100.0 100.0
Source: Tole survey (2016)
Only one fifth of the TDS has maintain greenery within their tole as specified the type and nature of trees by Municipality. Green environment is essential for us for sustainable development of our society. Municipality still has to do work more on maintaining the green environment within the region.
Sound Pollution ControlSound Pollution always plays a major role in degradation of environment. Noise can be explained as any sound that is not desired by the recipient. Noise effects hearing instantaneously, but in the long run too it affects human health in number of ways. It may affect the behavioral disorder of the people too. Control of sound pollution can be done in easiest way. The situation of the city regarding sound pollution is stated below.
3333Journal of Balkumari College
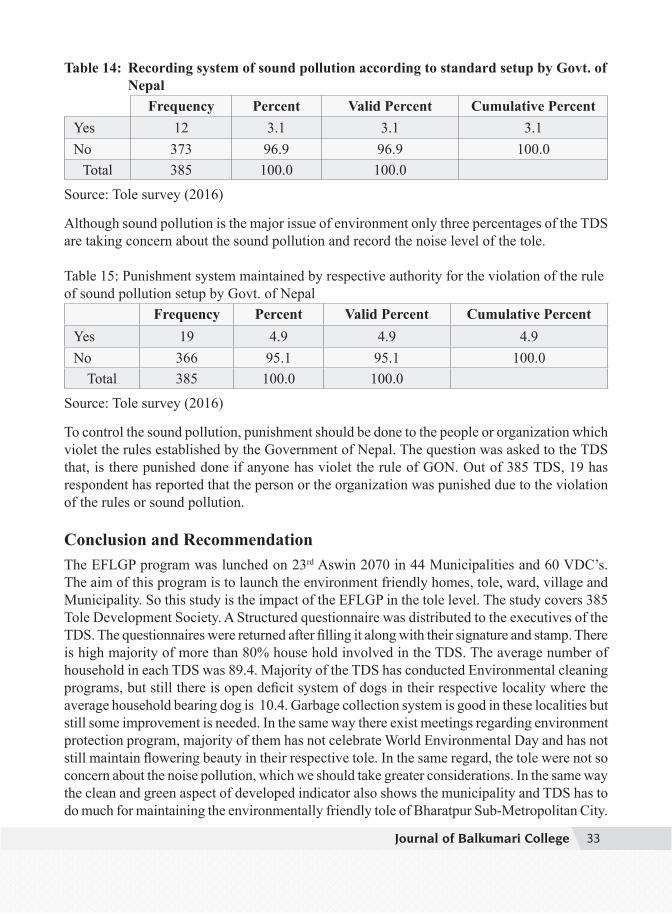
Table 14: Recording system of sound pollution according to standard setup by Govt. of Nepal
Frequency Percent Valid Percent Cumulative PercentYes 12 3.1 3.1 3.1No 373 96.9 96.9 100.0
Total 385 100.0 100.0
Source: Tole survey (2016)
Although sound pollution is the major issue of environment only three percentages of the TDS are taking concern about the sound pollution and record the noise level of the tole.
Table 15: Punishment system maintained by respective authority for the violation of the rule of sound pollution setup by Govt. of Nepal
Frequency Percent Valid Percent Cumulative PercentYes 19 4.9 4.9 4.9No 366 95.1 95.1 100.0
Total 385 100.0 100.0
Source: Tole survey (2016)
To control the sound pollution, punishment should be done to the people or organization which violet the rules established by the Government of Nepal. The question was asked to the TDS that, is there punished done if anyone has violet the rule of GON. Out of 385 TDS, 19 has respondent has reported that the person or the organization was punished due to the violation of the rules or sound pollution.
Conclusion and RecommendationThe EFLGP program was lunched on 23rd Aswin 2070 in 44 Municipalities and 60 VDC’s. The aim of this program is to launch the environment friendly homes, tole, ward, village and Municipality. So this study is the impact of the EFLGP in the tole level. The study covers 385 Tole Development Society. A Structured questionnaire was distributed to the executives of the TDS. The questionnaires were returned after filling it along with their signature and stamp. There is high majority of more than 80% house hold involved in the TDS. The average number of household in each TDS was 89.4. Majority of the TDS has conducted Environmental cleaning programs, but still there is open deficit system of dogs in their respective locality where the average household bearing dog is 10.4. Garbage collection system is good in these localities but still some improvement is needed. In the same way there exist meetings regarding environment protection program, majority of them has not celebrate World Environmental Day and has not still maintain flowering beauty in their respective tole. In the same regard, the tole were not so concern about the noise pollution, which we should take greater considerations. In the same way the clean and green aspect of developed indicator also shows the municipality and TDS has to do much for maintaining the environmentally friendly tole of Bharatpur Sub-Metropolitan City.

3434 Journal of Balkumari College
Bibliography
Social Mobilizer Hand Book. (2015, July). Environmental Friendly Local Governance. Kathmandu, Nepal: Ministry of State Providence and Local Governance.
http://www.chitwantourism.com/travel-blog/bharatpur-city.php. (2016, March 15). Retrieved March 15, 2016, from www.chitwantourism.com: http://www.chitwantourism.com
Basak, A. (2009). Environmental Studies. New Delhi: Pearsons Education.
Murthy, C. (2005). A text book of Environmental Sciences. New Delhi: Sultan Chand & Sons.
3535Journal of Balkumari College
AbstractThis paper is based on the satisfaction survey of students of Balkumari College. The research mainly focused on satisfaction of students towards teaching learning activities, teacher’s performance, quality education, educational environment of college. To know the level of satisfaction of 4000 students of Balkumari College, a sample of 239 students from different faculties are selected using random sampling technique. The primary data is collected from them using structured questionnaire on Likert Scale. Less than 20% student expresses their views as excellent on the different criteria of services provided by the college. Most of the student express their views that their expectation are not fulfilled what they expect before entering the college. Student feels that their teachers are qualified and pedagogy used by teachers are also good. However more than 80% of the cases, teacher’s devotion is not excellent according to the eye of students.Key word: BKC, Satisfaction, Opinion, survey, devotion, quality
IntroductionToday Balkumari College is an epitome of educational world having wide range of faculties, departments, councils, administrative units and so on. Management, education, science, staff nurse, paramedics, council of international affairs, council of research& development are some of notable faculties, departments and branches. Each of them has a definite mission and involved in itsIntermediate to Post graduate level with 4000 students, 90 teachers and 50 administrative staff, Balkumari College is affiliated with several universities- Tribhuvan University, Purbanchal University, Higher Secondary Education Board and CTEVT for the affiliation of different programs .Different programs like +2 Science and management, PCl Nursing, BSC, BBS, BEd, BHM, MEd, MBS etc are currently run by the college. Today its ambitions include quality education, research & development, Community services and health services. You may require pages and pages to describe each of those faculties, departments and administrative units.
Satisfaction is the power in the modern educational and academic word. The success or failure of any educational organization depends upon the student’s satisfaction/ dis-satisfaction. Satisfaction is student’sfulfillment response and judgment that passes out students provides a pleasurable level of employment in related field. In other words, satisfaction is the student
Students Satisfaction Survey of Balkumari College
Ganga Pd. SapkotaVice Cordinator-R&D
3636 Journal of Balkumari College
is evaluation of quality/service whether they have met their academic performance level and success of expectations. Success to meet needs and expectation is assumed to the satisfaction whether as failure to meet needs and expectation to result in dis-satisfaction with employees.From students satisfaction quality education provider must know how to please them.
ObjectiveThe main objective of the study is to determine level of students’ satisfaction towards academic environment of BKC.
• To determine the level of satisfaction of the students about teacher’s performance• To know the level of satisfaction of the students toward their expectation.• To identify the level of satisfaction of the students towards the facilities provided by
the college.
Theory and ReviewsA satisfaction survey may be conducted for several reasons like customer satisfaction survey, employee satisfaction survey, product satisfaction survey, quality satisfaction survey etc. Whatever the title of the survey is, its purpose is to gather data about perfection of some product, service or procedure and then analyze the data to make decisions for more improvements. A satisfaction survey may be conducted by using open ended or closed ended questions depending on the needs of the survey.No two ways about, a satisfaction survey format is essential key if you want to run a business successfully. Thus, here in the world of business the most crucial example of satisfaction survey is customer satisfaction survey Yes! This survey will work just like a survival tool that for sure will assist you to determine the satisfaction level of the customers. In this survey companies can ask several questions to their customers for the sake of knowing the views of potential customers. This survey may also be driven by the employer who willing to known the satisfaction of employee that they feel while working in a work-field.As we can say that, this survey can be conducted for different purpose, i.e. as a product satisfaction survey, as a quality satisfaction survey of equipment, as a business satisfaction survey, as service satisfaction survey & even more. To all appearance, in satisfaction survey the surveyor may gather data about perfection level of customer using diverse techniques of analyses. This survey will assist the individual to make decisions for further improvements. Almost certainly, a satisfaction survey template may be conducted by using open or closed ended questions that obviously, depending on the needs of the survey or as per the requirements of surveyor.
MethodologyThe research study is quantitative in nature as it has used the primary data that has been collected from the field study. Sampling research design is followed to carry out this study where all the Students of BKC is population and selected Students are sample.
3737Journal of Balkumari College
Primary data are collected using structured questionnaire. Among 4000 students of the college 239 students are selected randomly from different faculties. Questionnaire are administered to the sample students and they fill it, thus obtained data gathered and entered in excel program and analyzed using SPSS 20 version applying different statistical tool as per requirement.
AnalysisA structured questionnaire is administered to the students and their responses thus obtained are analyzed below.
Students were asked why they are choosing BKC and whether their expectations are fulfilled or not, the responses were tabulated below.
Table 1
Variables Excellent Good Ok Below Standard TotalReason
No. of Students 161 33 7 34 235Percentage(%) 69 14 3 14 100
Expectation No. of Students 20 129 71 9 229Percentage(%) 9 56 31 4 100
Source : Graduated students’ of BKC
Before entering BKC, more than two third students were feeling college is excellent as compared to the neighboring academic institutions, where as only 9% have fulfilled their expectations. It seems that college administration seriously address their academic needs and expectations to increase the quality and stability of the college.For student’s satisfaction survey students were asked three questions about position, management and teaching learning activities of the BKC. The responses were as -
Table 2
Variables Excellent Good Ok Below Standard TotalPosition of the college No. of Students 91 128 18 2 239
Percentage (%) 30 54 8 1 100Management System No. of Students 74 123 40 2 239
Percentage (%) 31 51 17 1 100Teaching learning No. of Students 78 128 27 5 238
Percentage (%) 33 54 11 2 100Average 31 53 12 1
Source : Graduated students’ of BKC
Out of 239 students, more than 50% students consider good position, good management and good teaching learning practices of the college among existing institution near the city. where

3838 Journal of Balkumari College
as the percentage of the students feeling excellent for above questions are 30%, 31% and 33% respectively. In average opinion of 31% students is very good and 53% give normal response for the quality of the college. This implies that college should maintain its quality by doing hard work.
Questions about devotion, teaching method and teachers rating is asked to the students, the responses were as-
Table 3
Variables Excellent Good Ok Below Standard TotalDevotion No of Students 62 122 41 10 235
Percentage(%) 26 52 17 4 100Teaching method No of Students 53 152 16 12 233
Percentage(%) 23 65 7 5 100Teachers Rating No of Students 127 87 18 2 234
Percentage(%) 54 37 8 1 100
Source : Graduated students’ of BKC
In general, more than median no. of students reflects their view in good devotion of the teachers and one fourth of the students give Excellency about devotion of the teachers. But it needs to improve the devotion of teachers from the behalf of teacher and college administration. There is no complain of the students towards the teaching method where 65% have favor in good teaching method and 23% give the version in Excellency. The quality of teachers in the eye of majority of the students is excellent hence there is no complain about the quality of the teachers. Hence to maintain and improve the teachers quality college administration should focus on teachers training and research oriented teaching/learning activities.The opinion about the physical facilities like cleanness, classroom management and library are obtained as-
Table 4
Questions Excellent Good Ok Below Standard TotalCleanness No of Students 73 114 29 20 236
Percentage(%) 31 48 12 8 100Classroom No of Students 41 134 42 16 233
Percentage(%) 18 58 18 7 100Library No of Students 139 76 15 6 236
Percentage(%) 59 32 6 3 100
Source : Graduated students’ of BKC
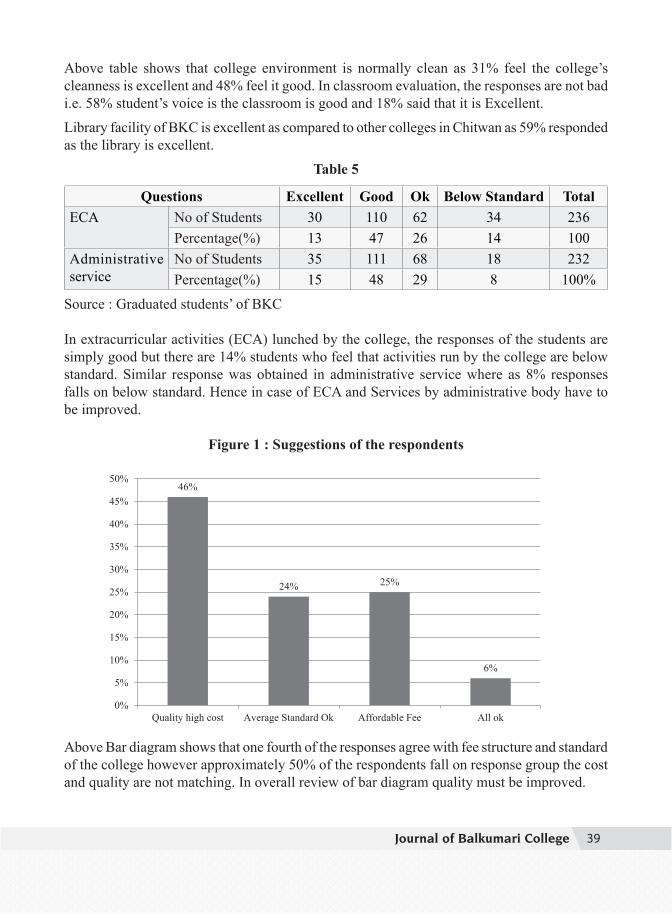
3939Journal of Balkumari College
Above table shows that college environment is normally clean as 31% feel the college’s cleanness is excellent and 48% feel it good. In classroom evaluation, the responses are not bad i.e. 58% student’s voice is the classroom is good and 18% said that it is Excellent.
Library facility of BKC is excellent as compared to other colleges in Chitwan as 59% responded as the library is excellent.
Table 5
Questions Excellent Good Ok Below Standard TotalECA No of Students 30 110 62 34 236
Percentage(%) 13 47 26 14 100Administrative service
No of Students 35 111 68 18 232Percentage(%) 15 48 29 8 100%
Source : Graduated students’ of BKC
In extracurricular activities (ECA) lunched by the college, the responses of the students are simply good but there are 14% students who feel that activities run by the college are below standard. Similar response was obtained in administrative service where as 8% responses falls on below standard. Hence in case of ECA and Services by administrative body have to be improved.
Figure 1 : Suggestions of the respondents
46%
24% 25%
6%
0%
5%
10%
15%
20%
25%
30%
35%
40%
45%
50%
Quality high cost Average Standard Ok Affordable Fee All ok
Above Bar diagram shows that one fourth of the responses agree with fee structure and standard of the college however approximately 50% of the respondents fall on response group the cost and quality are not matching. In overall review of bar diagram quality must be improved.
4040 Journal of Balkumari College
Conclusion• College administration seriously addressed the student’s academic needs to increase
the quality and sustainability of the college.• To maintain the existing standard, hard work should be done by college administration.• To maintain and improve the teacher’s quality administration should focus on training
and research oriented teaching learning activities.• Library facilities are excellent but extracurricular activities are not well managed. So
such activities should be well managed by respective stakeholders. • Class room environment is good however it need to be well managed.• Out of 15 questions of satisfaction survey on students of BKC, using Likert’s Scale
different components about improving quality are not above normal standard but lies in normal range. So for further quality development of college satisfaction level of the students should be increased which give the quality and good result.
ReferencesBlack, T. R. (1993). Evaluating social science research: an introduction, London: SageBryman, A., Cramer D. (1994). Quantitative data analysis for social scientists, London:
RoutledgeKirk, E. R. (1998). Experimental Design: Procedures for the Behavioral Sciences, Third
Edition. Monterey, California: Brooks/ColePublishing. ISBN 0-534-25092-0 Kitchin, R, Tate N. J. (2000). Conducting research into human geography, Harlow: Prentice HallMcCrossan, L. (1991). A handbook for interviewers – a manual of social survey practice and
procedures on structured interviewing, London: HMSOSmith, H. W. (1975). Strategies of social research - the methodological imagination, London:
Prentice Hall International
4141Journal of Balkumari College
AbstractOrganizations are continuously improving their human resource management practices (HRM) in order to achieve sustainable competitive advantage and increase their performance and profitability. These practices include training and development, performance, job satisfaction etc. Training is the nerve that suffices the need of fluent and smooth functioning of work which helps in enhancing the performance of employees and organizational development too. The purpose of this research is to identify training and development process that could improve employee’s performance and job satisfaction, to justify the training and development effectiveness practices on job performance and satisfaction in commercial bank of Nepal, and to identify gaps in the literature along with opportunities for future research.
Key words: Human capital, Job satisfaction, productivity, commitment.
1. IntroductionHuman resource management is concerned with people in an organization. Managing people in the organization is difficult task. The key objectives of HRM are to ensure organizational success through competent and motivated employees. It is said that line managers are unlikely to acquire the primarily responsibility of human resource management, without continuing support from HR specialists (Cummingham, 1995). Human resource are the people who work for the organization .It is really employee management with an emphasis on those employees are asset of the business. In this context, employees are sometimes referred to as human capital, they are viewed as the driving force for the success of organizations because of their skills, competencies, knowledge and experience (Becker & kessels2004, 1975,2002,2004). According to human capital theory, when capable employees leave, an organization losses the human capital embodied in those departing and also loses the chance to realize a return on its investment in developing the human capital.(Dess, 2001)As with other business assets, the goal is to make effective use of employees reducing risk and maximizing return on investment.
In the above context,what practices Nepalese organizations’ have been pursing to develop their human capital to keep them ready to work in changing environment and work standard is a subject of interest for investigation.
Effectiveness of Training and Development towards Human Resource Practices on Performance and Job Satisfaction in Commercial Bank of Nepal
Bala Nath Sigdel, Lecturer, Balkumari College
PhD Scholar of Mewar University Gangrar, Chittorgarh (Rajasthan), India
4242 Journal of Balkumari College
1.1 Significance of the study
Training and development is the most important subsystem or element of human resource development. (Tai, 2006) Asserts that training and development plays a crucial role for increasing work adaptability, ability, flexibility, maintaining necessary competence, and motivate employees. It concerns increasing, improving, enhancing and modifying employees and managers skills, capabilities and knowledge to enable current and future jobs to be more effectively conducted. To perform effectively, at a managerial position, employees go through dynamic process of training and development (Baldwin, 1994). A program of training and development is important as it lends stability and flexibility to an organization, besides contributing to its capacity to grow. Accidents scrap and damage to machinery and equipment can be avoided or minimized (K.Aswathappa, 1997).
1.2 Statement of Research problemWhile research shown relationship and effectiveness of human research practices on enhancing performance and job satisfaction in commercial bank of Nepal. Likewise, Nepal is a under developing country so, it needs to know the contribution of different factors and their impact on organizational performance that leads to the economic development and prosperity. This study is carried out to explore the solution for the following problems faced by the commercial banks of Nepal.1. Human resource are not considered as a sources of important assets. 2. Training, development, employee’s performance and motivation of employees are not regarded as an investment in human resources.
1.3 Objectives of the study• To examine the effect of training and development on employee performance within
organization.• To explore the relationship of training and development with employees satisfaction
in the organization.
1.4 Research questions• How effectiveness of training and development does improves employee’s performance
in the organization ?• Are the effects of training and development helps to increase job satisfaction within
organization?
1.5 Research Hypothesis:
On the basis of literature review the following hypothesis can be developedH1a: Training and development positively affects employee’s performanceH1b: Training and development positively affects employee’s satisfaction
4343Journal of Balkumari College
1.6 Limitations of the study
Result of this study may be viewed with the following limitations. This study considered only listed commercial bank of Nepal. Only training and development, performance and employee satisfaction were used for this study. This study considered only listed commercial bank of Nepal. Therefore the results may not be generalized over the entire market.
1.7 Organization of the study
(i) Introduction(ii) The review of literature(iii) The research methodology(iv) The analysis and interpretation(v) Conclusion and summary(vi) Suggestions and recommendations.
2. Literature Review Many scholars and research centers have conducted different research to find out the effectiveness of training and development towards HRM practice .The result indicated that, majority of the studies in different countries of the world identified a positive relationship between training, development with performance and job satisfaction. In this chapter the findings of recent researchers have been highlighted as literature review. HRM practices have a great impact on employees 'workplace attitudes because of the strong correlation between them (Edgar, 2005) as employees and organization performance are parallel. They are as important to managers as to employees and other stakeholders. (Bartel, 1994)found a significant positive relationship between training and labor productivity in her study while(Guidetti, 2007) found that training activities are positively associated with high performance practices, innovative labor demand features, workforce skill level, firm size, and are affected by labor flexibility in various directions.(Bernardin, 1993)Opine that over the years, training has become increasingly popular as HR tool for improving employees and managerial performance in the organization. It has been estimated that majority of organizations provide some type of formal training and spend millions of dollars doing so. They further write: while top managers recognize the value of training to help their firms gain a competitive edge, so too do employees . Employees understand that opportunities for training enable them to grow and advance in their careers. Development has to do with the increase of skill, through training, that is necessary for proper job performance (Flippo.E.B, 1984).
HRM process throws lights on the positive side of the workers that they are irreplaceable assets belonging to the organization that contribute to its' success of managing people at work. (Cappellie, 2001)Identified that HRM practices might raise productivity slightly, but they also raised labor costs. Well trained employees are key to business success. It has been shown that the most successful and productive employees are those who have received extensive training and development.
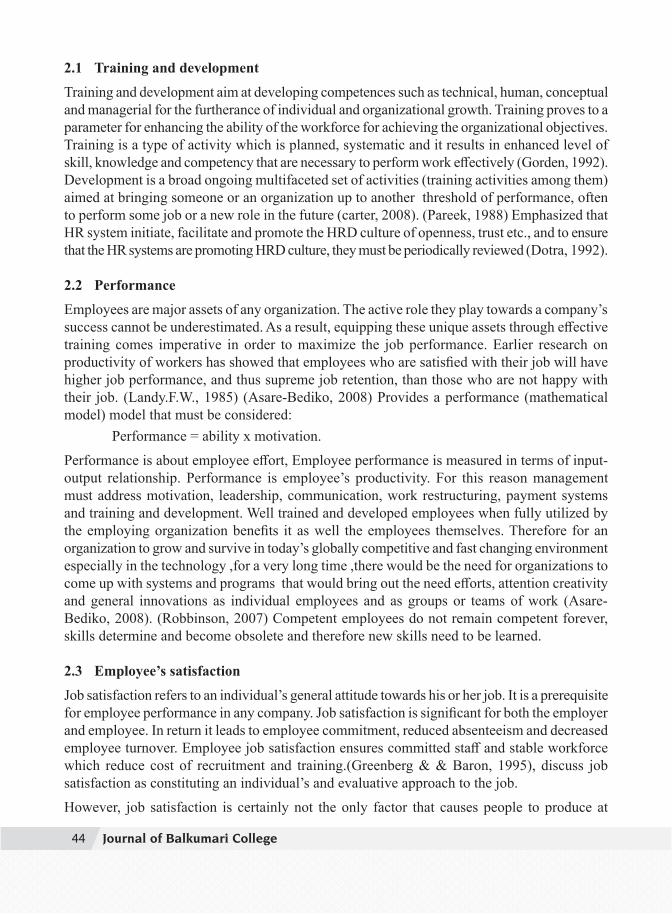
4444 Journal of Balkumari College
2.1 Training and development
Training and development aim at developing competences such as technical, human, conceptual and managerial for the furtherance of individual and organizational growth. Training proves to a parameter for enhancing the ability of the workforce for achieving the organizational objectives.Training is a type of activity which is planned, systematic and it results in enhanced level of skill, knowledge and competency that are necessary to perform work effectively (Gorden, 1992). Development is a broad ongoing multifaceted set of activities (training activities among them) aimed at bringing someone or an organization up to another threshold of performance, often to perform some job or a new role in the future (carter, 2008). (Pareek, 1988) Emphasized that HR system initiate, facilitate and promote the HRD culture of openness, trust etc., and to ensure that the HR systems are promoting HRD culture, they must be periodically reviewed (Dotra, 1992).
2.2 PerformanceEmployees are major assets of any organization. The active role they play towards a company’s success cannot be underestimated. As a result, equipping these unique assets through effective training comes imperative in order to maximize the job performance. Earlier research on productivity of workers has showed that employees who are satisfied with their job will have higher job performance, and thus supreme job retention, than those who are not happy with their job. (Landy.F.W., 1985) (Asare-Bediko, 2008) Provides a performance (mathematical model) model that must be considered: Performance = ability x motivation.Performance is about employee effort, Employee performance is measured in terms of input-output relationship. Performance is employee’s productivity. For this reason management must address motivation, leadership, communication, work restructuring, payment systems and training and development. Well trained and developed employees when fully utilized by the employing organization benefits it as well the employees themselves. Therefore for an organization to grow and survive in today’s globally competitive and fast changing environment especially in the technology ,for a very long time ,there would be the need for organizations to come up with systems and programs that would bring out the need efforts, attention creativity and general innovations as individual employees and as groups or teams of work (Asare-Bediko, 2008). (Robbinson, 2007) Competent employees do not remain competent forever, skills determine and become obsolete and therefore new skills need to be learned.
2.3 Employee’s satisfactionJob satisfaction refers to an individual’s general attitude towards his or her job. It is a prerequisite for employee performance in any company. Job satisfaction is significant for both the employer and employee. In return it leads to employee commitment, reduced absenteeism and decreased employee turnover. Employee job satisfaction ensures committed staff and stable workforce which reduce cost of recruitment and training.(Greenberg & & Baron, 1995), discuss job satisfaction as constituting an individual’s and evaluative approach to the job.
However, job satisfaction is certainly not the only factor that causes people to produce at
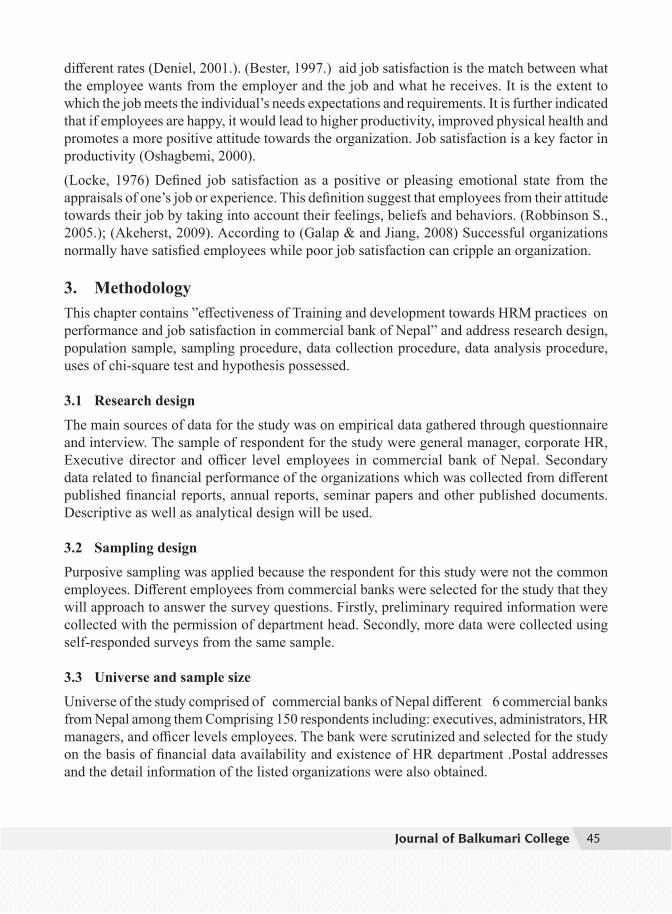
4545Journal of Balkumari College
different rates (Deniel, 2001.). (Bester, 1997.) aid job satisfaction is the match between what the employee wants from the employer and the job and what he receives. It is the extent to which the job meets the individual’s needs expectations and requirements. It is further indicated that if employees are happy, it would lead to higher productivity, improved physical health and promotes a more positive attitude towards the organization. Job satisfaction is a key factor in productivity (Oshagbemi, 2000).
(Locke, 1976) Defined job satisfaction as a positive or pleasing emotional state from the appraisals of one’s job or experience. This definition suggest that employees from their attitude towards their job by taking into account their feelings, beliefs and behaviors. (Robbinson S., 2005.); (Akeherst, 2009). According to (Galap & and Jiang, 2008) Successful organizations normally have satisfied employees while poor job satisfaction can cripple an organization.
3. MethodologyThis chapter contains ”effectiveness of Training and development towards HRM practices on performance and job satisfaction in commercial bank of Nepal” and address research design, population sample, sampling procedure, data collection procedure, data analysis procedure, uses of chi-square test and hypothesis possessed.
3.1 Research design The main sources of data for the study was on empirical data gathered through questionnaire and interview. The sample of respondent for the study were general manager, corporate HR, Executive director and officer level employees in commercial bank of Nepal. Secondary data related to financial performance of the organizations which was collected from different published financial reports, annual reports, seminar papers and other published documents. Descriptive as well as analytical design will be used.
3.2 Sampling design Purposive sampling was applied because the respondent for this study were not the common employees. Different employees from commercial banks were selected for the study that they will approach to answer the survey questions. Firstly, preliminary required information were collected with the permission of department head. Secondly, more data were collected using self-responded surveys from the same sample.
3.3 Universe and sample size
Universe of the study comprised of commercial banks of Nepal different 6 commercial banks from Nepal among them Comprising 150 respondents including: executives, administrators, HR managers, and officer levels employees. The bank were scrutinized and selected for the study on the basis of financial data availability and existence of HR department .Postal addresses and the detail information of the listed organizations were also obtained.

4646 Journal of Balkumari College
3.4 Data collection procedure
For data collection, different commercial bank, HR professionals, Managers administrators, employees were contracted prior to collect responses. Data were collected through personal visit and the questionnaire distributed to the HR managers, executives, administrators and employees, but those bank, where there were no HR department, other departments like administration, management department and employees of concerned bank were taken as the appropriate respondent of the study.
3.5 Data analysis proceduresIn the process of analysis of the data, descriptive statistical correlation and regression analysis were used to analyze the quantitative data. Beside Excel and SPSS were used to perform analysis of data. Qualitative data were manually edited and transcribed in different theme on the basis of study variables. Finally, both qualitative and quantitative data were triangulated to test the hypothesis and for conclusion.
4. Analysis and interpretation of dataThe data and information collected from different HR managers, executives, administrator are presented, interpreted and analyzed, according to research question formulated for this study. For data collection a total of 150 HRM professionals from 6 different banks were contracted but only 125 respondents gave the full information required for the study from the questionnaires. During data collection process, it was observed that a few bank did not have a separate HR department, but other department like administration and management department were taking care of the HRM activities.Returned questionnaires were coded and data entered into excel 2003 and SPSS 16.o.o. As the data was collected through mailed questionnaires there was no possibility for the researcher to ensure that respondents answered all the questions. A small number of questions were not answered in some of the questionnaires.
Table 4.9 Variables included in analyses
Independent Variables1 RS Recruitment & Selection2 TD Training & Development 3 EP Employee performance4 CP Career Planning System5 EP Employees satisfaction6 CS Compensation System
Mediating Variable7 EP Employee Performance
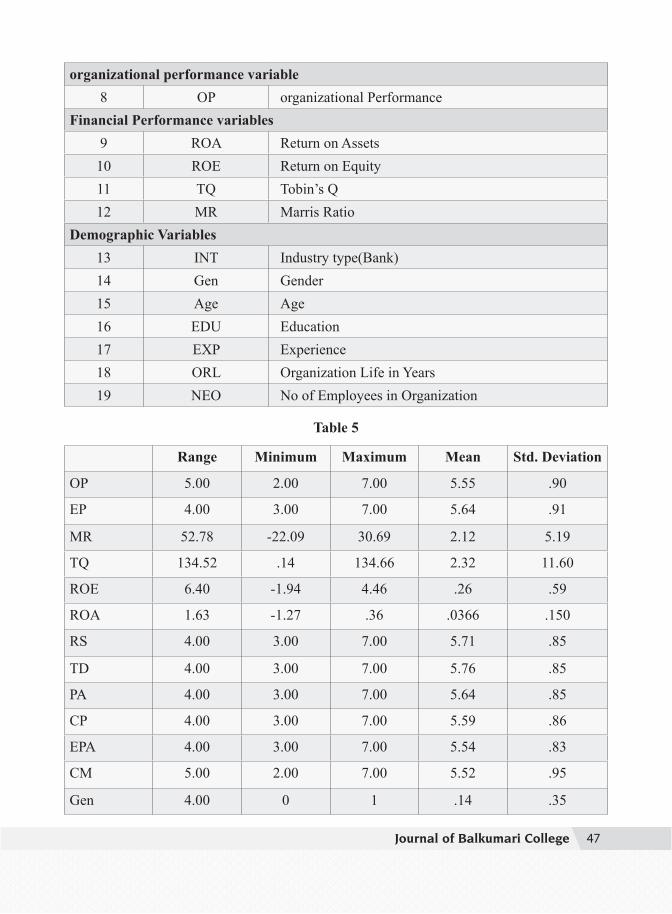
4747Journal of Balkumari College
organizational performance variable8 OP organizational Performance
Financial Performance variables9 ROA Return on Assets10 ROE Return on Equity11 TQ Tobin’s Q12 MR Marris Ratio
Demographic Variables13 INT Industry type(Bank)14 Gen Gender15 Age Age16 EDU Education17 EXP Experience 18 ORL Organization Life in Years19 NEO No of Employees in Organization
Table 5
Range Minimum Maximum Mean Std. Deviation
OP 5.00 2.00 7.00 5.55 .90
EP 4.00 3.00 7.00 5.64 .91
MR 52.78 -22.09 30.69 2.12 5.19
TQ 134.52 .14 134.66 2.32 11.60
ROE 6.40 -1.94 4.46 .26 .59
ROA 1.63 -1.27 .36 .0366 .150
RS 4.00 3.00 7.00 5.71 .85
TD 4.00 3.00 7.00 5.76 .85
PA 4.00 3.00 7.00 5.64 .85
CP 4.00 3.00 7.00 5.59 .86
EPA 4.00 3.00 7.00 5.54 .83
CM 5.00 2.00 7.00 5.52 .95
Gen 4.00 0 1 .14 .35
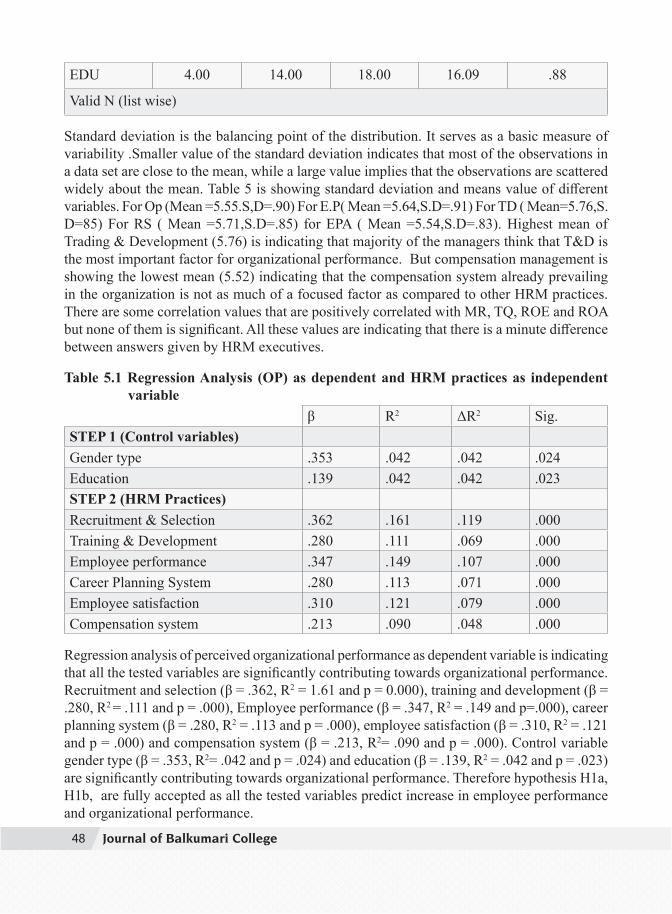
4848 Journal of Balkumari College
EDU 4.00 14.00 18.00 16.09 .88
Valid N (list wise)
Standard deviation is the balancing point of the distribution. It serves as a basic measure of variability .Smaller value of the standard deviation indicates that most of the observations in a data set are close to the mean, while a large value implies that the observations are scattered widely about the mean. Table 5 is showing standard deviation and means value of different variables. For Op (Mean =5.55.S,D=.90) For E.P( Mean =5.64,S.D=.91) For TD ( Mean=5.76,S.D=85) For RS ( Mean =5.71,S.D=.85) for EPA ( Mean =5.54,S.D=.83). Highest mean of Trading & Development (5.76) is indicating that majority of the managers think that T&D is the most important factor for organizational performance. But compensation management is showing the lowest mean (5.52) indicating that the compensation system already prevailing in the organization is not as much of a focused factor as compared to other HRM practices. There are some correlation values that are positively correlated with MR, TQ, ROE and ROA but none of them is significant. All these values are indicating that there is a minute difference between answers given by HRM executives.
Table 5.1 Regression Analysis (OP) as dependent and HRM practices as independent variable
β R2 ΔR2 Sig.STEP 1 (Control variables)Gender type .353 .042 .042 .024Education .139 .042 .042 .023STEP 2 (HRM Practices)Recruitment & Selection .362 .161 .119 .000Training & Development .280 .111 .069 .000Employee performance .347 .149 .107 .000Career Planning System .280 .113 .071 .000Employee satisfaction .310 .121 .079 .000Compensation system .213 .090 .048 .000
Regression analysis of perceived organizational performance as dependent variable is indicating that all the tested variables are significantly contributing towards organizational performance. Recruitment and selection (β = .362, R2 = 1.61 and p = 0.000), training and development (β = .280, R2 = .111 and p = .000), Employee performance (β = .347, R2 = .149 and p=.000), career planning system (β = .280, R2 = .113 and p = .000), employee satisfaction (β = .310, R2 = .121 and p = .000) and compensation system (β = .213, R2= .090 and p = .000). Control variable gender type (β = .353, R2= .042 and p = .024) and education (β = .139, R2 = .042 and p = .023) are significantly contributing towards organizational performance. Therefore hypothesis H1a, H1b, are fully accepted as all the tested variables predict increase in employee performance and organizational performance.
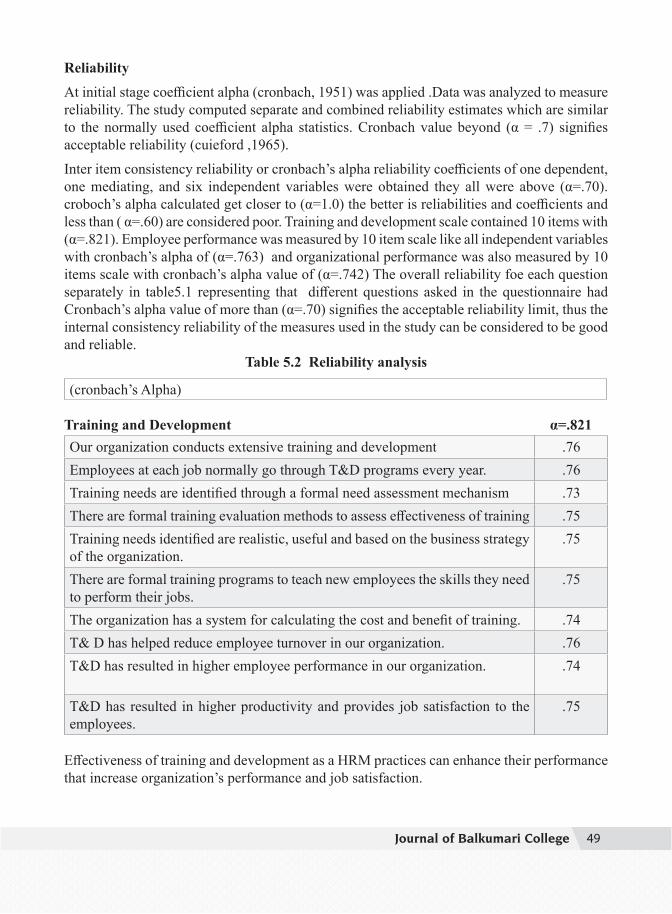
4949Journal of Balkumari College
Reliability
At initial stage coefficient alpha (cronbach, 1951) was applied .Data was analyzed to measure reliability. The study computed separate and combined reliability estimates which are similar to the normally used coefficient alpha statistics. Cronbach value beyond (α = .7) signifies acceptable reliability (cuieford ,1965).
Inter item consistency reliability or cronbach’s alpha reliability coefficients of one dependent, one mediating, and six independent variables were obtained they all were above (α=.70).croboch’s alpha calculated get closer to (α=1.0) the better is reliabilities and coefficients and less than ( α=.60) are considered poor. Training and development scale contained 10 items with (α=.821). Employee performance was measured by 10 item scale like all independent variables with cronbach’s alpha of (α=.763) and organizational performance was also measured by 10 items scale with cronbach’s alpha value of (α=.742) The overall reliability foe each question separately in table5.1 representing that different questions asked in the questionnaire had Cronbach’s alpha value of more than (α=.70) signifies the acceptable reliability limit, thus the internal consistency reliability of the measures used in the study can be considered to be good and reliable.
Table 5.2 Reliability analysis
(cronbach’s Alpha)
Training and Development α=.821Our organization conducts extensive training and development .76Employees at each job normally go through T&D programs every year. .76Training needs are identified through a formal need assessment mechanism .73There are formal training evaluation methods to assess effectiveness of training .75Training needs identified are realistic, useful and based on the business strategy of the organization.
.75
There are formal training programs to teach new employees the skills they need to perform their jobs.
.75
The organization has a system for calculating the cost and benefit of training. .74T& D has helped reduce employee turnover in our organization. .76T&D has resulted in higher employee performance in our organization. .74
T&D has resulted in higher productivity and provides job satisfaction to the employees.
.75
Effectiveness of training and development as a HRM practices can enhance their performance that increase organization’s performance and job satisfaction.
5050 Journal of Balkumari College
5. ConclusionTraining enables the employees to develop their skills within the organization and hence mutually helps to increase the organization’s market value, earning power of the employees and job security of the employees. Training mounds the employee’s attitude and helps them to achieve a better cooperation and develop strong commitment within the organization. Positive correlation with employee’s performance and job satisfaction of the employees. These results were similar to findings of (Russell,et. al 19995,Arthur,1994, Husselid, 1995 patrick,aet,al 2003) their findings supported the argument that training was an extensive activity that enhance employees performance, increased productivity, job satisfaction and helps to maintain good human relationship within organization.
6. Suggestions and recommendations1. This research is indicating that the effect of training and development positively impact
on organizational performance and job satisfaction.2. Commitment is one of the psychological factor of employee, which is essential
to accomplish goals, but it varies situation to situation. Training and development contribute goal accomplishment motivating HRM practices can enhance their performance that increase employee’s relationship and satisfaction.
ReferencesAbasi, S. H. (2000). Turnover : the real bottom line. 'public personnel Management'., vol,2,no.3,pp
333-34.Adams, A. (2003). Mitigating risk,visible hands,inevitable disasters,and soft variables:Management
research that matters to managers. Academy of ManagementExecutive., 17, 46-61.Ahuja, k. (2006). personnel Management.3rd Ed. New Delhi.,India.: Kalyani Publishers.Akeherst, G. (2009). Job satisfaction and commitment in the entrepreneurial SME. Small business
Economics., vol.32, pp. 227-289.Alatrista.J.and Arrowsmith, J. (2003). Managing employee commitment in the not-for-profit sector.
Personnel Review., 33(5), pp.536-548.At., Vol 14,No. 7, pp.1246-1266.Armstrong, M. (1992). a handbook of Human resource management,. New Delhi.: Aditya books
private limited ,p.198.Armstrong, M. (1995). A handbook of Personnel Management practices. London.: Kogan page
Limited.Arthur, J. (1994). Effects of human resource system on manufacturing and turnover. Academy of
management journal., 37,3.670-687.Asare-Bediko, K. (2008). Professional skills in Human resource management.2nd ed. Windy Hills.:
Associate Limited,277.Aziri, B. (2011). Job Satisfaction: A literature review ,management research and practice. Vol.3(4)
pp.77-86.B.Flippo, E. (1984). Personnel management 6th ed. Mc Grawhill.
5151Journal of Balkumari College
Banerj, K. (1981). Evolution of training- a study of supervisory development . Indian journal of Training and development., 11(4) : 150-155.
Barney, J. (1995). Looking inside for competitive advantages. The academy of management Executive .
Beardwell, I. &. (1998). Human Resource management: A contemprorary perspective. New Delhi.: Macmillian India lLimited.
Beardwell, I. c. (2004). Human resource management a contemproary approach. 4th Ed.harlow,prentice Hall.
Becker, T. (1992). Foci and bases of commitment. Are they distinctions woth making? Academy of Management Journal., 35(1), 232-244.
Beer, M. M. (1984). Managing Human Resources. New York.: Free press.Bester, C. &. (1997.). " Prediction of Academics Job satisfaction Level". British Journal of
Educational psychology., 20 (4) ,59-63.Bratton, J. G. (2007.). HRM theory and practice 4th ed.Basing Stoke Buckly, R. a. (2009). The theory and practice of training . 6th edu,Kogan page, London, Philadelphia.Budhwar, P. P. (1997). Evaluating levels of strategic integration and development of human resource
management in India. International journal of human resource management., 8,4,476-494.Campbell, J. (1990.). Modeling the performance prediction problem in industrial and the impact of
HR practices on the performance of business units organizational psychology,In Handbook of Industrial and organizational psychology (2nd ed).M.Dunnette and L.House (eds). Palo,Alto,C.A.:consulting psychologists press.
Carrell, R. N. (1989). Personnel: Human resource management. help.org/index.html.Cascio, W. (1992). Managing Human Resources:Productivity,Quality of work life,Profits. Mc Graw
-Hills Inc.Cole, G. (2004 ). Management theory and practice.6th ed. Thomson Learning.D.Shaw., D. G. (2001). voluntary turnover ,social capital and organizational performance. Academy
of management Review., 26(3); 446-456.Dany, F. (1994). Recruitment and selection in Europe:policies ,practices and methods,.
Inc:Brewstenand A.Hegewisch(eds.) .Policy and practicesin European Human resource Management: The price 213.
Deniel, B. (2001.). The welness payoff. New York:Wiley.Dessler, G. (2008). Human Resource management ,11th ed. pearson Dotra, J. &. (1992). tailoring human resources to a company's need. modern management., 9(3/4),16-
21.Ford, B. &. (1988). Transfer of training : A review and directions for futurer research . In personnel
psychology (pp. 41,63-105).Galap, S., & and Jiang, J. (2008). The impact of job characteristics on is employee satisfaction. A
comparison between permanent and temporary employees.Journal of computer information system., Vol.48,No 4,pp.58- 68.
Gallie, D. W. (1993). Employee commitment and the skills Revolution. London.: PSI publishing.Gorden, B. (1992). are canadian firmsunder investing in training? Canadian business economics,
1,1-25-33.Graham, H. (1978.). Human resource Management.,2nd ed. Plymouth:McDonald &Evans.

5252 Journal of Balkumari College
Guest, D. (1997). Human resource management and industrial relations. Journal of management studies., 24,5,503-521.
Guest.D. (1995). Human Resource management. Routeledge, London.Guest.D.E.Michie, M. &. (2oooc). Getting inside the HRM performancerelationship. papaer
presented to the academy of management conference. Toronto.Hesketh, A. a. (2006). Beyond Measuring the human resources management-organizational
performance Link. Applying critical realistic Meta-theory ,organization, 12(5),677-699.Huse, E. p. (1975 ). Trainees attributes: Neglected Influence on Training effectiveness,. Organizational
develoment and change., academy of management journal. 11(4) ,pp 736-749.Huselid, m. A. (1995). The impact of human resource practices on turnover,productivity and corporate
financial performance. Academy of management Journal., 3 :635-672.Ichnniowski¸C., S. P. (1997). The effects of Human resource practices on productivity: a study of
steel finishing lines,. Anercian Economic review., 87,3,291-313.Iverson, R. B. (1999.). Affective,normative and continuance commitment . Can the "right kind" of
commitment be managed?Journal of management studies., 36(3), 307-333.Kirkpatrick. (1998). Evaluating Training program:Four levels.In the hidden power of KripatrickD.
four levels. Sanfranscisco: Berette Koehler.Kirkpatrik, D. (1998). Evaluating training program at four levels: in the hidden power of Kirkpatrik's.
In In the hidden power of kirpatrik's four levels,T-D, (pp. pp 34-37). sanfrancisco:Berette kaehler.
Landy.F.W. (1985). The psychology of work behavior.3rd ed. Homewood.: IL; Dorseey press.Locke, E. (1976). The nature and causes of job satisfaction ,In M.D.Dunnettee(ed.). Handbook of
international and organizational psychology., p.p.1297-1349.Chicago,IL :RandMcnally.Lum, L. (2006.). Expalaining nursing Turnover Intent. Job satisfaction on organizational
commitment. Journal of organizational behavior., Pfeffer, J., & and Veiga, F. (1999). Putting people first for organizational success. Academy of
management Executive., 13(2): 37-48.pfeffer.J. (1998). The human equation: Buliding profits by putting people first. Boston.: Harvard
Business school Press.Piper, R. (1990). Human resource management:an international comparison. Berlin.: Walter De
Gruyten.Porter, L., Steers, R., Mowday, R., & & Boulian, P. (1974). organizational commitment ,Job
satisfaction and turnover among Psychiatric technicians. Journal of Applied Psychology ,Developing socities., 59(5), 603-609.
Poulet, R. (2008). Training process effectiveness. Journal of industrial and commercial Training., vol,18(1) pp.10-13.
Purcell, J. (2003). Understudying the people and performance link. Taylor, D. (1996). "Training and developing people"In Molander c."Human resource at work".
London: Chartwell Bratt.Tsui, A. (1987). defining the activities and effectiveness of the human resource development. A
multiple constituency approach., Human ULrich, D. (1987). organizational capability as a competitive advantage. Human resource
professionals as a strategic partners., Human resource planning,10,4,169-84.Ulrich.er, R. (1998). Delivering HR with an attitudes. HR magazine., 43(7).-154-160.
5353Journal of Balkumari College
AbstractThis research works intends to Extrinsic Motivation Audit in Balkumari College: A Study of Employees Satisfaction. The study covered randomly selected employees from BKC. A structured questionnaire was used in gathering of relevant data from the BKC. 82 questionnaires were filled and returned by the respondents out of distributed 125. The participants were drawn randomly from different departments and administration. The selection was done in such a way that it included all categories of employees (Senior and Junior with academic and nonacademic staff) and cut across the gender, job category. The result reveals that independent variables (retirement benefit, promotion, working environment, salary increment, suitable piece rate payment and job security) are the major factors that motivated job satisfaction significantly in BKC. The study also reveals that variables have positive influence on job satisfaction with R2 = 86% and the null hypothesis is rejected and verified the model: JS = β0 + β1 X1 + β2 X2+ β3 X3 + β4 X4 + β5 X5 + β6 X6 + ∈.
Key words: Retirement benefit, Promotion, Working environment, Salary increment, Suitable piece rate payment, Job security and Job satisfaction.
IntroductionBalkumari College is one of the leading college, established on 18th September 1986 (2nd Aswin 2043) (Policy and Acts of Balkumari College, 2010) in active participation of education lovers of Chitwan, imparting education at the University level in Nepal. She is affiliated to Tribhuvan University and she has been awarded with Quality Assurance & Accreditation (QAA) certification by Quality Assurance & Accreditation Committee of University Grants Commission Nepal (UGC, 2011). She contains six academic program with 140+ human recourses and 3500 + students. She has many strategic plans to meet her goals, and one of them is extrinsic motivation.
Extrinsic motivation (Deci, 1999) refers to the performance of an activity in order to attain a desired outcome. Extrinsic motivation comes from influences outside of the individual. In extrinsic motivation, the harder question to answer is where do people get the motivation to carry out and continue to push with persistence. Usually extrinsic motivation is used to attain outcomes that a person wouldn't get from intrinsic motivation. It helps to fulfill individual basic needs. Common extrinsic motivations are rewards such as money, fame, promotion,
Extrinsic Motivation Audit in Balkumari College: A Study of Employees Satisfaction
Mr. Ramesh Khanal Mrs. Radhika Sigdel Faculty of Applied Mathematics Faculty of Finance Management Balkumari College, Narayangarh Balkumari College, Narayangarh
5454 Journal of Balkumari College
grades, praise, pension, bonus, job security, good working environment, supportive supervision, holidays, pay leaves and fringe benefit for showing the desired behavior, and the threat of punishment following misbehavior. Competition is an extrinsic motivator because it encourages the performer to win and to beat others, not simply to enjoy the intrinsic rewards of the activity. A cheering crowd and the desire to win a trophy are also extrinsic incentives (S.R & G.M, 2015).
In combination with job satisfaction, extrinsic motivation is closely related to employee turnover and change of career. (Chi, 2013). The overall aim of this study is to explore extrinsic motivation audit and job satisfaction. At first, the study focusing on extrinsic motivational factors amongst employees and secondly how extrinsic motivational factors can influence their decision to change teaching learning activity. A structured questionnaire was used in gathering of relevant data from the BKC. 82 questionnaires were filled and returned by the respondents out of distributed 125. The participants were drawn randomly from different departments and administration.
According to (Chia, 2003) a large part of audit research has focused on qualified employees, their work and the characteristics required for and by their profession, and there is a need for more research focusing on employees. Hence, in the first study we develop a better understanding of what factors that can explain why employees choose to leave and unmotivated or leave before taking their job. In the second study we include employee’s at all different levels (paean to principal) and we focus on their perception of motivation. This study contributes to the literature on motivation, by exploring motivation in professional service firms, which is a less researched.
Literature ReviewKnowledge about what extrinsic motivates professors are crucial for the teaching profession. To be able to provide high quality teaching learning activates, Colleges need to motivate and retain qualified staff with solid expertise. The literature on motivation emphasize that motivated employees have greater organizational commitment, greater psychological well-being and are also more productive (Hall, 2009). Suhaiel Amdan and his team said that there was a significant positive, and strong relationship between office environment and organizational commitment (Amdanb, Rahmanb, Shahida, Bakara, & Demongb, 2016). They also added that most influenced dimension of office environment for organizational commitment was workstation setting. However, extrinsic motivation failed to moderate the relationship between office environment and organizational commitment. (Maharjan, 2012) Colleges should motivate the teachers for their job satisfaction in order to enhance the performance of the organizations and she concluded that there is a positive association between work motivation and job satisfaction of teachers. Arjun and Ajaya attempted to investigate the instrumentality and generalizability of public service motivation (PSM) instrument developed by Perry (Perry, 1996) in Nepali context and they also examined the interactive effect of perceptions of organizational politics (POP) and different dimensions of PSM on Nepali civil service employees’ organizational commitment. Their results revealed that PSM exists in Nepali context but all the dimensions are not reproduced. POP moderated the relationship between self-sacrifice dimension of PSM and employees’ organizational commitment (Mishra1, 2015). Firm performance increases as workers’ job satisfaction increases (Gumussoy, 2007). Therefore, firms have a great interest in identifying the determinants of job satisfaction. Calisir and Gumussoy added that demographic
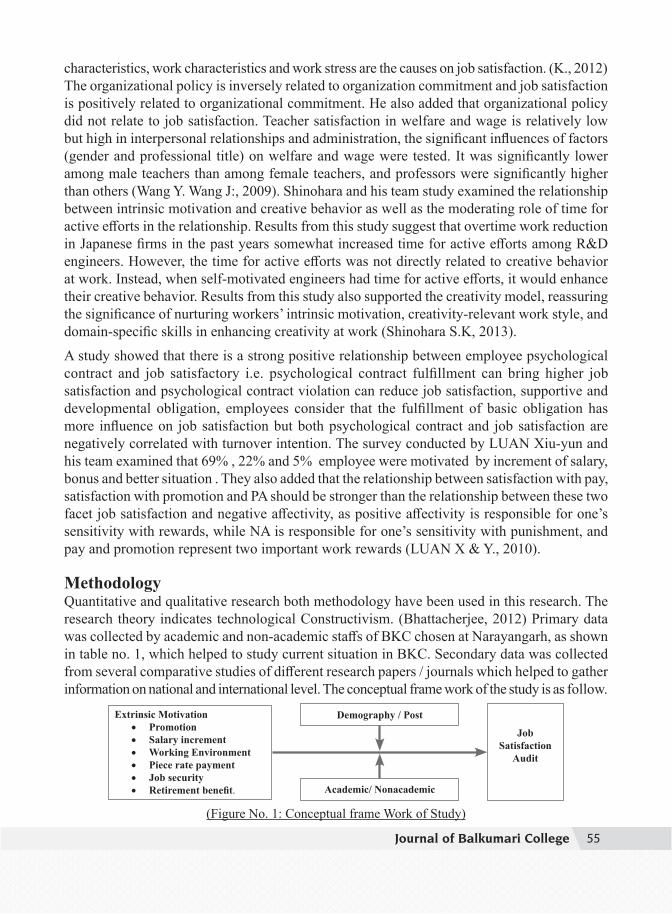
5555Journal of Balkumari College
characteristics, work characteristics and work stress are the causes on job satisfaction. (K., 2012)The organizational policy is inversely related to organization commitment and job satisfaction is positively related to organizational commitment. He also added that organizational policy did not relate to job satisfaction. Teacher satisfaction in welfare and wage is relatively low but high in interpersonal relationships and administration, the significant influences of factors (gender and professional title) on welfare and wage were tested. It was significantly lower among male teachers than among female teachers, and professors were significantly higher than others (Wang Y. Wang J:, 2009). Shinohara and his team study examined the relationship between intrinsic motivation and creative behavior as well as the moderating role of time for active efforts in the relationship. Results from this study suggest that overtime work reduction in Japanese firms in the past years somewhat increased time for active efforts among R&D engineers. However, the time for active efforts was not directly related to creative behavior at work. Instead, when self-motivated engineers had time for active efforts, it would enhance their creative behavior. Results from this study also supported the creativity model, reassuring the significance of nurturing workers’ intrinsic motivation, creativity-relevant work style, and domain-specific skills in enhancing creativity at work (Shinohara S.K, 2013). A study showed that there is a strong positive relationship between employee psychological contract and job satisfactory i.e. psychological contract fulfillment can bring higher job satisfaction and psychological contract violation can reduce job satisfaction, supportive and developmental obligation, employees consider that the fulfillment of basic obligation has more influence on job satisfaction but both psychological contract and job satisfaction are negatively correlated with turnover intention. The survey conducted by LUAN Xiu-yun and his team examined that 69% , 22% and 5% employee were motivated by increment of salary, bonus and better situation . They also added that the relationship between satisfaction with pay, satisfaction with promotion and PA should be stronger than the relationship between these two facet job satisfaction and negative affectivity, as positive affectivity is responsible for one’s sensitivity with rewards, while NA is responsible for one’s sensitivity with punishment, and pay and promotion represent two important work rewards (LUAN X & Y., 2010).
MethodologyQuantitative and qualitative research both methodology have been used in this research. The research theory indicates technological Constructivism. (Bhattacherjee, 2012) Primary data was collected by academic and non-academic staffs of BKC chosen at Narayangarh, as shown in table no. 1, which helped to study current situation in BKC. Secondary data was collected from several comparative studies of different research papers / journals which helped to gather information on national and international level. The conceptual frame work of the study is as follow.
Extrinsic Motivation• Promotion• Salary increment• Working Environment• Piece rate payment• Job security• Retirement benefit.
Demography / Post
Academic/ Nonacademic
Job Satisfaction
Audit
(Figure No. 1: Conceptual frame Work of Study)
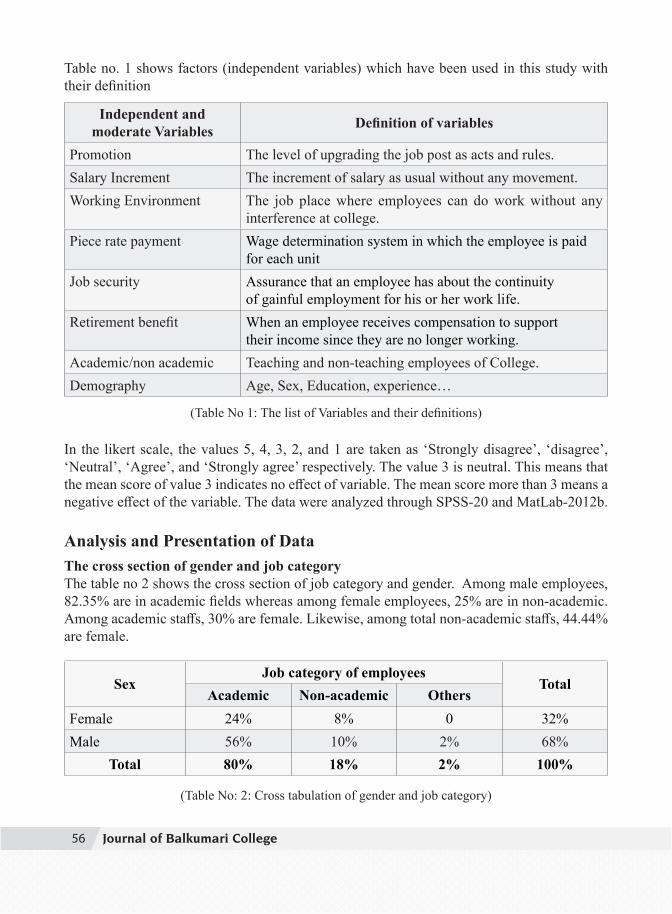
5656 Journal of Balkumari College
Table no. 1 shows factors (independent variables) which have been used in this study with their definition
Independent and moderate Variables Definition of variables
Promotion The level of upgrading the job post as acts and rules.Salary Increment The increment of salary as usual without any movement.Working Environment The job place where employees can do work without any
interference at college.Piece rate payment Wage determination system in which the employee is paid
for each unit Job security Assurance that an employee has about the continuity
of gainful employment for his or her work life. Retirement benefit When an employee receives compensation to support
their income since they are no longer working.Academic/non academic Teaching and non-teaching employees of College.Demography Age, Sex, Education, experience…
(Table No 1: The list of Variables and their definitions)
In the likert scale, the values 5, 4, 3, 2, and 1 are taken as ‘Strongly disagree’, ‘disagree’, ‘Neutral’, ‘Agree’, and ‘Strongly agree’ respectively. The value 3 is neutral. This means that the mean score of value 3 indicates no effect of variable. The mean score more than 3 means a negative effect of the variable. The data were analyzed through SPSS-20 and MatLab-2012b.
Analysis and Presentation of DataThe cross section of gender and job category The table no 2 shows the cross section of job category and gender. Among male employees, 82.35% are in academic fields whereas among female employees, 25% are in non-academic. Among academic staffs, 30% are female. Likewise, among total non-academic staffs, 44.44% are female.
SexJob category of employees
TotalAcademic Non-academic Others
Female 24% 8% 0 32%Male 56% 10% 2% 68%
Total 80% 18% 2% 100%
(Table No: 2: Cross tabulation of gender and job category)
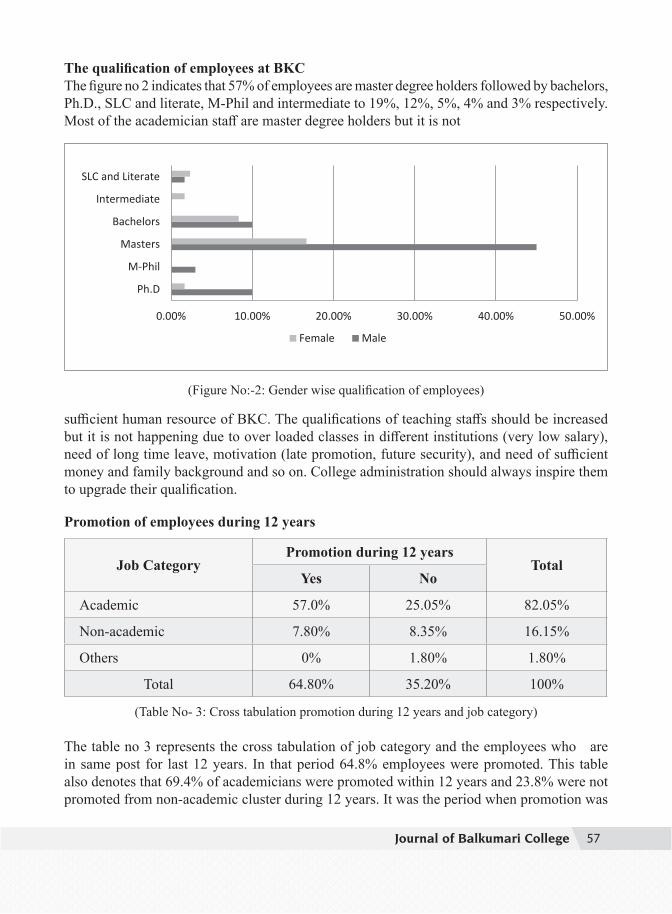
5757Journal of Balkumari College
The qualification of employees at BKCThe figure no 2 indicates that 57% of employees are master degree holders followed by bachelors, Ph.D., SLC and literate, M-Phil and intermediate to 19%, 12%, 5%, 4% and 3% respectively. Most of the academician staff are master degree holders but it is not
0.00% 10.00% 20.00% 30.00% 40.00% 50.00%
Ph.D
M-Phil
Masters
Bachelors
Intermediate
SLC and Literate
Female Male
(Figure No:-2: Gender wise qualification of employees)
sufficient human resource of BKC. The qualifications of teaching staffs should be increased but it is not happening due to over loaded classes in different institutions (very low salary), need of long time leave, motivation (late promotion, future security), and need of sufficient money and family background and so on. College administration should always inspire them to upgrade their qualification.
Promotion of employees during 12 years
Job CategoryPromotion during 12 years
TotalYes No
Academic 57.0% 25.05% 82.05%
Non-academic 7.80% 8.35% 16.15%
Others 0% 1.80% 1.80%
Total 64.80% 35.20% 100%
(Table No- 3: Cross tabulation promotion during 12 years and job category)
The table no 3 represents the cross tabulation of job category and the employees who are in same post for last 12 years. In that period 64.8% employees were promoted. This table also denotes that 69.4% of academicians were promoted within 12 years and 23.8% were not promoted from non-academic cluster during 12 years. It was the period when promotion was

5858 Journal of Balkumari College
to be given twice (Policy and Acts of Balkumari College, 2010) (JBRH, 2014) . The main cause of this issue are: clash between management committees and administration, political groupism between teachers and flattering of management committees and administration. Moreover, most of the academic and non-academic staffs are not responsible to their duties (JBRH, 2014).
Attitude toward implementation of extrinsic motivationTable no 4 represents that all most all respondents have negative attitude towards implementation of extrinsic motivation attitude at BKC.
Variables SA % A % N % DA % SDA % MeanPromotion in time 1.2 26.7 16.7 13.7 41.7 3.67Salary Increment without pressure 6.8 13.3 18.3 23.3 38.3 3.73Suitable working environment 8.3 28.3 31.7 15. 16.7 2.8Suitable piece rate payment 21.6 16.7 11.7 20.0 30.0 3.2Best job security to future 11.7 13.3 33.3 13.3 28.4 3.82Best retirement benefit 35. 21.7 21.7 6.6 15. 2.45
(Table No- 4: Attitude toward implementation of extrinsic motivation)
After change in political scenario, students leader of this College are allegedly involved in frequent vandalization destruction of College properties (JBRH, 2014) (BKC, 2016), disrespect to professors staff along with threating them for physical assaults, obstacle in administration , account and exam sections all of which has demoralized and demotivated the teaching faculties and administrative staffs as the management committee and administration have become completely failure or reluctant to react on such idiosyncratic activities and to take rigid actions against such culprit students and students leaders. At the same time, the meeting of management committee has not been held regular and decisions not made due to some pretension of responsible committee members including their religious program and health treatment outside the nation (JBRH, 2014). So, we urge that like other Universities and Colleges, the chairman of management committee should be foresighted, bold academic high profile and non-corrupted figure.
Relation between dependent and independent variablesTable 5 shows the degree of relationship between independent and dependent variables. It reveals the significance of extrinsic motivation factors on job satisfaction. Among the 6 extrinsic motivation factors, p-values of all factors except “Job security condition” and “Piece rate payment” are greater than 0.05, which are not significant and other 4 are significant at 5 percent level of significance with all independent variables positively correlated to dependent variables. It indicates that the employees are motivated with those factor. The correlation of “Job security” and “Piece rate payment” is 0.25 and 0.06 respectively which are insignificant at 5%. This means that these factors affect the employees’ extrinsic motivation insignificantly.
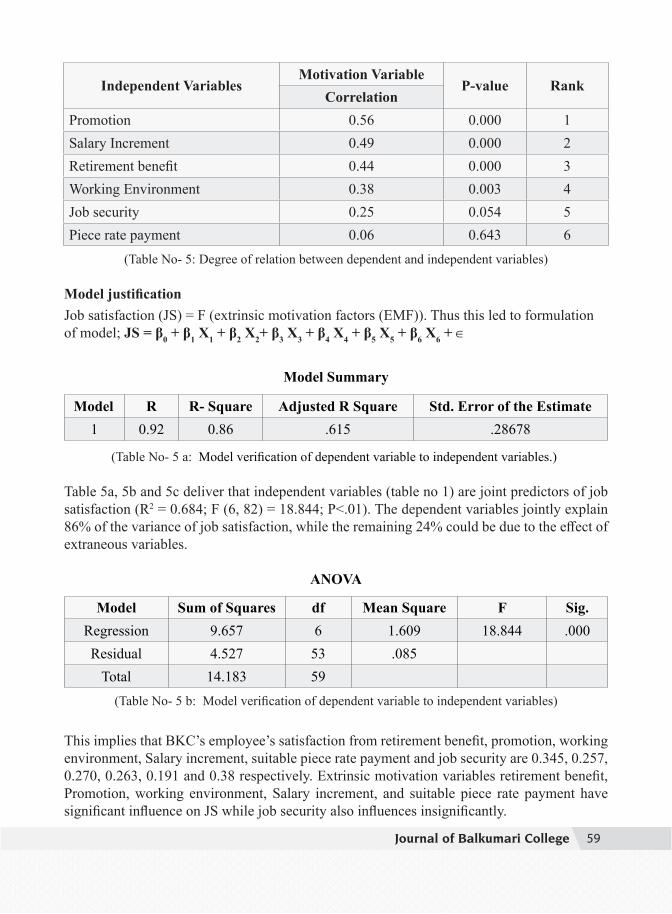
5959Journal of Balkumari College
Independent VariablesMotivation Variable
P-value RankCorrelation
Promotion 0.56 0.000 1Salary Increment 0.49 0.000 2Retirement benefit 0.44 0.000 3Working Environment 0.38 0.003 4Job security 0.25 0.054 5Piece rate payment 0.06 0.643 6
(Table No- 5: Degree of relation between dependent and independent variables)
Model justificationJob satisfaction (JS) = F (extrinsic motivation factors (EMF)). Thus this led to formulation of model; JS = β0 + β1 X1 + β2 X2+ β3 X3 + β4 X4 + β5 X5 + β6 X6 + ∈
Model Summary
Model R R- Square Adjusted R Square Std. Error of the Estimate1 0.92 0.86 .615 .28678
(Table No- 5 a: Model verification of dependent variable to independent variables.)
Table 5a, 5b and 5c deliver that independent variables (table no 1) are joint predictors of job satisfaction (R2 = 0.684; F (6, 82) = 18.844; P<.01). The dependent variables jointly explain 86% of the variance of job satisfaction, while the remaining 24% could be due to the effect of extraneous variables.
ANOVA
Model Sum of Squares df Mean Square F Sig.Regression 9.657 6 1.609 18.844 .000Residual 4.527 53 .085
Total 14.183 59(Table No- 5 b: Model verification of dependent variable to independent variables)
This implies that BKC’s employee’s satisfaction from retirement benefit, promotion, working environment, Salary increment, suitable piece rate payment and job security are 0.345, 0.257, 0.270, 0.263, 0.191 and 0.38 respectively. Extrinsic motivation variables retirement benefit, Promotion, working environment, Salary increment, and suitable piece rate payment have significant influence on JS while job security also influences insignificantly.
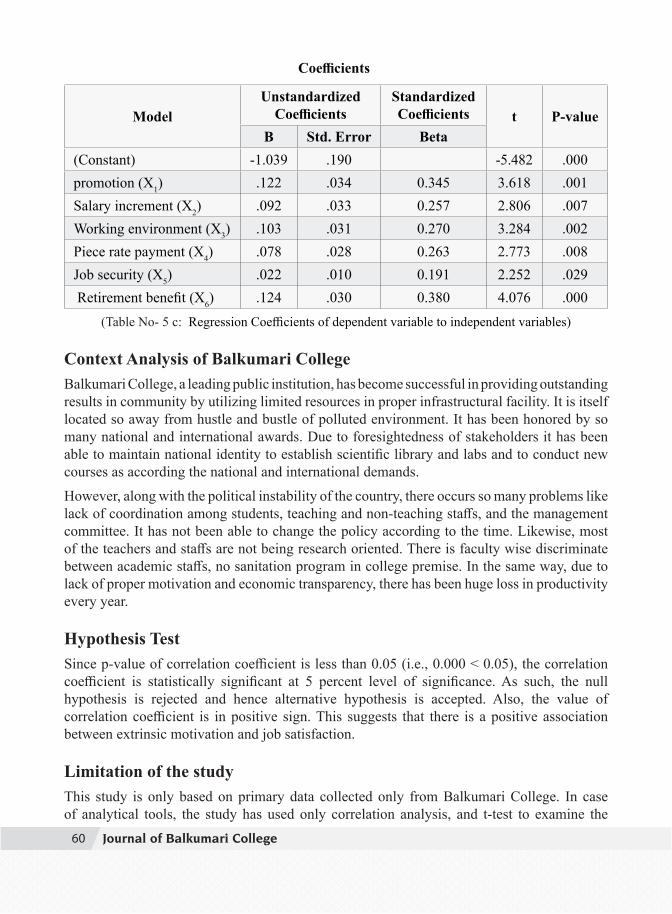
6060 Journal of Balkumari College
Coefficients
ModelUnstandardized
Coefficients Standardized Coefficients t P-value
B Std. Error Beta(Constant) -1.039 .190 -5.482 .000promotion (X1) .122 .034 0.345 3.618 .001Salary increment (X2) .092 .033 0.257 2.806 .007Working environment (X3) .103 .031 0.270 3.284 .002Piece rate payment (X4) .078 .028 0.263 2.773 .008Job security (X5) .022 .010 0.191 2.252 .029 Retirement benefit (X6) .124 .030 0.380 4.076 .000
(Table No- 5 c: Regression Coefficients of dependent variable to independent variables)
Context Analysis of Balkumari CollegeBalkumari College, a leading public institution, has become successful in providing outstanding results in community by utilizing limited resources in proper infrastructural facility. It is itself located so away from hustle and bustle of polluted environment. It has been honored by so many national and international awards. Due to foresightedness of stakeholders it has been able to maintain national identity to establish scientific library and labs and to conduct new courses as according the national and international demands. However, along with the political instability of the country, there occurs so many problems like lack of coordination among students, teaching and non-teaching staffs, and the management committee. It has not been able to change the policy according to the time. Likewise, most of the teachers and staffs are not being research oriented. There is faculty wise discriminate between academic staffs, no sanitation program in college premise. In the same way, due to lack of proper motivation and economic transparency, there has been huge loss in productivity every year. Hypothesis TestSince p-value of correlation coefficient is less than 0.05 (i.e., 0.000 < 0.05), the correlation coefficient is statistically significant at 5 percent level of significance. As such, the null hypothesis is rejected and hence alternative hypothesis is accepted. Also, the value of correlation coefficient is in positive sign. This suggests that there is a positive association between extrinsic motivation and job satisfaction.
Limitation of the studyThis study is only based on primary data collected only from Balkumari College. In case of analytical tools, the study has used only correlation analysis, and t-test to examine the
6161Journal of Balkumari College
relationship between extrinsic motivation and the job satisfaction of employees. The study results could have some limitations due to the limited analytical tools used and limited time.
Conclusion and RecommendationsThis research work intends to Extrinsic Motivation Audit in Balkumari College: A study of Employee’s Satisfaction. The participants were drawn randomly from different departments and administration. The selection was done in such a way that it included all categories of employees (Senior and Junior with academic and nonacademic staff) and cut across the gender, job category. The result reveals that independent variables (extrinsic motivation: retirement benefit, promotion, working environment, salary increment, suitable piece rate payment and job security) are the major factors that enhance job satisfaction significantly in BKC. The study also reveals that variables have positive influence on job satisfaction and the null hypothesis is rejected and verified the model: JS = β0 + β1 X1 + β2 X2+ β3 X3 + β4 X4 + β5 X5 + β6 X6 + ∈.
It is recommended that 1. The administration and management committee should implement these extrinsic
motivation factors. Regular trainings, seminars and workshops are essential to upgrade the skills of teachers and staffs with intrinsic motivation.
2. The management committee should formulate the Human Resource Development Cell (HRDC) to develop the human resources and right man right post policy with shift lock (JBRH, 2014).
3. In order to uplift the college situation from every aspect, it should reformulate essential laws and policies (JBRH, 2014) that unify all teachers, staff, students and stakeholders.
4. We should take strong initiation to give the best result of the students. BKC should run regular survey to measure expectation and satisfaction of stakeholders for immediate implementation of the results.
5. The management committee should be reformed at most three year duration whose chairman should be foresighted, bold academic high profile and non-corrupted figure (JBRH, 2014).
BibliographyAmdanb, S., Rahmanb, R. A., Shahida, S. A., Bakara, S. A., & Demongb, M. M. (2016). The
Role of Extrinsic Motivation on the Relationship between Office Environment and Organisational Commitment. Procedia Economics and Finance, 164-169.
Bhattacherjee, A. (2012). Social Science Research: Principles Methods, and Practices (Vol. 3). USF Open Access Textbooks Collection.
Chi, W. H.-J. (2013). Determinants of audit staff turnover: Evidence from Taiwan. International Journal of Auditing., 17, 100-112.
Chia, Y. M. (2003). Managerial Auditing Journal,. Managerial Auditing Journal,18(2), 100-111.
6262 Journal of Balkumari College
Deci, R. M. (1999). Intrinsic and Extrinsic Motivations: Classic Definitions and New Directions (Vol. 25). Contemporary Educational Psychology. doi:10.1006/ceps.1999.1020.
G.C., W. (2013). Sampling Techniques. Wiley.Gumussoy, F. C. (2007). DETERMINANTS OF JOB SATISFACTION IN THE IT INDUSTRY.
Proceedings of the 2007 IEEE IEEM.Hall, M. &. (2009). Mentoring and turnover intentions in public accounting firms: A research
note. Accounting. Organizations and Societ, 34, : 695-704.JBRH, C. a. (2070). Management audit Report of Balkumari College. K., s. (2012). Relation Between organizational policies, Job Satiafaction and organizational
Commitment in University Techologo MARA SAAWAK. Business, Engineering & Industrial Applications Colloquium, 377-382.
LUAN X, Z. Q., & Y., Z. (2010). Validity of Job Satisfaction Survey Scale in Chinese. International Conference on Management Science & Engineering, 1008-1013. doi: 10.1109/ICMSE.2010.5719922
Maharjan, S. (2012). Association between Work Motivation and Job Satisfaction of College Teachers. Administrative and Management Review, 24(2), 45-55.
Masrom, H. T. (2009, June 22-25,). An Examination of Smart Card Technology Acceptance Using Adoption. 31st Int. Conf. on Information Technology Interfaces,, 329-334.
Mishra1, A. K. (2015). Interactive Effects of Public Service Motivation and Organizational Politics on Nepali Civil Service Employees Organizational Commitment. Business Perspectives Research, 3(1), 31-35. doi:0.1177/2278533714551862
Perry, J. L. (1996). Perry, J. L. (1996). Measuring public service motivation: An assessment of construct reliability and validity,Journal of Administration Research & Theory, 6(1),5-22.
Policy and Acts of Balkumari College (Vol. 2). (2010). Narayangarh.R, P. S., & G.M., P. (2015). Foundations of Human Resource Management. Kathmandu: Kriti
Books Publishire and Distributors Pvt.Ltd.R.D, N., & s., H. (2011). Applied Regression Analysis (Vol. 3). Wiley.Richard I.Leven, D. S. (2010). Statistic for Management (Vol. 7). Pearson.S.R, P., & G.M, P. (2015). Foundations of Human Resource Management. Kathmandu: Kriti
Books Publishers and Distributors Pvt. Ltd.Shinohara S.K, F. T. (2013). Intrinsic Motivation and Creative Behavior: Moderating Role of
Active Efforts. Proceedings of the 2013 , 39-42. doi:10.1109/IEEM.2013.6962370UGC. (2011). Retrieved from http://www.ugcnepal.edu.np/page-detail/qaa-accreditedWang Y. Wang J:, M. L. (2009). An Empirical Research on Teacher Job satisfaction of
Universities in China. IEEE Conference Publications. doi: 10.1109/CISE.2009.5367000Zhu X., L. Y. (2010). A Study on Psychological Contract, Job Satisfaction and Turnover Intention
in Banking Industry. The 2nd International Conference on Information Science and Engineering, 2575 - 2578. doi:10.1109/ICISE.2010.5691029

6363Journal of Balkumari College
AbstractIn general- leadership is a social process in which a member of a group or organization influence the interpretation of internal and external events, the choice of goals or desired outcomes. It is Highly romanticized, emotional and courageous images. It is related to organization of work, activities, individual motivation and abilities, power relations nad shared orientation. Leadership comprises both rational and emotional element. It adds to know yourself and seek self-improvement and needs technically proficient. It seeks responsibility and take responsibility for the actions to make sound and timely decisions so tht we can set the examples in society and organizations. It should help to know people and look out for their well-being so that leader can keep people informed. Leadership should develop a sense of accountability, ownership and responsibility to ensure that tasks are understood, supervised, and accomplished and to train people as a team. Educational Leadership borrows its fundamental concepts about the structure and coordination of schools/colleges, rules and regulation within a school/colleges. So it adapts the terms such as quality, productivity, efficiency and the strategies.Slater (1995) declares that educational leadership is rooted in sociology and has four paradigms:Structural FunctionalistPerspectives, Politico-conflict Perspectives, Constructivist Perspectives and Critical Humanist Perspectives. It is also called as paradigmatic perspectives but some scholar has criticized framework thinking and proposed for leadership contexts as Categorical, Interpretive and Relational .
IntroductionLeadership is that quality of leader by which they get success individually and make the organization more successful to achieve the goal. Leadership is a social influence process that is comprised of both rational & emotional elements. Where personality, motivation & skill traits appear to be systematically related to leadership to schools. The critical situational factors in educational leadership are environment, leader roles, nature of sub-ordinates & characteristics of the organization. Leadership is itself a difficult & challenging part of management. The function & status of an organization is heavily dependent upon leadership. The leader can only be successful who would be success to balance internal, intermediate and external factors. Power is the capacity or potential to influence. Personal power is the influence capacity a leader derives from being seen by followers as likeable and knowledgeable. There are many traits, qualities and styles of leadership. The perspective of leadership is based on theoretical background.
Perspectives on Leadership: A study of leadership on its theory and practice
Ananta Dhungana PhD Scholar, Singhania University, Rajasthan, India
6464 Journal of Balkumari College
Some leadership theory based on structure and the system within the structure is structural functionalist approach of leadership. Some approach based on Marxism or conflict which supports the conflict by class on their own political background is considered as politico conflict perspectives of leadership. The next approach is that which stands on new idea, generation of new opinion and against elite approach is constructivist approach of leadership. The democratic approach which gives dignity to the person, reduce human sufferings, and enhance human well-being is related to critical humanistic perspectives of leadership. It is based on human suffering and compassion. Besides these perspectives of leadership, we can find different philosophy of leadeership but structural functionalist, Structural Functional Perspectives & leadership, Politico Conflict Perspectives & leadership, Constructist Perspectives & leadership, Critical Humanist Perspectives & leadership are more in practice.
Key words: Structural Functional Perspectives & leadership, Politico Conflict Perspectives & leadership, Constructist Perspectives & leadership, Critical Humanist Perspectives & leadership, organizational structure, Educational leadership, leadership by management.
ObjectivesThe objectives of the article is to introduce the different types of perspectives on leadership as below:
• Structural Functional Perspectives & leadership• Politico Conflict Perspectives & leadership• Constructist Perspectives& leadership• Critical Humanist Perspectives& leadership
Structural Functionalist Perspective & leadershipLeadership comprises a set of measurable skills. Science can lead us to explore leadership and improve understanding about its work and performance. It Believes in the existence of a single reality, a nature which can be discovered and analyzed in terms of its parts and working relationships (Bolman,1994) . Following Louis Althusser's concept of structure that society as a structured whole is a combination of rationally organized autonomous units or levels that essentially energize organization to achieve its objectives. A change even in one unit or level disturbs the total functioning of the structure because each unit or level is functionally connected with each other. A leader in an organizational is required to take pro-active initiative to restore the organizational structure as per the changed context. Changes in the structure may be caused by external and/ or internal forces A functionalist leader rather pays attention to ensuring that each unit within an organization functions without any obstruction. In case obstruction happens the leader has to diagnose what problems disturbed the functioning of the structure and subsequently mitigate the problems with compatible leadership strategies.
Structural Functionalist theory implies that society tends to be an organized, stable and well-
6565Journal of Balkumari College
integrated system in which each part of the society contributes to the functioning of the society as a whole.Society as a system of interrelated parts.Each group or institution persists because it is functional and associated with the work of American sociologists such as Talcott Parson, Robert K. Merton and Kingsley Davis( Rao, 2006). Structural functionalism is a perspective used to analyze societies and their component features that focuses on their mutual integration and interconnection. Social structures are placed at the center of analysis, and social functions are deduced from these structures. Structural functionalism implies that social institutions, collectively forming a social structure, function to maintain the harmony of the social whole. SF perspective is based on variety of core assumptions:
• Organizations exit to achieve established goals• Structure stipulates that people focus on getting the job done rather than doing what
they please.• Coordination and control are important for organizational effectiveness.• SF leaders value analysis and data, focus on lower levels, set clear directions, hold
people responsible for results and attempt to solve problem through restructuring (Bolman & Deal, 1994)
Society as a structured whole consisting of relatively autonomous levels ( legal, cultural, political etc) whose mode of articulation or effectivity is determined by economy.A structure is a combination of orderly engineered autonomous units or levels that essentially gear towards meeting organizational objectives.A change in one unit or level influences the total function of the structure.A SF leader takes proactive initiative to restore the organizational structure as per the changed context caused by either external or internal forces.
Politico Conflict Perspectives & leadershipConflicts are bound to happen in an organization because organizations are not mere physical structure rather they consist of organisms, in other words, human beings. Human dispositions are numerous and frictions among these dispositions lead to conflict. Actually, when organizational culture distorts as a result of defective leadership behavior characterized by partiality and discrimination conflict of interests supersedes unity of purpose. Distortions within organizational environs lead to germinate numerous informal groups which tend to promote self-directed or group-directed politics. Naturally conflict-brewed political games become a normal process in organizations. This reality necessarily raises several implications for leadership roles. Leadership as power relationship between the dominant and the subordinate. Some people always have more power than others do& the Subordinates think that their superior’s power is legitimate. The people with this perspective interpret the power structure in society and study how educational administration and the categorization of schooling relate to these power structures. The Subcategory: Feminist perspective(Bolman, Slater. 1994).Political theorists regard power, conflict and the distribution of scare resources as the central issues in organizations.PC leaders view organizations as political arenas that accommodate a complex variety of individual and group interests.Politico-conflict perspectives or framework sees the existing power relationship that influence the organizational efficiency. PC leaders take a stance and attempt to advocate for the emancipation of the group in suppression. Pc perspective is
6666 Journal of Balkumari College
based on variety of core assumptions:• Organizations are coalitions made up of different individuals and interest groups.• There are deeply rooted differences between individuals and groups in their values,
preferences, beliefs, information and perceptions of reality.• Allocation of scare resources, which constitutes about who gets what, are vital decisions
in organizations.• Power is the most important resource and conflict is inevitable and not necessarily a
bad component.• Organizational goals and decisions emerge from bargaining, negotiation and competition
for position among members of different coalitions Political leaders are advocates and negotiators who focus on process such as networking, building coalitions and power bases and negotiating compromises. ( Bolman & Deal, 1994).The presence of defective leadership creates an organizational environ where different interest groups flourish.The PC leaders are to be intuitive, innovative, harmonizer, negotiator and tactical enough who can work out amicable solutions from among layers of differences.
Constructivist Perspectives & leadershipAny behavior can qualify as a leader behavior if it meets certain conditions and conveys meaning. The Realities are multiple, constructed and holistic & No use of any prescriptive leader behavior. Subcategory: Attribution Theory(Bolman, Slater.1994). Creswel (2003) states - Individuals seek the understanding of the world in which they live and work. They develop subjective meanings of their experiences and these meanings are varied and multiple. According to Denzin & Lincoln (2005), Lambert states that a constructivist perspective requires a reexamination of the concept of leadership. It is central to our argument that the relationship between learning and leading philosophies is a dynamic one and Each view is changing as it is influenced by the other. It is critical to people learning and meaning making process Constructivism connects action to praxis and builds on anti-foundational arguments while encouraging experimental and multi-voiced texts. (p. 184). The assumptions are the meaning are constructed by human beings, Human beings engage with their world and make sense of it based on their historical and social perspective and The generation of meaning is always social, arising in and out of interaction with a human community. (Creswel.p.9, 2003). Stimulation of ideas through discourse among organizational members essentially begets new ideas that can raise the level of organizational effectiveness. Providing space for everyone to express their ideas and concerns within the organization is a healthy move to generate a wealth of ideas. Tyranny of the big hats decimates the potentials of subordinates. Constructive perspective strongly opposes the notion that higher level authorities alone possess the brainpower. Constructivist thought is found in the work of Kant.His argument was that there must be inherent organizing principles within man's consciousness. (Dilthey Burrell & Morgan, 1979) expanded Kant's original hypotheses and explained the distinction between natural sciences and cultural sciences. Natural science investigates external processes in a material world while cultural sciences investigates the internal process of the human mind. Dilthey suggested outward manifestations of human life needs to be interpreted in terms of inner experience. Schultz continued to build on the foundations of Dilthey and Weber. Schultz was
6767Journal of Balkumari College
in agreement with Weber that the essential function of social science was interpretive. Schultz moved forward with a phenomenological analysis of meaning and argued that consciousness is fundamentally an unbroken stream of lived experiences.
The implications of this approach can be said that there is a deep understanding of change and transitions; it is an understanding of context so that communities can be continually drawn and enriched. Leaders and followers need to develop a new language of civic virtue to discuss and make moral evaluations of the changes that make meaning for organizations and societies. There are two important notions- the first is that people construct new understandings using what they already know and the second notion is that people confront their understanding in light of what they encounter in the new learning situation. It is not enough for trainers to describe new ways of leading and expert leaders to translate from talk to action; it is more effective to engage leaders in activities that will lead to new actions in the organization. Constructivist leaders do not take the role of the "sage on the stage." rather, they act as "guides on the side". Leadership is symbolic and values shape and decision making process. Critical humanist are committed to social change, Educational administration research cant be exempted from values and the Subcategory: Ethical Leadership (Bolman, Slater. 1994). The constructivist or the interpretive paradigm tries to explain the nature of the social world thorough individual consciousness and subjectivity.Social reality exists within the consciousness of a single individual and It is formed by a network of assumptions and inter-subjectively shared meanings. The social world is produced and reinforced by humans through action and interaction which attempts to understand the social world form the participants’ perspectives through interpretations of meanings of their actions and interactions. It has Space for everybody, Child centered, caring, inclusive, inquiry/discovery based, active involvement of learners. E.g. Cognitive constructivism ( Jean Piaget), Social constructivism (Lev Vygotsky), Radical constructivism (Glasserfield), Contextual constructivism (Cobren), etc (Burrel & Morgan, 1977) . according to Hoy & Miskel (2001), A constructivist leader thus acts actively to provide space for everybody within the organizational system so as to generate wealth of idea where Rational, radical or dialectical constructivists all signify the role of each individual and advocate that a leader should listen from all and value each voice. It Stands opposite to the concept of elitism that believes that knowledge is available with higher level authorities only.A constructivist leadership perspective promotes the participatory, democratic approach.
Critical Humanistic perspective & leadershipCritical humanism focuses on human subjectivity, experience, and creativity. They start with people living their daily lives, feelings, actions and bodies, and a material world of inequalities and exclusions. It is never neutral, value-free work, because the core of the inquiry must be human values.It emphasizes those values that give dignity to the person, reduce human sufferings, and enhance human well-being. The value of critical humanism are commitment to a cluster of democratizing values that aim to reduce/ remove human sufferings, An ethics of care and compassion, Significantly developed by feminists, this is a value whereby looking after the other takes on a prime role and whereby sympathy, love and even fidelity become prime concerns, A politics of recognition and respect &Importance of trust. There are three

6868 Journal of Balkumari College
elements to build a humanistic approach to leadership development.: Search for meaning and purpose in human experience;Focus on knowledge as the basis for action; and Action grounded in a moral ethos.
Critical Humanist Perspectives is based a variety of core assumptions: A leader should act on a normative perspective which supports that leadership cant be fully understood unless it is studied within the immediate context in which it is perceived to exist. In terms of educational leadership, ethical or symbolic leadership forms the critical humanist perspective.Effective school leaders are synonymous with ethical leadership which is concerned with fairness, equity, commitment, responsibility and obligation (Bolman, 1994). Principal’s actions should be regulated by ethical guidelines and integrated with the values of a democratic society.School leaders should commit themselves to three ethics: the ethic of critique, caring and justice. ( Slater, 1994).Critical Humanist perspective prepares the base for symbolic leadership which acknowledges the role the symbols play in human experience.Rational approach only cant solve all the ambiguities and uncertainties.Human beings create symbols to overcome confusion, predict events and provide direction to cope with uncertainty and ambiguity. Rituals and ceremonies serve four major roles: to socialize, to stabilize, to reduce worries and uncertainties and to communicate message ( Bolman & Deal, 1991). School leaders adopt eight major symbolic roles ( Deal & Petersen, 1995): Historian, Anthropological Sleuth, Visionary, Symbol, Poets, Actors, Potter, and Healers. So A CH leader applies organism friendly behavior with cooperation and respect where everyone in the organization is valued.Critical understanding of human sentiments compassionate behavior inspired by values and ethics of relationships among human beings are taken into consideration.
ConclusionOne person can make a major difference, People working cooperatively make an even greater difference, Leadership makes a difference. Building and supporting new forms of leadership can make an even greater difference. So we can say that it is possible for local, institutional, national, and global leaders to reflect the world’s people, enjoy each other, and work well together. By identifying our individual, organizational, and global goals, we increase our chances of creating the world, relationships and lives. By clarifying our assumptions about human nature and providing opportunities for others to do the same, we create clearer bases for policy making, work and interactions advancing justice. So humanity calls for leaders to do fresh, creative thinking. Constructive listening, frees thinking. People can listen constructively to one another.
Educational Leadership borrows its fundamental concepts about the structure and coordination of schools, rules and regulation within a school and how it works from Organizational Theory which itself derived from Management Theory.So it adapted the terms such as quality, productivity, efficiency and the strategies.It borrowed its theories about human nature and motivation from economics. The discussions made on different perspectives on leadership from the sociological foreground ultimately assist in designing a framework consisting of four major frames as Structural Leadership, Human Resource Leadership, Political Leadership and Symbolic Leadership.
6969Journal of Balkumari College
References• Baker, E.; McGaw, B. & Peterson P (Eds) (2007) Constructivism and learning ,
International Encyclopedia of Education 3rd Edition, Oxford: Elsevier• Bolman, L.G.,Crow, G.M., Goldring, E., Slater, R.O., & Thurston, P.W. (1994).
Taxonomy and overview. In W.K.Hoy (Ed.), Educational administration: USA: McGraw Hill.
• Burrell, G. and Morgan, G.(1977). Sociological Paradigms and Organizational Analysis, Aldershot, Ashgate Publishing Company.
• Cook, R. G. & students. Implications of social constructivism for leaders. Virginia Beach: Regent University.
• Creswell, J. W. (2003). Research Design: qualitative, quantative, and mixed methods approaches, Sage, Thousand Oaks, California.
• Dareli, M.(2003). A Survey Research of Leadership Styles of Elementary School Principals, an Unpublished Dissertation, Turkey, Middle East Technical University.
• Denzin, N.K. & Lincoln, Y. S. (2005). Qualitative research (3rd ed.). New Delhi: Sage Publication.
• Gunter, H. (2001). Critical approaches to leadership in education. Journal of Educational Enquiry, Vol.2, No. 2, 2001. United Kingdom: University of Birmingham.
• Hoy, W.K., & Miskel, C.G. (2001). Educational administration: Theory, research, and practice. (6th ed.) New York: McGraw Hill.
• Lambert, L. Toward a theory of constructivist leadership (by- Chapter 2). Web- source.• Maxcy, S.J. (1995). Beyond leadership frameworks. Educational Administration
Quarterly, 31(3).• Rao, C.N.S.(2006) Principles of Sociology. New Delhi, S.Chanda and Company• Sergiovanni, T. J. (1994). Organizations or Communities? Changing the Metaphor
Changes the Theory. Educational Administration Quarterly, 30(2).• Slater, R.O. (1994). Symbolic educational leadership and democracy in America.
Educational Administration Quarterly, 30(1).• Slater, R.O. (1995). The sociology of leadership and educational administration.
Educational Administration Quarterly, 31(3).• Steffe, L. P.; Gale, J.(1995). Constructivism in Education, Hillsdale, NJ: Lawrence
Erlbaum
7070 Journal of Balkumari College
Abstract The invasive alien plant species (IAS) is the major problem of the world 53 IAS were identified from the field area. Most of the plants are introduced from South and North America by severed ways. Some IAS are also introduced from Africa. They play adverse role in Baranaabar community forest Chitwan. They disturb the habitat of wild fauna and contributes to elimination of native plants which are major source of fodder for wild herbivores and live stock. The most worst IAS are Mikamia Parthenium, Eupatorium, Lantana etc. 19 species of IAS belong to family Asteraceae which are extensively found in BCF. At present, the eradication of IAS should be strongly recommended
Key Word: Invasive alien plant species IAS, Barndabar Community Forest (BCF), Asteraceae, bio-diversity, eradication
IntroductionInvasive alien plant species (IAS) have become one of the serious problem to ecological and economic well being of every habitat and region on the earth (Boy and will 2013). They impact adversely upon biodiversity including elimination of native plant species through competition, predation or transmission of pathogens as well as local ecosystem. The invasive plant species traits include:
i. fast growth ( Enserink, 1999) ii. rapid dispersal ability
iii. phenotype plaslicity iv. tolerance of adverse environment conditions . v. rapid reed dispersal
vi. competition to plants for nutrient and soil.
The introduction plant alien species to a new locality can either by accidental or intentional (Enserienk, 1999).
Accidental introduction is possible by travel across country to country and important of various kinds of plant sources like timbers fodder food grains etc (Shimono and Konuma 2008). The intentional introduction is due to practice of agriculture, horticulture, forestry floriculture etc. The economic damage due to IAS (invasive alien Plant species) estimated is about 1.4 trillion dollars globally.
Enumeration and Threats of Invasive Alien Plant Species in Barndabar Community Forest
Dr. Manoj K.L. DasAssociate Professor, Birendra Mutiple Campus
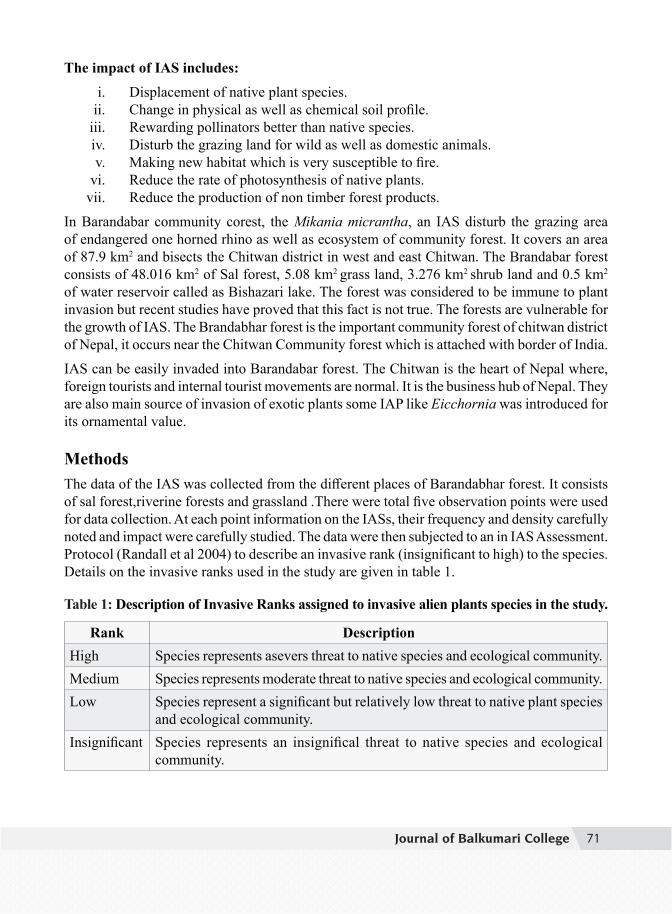
7171Journal of Balkumari College
The impact of IAS includes:
i. Displacement of native plant species. ii. Change in physical as well as chemical soil profile.
iii. Rewarding pollinators better than native species.iv. Disturb the grazing land for wild as well as domestic animals.v. Making new habitat which is very susceptible to fire.
vi. Reduce the rate of photosynthesis of native plants.vii. Reduce the production of non timber forest products.
In Barandabar community corest, the Mikania micrantha, an IAS disturb the grazing area of endangered one horned rhino as well as ecosystem of community forest. It covers an area of 87.9 km2 and bisects the Chitwan district in west and east Chitwan. The Brandabar forest consists of 48.016 km2 of Sal forest, 5.08 km2 grass land, 3.276 km2 shrub land and 0.5 km2 of water reservoir called as Bishazari lake. The forest was considered to be immune to plant invasion but recent studies have proved that this fact is not true. The forests are vulnerable for the growth of IAS. The Brandabhar forest is the important community forest of chitwan district of Nepal, it occurs near the Chitwan Community forest which is attached with border of India.IAS can be easily invaded into Barandabar forest. The Chitwan is the heart of Nepal where, foreign tourists and internal tourist movements are normal. It is the business hub of Nepal. They are also main source of invasion of exotic plants some IAP like Eicchornia was introduced for its ornamental value.
MethodsThe data of the IAS was collected from the different places of Barandabhar forest. It consists of sal forest,riverine forests and grassland .There were total five observation points were used for data collection. At each point information on the IASs, their frequency and density carefully noted and impact were carefully studied. The data were then subjected to an in IAS Assessment. Protocol (Randall et al 2004) to describe an invasive rank (insignificant to high) to the species.Details on the invasive ranks used in the study are given in table 1.
Table 1: Description of Invasive Ranks assigned to invasive alien plants species in the study.
Rank DescriptionHigh Species represents asevers threat to native species and ecological community.Medium Species represents moderate threat to native species and ecological community.Low Species represent a significant but relatively low threat to native plant species
and ecological community.Insignificant Species represents an insignifical threat to native species and ecological
community.
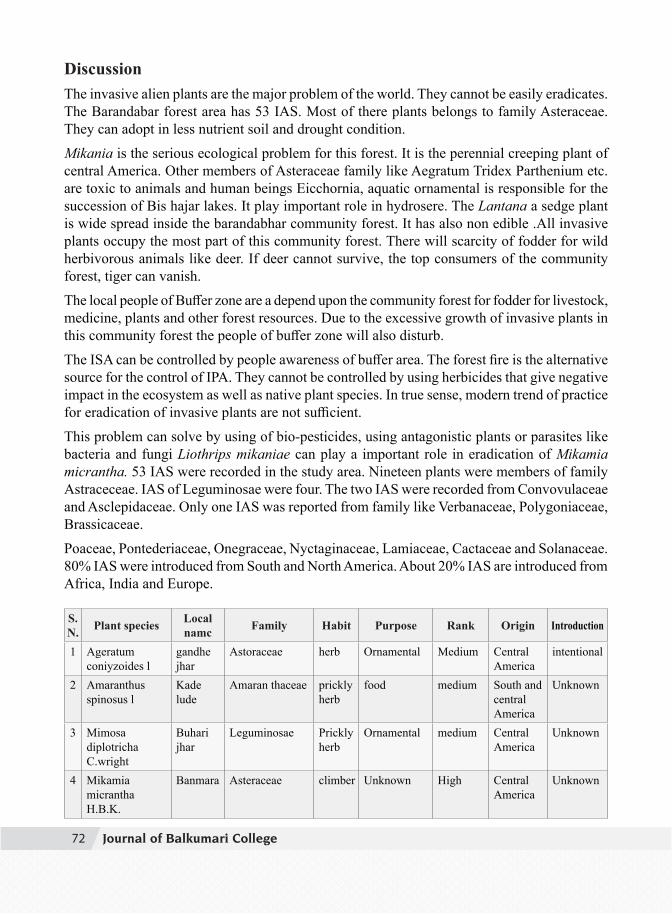
7272 Journal of Balkumari College
DiscussionThe invasive alien plants are the major problem of the world. They cannot be easily eradicates. The Barandabar forest area has 53 IAS. Most of there plants belongs to family Asteraceae. They can adopt in less nutrient soil and drought condition.
Mikania is the serious ecological problem for this forest. It is the perennial creeping plant of central America. Other members of Asteraceae family like Aegratum Tridex Parthenium etc. are toxic to animals and human beings Eicchornia, aquatic ornamental is responsible for the succession of Bis hajar lakes. It play important role in hydrosere. The Lantana a sedge plant is wide spread inside the barandabhar community forest. It has also non edible .All invasive plants occupy the most part of this community forest. There will scarcity of fodder for wild herbivorous animals like deer. If deer cannot survive, the top consumers of the community forest, tiger can vanish.The local people of Buffer zone are a depend upon the community forest for fodder for livestock, medicine, plants and other forest resources. Due to the excessive growth of invasive plants in this community forest the people of buffer zone will also disturb.The ISA can be controlled by people awareness of buffer area. The forest fire is the alternative source for the control of IPA. They cannot be controlled by using herbicides that give negative impact in the ecosystem as well as native plant species. In true sense, modern trend of practice for eradication of invasive plants are not sufficient.This problem can solve by using of bio-pesticides, using antagonistic plants or parasites like bacteria and fungi Liothrips mikaniae can play a important role in eradication of Mikamia micrantha. 53 IAS were recorded in the study area. Nineteen plants were members of family Astraceceae. IAS of Leguminosae were four. The two IAS were recorded from Convovulaceae and Asclepidaceae. Only one IAS was reported from family like Verbanaceae, Polygoniaceae, Brassicaceae.Poaceae, Pontederiaceae, Onegraceae, Nyctaginaceae, Lamiaceae, Cactaceae and Solanaceae. 80% IAS were introduced from South and North America. About 20% IAS are introduced from Africa, India and Europe.
S.N. Plant species Local
namc Family Habit Purpose Rank Origin Introduction
1 Ageratum coniyzoides l
gandhe jhar
Astoraceae herb Ornamental Medium Central America
intentional
2 Amaranthus spinosus l
Kade lude
Amaran thaceae prickly herb
food medium South and central America
Unknown
3 Mimosa diplotrichaC.wright
Buharijhar
Leguminosae Prickly herb
Ornamental medium Central America
Unknown
4 Mikamia micrantha H.B.K.
Banmara Asteraceae climber Unknown High Central America
Unknown
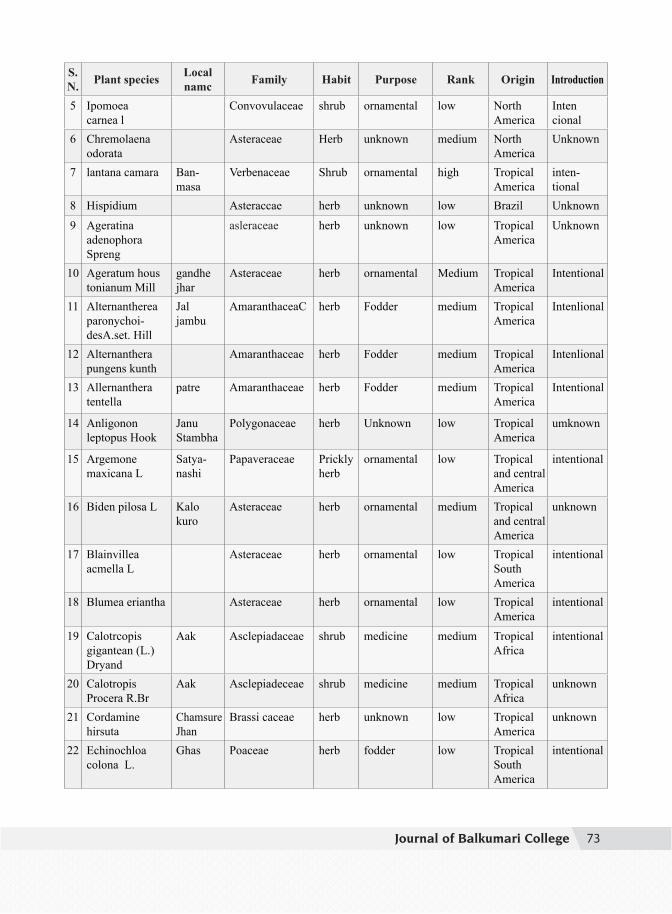
7373Journal of Balkumari College
S.N. Plant species Local
namc Family Habit Purpose Rank Origin Introduction
5 Ipomoea carnea l
Convovulaceae shrub ornamental low North America
Inten cional
6 Chremolaena odorata
Asteraceae Herb unknown medium North America
Unknown
7 lantana camara Ban-masa
Verbenaceae Shrub ornamental high Tropical America
inten-tional
8 Hispidium Asteraccae herb unknown low Brazil Unknown
9 Ageratina adenophora Spreng
asleraceae herb unknown low Tropical America
Unknown
10 Ageratum hous tonianum Mill
gandhe jhar
Asteraceae herb ornamental Medium Tropical America
Intentional
11 Alternantherea paronychoi-desA.set. Hill
Jal jambu
AmaranthaceaC herb Fodder medium Tropical America
Intenlional
12 Alternanthera pungens kunth
Amaranthaceae herb Fodder medium Tropical America
Intenlional
13 Allernanthera tentella
patre Amaranthaceae herb Fodder medium Tropical America
Intentional
14 Anligonon leptopus Hook
Janu Stambha
Polygonaceae herb Unknown low Tropical America
umknown
15 Argemone maxicana L
Satya-nashi
Papaveraceae Prickly herb
ornamental low Tropical and central America
intentional
16 Biden pilosa L Kalo kuro
Asteraceae herb ornamental medium Tropical and central America
unknown
17 Blainvillea acmella L
Asteraceae herb ornamental low Tropical South America
intentional
18 Blumea eriantha Asteraceae herb ornamental low Tropical America
intentional
19 Calotrcopis gigantean (L.) Dryand
Aak Asclepiadaceae shrub medicine medium Tropical Africa
intentional
20 Calotropis Procera R.Br
Aak Asclepiadeceae shrub medicine medium Tropical Africa
unknown
21 Cordamine hirsuta
Chamsure Jhan
Brassi caceae herb unknown low Tropical America
unknown
22 Echinochloa colona L.
Ghas Poaceae herb fodder low Tropical South America
intentional
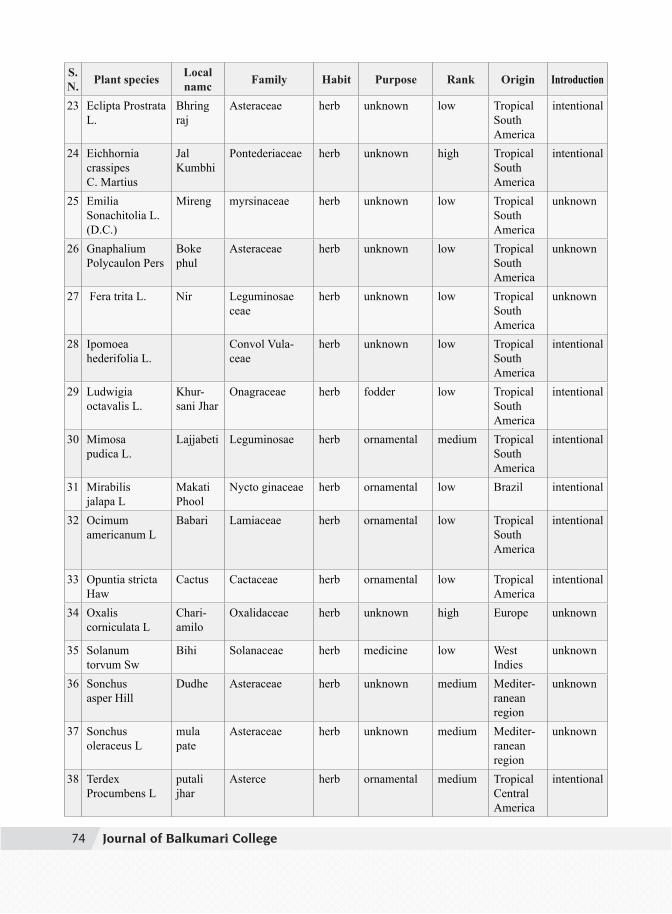
7474 Journal of Balkumari College
S.N. Plant species Local
namc Family Habit Purpose Rank Origin Introduction
23 Eclipta Prostrata L.
Bhring raj
Asteraceae herb unknown low Tropical South America
intentional
24 Eichhornia crassipesC. Martius
Jal Kumbhi
Pontederiaceae herb unknown high Tropical South America
intentional
25 Emilia Sonachitolia L. (D.C.)
Mireng myrsinaceae herb unknown low Tropical South America
unknown
26 Gnaphalium Polycaulon Pers
Boke phul
Asteraceae herb unknown low Tropical South America
unknown
27 Fera trita L. Nir Leguminosae ceae
herb unknown low Tropical South America
unknown
28 Ipomoea hederifolia L.
Convol Vula-ceae
herb unknown low Tropical South America
intentional
29 Ludwigia octavalis L.
Khur-sani Jhar
Onagraceae herb fodder low Tropical South America
intentional
30 Mimosa pudica L.
Lajjabeti Leguminosae herb ornamental medium Tropical South America
intentional
31 Mirabilis jalapa L
Makati Phool
Nycto ginaceae herb ornamental low Brazil intentional
32 Ocimum americanum L
Babari Lamiaceae herb ornamental low Tropical South America
intentional
33 Opuntia stricta Haw
Cactus Cactaceae herb ornamental low Tropical America
intentional
34 Oxalis corniculata L
Chari-amilo
Oxalidaceae herb unknown high Europe unknown
35 Solanum torvum Sw
Bihi Solanaceae herb medicine low West Indies
unknown
36 Sonchus asper Hill
Dudhe Asteraceae herb unknown medium Mediter-ranean region
unknown
37 Sonchus oleraceus L
mula pate
Asteraceae herb unknown medium Mediter-ranean region
unknown
38 Terdex Procumbens L
putali jhar
Asterce herb ornamental medium Tropical Central America
intentional
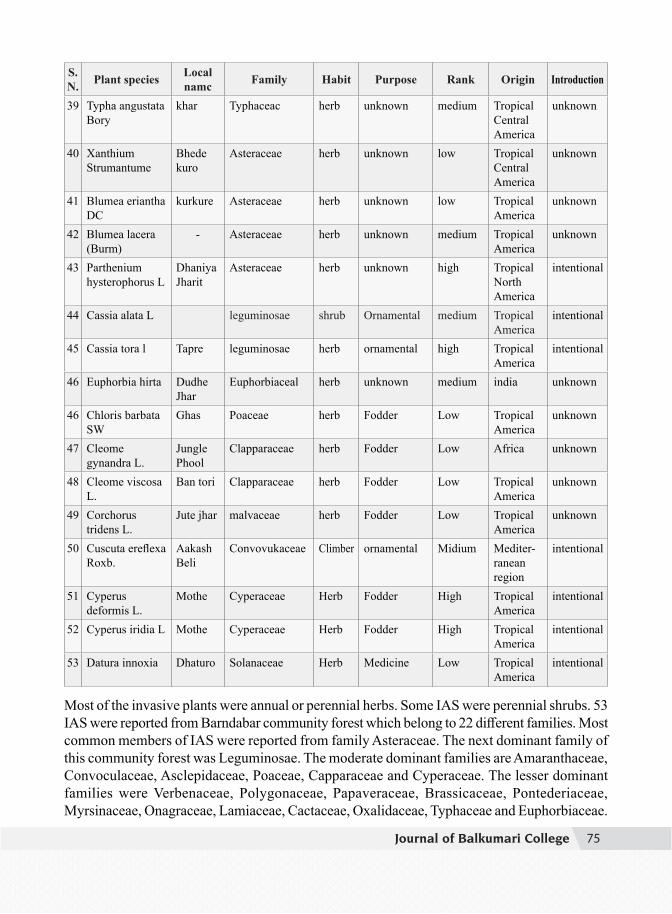
7575Journal of Balkumari College
S.N. Plant species Local
namc Family Habit Purpose Rank Origin Introduction
39 Typha angustata Bory
khar Typhaceac herb unknown medium Tropical Central America
unknown
40 Xanthium Strumantume
Bhede kuro
Asteraceae herb unknown low Tropical Central America
unknown
41 Blumea eriantha DC
kurkure Asteraceae herb unknown low Tropical America
unknown
42 Blumea lacera (Burm)
- Asteraceae herb unknown medium Tropical America
unknown
43 Parthenium hysterophorus L
Dhaniya Jharit
Asteraceae herb unknown high Tropical North America
intentional
44 Cassia alata L leguminosae shrub Ornamental medium Tropical America
intentional
45 Cassia tora l Tapre leguminosae herb ornamental high Tropical America
intentional
46 Euphorbia hirta Dudhe Jhar
Euphorbiaceal herb unknown medium india unknown
46 Chloris barbata SW
Ghas Poaceae herb Fodder Low Tropical America
unknown
47 Cleome gynandra L.
Jungle Phool
Clapparaceae herb Fodder Low Africa unknown
48 Cleome viscosa L.
Ban tori Clapparaceae herb Fodder Low Tropical America
unknown
49 Corchorus tridens L.
Jute jhar malvaceae herb Fodder Low Tropical America
unknown
50 Cuscuta ereflexa Roxb.
Aakash Beli
Convovukaceae Climber ornamental Midium Mediter-raneanregion
intentional
51 Cyperus deformis L.
Mothe Cyperaceae Herb Fodder High Tropical America
intentional
52 Cyperus iridia L Mothe Cyperaceae Herb Fodder High Tropical America
intentional
53 Datura innoxia Dhaturo Solanaceae Herb Medicine Low Tropical America
intentional
Most of the invasive plants were annual or perennial herbs. Some IAS were perennial shrubs. 53 IAS were reported from Barndabar community forest which belong to 22 different families. Most common members of IAS were reported from family Asteraceae. The next dominant family of this community forest was Leguminosae. The moderate dominant families are Amaranthaceae, Convoculaceae, Asclepidaceae, Poaceae, Capparaceae and Cyperaceae. The lesser dominant families were Verbenaceae, Polygonaceae, Papaveraceae, Brassicaceae, Pontederiaceae, Myrsinaceae, Onagraceae, Lamiaceae, Cactaceae, Oxalidaceae, Typhaceae and Euphorbiaceae.
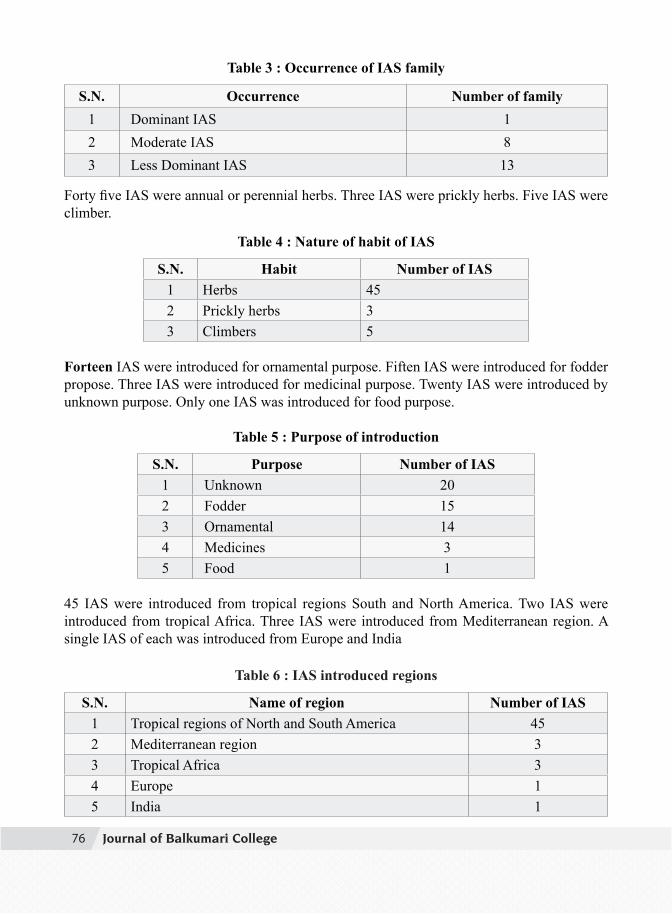
7676 Journal of Balkumari College
Table 3 : Occurrence of IAS family
S.N. Occurrence Number of family1 Dominant IAS 12 Moderate IAS 83 Less Dominant IAS 13
Forty five IAS were annual or perennial herbs. Three IAS were prickly herbs. Five IAS were climber.
Table 4 : Nature of habit of IAS
S.N. Habit Number of IAS1 Herbs 452 Prickly herbs 33 Climbers 5
Forteen IAS were introduced for ornamental purpose. Fiften IAS were introduced for fodder propose. Three IAS were introduced for medicinal purpose. Twenty IAS were introduced by unknown purpose. Only one IAS was introduced for food purpose.
Table 5 : Purpose of introduction
S.N. Purpose Number of IAS1 Unknown 202 Fodder 153 Ornamental 144 Medicines 35 Food 1
45 IAS were introduced from tropical regions South and North America. Two IAS were introduced from tropical Africa. Three IAS were introduced from Mediterranean region. A single IAS of each was introduced from Europe and India
Table 6 : IAS introduced regions
S.N. Name of region Number of IAS1 Tropical regions of North and South America 452 Mediterranean region 33 Tropical Africa 34 Europe 15 India 1
7777Journal of Balkumari College
ConclusionAmong five sites of study area it was observed that Barandabar community forest was invaded by IAS. Most the indigenous trees and shrubs act as substratum for the growth or Mikania micrantha. Other IAS were dominated over the indigenous species of plants. These plants are greatly influenced in forest ecosystem and disturb the habitat and grazing area of wild fauna and livestock. It is very essential to control IAS. This aspect is not properly considered, the future generation people cannot utilize the timber as well as non timber forest products. The eco- tourism industry of Chitwan should be vanished.
Reference Adhikari B 2004. Presentation on the Mikania problem in Nepal. First National stakeholder
workshop 25, November 2004. Bhatta S.R. 2006. Grassland management in Royal Chitwan Nationd park Biodiversity
conservation effort of Nepal. Special issue published on the occasion of 11th wildlife week 2063.
Boy and Witt 2013, Invasive Species, the Live hood threats; Case study of biological control of invasive species
Shimono and Konuma 2009, Trade Transport and Trouble managing invasive species pathways in journal of applied ecology Wiley online library.
Enserink, 1999, The management of alien species of India International Journal of biodiversity and conservation.
Proceedings of the international conference an Invasive Alliance species management 2014, National Trust for Nature Conservation Centre Sauraha Chitwan
Randall, Larry E. Morse, Naney Benton, Ron Hiebert, Stephanie Lu and Terri Killefer 2004. The invasive Assessment Protocol: A tool for creating Regional and National Lists of Invasive Nonnative plants that negatively impact Bio diversity, Invasive Plant Science and Management 1(1): 36-49
7878 Journal of Balkumari College
AbstractThe study confirmed that there seems to be a certain degree of correlation between the factors that behavioral finance theory and previous empirical evidence identify for the average retail investor. The study found that the most important factors that influence individual investment decisions were Company's dividend ratio, Use of company's annual reports, Government Regulations & intervention, Quality of top management, Return on Equity & investment, Active trading volume & turnover, Use of past price movement to predict future price, Major institution and corporations currently buying the stocks of the company. The findings from this research would provide an understanding of the various decisions to be made by investors based on the prevailing factors and the eventual outcomes for each decision and would identify the most influencing factors on the company’s investors’ behavior on how their future policies and strategies will be affected since investment decisions by the investors will determine the company’s strategy to be applied. Individual investments behavior is concerned with choices about purchases of small amounts of securities for his or her own account. Investment decisions are often supported by decision tools. It is assumed that information structure and the factors in the market systematically influence individuals’ investment decisions as well as market outcomes. The study finds that increase in the size of investment leads to decrease in the confidence level of investors. Size of investment has significantly positive impact on the level of involvement and negative effect on investors’ optimism; higher professional experience of investors tends to increase risk taking capacity while investors with large investment have lower tendency to take risk. Similarly, investors having higher level of confidence, involvement, optimism and risk taking attitude tend to trade more frequently in the stock market. Thus, investment behavior of investors is highly influenced by their personal characteristics and psychology.
I. IntroductionInvestment decisions are made by investors, portfolio managers and investment managers. Investors commonly perform investment analysis by making use of fundamental analysis, technical analysis and judgment. Investment decisions are often supported by decision tools. It is assumed that information structure and the factors in the market systematically influence individuals’ investment decisions as well as market outcomes. Investor market behavior derives from psychological principles of decision making to explain why people buy or sell stocks. These factors will focus upon how investors interpret and act on information to make
Factors Influencing Investment Decisions in Capital Market: A Study of Individual Investors in Nepal
Kul Chandra PanditLecturer of Finance, MBS, M.Phil. Scholar
7979Journal of Balkumari College
investment decisions. Behavioral finance is defined by Shefrin, (2000) as “a rapidly growing area that deals with the influence of psychology on the behavior of financial practitioners”. Individual investments behavior is concerned with choices about purchases of small amounts of securities for his or her own account (Nofsinger and Richard, 2002).
Traditional finance pre-supposes that people view all decisions through the transparent and objective lens of risk and return. It assumes that people are guided by reason and logic and independent judgment. It argues that markets are efficient, implying that the price of each security is an unbiased estimate of its intrinsic value. Behavioral finance, on the other hand, recognizes that emotions and herd natures play an important role in influencing decisions. It postulates that perceptions of risk and return are significantly influenced by the way decision problems are framed. It contends that heuristic-driven biases and errors, frame dependence, and effects of emotions and social influence often lead to discrepancy between market price and fundamental value (Sewell,2005).Behavioral finance combines psychology and economics to explain why and how people make seemingly irrational decisions when they spend, invest, save, and borrow money. It shows what happens when emotional reactions are engaged in investment decisions that shape the securities market and impact the prices of securities, as well as the allocation of financial resources in both spending and saving habits. This implies that in order to have a complete view of the market and its performance, one cannot ignore the investors’ behavioral patterns (Gilovich,1999).Modern portfolio theory provides practitioners with a set of quantitative tools for prescribing how investors should combine financial assets to maximize return for a given risk. Prospect theory is significant in Behavioral finance as it describes how people make choices in situations where they have to decide between alternatives that involve risk. However, in financial transactions, mental accounting is used to describe how individuals think about and evaluate their financial transactions. The role of stereotypes in investment decisions is explained by heuristic theory also referred to as representativeness. Effects of beliefs or assumptions of investment processes is explained by cognitive dissonance as the mental conflict that people experience when presented with evidence that their beliefs or assumptions are wrong.
Key points on investor behaviors: • Investments are often believed of as pieces of paper rather than part ownership of a company. • Investors are often intolerant to sell a good stock. • Investors often take a short-term viewpoint. Recent market losses lead to suspicion and
caution, while recent gains lead to action. • Investors may overestimate their skills; attributing success to ability they don't possess and
seeing order in information or data where it doesn't exist. • Investors follow the crowd, and are heavily influenced by other investors or compelling
news; they fail to check out the real facts. • Investors become obsessed with prices and trend-watching, rather than solid information. • The way in which, we as investors deal with loss and failure is just as important, if not
more important, than the way in which we deal with success. • Effectively controlling and guiding emotions are two very important issues in the equation
for success.
8080 Journal of Balkumari College
• Those successful continue to be successful as investors, recognize the importance of market psychology and incorporate it in their work to a certain extent.
The bulk of research in modern financial economics has been built on the notion that investors are rational agents who attempt to maximize wealth while minimizing risk. However, the investor is concerned with human phenomena, which are necessarily complex phenomena. Thus, it is quite important to understand the investment behavior of individual investors. Investment behaviors of investor are defined as how the investors judge, predict, analyze and review the procedures for decision making, which includes investment psychology, information gathering, defining and understanding, research and analysis (Slovic, 1972; Alfredo and Vicente, 2010). Behavioral finance is facing an important challenge to find investment behavior of individual investor. The proponents of behavioral paradigm are of the view that large number of investors act irrationally and are prone to behavioral heuristics that result in less than optimal investment choices. If investors are rational, the stock price should equal the present value of the expected cash distributions to shareholders. However, Shiller (1979), LeRoy and Porter (1981), and others have reported empirical evidence that prices of the stocks are more unstable than can be verified by the standard asset-pricing models and are surely affected by the investor's psychology and behavioral aspects. A large body of empirical research indicates that real individual investors behave differently from investors in these models. Most individual investors hold under-diversified portfolios. Many apparently uninformed investors trade actively, speculatively, and to their detriment. And, as a group, individual investors make systematic, not random, buying and selling decisions. In Grossman and Stiglitz’s (1980) rational expectations model, some investors choose to acquire costly information and others choose to invest passively. Informed, active, investors earn higher pre-cost returns, but, in equilibrium, all investors have the same expected utility. Despite a large number of studies on understanding factor influencing investment decision of individual investor's behavior carried out in developed economies, there have been very few empirical studies available in underdeveloped countries like Nepal. To sum up, this study tries to address the following issues:
• What factors motivate investors in investing stock market?• What types of markets investors prefer to investment?• Does the size of earning affect investors trading and monitoring behavior?• Does the size of investment affect investors trading and monitoring behavior?• What are the factors affecting investment decision of the investors?• Whether investors’ Socio-economic factors affect the stock market trading decision?• Does the investor’s psychology and their trading frequency are related? • How investors’ characteristics affect the different dimensions of investors’ psychology
such as ability of investment decision, investor effort, Investor optimism and risk appetite?
The remainder of the paper is organized on Section II gives the overview on the stock market of Nepal; Section III discusses data analysis and findings and section IV discuss the conclusion recommendation and discussion

8181Journal of Balkumari College
II. An Overview of Stock Market in Nepal Securities Marketing Centre (SMC) was established in 1976 to deal with Government securities in Nepal. SMC was converted into Securities Exchange Centre (SEC) in 1984. Before conversion into stock exchange SEC was the only capital market institution undertaking the job of brokering, underwriting, managing public issue, market making for Government bonds and other financial services, which led to have conflict of interest between one function to another. The Government taking policy to address the conflict of interest issue made first amendment in Securities Exchange Act, 1983 in 1993 that led to restructure capital market in the country. The first amendment in the Act paved the way to convert SEC into Nepal Stock Exchange Ltd. (NEPSE) in 1993 to take the exclusive responsibility of secondary market operation and establish Securities Board on June 7, 1993 as oversight agency to regulate capital market. The second amendment in the Act, 1983 was made in 1997 which made provision to register securities businesspersons in Securities Board of Nepal (SEBON). New Securities Act enacted in 2007 incorporating the provisions requiring public companies to register all securities at SEBON before making public issue and one window policy in public issue with extended disclosures including others. Central Securities Depository (CSD) and Credit Rating Agency (CRA) were licensed on August 25, 2011 and October 2, 2012 respectively as major infrastructures.There are Two hundred forty three companies listed on the Nepal stock exchange as on May 31st 2016 and fifty active licensed stock brokers. Currently the NEPSE is trading more than a 1.4 million shares each day, and plays a major role in the growth of Nepalese stock market. Total turnover made each day was more than 1049 million on Nepal stock exchange during the Jan to May 2016. When recall the previous a record we found turnover of NEPSE 755 million in 2012 and 572 million in 2008. The NPSE had an average of 2.4 million retail investors.
Table: 1 Market Summary
Share Volume : 1,401,002 Turnover : 1,049,706,995NEPSE INDEX : 1528.12 (-5.44) -0.35% SENSITIVE : 328.00 (-1.15) -0.35 %Total Turnover Rs : 1,049,706,995 Total Traded Shares : 1,401,002 Total Transactions : 5,507 Total Scripts Traded : 128Total Market Capitalization Rs.1,637,987.02 Millions
Floated Market Capitalization Rs. 538,449.79 Millions
Trades by the investors have to go through the stock brokers who may also act as advisors to the investors. There are only 50 stock brokers who have to serve a total of over 2.4 million retail investors in addition to other institutional investors. This workload makes it almost impossible for the stock brokers to provide adequate advice and education to their clients. The NEPSE, SEBON and NRB usually carry out investor education programs to provide investors with financial information regarding the capital markets operations as well as the products available plus the associated risks and possible returns.
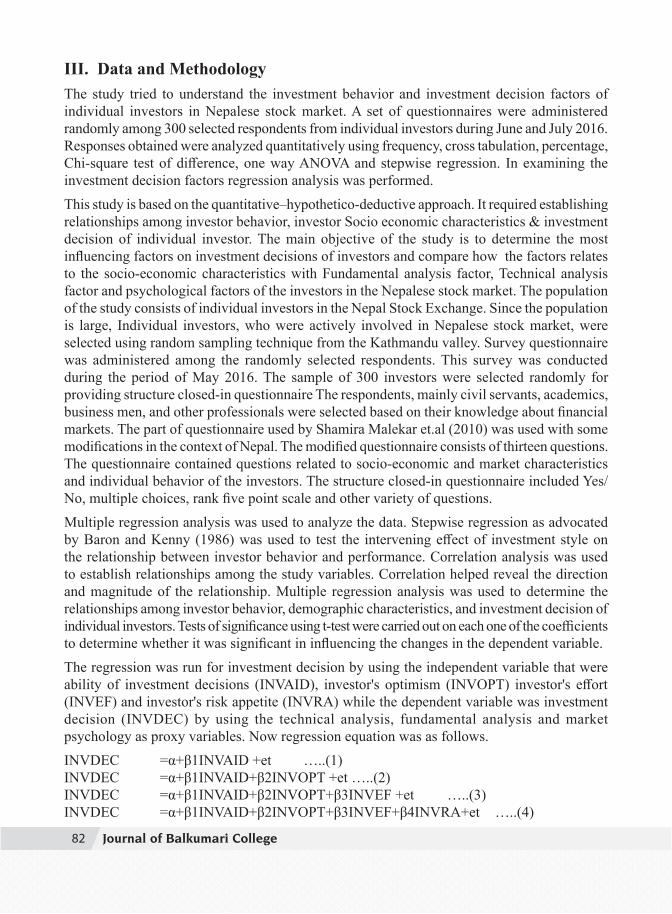
8282 Journal of Balkumari College
III. Data and MethodologyThe study tried to understand the investment behavior and investment decision factors of individual investors in Nepalese stock market. A set of questionnaires were administered randomly among 300 selected respondents from individual investors during June and July 2016. Responses obtained were analyzed quantitatively using frequency, cross tabulation, percentage, Chi-square test of difference, one way ANOVA and stepwise regression. In examining the investment decision factors regression analysis was performed.This study is based on the quantitative–hypothetico-deductive approach. It required establishing relationships among investor behavior, investor Socio economic characteristics & investment decision of individual investor. The main objective of the study is to determine the most influencing factors on investment decisions of investors and compare how the factors relates to the socio-economic characteristics with Fundamental analysis factor, Technical analysis factor and psychological factors of the investors in the Nepalese stock market. The population of the study consists of individual investors in the Nepal Stock Exchange. Since the population is large, Individual investors, who were actively involved in Nepalese stock market, were selected using random sampling technique from the Kathmandu valley. Survey questionnaire was administered among the randomly selected respondents. This survey was conducted during the period of May 2016. The sample of 300 investors were selected randomly for providing structure closed-in questionnaire The respondents, mainly civil servants, academics, business men, and other professionals were selected based on their knowledge about financial markets. The part of questionnaire used by Shamira Malekar et.al (2010) was used with some modifications in the context of Nepal. The modified questionnaire consists of thirteen questions. The questionnaire contained questions related to socio-economic and market characteristics and individual behavior of the investors. The structure closed-in questionnaire included Yes/No, multiple choices, rank five point scale and other variety of questions.Multiple regression analysis was used to analyze the data. Stepwise regression as advocated by Baron and Kenny (1986) was used to test the intervening effect of investment style on the relationship between investor behavior and performance. Correlation analysis was used to establish relationships among the study variables. Correlation helped reveal the direction and magnitude of the relationship. Multiple regression analysis was used to determine the relationships among investor behavior, demographic characteristics, and investment decision of individual investors. Tests of significance using t-test were carried out on each one of the coefficients to determine whether it was significant in influencing the changes in the dependent variable. The regression was run for investment decision by using the independent variable that were ability of investment decisions (INVAID), investor's optimism (INVOPT) investor's effort (INVEF) and investor's risk appetite (INVRA) while the dependent variable was investment decision (INVDEC) by using the technical analysis, fundamental analysis and market psychology as proxy variables. Now regression equation was as follows.INVDEC =α+β1INVAID +et …..(1)INVDEC =α+β1INVAID+β2INVOPT +et …..(2)INVDEC =α+β1INVAID+β2INVOPT+β3INVEF +et …..(3)INVDEC =α+β1INVAID+β2INVOPT+β3INVEF+β4INVRA+et …..(4)
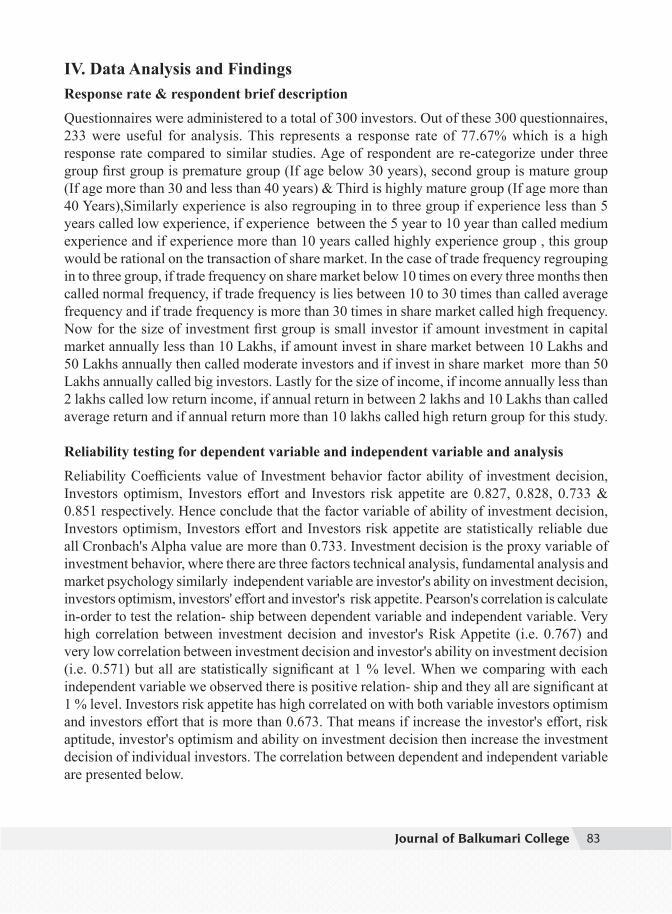
8383Journal of Balkumari College
IV. Data Analysis and Findings Response rate & respondent brief description
Questionnaires were administered to a total of 300 investors. Out of these 300 questionnaires, 233 were useful for analysis. This represents a response rate of 77.67% which is a high response rate compared to similar studies. Age of respondent are re-categorize under three group first group is premature group (If age below 30 years), second group is mature group (If age more than 30 and less than 40 years) & Third is highly mature group (If age more than 40 Years),Similarly experience is also regrouping in to three group if experience less than 5 years called low experience, if experience between the 5 year to 10 year than called medium experience and if experience more than 10 years called highly experience group , this group would be rational on the transaction of share market. In the case of trade frequency regrouping in to three group, if trade frequency on share market below 10 times on every three months then called normal frequency, if trade frequency is lies between 10 to 30 times than called average frequency and if trade frequency is more than 30 times in share market called high frequency. Now for the size of investment first group is small investor if amount investment in capital market annually less than 10 Lakhs, if amount invest in share market between 10 Lakhs and 50 Lakhs annually then called moderate investors and if invest in share market more than 50 Lakhs annually called big investors. Lastly for the size of income, if income annually less than 2 lakhs called low return income, if annual return in between 2 lakhs and 10 Lakhs than called average return and if annual return more than 10 lakhs called high return group for this study. Reliability testing for dependent variable and independent variable and analysisReliability Coefficients value of Investment behavior factor ability of investment decision, Investors optimism, Investors effort and Investors risk appetite are 0.827, 0.828, 0.733 & 0.851 respectively. Hence conclude that the factor variable of ability of investment decision, Investors optimism, Investors effort and Investors risk appetite are statistically reliable due all Cronbach's Alpha value are more than 0.733. Investment decision is the proxy variable of investment behavior, where there are three factors technical analysis, fundamental analysis and market psychology similarly independent variable are investor's ability on investment decision, investors optimism, investors' effort and investor's risk appetite. Pearson's correlation is calculate in-order to test the relation- ship between dependent variable and independent variable. Very high correlation between investment decision and investor's Risk Appetite (i.e. 0.767) and very low correlation between investment decision and investor's ability on investment decision (i.e. 0.571) but all are statistically significant at 1 % level. When we comparing with each independent variable we observed there is positive relation- ship and they all are significant at 1 % level. Investors risk appetite has high correlated on with both variable investors optimism and investors effort that is more than 0.673. That means if increase the investor's effort, risk aptitude, investor's optimism and ability on investment decision then increase the investment decision of individual investors. The correlation between dependent and independent variable are presented below.
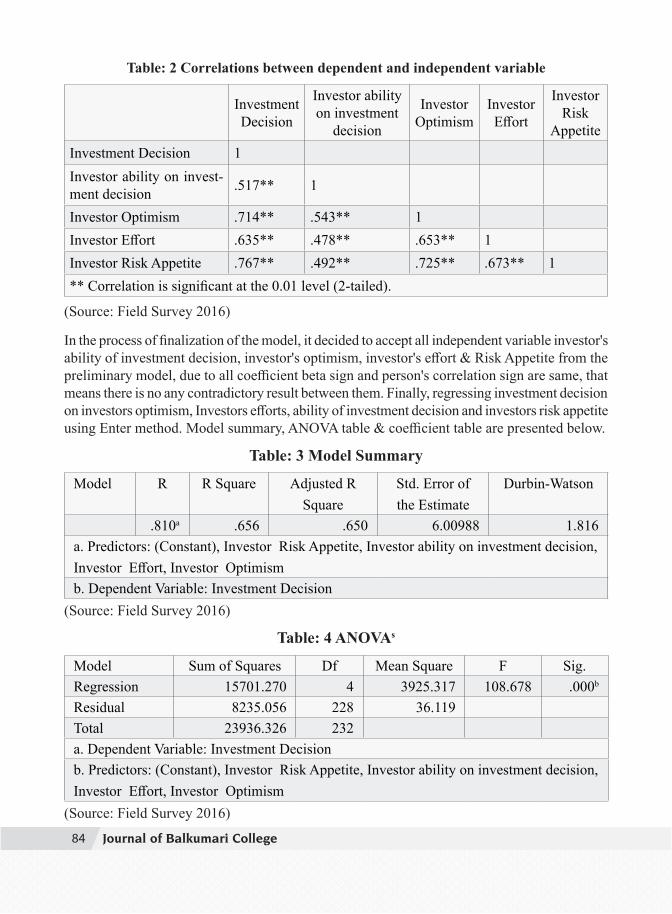
8484 Journal of Balkumari College
Table: 2 Correlations between dependent and independent variable
Investment Decision
Investor ability on investment
decision
Investor Optimism
Investor Effort
Investor Risk
AppetiteInvestment Decision 1Investor ability on invest-ment decision .517** 1
Investor Optimism .714** .543** 1Investor Effort .635** .478** .653** 1Investor Risk Appetite .767** .492** .725** .673** 1** Correlation is significant at the 0.01 level (2-tailed).
(Source: Field Survey 2016)
In the process of finalization of the model, it decided to accept all independent variable investor's ability of investment decision, investor's optimism, investor's effort & Risk Appetite from the preliminary model, due to all coefficient beta sign and person's correlation sign are same, that means there is no any contradictory result between them. Finally, regressing investment decision on investors optimism, Investors efforts, ability of investment decision and investors risk appetite using Enter method. Model summary, ANOVA table & coefficient table are presented below.
Table: 3 Model Summary
Model R R Square Adjusted R Square
Std. Error of the Estimate
Durbin-Watson
.810a .656 .650 6.00988 1.816a. Predictors: (Constant), Investor Risk Appetite, Investor ability on investment decision, Investor Effort, Investor Optimismb. Dependent Variable: Investment Decision
(Source: Field Survey 2016)
Table: 4 ANOVAs
Model Sum of Squares Df Mean Square F Sig.Regression 15701.270 4 3925.317 108.678 .000b
Residual 8235.056 228 36.119Total 23936.326 232a. Dependent Variable: Investment Decisionb. Predictors: (Constant), Investor Risk Appetite, Investor ability on investment decision, Investor Effort, Investor Optimism
(Source: Field Survey 2016)
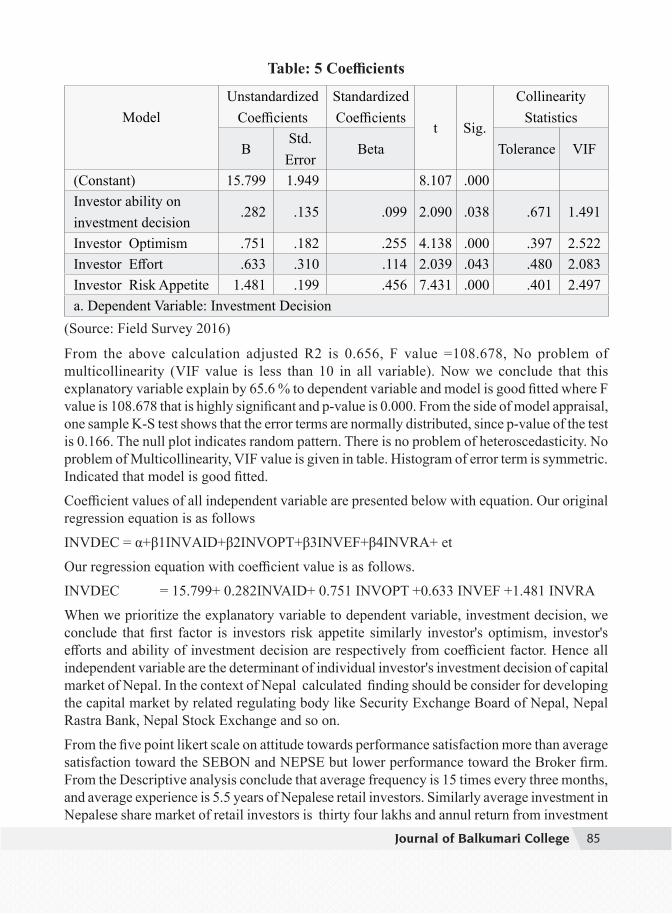
8585Journal of Balkumari College
Table: 5 Coefficients
ModelUnstandardized
CoefficientsStandardized Coefficients
t Sig.
Collinearity Statistics
BStd.
ErrorBeta Tolerance VIF
(Constant) 15.799 1.949 8.107 .000Investor ability on investment decision
.282 .135 .099 2.090 .038 .671 1.491
Investor Optimism .751 .182 .255 4.138 .000 .397 2.522Investor Effort .633 .310 .114 2.039 .043 .480 2.083Investor Risk Appetite 1.481 .199 .456 7.431 .000 .401 2.497a. Dependent Variable: Investment Decision
(Source: Field Survey 2016)
From the above calculation adjusted R2 is 0.656, F value =108.678, No problem of multicollinearity (VIF value is less than 10 in all variable). Now we conclude that this explanatory variable explain by 65.6 % to dependent variable and model is good fitted where F value is 108.678 that is highly significant and p-value is 0.000. From the side of model appraisal, one sample K-S test shows that the error terms are normally distributed, since p-value of the test is 0.166. The null plot indicates random pattern. There is no problem of heteroscedasticity. No problem of Multicollinearity, VIF value is given in table. Histogram of error term is symmetric. Indicated that model is good fitted.Coefficient values of all independent variable are presented below with equation. Our original regression equation is as follows INVDEC = α+β1INVAID+β2INVOPT+β3INVEF+β4INVRA+ et Our regression equation with coefficient value is as follows.
INVDEC = 15.799+ 0.282INVAID+ 0.751 INVOPT +0.633 INVEF +1.481 INVRA When we prioritize the explanatory variable to dependent variable, investment decision, we conclude that first factor is investors risk appetite similarly investor's optimism, investor's efforts and ability of investment decision are respectively from coefficient factor. Hence all independent variable are the determinant of individual investor's investment decision of capital market of Nepal. In the context of Nepal calculated finding should be consider for developing the capital market by related regulating body like Security Exchange Board of Nepal, Nepal Rastra Bank, Nepal Stock Exchange and so on.
From the five point likert scale on attitude towards performance satisfaction more than average satisfaction toward the SEBON and NEPSE but lower performance toward the Broker firm. From the Descriptive analysis conclude that average frequency is 15 times every three months, and average experience is 5.5 years of Nepalese retail investors. Similarly average investment in Nepalese share market of retail investors is thirty four lakhs and annul return from investment
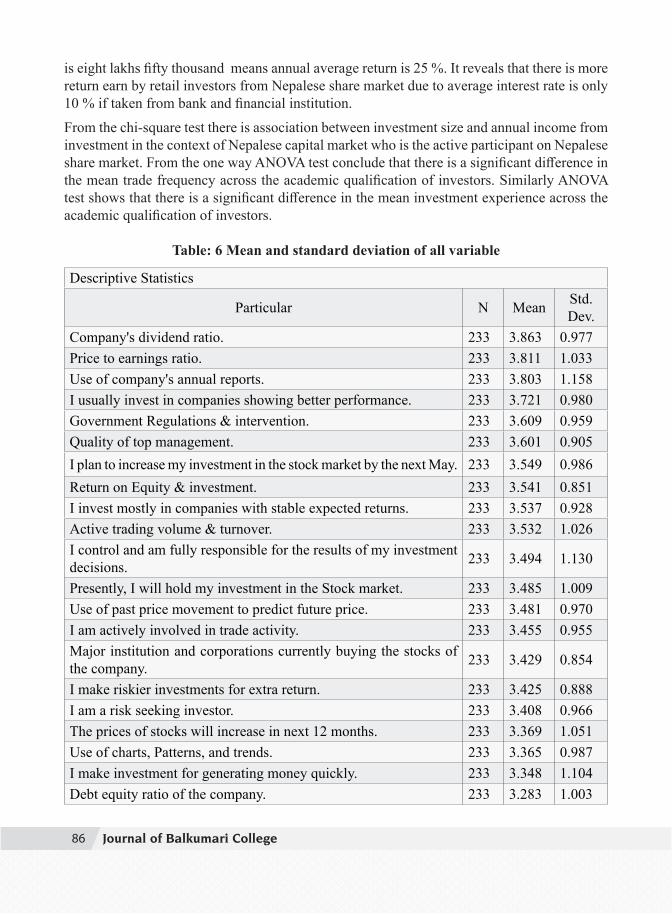
8686 Journal of Balkumari College
is eight lakhs fifty thousand means annual average return is 25 %. It reveals that there is more return earn by retail investors from Nepalese share market due to average interest rate is only 10 % if taken from bank and financial institution.
From the chi-square test there is association between investment size and annual income from investment in the context of Nepalese capital market who is the active participant on Nepalese share market. From the one way ANOVA test conclude that there is a significant difference in the mean trade frequency across the academic qualification of investors. Similarly ANOVA test shows that there is a significant difference in the mean investment experience across the academic qualification of investors.
Table: 6 Mean and standard deviation of all variable
Descriptive Statistics
Particular N Mean Std. Dev.
Company's dividend ratio. 233 3.863 0.977Price to earnings ratio. 233 3.811 1.033Use of company's annual reports. 233 3.803 1.158I usually invest in companies showing better performance. 233 3.721 0.980Government Regulations & intervention. 233 3.609 0.959Quality of top management. 233 3.601 0.905I plan to increase my investment in the stock market by the next May. 233 3.549 0.986Return on Equity & investment. 233 3.541 0.851I invest mostly in companies with stable expected returns. 233 3.537 0.928Active trading volume & turnover. 233 3.532 1.026I control and am fully responsible for the results of my investment decisions. 233 3.494 1.130
Presently, I will hold my investment in the Stock market. 233 3.485 1.009Use of past price movement to predict future price. 233 3.481 0.970I am actively involved in trade activity. 233 3.455 0.955Major institution and corporations currently buying the stocks of the company. 233 3.429 0.854
I make riskier investments for extra return. 233 3.425 0.888I am a risk seeking investor. 233 3.408 0.966The prices of stocks will increase in next 12 months. 233 3.369 1.051Use of charts, Patterns, and trends. 233 3.365 0.987I make investment for generating money quickly. 233 3.348 1.104Debt equity ratio of the company. 233 3.283 1.003
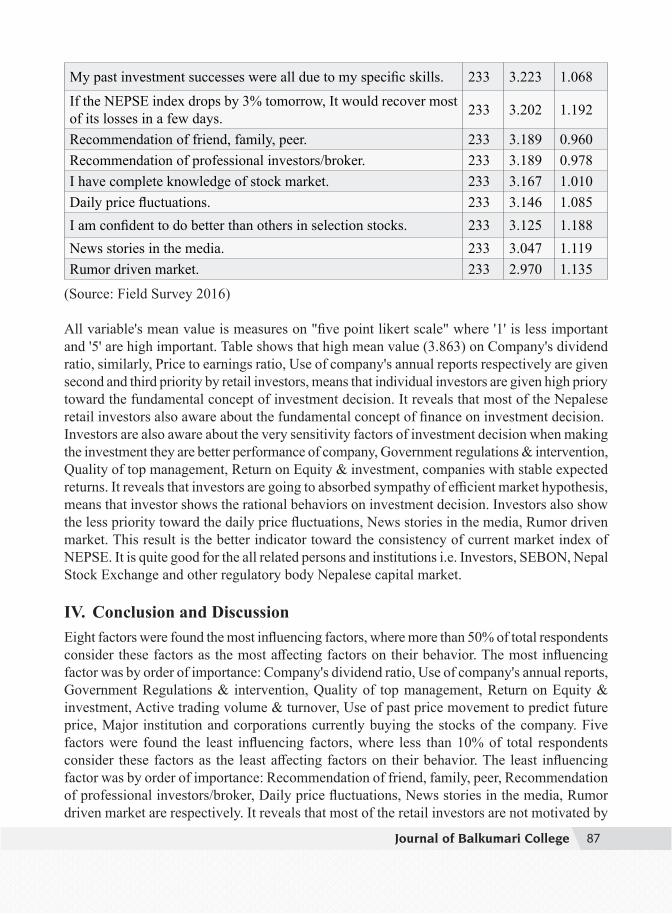
8787Journal of Balkumari College
My past investment successes were all due to my specific skills. 233 3.223 1.068If the NEPSE index drops by 3% tomorrow, It would recover most of its losses in a few days. 233 3.202 1.192
Recommendation of friend, family, peer. 233 3.189 0.960Recommendation of professional investors/broker. 233 3.189 0.978I have complete knowledge of stock market. 233 3.167 1.010Daily price fluctuations. 233 3.146 1.085I am confident to do better than others in selection stocks. 233 3.125 1.188News stories in the media. 233 3.047 1.119Rumor driven market. 233 2.970 1.135
(Source: Field Survey 2016)
All variable's mean value is measures on "five point likert scale" where '1' is less important and '5' are high important. Table shows that high mean value (3.863) on Company's dividend ratio, similarly, Price to earnings ratio, Use of company's annual reports respectively are given second and third priority by retail investors, means that individual investors are given high priory toward the fundamental concept of investment decision. It reveals that most of the Nepalese retail investors also aware about the fundamental concept of finance on investment decision. Investors are also aware about the very sensitivity factors of investment decision when making the investment they are better performance of company, Government regulations & intervention, Quality of top management, Return on Equity & investment, companies with stable expected returns. It reveals that investors are going to absorbed sympathy of efficient market hypothesis, means that investor shows the rational behaviors on investment decision. Investors also show the less priority toward the daily price fluctuations, News stories in the media, Rumor driven market. This result is the better indicator toward the consistency of current market index of NEPSE. It is quite good for the all related persons and institutions i.e. Investors, SEBON, Nepal Stock Exchange and other regulatory body Nepalese capital market.
IV. Conclusion and DiscussionEight factors were found the most influencing factors, where more than 50% of total respondents consider these factors as the most affecting factors on their behavior. The most influencing factor was by order of importance: Company's dividend ratio, Use of company's annual reports, Government Regulations & intervention, Quality of top management, Return on Equity & investment, Active trading volume & turnover, Use of past price movement to predict future price, Major institution and corporations currently buying the stocks of the company. Five factors were found the least influencing factors, where less than 10% of total respondents consider these factors as the least affecting factors on their behavior. The least influencing factor was by order of importance: Recommendation of friend, family, peer, Recommendation of professional investors/broker, Daily price fluctuations, News stories in the media, Rumor driven market are respectively. It reveals that most of the retail investors are not motivated by
8888 Journal of Balkumari College
market psychology, they try to use fundamental and technical analysis of market when make the investment decision. It is a good signal for development of capital market of Nepal.
It is found that investors have no preference in the types of market for investment but they are motivated for short term profit. The results indicate that increase in the size of investment leads to increase the frequency and investment experience. It is also seen that size of investment has positive impact on the level of involvement and negative effect on investors’ optimism, and again the results are statistically significant. Psychological factors, such ability of investment decision, investor's efforts, optimism and risk taking attitude of investors have impact on the trading frequency of investors. The respondents are quite disagreed that Nepalese investors are risk seeker and agreed that they want stable returns. It also provides evidences of using fundamental analysis tool by most of the investors while making investment decision in Nepal. Therefore, it can be concluded that investors with large investment have lower confidence, higher level of involvement, less optimism and high risk taking attitude. Likewise, investors having higher level of confidence, involvement, optimism and risk taking attitude tend to trade more frequently. Thus, share trading behavior of investors is highly influenced by their personal characteristics and psychology. From the step wise regression, when prioritize the investment decision factors, we conclude that first factor is investors risk appetite similarly investor's optimism, investor's efforts and investors ability of investment decision are respectively from coefficient factor. Hence all independent variable are the determinant of individual investor's investment decision of capital market of Nepal. Finally there is a space to conduct the research in Nepalese stock market from the perspective of technical analysis as well as to investigate in the stock market in other forms of efficient market hypothesis which the study has not covered. Nepal Stock Exchange (NEPSE) Limited is only the stock market of the Nepal. The Nepalese investors have no other option or platform as a stock market investor. There is no option for arbitrage in the secondary market in Nepal. Similarly there is no facility for the derivation market as well. In such a scenario, The Nepalese investors have to invest and make a portfolio considering or taking in mind of having only one stock market.At the same time the market capitalization of the Nepalese stock market is covered by only few sectors that is bank and financial institution and insurance also, least by Hydro and manufacturing sectors only with no choice of portfolio diversification with in the stock market. In such a scenario the idea of investment behavior of the retail investors and investment decision through the research and study will give a proper insight about the nature of the market.
The result from the investment behavior, investment decision, and influencing factors of research helps the general investors regarding the stage of Nepalese stock market is going through and at what the market need to improve regarding the information flow. Majority of the investors are motivated for earning short term profit in their investment, which is not good sign for the development of stock market in Nepal. Listed companies, stock exchange and Security Board of Nepal are suggested to take necessary initiatives to make profitable long term investment. The behavior of individual investors is indeed to some extent irrational when considered from a standard finance point of view. It is found that Individual investors have high level of involvement and overconfidence while they are not much optimistic about the

8989Journal of Balkumari College
future outlook of market. Rational investors should be optimistic about the future outlook when they have high level of involvement and overconfidence. Finally, to understand the decision making process of investors, future researchers is recommended to use Analytical Hierarchical Process (AHP).
Survey QuestionnaireFactors Influencing Investment Decisions in Capital Market:
A Study of Individual Investors in Nepal
1a. Age: - ……………(In Years) 1b. Sex: - (a) Male [ ] (b) Female [ ]1c. Marital Status: - (a) Married [ ] (b) Single [ ]1. What is your educational qualification? a. Below Bachelors [ ] b. Bachelors [ ] c. Masters [ ] d. M. Phil/Ph.D. [ ]2. What is your investment experience in stock market:-……………(In years)3. How many times you trade (buying and selling) shares in market? ............ Times (During
3 months)4. What is your average gross annual investment to stock Market? ..Lakhs (Annual)5. What is your average gross annual income from Stock Market? Percentage (Annual)6. How frequently do you monitor your investment in stocks market? a. Daily [ ] b. Weekly [ ] c. Monthly [ ] d. Quarterly [ ] 7. Which market do you prefer for investment? a. Primary Market [ ] b. Secondary market [ ] c. Both [ ] 8. What are your investment objectives? a. Short term profit seeking [ ] b. Stable income (Dividends) [ ] c. Long term profit seeking [ ] d. Others [ ]9. How often do you look at the financial ratios of company that you want to invest? a. Always [ ] b. Very frequently [ ] c. Occasionally [ ] d. Very rarely [ ] e. Never [ ] 10. Which sources of information do you use to analyze shares for investment? (Please tick more than one as per your requirement) a. Newspaper [ ] b. Website of NEPSE [ ] c. Company Website [ ] d. Brokerage firm [ ] e. Annual report of company [ ]11. Please Tick the following
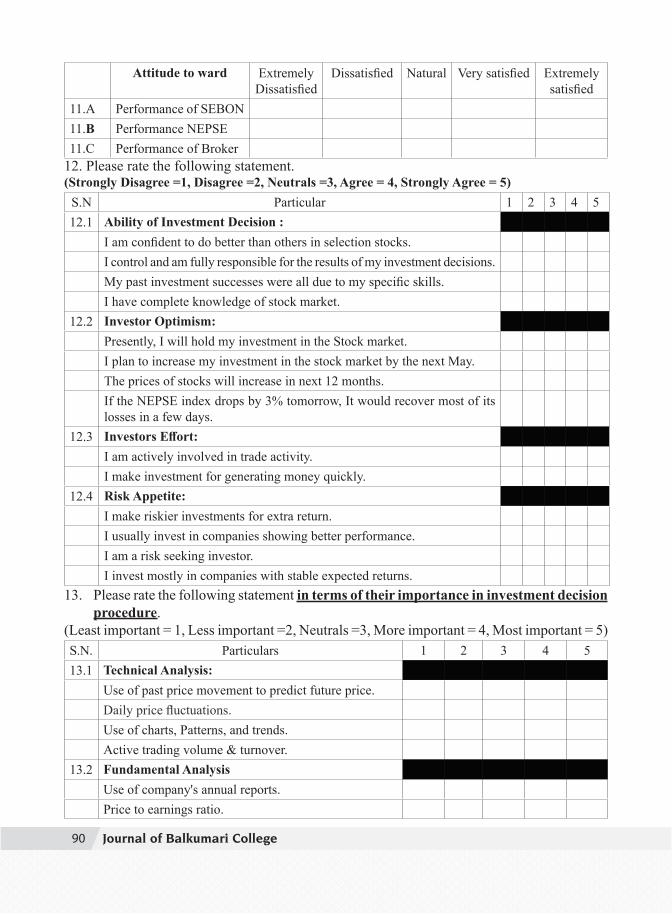
9090 Journal of Balkumari College
Attitude to ward ExtremelyDissatisfied
Dissatisfied Natural Very satisfied Extremely satisfied
11.A Performance of SEBON11.B Performance NEPSE11.C Performance of Broker
12. Please rate the following statement.(Strongly Disagree =1, Disagree =2, Neutrals =3, Agree = 4, Strongly Agree = 5)
S.N Particular 1 2 3 4 512.1 Ability of Investment Decision :
I am confident to do better than others in selection stocks.I control and am fully responsible for the results of my investment decisions.My past investment successes were all due to my specific skills.I have complete knowledge of stock market.
12.2 Investor Optimism:Presently, I will hold my investment in the Stock market. I plan to increase my investment in the stock market by the next May.The prices of stocks will increase in next 12 months.If the NEPSE index drops by 3% tomorrow, It would recover most of its losses in a few days.
12.3 Investors Effort:I am actively involved in trade activity. I make investment for generating money quickly.
12.4 Risk Appetite:I make riskier investments for extra return.I usually invest in companies showing better performance.I am a risk seeking investor. I invest mostly in companies with stable expected returns.
13. Please rate the following statement in terms of their importance in investment decision procedure.
(Least important = 1, Less important =2, Neutrals =3, More important = 4, Most important = 5)S.N. Particulars 1 2 3 4 513.1 Technical Analysis:
Use of past price movement to predict future price.Daily price fluctuations. Use of charts, Patterns, and trends. Active trading volume & turnover.
13.2 Fundamental Analysis Use of company's annual reports.Price to earnings ratio.
9191Journal of Balkumari College
Company's dividend ratio.Debt equity ratio of the company. Return on Equity & investment.Government Regulations & intervention. Quality of top management.
13.3 Market Psychology:Rumor driven market.News stories in the media.Recommendation of professional investors/broker.
Recommendation of friend, family, peer.Major institution and corporations currently buying the stocks of the company.
References AFOLABI, Michael Oluseye (2013) " Effect of Financial Reporting on Investment Decision
Making of Manufacturing Firms in Nigeria" European Journal of Humanities and Social Sciences Vol. 22, No.1, 2013
Alfredo, M.O, and Vicente, S. F. (Jul. 2010). I.T. investment and intangibles: evidence from banks, SSRN Working Paper Series.
Baker, H. K. & Nofsinger, J. R. (2010). Behavioral Finance: Investors, Corporations, and Markets, New York: John Wiley & Sons.
Baker, H.K and Haslem, J.A. (1973), "Information needs of individual investors", Journal of Accountancy, Vol. 136, pp.64-9.
Baker, H.K., M.B. Hargrove, and J.A. Haslem.(1977) “An Empirical Analysis of the Risk Return Preferences of individual investos,” Journal of Financial and Quantitative Analysis, Vol. 12, No. 3, pp. 377-389.
Barber, B. M. & Odean, T. (1999). The Courage of Misguided Convictions.Financial Analysts Journal, 55(6), 1.
Barber, B. M. & Odean, T. (2011). The Behaviour of Individual Investors. California: University of California Press.
Barber, B.M. & Terrance, O. (2000). Trading is hazardous to your wealth: The common stock investment performance of individual investors, Journal of Finance 55, 773-806.
Becket, M. (2012). How the Stock Market Works: A Beginner's Guide to Investment. London: Kogan Page Publishers.
Cooper, D. R & Schindler, P.M. (2008), Business Research Methods, New Delhi: TataMcGraw Hill.
DeBondt, W. F. M. &Thaler, R. (1985). Does the Stock Market Overreact? The Journal of Finance, 40, 793-805.
DeBondt, W. F. M. &Thaler, R. H. (1987).Further Evidence on Investor Overreaction and Stock Market Seasonality.The Journal of Finance, 42, 557581.
9292 Journal of Balkumari College
Devkota, B.P., Upadhyaya, S.K. and Joshi, M.R. (2007), Development of Financial Institutions in Nepal, Kathmandu, Tribhuvan University, Centre for Economic Development and Administration (CEDA).
Fama, E. F. & French, K.R. (1992).The Cross-Section of Expected Stock Returns. The Journal of Finance, 47(2), 427-465.
Financial System and Economic Development, Nepal Rastra Bank in Fifty Years, Part –II, Financial System, Kathmandu, Nepal Rastra Bank.
GnaniDharmaja .V,Ganesh .J, Dr. Santhi .V ” A Study on the Individual Investor Behavior with Special Referance to Geojit BNP Paribas Financial Service Ltd, Coimbatore. ” IRACST- International Journal of Research in Management & Technology (IJRMT), ISSN: 2249-9563 Vol. 2 No.2, April 2012
Griffin, D. and Tversky, A. (1992.The weighing of evidence and the determinants of confidence, Cognitive Psychology, 24, 411–435.
Griffin, D. and Tversky, A. (1992.The weighing of evidence and the determinants of confidence, Cognitive Psychology, 24, 411–435.
Gilovich, 1999 : The Endowment Effect, Loss Aversion, and Status Quo Bias, Journal of Economic Perspectives, 5(1), 193-206.
Grossman, S. J. and Stiglitz, J.E. (1980).On the impossibility of informationally efficient markets. American Economic Review, 70, pp. 393-408.
K.C., B. (2010). Stock Market Development in Nepal.SEBON Journal, 4, pp.77-94.Paudel, N. P. (2005).
Kahneman, D. &Tversky, A. (1979). Prospect Theory: An Analysis of Decision under Risk. Econometrica, XL (VII), 263-291.
Lakonishok, J., Shleifer, A. &Vishny, R. W. (1994). Contrarian Investment, Extrapolation, Price-Earnings Ratios: A Test of the Efficient Market Hypothesis. The Journal of Finance, 32 (3), 663-682.
LeRoy, S. F., and Porter, R.D. (1981). The present-value relation: tests based on implied variance bounds. Econoometrica , 49, pp. 555-574.
MacCrimmon, K. R., &Wehrung, D. A. (1986).Taking risks. New York: The Free Press.Markowitz, H. (1952). Portfolio Selection. The Journal of Finance, 7(1), 77-91. McDermott, R., James H. F.& Smirnov, O. (2008). On the Evolutionary Origin of Prospect
Theory Preferences. Journal of Politics, 70(2), 335-350.Mehmet Islamoglu, Mehmet Apan, AdemAyvali " Determination of factors Affecting
Individuals Investor Behaviors : A Study on Bankers "International Journal of Economics and Financial Issues, 2015,5(2),531-543.
Nagy and Obenberger, (1994) “Factors influencing investor behavior”, Financial Analysts Journal, Vol.50.
Nofsinger and Richard, (2002). Individual investments behaviour, New york, McGraw-Hill Potter,of the Academy of Financial Services.
Rattiner, J. H. (2009). Rattiner's Review for the CFP(R) Certification Examination, Fast Track, Study Guide. New York: John Wiley and Sons.
9393Journal of Balkumari College
Razek, Y. H. A. (2011). An Overview of Behavioral Finance and Revisiting the Behavioral Life Cycle Hypothesis, The IUP Journal of Behavioral Finance, VIII (3), 7-24.
Ritter, J. R. (2003). Behavioral Finance.Pacific-Basin Finance Journal, 11(4), 429437.SamreenLodhi (2014) " Factors Influencing Individual Investor Behavior: An Empirical Study
of City Karachi " IOSR Journal of Business and Management (IOSR-JBM) e-ISSN: 2278-487X, p-ISSN: 2319-7668. Volume 16, Issue 2. Ver. III (Feb. 2014), PP 68-76 www.iosrjournals.org
Sewell, M. (2005).Behavioural finance. Retrieved from http://www.behaviouralfinance.netShefrin, H. (1999), Beyond Greed and Fear, Harvard Business School Press, Boston, MA.Shiller, R. J. (1979). The volatility of long-term interest rates and expectations models of the
term structure. The Journal of Political Economy, 87(6), pp. 1190-1219. Slovic, P. (1972). Psychological study of human judgment: implications for investment decision
making. Journal of Finance , 27(4), pp.779-799. Stiglitz, J. E. (1994). The role of the state in financial markets.Proceedings of the World Bank
Annual Conference on Development Economics, Washington.Sung, J., & Hanna, S. (1996a). Factors related to household risk-tolerance: An Ordered Probit
Analysis. Consumer Interests Annual, 42, 227-228.Thaler, R. H. (1999).Mental Accounting Matters. Journal of Behavioural Decision Making,
12(3), 183-206.
9494 Journal of Balkumari College
Abstract
This research work intends to investigate the “Customers Attitude on e-Security to Smart Cards in Narayangarh: Technology Satisfaction” The study covered randomly selected customers Narayangarh. Eighty two questionnaires were filled and returned by the respondents out of distributed 200. The participants were drawn randomly from different ATM center and POS. The selection was done in such a way that to include all categories of customers (students, bureaucrats, housewife….) and cut across the gender. The result reveals that quality service (awareness, anxiety, ease of use, usefulness, support and security.) and ATM are the major factors that influence customer satisfaction significantly in Narayangarh with R2 = 78% and the null hypothesis is rejected and verified the model: ASC = β0 + β1 X1 + β2 X2+ β3 X3 + β4 X4 + β5 X5 + β6 X6 + ∈.
Key words: ATM, Point of sales, Smart cards, Security and Technology Satisfaction.
BackgroundFinancial institutions and their customers were slow to respond to the new technology, but by the end of the 1970’s ATMs had gained widespread acceptance within the banking industry (Rathband & Anderson, 1999). The 1980’s and 1990’s showed considerable expansion of the ATM market, which is expected to continue as ATMs are increasingly placed in retail establishments and other locations beyond the traditional banking environments (Wikipedia).A smart card consists of a chip and an integral operating system. The chip contains a processor, arithmetic processing registers, random access memory (RAM) used during program execution, read only memory (ROM) to house the operating systems (Shen, 1995).The smart card must be inserted in a reader/writer, machine that supplies power to the chip and the connection for communication. Smart cards can be used as debit, credit or stored-value cards in the transit environment (wikipedia). In addition, smart cards are ideal for use in a harsh environment, which transit is. The concept of a smart card was developed by Roland Moreno, in 1974 (Townsend, 1993). However, the card was first patented in Japan by Kunitaka Arimura of the Arimura Technology (Joshi., 1993). Most credit cards are issued by local banks or credit unions, and are the shape and size specified by the ISO/IEC 7810 (ISO, 2003) standard as ID-1. Almost all twenty nine commercial banks (NRB)in Nepal issued both smart cards in Nepal
Customers Attitude on e-Security to Smart Cards at Narayangarh: Technology Satisfaction
Ramesh KhanalFaculty of applied Mathematics, Balkumari College
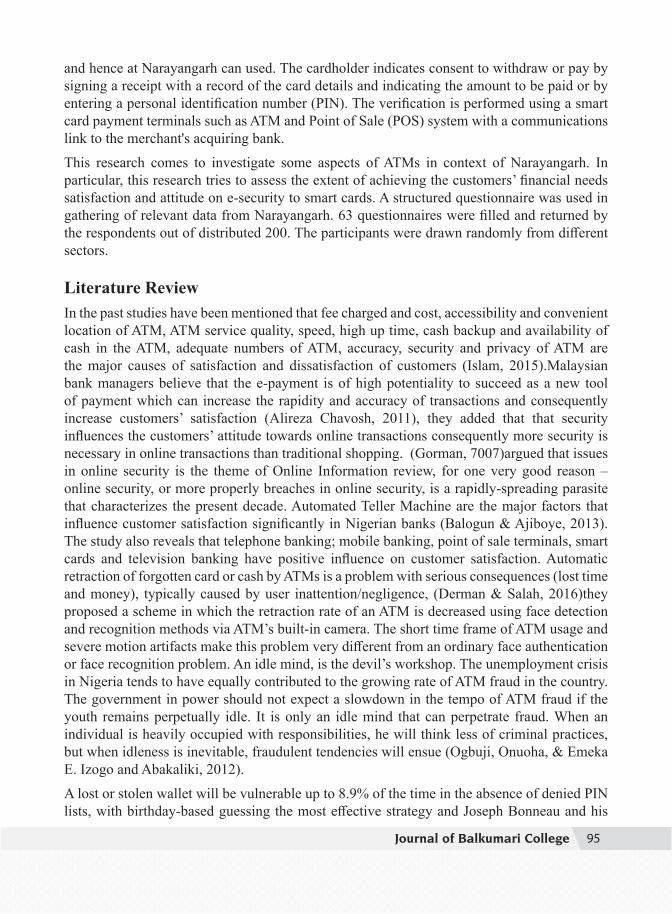
9595Journal of Balkumari College
and hence at Narayangarh can used. The cardholder indicates consent to withdraw or pay by signing a receipt with a record of the card details and indicating the amount to be paid or by entering a personal identification number (PIN). The verification is performed using a smart card payment terminals such as ATM and Point of Sale (POS) system with a communications link to the merchant's acquiring bank.
This research comes to investigate some aspects of ATMs in context of Narayangarh. In particular, this research tries to assess the extent of achieving the customers’ financial needs satisfaction and attitude on e-security to smart cards. A structured questionnaire was used in gathering of relevant data from Narayangarh. 63 questionnaires were filled and returned by the respondents out of distributed 200. The participants were drawn randomly from different sectors.
Literature Review In the past studies have been mentioned that fee charged and cost, accessibility and convenient location of ATM, ATM service quality, speed, high up time, cash backup and availability of cash in the ATM, adequate numbers of ATM, accuracy, security and privacy of ATM are the major causes of satisfaction and dissatisfaction of customers (Islam, 2015).Malaysian bank managers believe that the e-payment is of high potentiality to succeed as a new tool of payment which can increase the rapidity and accuracy of transactions and consequently increase customers’ satisfaction (Alireza Chavosh, 2011), they added that that security influences the customers’ attitude towards online transactions consequently more security is necessary in online transactions than traditional shopping. (Gorman, 7007)argued that issues in online security is the theme of Online Information review, for one very good reason –online security, or more properly breaches in online security, is a rapidly-spreading parasite that characterizes the present decade. Automated Teller Machine are the major factors that influence customer satisfaction significantly in Nigerian banks (Balogun & Ajiboye, 2013). The study also reveals that telephone banking; mobile banking, point of sale terminals, smart cards and television banking have positive influence on customer satisfaction. Automatic retraction of forgotten card or cash by ATMs is a problem with serious consequences (lost time and money), typically caused by user inattention/negligence, (Derman & Salah, 2016)they proposed a scheme in which the retraction rate of an ATM is decreased using face detection and recognition methods via ATM’s built-in camera. The short time frame of ATM usage and severe motion artifacts make this problem very different from an ordinary face authentication or face recognition problem. An idle mind, is the devil’s workshop. The unemployment crisis in Nigeria tends to have equally contributed to the growing rate of ATM fraud in the country. The government in power should not expect a slowdown in the tempo of ATM fraud if the youth remains perpetually idle. It is only an idle mind that can perpetrate fraud. When an individual is heavily occupied with responsibilities, he will think less of criminal practices, but when idleness is inevitable, fraudulent tendencies will ensue (Ogbuji, Onuoha, & Emeka E. Izogo and Abakaliki, 2012).
A lost or stolen wallet will be vulnerable up to 8.9% of the time in the absence of denied PIN lists, with birthday-based guessing the most effective strategy and Joseph Bonneau and his

9696 Journal of Balkumari College
team advised users not to use PINs based on a date of birth, and those banks which do not currently employ blacklists to immediately do so (Joseph Bonneau, 2010).
Smart cards are emerging as the desirable new fare collection medium because of the numerous problems associated with the operations and maintenance of the magnetic stripe cards. Smart cards can be used as debit, credit or stored-value cards for transit. Fraud and fare evasion can also be reduced by adopting the smart cards -based fare systems. The cards are more difficult to counterfeit than tokens or magnetic stripe card, and they can be programmed to prevent immediate re-use (N. 0. Attoh-Okine and L. David Shen, 1995). (G¨uney Kayım, 2016) Kaym and his friends proposed a multimodal authentication system that operates under the constraints imposed by this applications scenario, and implement face recognition and color based body appearance recognition to create a system that improves ATM behavior in case of forgotten card or cash by re-identifying the user from an embedded ATM camera. Among the fast growing usage of new technologies, smart card technology has an outstanding growth and making its way worldwide into the hands and wallets of everyone (Masrom, 2009). In fact, smart cards greatly improve the comfort and security of any transaction they added. It is important to note that consumer acceptance and confidence are vital for the further development of smart card technology. Adoption of smart card technologies should not be made simply, knowing the customers perception of and behavioral intention to use technology should be a key in the decision making process. (Mandal, 2013)Today’s life is so busy that spending a valuable second cost so much. In, such situation if money flow is possible swiftly by just one swipe it would be a great relief. Biometric based authentication can be a new approach to satisfy user needs by replacing pass word based authentication. Among all biometric techniques fingerprinting is the oldest and secured methodology practiced till date. Susmita proposed system user can transact money by placing his/her thumb imprint on new proposed ATM card. This new system will smoothen the transaction with security. PIN is used for security in ATMs and authentication is provided to the users by entering the PIN. These PIN numbers can be hacked easily through specific fraudulent activities and it can be observed by human or device attackers (Morris & G.B, 2003). Varalakshmi described about attacks on pin entry and secure ATM transactions methods used to reduce physical and electronic theft in ATMs.
MethodologyThis research model is developed based on Technology Acceptance Model (TAM) (FD., 1986).Diffusion of Innovation Theory (Rogers, 1995), Unified Theory of Acceptance and Use of Technology (UTAUT) (Morris & G.B, 2003), Extension of Technology Acceptance Model (TAM2) (Venkatesh & F.D., 2000) and the model which was used in a research by (Cheng., 2003). Fig.1 shows a schematic view of this model. Quantitative research qualitative both methodology has been used in this research
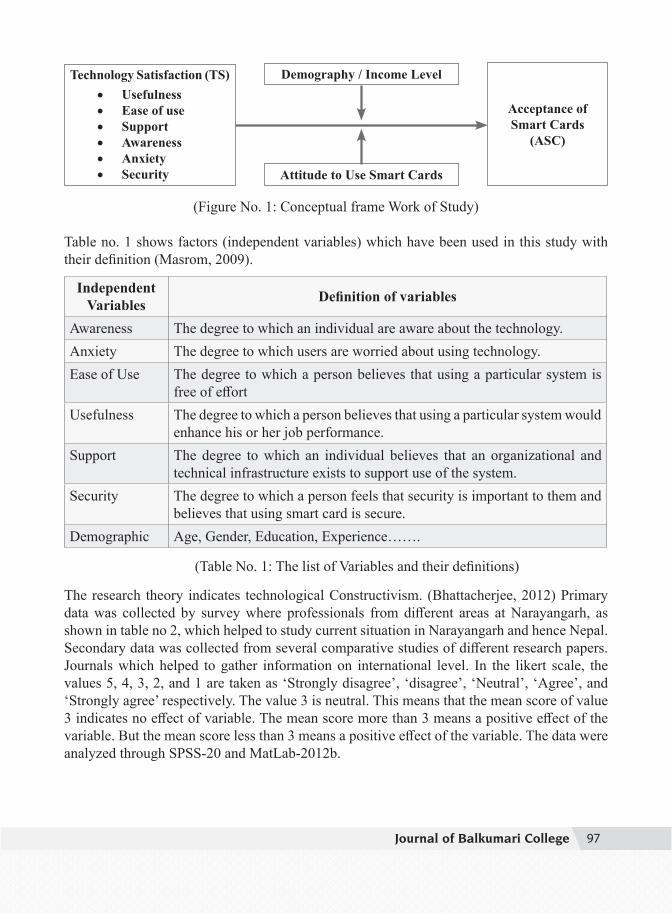
9797Journal of Balkumari College
Technology Satisfaction (TS)• Usefulness• Ease of use• Support• Awareness• Anxiety• Security
Demography / Income Level
Attitude to Use Smart Cards
Acceptance of Smart Cards
(ASC)
(Figure No. 1: Conceptual frame Work of Study)
Table no. 1 shows factors (independent variables) which have been used in this study with their definition (Masrom, 2009).
Independent Variables Definition of variables
Awareness The degree to which an individual are aware about the technology.Anxiety The degree to which users are worried about using technology.Ease of Use The degree to which a person believes that using a particular system is
free of effortUsefulness The degree to which a person believes that using a particular system would
enhance his or her job performance.Support The degree to which an individual believes that an organizational and
technical infrastructure exists to support use of the system.Security The degree to which a person feels that security is important to them and
believes that using smart card is secure.Demographic Age, Gender, Education, Experience…….
(Table No. 1: The list of Variables and their definitions)
The research theory indicates technological Constructivism. (Bhattacherjee, 2012) Primary data was collected by survey where professionals from different areas at Narayangarh, as shown in table no 2, which helped to study current situation in Narayangarh and hence Nepal. Secondary data was collected from several comparative studies of different research papers. Journals which helped to gather information on international level. In the likert scale, the values 5, 4, 3, 2, and 1 are taken as ‘Strongly disagree’, ‘disagree’, ‘Neutral’, ‘Agree’, and ‘Strongly agree’ respectively. The value 3 is neutral. This means that the mean score of value 3 indicates no effect of variable. The mean score more than 3 means a positive effect of the variable. But the mean score less than 3 means a positive effect of the variable. The data were analyzed through SPSS-20 and MatLab-2012b.

9898 Journal of Balkumari College
Data Presentation and AnalysisAnalysis of respondent
Table no 2 represents that 51% of respondents are female. Moreover 38.77%, 26.53%, 22.48% and 12.24% of male are businessmen, students, bureaucrat and other respectively and 68.6% of female are housewife.
OccupationsGender
TotalMale Female
Business Men 19% 5% 24%Students 13% 8% 21%
Housewife 0% 35% 35%Bureaucrat 11% 1.5% 12.5%
Others 6% 1.5% 7.5%Total 49% 51% 100%
(Table no 2: Cross Tabulation of occupation and gender)
Status of smarts cards Figure no. 2 indicates that 22.22% of businessman have their own smart cards and 22.50% of housewife and 20.5% of students do not have own smart cards because most of
22.22%
6.34%
11.11% 12.70%
8%
1.50%
10.50%
22.50%
0 0 0.00%
5.00%
10.00%
15.00%
20.00%
25.00%
Businessman Student Housewife Bureaucrat OthersYes No
(Figure no 2: Occupation wise own Smart Cards)
The parents and husbands whose home banks are outside the city or nation has given their smart cards to student and housewife respectively. All of bureaucrat and others are using their own smart cards. Furthermore, 70% of smart cards were used on both outside the na-tion and in the nation, 23% and 7% were used on own city and on nation. Similarly 65% of respondents used smart cards in both cash withdraw and point of sales and remaining used only in cash withdraw. 46% of respondents have only one smart cards whereas19%, 16%, 13% and 6% had 3, 4, 2, and 5 cards respectively. Finally 37% of respondents have used smart
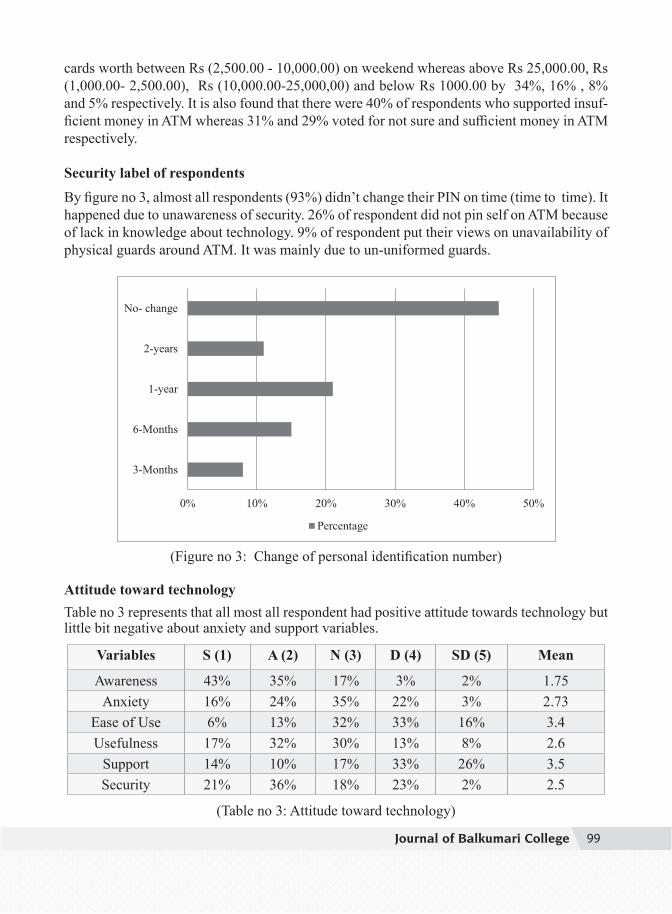
9999Journal of Balkumari College
cards worth between Rs (2,500.00 - 10,000.00) on weekend whereas above Rs 25,000.00, Rs (1,000.00- 2,500.00), Rs (10,000.00-25,000,00) and below Rs 1000.00 by 34%, 16% , 8% and 5% respectively. It is also found that there were 40% of respondents who supported insuf-ficient money in ATM whereas 31% and 29% voted for not sure and sufficient money in ATM respectively.
Security label of respondents
By figure no 3, almost all respondents (93%) didn’t change their PIN on time (time to time). It happened due to unawareness of security. 26% of respondent did not pin self on ATM because of lack in knowledge about technology. 9% of respondent put their views on unavailability of physical guards around ATM. It was mainly due to un-uniformed guards.
0% 10% 20% 30% 40% 50%
3-Months
6-Months
1-year
2-years
No- change
Percentage
(Figure no 3: Change of personal identification number)
Attitude toward technologyTable no 3 represents that all most all respondent had positive attitude towards technology but little bit negative about anxiety and support variables.
Variables S (1) A (2) N (3) D (4) SD (5) Mean
Awareness 43% 35% 17% 3% 2% 1.75Anxiety 16% 24% 35% 22% 3% 2.73
Ease of Use 6% 13% 32% 33% 16% 3.4Usefulness 17% 32% 30% 13% 8% 2.6
Support 14% 10% 17% 33% 26% 3.5Security 21% 36% 18% 23% 2% 2.5
(Table no 3: Attitude toward technology)
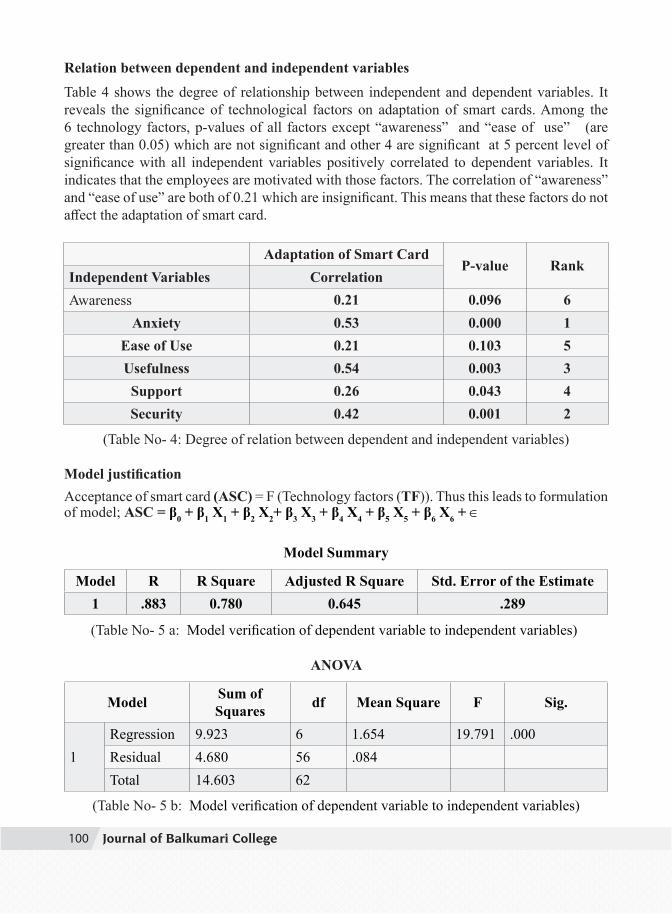
100100 Journal of Balkumari College
Relation between dependent and independent variables
Table 4 shows the degree of relationship between independent and dependent variables. It reveals the significance of technological factors on adaptation of smart cards. Among the 6 technology factors, p-values of all factors except “awareness” and “ease of use” (are greater than 0.05) which are not significant and other 4 are significant at 5 percent level of significance with all independent variables positively correlated to dependent variables. It indicates that the employees are motivated with those factors. The correlation of “awareness” and “ease of use” are both of 0.21 which are insignificant. This means that these factors do not affect the adaptation of smart card.
Adaptation of Smart CardP-value Rank
Independent Variables CorrelationAwareness 0.21 0.096 6
Anxiety 0.53 0.000 1Ease of Use 0.21 0.103 5Usefulness 0.54 0.003 3Support 0.26 0.043 4Security 0.42 0.001 2
(Table No- 4: Degree of relation between dependent and independent variables)
Model justificationAcceptance of smart card (ASC) = F (Technology factors (TF)). Thus this leads to formulation of model; ASC = β0 + β1 X1 + β2 X2+ β3 X3 + β4 X4 + β5 X5 + β6 X6 + ∈
Model Summary
Model R R Square Adjusted R Square Std. Error of the Estimate1 .883 0.780 0.645 .289
(Table No- 5 a: Model verification of dependent variable to independent variables)
ANOVA
Model Sum of Squares df Mean Square F Sig.
1Regression 9.923 6 1.654 19.791 .000Residual 4.680 56 .084Total 14.603 62
(Table No- 5 b: Model verification of dependent variable to independent variables)
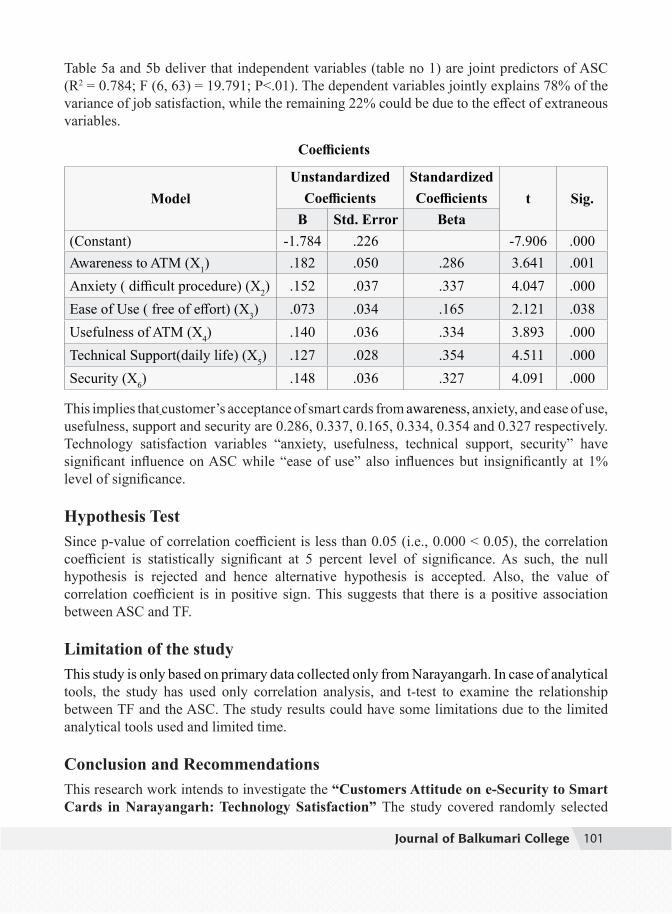
101101Journal of Balkumari College
Table 5a and 5b deliver that independent variables (table no 1) are joint predictors of ASC (R2 = 0.784; F (6, 63) = 19.791; P<.01). The dependent variables jointly explains 78% of the variance of job satisfaction, while the remaining 22% could be due to the effect of extraneous variables.
Coefficients
ModelUnstandardized
CoefficientsStandardized Coefficients t Sig.
B Std. Error Beta(Constant) -1.784 .226 -7.906 .000Awareness to ATM (X1) .182 .050 .286 3.641 .001Anxiety ( difficult procedure) (X2) .152 .037 .337 4.047 .000Ease of Use ( free of effort) (X3) .073 .034 .165 2.121 .038Usefulness of ATM (X4) .140 .036 .334 3.893 .000Technical Support(daily life) (X5) .127 .028 .354 4.511 .000Security (X6) .148 .036 .327 4.091 .000
This implies that customer’s acceptance of smart cards from awareness, anxiety, and ease of use, usefulness, support and security are 0.286, 0.337, 0.165, 0.334, 0.354 and 0.327 respectively. Technology satisfaction variables “anxiety, usefulness, technical support, security” have significant influence on ASC while “ease of use” also influences but insignificantly at 1% level of significance.
Hypothesis TestSince p-value of correlation coefficient is less than 0.05 (i.e., 0.000 < 0.05), the correlation coefficient is statistically significant at 5 percent level of significance. As such, the null hypothesis is rejected and hence alternative hypothesis is accepted. Also, the value of correlation coefficient is in positive sign. This suggests that there is a positive association between ASC and TF.
Limitation of the studyThis study is only based on primary data collected only from Narayangarh. In case of analytical tools, the study has used only correlation analysis, and t-test to examine the relationship between TF and the ASC. The study results could have some limitations due to the limited analytical tools used and limited time.
Conclusion and RecommendationsThis research work intends to investigate the “Customers Attitude on e-Security to Smart Cards in Narayangarh: Technology Satisfaction” The study covered randomly selected
102102 Journal of Balkumari College
customers Narayangarh. Eighty two questionnaires were filled and returned by the respondents out of distributed 200. The participants were drawn randomly from different ATM center and POS. The selection was done in such a way that to include all categories of customers (students, bureaucrats, housewife….) and cut across the gender. The result reveals that quality service (awareness, anxiety, ease of use, usefulness, support and security.) and ATM are the major factors that influence customer satisfaction significantly in Narayangarh with R2 = 78% and the null hypothesis is rejected and verified the model: ASC = β0 + β1 X1 + β2 X2+ β3 X3 + β4 X4 + β5 X5 + β6 X6 + ∈.
Customers can now have access to their account outside working hours to make withdrawal through ATM and POS to attend to their needs. This has also resulted in higher customer satisfaction. Based on the findings of the study, it is therefore recommended that management should improve on the service quality, increase the numbers of ATM dispensers, POS, e-security awareness, confidentiality of consumer data should be protected.
BibliographyAlireza Chavosh, A. B. (2011). Comparing The Satisfaction with The Banks E-payment Services
between Degree Holder and Non-Degree Holder Customers in Penang-Malaysia. International Journal of e-Education, e-Business, e-Management and e-Learning,, 1(2), 132-138.
Balogun, O. J., & Ajiboye, F. a. (2013). An Investigative Study on Factors Influencing the Customer Satisfaction with E-Banking in Nigeria. International Journal of Academic Research in Economics and Management Sciences, 2(6), 64-73. doi:10.6007/IJAREMS/v2-i6/442
Bhattacherjee, A. (2012). Social Science Research: Principles Methods, and Practices (Vol. 3). USF Open Access Textbooks Collection.
Cheng., C. H. (2003). Comparing smart card adoption in Singapore and Australian universities. International Journal of Human-Computer study, 58(3), 303-325.
Cochran, W. G. (n.d.). Sampling Techniques (Vol. 3). Wiley.Derman, E., & Salah, Y. K. (2016). SHORT TERM FACE RECOGNITION FOR AUTOMATIC
TELLER MACHINE (ATM) USERS. 111-114. doi:10.1109/IWBF.2016.7449682FD., D. (1986). A technology acceptance model for empirically testing new end user information
systems: theory and results. Sloan School of Management, MIT, Massachusetts Institute of Technology.
G¨uney Kayım, E. D. (2016). SHORT TERM RE-IDENTIFICATION OF AUTOMATIC TELLER MACHINE (ATM) USERS VIA FACE AND BODY APPEARANCE FEATURES. IEEE, 1-6. doi:10.1109/IWBF.2016.7449682
Gorman. (7007). Who am I, and where’s my money? Issues in online security. Online Information Review Vol. 31 No. 5, 2007, pp. 561, 31(5), 561-565.
Islam, T. (2015). Customers’ Satisfaction and ATM Services: The Case of Bangladesh. World Review of Business Research, 5(3), 121-139.
103103Journal of Balkumari College
ISO. (2003). Retrieved from http://www.iso.org/iso/catalogue_detail?csnumber=31432Joseph Bonneau, S. P. (2010). A birthday present every eleven wallets? The security of customer-
chosen banking PINs. University of Cambridge,Computer Laboratory.Joshi., A. (1993). Get Electronic Card Smart. Chicago, Ill: Fare Collection and Police/security
Workshop.Mandal, S. (2013). A Review on Secured Money Transaction A Review on Secured Money
Transaction Secured Money Transactionwith Fingerprint Technique in ATM System. International Journal of Computer Science and Network, 2(4), 8-11. Retrieved from https://arxiv.org/ftp/arxiv/papers/1307/1307.8043.pdf
Masrom, H. T. (2009, June 22-25,). An Examination of Smart Card Technology Acceptance Using Adoption. 31st Int. Conf. on Information Technology Interfaces,, 329-334.
Morris, V. V., & G.B, D. ,. (2003). User acceptance of information technology: toward a unified view. MIS, Quarterly, 27(3), 425-478.
N. 0. Attoh-Okine and L. David Shen. (1995). Security Issues of Emerging Smart Cards Fare Collection Application in Mass Transit. IEEE, 523-526. doi:10.1109/VNIS.1995.518887
Norman R. Draper, H. S. (2011). Applied Reigression Analysis. Wiley.NRB. (n.d.). Retrieved from http://nrb.org.np/index.phpOgbuji, C. N., Onuoha, C. B., & Emeka E. Izogo and Abakaliki, N. (2012). Analysis of the
Negative Effects of the Automated Teller Machine (ATM) as a Channel for Delivering Banking Services in Nigeria. International Journal of Business and Management, 7(7), 180-190. doi:10.5539/ijbm.v7n7p180
Rathband, P., & Anderson, R. (1999). A case study of refurbishment and re-sale of automatic teller machines. Proceedings of the 1999 IEEE International Symposium on. doi: 10.1109/ISEE.1999.765894
Richard I Levin, D. S. (2010). Statistic for Management (Vol. 7). Pearson.Rogers, E. (1995). The Diffusion of Innovation (4 th).Shen, N. O.-O. (1995). Security issues of emerging smart cards fare collection application
in mass transit. Vehicle Navigation and Information Systems Conference,IEEE. doi: 10.1109/VNIS.1995.518887
Venkatesh, V., & F.D., D. (2000). A theoretical extension of the technology acceptance Model. Four longitudinal field studies Management Science(46), 186-204.
wikipedia. (n.d.). Retrieved from https://en.wikipedia.org/wiki/Smart_cardWikipedia. (n.d.). Retrieved from https://en.wikipedia.org/wiki/Cash_machine
104104 Journal of Balkumari College
AbstractShareholders prefer current to future income or dividend can prevail current good information and can indicate company's good future market but on behalf of retained earnings arguments as company contains good investment opportunities and subject to lower taxes. In the context of Nepal, researcher wants to study earnings, dividend and stock prices using cross section data to test the effect of dividend payout on share value using regression model. Secondary data of 45 Nepalese companies has been imported from SEBON, NEPSE and published journals.The study period covers the 10 years data i.e. 2003/04 to 2012/13. Different statistical and econometric models were used to analyze the secondary data using EXCEL, SPSS etc. In total sector, market price per share has been well explained by dividend than retained earnings. Further, market price per share lagged variable which is realized that the speed of the adjustment between desired and actual share price is slow.Keywords: NEPSE, SEBON, Dividends, Retained Earnings and Market Price of Share.
IntroductionDividends are still an unresolved mystery for financial economists, eluding any single theory. In pioneering study of Lintner (1956) pointed out determinants of dividend changes are current earnings and prior year dividends. Modigliani and Miller (1961) found that the value of the firm depends upon firms earning, depending upon investment policy. There are some basic outstanding issues about dividend payment in context of Nepal. Some of them are described as dividend which can be paid as lower taxes or as investors return or only alluring people to raise the goodwill of the company but it is still not clear about the relationship between dividend payment and share market price. According to Chawla and Shrinivashan (1987), following hypothesis exists like share holders prefer current to future income or dividend can prevail current good information and can indicate company's good future market but on behalf of retained earnings arguments as company contains good investment opportunities and subject to lower taxes. According to optimal dividend policy on behalf of maximization of shareholder's wealth may affect value of the firm.
Gordon (1962) argues that dividend policy affects the value of stock even in situation in which the return on investment is equal to capitalization rate. Dividend policy is influenced by the factors like liquidity position, debt level, assets expansion, profit rate, stability of earnings,
Relationship of Market Price of Share with Dividends and Retained Earnings: A Case of Nepal
Dr. Guna Raj ChhetriLecturer of Finance, MBA, M.Phil., Ph.D.
Balkumari College, Narayangarh
105105Journal of Balkumari College
access to the capital markets, and control and tax position of stockholders. Gunasekarage and Power (2006) suggested dividend/earnings news does not appear to act as a signal of long term future company performances, companies which cut dividends and reported lower earnings achieved excess return in future. This is another confounding puzzle. In the context of Nepal, researcher hopes to explore reasons behind this puzzle.
Friend and M. Puckett (1964) studied dividend and stock prices using cross section data to test the effect of dividend payout on share value using regression model. They concluded retained earnings effect is more than dividend effect given the investment opportunities. Chawla and Srinivasan (1987) studied the relationship between dividend and share price in Indian context. This study and some other later studies of Kumar and Mohan(1975) concluded that the stock market has started recognizing the impact of retained earnings in Indian stock market.
Research QuestionsThe following research questions are drawn to guide the study:
• What is the relationship between dividends and stock price in Nepalese corporate firms? • Whether dividend or retained earnings are more influencing variable for determining
share price?
Objectives of the Study• The major objective of this study is to examine the relationship between dividend and
stock price. This study attempts to analyze the impact of dividend policy on market share price with determinant variables of retained earnings per share, dividend per share, lag price earnings ratio and lag market price per share.
• The specific objective of this study is to determine the relationship of market price per share with related financial indicators such as lagged price earnings ratio and lagged market price per share.
Literature ReviewWhat and how much it is desirable to pay dividend is always a controversial topic. Shareholders always expect higher dividend from corporation but company ensures towards setting aside funds for maximizing wealth. In other words, the firm will use the net profit for paying of dividend to the shareholder, if the payment will lade to maximization of the wealth of the owners. If not, it is better to retain them to finance investment programs. Friend and Pucket (1964) used dividends, retained earnings and price earnings ratio as independent variables in their regression model of price function. The study concluded that retained earnings effect is more than dividend given the investment opportunities.
Lintner (1956) had stressed that firms only increase dividends when management believes that earnings have permanently increased. It is clear that more than 80% of the variation in stock prices can be explained by independent variables. Dividends have a predominant influence on stock prices.
In Nepalese stock market, Pradhan (2003) using pool cross section data of 29 companies from
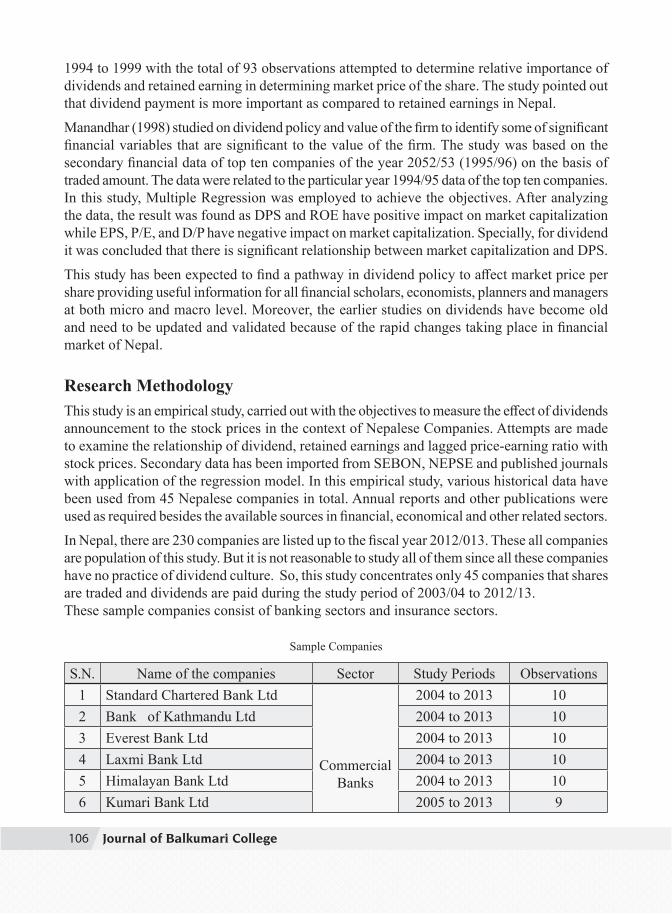
106106 Journal of Balkumari College
1994 to 1999 with the total of 93 observations attempted to determine relative importance of dividends and retained earning in determining market price of the share. The study pointed out that dividend payment is more important as compared to retained earnings in Nepal.
Manandhar (1998) studied on dividend policy and value of the firm to identify some of significant financial variables that are significant to the value of the firm. The study was based on the secondary financial data of top ten companies of the year 2052/53 (1995/96) on the basis of traded amount. The data were related to the particular year 1994/95 data of the top ten companies. In this study, Multiple Regression was employed to achieve the objectives. After analyzing the data, the result was found as DPS and ROE have positive impact on market capitalization while EPS, P/E, and D/P have negative impact on market capitalization. Specially, for dividend it was concluded that there is significant relationship between market capitalization and DPS.This study has been expected to find a pathway in dividend policy to affect market price per share providing useful information for all financial scholars, economists, planners and managers at both micro and macro level. Moreover, the earlier studies on dividends have become old and need to be updated and validated because of the rapid changes taking place in financial market of Nepal.
Research MethodologyThis study is an empirical study, carried out with the objectives to measure the effect of dividends announcement to the stock prices in the context of Nepalese Companies. Attempts are made to examine the relationship of dividend, retained earnings and lagged price-earning ratio with stock prices. Secondary data has been imported from SEBON, NEPSE and published journals with application of the regression model. In this empirical study, various historical data have been used from 45 Nepalese companies in total. Annual reports and other publications were used as required besides the available sources in financial, economical and other related sectors. In Nepal, there are 230 companies are listed up to the fiscal year 2012/013. These all companies are population of this study. But it is not reasonable to study all of them since all these companies have no practice of dividend culture. So, this study concentrates only 45 companies that shares are traded and dividends are paid during the study period of 2003/04 to 2012/13.These sample companies consist of banking sectors and insurance sectors.
Sample Companies
S.N. Name of the companies Sector Study Periods Observations1 Standard Chartered Bank Ltd
Commercial Banks
2004 to 2013 102 Bank of Kathmandu Ltd 2004 to 2013 103 Everest Bank Ltd 2004 to 2013 104 Laxmi Bank Ltd 2004 to 2013 105 Himalayan Bank Ltd 2004 to 2013 106 Kumari Bank Ltd 2005 to 2013 9
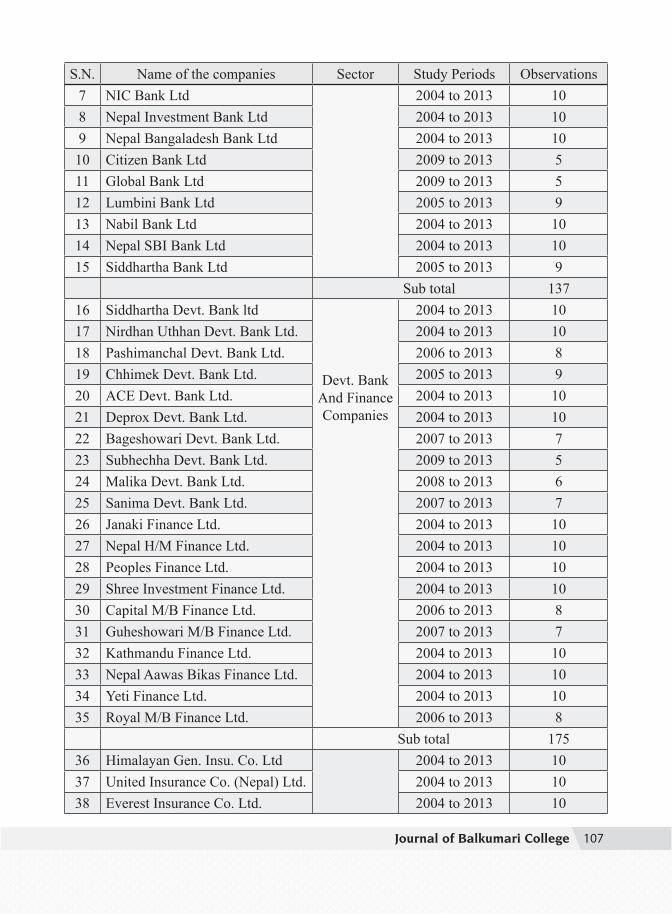
107107Journal of Balkumari College
S.N. Name of the companies Sector Study Periods Observations7 NIC Bank Ltd 2004 to 2013 108 Nepal Investment Bank Ltd 2004 to 2013 109 Nepal Bangaladesh Bank Ltd 2004 to 2013 1010 Citizen Bank Ltd 2009 to 2013 511 Global Bank Ltd 2009 to 2013 512 Lumbini Bank Ltd 2005 to 2013 913 Nabil Bank Ltd 2004 to 2013 1014 Nepal SBI Bank Ltd 2004 to 2013 1015 Siddhartha Bank Ltd 2005 to 2013 9
Sub total 13716 Siddhartha Devt. Bank ltd
Devt. Bank And Finance Companies
2004 to 2013 1017 Nirdhan Uthhan Devt. Bank Ltd. 2004 to 2013 1018 Pashimanchal Devt. Bank Ltd. 2006 to 2013 819 Chhimek Devt. Bank Ltd. 2005 to 2013 920 ACE Devt. Bank Ltd. 2004 to 2013 1021 Deprox Devt. Bank Ltd. 2004 to 2013 1022 Bageshowari Devt. Bank Ltd. 2007 to 2013 723 Subhechha Devt. Bank Ltd. 2009 to 2013 524 Malika Devt. Bank Ltd. 2008 to 2013 625 Sanima Devt. Bank Ltd. 2007 to 2013 726 Janaki Finance Ltd. 2004 to 2013 1027 Nepal H/M Finance Ltd. 2004 to 2013 1028 Peoples Finance Ltd. 2004 to 2013 1029 Shree Investment Finance Ltd. 2004 to 2013 1030 Capital M/B Finance Ltd. 2006 to 2013 831 Guheshowari M/B Finance Ltd. 2007 to 2013 732 Kathmandu Finance Ltd. 2004 to 2013 1033 Nepal Aawas Bikas Finance Ltd. 2004 to 2013 1034 Yeti Finance Ltd. 2004 to 2013 1035 Royal M/B Finance Ltd. 2006 to 2013 8
Sub total 17536 Himalayan Gen. Insu. Co. Ltd 2004 to 2013 1037 United Insurance Co. (Nepal) Ltd. 2004 to 2013 1038 Everest Insurance Co. Ltd. 2004 to 2013 10
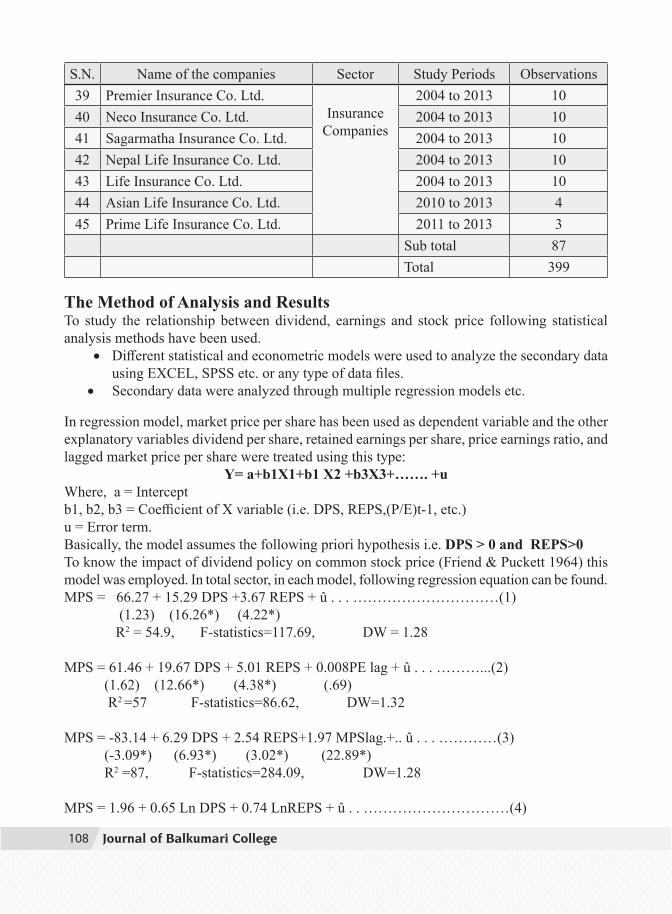
108108 Journal of Balkumari College
S.N. Name of the companies Sector Study Periods Observations39 Premier Insurance Co. Ltd.
Insurance Companies
2004 to 2013 1040 Neco Insurance Co. Ltd. 2004 to 2013 1041 Sagarmatha Insurance Co. Ltd. 2004 to 2013 1042 Nepal Life Insurance Co. Ltd. 2004 to 2013 1043 Life Insurance Co. Ltd. 2004 to 2013 1044 Asian Life Insurance Co. Ltd. 2010 to 2013 445 Prime Life Insurance Co. Ltd. 2011 to 2013 3
Sub total 87 Total 399
The Method of Analysis and ResultsTo study the relationship between dividend, earnings and stock price following statistical analysis methods have been used.
• Different statistical and econometric models were used to analyze the secondary data using EXCEL, SPSS etc. or any type of data files.
• Secondary data were analyzed through multiple regression models etc.
In regression model, market price per share has been used as dependent variable and the other explanatory variables dividend per share, retained earnings per share, price earnings ratio, and lagged market price per share were treated using this type:
Y= a+b1X1+b1 X2 +b3X3+……. +uWhere, a = Interceptb1, b2, b3 = Coefficient of X variable (i.e. DPS, REPS,(P/E)t-1, etc.)u = Error term.Basically, the model assumes the following priori hypothesis i.e. DPS > 0 and REPS>0To know the impact of dividend policy on common stock price (Friend & Puckett 1964) this model was employed. In total sector, in each model, following regression equation can be found.MPS = 66.27 + 15.29 DPS +3.67 REPS + û . . . …………………………(1)
(1.23) (16.26*) (4.22*) R2 = 54.9, F-statistics=117.69, DW = 1.28
MPS = 61.46 + 19.67 DPS + 5.01 REPS + 0.008PE lag + û . . . ………...(2) (1.62) (12.66*) (4.38*) (.69) R2 =57 F-statistics=86.62, DW=1.32
MPS = -83.14 + 6.29 DPS + 2.54 REPS+1.97 MPSlag.+.. û . . . …………(3) (-3.09*) (6.93*) (3.02*) (22.89*) R2 =87, F-statistics=284.09, DW=1.28
MPS = 1.96 + 0.65 Ln DPS + 0.74 LnREPS + û . . …………………………(4)
109109Journal of Balkumari College
(10.52*) (10.61*) (3.07*) R2 =70, F-statistics = 143.73, DW = 1.15
MPS = 3.37 + 0.98Ln Dps +0.43 LnReps + 0.53 Ln PE lag +û . ………….(5) (7.88*) (11.16*) (6.89*) (5.05*) R2 =73, F-statistics=90.74, DW =1.56
MPS = 0.87 + 0.38LnDPS + 0.12Ln REPS + 0.73Ln MPS lag . . …...........(6) (4.54*) (3.04*) (2.15*) (13.78*) R2 =89%, F-statistics = 238.13, DW =1.46,
If total sector is considered in the case of only DPS and REPS, the explanatory variables show the coefficient of DPS > REPS i.e. 15.29 and 3.67, the model is significant and coefficients of regression are also significant. If PElag is considered next independent variable the relation between dividend and retained earnings is also consistent but PElag is not related i.e. Rs.1 increase in lag price earnings ratio, MPS will not change as well as this variable is also insignificant. If we again consider MPSlag as independent variable even the relative weight of DPS is greater than REPS but MPSlag is also positively related with MPS, the model is significant with individually too. In logarithm transform of model 1, dividend per share is greater than retained earnings per share if LnDPS and Ln REPS are only independent variables but if logPElag is independent variable it is positively related and significant at 5 percent i.e. 0.53. If LnMPS lag is considered as independent variable, the relative weight of DPS is customary strong than REPS i.e. 0.38 and 0.12 where MPSlag is highly co-related with MPS i.e. it explains more in average stock price variation of MPS i.e. 0.73 which seems only 0.27 percentages of the adjustment of actual to desired share price may be completed within a year.
Concluding RemarksTo overall, it is predicted that DPS is a motivating factor in Nepalese financial society which is also able to increase market price per share of the public shares in the area of finance sector, insurance sector, manufacturing sector, hotel sector and other sectors. Comparatively, it is also found that effect of DPS > REPS > PELag in this study. Lagged market price per share is an accelerator to increase or to catalyze market price per share in subsequent year. As this breakthrough, it is recommended that optimal dividend should be paid to shareholders on behalf of them as well as public companies. The major findings of the study are as follows:
• In total sector, market price per share of stock has been well explained by dividend than retained earning. Further, market price per share lagged variable which is realized that the speed of the adjustment between desired and actual share price is slow.
• The coefficient of price earning ratio has relatively low effect upon market price per share rather than other independent variables i.e. dividend per share and retained earning per share.
Overall, it can be concluded that the findings are consistent with Pradhan (2003) in the context
110110 Journal of Balkumari College
of Nepal and inconsistent with Friend and Puckett (1964) in context of western countries having developed and perfect market and same result recognized to be felt in context of India as the same study propounded by Chawla and Srinivasan (1987) but inconsistent with this study.
BibliographyChawla, Deepak and G. Srinivasan, (1987). Impact of dividend and retention on share price- an
economic study. Decision,137-140.
Friend Irwin, and Puckett Marshal, (1964). Dividend and stock prices. American Economic Review, 73 (1) 17-30, 656-682.
Gordon, Myron J., (1962). Dividends, earnings, and stock prices - Review of Economics and Statistic, 99-105.
Gunasekarage, Abeyranta and Power, David M. (2006). Anamolous evidence in dividend announcement effect. Managerial finance, 32(3), 209-226.
Kumar, S. and Mohan Man (1975). Share prices in India. Indian Economic Journal, 23, 23-27.
Lintner, V. John (1956). Distribution of incomes of corporations among dividends, retained earnings, and taxes, American Economic Review 46(2) 97-133.
Manandhar, Kamal Das (1998). A study of dividend policy and value of the firm in small stock market: A case of Nepal. Management Dynamics, 8(1):15-20.
Modigliani, Franco and Miller, Metron H. (1961). Dividend policy, growth, and the valuation of shares. Journal of Business, 411-33
Pradhan, Radhe Shyam (2003). Effects of dividend on common stock prices: The Nepalese evidence. Research in Nepalese Finance, Katmandu: Buddha Academic Enterprises (P) Ltd.
www.nepalstock.com.npwww.sebon.gov.npwww.sharesansar.comwww.bizmandu.comwww.merolagani.comwww.mof.gov.npwww.nrb.org.npwww.nepalsharemarket.comwebsites of samples companies
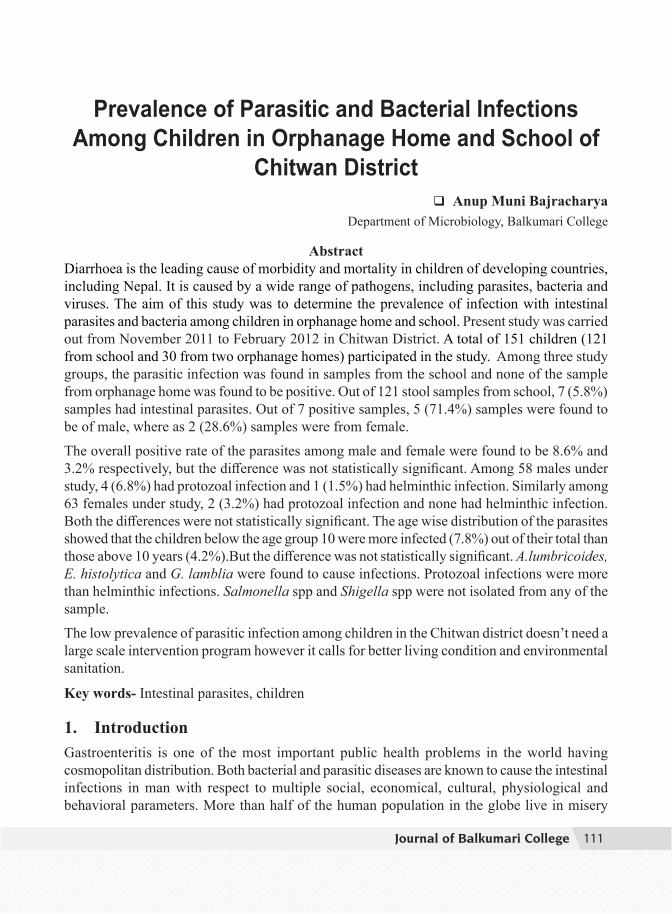
111111Journal of Balkumari College
AbstractDiarrhoea is the leading cause of morbidity and mortality in children of developing countries, including Nepal. It is caused by a wide range of pathogens, including parasites, bacteria and viruses. The aim of this study was to determine the prevalence of infection with intestinal parasites and bacteria among children in orphanage home and school. Present study was carried out from November 2011 to February 2012 in Chitwan District. A total of 151 children (121 from school and 30 from two orphanage homes) participated in the study. Among three study groups, the parasitic infection was found in samples from the school and none of the sample from orphanage home was found to be positive. Out of 121 stool samples from school, 7 (5.8%) samples had intestinal parasites. Out of 7 positive samples, 5 (71.4%) samples were found to be of male, where as 2 (28.6%) samples were from female.The overall positive rate of the parasites among male and female were found to be 8.6% and 3.2% respectively, but the difference was not statistically significant. Among 58 males under study, 4 (6.8%) had protozoal infection and 1 (1.5%) had helminthic infection. Similarly among 63 females under study, 2 (3.2%) had protozoal infection and none had helminthic infection. Both the differences were not statistically significant. The age wise distribution of the parasites showed that the children below the age group 10 were more infected (7.8%) out of their total than those above 10 years (4.2%).But the difference was not statistically significant. A.lumbricoides, E. histolytica and G. lamblia were found to cause infections. Protozoal infections were more than helminthic infections. Salmonella spp and Shigella spp were not isolated from any of the sample.
The low prevalence of parasitic infection among children in the Chitwan district doesn’t need a large scale intervention program however it calls for better living condition and environmental sanitation.
Key words- Intestinal parasites, children
1. IntroductionGastroenteritis is one of the most important public health problems in the world having cosmopolitan distribution. Both bacterial and parasitic diseases are known to cause the intestinal infections in man with respect to multiple social, economical, cultural, physiological and behavioral parameters. More than half of the human population in the globe live in misery
Prevalence of Parasitic and Bacterial Infections Among Children in Orphanage Home and School of
Chitwan District Anup Muni Bajracharya
Department of Microbiology, Balkumari College
112112 Journal of Balkumari College
pain and suffer vast economic loss due to parasites. About one fourth of the world populations are estimated to be infected by one or more species of intestinal parasites (Rai et al, 1995).
World Health Organisation has estimated that Ascaris lumbricoides, Hookworm and Trichuris trichiura infect 1.4 billion, 1.3 billion, 1.0 billion people worldwide, respectively WHO (1995) has reported diarrhoeal diseases as one of the five biggest killers resulting 3.1 million deaths. Similarly, it has reported intestinal worm infections as one among ten biggest killer resulting 135000 deaths.
The intestinal parasitosis and the diarrhoeal diseases have been found to bear wider prevalence among children. Children being the major victim of the infection, this research are concerned on them. Owing to poor sanitary and other living condition of majority of Nepalese families, the children could be the major victim of these infections. The immaturity and less effective self care during small age lead to insufficient sanitary practice and poor personal hygiene which makes children more susceptible to gastrointestinal infection. It is a notable fact that the sharing of common mess and room, sanitary conditions and other environmental factors in orphanage home too may significantly affect their health. These conditions also may vary depending upon the ownership and management of the orphanage home i.e. government or private.Thus, a research was needed to reveal the prevalence and pattern of intestinal infections among children living in orphanage home and school.
2. Materials and MethodsThe laboratory investigation part of this research was carried out in Microbiology laboratory of Balkumari College, Narayangarh. The study period was from November 2011 to February 2012. The stool samples were collected from the children of the Hamro Ghar, Nagarban Marg,Bharatpur, Chitwan. (orphanage home 1), Shree Satya Sai Bal Aashram, Bharatpur, Chitwan (orphanage home 2) and Orbit Secondary English Boarding School, Jutpaani VDC, Chitwan.The stool sample was processed for macroscopic examination, stool culture for Salmonella spp., Shigella spp and microscopic examination through saline wet mount method. Data was entered and analysed using MS Excel and SPSS.
3. ResultsA total of 151 samples were collected from the children. Out of them, 121 stool samples were collected from school and a total of 30 samples were collected from two different orphanage homes in Chitwan,
Among three study groups, the parasitic infection was found in samples from the school and none of the sample from orphanage home was found to be positive. Out of 121 stool samples from school, 7 (5.8%) samples had intestinal parasites (Fig. 1). Out of 7 positive samples, 5 (71.4%) samples were found to be of male, where as 2 (28.6%) samples were from female.
The overall positive rate of the parasites among male and female were found to be 8.6% and 3.2% respectively, but the difference was not statistically significant (Fig.2).
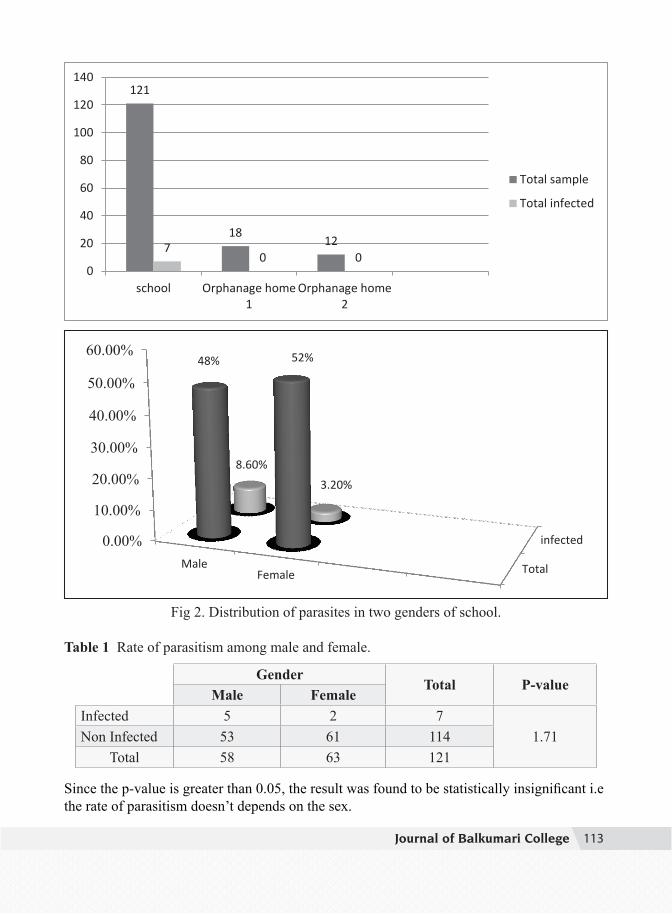
113113Journal of Balkumari College
121
18 12 7
0 0 0
20
40
60
80
100
120
140
school Orphanage home1
Orphanage home2
Total sample
Total infected
Total
infected0.00%
10.00%
20.00%
30.00%
40.00%
50.00%
60.00%
MaleFemale
48% 52%
8.60%
3.20%
Fig 2. Distribution of parasites in two genders of school.
Table 1 Rate of parasitism among male and female.
GenderTotal P-value
Male FemaleInfected 5 2 7
1.71Non Infected 53 61 114Total 58 63 121
Since the p-value is greater than 0.05, the result was found to be statistically insignificant i.e the rate of parasitism doesn’t depends on the sex.
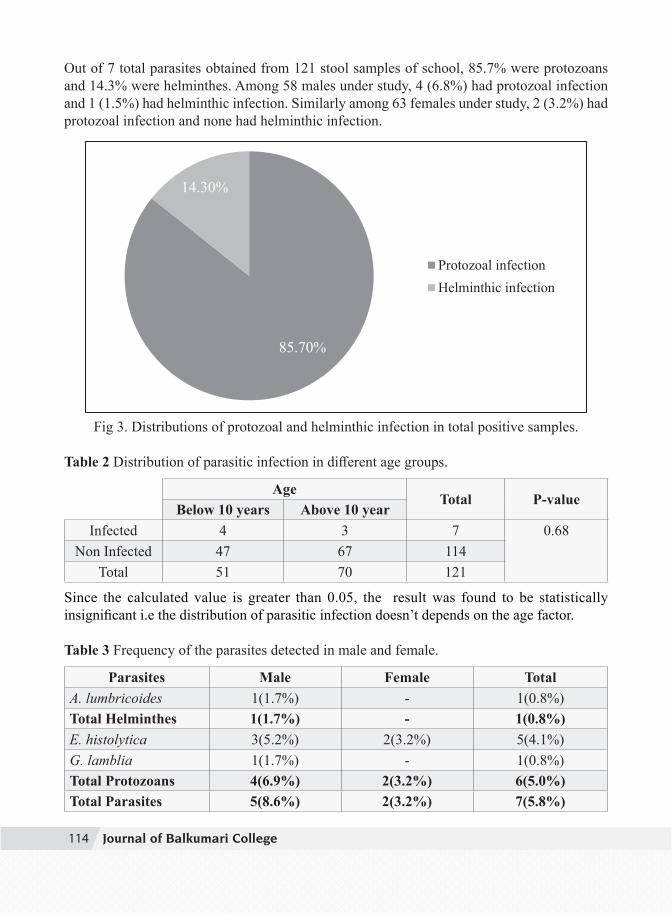
114114 Journal of Balkumari College
Out of 7 total parasites obtained from 121 stool samples of school, 85.7% were protozoans and 14.3% were helminthes. Among 58 males under study, 4 (6.8%) had protozoal infection and 1 (1.5%) had helminthic infection. Similarly among 63 females under study, 2 (3.2%) had protozoal infection and none had helminthic infection.
85.70%
14.30%
Protozoal infectionHelminthic infection
Fig 3. Distributions of protozoal and helminthic infection in total positive samples. Table 2 Distribution of parasitic infection in different age groups.
AgeTotal P-value
Below 10 years Above 10 yearInfected 4 3 7 0.68
Non Infected 47 67 114Total 51 70 121
Since the calculated value is greater than 0.05, the result was found to be statistically insignificant i.e the distribution of parasitic infection doesn’t depends on the age factor.
Table 3 Frequency of the parasites detected in male and female.
Parasites Male Female TotalA. lumbricoides 1(1.7%) - 1(0.8%)Total Helminthes 1(1.7%) - 1(0.8%)E. histolytica 3(5.2%) 2(3.2%) 5(4.1%)G. lamblia 1(1.7%) - 1(0.8%)Total Protozoans 4(6.9%) 2(3.2%) 6(5.0%)Total Parasites 5(8.6%) 2(3.2%) 7(5.8%)

115115Journal of Balkumari College
Among the protozoal parasites, A. lumbricoides, E. histolytica and G. lamblia were found to cause infections. Protozoal infections were more than helminthic infections. Infections by E. histolytica was found to be more than G. lamblia and A. lumbricoides.
The stool cultures done for the isolation of Salmonella spp. and Shigella spp. resulted no non lactose fermenting pale colonies on S.S agar. Thus, Salmonella spp and Shigella spp were not isolated from any of the sample. Since there were no bacterial isolates, the antibiotic susceptibility pattern was not carried out.
4. DiscussionIn the present study only 7 children (5.8%) of school sample were found to be infected with one or more intestinal parasites. The rate of infection was not found to be similar to the general trend of parasitic infection among Nepalese population as reported by Chhetri (1997). The result of the study was lower than the findings reported by Sharma et al (2004) who found about two-third of the school children infected with one or more intestinal parasites in Kathmandu Valley.Among three study groups under study, the parasitic infection was only found in the sample from the school. None of the sample from orphanage were found to be positive. The proper sanitation and good care of orphan children in orphanage home may be the causes behind zero infection rate in the orphanage home. The less crowded environment better level of sanitation, provision of clean safe water reflects the good and caring living status in studied orphanage home. On the other hand, the 7 positive cases in the school might reflects that these students might have poor living The poverty, illiterate parents, lack of awareness and lack of proper care of children in their homes may be the causes behind this. The orphanage homes have the system of regular health check up and health care facilities as these organization are meant to take proper care of the children where as this could not be expected in the homes of each and every children from the school. The school may have poor provisions of drinking water or lack of proper sanitary facilities.In the study, the parasitic infection rate was found to be marginally higher among male but the difference was not statistically significant i.e the rate of parasitism doesn’t depends on the sex. The result was in agreement with the trend observed by Sharma et al (2004) among school children and that of Rai et al (2000) among rural population. Similarly, the significantly higher infection rates have been found among female in Nepal (Rai et al, 1995). This indicated that the gender may or may not play role in parasitosis depending on the region and other environmental or behavioural factors.In the study, E. histolytica has been found to be the commonest protozoal parasites.
The total absence of Shigella spp. and Salmonella spp. in the above study may be attributed to the study group being almost healthy and very few of them were diarrhoeal and symptomatic.
5. ConclusionHence, the parasitic infections are closely related with the conditions of living and environmental sanitation in a community. The proper sanitation in orphanage home resulted in zero infection

116116 Journal of Balkumari College
whereas the lacking of it in school and homes of each and every students might be the cause of parasitic infection. They are more prevalent among socio-economically depressed community where standard of living and environmental hygiene, health education and other amenities are inadequate or lacking. So it can be effectively controlled when the socioeconomic status of a community is improved, when better living conditions, environmental sanitation, and other interventions such as regular deworming, health education and improved nutritional status are made possible.
6. AcknowledgementsMy special felicitation goes to all those children of orphanage home and school who volunterred in my study, without whom this work would never have been possible.
7. ReferencesAdhikari N, Bomjan R, Khatri D, Joshi DR,Dhakal P and Lekhak B (2005) Intestinal helminthic
Infections Among School Children in Kathmandu Valley.Journal of Nepal Health Research Council vol 5.
Bista MB et al (1993) Diarrhoeal Diseases. In: An epidemiological review-Epidemological division, Ministry of Health, Nepal
Chand AB, Sherchand JB and Basnet SR (2001) Study of aetiology of children diarrhoeal cases in relation to parasites to determine antibiotic sensitivity pattern J Nepal assoc Med Lab Sciences 3: 17-20
Cheesbrough M (1998) Parasitological tests. In: District laboratory practice in Tropical Countries (Part.1). Cambridge University Press, UK
Cheesbrough M (2000) Microbiological tests. In: District Laboratory Practice in Tropical Countries (Part 2). Cambridge University Press, UK
Chhetri MK (1997) Parasitic infection in Nepal. J Nep Med Assoc 35: 60-65Ishiyama S, Rai SK, Ono K, Rai CK, Rai G, Tsuji H, Sharma AP and Choudhary DR (2001)
Study of enteropathogens and its predisposing factors in a suburban public school children in Kathmandu, Nepal. Nepal Med College J 3: 5-9
Ishiyama S, Rai SK, Ono K and Uga S (2003) A small-scale study on intestinal parasitosis in a remote village in Nepal. Nepal Med College J 5: 28-30
Malla B, Sherchand JB, Ghimire P,BC Rajendra Kumar and Gauchan (2005) Prevalence of Intestinal Parasitic Infections and Malnutrition among Children in a Rural Community of Sarlahi, Journal of Nepal Health Research Council. Vol 2
Rai SK and Gurung CK (1986) Intestinal parasitic infection in high school children of Birgunj City. J Inst Med (Nepal) 8: 33-38
Rai SK, Bajracharya K, Budhathoki S, Khadka JB, Rai KK, Shrestha MK, Sharma CM, Nakanishi M, Kobo T and Shrestha HG (1995) Status of intestinal parasitosis at TU Teaching Hospital. J Inst Med ( Nepal ) 17:134-142
117117Journal of Balkumari College
Rai K, Serchand JB and Bhatta DR (2004) Study of enteropathogens and its predisposing factors in gastroenteritis suspected children attending Kanti Children Hospital, Kathmandu, Nepal. J Nepal assoc Med Lab Sciences 6: 48-53
Sayyari AA, Imanzadeh F , Yazdi SAB, Karami H and Yaghoobi M (2005) Prevalence of intestinal parasitic infections in the Islamic Republic of Iran. Eastern Mediterranean Health Journal 11: 377-383
Sharma BK, Rai SK, Rai DR and Choudhury DR (2004) Prevalence of intestinal parasitic infestation in school children in the NorthEastern part of Kathmandu Valley, Nepal. SouthEast Asian J Trop Med Public Health 35 (3): 501-505
Sherchand JB, Larsson S and Shrestha MP (1996) Intestinal parasites in children and adults with and without abdominal discomfort from the Kathmandu area of Nepal. Trop Gastroenterol 17: 15-22
Takemasha K, Kimura K, May SI, Rai SK, Ohyama F, Wu Z, Kimura D and Uga S (2004) Epidemiological survey of intestinal parasitic infections of diarrhoeal in patients in Nepal and Lao PDR. Nepal Med College J 6: 7-12
Tamang MD, Sharma N, Makaju RK, Sarma AN, Koju R, Nepali N and Mishra SK (2005) An outbreak of El Tor Cholera in Kavre district, Nepal. Kathmandu University Medical Journal 3: 138-142
World Health Organization (1995) World Health Statistics Annual Volume 1 Vital Statistics and Cause of Death. WHO, Geneva
WHO (2004) Health of the Elderly in Southeast Asia - A Profile. Regional Office for SouthEast Asia, New Delhi
118118 Journal of Balkumari College
I. Introduction
Market efficiency implies that all known information is immediately discounted by all investors and reflected in share prices in the stock market. As such, no one has an information edge. In the ideal efficient market, everyone knows all possible-to-know information simultaneously, interprets it similarly, and behaves rationally. But, human beings what they are, this of course rarely happens. In such a world, the only price changes that would occur are those which results from new information. Since there is no reason to expect that information would be non-random in its appearance, the period-to-period price changes of a stock should be random movements, statistically independent of one another. The level of stock prices will, under these conditions, describe what statisticians call a ‘random walk’ and physicists call Brownian motion. In the normal course of events, the level of prices, i.e., the summation of these random movements will show movements that look like cycle but in fact are not. In an efficient market, all the relevant information is reflected in the current stock price. Information cannot be used to obtain excess return: the information has already been taken into account and absorbed in the prices. In other words, all prices are correctly stated and there are no “bargains” in the stock market.
The requirements for a securities market to be efficient market are: (1) Prices must be efficient so that new investments and better products will cause a firm’s securities prices to rise and motivate investors to supply capital to the firm (i.e., buy its stock); (2) Information must be discussed freely and quickly across the nations so all investors can react to new information; (3) Transactions costs such as sales commissions on securities are ignored; (4) Taxes are assumed to have no noticeable effect on investment policy; (5) Every investor is allowed to borrow or lend at the same rate; and, finally, (6) Investors must be rational and able to recognize efficient assets and that they will want to invest money where it is needed most (i.e., in the assets with relatively high returns). (Bhalla, 2005)
II. Literature ReviewMarket Efficiency
The concept of efficiency is central to finance. Primarily, the term efficiency is used to describe a
Efficient Market Hypothesis: An Empirical Test of Nepalese Stock Market
Rashesh VaidyaLLB, M. Phil Scholar
119119Journal of Balkumari College
market in which relevant information is impounded into the price of financial assets. Sometimes, however, economists use this word to refer to operational efficiency, emphasizing the way resources are employed to facilitate the operation of the market.
Back in the 16th century the prominent Italian mathematician, Girolamo Cardano, in Liber de Ludo Aleae (The Book of Games of Chance) (Cardano, c. 1564) wrote: ‘The most fundamental principle of all in gambling is simply equal conditions, e.g. of opponents, of bystanders, of money, of situation, of the dice box, and of the die itself. To the extent to which you depart from that equality, if it is in your opponents favor, you are a fool, and if in your own, you are unjust’.
In 1828 the Scottish botanist, Robert Brown, noticed that grains of pollen suspended in water had a rapid oscillatory motion when viewed under a microscope (Brown, 1828). Then in 1863 a French stockbroker, Jules Regnault, observed that the longer you hold a security, the more you can win or lose on its price variations: the price deviation is directly proportional to the square root of time (Regnault, 1863). As far back as 1880 the British physicist, Lord Rayleigh, (through his work on sound vibrations) was aware of the notion of a random walk (Rayleigh, 1880). Whilst in 1888 John Venn, the British logician and philosopher, had a clear concept of both a random walk and Brownian motion (Venn, 1888). Even in 1889 efficient markets were clearly mentioned in a book by George Gibson entitled The Stock Markets of London, Paris and New York. Gibson wrote that when ‘shares become publicly known in an open market; the value which they acquire may be regarded as the judgment of the best intelligence concerning them’ (Gibson, 1889). The following year Alfred Marshall wrote Principles of Economics (Marshall, 1890).In 1900 a French mathematician, Louis Bachelier, published his PhD thesis, Th´eorie de la Sp´eculation to the Sorbonne in mathematics (Bachelier, 1900). The concept of market efficiency had been anticipated at the beginning of the century in the doctoral dissertation submitted by Bachelier (1900). (Sewell, 2011) In his opening paragraph, Bachelier recognizes that "past, present and even discounted future events are reflected in market price, but often show no apparent relation to price changes." This recognition of the informational efficiency of the market leads Bachelier to continue, in his opening paragraphs, that "if the market, in effect, does not predict its fluctuations, it does assess them as being more or less likely, and this likelihood can be evaluated mathematically." This gives rise to a brilliant analysis that anticipated not only Albert Einstein's subsequent derivation of the Einstein-Wiener process of Brownian motion, but also many of the analytical results that were rediscovered by finance academics in the second half of the century. Sadly, Bachelier's contribution was overlooked until it was circulated to economists by Paul Samuelson in the late 1950s, and subsequently published in English by Cootner (1964).
Although there could have been an emerging theory of speculative markets during the first half of the twentieth century, this was not to be. Instead, the early literature followed the path of accumulating a variety of empirical observations that did not sit easily alongside the paradigms of economics or the beliefs of practitioners. Bachelier had concluded that commodity prices fluctuate randomly, and later studies by Working (1934) and Cowles and Jones (1937) were to show that US stock prices and other economic series also share these characteristics. These studies were largely overlooked by researchers until the late 1950s.
120120 Journal of Balkumari College
There was, in addition, disturbing evidence about the difficulty of beating the equity market. Alfred Cowles III, founder of the Cowles Commission and benefactor of the Econometric Society, published in the launch issue of Econometrica a painstaking analysis of many thousands of stock selections made by investment professionals. Cowles (1933) found that there was no discernible evidence of any ability to outguess the market. Subsequently, Cowles (1944) provided corroborative results for a large number of forecasts over a much longer sample period. By the 1940s, there was therefore scattered evidence in favor of the weak and strong form efficiency of the market, though these terms were not yet in use. (Dimson and Mussavian, 2000)
Capital Market EfficiencyThe purpose of capital markets is to transfer funds between lenders (savers) and borrowers (producers) efficiently. In an allocationally efficient market, scare savings are optimally allocated to productive investments in a way that benefits everyone. To describe efficient capital markets it is useful, first of all, to contrast them with perfect capital markets. The following conditions may be considered as necessary for perfect capital markets:
• Markets are frictionless; that is, there are no transaction costs or taxes, all assets are perfectly divisible and marketable, and there are no constraining regulations.
• There is perfect competition in securities markets. This means that in securities markets all participants are price takers.
• Markets are informationally efficient; that is, information is costless, and it is received simultaneously by all individuals.
• All individuals are rational expected utility maximizers.Given these conditions, both product and securities markets will be both allocationally and operationally efficient. Allocational efficiency has already been defined, but what about operational efficiency? Operational efficiency deals with the cost of transforming funds. In the idealized world of perfect capital markets, transaction costs are assumed to be zero and markets are perfectly liquid; therefore we have perfect operational efficiency.
Capital market efficiency is much less restrictive than the notion of perfect capital markets outlines above. In an efficient capital market, prices fully and instantaneously reflect all available relevant information. This means that when assets are traded, prices are accurate signals for capital allocation. (Copeland and et al, 2007)
Efficient Market Hypothesis (EMH)Fama (1970, 1976) has done a great deal to operationalize the notion of capital market efficiency. He defines three types of efficiency, each of which is based on a different notion of exactly what type of information is understood to be relevant in the phrase "all prices fully reflect all relevant information." (Copeland and et al, 2007)It is common to distinguish among three versions of the EMH: the weak, semi-strong, and strong forms of the hypothesis. These versions differ by their notions of what is meant by the term "all available information."
121121Journal of Balkumari College
The weak-form hypothesis asserts that stock prices already reflect all information that can be derived by examining market trading data such as the history of past prices, trading volume, or short interest. This version of the hypothesis implies that trend analysis is fruitless. Past stock price data are publicly available and virtually costless to obtain. The weak-form hypothesis holds that if such data ever conveyed reliable signals about future performance, all investors already would have learned to exploit the signals. Ultimately, the signals lose their value as they become widely known because a buy signal, for instance, would result in an immediate price increase. (Bodie and et al, 2015) No investor can earn excess returns by developing trading rules based on historical price or return information. In other words, the information in past prices or return is not useful or relevant in achieving excess returns. (Copeland et al, 2007) The weak form of the EMH states that all information contained in past price movements is fully reflected in current market prices. If this were true, then information about recent trends in stock prices would be of no use in selecting stocks-the fact that a stock has risen for the past three days, for example, would give us no useful clues as to what it will do today or tomorrow. People who believe that weak-form efficiency exists also believe that "tape watchers" and "chartists" are wasting their time. (Brigham and Ehrhardt, 2012)The semi-strong-form hypothesis states that all publicly available information regarding the prospects of a firm must be reflected already in the stock price. Such information includes, in addition to past prices, fundamental data on the firm's product line, quality of management, balance sheet composition, patents held, earning forecasts, and accounting practices. Again, if investors have access to such information from publicly available sources, one would expect it to be reflected in stock prices. (Bodie and et al, 2015) No investor can earn excess returns from trading rules based on any publicly available information. Examples of publicly available information are annual reports of companies, investment advisory data such as "Heard on the Street" in the Wall Street Journal, or tic-to-tic transaction information. (Copeland et al, 2007)The semi-strong form of the EMH states that current market prices reflect all publicly available information. Therefore, if semi-strong-form efficiency exists, it would do no good to pore over annual reports or other published data because market prices would have adjusted to any good or bad news contained in such reports back when the news came out. With semi-strong-form efficiency, investors should expect to earn predicted by the SML (Security Market Line), but they should not expect to do any better unless they have either good luck or access to information that is not publicly available. However, insiders (for example, the presidents of companies) who have information that is not publicly available can earn consistently abnormal returns (returns higher than those predicted by the SML) even under semi-strong-form efficiency. Another implication of semi-strong-form efficiency is that whenever information is released to the public, stock prices will respond only if the information is different from what had been expected. (Brigham and Ehrhardt, 2012)
Finally, the strong-form version of the efficient market hypothesis states that stock prices reflect all information relevant to the firm, even including information available only to company insiders. This version of the hypothesis is quite extreme. Few would argue with the proposition that corporate officers have access to pertinent information long enough before public release to enable them to profit from trading on that information. (Bodie and et al, 2015) No investor
122122 Journal of Balkumari College
can earn excess returns using any information, whether publicly available or not. (Copeland et al, 2007) The strong from of the EMH states that current market prices reflect all pertinent information, whether publicly available or privately held. If this form holds, even insiders would find it impossible to earn consistently abnormal returns in the stock market. (Brigham and Ehrhardt, 2012)
Obviously, the last type of market efficiency is very strong indeed. If markets were efficient in their strong form, prices would fully reflect all information even though it might be held exclusively by a corporate insider. Even before we have a chance to trade based on the news, the strong form of market efficiency predicts that prices will have adjusted so that we cannot profit. (Copeland et al, 2007) A body of theory Efficient Market Hypothesis (EMH) holds (1) that stocks are always in equilibrium and (2) that it is impossible for an investor to consistently "beat the market". (Brigham and Ehrhardt, 2012) After twenty years of market efficiency literature published in 1970, Fama (1991) proposed to change the categories of market efficiency namely:
• Using tests for return predictability instead of weak-form tests, which are only concerned with forecast power of past returns, i.e. how well do past returns predict future return?
• Using event studies instead of semi-strong-form tests of the adjustment of prices to public announcements, i.e. how quickly do prices reflect public information announcements? and
• Using test for private information instead of strong-form tests of whether specific investors have information in market place or not, i.e. do any investors have private information that is not fully reflected in market prices? (Dangol, 2010)
Market AnomaliesResearchers have uncovered certain empirical regularities in common stocks. That is, certain cross-sectional differences among stock returns have been found to occur with regularity. Some regularity should occur according to certain asset pricing models. For example, the CAPM asserts that different stocks should have different returns because different stocks have different betas. What makes the regularities that are about to be discussed of special interest is that they are not predicted by any of the traditional asset pricing models. Accordingly, they are sometimes also referred to as anomalies. (Sharpe & et. al, 2006)
In recent years, several so-called anomalies have been identified. Anomalies are situations that appear to violate the traditional view of market efficiency, suggesting that it may be possible for careful investors to earn abnormal returns.Most of these anomalies appear to revolve around four themes:
• Markets tend to overreact to news, both good and bad.• Value investing is contrarian in nature and is beneficial because markets overreact.• The market consistently ignores certain stocks, especially small stocks.• All things being equal, there are times when it is more advantageous to buy stocks
whereas there are other times when it is better to avoid stocks. (Bhalla, 2005)
123123Journal of Balkumari College
Calendar Anomalies
The Efficient market hypothesis of Fama (1970) is beaten by several anomalies. Calendar anomalies are of vital importance and found to exist in most stock exchanges around the world. They indicate that there is some regularity in return patterns which enable investors to formulate their investment strategies accordingly and achieve abnormal returns. This study focuses on four calendar anomalies, day of the week, month of the year (January effect), turn of the month effects and holiday effect.
The day of the week effect indicates that Monday returns are lower than the returns of other week days. (Cross, 1973; French, 1980; Gibbons and Hess, 1981; Lakonishok and Levi, 1982) Literature suggests a number of hypotheses to explain the presence of this seasonality: specifically, an information release hypothesis, whereby firms delay the release of negative information until the end of the week, a settlement regime hypothesis, related to differences in the timing of transactions and settlement, and an information processing hypothesis associated with the asymmetry in information costs across small and large investors. January effect is another well-known calendar anomaly which indicates that returns in January are the largest comparing to the returns in other months of the year. (Rozeff and Kinney, 1976) This is explained mainly by tax-loss hypothesis which assumes that investors sell their loosed securities to decrease their taxes at the end of the year and return to long positions at the beginning of the following year.Turn of the month effect indicates that most returns are achieved on the turning days of the month (Ariel, 1987). Two arguments are mainly put forward to explain this anomaly. First, companies usually declare profits during the first fortnight of the month. Second, end-of-the month prices increase is attributable to better purchasing power resulting from salaries that are usually paid at the end of the month.Unusually good performance for the stocks on the day prior to market closing holidays have also been documented; this phenomena be known as holiday effect. Lakonishok and Smidt (1988) proved that the rate of return for the pre-holiday effect is twenty-three times larger than the regularity daily rate return. Besides, Ariel (1990) also shown that there are nine to fourteen times more for the means of pre-holiday return compare with the means for non-pre-holiday returns. These abnormal preholiday returns are results of purchasing pressure made by investors who would like to close their short position before holidays.
III. Data Source and MethodologyThe paper has used only the primary data find the awareness level and opinion towards the major three aspects of Efficient Market Hypothesis (EMH) among the Nepalese investors. For a survey study, a full-fledged questionnaire is constructed to cover different aspects namely ideas regarding EMH with reference to Pradhan and Upadhyay (2004) and Dangol (2009). The respondents are considered suitable either they are being active investors or potential investors who have better knowledge on stock market. Thus, the sample has been taken from the total number of the investors who have maintained Beneficial Owners' (BOs) Demat Account. And as of data, about 300,000 (275,397) have maintained the account with Central Depository
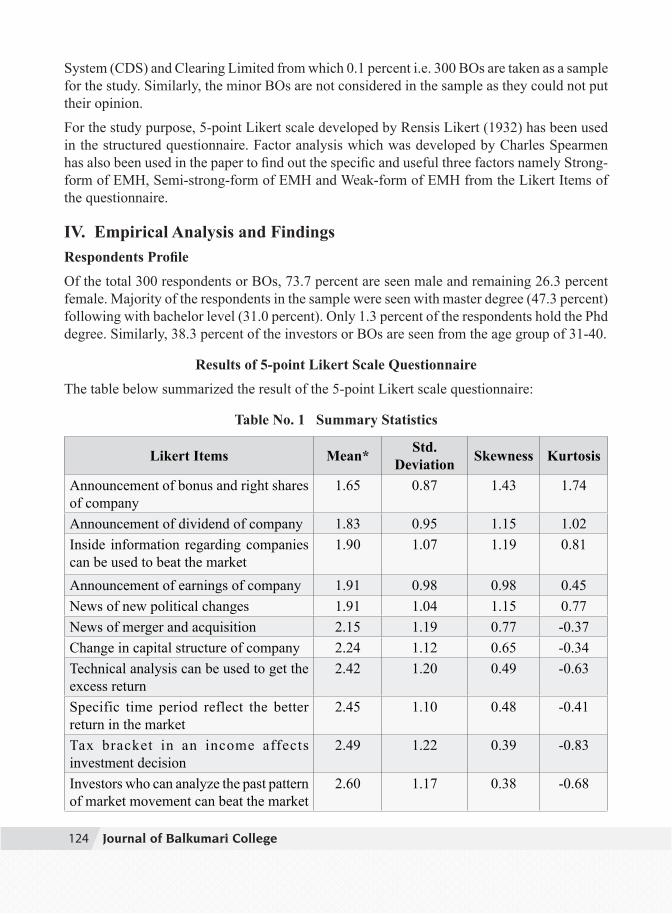
124124 Journal of Balkumari College
System (CDS) and Clearing Limited from which 0.1 percent i.e. 300 BOs are taken as a sample for the study. Similarly, the minor BOs are not considered in the sample as they could not put their opinion.
For the study purpose, 5-point Likert scale developed by Rensis Likert (1932) has been used in the structured questionnaire. Factor analysis which was developed by Charles Spearmen has also been used in the paper to find out the specific and useful three factors namely Strong-form of EMH, Semi-strong-form of EMH and Weak-form of EMH from the Likert Items of the questionnaire.
IV. Empirical Analysis and FindingsRespondents ProfileOf the total 300 respondents or BOs, 73.7 percent are seen male and remaining 26.3 percent female. Majority of the respondents in the sample were seen with master degree (47.3 percent) following with bachelor level (31.0 percent). Only 1.3 percent of the respondents hold the Phd degree. Similarly, 38.3 percent of the investors or BOs are seen from the age group of 31-40.
Results of 5-point Likert Scale QuestionnaireThe table below summarized the result of the 5-point Likert scale questionnaire:
Table No. 1 Summary Statistics
Likert Items Mean* Std. Deviation Skewness Kurtosis
Announcement of bonus and right shares of company
1.65 0.87 1.43 1.74
Announcement of dividend of company 1.83 0.95 1.15 1.02Inside information regarding companies can be used to beat the market
1.90 1.07 1.19 0.81
Announcement of earnings of company 1.91 0.98 0.98 0.45News of new political changes 1.91 1.04 1.15 0.77News of merger and acquisition 2.15 1.19 0.77 -0.37Change in capital structure of company 2.24 1.12 0.65 -0.34Technical analysis can be used to get the excess return
2.42 1.20 0.49 -0.63
Specific time period reflect the better return in the market
2.45 1.10 0.48 -0.41
Tax bracket in an income affects investment decision
2.49 1.22 0.39 -0.83
Investors who can analyze the past pattern of market movement can beat the market
2.60 1.17 0.38 -0.68
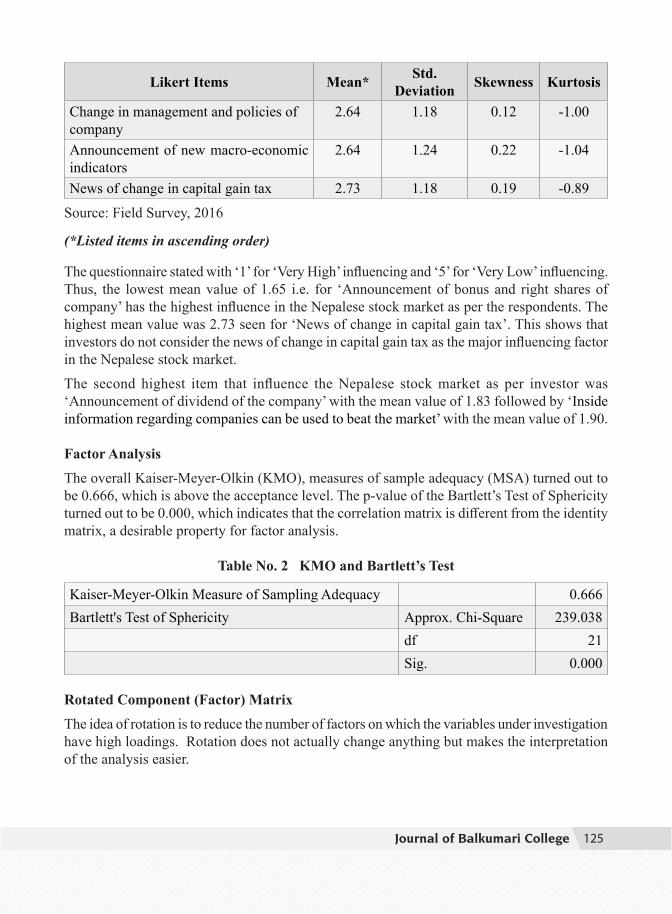
125125Journal of Balkumari College
Likert Items Mean* Std. Deviation Skewness Kurtosis
Change in management and policies of company
2.64 1.18 0.12 -1.00
Announcement of new macro-economic indicators
2.64 1.24 0.22 -1.04
News of change in capital gain tax 2.73 1.18 0.19 -0.89
Source: Field Survey, 2016
(*Listed items in ascending order)
The questionnaire stated with ‘1’ for ‘Very High’ influencing and ‘5’ for ‘Very Low’ influencing. Thus, the lowest mean value of 1.65 i.e. for ‘Announcement of bonus and right shares of company’ has the highest influence in the Nepalese stock market as per the respondents. The highest mean value was 2.73 seen for ‘News of change in capital gain tax’. This shows that investors do not consider the news of change in capital gain tax as the major influencing factor in the Nepalese stock market. The second highest item that influence the Nepalese stock market as per investor was ‘Announcement of dividend of the company’ with the mean value of 1.83 followed by ‘Inside information regarding companies can be used to beat the market’ with the mean value of 1.90.
Factor AnalysisThe overall Kaiser-Meyer-Olkin (KMO), measures of sample adequacy (MSA) turned out to be 0.666, which is above the acceptance level. The p-value of the Bartlett’s Test of Sphericity turned out to be 0.000, which indicates that the correlation matrix is different from the identity matrix, a desirable property for factor analysis.
Table No. 2 KMO and Bartlett’s Test
Kaiser-Meyer-Olkin Measure of Sampling Adequacy 0.666Bartlett's Test of Sphericity Approx. Chi-Square 239.038 df 21 Sig. 0.000
Rotated Component (Factor) Matrix
The idea of rotation is to reduce the number of factors on which the variables under investigation have high loadings. Rotation does not actually change anything but makes the interpretation of the analysis easier.
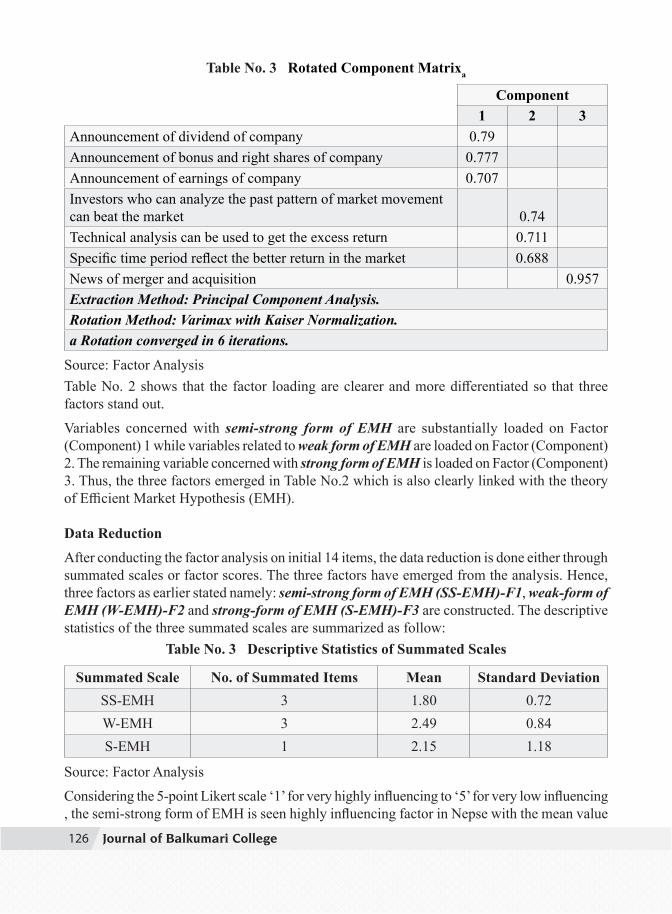
126126 Journal of Balkumari College
Table No. 3 Rotated Component Matrixa
Component1 2 3
Announcement of dividend of company 0.79 Announcement of bonus and right shares of company 0.777 Announcement of earnings of company 0.707 Investors who can analyze the past pattern of market movement can beat the market 0.74 Technical analysis can be used to get the excess return 0.711 Specific time period reflect the better return in the market 0.688 News of merger and acquisition 0.957Extraction Method: Principal Component Analysis. Rotation Method: Varimax with Kaiser Normalization.a Rotation converged in 6 iterations.
Source: Factor AnalysisTable No. 2 shows that the factor loading are clearer and more differentiated so that three factors stand out. Variables concerned with semi-strong form of EMH are substantially loaded on Factor (Component) 1 while variables related to weak form of EMH are loaded on Factor (Component) 2. The remaining variable concerned with strong form of EMH is loaded on Factor (Component) 3. Thus, the three factors emerged in Table No.2 which is also clearly linked with the theory of Efficient Market Hypothesis (EMH).
Data ReductionAfter conducting the factor analysis on initial 14 items, the data reduction is done either through summated scales or factor scores. The three factors have emerged from the analysis. Hence, three factors as earlier stated namely: semi-strong form of EMH (SS-EMH)-F1, weak-form of EMH (W-EMH)-F2 and strong-form of EMH (S-EMH)-F3 are constructed. The descriptive statistics of the three summated scales are summarized as follow:
Table No. 3 Descriptive Statistics of Summated Scales
Summated Scale No. of Summated Items Mean Standard DeviationSS-EMH 3 1.80 0.72W-EMH 3 2.49 0.84S-EMH 1 2.15 1.18
Source: Factor Analysis
Considering the 5-point Likert scale ‘1’ for very highly influencing to ‘5’ for very low influencing , the semi-strong form of EMH is seen highly influencing factor in Nepse with the mean value
127127Journal of Balkumari College
of 1.80 and the average influencing factor were seen for the weak-form of EMH with the mean value of 2.49.
V. Summary and ConclusionThe history of stock market in Nepal is not so long. The history of securities market began with the floatation of shares by Biratnagar Jute Mills Ltd. and Nepal Bank Ltd. in 1937. Introduction of the Company Act in 1964, the first issuance of Government Bond in 1964 and the establishment of Securities Exchange Center Ltd. in 1976 were other significant development relating to capital markets.NEPSE opened trading floor on 13 Jan. 1994 for its newly appointed brokers and market makers, then only the concept of secondary market or stock market came to an existence in Nepal. From that day on the market went on developing and the number of listed companies to the number of brokers and active investors went on increasing and the process is going on. The market has come from the era of open-out-cry system of trading to real time trading system using Wide Area Network (WAN). So, the market has seen ups and downs in the past two decades. At the same time the awareness level of the investors have also changed to some extent. In conclusion, in context to the opinion towards, the three types of EMH, the Nepalese investors has expressed that the market is at the semi-strong stage with leaving the weak form of EMH. But at the same time the market has not been able to catch the strong-from of EMH. Thus, there is long way to go for the full development of the Nepalese stock market.
BibliographyAriel, R. A. (1987). A monthly effect in stock returns. Journal of Financial Economics , 18
(1), 161-74.Bhalla, V. (2005). Investment Management: Security Analysis And Portfolio Management (12th
Edition ed.). New Delhi: S. Chand & Company Ltd.Bodie, Z. A. (2015). Investments (10th Edition ed.). New Delhi: McGraw Hill Education.
Brigham, E. F. (2012). Financial Management: Theory and Practice (12th Edition ed.). New Delhi: CENGAGE Learning.
Brown, D. a. (1989). On technical analysis. Review of Financial Studies , 2 (4), 527-551.Cardano, G. (c. 1564), Liber de Ludo Aleae. First published (in Latin) in Vol. 1, Opera
Omnia edited by Charles Spon, Lyons, 1663. Translated into English by Sydney Henry Gould in Cardano: The Gambling Scholar by Oystein Ore, Princeton University Press, Princeton, NJ, 1953. Reprinted in The Book on Games of Chance, Holt, Rinehart and Winston, New York, 1961.
Cootner, P. H. (1964). The Random Character of Stock Market Prices. Cambridge: M.I.T. Press.
Copeland, T. E. (2007). Financial Theory and Corporate Policy (4th Edition ed.). New Delhi: Pearson Education.
128128 Journal of Balkumari College
Cowles, A. (1933). Can stock market forecasters forecast? Econometrica (1), 309-324.
Cowles, A. and Jones, H. E. (1937), Some a posteriori probabilities in stock market action, Econometrica 5(3), 280–294.
Dangol, J. (2009). A survey of stock market reaction to public information. PYC Nepal Journal of Management , II (1), 85-103.
Dangol, J. (2010). Efficient Market Hypothesis:Few Empirical Evidences from Nepalese Stock Market (1st ed.). Kathmandu: Quest Publication.
Dimson, E. and Mussavian, M. (1998). A brief history of market efficiency, European Finan-cial Management 4(1), 91–193.
Fama, E. F. (1970). Efficient capital markets: A review of theory and emprical work. The Journal of Finance , XXV (2), 383-417.
Gibson, G. (1889), The Stock Markets of London, Paris and New York, G.P. Putnam’s Sons, New York.
Lakonishok, J. a. (1988). Are seasonal anomalies real? A ninety-year presepective. Review of Financial Studies , 1 (4), 403-25.
Levin, R. I. (2008). Statistics for Management (6th Edition ed.). New Delhi: Pearson Prentice-Hall of India.
Marshall, A. (1890), Principles of Economics, Macmillan, London.Pradhan, R. a. (2004). The efficient market hypothesis and the behavior of share prices in Nepal.
The Nepalese Management Review , XII (1), 1-27.Rayleigh, L. (1880). On the resultant of a large number of vibrations of the same pitch and
of arbitrary phase, Philosophical Magazine 10, 73–78.Regnault, J. (1863). Calcul des Chances et Philosophie de la Bourse, Mallet-Bachelier et
Castel, Paris.
Rozeff, M. S. (1976). Capital market seasonality: The case of stock returns. Journal of Finan-cial Economics , 3 (4), 379-402.
Sewell, M. (2011). History of the efficient market hypothesis . UCL Department of Computer Science Research Note , 11(04), 1-14.
Venn, J. (1888). The Logic of Chance, an Essay on the Foundations and Province of the The-ory of Probability with Special References to its Logical Bearings and its Application to Moral and Social Sciences, and to Statistics, (3rd ed.), MacMillan, London.
Working, H. (1934). A random difference series for use in the analysis of time series. American Statistical Association Journal (29), 11-24.
Zikmund, W. G. (2012). Business Research Methods (8th ed.). Delhi: CENGAGE Learning.

• Independent Management audit to assess its system, effectiveness & sustainability
• Internal Quality Assurance Audit followed by review meeting• Functional Procedures for all academic and administrative units • Daily Monitoring Mechanism consisting of Vice Principal & Program
In-charges• Final Exam Record & analysis • Strategic Planning• Calendar of Events• Publications and Paper presentations• Seminars and Workshops from Departments • Organizing Guest Lectures• Student Counseling• Organization of discussions, workshops, seminars, training programmes• Organization of students orientation at the outset of Academic session • Peer review for self-appraisal • Academic Research Journal of Balkumari College• Identifying departmental best practices• Ex students, students & parents Feedback system and analysis• Employment activities• Establishment of Research Development Cell• Developing national /international linkages • Balkumari Manual to control all activities• Self Study Report being prepared for reassessment by UGC, QAAC• Educational Management Information System (EMIS) established
QUALITY INITIATIVES OF BALKUMARI COLLEGE

Programs & Departments of Balkumari College Board of governors is the supreme head controlling the college.
Principal is the executive chief.
Master Degree Programs: • Master in Business Studies (MBS) • Master in Education (M Ed)
Bachelor Programs:• Bachelor in Business Studies (BBS) - 4 yrs.• Bachelor in Hotel Management (BHM) - semester• Bachelor in Education (B Ed) - 4 yrs.• Bachelor in Information Communication
Technology Education (BICTE) - semester• Bachelor in Science Microbiology (B Sc) - 4 yrs.• Bachelor Environmental Science (BSc) - 4 yrs.
Health Programs in seperate location: • Proficiency in Nursing (Staff Nursing)• Assistant Nurse Mid wife (ANM)• Community Medicine Assistant (CMA)
Academic
Administrative
Additional Departments
♦ General administration headed by Deputy Administrator
♦ Account section headed by Account Controller
♦ Library Section headed by Deputy Administrator
♦ Exam Section headed by Assistant Administrator
♦ Procurement section headed by Account Officer
♦ Store headed by Head Assistant
Department heads • Economics • English• Nepali • Mathematics • Extra Activities • General Computer • Degree Research Committee• Extra Curricular Activities
Academic monitoring mechanism:• Principal, Vice Principals (Directors)• Quality Management Representative • Degree Program In charge (Management)
• Research & Development • Section for External Affairs • Public Information & Publication Division • Information & Record Section (EMIS)• Library Advisory Committee • Physical Facilities Section • Environmental and Greeneries Section
Balkumari CollegeNarayangarh, Chitwan, Nepal
Tel.: 056-521842, Fax: 056-524700E-mail: [email protected] | [email protected]
Website: www.balkumaricollege.edu.np
• Degree Program In-charge (Education)• Morning shift Program In-charge
(management)• Morning Program In-charge (education)• Day Program In-charge (management)• Hotel Management program In-charge • Science Program In-charge • Health Program In-charge• Internal Quality Assurance Section


![[XLS] · Web viewNarayangarh_PS+GP_Sect_WP Narayangarg_PS+GP_Sect Narayangarh GP_PRINT Narayangarh PS_print Pond excavation of Mahammadpur Swasan Pond excavation of Panda Pukur Pond](https://img.pdfslide.us/doc/110x75/5b3eeb177f8b9a51528b74be/xls-web-viewnarayangarhpsgpsectwp-narayangargpsgpsect-narayangarh-gpprint.jpg)