Embed Size (px)
Citation preview
August 1, 2017 Analyst: AshutoshTiwari [email protected] (+91-8128694112, +91 79-61909517) Page 1 of 13
Before reading this report, you must refer to the disclaimer on the last page.
Balkrishna Industries Ltd. Absolute :ADD
Relative : BENCHMARK
1QFY18 Result: Estimate (), TP (), Rating () Regular Coverage 5% ATRin 17 Months
Management commentary points to sharp margin recovery over coming quarters Auto Parts
© 2017Equirus All rights reserved
Rating Information
Price (Rs) 1,626
Target Price (Rs) 1,739
Target Date 30th Sept'18
Target Set On 28th May'17
Implied yrs of growth (DCF) 15
Fair Value (DCF) 1,210
Fair Value (DDM) 599
Ind Benchmark BSEAUTO
Model Portfolio Position NA
Stock Information
Market Cap (Rs Mn) 157,254
Free Float (%) 45.63 %
52 Wk H/L (Rs) 1750/705
Avg Daily Volume (1yr) 344,773
Avg Daily Value (Rs Mn) 422
Equity Cap (Rs Mn) 193
Face Value (Rs) 2
Bloomberg Code BIL IN
Ownership Recent 3M 12M
Promoters 54.4 % 0.0 % -3.9 %
DII 13.8 % 0.5 % -0.7 %
FII 18.3 % 0.0 % 0.4 %
Public 13.6 % -0.5 % 4.3 %
Price % 1M 3M 12M
Absolute -2.2 % 6.8 % 123.1 %
Vs Industry -6.9 % -0.8 % 106.9 %
APOLLOTYRE 10.5 % 9.0 % 62.9 %
MRF 1.1 % 1.8 % 104.2 %
Standalone Quarterly EPS forecast
Rs/Share 1Q 2Q 3Q 4Q
EPS (17A) 15.4 25.1 19.2 14.2
EPS (18E) 15.8 17.3 18.7 21.5
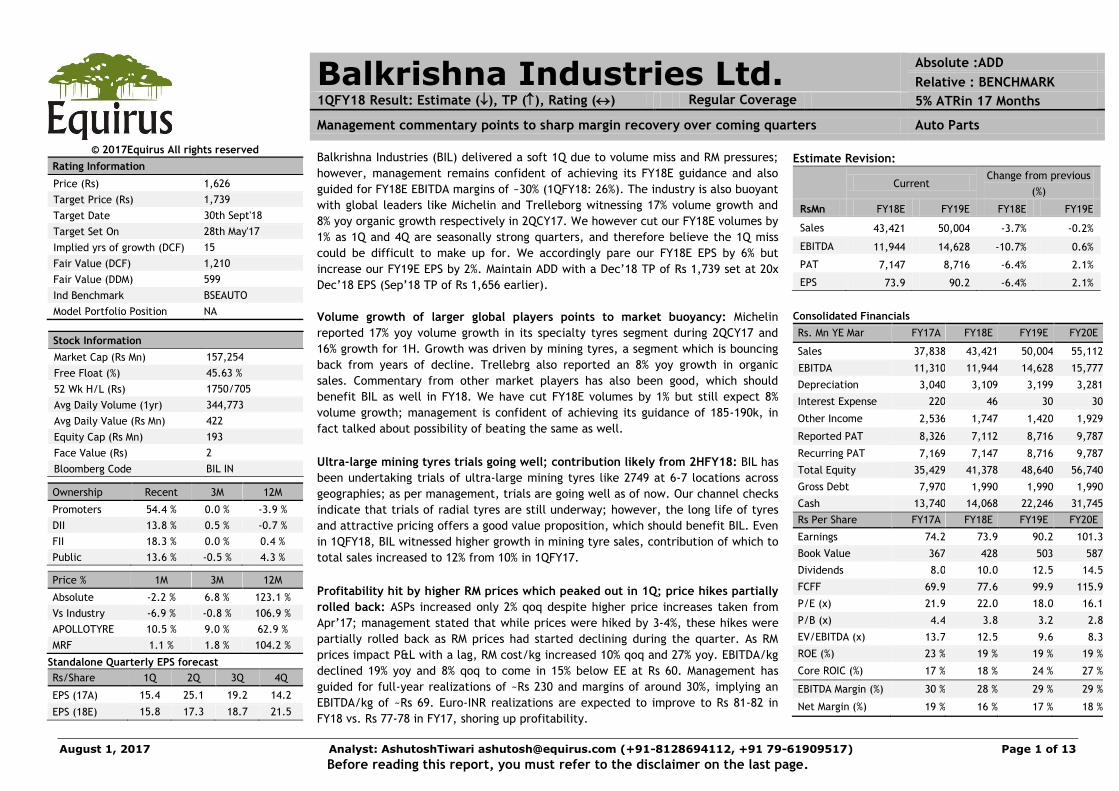
Balkrishna Industries (BIL) delivered a soft 1Q due to volume miss and RM pressures;
however, management remains confident of achieving its FY18E guidance and also
guided for FY18E EBITDA margins of ~30% (1QFY18: 26%). The industry is also buoyant
with global leaders like Michelin and Trelleborg witnessing 17% volume growth and
8% yoy organic growth respectively in 2QCY17. We however cut our FY18E volumes by
1% as 1Q and 4Q are seasonally strong quarters, and therefore believe the 1Q miss
could be difficult to make up for. We accordingly pare our FY18E EPS by 6% but
increase our FY19E EPS by 2%. Maintain ADD with a Dec’18 TP of Rs 1,739 set at 20x
Dec’18 EPS (Sep’18 TP of Rs 1,656 earlier). Volume growth of larger global players points to market buoyancy: Michelin
reported 17% yoy volume growth in its specialty tyres segment during 2QCY17 and
16% growth for 1H. Growth was driven by mining tyres, a segment which is bouncing
back from years of decline. Trellebrg also reported an 8% yoy growth in organic
sales. Commentary from other market players has also been good, which should
benefit BIL as well in FY18. We have cut FY18E volumes by 1% but still expect 8%
volume growth; management is confident of achieving its guidance of 185-190k, in
fact talked about possibility of beating the same as well. Ultra-large mining tyres trials going well; contribution likely from 2HFY18: BIL has
been undertaking trials of ultra-large mining tyres like 2749 at 6-7 locations across
geographies; as per management, trials are going well as of now. Our channel checks
indicate that trials of radial tyres are still underway; however, the long life of tyres
and attractive pricing offers a good value proposition, which should benefit BIL. Even
in 1QFY18, BIL witnessed higher growth in mining tyre sales, contribution of which to
total sales increased to 12% from 10% in 1QFY17. Profitability hit by higher RM prices which peaked out in 1Q; price hikes partially
rolled back: ASPs increased only 2% qoq despite higher price increases taken from
Apr’17; management stated that while prices were hiked by 3-4%, these hikes were
partially rolled back as RM prices had started declining during the quarter. As RM
prices impact P&L with a lag, RM cost/kg increased 10% qoq and 27% yoy. EBITDA/kg
declined 19% yoy and 8% qoq to come in 15% below EE at Rs 60. Management has
guided for full-year realizations of ~Rs 230 and margins of around 30%, implying an
EBITDA/kg of ~Rs 69. Euro-INR realizations are expected to improve to Rs 81-82 in
FY18 vs. Rs 77-78 in FY17, shoring up profitability.
Estimate Revision:
Current
Change from previous
(%)
RsMn FY18E FY19E FY18E FY19E
Sales 43,421 50,004 -3.7% -0.2%
EBITDA 11,944 14,628 -10.7% 0.6%
PAT 7,147 8,716 -6.4% 2.1%
EPS 73.9 90.2 -6.4% 2.1%
Consolidated Financials
Rs. Mn YE Mar FY17A FY18E FY19E FY20E
Sales 37,838 43,421 50,004 55,112
EBITDA 11,310 11,944 14,628 15,777
Depreciation 3,040 3,109 3,199 3,281
Interest Expense 220 46 30 30
Other Income 2,536 1,747 1,420 1,929
Reported PAT 8,326 7,112 8,716 9,787
Recurring PAT 7,169 7,147 8,716 9,787
Total Equity 35,429 41,378 48,640 56,740
Gross Debt 7,970 1,990 1,990 1,990
Cash 13,740 14,068 22,246 31,745
Rs Per Share FY17A FY18E FY19E FY20E
Earnings 74.2 73.9 90.2 101.3
Book Value 367 428 503 587
Dividends 8.0 10.0 12.5 14.5
FCFF 69.9 77.6 99.9 115.9
P/E (x) 21.9 22.0 18.0 16.1
P/B (x) 4.4 3.8 3.2 2.8
EV/EBITDA (x) 13.7 12.5 9.6 8.3
ROE (%) 23 % 19 % 19 % 19 %
Core ROIC (%) 17 % 18 % 24 % 27 %
EBITDA Margin (%) 30 % 28 % 29 % 29 %
Net Margin (%) 19 % 16 % 17 % 18 %
Balkrishna Industries Ltd. Absolute –ADD Relative – BENCHMARK 5% ATR in 17 Months
August 1, 2017 Analyst: Ashutosh Tiwari [email protected] (+91-8128694112, +91 79-40504017) Page 2 of 12
Concall takeaways:
Market scenario and volumes:
Management stated that the demand scenario continues to improve.
The company is strengthening its distribution network in India to expand
domestic sales.
Management is confident of meeting its FY18 annual volume guidance of
185,000-190,000MT and may even revise it upwards.
While BIL had taken a 3-4% hike earlier, the company partially rolled it back in
select markets due to a decline in RM prices. No further reduction in pricing is
expected.
RM inventory days are normally 60-75 days for 1Q.
Full-year EBITDA margin is expected at 30%.
BIL does not see significant savings on logistics costs in India post GST, as it does
not follow a depot structure and dispatches goods directly to dealers.
Of the total production of 47,000 tons during the quarter, Bhuj production stood
at 15,376 tons.
Geographical breakup of volumes was as follows: Europe 55%, America 14-15%
and India 17%.
In terms of new geographies, the focus will be on Russia, CIS and certain parts of
the US where the company does not have a significant presence.
Management endeavors to increase penetration in OEM and replacement
segments.
OEM sales for the quarter stood at 26% and should increase at a steady pace to
32% in the next three years.
Though the non-agri segment is expected to yield better growth than the agri
segment, the focus will remain on the latter because of its non-cyclic nature.
BIL is getting a good response for mining tyres, especially from the replacement
market.
The proportion of mining tyre sales increased from ~10% in 1QFY17 to 12% in
1QFY18.
Forex and other highlights:
Realized forex gains pertaining to sales were at Rs 630mn for 1Q.
BIL booked an unrealized loss of Rs 100mn during the quarter.
MTM on currency futures outstanding are directly taken through the balance
sheet.
Euro-INR realizations for FY18E are expected at Rs 80-81 vs. 74-75 last year.
The company hedges 80-85% of its net exposure for Euro forex risk, and covers
its dollar exposure through imports.
On the debt front, BIL’s gross long-term loan stands at US$ 4.34bn. In
comparison, cash and cash equivalents were at 11.4bn, making the company net
debt-free.
Carbon black facility:
As part of its backward integration plan, BIL will incur a capex of Rs 1.5bn for
setting up a carbon black facility (annual capacity: 60,000MT) at the Bhuj plant.
This facility will be ready in 18-24 months.
At the current volume run-rate, BIL’s carbon black requirement is ~27% or 50k
tons. By the time the plant comes on stream, the requirement will increase to
over 60k tons.
Feed stock used in the plant will generate steam as a by-product, which can be
utilized in the tyre manufacturing process.
BIL expects the plant to generate a ROIC of more than 20% and 10% cost savings
on carbon-black sourcing. It will also help save on logistics and planning fronts.

Balkrishna Industries Ltd. Absolute –ADD Relative – BENCHMARK 5% ATR in 17 Months
August 1, 2017 Analyst: Ashutosh Tiwari [email protected] (+91-8128694112, +91 79-40504017) Page 3 of 12
Exhibit 01: Quarterly sales volume (tons)
Exhibit 02: ASP/kg & Raw material cost/Kg trend (Rs)
Source: Company, Equirus Securities
Exhibit 03: Quarterly EBITDA/kg (Rs)
Exhibit 04: Annual Sales volumes &EBITDA margins
Source: Company, Equirus Securities
0
5,000
10,000
15,000
20,000
25,000
30,000
35,000
40,000
45,000
50,0001Q
FY14
2Q
FY14
3Q
FY14
4Q
FY14
1Q
FY15
2Q
FY15
3Q
FY15
4Q
FY15
1Q
FY16
2Q
FY16
3Q
FY16
4Q
FY16
1Q
FY17
2Q
FY17
3Q
FY17
4Q
FY17
1Q
FY18
234 244 250 245 247 250 256 261
231 238 239
251
225 224 227 227 232
122 121 121 119 124 124 120 120 107
95 92 88 89 86 89 102
113
0
50
100
150
200
250
300
1Q
FY1
4
2Q
FY1
4
3Q
FY1
4
4Q
FY1
4
1Q
FY1
5
2Q
FY1
5
3Q
FY1
5
4Q
FY1
5
1Q
FY1
6
2Q
FY1
6
3Q
FY1
6
4Q
FY1
6
1Q
FY1
7
2Q
FY1
7
3Q
FY1
7
4Q
FY1
7
1Q
FY1
8
ASP/Kg RM cost/Kg
56 51
57 56 62
69
85
112
39
81 77
90
75 77 77
65 60
0
20
40
60
80
100
120
1Q
FY1
4
2Q
FY1
4
3Q
FY1
4
4Q
FY1
4
1Q
FY1
5
2Q
FY1
5
3Q
FY1
5
4Q
FY1
5
1Q
FY1
6
2Q
FY1
6
3Q
FY1
6
4Q
FY1
6
1Q
FY1
7
2Q
FY1
7
3Q
FY1
7
4Q
FY1
7
1Q
FY1
8
56
72 81 84
112
133 138 143 154
148
172 186
208
227
0.0%
5.0%
10.0%
15.0%
20.0%
25.0%
30.0%
35.0%
-
50
100
150
200
250
Sales Volumes EBITDA Margin

Balkrishna Industries Ltd. Absolute –ADD Relative – BENCHMARK 5% ATR in 17 Months
August 1, 2017 Analyst: Ashutosh Tiwari [email protected] (+91-8128694112, +91 79-40504017) Page 4 of 12
Quarterly Results Table (Standalone)
Rs Mn 1QFY18 1QFY18E 4QFY17 1QFY17 % Change
Comments 1QFY18E 4QFY17 1QFY17
Net Sales 10,128 11,527 10,029 9,420 -12% 1% 8% less: Forex loss/(gain) -630 0 -460 -320 Adjusted Sales 10,758 11,527 10,489 9,740 -7% 3% 10% Materials consumed 5,232 4,985 4,718 3,846 5% 11% 36% Employee Cost 587 634 595 546 -7% -1% 8% Other Expenses 2,147 2,478 2,162 2,119 -13% -1% 1% Total Expenditures 7,966 8,097 7,476 6,510 -2% 7% 22% EBITDA 2,792 3,430 3,014 3,230 -19% -7% -14% Depreciation 755 762 751 775 -1% 1% -3% EBIT 2,037 2,668 2,263 2,456 -24% -10% -17% Interest 51 52 53 66 -2% -2% -22% Other Income 293 281 157 -113 4% 86% -359% PBT 2,278 2,896 2,367 2,277 -21% -4% 0% Tax 747 927 993 786 -19% -25% -5% Recurring PAT 1,531 1,969 1,375 1,491 -22% 11% 3% Extraordinaries 34 0 -811 -154 Reported PAT 1,497 1,969 2,185 1,645 -24% -31% -9% EPS (Rs) 15.8 20.4 14.2 15.4 -22% 11% 3% EBITDA Margin 27.6% 29.8% 30.0% 34.3% -219 bps -248 bps -672 bps Adj. EBITDA Margin 26.0% 29.8% 28.7% 33.2% -380 bps -278 bps -721 bps Adj Gross Margin 51.4% 56.8% 55.0% 60.5% -538 bps -365 bps -915 bps EBIT Margin 20.1% 23.1% 22.6% 26.1% -303 bps -245 bps -595 bps PBT Margin 22.5% 25.1% 23.6% 24.2% -263 bps -111 bps -167 bps PAT Margin 14.8% 17.1% 21.8% 17.5% -230 bps -701 bps -268 bps Tax Rate 32.8% 32.0% 41.9% 34.5% 79 bps -915 bps -174 bps

Balkrishna Industries Ltd. Absolute –ADD Relative – BENCHMARK 5% ATR in 17 Months
August 1, 2017 Analyst: Ashutosh Tiwari [email protected] (+91-8128694112, +91 79-40504017) Page 5 of 12
1QFY18 1QFY18E 4QFY17 1QFY17 % Change
Comments 1QFY18E 4QFY17 1QFY17
Volume (tonnes) 46,327 48,300 46,149 43,306 -4% 0% 7%
ASP/kg (Rs) 219 239 217 218 -8.4% 0.6% 0.5%
Adj ASP/Kg (Rs) 232 239 227 225 -2.7% 2.2% 3.2%
RM cost/kg (Rs) 113 103 102 89 9.4% 10.4% 27.2%
EBITDA/kg (Rs) 60 71 65 75 -15.1% -7.7% -19.2%
Gross Margin 51.4% 56.8% 55.0% 60.5% -538 bps -365 bps -915 bps
RM as % of Sales 48.6% 43.2% 45.0% 39.5% 538 bps 365 bps 915 bps
Empl. Cost as % of Sales 5.5% 5.5% 5.7% 5.6% -4 bps -21 bps -14 bps
Other exp. as % of Sales 20.0% 21.5% 20.6% 21.8% -154 bps -66 bps -180 bps

Balkrishna Industries Ltd. Absolute –ADD Relative – BENCHMARK 5% ATR in 17 Months
August 1, 2017 Analyst: Ashutosh Tiwari [email protected] (+91-8128694112, +91 79-40504017) Page 6 of 12
Company Snapshot
How we differ from Consensus
- Equirus Consensus % Diff Comment
EPS FY18E 73.9 84.2 -12 % We are conservative in our FY19
estimates FY19E 90.2 100.1 -10 %
Sales FY18E 43,421 44,181 -2 %
FY19E 50,004 50,616 -1 %
PAT FY18E 7,147 8,134 -12 %
FY19E 8,716 9,670 -10 %
Key Drivers:
FY17A FY18E FY19E FY20E
Sales Volume (tons) 172,420 186,397 207,690 227,010
ASP (Rs/kg) 218 233 241 243
RM/kg (Rs) 92 107 106 109
EBITDA/kg (Rs) 66 64 70 70
Risk to Our View: Foreign exchange fluctuations and sharp increases in rubber prices are
major risks
Key Triggers
Fall in rubber and crude prices
Sensitivity to Key Variables % Change % Impact on EPS
Natural Rubber 10 % -5 %
NTCF 10 % -1 %
Carbon Black 10 % -1 %
DCF Valuations & Assumptions
Rf Beta Ke Term. Growth Debt/IC in Term. Yr
6.8 % 1.0 12.8 % 3.0 % 6.4 %
- FY18E FY19E FY20-22E FY23-27E FY28-32E
Sales Growth 15 % 15 % 10 % 10 % 10 %
NOPAT Margin 14 % 16 % 15 % 15 % 15 %
IC Turnover 1.32 1.56 1.56 1.45 1.45
RoIC 17.8 % 24.0 % 25.4 % 23.4 % 23.4 %
Years of strong growth 1 2 5 10 15
Valuation as on date (Rs) 659 826 861 945 1,021
Valuation as of Sept'18 782 979 1,020 1,121 1,210
We have valued the company at 20x Dec’18 EPS, deriving our Dec’18 PT of Rs 1,739. Our
DCF-based valuation suggests a Dec’18 TP of Rs 1,210.
Company Description:
Balkrishna Industries has a 5% global market share in off-highway tires (OTR, agri). It gets
90% of revenues from exports. It derives ~55% / 15% of its revenues from Europe and
North America. Company hedges rubber commodity and currency.
Comparable valuation Mkt Cap
Rs. Mn.
Price
Target
Target
Date
EPS P/E BPS P/B RoE Div Yield
Company Reco. CMP FY17A FY18E FY19E FY17A FY18E FY19E FY17A FY18E FY17A FY18E FY19E FY17A FY18E
Balkrishna Industries
ADD 1,626 157,254 1,739 30th Sept'18 74.2 73.9 90.2 21.9 22.0 18.0 366.5 3.8 23 % 19 % 19 % 0.5 % 0.6 %
Apollo Tyres SHORT 266 135 193 30th Sept'18 21.6 16.4 19.0 11.4 15.0 13.0 143.2 1.6 12 % 11 % 12 % 1.3 % 1.0 %
MRF NR 69,100 293 NR NR 3,531.3 4,079.6 5,049.3 19.6 16.9 13.7 3,996.0 2.9 23 % 17 % 22 % 0.1 % 0.0 %

Balkrishna Industries Ltd. Absolute –ADD Relative – BENCHMARK 5% ATR in 17 Months
August 1, 2017 Analyst: Ashutosh Tiwari [email protected] (+91-8128694112, +91 79-40504017) Page 7 of 12
Standalone Quarterly Earnings Forecast and Key Drivers Rs in Mn 1Q17A 2Q17A 3Q17A 4Q17A 1Q18E 2Q18E 3Q18E 4Q18E 1Q19E 2Q19E 3Q19E 4Q19E FY17A FY18E FY19E FY20E
Revenue 9,420 9,325 8,822 10,029 10,128 10,747 10,719 11,874 12,804 12,139 11,973 13,137 37,883 43,468 50,053 55,163
Materials consumed 3,846 3,666 3,584 4,718 5,232 4,853 4,657 5,158 5,644 5,351 5,277 5,790 15,813 19,899 22,062 24,659
Employee Cost 546 540 562 595 587 613 611 653 743 692 682 723 2,243 2,464 2,840 3,130
Other Expenditure 2,119 2,045 1,896 2,162 2,147 2,257 2,251 2,493 2,689 2,549 2,514 2,759 8,508 9,148 10,511 11,584
EBITDA 2,910 3,075 2,780 2,554 2,162 3,025 3,201 3,569 3,729 3,547 3,499 3,865 11,319 11,956 14,641 15,791
Depreciation 775 725 788 751 755 767 773 778 783 788 793 798 3,038 3,073 3,163 3,245
EBIT 2,136 2,350 1,992 1,803 1,407 2,257 2,428 2,791 2,946 2,759 2,706 3,067 8,280 8,884 11,478 12,545
Interest 66 47 49 53 51 36 36 36 36 36 36 36 214 160 144 144
Other Income 207 1,035 632 617 923 241 268 305 297 328 369 416 2,491 1,737 1,410 1,919
PBT 2,277 3,338 2,574 2,367 2,278 2,462 2,660 3,060 3,207 3,051 3,039 3,447 10,557 10,461 12,744 14,319
Tax 786 909 718 993 747 788 851 979 1,026 976 972 1,103 3,406 3,366 4,078 4,582
Recurring PAT 1,491 2,429 1,857 1,375 1,531 1,674 1,809 2,081 2,181 2,075 2,066 2,344 7,151 7,096 8,666 9,737
Extraordinary -154 -160 -33 -811 34 0 0 0 0 0 0 0 -1,158 34 0 0
Reported PAT 1,645 2,589 1,890 2,185 1,497 1,674 1,809 2,081 2,181 2,075 2,066 2,344 8,309 7,061 8,666 9,737
EPS (Rs) 15.42 25.13 19.21 14.22 15.84 17.32 18.71 21.53 22.56 21.46 21.38 24.25 73.99 73.41 89.65 100.74
Key Drivers
Sales Tonnage ('000 MT) 43 43 40 46 46 46 45 50 53 50 50 55 172 186 208 227
Realization (Rs/kg) 218 219 218 217 219 236 239 239 241 241 241 241 218 233 241 243
Natural Rubber (Rs/kg) 111 111 115 130 150 138 132 132 136 136 136 136 117 138 136 140
Synthetic Rubber (Rs/kg) 106 106 110 125 145 133 127 127 131 131 131 131 112 133 131 135
NTCF (Rs/kg) 200 206 206 215 225 225 225 225 227 227 227 227 207 225 227 229
- - - - - - - - - - - - - - - - -
Sequential Growth (%)
Revenue 8 % -1 % -5 % 14 % 1 % 6 % 0 % 11 % 8 % -5 % -1 % 10 % - - - -
Materials consumed 9 % -5 % -2 % 32 % 11 % -7 % -4 % 11 % 9 % -5 % -1 % 10 % - - - -
EBITDA 33 % 6 % -10 % -8 % -15 % 40 % 6 % 12 % 4 % -5 % -1 % 10 % - - - -
EBIT 46 % 10 % -15 % -9 % -22 % 60 % 8 % 15 % 6 % -6 % -2 % 13 % - - - -
Recurring PAT 10 % 63 % -24 % -26 % 11 % 9 % 8 % 15 % 5 % -5 % 0 % 13 % - - - -
EPS 10 % 63 % -24 % -26 % 11 % 9 % 8 % 15 % 5 % -5 % 0 % 13 % - - - -
Yearly Growth (%)
Revenue 10 % 15 % 26 % 15 % 8 % 15 % 22 % 18 % 26 % 13 % 12 % 11 % 16 % 15 % 15 % 10 %
EBITDA 165 % 20 % 71 % 17 % -26 % -2 % 15 % 40 % 72 % 17 % 9 % 8 % 35 % 6 % 22 % 8 %
EBIT 370 % 26 % 131 % 23 % -34 % -4 % 22 % 55 % 109 % 22 % 11 % 10 % 49 % 7 % 29 % 9 %
Recurring PAT 47 % 129 % 94 % 2 % 3 % -31 % -3 % 51 % 42 % 24 % 14 % 13 % 63 % -1 % 22 % 12 %
EPS 47 % 129 % 94 % 2 % 3 % -31 % -3 % 51 % 42 % 24 % 14 % 13 % 63 % -1 % 22 % 12 %
Margin (%)
EBITDA 31 % 33 % 32 % 25 % 21 % 28 % 30 % 30 % 29 % 29 % 29 % 29 % 30 % 28 % 29 % 29 %
EBIT 23 % 25 % 23 % 18 % 14 % 21 % 23 % 24 % 23 % 23 % 23 % 23 % 22 % 20 % 23 % 23 %
PBT 24 % 36 % 29 % 24 % 22 % 23 % 25 % 26 % 25 % 25 % 25 % 26 % 28 % 24 % 25 % 26 %
PAT 16 % 26 % 21 % 14 % 15 % 16 % 17 % 18 % 17 % 17 % 17 % 18 % 19 % 16 % 17 % 18 %

Balkrishna Industries Ltd. Absolute –ADD Relative – BENCHMARK 5% ATR in 17 Months
August 1, 2017 Analyst: Ashutosh Tiwari [email protected] (+91-8128694112, +91 79-40504017) Page 8 of 12
Consolidated Financials P&L (Rs Mn) FY17A FY18E FY19E FY20E
Balance Sheet (Rs Mn) FY17A FY18E FY19E FY20E
Cash Flow (Rs Mn) FY17A FY18E FY19E FY20E
Revenue 37,838 43,421 50,004 55,112 Equity Capital 193 193 193 193 PBT 10,586 10,537 12,819 14,394
Op. Expenditure 26,529 31,477 35,376 39,335 Reserve 35,235 41,184 48,447 56,547 Depreciation 3,040 3,109 3,199 3,281
EBITDA 11,310 11,944 14,628 15,777 Networth 35,429 41,378 48,640 56,740 Others 1,158 -34 0 0
Depreciation 3,040 3,109 3,199 3,281 Long Term Debt 7,970 1,990 1,990 1,990 Taxes Paid 3,418 3,391 4,103 4,607
EBIT 8,270 8,836 11,429 12,496 Def Tax Liability 3,805 3,806 3,806 3,806 Change in WC -2,714 -1,140 -673 -673
Interest Expense 220 46 30 30 Minority Interest 0 0 0 0 Operating C/F 8,653 9,081 11,242 12,396
Other Income 2,536 1,747 1,420 1,929 Account Payables 3,744 5,826 6,460 7,221 Capex -2,043 -1,610 -1,610 -1,210
PBT 10,586 10,537 12,819 14,394 Other Curr Liabi 6,943 109 125 138 Change in Invest 0 0 0 0
Tax 3,418 3,391 4,103 4,607 Total Liabilities & Equity 57,891 53,108 61,020 69,894 Others 0 0 0 0
PAT bef. MI & Assoc. 7,169 7,147 8,716 9,787 Net Fixed Assets 28,411 26,257 24,269 22,197 Investing C/F -2,043 -1,610 -1,610 -1,210
Minority Interest 0 0 0 0 Capital WIP 1,097 0 0 0 Change in Debt -4,932 -5,980 0 0
Profit from Assoc. 0 0 0 0 Others 2,051 3,802 4,202 4,202 Change in Equity 285 0 0 0
Recurring PAT 7,169 7,147 8,716 9,787
Inventory 4,761 4,402 5,069 5,587 Others 205 -1,163 -1,454 -1,687
Extraordinaires -1,158 34 0 0 Account Receivables 4,118 6,900 7,946 8,757 Financing C/F -4,442 -7,143 -1,454 -1,687
Reported PAT 8,326 7,112 8,716 9,787 Other Current Assets 3,714 -2,321 -2,711 -2,594 Net change in cash 2,167 328 8,178 9,499
FDEPS (Rs) 74.2 73.9 90.2 101.3 Cash 13,740 14,068 22,246 31,745 RoE (%) 23 % 19 % 19 % 19 %
DPS (Rs) 8.0 10.0 12.5 14.5 Total Assets 57,891 53,108 61,020 69,894
RoIC (%) 16 % 15 % 17 % 17 %
CEPS (Rs) 105.6 106.1 123.3 135.2 Non-cash Working Capital 1,906 3,046 3,719 4,392
Core RoIC (%) 17 % 18 % 24 % 27 %
FCFPS (Rs) 69.9 77.6 99.9 115.9 Cash Conv Cycle 18.4 25.6 27.1 29.1 Div Payout (%) 11 % 16 % 17 % 17 %
BVPS (Rs) 366.5 428.1 503.2 587.0 WC Turnover 19.9 14.3 13.4 12.5 P/E 21.9 22.0 18.0 16.1
EBITDAM (%) 30 % 28 % 29 % 29 % FA Turnover 1.3 1.7 2.1 2.5 P/B 4.4 3.8 3.2 2.8
PATM (%) 19 % 16 % 17 % 18 % Net D/E -0.2 -0.3 -0.4 -0.5 P/FCFF 23.3 20.9 16.3 14.0
Tax Rate (%) 32 % 32 % 32 % 32 % Revenue/Capital Employed 0.8 0.9 1.0 0.9 EV/EBITDA 13.7 12.5 9.6 8.3
Sales Growth (%) 15 % 15 % 15 % 10 %
Capital Employed/Equity 1.4 1.2 1.1 1.1
EV/Sales 4.1 3.4 2.8 2.4
FDEPS Growth (%) 61 % 0 % 22 % 12 %
Dividend Yield (%) 0.5 % 0.6 % 0.8 % 0.9 %
TTM P/E vs. 2 yr forward EPS growth TTM EV/EBITDA vs. 2 yr forward EBITDA growth TTM P/B vs. 2 yr forward RoE
6x
9x
12x
15X
20x
-20%
0%
20%
40%
60%
80%
0
500
1000
1500
2000
Ma
r/0
4Se
p/0
4M
ar/
05
Sep
/05
Ma
r/0
6Se
p/0
6M
ar/
07
Sep
/07
Ma
r/0
8Se
p/0
8M
ar/
09
Sep
/09
Ma
r/1
0Se
p/1
0M
ar/
11
Sep
/11
Ma
r/1
2Se
p/1
2M
ar/
13
Sep
/13
Ma
r/1
4Se
p/1
4M
ar/
15
Sep
/15
Ma
r/1
6Se
p/1
6M
ar/
17
Sep
/17
Ma
r/1
8Se
p/1
8M
ar/
19
EPS Growth
-10%
0%
10%
20%
30%
40%
0
50000
100000
150000
200000
Mar
/04
Sep/
04M
ar/0
5Se
p/05
Mar
/06
Sep/
06M
ar/0
7Se
p/07
Mar
/08
Sep/
08M
ar/0
9Se
p/09
Mar
/10
Sep/
10M
ar/1
1Se
p/11
Mar
/12
Sep/
12M
ar/1
3Se
p/13
Mar
/14
Sep/
14M
ar/1
5Se
p/15
Mar
/16
Sep/
16M
ar/1
7Se
p/17
Mar
/18
Sep/
18M
ar/1
94x
6x
8x
10x
12x
EBITDA Growth
0%
10%
20%
30%
40%
0
500
1000
1500
2000
2500
Ma
r/0
4N
ov/
04
Jul/
05
Ma
r/0
6N
ov/
06
Jul/
07
Ma
r/0
8N
ov/
08
Jul/
09
Ma
r/1
0N
ov/
10
Jul/
11
Mar
/12
No
v/1
2Ju
l/1
3M
ar/
14
No
v/1
4Ju
l/1
5M
ar/
16
No
v/1
6Ju
l/1
7M
ar/
18
No
v/1
8
RoE
1.0x
2.0x
3.0x
4.0x

Balkrishna Industries Ltd. Absolute –ADD Relative – BENCHMARK 5% ATR in 17 Months
August 1, 2017 Analyst: Ashutosh Tiwari [email protected] (+91-8128694112, +91 79-40504017) Page 9 of 12
Historical Consolidated Financials P&L (Rs Mn) FY14A FY15A FY16A FY17A
Balance Sheet (Rs Mn) FY14A FY15A FY16A FY17A
Cash Flow (Rs Mn) FY14A FY15A FY16A FY17A
Revenue 37,719 38,168 32,895 37,838 Equity Capital 193 193 193 193 PBT 7,062 7,133 6,743 10,586
Op. Expenditure 28,822 28,236 24,671 26,529 Reserve 18,757 22,566 27,555 35,235 Depreciation 1,703 2,437 2,823 3,040
EBITDA 8,896 9,933 8,223 11,310 Networth 18,951 22,760 27,748 35,429 Others 379 437 1,421 1,158
Depreciation 1,703 2,437 2,823 3,040 Long Term Debt 24,120 23,574 12,902 7,970 Taxes Paid 1,772 2,125 2,342 3,418
EBIT 7,193 7,496 5,400 8,270 Def Tax Liability 2,212 1,903 2,669 3,805 Change in WC -1,355 1,959 2,084 -2,714
Interest Expense 273 476 395 220 Minority Interest 0 0 0 0 Operating C/F 6,017 9,841 10,729 8,653
Other Income 141 114 1,737 2,536 Account Payables 4,648 4,595 3,411 3,744 Capex -8,858 -3,699 -2,387 -2,043
PBT 7,062 7,133 6,743 10,586 Other Curr Liabi 290 354 7,253 6,943 Change in Invest -3,668 -771 -3,151 0
Tax 2,316 2,408 2,285 3,418 Total Liabilities & Equity 50,221 53,185 53,984 57,891 Others 230 101 18 0
PAT bef. MI & Assoc. 4,746 4,726 4,457 7,169 Net Fixed Assets 23,890 25,731 28,588 28,411 Investing C/F -12,296 -4,369 -5,520 -2,043
Minority Interest 0 0 0 0 Capital WIP 5,656 4,763 2,311 1,097 Change in Debt 4,319 -608 -4,985 -4,932
Profit from Assoc. 0 0 0 0 Others 5,887 2,256 1,657 2,051 Change in Equity 0 8 0 285
Recurring PAT 4,746 4,726 4,457 7,169 Inventory 5,684 4,114 3,983 4,761 Others -669 -702 -1,269 205
Extraordinaires 0 0 40 -1,158 Account Receivables 6,138 5,797 3,850 4,118 Financing C/F 3,649 -1,302 -6,254 -4,442
Reported PAT 4,746 4,726 4,418 8,326 Other Current Assets 2,796 2,317 2,024 3,714 Net change in cash -2,631 4,170 -1,045 2,167
EPS (Rs) 49.1 48.9 46.1 74.2 Cash 170 8,207 11,573 13,740
RoE (%) 28 % 23 % 18 % 23 %
DPS (Rs) 2.0 2.4 5.6 8.0
Total Assets 50,221 53,185 53,984 57,891
RoIC (%) 12 % 11 % 10 % 16 %
CEPS (Rs) 66.7 74.1 75.3 105.6 Non-cash Working Capital 9,680 7,279 -807 1,906 Core RoIC (%) 12 % 12 % 10 % 17 %
FCFPS (Rs) -63.1 59.9 56.6 69.9 Cash Conv Cycle 93.7 69.6 -9.0 18.4 Div Payout (%) 5 % 6 % 14 % 11 %
BVPS (Rs) 196.1 235.5 287.1 366.5 WC Turnover 3.9 5.2 -40.7 19.9
P/E 33.1 33.3 35.3 21.9
EBITDAM (%) 24 % 26 % 25 % 30 % FA Turnover 1.3 1.3 1.1 1.3 P/B 8.3 6.9 5.7 4.4
PATM (%) 13 % 12 % 14 % 19 % Net D/E 1.3 0.7 0.0 -0.2 P/FCFF -25.8 27.2 28.7 23.3
Tax Rate (%) 33 % 34 % 34 % 32 % Revenue/Capital Employed 0.9 0.8 0.7 0.8 EV/EBITDA 20.9 17.8 19.9 13.7
Sales growth (%) 11 % 1 % -14 % 15 %
Capital Employed/Equity 2.5 2.2 1.8 1.4
EV/Sales 4.9 4.6 5.0 4.1
FDEPS growth (%) 36 % 0 % -6 % 61 %
Dividend Yield (%) 0.1 % 0.1 % 0.3 % 0.5 %
Balkrishna Industries Ltd. Absolute –ADD Relative – BENCHMARK 5% ATR in 17 Months
August 1, 2017 Analyst: Ashutosh Tiwari [email protected] (+91-8128694112, +91 79-40504017) Page 10 of 12
Equirus Securities
Research Analysts Sector/Industry Email
Equity Sales E-mail
AbhishekShindadkar IT Services [email protected] 91-22-43320643 VishadTurakhia [email protected] 91-22-43320633
AshutoshTiwari Auto, Metals & Mining [email protected] 91-79-61909517 SubhamSinha [email protected] 91-22-43320631
DepeshKashyap Mid-Caps [email protected] 91-79-61909528 SwetaSheth [email protected] 91-22-43320634
DevamModi Power & Infrastructure [email protected] 91-79-61909516 Viral Desai [email protected] 91-22-43320635
DhavalDama FMCG, Mid-Caps [email protected] 91-79-61909518 BinoyDharia [email protected] 91-22-43320632
Manoj Gori Consumer Durables [email protected] 91-79-61909523 Dealing Room E-mail
Maulik Patel Oil and Gas [email protected] 91-79-61909519 Ashish Shah [email protected] 91-22-43320662
PrafulBohra Pharmaceuticals [email protected] 91-79-61909532 IleshSavla [email protected] 91-22-43320666
RohanMandora Banking & Financial Services [email protected] 91-79-61909529 Manoj Kejriwal [email protected] 91-22-43320663
Associates E-mail Dharmesh Mehta [email protected] 91-22-43320661
AnkitChoudhary [email protected] 91-79-61909533 SandipAmrutiya [email protected] 91-22-43320660
Ashdeep Kaur [email protected] 91-79-61909527 Compliance Officer E-mail
Bharat Celly [email protected] 91-79-61909524 Jay Soni [email protected] 91-79-61909561
Harshit Patel [email protected] 91-79-61909522
Meet Chande [email protected] 91-79-61909513
ParvaSoni [email protected] 91-79-61909521
Pranav Mehta [email protected] 91-79-61909514
RonakSoni [email protected] 91-79-61909525
Samkit Shah [email protected] 91-79-61909520
ShreepalDoshi [email protected] 91-79-61909541
Vikas Jain [email protected] 91-79-61909531
Rating & Coverage Definitions: Absolute Rating • LONG : Over the investment horizon, ATR >= Ke for companies with Free Float market cap >Rs 5 billion and ATR >= 20% for rest of the companies • ADD: ATR >= 5% but less than Ke over investment horizon • REDUCE: ATR >= negative 10% but <5% over investment horizon • SHORT: ATR < negative 10% over investment horizon Relative Rating • OVERWEIGHT: Likely to outperform the benchmark by at least 5% over investment horizon • BENCHMARK: likely to perform in line with the benchmark
Registered Office:
Equirus Securities Private Limited
Unit No. 1201, 12th Floor, C Wing, Marathon Futurex,
N M Joshi Marg, Lower Parel,
Mumbai-400013.
Tel. No: +91 – (0)22 – 4332 0600
Fax No: +91- (0)22 – 4332 0601

Balkrishna Industries Ltd. Absolute –ADD Relative – BENCHMARK 5% ATR in 17 Months
August 1, 2017 Analyst: Ashutosh Tiwari [email protected] (+91-8128694112, +91 79-40504017) Page 11 of 12
• UNDERWEIGHT: likely to under-perform the benchmark by at least 5% over investment horizon Investment Horizon Investment Horizon is set at a minimum 3 months to maximum 18 months with target date falling on last day of a calendar quarter. Lite vs. Regular Coverage vs. Spot Coverage We aim to keep our rating and estimates updated at least once a quarter for Regular Coverage stocks. Generally, we would have access to the company and we would maintain detailed financial model for Regular coverage companies. We intend to publish updates on Lite coverage stocks only an opportunistic basis and subject to our ability to contact the management. Our rating and estimates for Lite coverage stocks may not be current. Spot coverage is meant for one-off coverage of a specific company and in such cases, earnings forecast and target price are optional. Spot coverage is meant to stimulate discussion rather than provide a research opinion.
Corporate Office:
3rd floor, House No. 9,
Magnet Corporate Park, Near Zydus Hospital, B/H Intas Sola Bridge,
S.G. Highway Ahmedabad-380054
Gujarat
Tel. No: +91 (0)79 - 6190 9550
Fax No: +91 (0)79 – 6190 9560
© 2017 Equirus Securities Private Limited. All rights reserved. For Private Circulation only. This report or any portion hereof may not
be reprinted, sold or redistributed without the written consent of Equirus Securities Private Limited
Analyst Certification
I, AshutoshTiwari, author to this report, hereby certify that all of the views expressed in this report accurately reflect my personal views about the subject company or companies and its or their securities. I also
certify that no part of my compensation was, is or will be, directly or indirectly, related to the specific recommendations or views expressed in this report.
Disclosures
Equirus Securities Private Limited (ESPL) having Corporate Identification Number U65993MH2007PTC176044 is registered in India with Securities and Exchange Board of India (SEBI) as a trading member on the
Capital Market (Reg. No. INB231301731), Futures & Options Segment (Reg. No.INF231301731) of the National Stock Exchange of India Ltd. (NSE) and on Cash Segment (Reg. No.INB011301737) of Bombay Stock
Exchange Limited (BSE).ESPL is also registered with SEBI as Research Analyst under SEBI (Research Analyst) Regulations, 2014 (Reg. No. INH000001154), as a Portfolio Manager under SEBI (Portfolio Managers
Regulations, 1993 (Reg. No. INP000005216) and as a Depository Participant of the Central Depository Services (India) Limited (Reg. No. IN-DP-324-2017). There are no disciplinary actions taken by any regulatory
authority against ESPL. ESPL is a subsidiary of Equirus Capital Pvt. Ltd. (ECPL) which is registered with SEBI as Category I Merchant Banker and provides investment banking services including but not limited to
merchant banking services, private equity, mergers & acquisitions and structured finance.
As ESPL and its associates are engaged in various financial services business, it might have: - (a) received compensation (except in connection with the preparation of this report) from the subject company for
investment banking or merchant banking or brokerage services in the past twelve months;(b) managed or co-managed public offering of securities for the subject company in the past twelve months; or (c) have
received a mandate from the subject company; or (d) might have other financial, business or other interests in entities including the subject company (ies) mentioned in this Report. ESPL & its associates, their
directors and employees may from time to time have positions or options in the company and buy or sell the securities of the company (ies) mentioned herein. ESPL and its associates collectively do not own (in
their proprietary position) 1% or more of the equity securities of the subject company mentioned in the report as the last day of the month preceding the publication of the research report. ESPL or its Analyst or
Associates did not receive any compensation or other benefits from the companies mentioned in the report or third party in connection with preparation of the research report. Accordingly, neither ESPL nor
Research Analysts have any material conflict of interest at the time of publication of this report. Compensation of our Research Analysts is not based on any specific merchant banking, investment banking or
brokerage service transactions. ESPL has not been engaged in market making activity for the subject company.
The Research Analyst engaged in preparation of this Report:-
(a) has not received any compensation from the subject company in the past twelve months; (b) has not managed or co-managed public offering of securities for the subject company in the past twelve months;
(c) has not received any compensation for investment banking or merchant banking or brokerage services from the subject company in the past twelve months; (d) has not received any compensation for products
or services other than investment banking or merchant banking or brokerage services from the subject company in the past twelve months; (e) has not received any compensation or other benefits from the
subject company or third party in connection with the research report; (f) might have served as an officer, director or employee of the subject company; (g) is not engaged in market making activity for the
subject company.
This document is not directed or intended for distribution to, or use by, any person or entity who is a citizen or resident of or located in any locality, state, country or other jurisdiction, where such distribution,
publication, availability or use would be contrary to law, regulation or which would subject ESPL and affiliates to any registration or licensing requirement within such jurisdiction. The securities described herein
may or may not be eligible for sale in all jurisdictions or to a certain category of investors. Persons in whose possession of this document are required to inform themselves of, and to observe, such applicable
restrictions. Please delete this document if you are not authorized to view the same. By reading this document you represent and warrant that you have full authority and all rights necessary to view and read this
document without subjecting ESPL and affiliates to any registration or licensing requirement within such jurisdiction.

Balkrishna Industries Ltd. Absolute –ADD Relative – BENCHMARK 5% ATR in 17 Months
August 1, 2017 Analyst: Ashutosh Tiwari [email protected] (+91-8128694112, +91 79-40504017) Page 12 of 12
This document has been prepared solely for information purpose and does not constitute a solicitation to any person to buy, sell or subscribe any security. ESPL or its affiliates are not soliciting any action based
on this report. The information and opinions contained herein is from publicly available data or based on information obtained in good faith from sources believed to be reliable but ESPL provides no guarantee as
to its accuracy or completeness. The information contained herein is as on date of this report, and is subject to change or modification and any such changes could impact our interpretation of relevant
information contained herein. While we would endeavour to update the information herein on reasonable basis, ESPL and its affiliates, their directors and employees are under no obligation to update or keep the
information current. Also there may be regulatory, compliance, or other reasons that may prevent ESPL and its group companies from doing so. This document is prepared for assistance only and is not intended
to be and must not alone be taken as the basis for an investment decision. Each recipient of this document should make such investigations as it deems necessary to arrive at an independent evaluation of an
investment in the securities of companies referred to in this document including the merits and risks involved. This document is intended for general circulation and does not take into account the specific
investment objectives, financial situation or particular needs of any particular person. ESPL and its group companies, employees, directors and agents accept no liability, and disclaim all responsibility, for the
consequences of you or anyone else acting, or refraining to act, in reliance on the information contained in this publication or for any decision based on it. ESPL/its affiliates do and seek to do business with
companies covered in its research report. Thus, investors should be aware that the firm may have conflict of interest.
A graph of daily closing prices of securities is available at http://www.nseindia.com/ChartApp/install/charts/mainpage.jsp and www.bseindia.com (Choose a company from the list on the browser and select the
“three years” period in the price chart).
Disclosure of Interest statement for the subject Company Yes/No If Yes, nature of such interest
Research Analyst’ or Relatives’ financial interest No
Research Analyst’ or Relatives’ actual/beneficial ownership of 1% or more No
Research Analyst’ or Relatives’ material conflict of interest No
Disclaimer for U.S. Persons
ESPL/its affiliates are not a registered broker–dealer under the U.S. Securities Exchange Act of 1934, as amended (the“1934 act”) and under applicable state laws in the United States. In addition Equirus is not a
registered investment adviser under the U.S. Investment Advisers Act of 1940, as amended (the "Advisers Act" and together with the 1934 Act, the “Acts”), and under applicable state laws in the United States.
Accordingly, in the absence of specific exemption under the Acts, any brokerage and investment services provided by Equirus, including the products and services described herein are not available to or intended
for U.S. persons. The information contained in this Report is not intended for any person who is a resident of the United States of America or a resident of any jurisdiction, the laws of which imposes prohibition
on soliciting the securities business in that jurisdiction without going through the registration requirements and/ or prohibit the use of any information contained in this report. This Report and its respective
contents do not constitute an offer or invitation to purchase or subscribe for any securities or solicitation of any investments or investment services and/or shall not be considered as an advertisement tool. "U.S.
Persons" are generally defined as a natural person, residing in the United States or any entity organized or incorporated under the laws of the United States. US Citizens living abroad may also be deemed "US
Persons" under certain rules.