Embed Size (px)
Citation preview
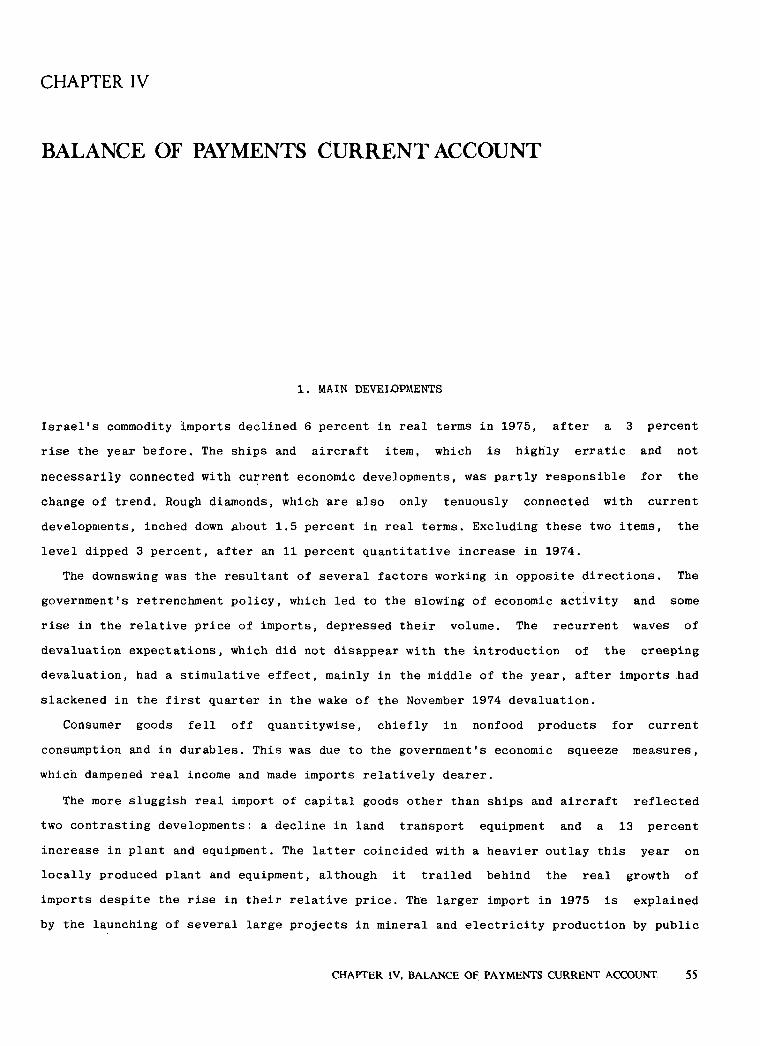
CHAPTER IV
BALANCE OF PAYMENTS CURRENT ACCOUNT
1. MAIN DEVELOPMENTS
Israel's commodity imports declined 6 percent in real terms in 1975, after a 3 percentrise the year before. The ships and aircraft item, which is highly erratic and notnecessarily connected with current economic developments, was partly responsible for thechange of trend. Rough diamonds, which are also only tenuously connected with currentdevelopments, inched down about 1.5 percent in real terms. Excluding these two items, thelevel dipped 3 percent, after an 11 percent quantitative increase in 1974.
The downswing was the resultant of several factors working in opposite directions. The
government1s retrenchment policy, which led to the slowing of economic activity and some
rise in the relative price of imports, depressed their volume. The recurrent waves ofdevaluation expectations, which did not disappear with the introduction of the creepingdevaluation, had a stimulative effect, mainly in the middle of the year, after imports had
slackened in the first quarter in the wake of the November 1974 devaluation.Consumer goods fell off quantitywise, chiefly in nonfood products for current
consumption and in durables. This was due to the government's economic squeeze measures,which dampened real income and made imports relatively dearer.
The more sluggish real import of capital goods other than ships and aircraft reflectedtwo contrasting developments: a decline in land transport equipment and a 13 percentincrease in plant and equipment. The latter coincided with a heavier outlay this year on
locally produced plant and equipment, although it trailed behind the real growth ofimports despite the rise in their relative price. The larger import in 1975 is explainedby the launching of several large projects in mineral and electricity production by public
CHAPTER IV, BALANCE OF PAYMENTS CURRENT ACCOUNT 55

sector companies, as well as new investment in the metal and other export industries inanticipation of an accelerated expansion of overseas sales.
Imports of nondiamond inputs were down 1.5 percent in real terms; however, calculationsbased on constant input coefficients show that this item should have fallen off even more
steeply compared with actual imports in 1974 (17 percent). That this did not happen can
apparently be attributed to the continued buildup of stocks, which began in 1973 becauseof the primary commodity price explosion at the end of the previous year and the weakening
of the dollar in the first half of 1973. The anticipated increase in import prices underthe government's new economic policy in 1974 and the renewal of devaluation expectationsin the second half of 1975 because of the grave erosion in the country's balance ofpayments position stimulated an import of intermediates in excess. of current requirements .
Table IV1
COMMODITY IMPORTS, EXPORTS, AND THE TRADE DEFICIT, 197175
($ million(
Net trade deifcit*Net exports"Net impotrs0
Ships and aircraftQuantityQuantityQuantityindexSeasonallyUnadindexSeasonallyUnadindexSeasonallyUnad
ExpotrsImports1972=100adjustedjusted1972=100adjustedjusted1972=100adjustedjusted
Annual data13.163.8810.11,086.71,896.819728.7224.81,371.11,372.72,743.8197314.1150.52,303.41, 722.64,026.019746.242.72,248.01,828.74,076.71975
Quarterly data13.897.5201.3169.099.2253.1286.098.4454.4455.01972 I8.213.894.0196.0219.495.6256.7259.594.9452.7478.9II0.516.191.3184.5185.6100.0272.0229.096.3456.5414.6m4.420.1117.2228.8236.1105.2307.7312.2110.3536.5548.3IV2.14.7124.0260.4231.1104.9312.6353.3113.0573.0584.41973 I3.994.7133.2315.9352.1105.8357.1360.9117.5673.0713.0II0.394.7142.2406.7405.9117.5408.6356.5128.0815.3762.4III2.430.7113.1394.3381.981.4306.3302.194.9700.6684.0IV0.62.2125.1523.0488.7105.2379.5424.5113.7902.5913.21974 I0.835.8142.9573.4631.7108.3431.8442.6123.01,005.21,074.3II3.948.0140.1606.6583.0111.0445.0383.4123.41,051.6966.4III8.864.5139.3607.6600.1110.4471.1472.1122.71,078.71,072.2IV0.43.7134.5604.5557.7106.1458.5497.6118.11,063.01,055.31975 I113.8537.4589.1107.2446.9458.2110.0984.31,047.3II5.42.5135.8599.6583.9110.4425.9373.0121.31,025.5956.9HI0.436.5124.1520.9517.4118.7497.2499.9121.01,018.11,017.3IV
a Excludes ships and aircraft.Source: Central Bureau of Statistics.
56 BANK OF ISRAEL ANNUAL REPORT 1975

Import prices moved up by a modest 5 percent in the year reviewed, after soaring 76
percent in 197374. The softening of primary commodity prices on the world markets sincethe second half of 1974 and the strengthening of the dollar in the second half of 1975 arewhat retarded the advance in Israel1s import prices.
Nonoil import prices rose about 80 percent in dollar terms ,between 1970 and 1975, whileexport prices of the industrial countries went up 70 percent in local currency terms. The
divergence was partly due to the depreciation of the dollar and the IL (which was stillpegged to the dollar) against the leading European currencies. These two currenciesslipped 12 percent during this period (see Table IV11). Disregarding the weakening of thedollar, Israel's import prices went up 60 percent, with the improvement in the country's
relative position beginning in 1974.
Imports (excluding ships and aircraft) did not advance at an even pace in 1975, thelevel dipping in the first half and reversing direction in the second (see Table IV4).The 7 percent firsthalf quantitative decrease (compared with the first half of 1974) isexplained by the spurting of the main groups at the end of 1974 with the intensificationof expectations of a devaluation and of the introduction of tough policy measures. The 6
percent growth in the second> half of 1975 (compared with the first half) occurredprimarily in capital goods and uncut diamonds. In the first quarter of 1976 the nominal
import bill dropped 3 percent from the previousquarter, with the steepest declines beingin intermediates and consumer durables. In view of the continued strengthening of thedollar in the first quarter of 1976 and the fall of world raw material prices, it is too
early to say whether this represented a real decrease.In exports, there were no clear signs of a significant acceleration of growth, which is
a prerequisite for extricating the economy from the stagnation into which the balance ofpayments constraints have mired it. The upswing in overseas sales in the second half ofthe year reviewed cannot be taken as indicative of a real change of trend, as regardseither its dimensions or the product mix. Very little progress was made in 1975, incomparison with either earlier years or the balance of payments requirements. The increasecame to a niggardly 2 percent overall. In manufactures other than diamonds and minerals,which constitute the principal group and the greatest potential for expanding thecountry's overseas sales, there was actually a complete standstill.
The export picture is a complex one, from the aspect of the multiplicity of forces atwork, changes in their relative importance and direction, and the variability of trendsduring the year and in the various component items.
Agricultural products made impressive strides forward, advancing 23 percent in quantity
CHAPTER IV, BALANCE OF PAYMENTS CURRENT ACCOUNT 57

Table IV2
ISRAEL'S TERMS OF TRADE, 196975
Excluding diamondsIncluding diamonds
TermsExportImportTermsExportImportof tradepirce indexpirce indexof trade*pirce indexpirce index
Annual data11)1968=[ 00(
99.3103.7104.499.7104.7105.0196997.0103.5106.798.9104.4105.6197094.4105.6111.999.3108.4109.2197193.1109.9118.0100.4116.2115.8197286.9131.5151.396.5142.9148.1197378.9167.5212.383.3169.1202.9197481.7181.6222.283.5177.0211.91975
Quarterly datac)1973=100(
106.488.583.2106.089.684.51973 I106.098.993.3105.499.394.2II102.5109.9107.2101.0108.3107.2III93.3108.0115.893.0106.3114.3IV77.8113.7146.278.1109.8140.61974 I79.3123.1155.380.1120.3150.2II84.3125.9149.383.0119.4143.9III85.5131.0153.383.5120.7144.6IV81.7136.5167.079.1125.0158.11975 I82.6137.6166.577.5122.9158.5II84.5131.8156.080.6120.6149.6III84.6129.1152.682.0120.0146.4IV
a The export price index divided by the import price index.b The indexes calculated according to 1968 pirces are Paasche indexes. In 1973 the Central Bureau of Statistics chainedthe base of the pirce indexes to 1972=100. The pirce indexes for 1973 and 1974 based on 1968=100 were obtainedby linking these indexes based 0/2 1972=100 to 1972 based on 1968=100.
c For quarterly compairsons we assumed a fixed (1973) basket of goods throughout in order to separate out the influence of changes in the basket on the price indexes.
Source: Central Bureau of Statistics.
^terms and commanding 17 percent higher prices abroad. The gain in citrus tonnage and theaccompanying steep price rise can be credited to the continued buoyant foreign demand.
Other agricultural exports expanded 34 percent , thus resuming the vigorous uptrend of thepast decade , wh L ch had been blunted in the two preceding years because of the war.
The poor performance of minerals, where both tonnage and prices sagged, is explained by
the cooling of the world market for such products. The stagnation of diamonds, for thesecond consecutive year , was accompanied by a precipitate fall in their relative pricebya total of 20 percent in the last two years compared with the national export average. The
world 600^01x1x0 retreat and the contraction of income in the industrial countries go a longway to explain these developr.ients .
Overseas industrial sales exclusive of diamonds and minerals flattened in 1975, after
three years of very sluggish growtha 6 percent real average in 197274, as against more
58 BANK OF ISRAEL ANNUAL REPORT 1975

than 20 percent a year until 1971. In industrial exports two broad groups can be
distinguished which differ sharply from each other from the aspect of their development.
The more technologically advanced industries (electronics, equipment, and metal) postedhealthy gains in the last two years (with some interindustry and interternporaldifferences), while in the "traditional" industries, which are not in the front ranktechnologically speaking (food, textiles and clothing, leather, wood, paper, and rubberand plastics), sales have been steadily losing ground in the last few years.
The movement of industrial exports during 1975 was not even. Seasonally adjusted datashow that the level was generally stable from the beginning of 1974 until the thirdquarter of 1975, jumping steeply in the final quarter; according to preliminary estimatesthe uptrend was sustained in the first quarter of 1976. The advance was paced by militarygoods, whereas other products tumbled after having risen at the end of 1975. The nature ofthe export expansionits confinement to a special narrow segment of the manufacturingsector which is subject to sharp fluctuationsraises a question how to interpret it: towhat extent it is indicative of a real change of trend according with the country's exportrequirements, and to what extent its source lies in fortuitous factors.
2. COMMODITY IMPORTS
Commodity imports were a shade lower in 1975 in current price terms, amounting to$4,126 million as against $4 ,197 million the year before. Import prices .went up 5 percent,and so the real decline came to 6 percent, after a 3 percent rise in 1974 (see Table
IV3) . Excluding ships and aircraft and rough diamonds (which, as stated, are onlyslightly connected with current economic activity), the level slipped 3 percent, compared
with an 11 percent increase in 1974.
The highly irregular ships and aircraft item totaled $43 million in 1975, as contrastedwith $151 million in 1974. Net nominal imports of rough diamonds were a notch higher thanin 1974$412 million vs. $407 million. In real terms the level was down 1.5 percent,after sagging 21 percent in 1974. The decline in the year reviewed is explained by thepersistence of the world retreat in this industry, which began to leave its impress at theend of 1973. Another sign of the slump was the high rate of imports returned this year12percent compared with 8 percent in 1974.
All three main commodity import groups recorded real decreases this year. Consumer
goods were down 16 percent, after a 2 percent rise the year before; nondiamond
intermediates inched down 1.5 percent, compared with a 12 percent increase in 1974; and
CHAPTER IV, BALANCE OF PAYMENTS CURRENT ACCOUNT 59

Table IV3
COMMODITY IMPORTS," BY ECONOMIC DESTINATION, 197375
($ million, at current prices(
Percent annual increaseQuantityPrice
1974197419741973
EntireJan.EntireJan.EntireJan.EntireJan.1975yearSept.1975yearSept.1975yearSept.yearSept.
Consumer goods6.816.921.112.241.336.6167.0139.395.0118.688.1Food
18.81.32.18.813.910.456.964.448.857.343.3Other nondurables37.024.019.514.08.610.6106.9148.8113.1110.585.6Durables
Thereof: transport^6.239.331.714.08.610.637.160.545.640.031.3equipment16.31.91.312.120.820.0330.8352.5256.9286.4217.0Total
Production inputs8.224.317.04.530.335.61,739.41,812.31,296.91,119.4817.5For current production11.81.411.04.530.335.6347.6297.5208.5225.2172.7Spare parts, tools, etc.5.320.412.14J30.335.62,087.02,109.81,505.41,344.6990.2Subtotal11.325.211.44.1278.6369.8637.7597.2429.0211.0105.5Fuel1.614.36.62.352.366.42,724.72,707.01,94441,555.61,095.7Subtotal, incl. fuel1.421.428.62.715.618.2412.0407.0340.6448.0403.4Rough diamonds (net(1.55.22.32.347.856.03,136.73,114.02,285.02,003.61,499.1Total
Capital goods12.612.45.911.79.28.1541.3430.2312.8350.4273.2Plant and equipment
55.713.132.318.84.98.166.9127.098.8107.069.1Land transport equipmentTotal, excl. ships and
2.812.5llJ12.38.38.1608.2557.2411.64574342.3aircraft42.7150.586.0224.8194,1Ships and aircraft
Total, incl. ships and18.1^4.214.212.38.38.1650.9707.7437.6682.2536.4aircraft
7.75.22.70.10.1Goods n.cs.5.52.65.34.537.042.64,126.14,179.43,042.22,972.32,252.6Total gross imports
Total imports, excl.ships and aircraft
3.310.87.14.842.147.53,671.43,621.92,615.62,299.51,655.1and diamondsImports returned (excl.
6.62.92.23.73.0diamonds(4,119.54,176.53,040.02,968.62,249.6Total net imports
Less: Balance of pay100.1104.086.272.651.6ments adjustments
Total net imports,excl. administeredareas (accordingto balance of pay
4,019.44,072.52,953.82,896.02,198.0.ments(Commodity imports from
123.1103.475.966.750.7the administered areasTotal net imports,incl. administeredareas (accordingto balance of pay
4,142.54,175.93,029.72,962.72,248.7ments(
* C.i.f. values.Statistics.SOURCE: Central Bureau of
60 BANK OF ISRAEL ANNUAL REPORT 1975

capital goods other than ships and aircraft fell 3 percent after a 13 percent growth in1974. In consumer goods durables and nonfood products for current consumption were
responsible for the quantitative decrease; food imports, on the other hand, were up 7
percent in real terms, reversing the steep 17 percent drop of the previous year. The food
item consists chiefly of two products: frozen meat, which is imported by the government,
and sugar, which is imported partly by the government and partly by private dealers. The
1974 decrease occurred in frozen meat, owing to the accumulation of a large stock with thedragging of sales. In 1975 this sub it em soared 90 percent quant'itywise, mainly because ofcatchup demand after the previous ye ar ' s decrease, and accounted for the bigger food
import this year.Consumer durables plummeted 37 percent in real terms, after rising 24 percent in 1974
and by a 17 percent average in 196872. The downswing was led by land transportequipment 46 percent. Other items, such. as furniture and household equipment , also fellnoticeably. Nondurables other than food declined for the second consecutive year19percent in 1975 and 1 percent in 1974after moving up at a 9 percent average annual ratein 196872.
Imports of consumer goods are influenced by changes in real disposable income, theexpectation of relative price changes (including devaluations), ' and the government'seconomic measures, both fiscal (which in turn influence these factors) and administrative.In 1975 the government continued its policy of economic stringency, aimed at transferringfactors of production from domestic to export destinations in order to whittle down thebalance of payments deficit. As regards private consumption, this policy depressed realdisposable income and pushed up the relative price of imports. The shrinkage of income
dampened private consumption, including imports. The dearer cost of foreign consumer goods
led to some substitution of domestically produced commodities (both durables and
nondurables other than food), and hence reduced the direct import share of these items.The year reviewed was the second consecutive one to witness a decline in the direct importshare of total private consumption, after it had been on the rise from 1968 (apart from
1970); whereas in 196873 private consumption of goods grew 48 percent in quantity terms,imports of consumer products went up 83 percent; in 197375, however, the trend was
reversed, the former inching up 1.5 percent and the latter dropping. .15 percent .
1. No precise data are available on the change in the price ratio between imported anddomestically produced consumer goods, but national accounts data show that in 1975imported and domestically produced durables became 46 percent dearer, with imports risingat least 47 percent. In wearing apparel and personal consumption articles the total priceincrease was 28 percent, and in imports alone it was 41 percent.
CHAPTER IV, BALANCE OF PAYMENTS CURRENT ACCOUNT 61

Another determinant of consumer behavior in the short run is the public's expectations.After the likelihood of a cliange in the IL exchange rate had spurred the advancing of
overseas purchases in 1974, such expectations subsided in the first half of the year
reviewed following the devaluation of November 1974. This led to a sharp drop in realimports of durable goods (see Table IV4). The continued worsening of the balance ofpayments position triggered a renewed expectation of an import price rise in the second
half of the year, and this resulted in a somewhat larger volume during this period.Another reason for the downturn in consumer goods imports was the government's banning,
in :November 1974, of the overseas purchase of luxury items for a sixmonth period. In some
products, such as private cars, the ban was extended for another three months. Even so,during this period there was some import of the restricted items, which apparentlyrepresented the shipment of goods that had been ordered before the ban went into effect.The sagging of immigration in 1975 was another factor behind the smaller import ofconsumer goods.
Capital goods other than ships and aircraft were down 3 percent in real terms, afterrising 13 percent the year before. Trends here were mixed: land transport equipment
tumbled 56 percent, while plant and equipment were up 13 percent, after a 12 percentincrease in 1974. As a rule, imports of capital goods are not influenced by shorttermconsiderations, for investment is a protracted process, with considerable time elapsingbetween the planning and completion stages, and it is not quickly alterable; in addition,delivery dates are usually quite far ahead. A more telling determinant is the businessoutlook. The year reviewed witnessed a slowdown of the economy, but even so there was a
larger real expenditure on plant and equipment, both domestically manufactured and
imports. The hefty increase in foreign capital goods was conceivably due to theimplementation of several big projects: the exploitation of new phosphate deposits atNahal Zin, the development of petrochemicals, and the expansion of electricityproductioncompletion of the Eshkol III power station and continuation of work on Eshkol
IV. These investments were made by public sector companies, whose operations are notdirectly influenced by current business conditions and depend not on shortterm government
policy but on longrange development programs. In addition, several industries (e.g. metalfabrication) apparently stepped up their capital spending in anticipation of an expansioncf their export markets.
Imports of nondiamond inputs were down 1.5 percent in real terms, following a 14
percent physical increase in 1974. After dipping 25 percent in 1974, fuel was up 11
percent in tonnage terms in the year reviewed. This is explained by the running down of
62 BANK OF ISRAEL ANNUAL REPORT 1975

IV4Table
197375BY ECONOMIC DESTINATION, QUARTERLY*COMMODITY IMPORTS,
)$ million(
Capital goods*Intermediates0Consumer durablesLTotal8
SeasonSeasonSeasonSeasonQuantityally adUnadQuantityally ad 1UnadQuantityally adUnadQuantityally adUnadindexbjustedjustedindexbjustedjustedindex1"justedjustedindexbjustedjusted
Annual data457.41,344.6110.52,743.81973
557.22,109.8148.84,026.01974
608.22,087.0106.94,076.71975Quatrerly data
103.1101.6101.0105.8278.6292.1105.125.426.599.6573.0584.41973 I
95.4108.5113.2102.0322.5329.7105.515.629.3103.6673.0713.0II107.3137.4129.4105.8379.9366.198.533.029.9112.9815.3762.4III
94.2110.5113.886.4371.0356.790.923.224.883:7700.6684.0IV
116.4135.8134.7109.4418.5435.3114.834.535.4100.3902.5913.21974 I
113.3144.9149.5118.0524.2543.4140.443.943.6108.51,005.21,074.3II
107.9137.4127.5125.4555.4526.8114.837.734.2108.81,051.6966.4III
114.3137.4145.5129.2620.3604.3125.834.035.6108.21,078.71,072.2IV101.0150.2145.5119.1545.4557.797.637.337.4104.11,063.01,055.31975 I
106.0159.6163.4112.0528.5544.968.025.224..997.0984.31,047.3II111.0148.3141.5111.2501.8482.070.625.223.3107.01,025.5956.9w121.9149.0157.8113.8513.5502.471.519.821.3106.71,018.11,017.3IV
" Excludes ships and aircraft.b Average1973 = 100; see note b to Table IV2.c Excludes diamonds and fuel.
stocks in 1974 (see Table IV7) and by the tendency to maintain larger stocks after thereturn of the AbuRodeis oilfield. Not counting fuel, physical volume was down 5 percent,as contrasted with a 20 percent increase in 1974.
Required imports of inputs in 1975, calculated according to constant input coefficientsofor the various sectors of the economy, fell short of actual imports this year. Excluding
diamonds, they should have been 17 percent below their actual 1974 level. In 1972 the gap
between required and actual imports was smaller; it widened in the next two years and in
1975 narrowed somewhat, although it still surpassed the 1973 figure.A cardinal factor in the divergence was fluctuations in inventory investment due to
speculative motives. In 1972 there were no devaluation expectations, the European foreignexchange markets had calmed down, and the cost of maintaining stocks was high because of
2. Required imports of inputs are calculated according to the inputoutput table for1968/S9, assuming constant technological coefficients. This is a strong assumption,considering the amount of time that has elapsed since then, and therefore the computationsshould be regarded with considerable caution. Moreover, inventory is not included in thefinal uses from which the import requirements were calculated, so that there is a downwardbias in total required imports. Consequently, the differentials between actual andrequired imports were really smaller than shown in Table IV7.
CHAPTER IV, BALANCE OF PAYMENTS CURRENT ACCOUNT 63

Table
COMMODITY IMPORTS* BY
($ million,
1973
. NewOld:lassincationclassification >19721971197019691968
646.1683.6623.8561.0524.8505.0445.1223.6261.1228.5201.4172.7176.8143.0422.5422.5395.3359.6352.1328.2302.1557.6629.9597.3489.0446.0403.6291.3373.5445.8421.3342.5312.6.285.9202.7184.1184.1176.0146.5133.4117.788.6
1,203.71,313.51,221.11,050.0970.8908.6736.4133.5133.511 1.7115.991.786.575.0
1,337.21,447.01,332.81,165.91,062.599S.1811.4
284.1284.1284.1258.8222.9200.0170.9
Pirvate consumptionDirect importsIndirect imports
Investment, excl. ships and aircraftDirect importsIndirect importsTotal pirvate domestic demand
Public consumptionTotal domestic demand
Exports, excl. diamonds (incl.administered areas)Total imports, excl. diamonds,ships and aircraft
Exports of diamonds. Total imports, excl. ships and
aircraftTotal actual imports, excl. shipsand aircraft and diamondsa
Pirvate consumptionDirect importsIndirect imports
Investment, excl. ships and aircraftDirect importsIndirect importsTotal pirvate domestic demand
Public consumptionTotal domestic demand
Expotrs, excl. diamondsTotal imports, excl. diamonds
982.3 1,195.1 1,285.4 1,424.7 1,616.9163.5 169.8 158.4 210.7 273.7
1,145.8 1,364.9 1,443.8 1,635.4 1,890.6
1,029.2 1,223.2 1,315.9 1,470.6 1,586.8
Percent of total imports, excl. diamonds38.639.440.842.345.314.114.113.414.814.624.525.327.427.530.736.934.334.733.829.726.024.024.323.920.610.910.310.49.99.175.573.775.576.175.06.98.17.27.27.682.481.882.683.382.617.618.217.416.717.4
100.0100.0100.0100.0100.0
1,621.31,731.1306.7306.7
1,328.02,037.8
1,793.31,793.3
39.939.513.815.1
26.124.434.436.423.025.811.410.674.275.98.27.782383.617.516.4100.0100.0
* This table presents the direct imports for the various ifnal demands and indirect imports as calculated according toinputoutput coefficients. Hence there is a discrepancy between total imports as listed here and actual total imports. .
Until 1972 direct imports are according to the old classification, and from 1974 onward according to the new classification.
the alternative rates of return obtainable in Israel's financial and real estate markets.In the following year the economy apparently began to move to a higher level ofinventories. At the end of 1972 international commodity prices started to boom, and theperceptible weakening of the dollar on the European markets in the first half of 1973
sharply pulled up Israel's import prices and made it pay to stockpile, especially in view
of the strong demand pressures prevailing in the domestic economy. In the first half of1974 world' prices continued to spurt, and to this was added the belief that the government
would move to make imports costlier under its new economic policy. The rebounding of the
64 BANK OF ISRAEL ANNUAL REPORT 1975

IV5
FINAL DEMAND, 196875
at 1972 prices(
increaseannual quantitativePercent
197519741973197219711970196919751974
4.64.09.611.26.93.913.5640.7671.616.31.914.313.516.62.323.6190.7227.8' 1.45.06.99.92.17.38.6450.0443.82.58.95.522.29.610.538.6591.7607.02.812.55.823.09.69.341.1408.3420.01.91.64.620.19.813.332.8183.4187.03.66.27.616.38.26.923.41,232.41,278.62.416.619.53.626.46.015.3151.9155.63.57.38.614.39.76.822.61,384.31,434.2
333.8 347.5 17.0 11.5 16.1 9.8 17.5
2,061.2
2,014.6
2,022.0
1,943.3
19.1 5.8 13.3 15.6 7.8 6.9
Percent of incremental imports, exd. diamonds
b Obtained by summing the imports for the various ifnal demands at 1972 prices.
4.1
2.09.17.113.510.87.621.71,731.81,768.01.04A12.129.933.06.73.9290.2293.2
1.9
85.417.45J2.432.726.021.928.237.038.0102.52.928.614.120.6^.515.911.012.9
17.114.523.818.65.426.412.326.025.142.333.728.656.430.947.052.834.234.332.331.721.541.021.529.6' 39.123.623.89.92.07.115.49.417.413.710.610.6
127.651.180.989.056.968.981.071.272.310.215.119.12.217.45.85.48.88.8137.866.1100.086.874.274.786.480.081.137.833.9 13.225.825.413.720.018.9
100.0100.0100.0100.0100.0100.0100.0100.0100.0
economy, jitters about a possible rationing of foreign currency, the opportunity made
available by the government to finance raw material imports by way of foreign credit, allthese stimulated stockpiling.
In 1975 expectational trends were mixed: the first half witnessed the fading of thelikelihood of a big change in the IL rate after the November 1974 devaluation, but thepicture changed in the second half with the deterioration in the country's balance ofpayments position, the difficulties of obtaining American aid, and the stiffening of the
aid terms. This expectational change was reflected in both the big differential between
CHAPTER IV, BALANCE OF PAYMENTS CURRENT ACCOUNT 65

Table l\6USES OF DOMESTIC OUTPUT AND THEIR IMPORT COMPONENT, 197175
usesTotalDomestic usesExportsExcl.Incl.InvestPrivate con Public conTo adminisExcl.Incl.
diamondsdiamondsmentsumption sumptionTotaltered areasdiamondsdiamonds
Uses of domestic outputprices()IL million, at 1968/69 producer ;
18,87019,6983,6992,3947,56713,6603314,8795,707197121,05422,1334,4922,4238,35115,2664385,3506,429197222,08023,2894,7222,6728,84216,2364585,3856,594197323,70424,8534,7613,2049,29917,2645375,9037,052197423,887.25,0264,6273,1039,36917,0996586,1307,2691975
current commodity inputsimports ofRequiredat 1972 prices()$ million,
8811,0921471163606233122843919719671,241176112395683402445181972
1,0241,3311841344237414324154819731,1201,4131871564447875228257519741,1331,42318315245078565283573 .1975
uses of domestic outputincrease inPercent11.612.421.41.210.411.832.19.712.619724.95.25.110.35.96.44.60.72.619737.46.70.819.95.26.317.19.66.919740.80.72.83.10.81.022.63.83.11975
current inputsPercent increase in required imports of9.813.619.73.410.09.629.07.018.019725.97.34.619.67.18.57.51.25:819739.46.21.616.45.06.220.917.04.919741.20.72.12.61.40.225.00.40.31975
the official rate of the dollar and its price on the free market on the one hand, and the
high price of the Nat ad dollar and the dent in foreign currency sales by the privatesector in the second half of the year on the other. The diminished attraction ofindexlinked financial assets (notably bonds), because of the anticipated worsening oftheir terms (such as the taxation of devaluation gains) and the deceleration of the priceadvance in the second and third 11.iarters of the year, induced a switch to the commodity
markets despite the rise in real interest rates in the third quarter.The swings in the aforementioned differential reflected, as stated, the expectational
pattern over the year. The heightening of devaluation expectations in the final quarter of
1974 gave a fj Hip to inventory investment; in the first quarter of 1975 there was some
destocking (although the level still exceeded that in mid1974): and there was a furtherdecline in the second quarter. In the next three months the sharpening of expectations led
to a heavier inventory investment. In the final quarter, even though there was no
66 BANK. OF JSRAEL ANNUAL REPORT 1975

Table IV7
REQUIRED AND ACTUAL IMPORTS OF COMMODITY INPUTS, 197175
($ million(
Required imports
excl.Total imports,excl.Total imports,fueldiamonds anddiamondsDomestic destinationsExports
TotalPublicPrivateTo adminExcl.Incl.DifReDifReconsump consump requiredInvestistereddiadia
ferenceActualquiredferenceActualaquiredimportstiontionmentTotalareasmondsmonds
At current prices1318867551319758441,034111342142595292204101971
66933867631,0309671,241112395176683402445181972
1631,3451,1822241,5561,3321,718170559239968583066921973
3642,1101,7462912,7072,4162,8443219443561,6211566401,0681974
2182,0871,8692692,7252,4562,8943151,0133471,6751945871,0251975
pircesAt 19721349167821351,0168811,091116360147623312284391971
66933867631,0309671,24111239517668340244518197221311,0489171721,1961,0241,331134423184741432415481973
2681,2619932471,3671,1201,413156444187787522825751974/77
1771,1941,0172111,3441,1331,423152450183785652835731975A*
annual quantitative changePercent1.81.49.813.83.410.019.79.629.07.018.01972<
r
12.316.15.97.319.67.14.68.57.51.25.81973<z
20.414.39.46.216.45.01.66.220.917.04.91974om
5.41.61.20.72.61.42.10.225.00.4.O31975O77
total imports, excl. diamondsPercent of12prices)(at 1972>
10013.240.916.770.73.525.91971m
10011.640.918.270.64.125.21972110013.141.318.072.44.223.51973
10013.939.616.770.34.625.2. 1974
10013.439.716.269.35.725.019757a71
Percent of incremental importsz
pirces)(at 1972<n
1004.740.733.769.810.518.61972310038.649.114.0101.85.35.31973
10022.921.93.147.99.442.71974
10030.846.230.815.41.07.71975
1111 on an/י?וו11ו5ל nrp.c\\A rlnsQiiffinp tn thpjx accnrrii cation: the ifguerlew classile to the 1accordindata presented here for 1971 and 1972 areי TheO\1$ 937.0 million respectively.

weakening of expectations, there was some stockshedding because of the unexpectedrebounding of several demands: a real increase in private consumption of domesticallyproduced goods and the growth of industrial exports , which apparently led to a greater useof imported intermediates.
The demands depressing imports of nondiamond inputs were investment and publicconsumption; those stimulating imports were private consumption and exports excludingdiamonds and the administered areas. This of course reflected the real contraction of
capital expenditures and public consumption of domestically produced goods and theincrease in other uses. As regards direct imports for the various uses (Table IV5), theyear surveyed was the first since 1968 to see a real decline in the total volume.
The sole final use to take a larger import in 1975 was nondiamond exports, whereas
those for all other destinations declined in quantity terms. In other words, domestic usesaccounted for the downturn in imports, for the first time since 1968. The most strikingchange was the drop in the weight of direct and indirect imports for private consumption
from 45 percent of total nondiamond imports in 1968 to 37 percent in 1975. In investment
(excluding ships and aircraft) there was very little change this year . In publicconsumption the weight of imported inputs fell from their high 1968 level (due to the SixDay war) until 1973 (except for 1971)years in which there was a relatively calm securitysituationbut shot up again in the wake of the Yom Kippur War In nondiamond exports thelevel held fairly steady in 196873 but rose in the last two years, accounting in 1975 forabout 20 percent of total imports for the various final uses (excluding diamonds).
Examination of the sources of import growth (Table IV8) reveals that in 1975 theeconomy moved to a basket of uses with a lower import content than in the previous year,4due to the declining weights of private consumption, investment, and public consumption.
The contraction of total uses explains only some 10 percent of the import drop. The dentin the direct import share of private consumption, which was only slightly offset by therise in direct imports for investment, was responsible for roughly 80 percent of the totaldecrease in imports. In domestic output uses there was a shift to a basket with an import
.3. The data in Table IV5 relate to both direct and indirect imports for the variousfinal uses. The indirect imports were calculated with the help of inputoutput tables, andtotal imports include inputs for the various uses as computed according to inputoutputcoefficients and not actual inputs. Thus there is a difference between total imports aslisted in the table and total actual imports, amounting to the difference between actualand required imports of inputs so calculated. In this table exports exclude diamonds butinclude the administered areas.
4. The uses referred to in Table IV8 are private consumption, public consumptionexcluding direct defense imports (henceforth public consumption), investment other thanships and aircraft (henceforth investment), and exports excluding diamonds but includingthe administrative areas (henceforth exports).
68 BANK OF ISRAEL ANNUAL REPORT 1975

Table IV8
GROWTH OF COMMODITY IMPORTS* BY COMPONENT," 196975
($ million, at 1972 prices(
1969751975197419731972197119701969
Increase in imports due to:797.93.5129.7137.4162.4150.490.9130.61. Increase in total uses53.45.515.732.225.83.312.440.52. Change in composition of uses21.924.29.410.926.622.71.841.9Domestic uses31.518.76.321.30.819.410.61.4Export
3. Change in local productiondirect7.228.415.71.516.52.0'6.130.6import shares of uses7.228.415.71.516.5.2.06.130.0Thereof: Domestic uses
4. Change in sectoral origin of14.61.217.010.612.75.96.911.3demand for domestic output
9.15.53.713.49.33.74.13.6Domestic uses5.54.320.7. 2.83.49.62.8. 7.7Export
858.736.2146.7114.3192.0139.290.3212.4Total calculated increase in imports0682.149.997.0122.1166.7103.367.3183.4Domestic uses176.613.749.725.335.923.029.0Export934.871.3221.3206.6116.2154.792.7194.0Actual increase in imports
" Excludes diamonds and ships and aircraft.b The data here include direct imports for the various uses and indirect imports as calculated with the help of inputoutput tables. Hence there is a discrepancy between total impotrs as listed here and actual imports, amounting to thedifference between total actual impotred inputs and total required inputs computed accprding to inputoutput coelficients.The uses referred to in this table are private consumption (excluding direct defense imports), investment (excludingships and aircraft), and exports (excluding diamonds and including the administered areas).The sources of the increase in imports are as follows: (1) The change in total uses as defined here; (2) the change inthe weights of these uses in total uses due to the difference between the rate of increase in total uses and the rate ofchange in the total commodity impotr increase; (3) the change in the direct impotrdomestic output shares of eachuse; (4) the change in the sectoral origin of demand for domestic output. Until 1973 the increase in impotrs was calculated according to the old classification, and from 1973 onward according to the new classification.
" See note ".
component only a shade higher than in 1974.
The year reviewed was the first since 1968 in which the total effect of these factorswas to depress imports and the change in total uses accounted for only a small fraction ofthe downturn in imports. In 1972 the economy had moved to a basket of uses with a higherimport content, and over 80 percent of the incremental import stemmed from the expansionof total uses. The rising weight of investment in total uses and that of direct imports inboth private consumption and investment also contributed to the import growth, which was
only partly offset by a slightly greater preference in all uses for domestic inputs.In 1973 there was a drop in the import content of the uses, and the larger import was
due to the increase in total uses. The altered composition of usesa decline in theinvestment and export proportionscaused imports to sag, and this was only partlybalanced by a shift to a more importintensive branch composition of private consumption
and public consumption from domestic output. In 1974 the weight of investment continued todrift down and there was a drop in private consumption too; public consumption and
CHAPTER IV, BALANCE OF PAYMENTS CURRENT ACCOUNT 69

exports, on the other hand, moved up. The share of direct imports fell off in privateconsumption and rose in investment. The net result was a decline in the weight of directimports in total uses and a more importin tensive branch composition of uses from domesticoutput, with exports playing the dominant role.
Table IV9
INDEX OF COMODITY IMPORT PRICES, 196975
Total imports
CapitalInputs exd.diamonds
Consumer goodsExd.diamondsExd.lnd.
goodsFueland fuelFoodTotaland fueldiamondsdiamonds
1968=100Annual averages105.1102.1104.7103.1102.8104.6104.4105.51969108.1100.5106.6107.9106.1107.6107.2105.61970108.4112.8109.1132.0117.5111.3111.9109.21971117.1135.2112.8155.9128.5117.1118.0115.81972144.1191.5144.8216.9161.2148.7151.9148.41973
1972=100*122.5141.6128.4138.6128.1127.1128.2127.91973132.7536.3167.3195.8154.8157.0180.0175.21974149.0514.1174.8219.8173.5167.7188.4183.01975
1972=100Quarterly data124.9583.9155.5167.4142.3145.4172.1168.21974 I132.9575.2169.0194.6150.2157.5178.5173.5II132.9494.6168.6194.2155.3158.2184.9180.0III140.0485.7173.9230.5173.0165.5186.5181.5IV155.0481.0182.9280.2200.6176.9194.0187.51975 I155.3537.5178.5254.5190.0173.3195.5189.3II143.5520.2174.0178.1155.31635185.1180.6III142.3522.7164.0173.1155.8157.3179.5175.2IV
a In 1973 the Central Bureau of Statistics chained the base of the price indexes to 1972=100. Calculation of the indexesfor 1973 on the basis of 1968=100 would of course yield difFerent results from a calculation based on 1972=100.
Source: Central Bureau of Statistics.
After a strong twoyear surge (76 percent between 1972 and 1974), import prices went up
by a fairly mild 5 percent in 1975. The factors which had previously pushed the level up
at an inordinate rate lost momentum in the year reviewed, and at times even reverseddirection. In 1973 most of the upward thrust had been engendered by the world primary
commodity price boom and the depreciation of the dollar against the principal Europeancurrencies. In 1974 the predominant factor was the fuel price explosion. On the otherhand, many primary commodity prices began to soften in midyear and the dollar was lessvolatile than in 1973. In 1975 the index of Israel's import prices mirrored the sagging of
70 BANK OF ISRAEL ANNUAL REPORT 1975

world primary commodity prices since the middle of 1974.5 The appreciable strengthening ofthe dollar, mainly since the third quarter of the year (about 8 percent between June and
December 1975), also pulled down Israel's import prices (the IL was pegged to the dollarin 1975). As a result, Israel's import prices moved up at a modest pace on an annualaverage and even turned down in the course of the year (see Table IV9).
A comparison of Israel's nonfuel import prices (which are in dollars) with the exportprices of the industrial countries (which in Table IV10 are in local currency terms)shows that in 197075 the former outstripped the rise in the latter80 vs. 70 percent.This was partly due to the fall of the dollar against the leading European currencies (12
percent in 197075). If the weakening of the dollar is discounted, Israel's import pricesrose 60 percent during this period. The improvement in Israel's relative position has been
going on since early 1974, when the country's import prices, adjusted for the change inthe dollar rate, began to trail behind the price advance in the industrial nations; from
the beginning of 1974 to the end of 1975 Israel's import prices so adjusted went up 7
Table IV10
IMPORT PRICE INDEX OF ISRAEL AND SIX INDUSTRIAL COUNTRIES, 197075
impotrIsraeliExpotr pirce indeximportIsraelipirces (adjusted( /of industrialprices, exd. fuel,IL rate againsti importtfraelexport pirces of incountiresadjusted forbasket of selectedexd. fuelprices,dustiral countires)in local currency(change in IL ratecurrencies0)in dollars(
PercentPercentPercentPercentPercentchangeIndexchangeIndexchangeIndexchangeIndexchangeIndex
Annual daat100.0100.0100.0100.0100.01970
3.196.93.1103.10.199.92.8102.82.7102.71971
1.097.93.0106.24.1104.01.6104.45.7108.61972
6.2104.012.1119.019.0123.86.6111.326.9137.81973
2.0101.927.1151.224.4154.01.5109.622.5168.81974
7.794.112.4170.03.8159.92.3112.16.2179.31975
fQuarterly data106.3139.2147.9106.5157.51974 I
3.6102.57.0148.93.2152.64.7111.58.1170.2II3.598.95.5157.11.8155,31.9109.40.2169.9m1.397.63.9163.32.6159.31.3110.83.9176.5IV
1.396.32.5167.41.2161.24.9116.26.1187.31975 I1.794.70.6168.41.1159.50.3115.81.4184.7II
94.71.2170.411161.35.6109.34.5176.3III4.090.92.0173.82.0158.01.8107.33.9169.5IV
* Weighted by the composition of Israel's imports in 1972.Source: Central Bureau of Statistics, Monthly Foreign Trade Statistics, Apirl 1976, and Bank of Israel calculations.
5. The import price index is calculated according to the prices on the dates the goodsare released from customs and not the purchase dat'es . Since quite some time usuallyelapses between the two dates, a change in international prices shows up in the indexafter a considerable lag.
CHAPTER IV. BALANCE OF PAYMENTS CURRENT ACCOUNT 71

percent, compared with 25 percent in the industrial countries.6 Conceivably this partlyreflected the lagged effect of the softening of world prices on Israel's import priceindex (see note 5 above), and it may also be that Israel's import basket during thisperiod was cheaper than the industrial countries' export basket.
3. COMMODITY EXPORTS
Israel's industrial export progress is predominantly determined by two factors: foreigndemand and the economy's competitive standing. The picture for 1975 is not clearcut, therebeing a change of trend during the year and differences between the various industrialbranches.
The ebbing of overseas demand greatly retarded Israel's exports this year. The
developed industrial countries slid into their deepest recession in the entire postWorldWar II period. After a much slower expansion of Israel's export markets in 1974, there was
a complete standstill in 1975; this compares with a 10 percent average annual growth inthe five preceding years. The slump in world demand bottomed out in the first half of1975; in the second half the trend began to pick up, and this was apparently one of thereasons Israel's foreign sales accelerated during this period.
The drastic change in the economic climate undoubtedly played a central role in theflattening of industrial exports in 1975. But this was only one of a whole string of
factors, and it seems that it exerted a differential effect, as evidenced by the sharpinterbranch divergences in trend..
Israel's competitive position apparently did not undergo any significant change in theyear reviewed, even though an improvement in export profitability was one of the foremosteconomic policy targets. Various. indicators show a slight average upturn in 1975 compared
with the previous year (see Table IV19), but the figure still fell short of its 1973
level; what is more, there were sharp fluctuations during this period, and in the second
half of 1975 the level even sank noticeably. The main indicators presented here are theratio between export prices to the exporter and production costs, and the ratio between
7export prices to the exporter and domestic output prices. These two measures highlight a
salient fact: in recent years export profitability has not changed much, in glaringcontrast to the rising trend in 196769 (and to some extent even afterward), which was the
6. The strengthening of the dollar since the second half of 1975 has further bolsteredIsrael's relative position.
7. The latter measure apparently overstates profitability, for domestic output .pricesrepresent the market and not producer prices, and in the last few years the former rosefaster because of the hiking of indirect taxes.
72 BANK OF ISRAEL ANNUAL REPORT 1975
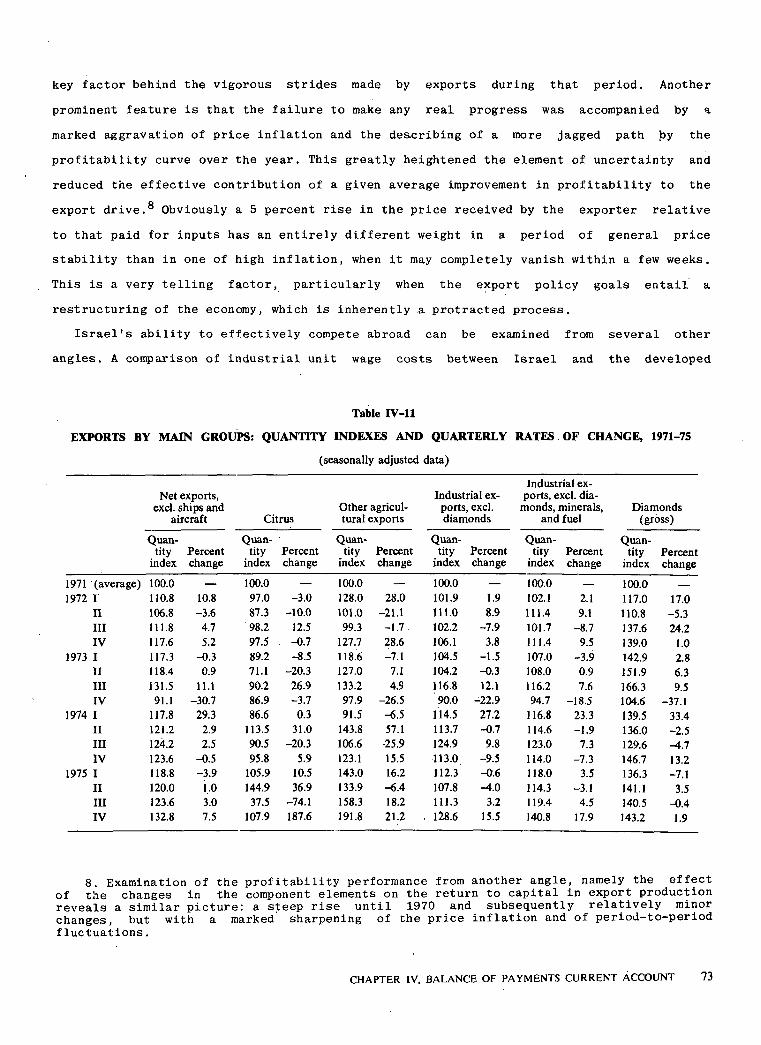
key factor behind the vigorous strides made by exports during that period. Another
prominent feature is that the failure to make any real progress was accompanied by a
marked aggravation of price inflation and the describing of a more jagged path by theprofitability curve over the year. This greatly heightened the element of uncertainty and
reduced the effective contribution of a given average improvement in profitability to theexport drive. ^ Obviously a 5 percent rise in the price received by the exporter relativeto that paid for inputs has an entirely different weight in a period of general pricestability than in one of high inflation, when it may completely vanish within a few weeks .
This is a very telling factor, particularly when the export policy goals entail arestructuring of the economy, which is inherently a protracted process.
Israel's ability to effectively compete abroad can be examined from several otherangles. A comparison of industrial unit wage costs between Israel and the developed
Table IV11
EXPORTS BY MAIN GROUPS: QUANTITY INDEXES AND QUARTERLY RATES OF CHANGE, 197175
(seasonally adjusted data(
Industrial expotrs, excl. diaIndustrial exNet expotrs,
Diamondsminerals,monds, 1, excl.potrsOther agriculexcl. ships and)gross(and fueldiamondstural expotrsCitrusaircraft
QuanQuanQuanQuanQuanQuanPercenttityPercenttityPercenttityPercenttityPercenttityPercenttitychangeindexchangeindexchangeindexchangeindexchangeindexchangeindex
100.0100.0100.0100.0100.0100.0)average(197117.0117.02.1102.11.9101.928.0128.03.097.010.8110.8I19725.3110.89.1111.48.9111.021.1101.010.087.33.6106.8II24.2137.68.7101.77.9102.21.7.99.312.598.24.7111.8III1.0139.09.5111.43.8106.128.6127.7. 0.797.55.2117.6IV2.8142.93.9107.01.5104.57.1118.68.589.20.3117.3I19736.3151.90.9108.00.3104.27.1127.020.371.10.9118.4II9.5166.37.6116.212.1116.84.9133.226.990.211.1131.5III
37.1104.618.594.722.990.026.597.93.786.930.791.1IV33.4139.523.3116.827.2114.56.591.50.386.629.3117.8I19742.5136.01.9114.60.7113.757.1143.831.0113.52.9121.2IIA.I129.67.3123.09.8124.925.9106.620.390.52.5124.2III13.2146.77.3114.09.5113.015.5123.15.995.80.5123.6IV7.1136.33.5118.00.6112.316.2143.010.5105.93.9118.8I19753.5141.13.1114.34.0107.86.4133.936.9144.91.0120.0II0.4140.54.5119.43.2111.318.2158.374.137.53.0123.6III1.9143.217.9140.815.5. 128.621.2191.8187.6107.97.5132.8IV
8. Examination of the profitability performance from another angle, namely the effectof the changes in the component elements on the return to capital in export productionreveals a similar picture: a steep rise until 1970 and subsequently relatively minorchanges, but with a marked sharpening of the price inflation and of periodtoperiodfluctuations.
CHAPTER IV, BALANCE OF PAYMENTS CURRENT ACCOUNT 73

Table IV12
COMMODITY EXPORTS, 197175
($ million, at current f.o.b. prices(
19751974197319721971
Agricultural exports176.8120.8108.7109.0113.8Citrus101.171.363.051.941.0Other277.9192.1171.7160.9154.8Total agricultural exports
Industrial exports84.490.148.142.341.9Mining and quarrying125.7128.8105.595.078.9Food, beverages, tobacco161.9167.3154.8129.6123.9Textiles, clothing, leather44.736.329.230.527.4Rubber and plastic products185.9218.479.761.853.9Chemicals199.2154.8109.482.980.3Metal, machinery, transpotr equipment97.859.827.929.625.3Electrical and electronic equipment548.9562.6562.8389.6268.0Diamonds (net(70.772.063.751.942.2Other .
1,519.21,490.11,181.1912.6741.8Total industrial exports1,797.11,682.21,352.81,073.5896.6Total agricultural and industrial exports
Other exportsBunkers and stores supplied to foreign
18.228.89.310.610.8ships and aircraft6.214.08.813.15.3Sale of old ships and aircraft27.321.023.410.46.1Miscellaneous51.763.841.534.122.2Total other expotrs
1,848.41,746.01,394.31,107.6918.8Totali expotrs (foreign trade definition(13.89.46.15.7Exports returned (excl. diamonds(
33.923.019.314.2AdjustmentsTotal expotrs, excl. administered areas
1,702.71,365.21,082.6900.5)balance of payments deifnition(297.1191.2129.693.8Exports to administered areas
Total net commodity expotrs, f.o.b.,incl. administered areas (balance of
1,999.81,556.41,21?.2994.3payments deifnition(
Source: Central Bureau of Statistics.
countries shows a marked decrease in Israel's favor until 1972 (see Table IV21). This
trend was checked, and even reversed direction, in 197374, but again turned downward in
1975. At first blush this would seem to attest to a bolstering of Israel's competitivestanding, and to some extent it was contrary to the actual development of exports.9 But
this must be viewed in its proper perspective, and the picture here is not so sharp.
In reality profitability is affected by changes in total production costs, which
include, besides labor, domestically purchased inputs, some of them nontradables. The
prices of these components do not necessarily move in step with those of the others,
9. The lagged effect of developments in this area and the adverse change at the end of1975 must be borne in mind.
74 BANK OF ISRAEL ANNUAL REPORT 1975

particularly in a period of drastic changes in the balance of payments and in relativeprices. In contrast to Israel, the balance of payments strain in the developed industrialcountries in the last few years was accompanied by a striking alteration of relativeprices (see Table IV23). In 197274 export prices in these countries rose 16 percentrelative to the product, whereas in Israel they went up only 3 percent.
The implications of these developments regarding the competitiveness of the variouscountries are quite plain. The prices of nontradable inputs and domestic inputs as a whole
in relation to exports rose less steeply in the industrial nations than in Israel. In
other words, total production costs relative to exports rose faster in Israel and more
slowly in the industrial countries than what a comparison of per unit labor costs aloneindicates. One other point that should be noted is that the unit labor cost indicator does
not allow for the effect on competitiveness of trend differences in the prices to theexporter. An equal rise in this measure in two countries does not imply a constant
relative competitiveness if one of them experienced a stronger export price advance. Thus
a comparison of relative price trends in the industrial countries and in Israel may alsoblur the picture of Israel's competitive standing as revealed by the per unit labor costfigures.
The discussion so far has not dealt with another development which played a formidablerole in Israel's industrial export trends in the last four years, namely the big disparitybetween the two broad component groups. One consists of the products of the electronics,machinery, and metal industries, which in general may be regarded as more advanced
technologically speaking, while the second group consists of the less technologicallyadvanced industries: food, textiles, clothing, leather, wood, and rubber and plastics.What characterizes the first group is its impressive export performance (with of coursesome interindustry and intertemporal differences). In the last four years its overseassales swelled 86 percent in real terms, and even in 1975, when world commerce shrank, itracked up a 13 percent gain. By contrast, the second group has been slipping perceptivelysince 1972 (a cumulative decrease of 10 percent over this period), after it had made onlysluggish headway previously (see Tables IV15 and IV16(. '
These changes, of course, altered the weights of the two groups in industrial output,
10. This comparison does not accurately reflect the relevant developments, for exportprices also include the effect of the import component. A more precise comparison would bebetween output prices for export and those for domestic uses. A hypothetical calculationof. the relative changes in output prices between these two destinations, based on generalassumptions regarding the import components and the export share of the product, ispresented for illustrative purposes in the appendix to this chapter (in Hebrew only). Itshows that the divergence between the movement of relative prices in Israeli and in theindustrial countries was probably even more pronounced.
CHAPTER IV. BALANCE OF PAYMENTS CURRENT ACCOUNT 75

1V13Table
197175GROUP,MAJORBY BRANCH ANDCOMMODITY EXPORTSCO
<
current prices()$ million, atz
pircechange inannualPercentannual change in quantityPercent ;= 100Quantity index:1971 =1Q75
19751974197319721975197419731972. 1975197419731972\y 1 j
($ m.(<
17.38.811.22.323.33.2^.01.6124.2100.797.5101.6277.9Agricultural exports25.77.25.60.216.43.75.64.4108.993.690.295.6170.8Citrus<
2.
5.812.225.26.634.00.93.018.7155.7116.2115.1118.7101 JOtherZf*10.360.029.23.815.117.112.02.785.1100.385.697.384.4Mining and quarrying<
6.824.110.94.78.61.60.115.0103.5113.3115.1115.0125.7Food, beverages, tobaccoJO
10.013.535.72.67.39.41.410.074.580.488.790.052.3Textilesm
4.610.922.35.12.01.48.55.899.298.296.8105.1104.1Clothing35.78.918.04.818.28.27.327.2127.9108.2117.9127.25.5Leather8.526.540.21.06.124.52.419.982.888.1116.7119.612.8Wood14.962.122.54.316.519.215.57.461.273.390.8107.42.8Paper14.962.122.510.912.616.76.60.6 .88.178.394.0100.618.6Pirnting and publishing
Rubber and plastic prod13.036.45.48.69.18.68.72.593.385.593.6102.544.7ucts
4.458.915.03.918.572.512.110.4174.0213.5123.8110.4185.9ChemicalsNonmetallic mineral prod
4.78.119.46.57.098.72.8^14.2122.0114.057.355.86.5ucts9.545.630.64.00.416.331.15.0145.4144.8124.595.025.5Basic metals8.815.120.03.546.622.421.35.0148.3101. I82.6105.0103.2Metal products6.16.424.37.29.123.229.232.2229.6210.4170.8132.230.8Machinery17.19.123.84.415.925.277.830.2130.7155.4124.196.839.7Transport equipment
Electircal and electronic5.06.522.59.655.8101.323.06.7257.7165.482.2106.797.8equipment
Diamonds1.66.328.817.60.53.212.425.9137.7137.0141.5125.9611.1Gross1.66.328.817.60.86.012.330.1136.2137.3146.1130.1548.9Net10.113.321.49.93.711.70.638.3118.3122.9139.1138.330.0Misc. industiral expotrs
Total industrial exports2.619.724.87.90.15.64313.3124.9124.8118.2113.31,611.4Gross5.932.220.64.91.213.42.15.3115.5116.9103.110531,970.3Excl. diamonds
Excl. diamonds and5.529.919.95.00.213.11.26.1118.8118.6104.8106.1885.9minerals
Total industiral and agir5.618.422.76.72.65.33.311.8124.8121.6115.5111.81,889.3cultural exports11.419.730.018.027.128.46.49.936.3132.1102.9109.951.8Other exports
Total expotrs (foreign4.718.422.97.01.56.03.011.7123.8122.0115.1111.71,941.1trade definition(
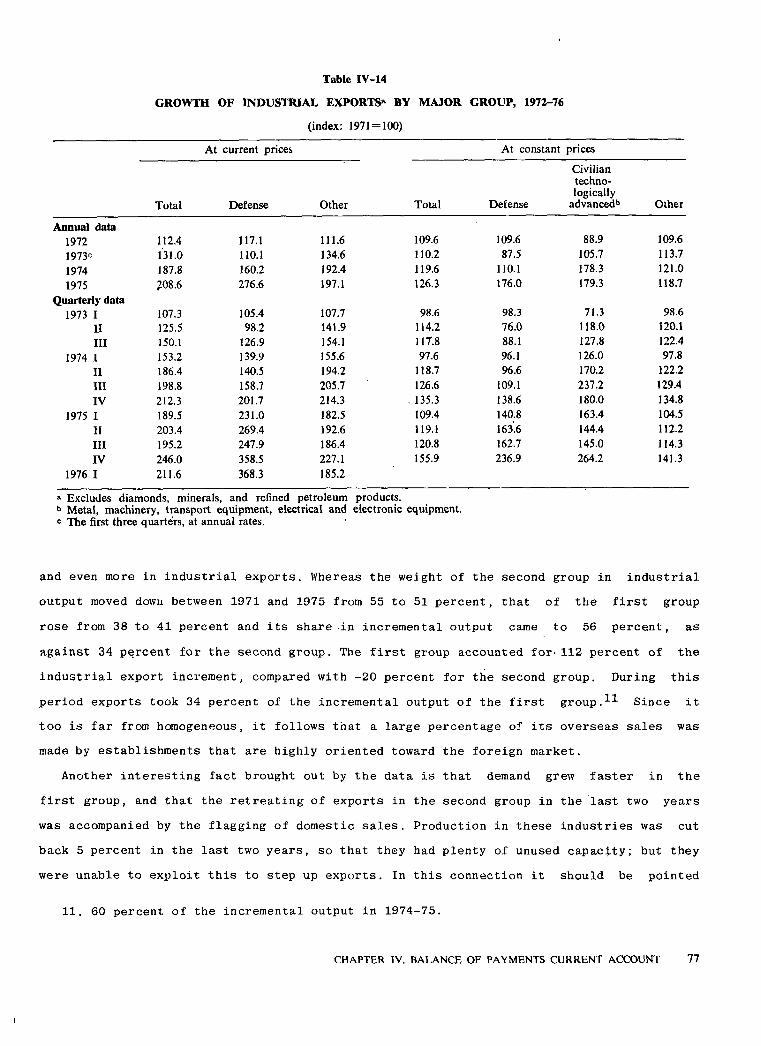
Table IV14
GROWTH OF INDUSTRIAL EXPORTS* BY MAJOR GROUP, 197276
(index:1971 = 100)
pricesAt constantAt current pirces
Civiliantechnologicallyadvanced11 OtherDefenseTotalOtherDefenseTotal
Annual data109.688.9109.6109.6111.6117.1112.41972113.7105.787.5110.2134.6110.1131.01973'121.0178.3110.1119.6192.4160.2187.81974118.7179.3176.0126.3197.1276.6208.61975
Quarterly data98.671.398.398.6107.7105.4107.31973 I120.1118.076.0114.2141.998.2125.5II122.4127.888.1117.8154.1.126.9150.1III97.8126.096.197.6155.6139.9153.21974 I122.2170.296.6118.7194.2140.5186.4II129.4237.2109.1126.6205.7158.7198.8III134.8180.0138.6. 135.3214.3201.7212.3IV104.5163.4140.8109.4182.5231.0189.51975 I112.2144.4163.6119.1192.6269.4203.4II114.3145.0162.7120.8186.4247.9195.2III141.3264.2236.9155.9227.1358.5246.0IV
185.2368.3211.61976 I
a Excludes diamonds, minerals, and reifned petroleum products.b Metal, machinery, transpotr equipment, electircal and electronic equipment.<= The ifrst three quarters, at annual rates.
and even more in industrial exports. Whereas the weight of the second group in industrialoutput moved dowu between 1971 and 1975 from 55 to 51 percent, that of the first group
rose from 38 to 41 percent and its share in incremental output came to 56 percent, as
against 34 percent for the second group . The first group accounted for. 112 percent of theindustrial export increment, compared with 20 percent for the second group. During thisperiod exports took 34 percent of the incremental output of the first group .I' Since ittoo is far from homogeneous, it follows that a large percentage of its overseas sales was
made by establishments that are highly oriented toward the foreign market.Another interesting fact brought out by the data is that demand grew faster in the
first group, and that the retreating of exports in the second group in the last two yearswas accompanied by the flagging of domestic sales. Production in these industries was cut
back 5 percent in the last two years, so that they had plenty of unused capacity; but theywere unable to exploit this to step up exports. In this connection it should be pointed
11. 60 percent of the incremental output in 197475.
CHAPTER IV, BALANCE OF PAYMENTS CURRENT ACCOUNT 77

Table IV15
INDUSTRIAL OUTPUT AND EXPORTS BY INDUSTRY TYPE," 197175.
1971
197519741973"19721971= 1001968=100
Total industry122.6119.8119.1108.2100145.9Total output122.4.120.2121.7108.4100141.8Output for domestic market123.4118.2106.1107.3100173.3Exports16.316.015.316.016.112.8Exports as a percent of output
"Traditional" industries3114.2117.3119.5107.1100Total output119.3122.6124.6108.3100Output for domestic market92.594.798.3102.2100Expotrs15.515.515.718.319.2Exports as a percentof. output
Technologically advanced industirese
133.8124.8119.5108.9100Total output125.8118.6119.7108.1100Output for domestic market185.9165.0)18.1114.3100Exports18.617.713.314.113.4Exports as a percent of output
Total industry percent annualincrease
2.30.610.18.213.5'Total output1.61.110.37.010.8Output for domestic market0.71.70.21.22.7Exports
a Excludes diamonds, minerals, and reifned petroleum products. The data are based on 1968 producer pirces; expotrshave been valued at domestic market prices (i.e. the price differences .between the two markets as estimated from theinputoutput table).
b The first three quatrers of the year, at annual rates. ,
" In 1969.<* Food, leather, textiles and clothing, wood and wood products, paper and paper products, rubber and plastics.e Basic metals, . chemicals, transpotr equipment, electronic equipment, machinery, and metal products.f Average for 196871.
out that the revival of world demand has been felt mostly in consumer goods, and hence ismore relevant to the second group, where a large proportion of the output is destined forconsumption.
The existing data do not permit a reliable analysis of the background to thesedevelopments, but they apparently reflect a longterm structural change in world commerce
and in Israel's relative advantages. A comparison of per unit labor costs (Table IV21)seems to indicate a notable improvement in Israel's competitive ability, at least until1972, but the comparison is with developed industrial nations. The picture they reveal ischiefly relevant to those industries that made technical strides during this period; theyare less relevant to those "traditional" industries that lagged behind in this respect,for this period witnessed the steady loss of the relative advantages enjoyed by theindustrial states to those on a lower rung of industrial development: Korea, Formosa, Hong
Kong, Brazil, Mexico, etc. One manifestation of this trend has. been the growing tendency
78 BANK OF ISRAEL ANNUAL REPORT 1975

of large manufacturing concerns in the developed world to set up subsidiaries in thesecountries and to transfer to them the simpler stages of production. A measurement of theinternational competitiveness of Israel's traditional industries should therefore be made
not with the developed industrial countries, but with those lower down on the development
ladder. A preliminary examination shows that here there may have been a noticeable turnfor the worse.
Table IV16
TOTAL AND INCREMENTAL INDUSTRIAL OUTPUT AND EXPORTS,BY INDUSTRY TYPE, 1971 AND 1975
(percentages, at constant prices)
1971 1975
"Traditional" industiresOutput 54.9 51.1Exports 65.1 48.7Incremental output, 197175 34.4Incremental exports, 197175 20.3
Technologically advanced industriesOutput 37.8 41.2Exports 31.4 47.1Incremental output, 197175 56.5Incremental exports, 197175 112.3
Other industriesOutput 7.3 7.7Exports 3.5 4.2Incremental output, 197175 911
Incremental exports, 197175 8.0
These changes in the composition of Israel's industrial exports and in its ability to
compete have an important bearing on the restructuring of the economy which is n.ecessary
for mending the balance of payments. Because of the marked changes in the relativecompetitiveness of the various branches , in diverting resources. to exports the emphasis
should be not so much on directly altering the economic destinations of the output of theexisting industries as on the more painstaking restructuring of the economy: thealteration of the branch composition of investments and the shifting of workers from some
branches to others. The slackening of demand for the products of those industries whose
international competitive standing has weakened and the resulting hidden unemployment are
not calculated to induce them to shift to exports.12 Thus there can arise a situation ofunderemployment in some industries side by side with a shortage of labor in others.
12. If a large hidden unemployment is what induces them to eye the foreign market, thisis an export based on shortterm considerations and is not profitable to the nationaleconomy.
CHAPTER IV. BALANCE OF PAYMENTS CURRENT ACCOUNT 79

The nature of the requisite structural changethe transformation of the industrymakeup of the economy and the new investment involved, the time required for doing this,and the need for greater labor mobilitymakes it imperative that the relative pricestructure be such as to properly guide entrepreneurs in their decisionmaking and be
credible enough for taking decisions that will bear fruit only after several years.
(a) Exports by Branches
Commodity exports edged up 2 percent in real terms in 1975, compared with a 4.5 percent
Table
EFFECTIVE EXCHANGE RATE FOR
OiffcialDategroup (90(by valueaddedper dollar(Incentive (agorotrate (agochangeDate
rot perwent intochange66+5665465536^52635025dollar(forceannounced*
10.57.54.51.03001.4.6625.518.010.51.83001.11.6634.5 )45>(25.5183001.3.6735201035019.11.6719.11.6755352035019.2.70>>17.2.70105908035017.8.7016.8.701121009590833501.1.7119.5.71898887868542022.8.7122.8.7199989796954201.1.7222.8.72"1141111081051024201.1.7310.4.73
' 1211171131091054201.8.735.8.731421381341301264205.11.7319.2.741841801761721684203.7.742.7.7413012612011410860010.11.7410.11.741641561451341236001.1.7519.1.751741651521401276001.4.7521.5.75178169155143129.6001.5.7528.5.751821731581451316001.6.7528.5.7518517616014813261219.6.75'22.6.751851761601481326245.8.755.8.751851761601481326369.9.759.9.7518517616014813270028.9.7528.9.7518517616014813271024.11.7524.11.75
a For diamonds and certain other items under the control of the Ministry of Commerce and Industry's Diamond Department a different schedule of indirect tax rebates was in force (see also note e).
b This column lists the dates on which the changes were oiffcially announced. In some cases the change was announcedwith effect retroactive, but exporters were generally aware of fhe impending change close to the date it went into force.
c In March 1967 a special incentive was granted to growth industries', this was abolished after the November 1974devaluation.
d In Apirl 1970 the Ministry of Commerce and Industry added to the list of items eligible for incentives a group oftextile products, which received the following rates:
IncentiveDate (agorot per dollar(
107.4.707017.8.707219.5.718522.8.71
80 BANK OF ISRAEL ANNUAL REPORT 1975

average annual advance in the two preceding years. This slight gain was achieved thanks tothe vigorous expansion of farm sales, which more than outweighed the stagnation inmanufactures. The contribution of agriculture to the nominal expansion of total exportswas even greater, for the prices it commanded abroad rose much faster than those ofmanufactures.
Agriculture : After growth had tailed off a bit in' the two preceding years, farm
exports made big strides in 1975, with both citrus and other products sharing in the
IV17
INDUSTRIAL EXPORTS,11 196675
EffectiveImport defense
lewrate forimportsfor
Agorotperby valueadded groupper dollar()agorotexchange rateEffective
exportsdollarPercent1 66+5665465536452635025
310.5307.5304.5301325.5318.0310.5301.8334.5)345(325.5318.0385370360350405385. 370350
4207020455440430350462450445440433350
5048420509508507506505420519518517516515420534531528525522420541537533529525420
52510525562558554550546420567147356046005965925884206909015730726720714708600
764756745734723600774765752740727600778769755743729600782773758745731600
703.891.815797788772760744612 .
717.693.615809800784772756624731.495.415821812796784768636805.010515885876860848832700816.5106.515895886870858842710
Subsequently these products were granted the incentives for the 2635 percent valueadded group.* In August 1972 a 10 agorot increase in incentives was announced, to replace the government's participation in theifnancing of. export promotion. For the majority of products this simply represented the awarding of a higher incentive.The arrangement did not apply to a group of items which the Ministry of Commerce and Industry deemed ineligiblefor this type of support (diamonds, minerals, refined petroleum products, soybean oil and oilcake, arms and ammunition, scrap, cement, and exports via the Jordan bridges). After the changes introduced subsequently these goods received 10 agorot less than the amounts listed in the table. This group has become slimmer over the years, as someof the items have become eligible for the extra incentive.
f The IL was ofifcially devalued on June 18, 1975.
CHAPTER IV. BALANCE OF PAYMENTS CURRENT ACCOUNT 81

advance. In the case of citrus this is explained by the buoyant foreign demand for Israelifruit, after the crops of such rivals as Spain and Cyprus were damaged by adverse naturalconditions and Moroccco turned to the Eastern European markets. This made it possible tostep up overseas sales of fresh fruit at the expense of supplies to the canneries.
The formidable expansion of other farm exports can be ascribed, on the supply side, to
the full utilization of productive capacity after the previous underutilization due to theYom Kippur War. All the increment went abroad, where higher prices were fetched this year.That this gain was achieved despite the recession in Israel1s principal markets for such
products can apparently be credited to the fact that the population groups buying thesecommodities are less vulnerable to shortrun changes in income. In addition, the foreignmarkets for these items are expanding steadily. Some of the products are newcomers to thelist, and I s rae 1 is also gaining a foothold in new areas with items that have long been
sold abroad. Non citrus products are largely dispatched by air at tariffs far above thegoing international levela factor constraining a stronger expansion of overseas sales.
Diamonds : The faltering of world demand for diamonds, evident since the beginning of1974, was accompanied in 1975 by swings in both directions in the prices of polishedstones, but the average level remained relatively low compared with other world prices (atthe end of 1975 diamond prices stood at their level in the third quarter of 1973). Despite
IV18Table
197375AND IMPORTS,RATES FOR EXPORTSEXCHANGEEFFECTIVE
)IL per dollar(
Export incentiveEffective exchange ratesfor highest
ImportsExportsOiffcial IL rate (IL(
Annual data5.075.351.154.2019735.646.011.514.5019747.288.071.746,331975
Quarterly data5.045.190.994.201973 I5.045.271.074:20II5.045.38.184.20III5.175.54.344.20IV5.255.62.424.201974 I5.255.62.424.20II5.676.04.844.20III6.376.75.355.40IV6.907.60.606.001975 I6.927.77.756.02II7.198.05.806.25III8.108.85.817.04IV
82 BANK OF ISRAEL ANNUAL REPORT 1975

the 1975 dent in both quantities and prices, toward the end of the year there were signsof a pickup, which was apparently connected with the fact that the industrial countriesbegan to pull out of their business slump. Data for the first quarter of 1976 point to a
' definite continuation of the uptrend (an increase of 12 percent in seasonally adjustedmoney terms over the final quarter of 1975). Conceivably the appreciation of the dollarduring 1975 weakened one element of the demand for diamonds, namely that stemming from
shortrun considerations connected with the adjustment of asset portfolios; the otherelement rose even more strongly at the end of the year. The disparate diamond export and
import price changes (1.6 percent for exports and 2.8 percent for imports) would seem to
attest to a decline in the industry1s value added, but it should be stressed that theprice indexes here are quite deficient, and so caution must be exercised in drawing
conclusions on this point.Minerals : The depressed state of the world market for all the principal minerals
exported by Israel caused overseas sales to dip 6 percent in value and 15 percent intonnage, after a resounding 90 percent spurt in 1974. The crisis cropped up in the courseof the year reviewed, and after exports had peaked at some $30 million in the firstquarter, the level fell to about half in the last three months.
The item hit hardest was phosphates. Morocco, the number one exporter of this product,succeeded until the middle of 1974 in fixing prices four to five times as high as thoseprevailing at the end of 1973, and even at this level a shortage was felt in the market.The collapse pf prices and slackening of demand at the beginning of 1975 were due toseveral factors. Unlike the oil cartel, that organized by Morocco was unable to hold itsown, and the junior partners began to undercut the fixed tariffs in order to boost sales.In addition, the drastic phosphate price rise led to a more rational use of fertilizers(especially in the developed countries) and to a sharp break in demand .. This followed theeasing of demand on the part of the developing countries, which began in 1974 because of
the paucity of foreign exchange they have suffered since the oil price explosion. The
speculative stockpiling during the boon period (which gave a further twist to the pricespiral) now helped to create a feeling of oversupply. Israel's phosphates are inferior tothose of most of its competitors, and this restricts its use. During the 1974 price boom
the country benefited from some substitution effect and managed to step up its exports ata faster quantitative rate than its rivals. The year reviewed saw a reversal of trend,with Israel's sales tumbling more than four times as fast as the world average.
This led to the cutting back of potash production as well. The market for this product,also used as a fertilizer, differs from that for phosphates, and Israel1s position here is
CHAPTER IV. BALANCE OF PAYMENTS CURRENT ACCOUNT 83

also different. The 1974 boom was more modest and prices slipped less dramatically in thesecond half of 1975. World trade in this commodity did not shrink on average in 1975,
although growth slowed from a 10 percent annual average in recent years to a mere one
percent this year. In contrast to phosphates, the difficulties encountered in marketingpotash induced a policy of stockpiling in anticipation of a recovery in 1976.
Even at the present low world price level, phosphate and potash sales are profitable tothe economy. This does not apply, however, to coppercement. The collapse of prices in
1975, which was primarily associated with .the world recession, exposed the economic
weakness of the Timna works and led to its closure at the beginning of 1976, despite a
Table
INDICATORS OF INDUSTRIAL
1966 1967 1968 1969 1970 1971 1972
1. Prices received by the exporterPercent annual changeIndex (1965=100)
2. Prices paid by the importer for importedintermediates1' )in IL)Percent annual changeIndex (1965=100)
3. Domestic input pricesPercent annual changeIndex (1965=100)
4. Wages per unit of outputPercent annual changeIndex (1965=100)
5. Price of capital per unit of outputPercent annual changeIndex (1965=100)
6. Weighted index of input prices0Percent annual changeIndex (1965=100)
7. Domestic output prices'1Percent annual changeIndex (1965=100)
8. Prices received by the exporter/weightedindex of input prices .
Percent annual changeIndex (1965=100)
9. Prices received by the expotrer/domesticoutput prices6Percent annual changeIndex (1965=100(
14.312.810.43.88.811.63.5185.8162.5144.1130.5125.7115.5103.5
18.321.910.24.59.81.01.0182.3154.1126.4114.7109.8100.0101.0
12.29.66.51.92.31.14.7144.5128.8117.5110.3108.2105.8104.7
7.85.610.80.0A.I0.211.1133.4123.7117.1105.7105.7110.9111.1
13.918.29.11.514.07.65.3140.8123.6104.695.997.4113.3105.3
13.112.58.52.01.70.65.2151.6134.0119.1109.7107.6105.8105.2
11.19.46.21.92.41.14.8142.8128.5117.5110.6108.5106.0104.8
0.90.20.82.77.011.01.6122.4121.3121.0120.0116.8109.298.4
2.83.2.3.91.86.310.31.2130.1126.5122.6118.0115.9109.098.8
" Excludes diamonds, minerals, and refined petroleum products.b Importsforexports.c Weighted according to the composition of inputs to industry, excluding diamonds, minerals, and refined petroleum products, according to the 1968/69 inputoutput table.
84 BANK OF ISRAEL ANNUAL REPORT 1975

likely slow rebounding of prices during the year.
(b) Indus tria 1 Exports Other Than Diamonds and MineralsOverseas sales of manufactures remained unchanged in physical terms in 1975j while the
prices received rose 5.5 percenta much milder rate than in previous years. This group
includes refined petroleum products, whose export is quite erratic and has a small valueadded. Excluding diamonds, minerals, and refined petroleum products, industrial salesabroad forged ahead 5.3 percent in real terms in 1975, roughly the same average rate as in
the two preceding years. Trends in the various branches and product groups were mixed in
IV19
EXPORTPROFITABILITY,8 196675
19751974
IVIIIIIIIVHIIII197519741973
7.12.41.217.915.111.69.36.642.642.125.1491.4458.7469.8464.1393.5341.8306.2280.2471.0330.3232.4
6.50.22.814.716.66.98.62.234.143.229.0470.3441.7440.9453.8355.8339.5317.5292.4451.7336.7235.2
9.21.42.714.318.07.611.519.543.655.918.8416.3381.2376.0366.1320.3271.5252.4226.3384.8267.6171.6
3.24.02.819.30.217.210.06.638.731.413.3288.9279.9269.2261.9219.5219.1187.0170.0275.2198.5151.1
12.03.11.215.917.69.89.75.940.436.322.8360.6321.9332.2328.1283.1240!7210.2199.9335.7235.7172.9
7.51.20.919.310.69.110.110.439.546.021.4398.9371.2366.8363.7305.0275.9253.0229.7374.9268.7184.0
8.31.43.212.114.97.612.216.138.848.018.1
378.4349.4344.6333.9297.9259.3240.1214.8351.5253.3168.7
0.33.20.41.14.12.40.83.42.22.73.2123.2123.6128.1127.6129.0123.9121.0122.0125.6122.9126.3
1.13.72.05.20.23.72.58.22.85.45.9129.9131.3136.3139.0132.1131.8127.1130.4134.0130.4137.8
d Wholesale price index, weighted according to the composition of industrial exports, excluding diamonds, minerals, andreifned petroleum products.
e Prices to the user and not the producer, since they include taxes. This indicator is therefore biased when the pircechange is due to a change in taxes (and subsidies(.
CHAPTER IV. BALANCE OF PAYMENTS CURRENT ACCOUNT 85

Table IV20
GROWTH OF ISRAEL'S EXPORT MARKETS* AND INDUSTRIAL EXPORTS, 196675
(percentages(
Growth of Israel's export markets
Developedcountries Other Total
Real growthof Israel'sindustrialexports5
Weighted by the composition ofexports in 1972, exd. diamonds
7.719665.3196713.8196810.719697.919706.319718.2197210.31973
19740.41972 weights0.11974 weights8.31975 )1974 weights(
1.21974 ifrst half8.21975 ifrst half1.3second half
Weighted by the composition ofexports in 1974, ind. diamonds
0.319748.81975
1.51974 ifrst. half8.11975 ifrst half1.2second half
7.54.612.2!0.410.39.97.714.8
14.315.617.3
2.717.17.8
15.011.7
4.213.66.6
7.75.213.610.78:36.88.011.6
4.14.90.4
1.70.34.3
4.42.5
2.31.73.1
11.314.031.314.515.825.86.73.6
8.2
0.4
a The measure of market expansion is the rate of quantitative increase in the total imports of the countries of destination, weighted by each country's share in Israel's exports.
b Excludes diamonds, minerals, and old ships and aircraft.
1975, the level flattening at the beginning of the year and moving up at an acceleratingpace in the final part.
1. Developments during the year
The turnabout in industrial exports other than diamonds, minerals, and refinedpetroleum products in the third quarter of 197513 pulled this group out of the slump intowhich it had sunk in the prewar quarter. The question of whether the uptrend will be
sustained in 1976 can be examined tentatively on the strength of partial data for thefirst quarter of the year. These show a slight downturn compared with the final quarter of
13. Theoretically there was reason to believe that the cutting in July 1975 of theCommon Market tariffs on Israeli goods by 60 percent for most industrial products wouldinfluence exports. But in a breakdown of Israel's overseas sales by country of destinationit is hard to detect such an impact.
86 BANK OF ISRAEL ANNUAL REPORT 1975

Table IV21
UNIT WAGE COSTS IN MANUFACTURING IN ISRAEL AND SIX LARGEST INDUSTRIALCOUNTRIES 196675
(index: 1965=100(
Unit exportUnit wagecostIndex ofwage costsUnitwagecostratio betweeneffective rate
ratio betweenIsrael andof IL relativeSix majorIsrael andthe Sixto currenciesRatio ofindustrialthe Sixc)34(of the Six)1( to (2(countries'"Israel*
)6()5()4()3()2()1(
Annual data104.6104.4103.5108.1102.8111.11966101.3100.8115.5116.495.3110.9196788.386.2128.3110.695.6105.7196885.583.3.128.3106.998'9105.7196986.279.8140.4112.1104.5117.1197083.073.1153.0111.9110.5123.7197172.161.9187.3116.0115.0133.4197269.761.0205.5125.4120.5151.1197368.564.5226.1145.8136.1198.5197464.456.2308.5173.8158.3275.21975
Quatrerly data67.864.7207.3134.1126.8170.01974 I70.066.1213.7141.3132.3187.0/I74.169.4226.9157.4139.2219.1III63.058.3256.7149.5146.8219.9IV63.057.0300.5171.2153.0261.91975 I62.455.2307.2169.7158.6269.2II65.565.5301.9171.3163.4279.9III
326.4288.9IV
" In Israeli currency.b In local currencies.< Column 5 adjusted for the change in the price of Israel's exports relative to those of the six industrial countries (seeTable IV22(.
1975; but if account is taken of seasonal influences and a possible further softening ofprices, this can probably be construed as a slight real rise. However, the gain was
dominated by military goods, whose sale is not governed solely by those forces ordinarilyinfluencing industrial exports as a whole, and which are also subject to sharpfluctuations during the year. In other industrial exports the first quarter of 1976 saw a
20 percent nominal contraction, which represented a steep decline in seasonally adjustedreal terms. It is this that casts doubt on the durability of the turnabout in theindustrial export trend.
The business revival in the industrial countries is apparently insufficient stimulus toer>sure the sustained rapid expansion of Israel's exports in the absence of very weightycomplementary factors. The world market boom has given an especially strong finip toconsumer goods exports. Constructionrelated industries have experienced a similar
CHAPTER IV. BALANCE OF PAYMENTS CURRENT ACCOUNT 87

rebounding . while nonmetallic mineral products have displayed an irregular trend. There
has been no significant change in the difficulties bogging down the chemical industry. The
metal, machinery, and electronics industries, which produce mainly for investment and
public consumption, enjoyed vigorous growth throughout 1975. The picture for the first'quarter of 1976 seems less bright, but it is premature to draw any conclusions.
2. Developments by industry and commodity groups
The reverses suffered by the chemical industry (excluding refined petroleum products,which in 1974 accounted for 22 percent of total industrial exports) go a long way toexplain the standstill in the year reviewed. The crisis in world fertilizer consumptionhas already been mentioned. Compounding this was the apparently increased domestic use offertilizer, which of course affected foreign sales. Plastic materials, which together withfertilizers make up the basic chemicals industry, had to contend with a weakening ofprices and demand. Products based on crude oil or its derivatives suffered a noticeable
drop in profitability, both because of the high prices paid for raw materials and becauseof lower production costs in the European countries using natural gas. In pesticides the
Table IV22
INDUSTRIAL EXPORT PRICE INDEX OF ISRAEL AND SIX INDUSTRIALCOUNTRIES, 196675
(prices in dollars; 1965=100(
Ratio ofIndex for sixIndex for Israel,)Dto(2(industrial countriesexcl. diamonds and fuel
)3()2()1(
Annual data99.8102.5102.31966
99.5102.7102.21967
97.6102.199.71968
97.4106.0103.21969
92.6112.8104.4197088.1118.2104.11971
85.8127.5109.41972
87.5150.0131.21973
94.2181.2170.6197487.3206.0179.91975
Quarterly data95.4162.5155.11974 I94.4180.2170.1II93.7186.9175.2III92.5195.0180.4IV90.5208.4188.51975 I88.5210.3186.2II86.5203.3175.9III85.0202.0171.6IV
88 BANK OF ISRAEL ANNUAL REPORT 1975

retreat was milder, with such profitable items as bromine and bromides faring better thisyear and other products losing ground.
Tire sales, which dominate the rubber and plastics industry, were not affected in 1975,
and in fact they even made further headway thanks to the foresight of the producer.Anticipating a falling demand for automobile tires, the factory switched much of itsproduction to alternative lines where demand was not hit .
The poorer export performance of the textile and garment industry was connected bothwith the slackening of demand for consumer goods in general and with the persistent lossof competitiveness of some Israelimade products. This was probably one of the reasons theCommon Market lowered the customs duties on these products in the middle of 1975, inaddition to the pickup in demand for consumer goods during this period. The drop was
steepest in textiles, where Israeli mills have to vie with very large and efficient firms.In garment manufacture, where exclusive fashion goods are of mounting importance, Israelseems to be in a stronger position. In this connection it should be mentioned that inrecent years the incentives granted through the various branch funds have been cut sharplywithout a compensatory increase in direct incentives.
Processed foodstuffs also fared less well in 1975,for the second consecutive year.Most affected were citrus products, which is explained by Brazil's aggressive competitionin Europe and by the successful season enjoyed by fresh citrus. At the beginning of theyear Brazil seemed to be undercutting its rivals in Europe, but later on prices firmed and
Israel was able to hold its own. The banner season in fresh citrus led to the diversion of
fruit to direct export, which was more profitable to the grower, and limited supplies to
Table IV23
EXPORT AND GNP PRICE INDEXES OF ISRAEL AND SIX INDUSTRIALCOUNTRIES, 197275
(in local currencies; 1972=100(
Index ofIndex ofimportRatio ofIndex ofimplicitprices)1; to (2(export pricesGNP deflator
)4()3()2()1(
countiresSix industiral113.4103.0110.3107.11973161.6116.4139.4119.81974174.8115.2152.5132.81975
Isarel120.7101.9123.0120.71973172.8102.6167.4163.21974250.1105.6236.8224.21975
CHAPTER IV, BALANCE OF PAYMENTS CURRENT ACCOUNT 89

Table IV24
EXPORT PRICE INDEX, 196975
Total exports* Total industrial Agricultuarl exportsexports, excl.
122.91973145.51974
Quarterly data134.01974 I134.0II149.8III150.9IV156.11975 I155.0II146.6III148.7IV
1968=100103.5103.7105.1103.5105.7105.6110.9109.9133.8131.6
1972=100"120.6119.6159.5150.7
1972=100144.6136.2144.6136.2144.6161.9169.3164.4177.7166.3174.9171.8165.0155.7159.8155.5
Incl. diamonds Excl. diamonds diamonds Total Citrus
Afinual averages1969 104.7 103.7 103.5 104.5 105.91970 104.4 103.5 105.1 99.4 99.91971 108.4 105.6 105.7 105.1 107.61972 116.2 109.9 110.9 107.2 107.71973 145.1 131.6 133.8 124.8 121.4
111.2 105.6121.0 113.1
113.3 104.4113.3 104.4142.8 166.5139.1 122.3131.2 122.6156.6 167.5123.2 166.6139.2 141.3
" In 1973 the Central Bureau of Statistics chained the base of the price indexes to 1972=100. Calculation of the indexesfor 1973 on the basis of 1968=100 will of course yield different results from a calculation based on 1972=100.
Source: Central Bureau. of Statistics.
the canneries. The data for the beginning of 1976 reveal a similar picture.In all other items demand sagged during most of 1975 but turned up toward the end. In
poultrymeat products, however, exports have been on the rise for several years, and thetrend gained impetus in 1975. Here too exports have to compete with sales to domesticindustry.
Exports of the wood industry, which is dominated by plywood and other constructionproducts, continued to lose ground in 1975 because of the softening of Israel's principalmarket, the U.K. Paper manufacture had to contend. with sinking prices after an acute
shortage in 1974, and exports fell off.While on the whole Israel' s exports lost vigor in 1975, the metal, machinery, transport
equipment, and electrical and electronic equipment industries continued to make impressiveheadway: 28 percent in real terms as opposed to 38 percent in 1974. In this group militarygoods play a very important role, and they have made very formidable progress in recentyears. In 1973 overseas sales of these industries contracted, mainly because of the war;in 1974 however, they posted a real 25 percent gain, and in 1975 they shot up by an
additional 60 percent. Military exports are characterized by several distinctive features.
90 BANK OF ISRAEL ANNUAL REPORT 1975
First of all, Israel is one of the few countries than can offer weapons systems that have
undergone the test of actual combatan advantage which even seasoned and advanced
manufacturers turning out a wider array of weapons do not possess. Secondly, most of theproducts in this group are of a highly sophisticated nature; hence quality, and especiallythe type of service they supply, outweigh the price factor.
These industries managed to boost their exports appreciably even though during thisperiod (and even more in previous years) they also greatly stepped up domestic sales. The
fact that they have been undergoing very rapid expansion for the past several years proves
that when there is an adequate profitability the concern or industry can expand capacityand overcome productive factor constraints much more easily than is usually thoughtpossible. Behind this growth process, of course, lies the fact that at least in theinitial stages these industries enjoyed a buoyant domestic demand. This assured them of a
good price and a large volume of orders for a relatively long period ahead, thus enabling
them to mobilize the sizable investment capital required.Turning to the nondefense production of these industries we find that pipe exports
moved ahead more slowly than in 1974, when there was an ebullient world demand for this
item because of the numerous oil drillings; however, the 1975 growth rate (30 percent) was
still impressive, and in the last three years sales doubled. The share of other basicmetal products in total exports of the metal, machinery, and transport equipment
industries has been on the decline. It seems that with the expansion of these industriesmetal products have either been exported more in an indirect than a direct manner, or have
been diverted to domestic uses.
The smaller overseas marketing of transport equipment should be viewed in conjunctionwith the special character of the production process here, namely the relatively long timerequired to turn out the product and its indivisibility. This results in sharposcillations in overseas sales, even from year to year. For example, in 1974 Israel soldan $8.5 million floating drydock abroad, whereas in 1975 there was no export whatsoever by
the shipbuilding industry, even though production for foreign customers went on and
exports will be resumed in 1976 and thereafter.
4. EXPORTS AND IMPORTS OF SERVICES
The surplus on invisibles,14 excluding defense imports and transactions with theadministered areas, shrank from $143 million in 1974 to S78 million; exports inched ahead
14. With commodity imports valued c.i.f .
CHAPTER IV, BALANCE OF PAYMENTS CURRENT ACCOUNT 91

Table IV25
IMPORTS AND EXPORTS OF SERVICES, 197175
($ million(
19751974197319721971
A. Excl. administered areasand defenseTransportation, f.o.b."
548584371325265Credit551491348271258Debit39323547Net
Tourism234194230212178Credit1571421067060Debit7752124142118Net
Freight insurance, f.o.b."2_2441Net
Other insurance2820341912Net
Capital services321354240127120Credit709585384247207Debit38823114412087Net
Other services186173145137117Credit17415612312198Debit1217221619Net
Government. n.e.s.4226192734Credit102102955560Debit7876762826Net
Net total, excl. net410167894118defense imports
1,8461,2241,253490555B. Defense imports, net2,2561,3911,342449537Net total, incl. defense
C. Net transactions with151135966125administered areas
Total balance on2,4071,5261,438510562services, f.o.b.
D. Adjustment from f.o.b. toc.i.f. recording of commod
332310200135128ity importsTotal balance on
2,0751,2161,238375434 services, c.i.f.
" The adjustment from an f.o.b. to a c.i.f. recording of commodity imports is presented in Tables IV26 and IV27.Source: Central Bureau of Statistics.
only 2 percent in 1975, as against 36 percent the year before, while imports grew by a
more rapid 16 percent, as opposed to 37 percent in 1974. If commodity imports are valuedf.o.b., there was an adverse balance in services for the past three years: $89 million in
1973, $167 million in 1974, and $410 million in 1975. Two items were most responsibile forthe steep jump this year: capital services, where the deficit shot up from $231 million in1974 to $388 million, and transportation, which had wound up the previous year with a
surplus.
92 BANK OF ISRAEL ANNUAL REPORT 1975

Table IV2*
OF SERVICES, 197175EXPORTS
)$ million(
increaseAnnual
Percent$ million
19751974197319721975. 19741973197219751974197319721971
6.257.714.222.436.0213.746.259.4548.4584.4370.7324.5265.1Transportation, f.o.b.2.534.11.726.13.030.01.517.9115.0118.088.086.568.6Passenger4.668.522.835.916.0141.06.52.8331.0347.0206.0167.8123.5Freight14.255.79.33.817.042.76.52.8102.4119.476.770.273.0Other income20.415.78.419.039.636.07.833.9233.6194.0230.0212.2178.3Travel17.041.616.98.240.069.024.010.7275.0235.0166.0142.0131.3Insurance, f.o.b.9.347.589.06.033.0114.0113.07.2321.0354.0240.0127.0119.8Capital services7.736.829.619.92.07.08.06.724.026.019.027.033.7Government, n.es7.518.96.017.113.027.48.220.0185.6172.6145.2137.0117.0Other services\A33.720.814.721.6395.1201.2124.51,587.61,566.01,170.9969.7845.2Total
11950.716.125.417.625.97.18.959.477.051.144.035.1Exports to administered areas0.234.520.615.24.0421.0208.3133.41,647.01,643.01,222.01,013.7880.3Grand total, f.o.b.
Adjustment to a c.i.f. recordingof commodity impotrsImport cargoes by Israeli
10.659.846.214.017.862.733.1 8.8185.3167.5104.871.762.9carriers6.919.71.03.41.02.46.10.215.614.612.26.15.9Insurance thereon
Total service exports, c.i.f.2.335.723.014.640.4460.2240.4133.51,788.51,748.11,287.91,047.5914.0Excl. administered areas1.336.322.715.022.8486.1247.5142.41,847.91,825.11,339.01,091.5949.1Incl. administered areas
Source: Central Bureau of Statistics.
The turn for the worse in capital services was due primarily to the contraction ofincome ($33 million), for the first time since 1971; in outlays the uptrend slowed from 56
and 52 percent in 1973 and 1974 respectively to 21 percent. Most of the increase was inpublic sector interest payments, which should be seen against the swelling of thecountry's external indebtedness from $6.25 billion in 1974 to $7.6 billion.
In transportation (with commodity imports recorded f.o.b.)15 income fell off $3G
million, after having soared $214 million in 1974. On the expenditure side the level moved
up much more sluggishly in1975$60 million as against $143 million the year before. AH
subitems contributed to the drop in income. Cargo transport receipts were off 5 percent inboth value and quantity (prices, which are in dollars, held steady) . The downturn here was
15. In an f.o.b. valuation of comir.odity imports insurance on import freight carried . byforeign companies is included on the expenditure side (import), while that on importcargoes hauled by Israeli companies is not included on the income side. A discussion oftotal Israeli shipping and air revenues appears in Chapter XV.
CHAPTER IV, BALANCE OF PAYMENTS CURRENT ACCOUNT 93
caused by the smaller throughput of the EilatAshkelon petroleum pipeline, mainly in thetransshipment of fuel, which fell off because of the subsiding of foreign demand forpetroleum products; income from export cargo volume, on the other hand, rose. Passengerfares yielded 3 percent less this year in nominal and 8 percent in real terms. The number
of tourist arrivals held steady in 1975; the drop in earnings was due predominantly to thedeclining share of Americans and rising share of Europeans in the year reviewed, and tosome extent to the larger percentage arriving overland at the expense of those coming by
air. The third source of revenue is the expenditure of foreign shipping and air companiesin Israel and income from the chartering of ships and aircraft, which are included under"other income". In 1975 revenue from charter hire was down 9 percent in money terms but up
8 percent in real terms. Sales of bunkers to foreign ships and aircraft dipped from $26
million in 1974 to $14 mi 11 ion ; excluding this item, the outlays of foreign crews inIsrael held steady in value, but fell off 9 percent in quantity.
On the expenditure side, passenger conveyance was down 7 percent in value (12 percentin quantity), compared with increases of 23 and 2 percent respectively in 1974. Thissubitem includes payments to foreign shipping and air carriers by Israelis going abroad .
Since the number of such travelers was unchanged in 1975, if follows that the proportionof those using Israeli carriers rose at the expense of foreign carriers. Other transportoutlays (commodity imports recorded f .o .b . ) were up 14 percent in value this year,
compared with 43 percent in 1974. Purchases of bunkers by Israeli companies totaled $74
million, as against $65 million in 1974. Other overseas expenditure by Israeli crews rose25 percent in value (11 percent in quantity), while the amount spent on charter hire went
up 49 percent, from $82 million to $122 million.Tourism yielded 20 percent more this year, after a 16 percent decline in 1974. The
figures for the past two years may be understated, for part of the time the big gap
between the official and unofficial price of the dollar prompted many to convert foreigncurrency on the black market. The expenditure side of this item, which includes the
foreign currency travel allowance to, Israelis going abroad, increased 10 percent in value,
after soaring 51 and 34 percent in 1973 and 1974 respectively. The slacker rise in such
allowances this year is explained by the tapering off of the number of Israeli travelersbecause of the economic slowdown and the high level reached in the two preceding years.
The insurance item (f .o.b . ) is large on both the credit and debit sides, but the netbalance is small, for there is a close connection between payments and receipts: premium
payments are offset by claims payments by foreign insurers to Israelis and commission paidto local agents of foreign companies.
94 BANK OF ISRAEL ANNUAL REPORT 1975

Table IV27
IMPORTS OF SERVICES, 197175
($ million(
increaseAnnual
Percentlion$ mil
19751974197319721975197419731972197519741973.19721971
12.329.128.65.060.2142.877.412.9551.0490.8348.0270.6257.7Transportation, f.Q.b.6.623.114.512.42.16.03.32.529.932.026.022.720.2Passenger13.642.539.44.462.3136.874.110.4521.1458.2322.0247.9237.5Other10.134.351.016.814.436.435.810.1156.8142.4106.070.260.1Travel18.726.223.514.048.053.338.720.3305.0257.0203.7165.0144.7Insurance, f.o.b.21.252.355.619.3124.0201.0137.239.9709.0585.0384.0246.8206.9Government, n.e.s.
7.472.78.87.0'40.05.3102.0102.095.055.060.3Capital services11 227.11.723.417.533.32.122.9173.5156.0122.7120.697.7Other services15.237.635.712.2264.1473.8331.2100.81,997.31,733.21,176.0928.2827.4Total (excl. defense), f.o.b.50.82.3155.71 1.7622.029.0763.064.61,846.01 ,224.01,253.0490.0554.6Defense imports
Imports from administered1.044.539.672.82.165.241.644.6209.7211.8146.6105.060.4areas
27.923.475.76.0884.0593.41,109.583.24,053.03,169.02,575.61,466.11,382.9Total service imports, f.o.b.Adjustment from f.o.b. to c.i.f.recording of commodityimportsTransport of import cargoes
1.858.851.06.12.143.725.13.2120.1118.074.349.252.4by foreign carriersInsurance of import cargoes
transported by foreign7.17.715.211.30.70.71.20.810.59.89.17.97.1carriers.
Total imports of servicesExcl. defense and ad
16.336.5351013.4261.3429.4304.9103.21,866.71,605.41,176.0871.1767.9ministered areasIncl. defense and ad
29.018.175.76.0881.2465.51,109.583.23,92243,041.22,575.61,466.11382.9ministered areas
Source: Central Bureau of Statistics.
In the hetereogeneous "other services" item there was a nominal rise of 8 percent on
the credit side and 11 percent on the debit side. As regards income there was a largeroutlay by foreign exporters to their Israeli agents and in transfers by returning Israeliresidents. The debit side1 showed an increase in commissions paid by Israeli exporters totheir overseas agents.
In transactions with the administered areas exports tumbled 23 percent in value, aftera 51 percent gain in 1974, wh i 1e the value of imports edged down 1 percent, after soaring
45 percent the year before. The overwhelming share of imports$178 million in 1975, orsome 85 percent of the totalconsisted of wage payments to workers from the areas, which
were virtually unchanged this year. On the export side wage payments to Israeli workers inthe areas fell from $56 million in 1974 to $43 million.
CHAPTER IV, BALANCE OF PAYMENTS CURRENT ACCOUNT 95