Embed Size (px)
Citation preview
Balance Benchmarking 2011
24th November 2011

Introduction
Introduction
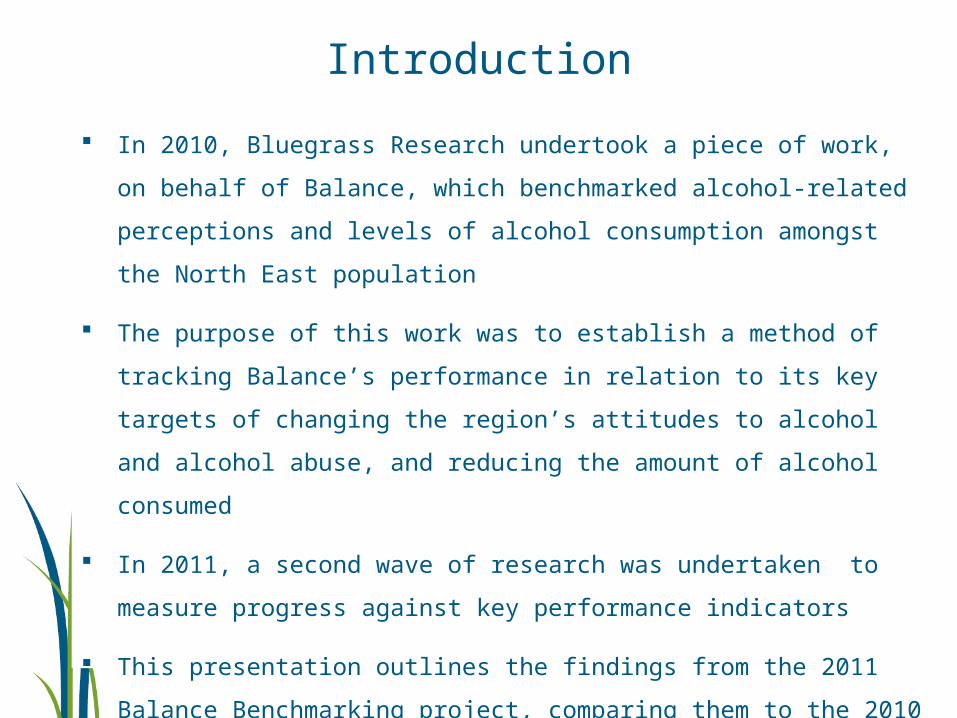
In 2010, Bluegrass Research undertook a piece of work, on behalf
of Balance, which benchmarked alcohol-related perceptions and
levels of alcohol consumption amongst the North East population
The purpose of this work was to establish a method of tracking
Balance’s performance in relation to its key targets of changing the
region’s attitudes to alcohol and alcohol abuse, and reducing the
amount of alcohol consumed
In 2011, a second wave of research was undertaken to measure
progress against key performance indicators
This presentation outlines the findings from the 2011 Balance
Benchmarking project, comparing them to the 2010 benchmark
Methodology
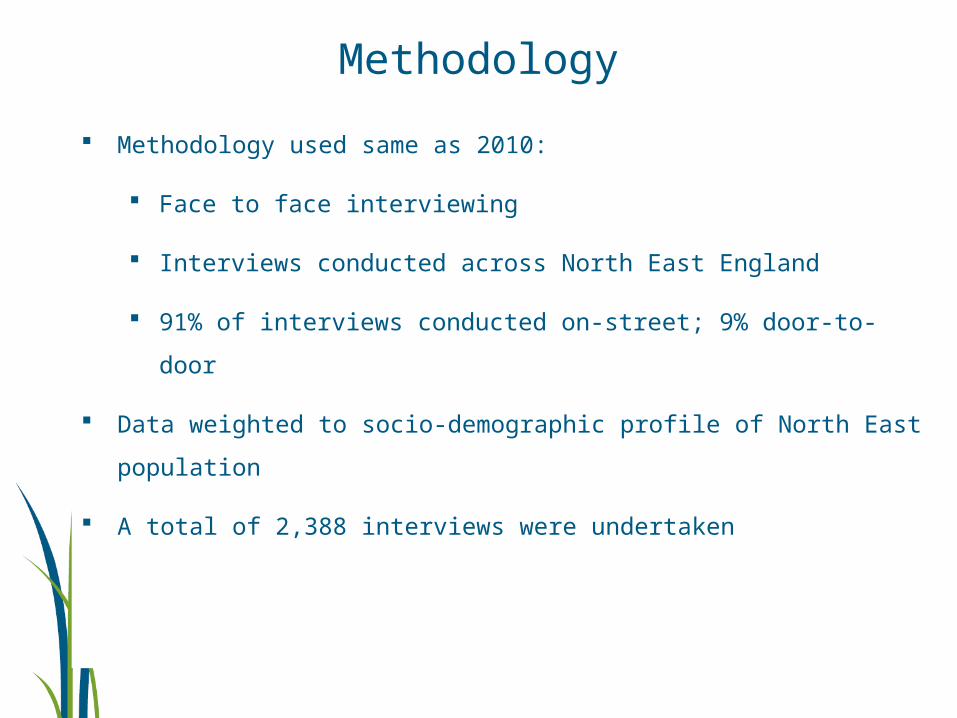
Methodology used same as 2010:
Face to face interviewing
Interviews conducted across North East England
91% of interviews conducted on-street; 9% door-to-door
Data weighted to socio-demographic profile of North East
population
A total of 2,388 interviews were undertaken
Alcohol Consumption
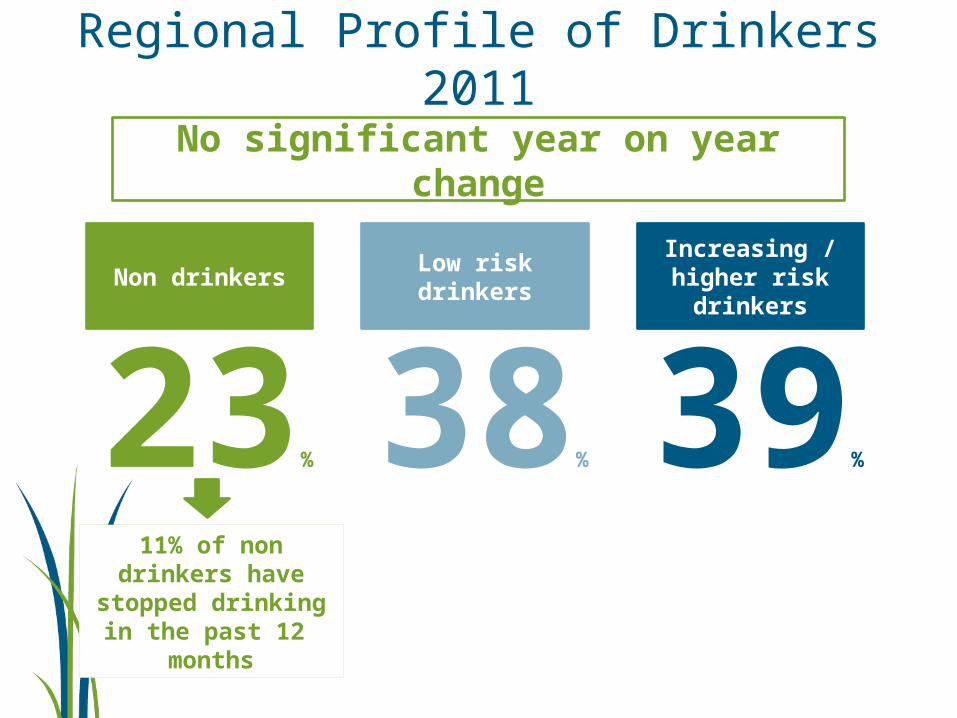
Regional Profile of Drinkers 2011
Non drinkers
23%
Low risk drinkers
38%
Increasing / higher risk
drinkers
39%
11% of non drinkers have
stopped drinking in the past 12
months
No significant year on year change
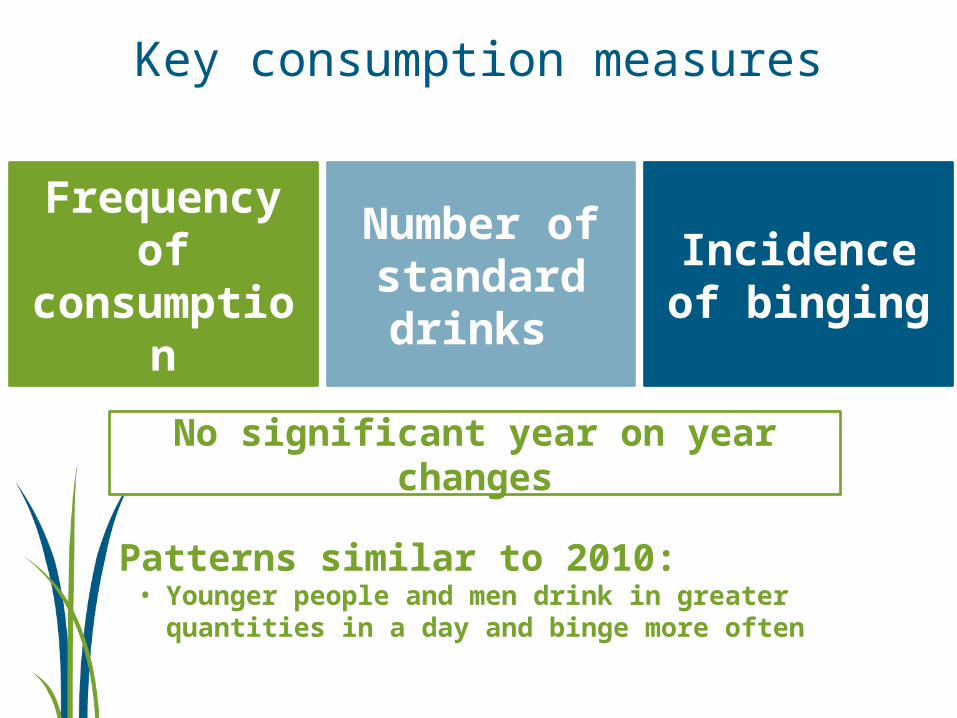
Key consumption measures
Frequency of
consumption
Number of standard drinks
Incidence of binging
No significant year on year changes
Patterns similar to 2010:• Younger people and men drink in greater quantities
in a day and binge more often
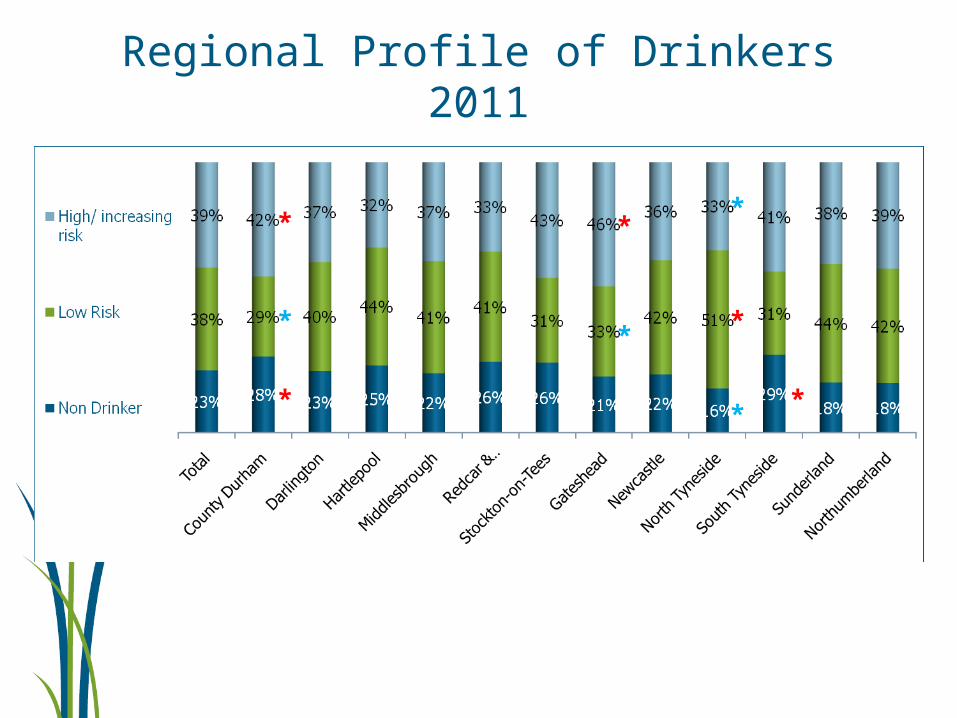
Regional Profile of Drinkers 2011
*
*
*
*
**
*
*
*
Drinking Behaviour
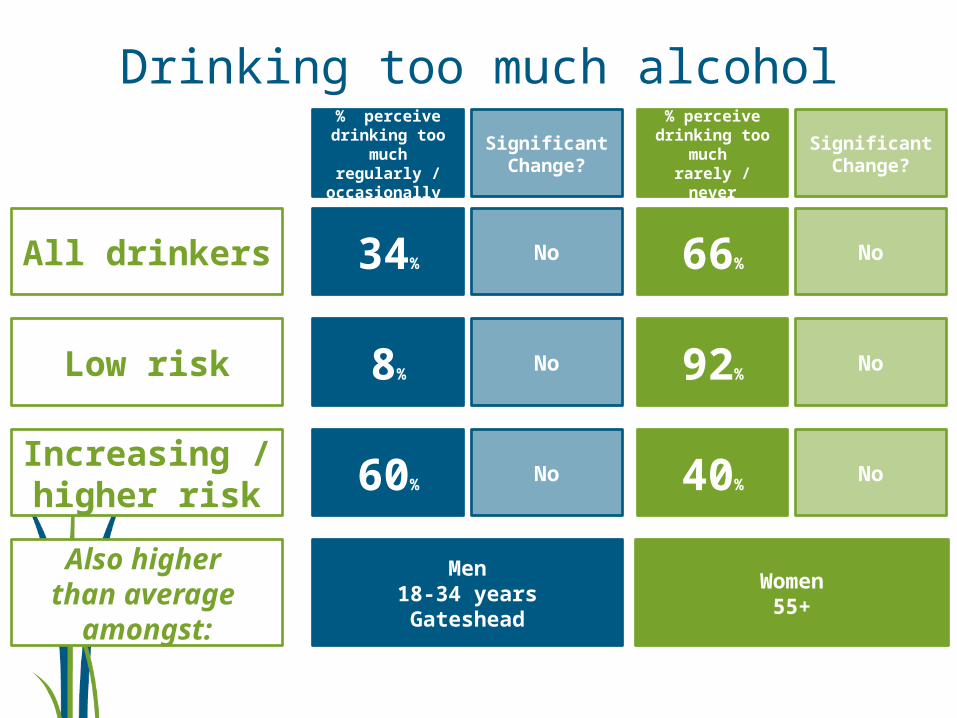
Drinking too much alcohol% perceive
drinking too much rarely /
never
Significant Change?
% perceive drinking too
much regularly /
occasionally
Significant Change?
34% No 66% No
8% No 92% No
60% No 40% No
Men18-34 yearsGateshead
Women55+
All drinkers
Low risk
Increasing / higher risk
Also higher than average
amongst:
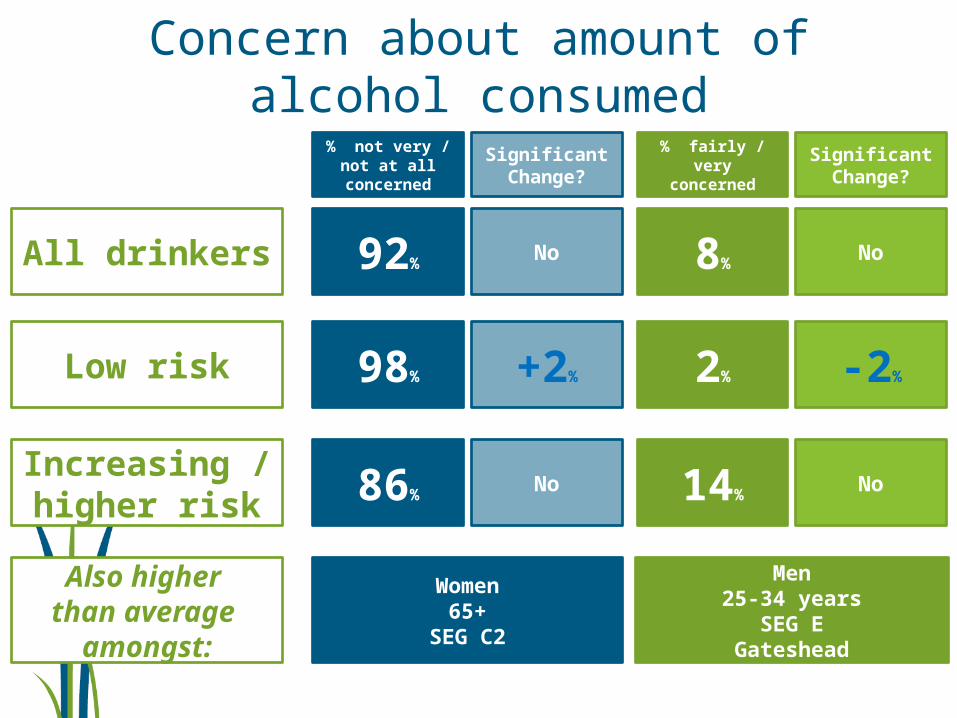
Concern about amount of alcohol consumed
All drinkers
% fairly / very concerned
Significant Change?
% not very / not at all
concerned
Significant Change?
Low risk
Increasing / higher risk
92% No 8% No
98% +2% 2% -2%
86% No 14% No
Also higher than average
amongst:
Women65+
SEG C2
Men25-34 years
SEG EGateshead
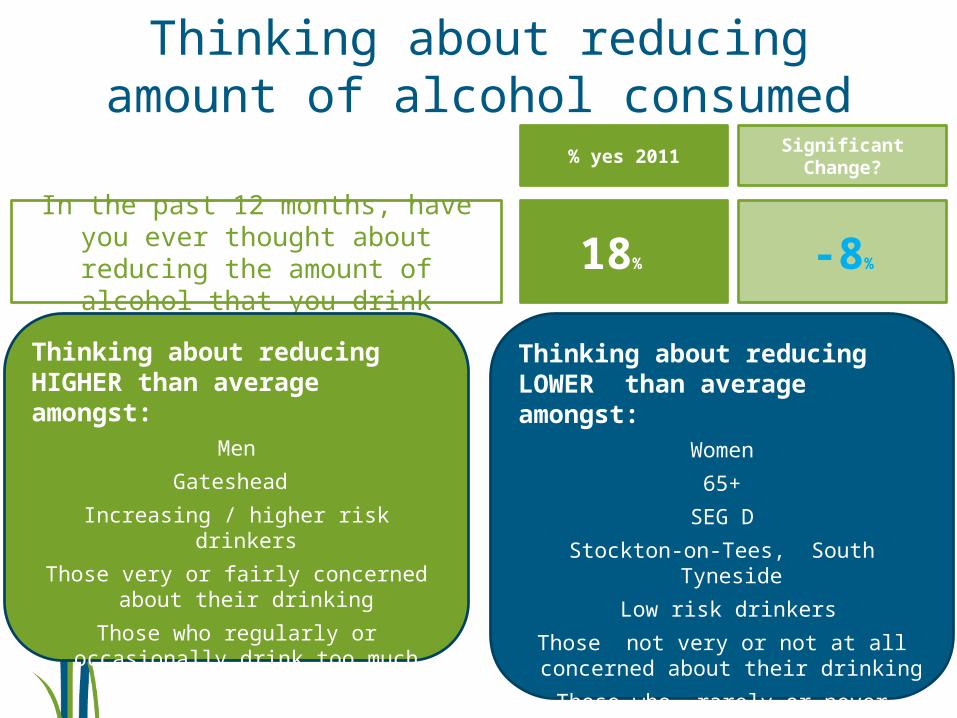
Thinking about reducing amount of alcohol consumed
In the past 12 months, have you ever thought about reducing the amount of alcohol that you drink
% yes 2011Significant Change?
18% -8%
Thinking about reducing HIGHER than average amongst:
Men
Gateshead
Increasing / higher risk drinkers
Those very or fairly concerned about their drinking
Those who regularly or occasionally drink too much
Thinking about reducing LOWER than average amongst:
Women
65+
SEG D
Stockton-on-Tees, South Tyneside
Low risk drinkers
Those not very or not at all concerned about their drinking
Those who rarely or never drink too much
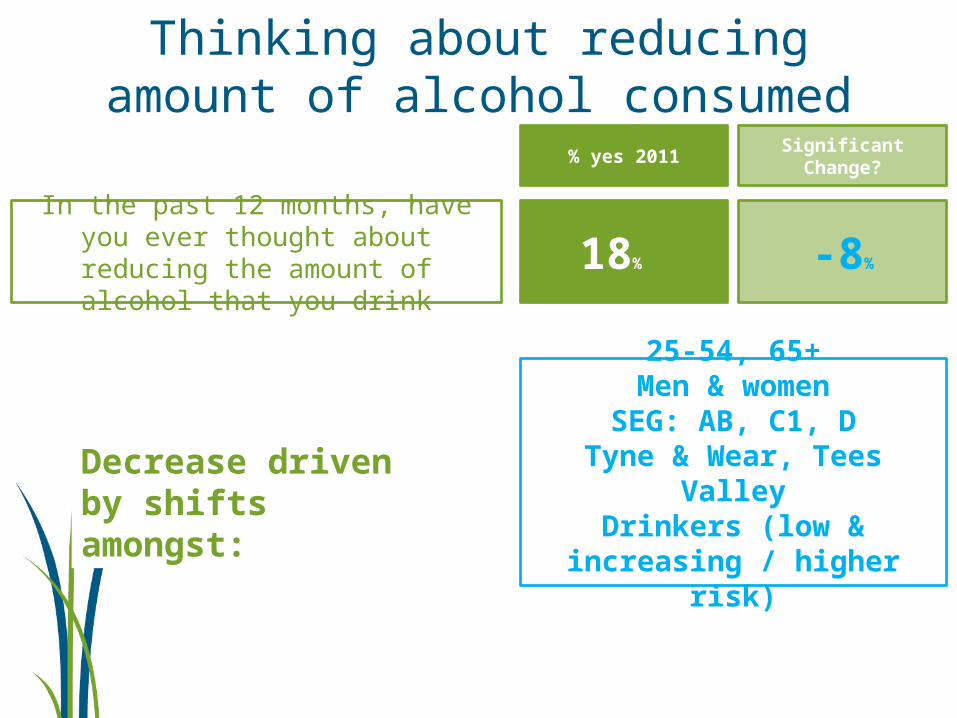
Thinking about reducing amount of alcohol consumed
In the past 12 months, have you ever thought about reducing the amount of alcohol that you drink
% yes 2011Significant Change?
18% -8%
Decrease driven by shifts amongst:
25-54, 65+Men & womenSEG: AB, C1, D
Tyne & Wear, Tees ValleyDrinkers (low &
increasing / higher risk)
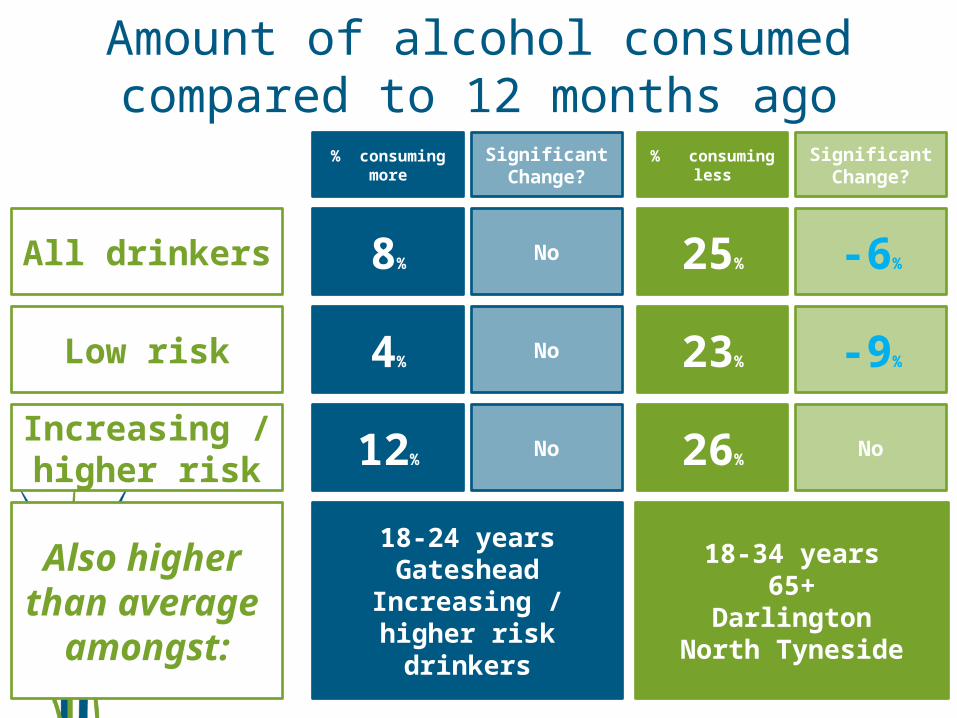
Amount of alcohol consumed compared to 12 months ago
All drinkers
% consuming less
Significant Change?
% consuming more
Significant Change?
Low risk
Increasing / higher risk
8% No 25% -6%
4% No 23% -9%
12% No 26% No
Also higher than
average amongst:
18-24 yearsGateshead
Increasing / higher risk drinkers
18-34 years65+
DarlingtonNorth Tyneside
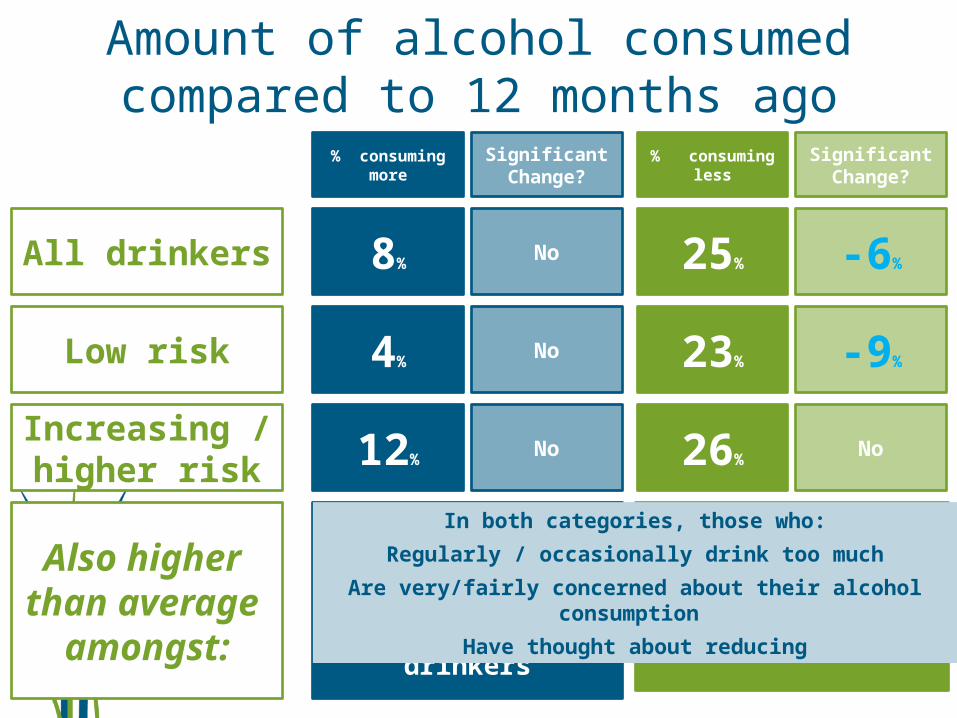
Amount of alcohol consumed compared to 12 months ago
All drinkers
% consuming less
Significant Change?
% consuming more
Significant Change?
Low risk
Increasing / higher risk
8% No 25% -6%
4% No 23% -9%
12% No 26% No
Also higher than
average amongst:
18-24 yearsGateshead
Increasing / higher risk drinkers
65+Darlington
North Tyneside
In both categories, those who:
Regularly / occasionally drink too much
Are very/fairly concerned about their alcohol consumption
Have thought about reducing
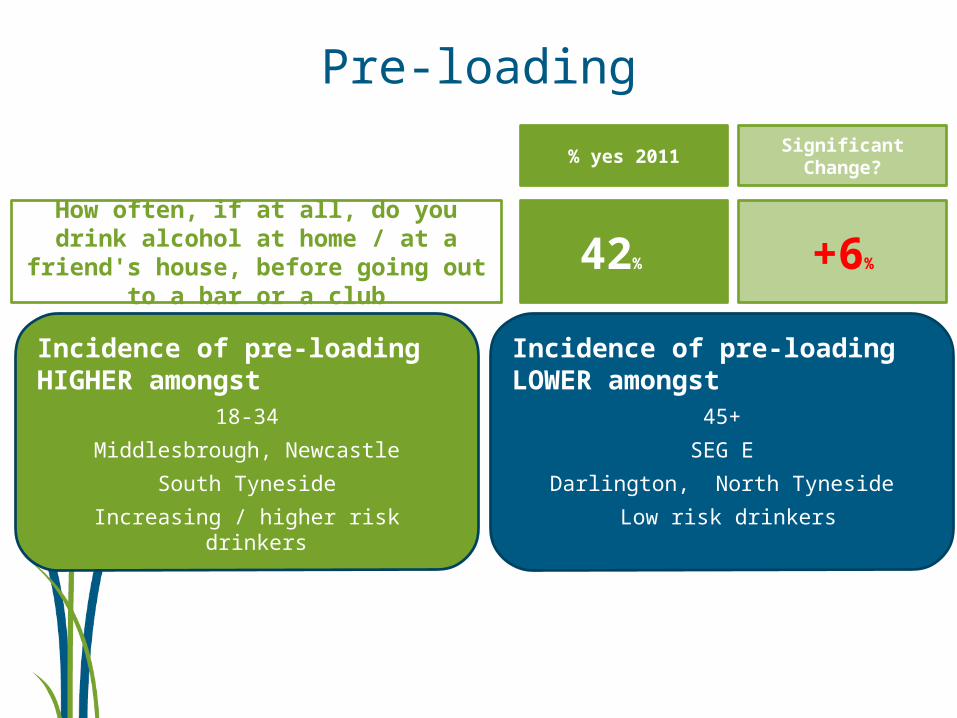
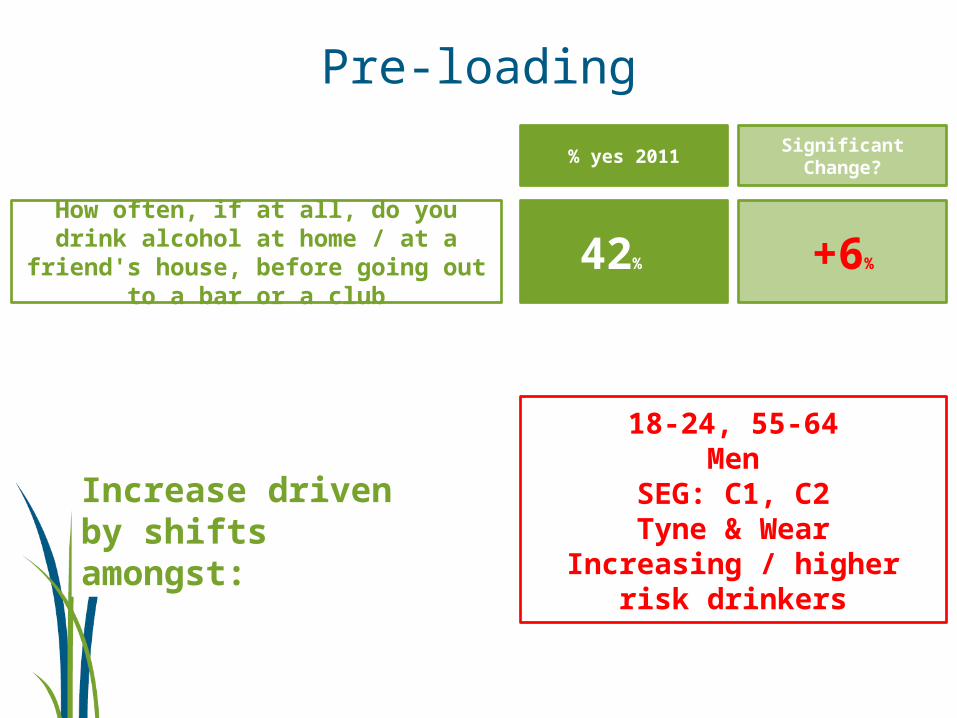
Pre-loading
How often, if at all, do you drink alcohol at home / at a friend's
house, before going out to a bar or a club
% yes 2011Significant Change?
42% +6%
Incidence of pre-loading HIGHER amongst
18-34
Middlesbrough, Newcastle
South Tyneside
Increasing / higher risk drinkers
Incidence of pre-loading LOWER amongst
45+
SEG E
Darlington, North Tyneside
Low risk drinkers
Pre-loading
How often, if at all, do you drink alcohol at home / at a friend's
house, before going out to a bar or a club
% yes 2011Significant Change?
42% +6%
Increase driven by shifts amongst:
18-24, 55-64Men
SEG: C1, C2Tyne & Wear
Increasing / higher risk drinkers
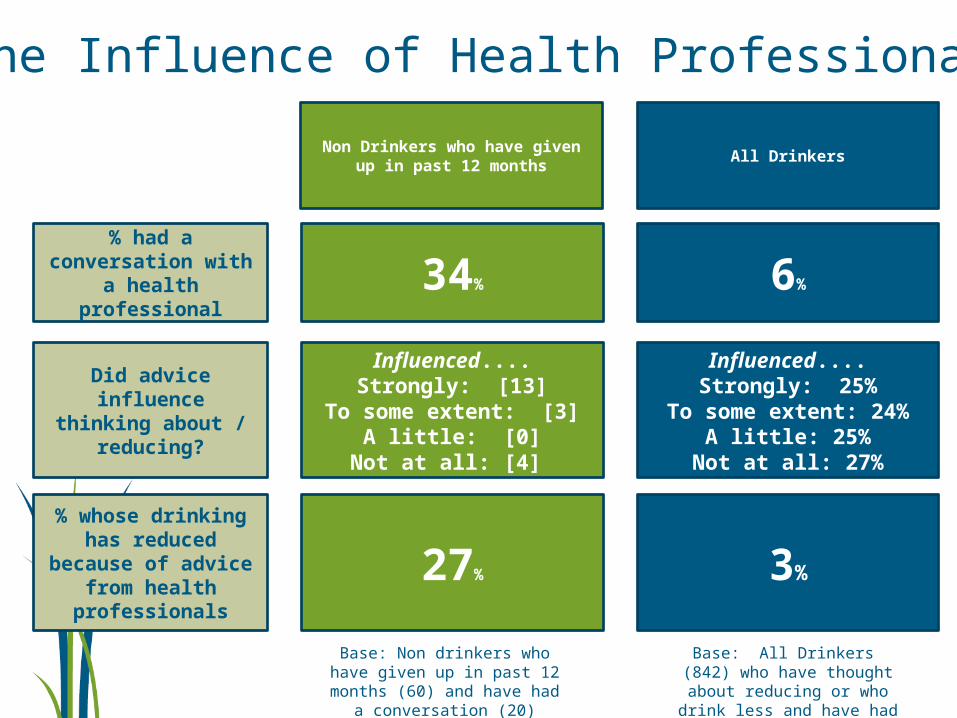
Non Drinkers who have given up in past 12 months
% had a conversation with
a health professional
The Influence of Health Professionals
All Drinkers
34% 6%
Did advice influence thinking about / reducing?
Influenced....Strongly: [13]
To some extent: [3]A little: [0]
Not at all: [4]
Influenced....Strongly: 25%
To some extent: 24%A little: 25%
Not at all: 27%
Base: Non drinkers who have given up in past 12 months
(60) and have had a conversation (20) Caution,
small base
Base: All Drinkers (842) who have thought about
reducing or who drink less and have had a
conversation (81)
% whose drinking has reduced
because of advice from health
professionals
27% 3%
Profiling the NE Drinker Segment
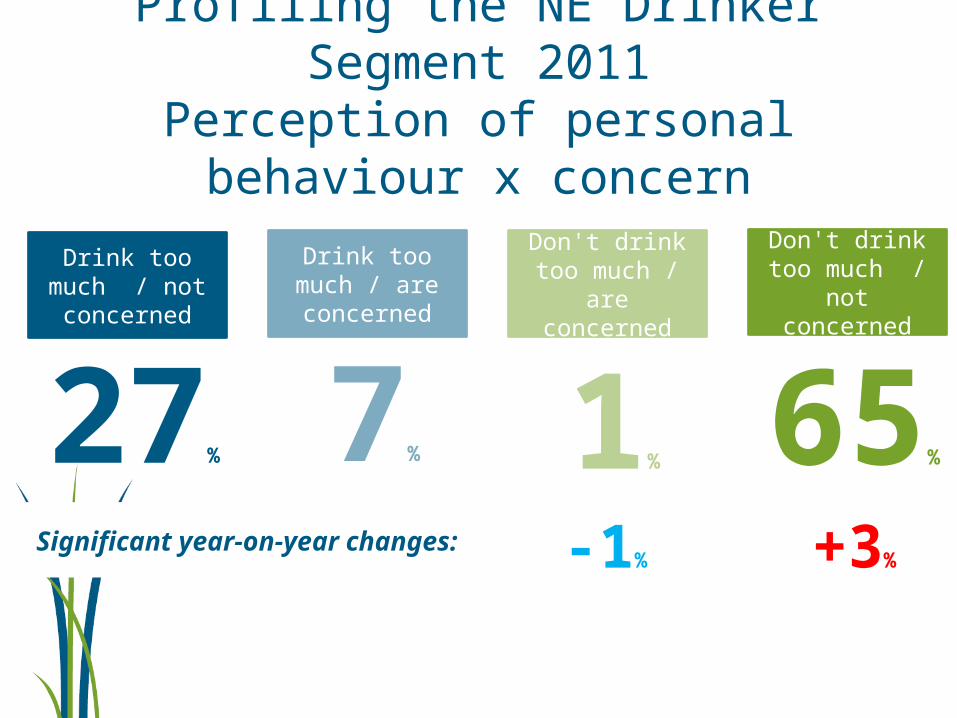
Profiling the NE Drinker Segment 2011
Perception of personal behaviour x concern
Don't drink too much / are
concerned
1%
Drink too much / are concerned
7%
Drink too much / not concerned
27%
Don't drink too much /
not concerned
65%
+3%-1%
Significant year-on-year changes:
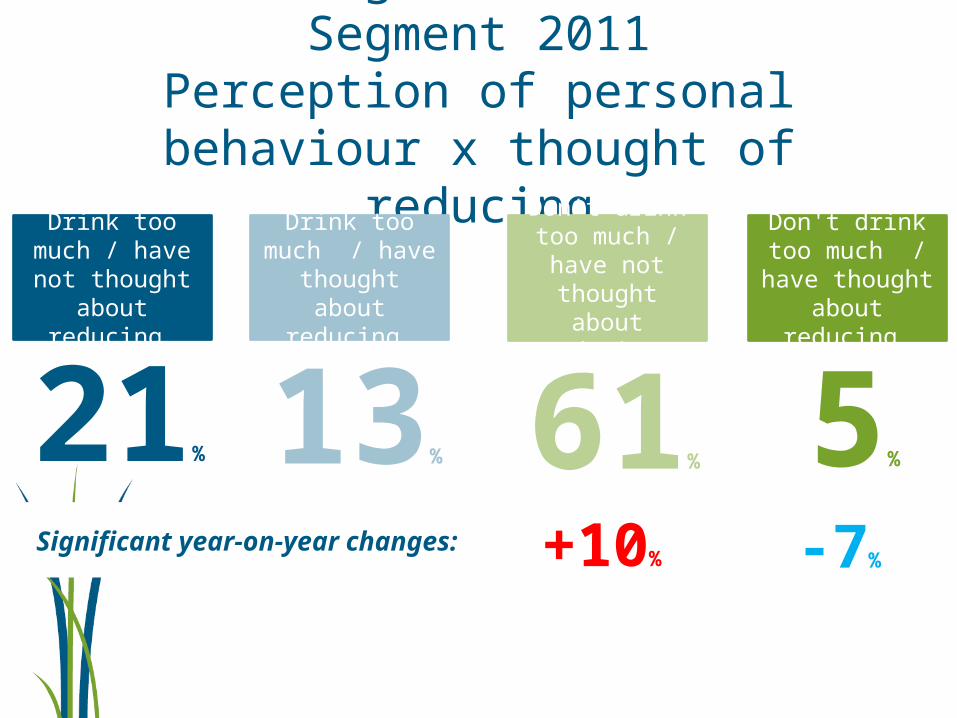
Profiling the NE Drinker Segment 2011
Perception of personal behaviour x thought of reducing
Don't drink too much / have not
thought about reducing
61%
Drink too much / have not thought
about reducing
21%
Drink too much / have thought about
reducing
13%
Don't drink too much /
have thought about
reducing
5%
+10% -7%
Significant year-on-year changes:
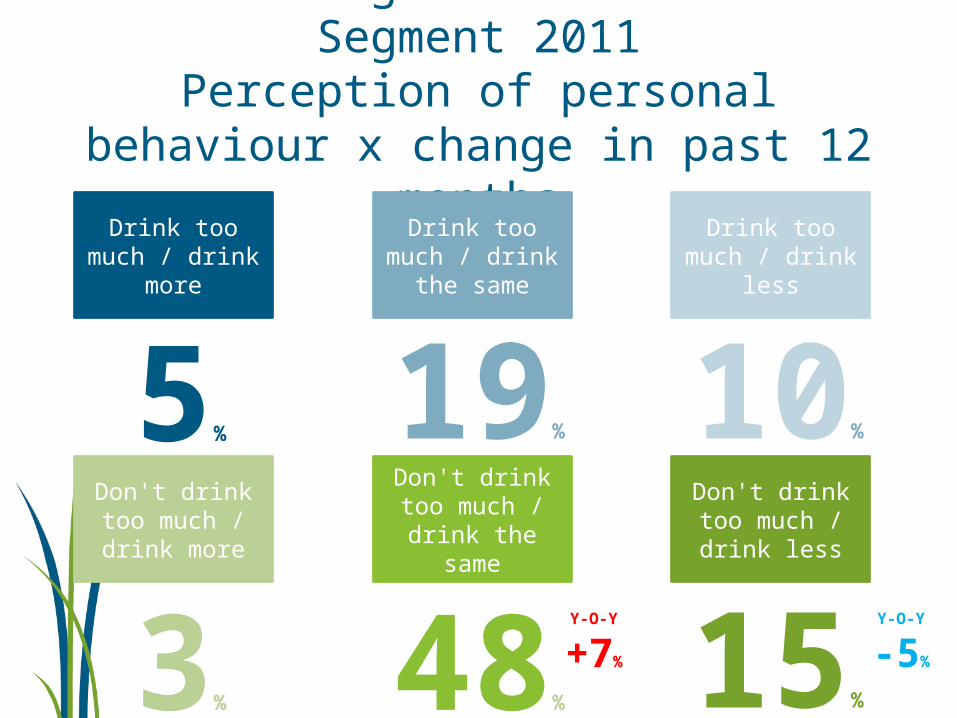
Profiling the NE Drinker Segment 2011
Perception of personal behaviour x change in past 12 months
Don't drink too much / drink the
same
48%
Drink too much / drink
the same
19%
Drink too much / drink
more
5%
Don't drink too much / drink less
15%
Drink too much / drink
less
10%
Don't drink too much / drink more
3%
Y-O-Y
-5%
Y-O-Y
+7%
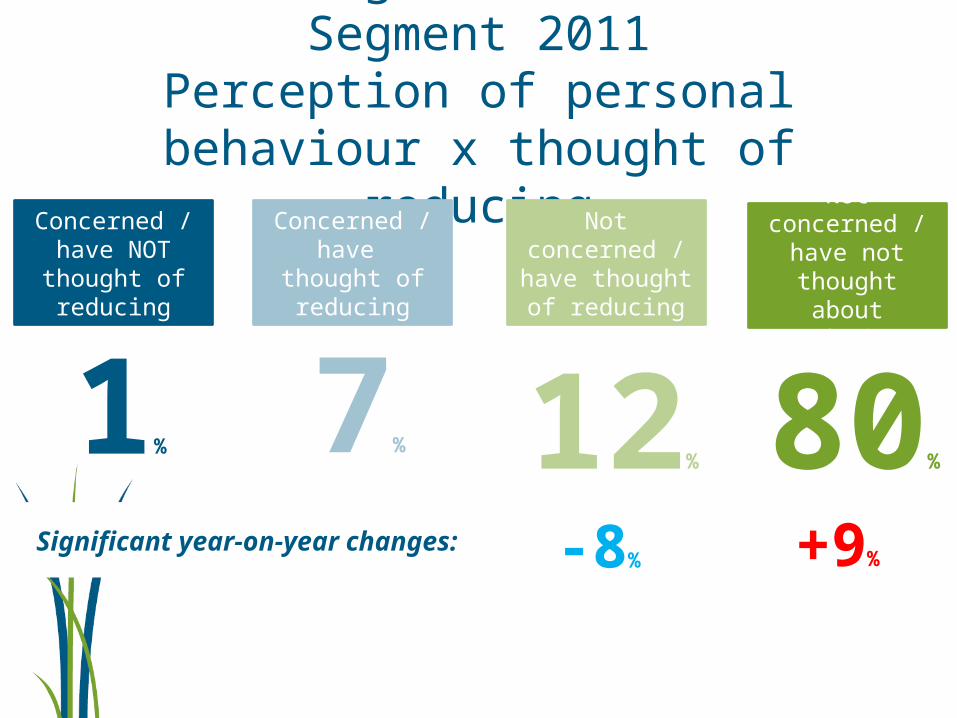
Profiling the NE Drinker Segment 2011
Perception of personal behaviour x thought of reducing
Concerned / have NOT thought of reducing
1%
Concerned / have
thought of reducing
7%
Not concerned / have not
thought about reducing
80%
+9%-8%
Significant year-on-year changes:
Not concerned / have thought
of reducing
12%
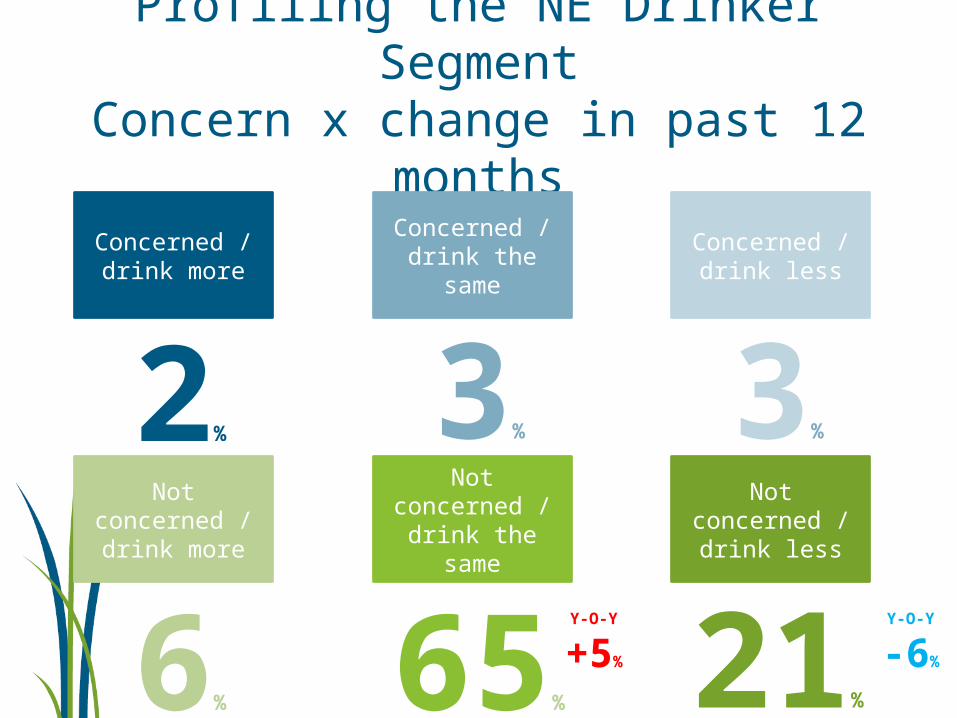
Profiling the NE Drinker SegmentConcern x change in past 12
months
Not concerned / drink the
same
65%
Concerned / drink the
same
3%
Concerned / drink more
2%
Not concerned / drink less
21%
Concerned / drink less
3%
Not concerned / drink more
6%
Y-O-Y
-6%
Y-O-Y
+5%
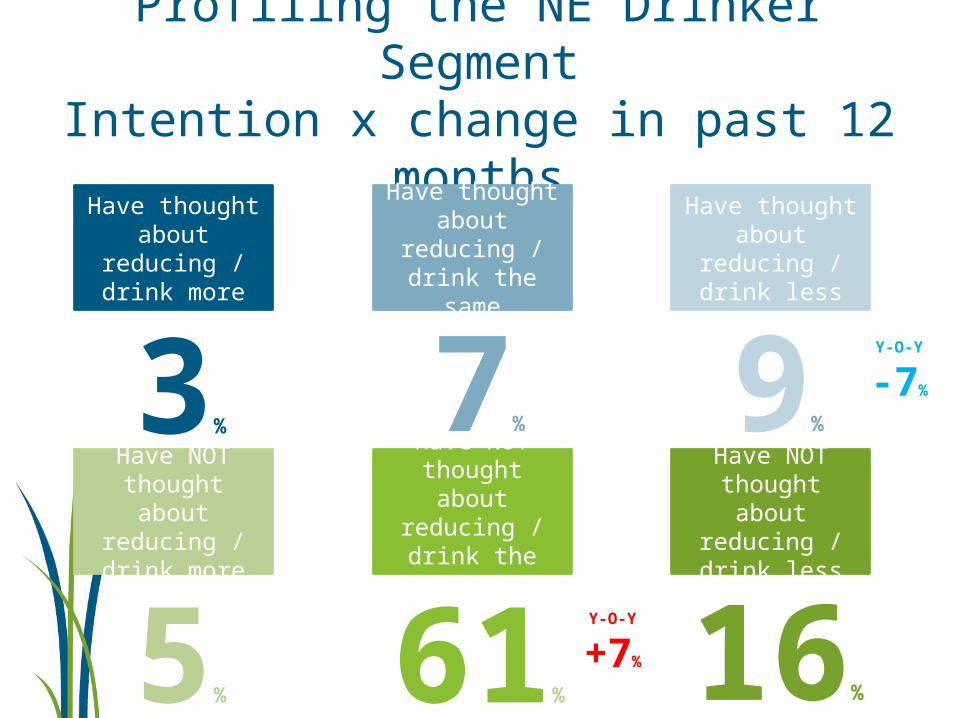
Profiling the NE Drinker SegmentIntention x change in past 12
months
Have NOT thought about
reducing / drink the
same
61%
Have thought about
reducing / drink the
same
7%
Have thought about
reducing / drink more
3%
Have NOT thought about
reducing / drink less
16%
Have thought about
reducing / drink less
9%
Have NOT thought about
reducing / drink more
5%
Y-O-Y
-7%
Y-O-Y
+7%

Understanding Units & Limits
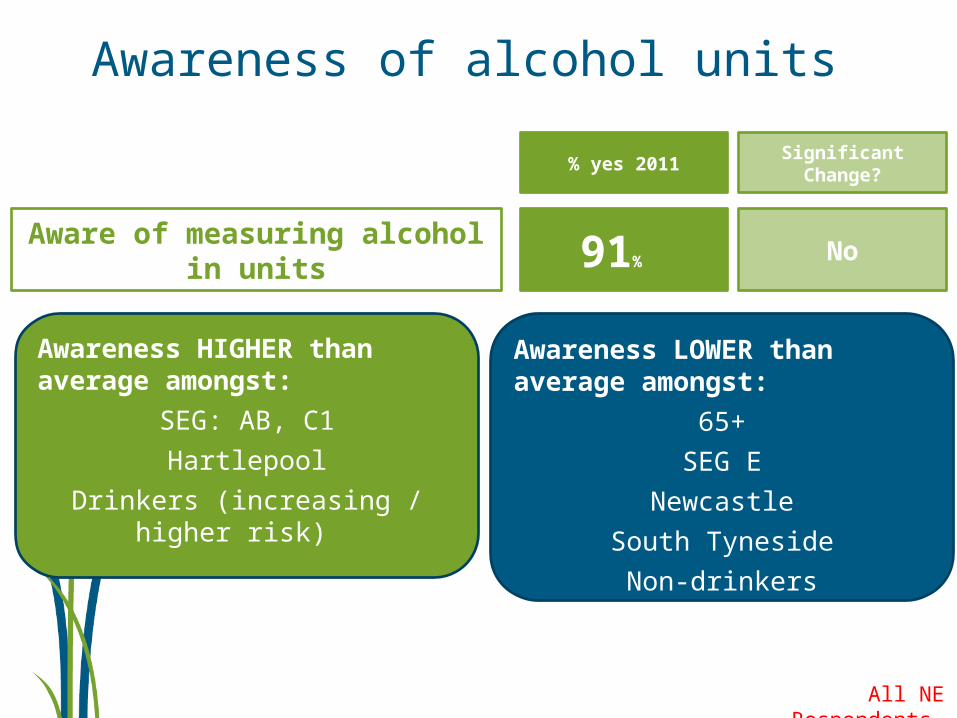
Awareness of alcohol units
Aware of measuring alcohol in units
% yes 2011Significant Change?
91% No
Awareness HIGHER than average amongst:
SEG: AB, C1
Hartlepool
Drinkers (increasing / higher risk)
Awareness LOWER than average amongst:
65+
SEG E
Newcastle
South Tyneside
Non-drinkers
All NE Respondents
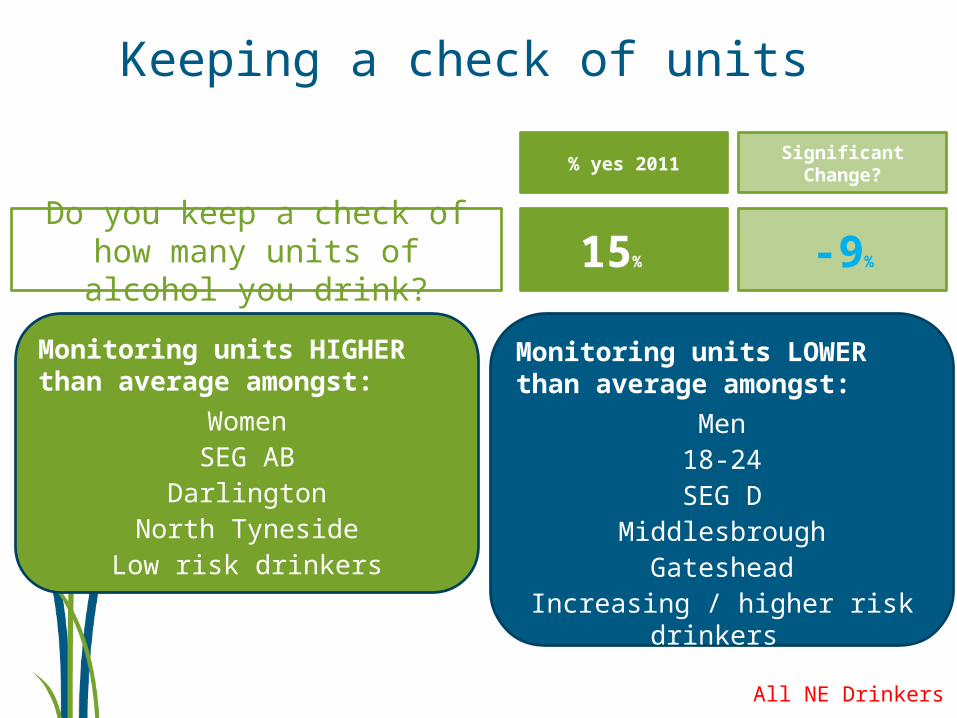
Keeping a check of units
Do you keep a check of how many units of alcohol you
drink?
% yes 2011Significant Change?
15% -9%
Monitoring units HIGHER than average amongst:
WomenSEG AB
DarlingtonNorth Tyneside
Low risk drinkers
Monitoring units LOWER than average amongst:
Men18-24SEG D
MiddlesbroughGateshead
Increasing / higher risk drinkers
All NE Drinkers
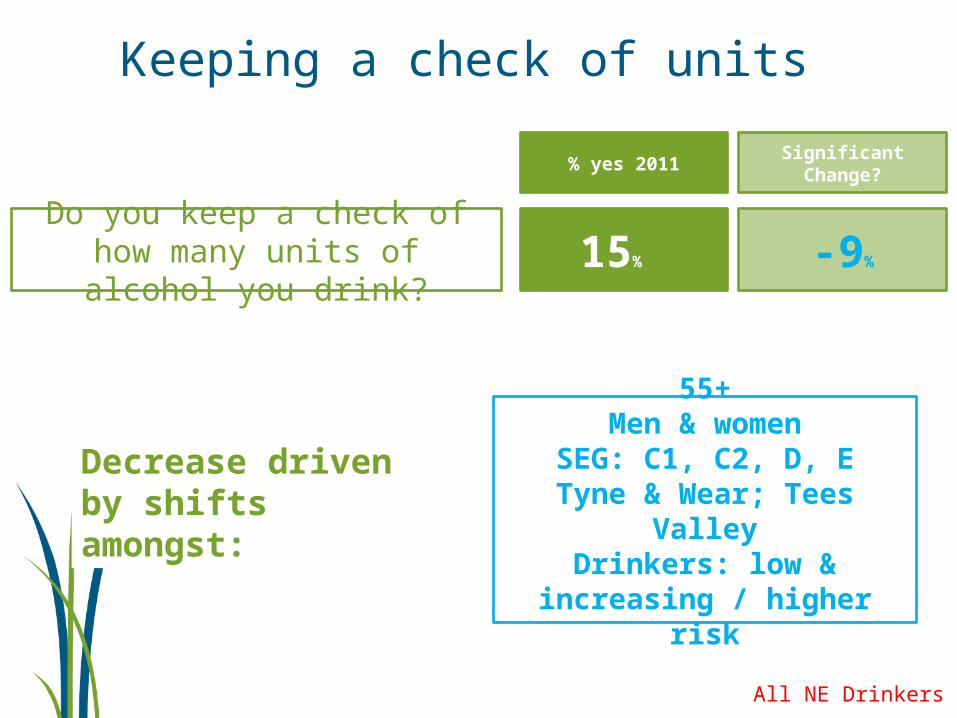
Keeping a check of units
Do you keep a check of how many units of alcohol you
drink?
% yes 2011Significant Change?
15% -9%
Decrease driven by shifts amongst:
55+Men & women
SEG: C1, C2, D, ETyne & Wear; Tees
ValleyDrinkers: low &
increasing / higher risk
All NE Drinkers
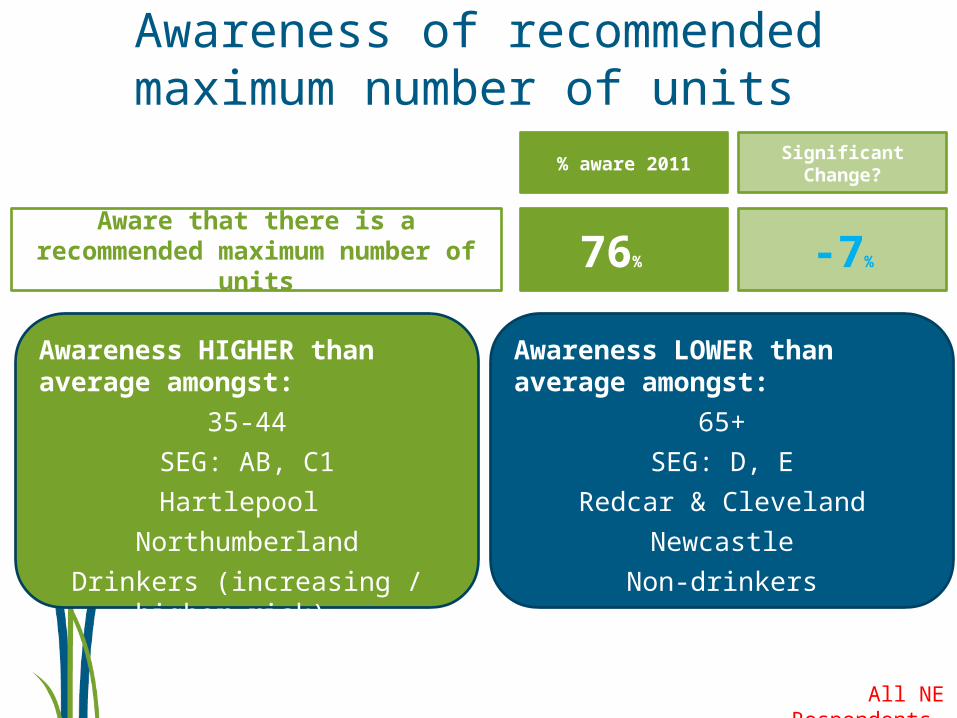
Awareness of recommended maximum number of units
Aware that there is a recommended maximum number
of units
% aware 2011Significant Change?
76% -7%
Awareness HIGHER than average amongst:
35-44
SEG: AB, C1
Hartlepool
Northumberland
Drinkers (increasing / higher risk)
Awareness LOWER than average amongst:
65+
SEG: D, E
Redcar & Cleveland
Newcastle
Non-drinkers
All NE Respondents
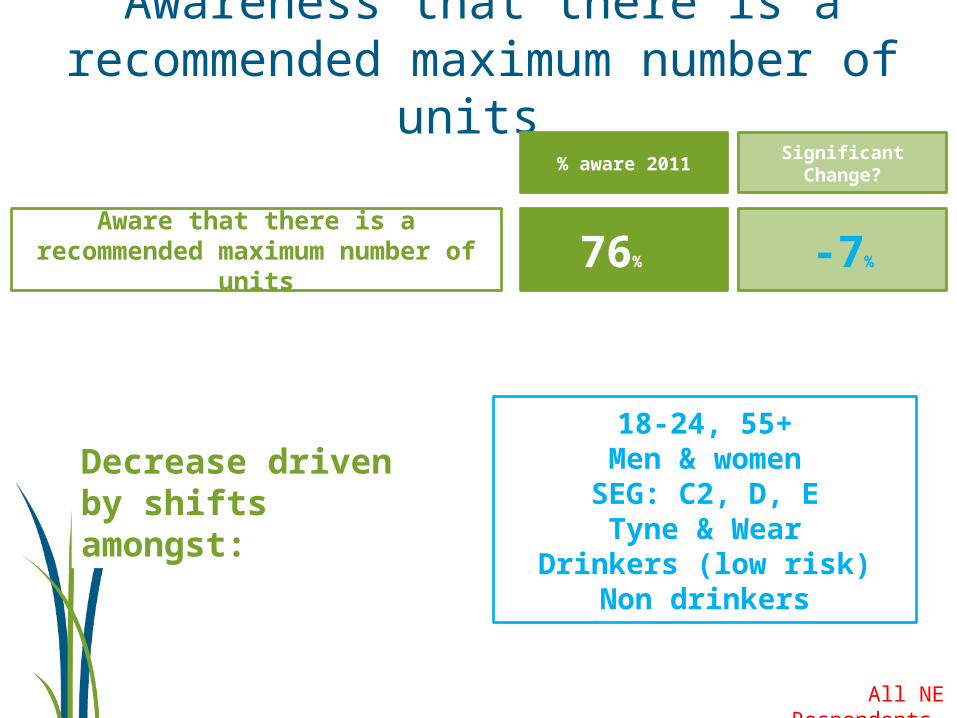
Awareness that there is a recommended maximum number of
units
Aware that there is a recommended maximum number
of units
% aware 2011Significant Change?
76% -7%
Decrease driven by shifts amongst:
18-24, 55+Men & womenSEG: C2, D, ETyne & Wear
Drinkers (low risk)Non drinkers
All NE Respondents
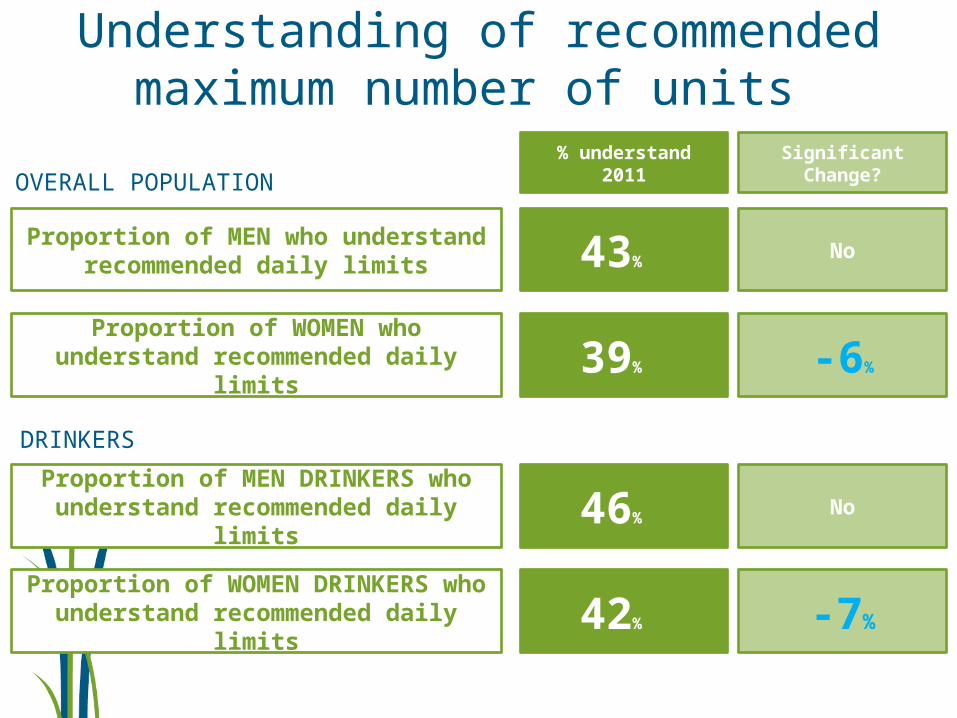
Understanding of recommended maximum number of units
Proportion of MEN who understand recommended daily
limits
% understand 2011
Significant Change?
43% No
Proportion of WOMEN who understand recommended daily
limits39% -6%
OVERALL POPULATION
Proportion of MEN DRINKERS who understand recommended daily
limits46% No
Proportion of WOMEN DRINKERS who understand recommended
daily limits42% -7%
DRINKERS

Minimum Pricing
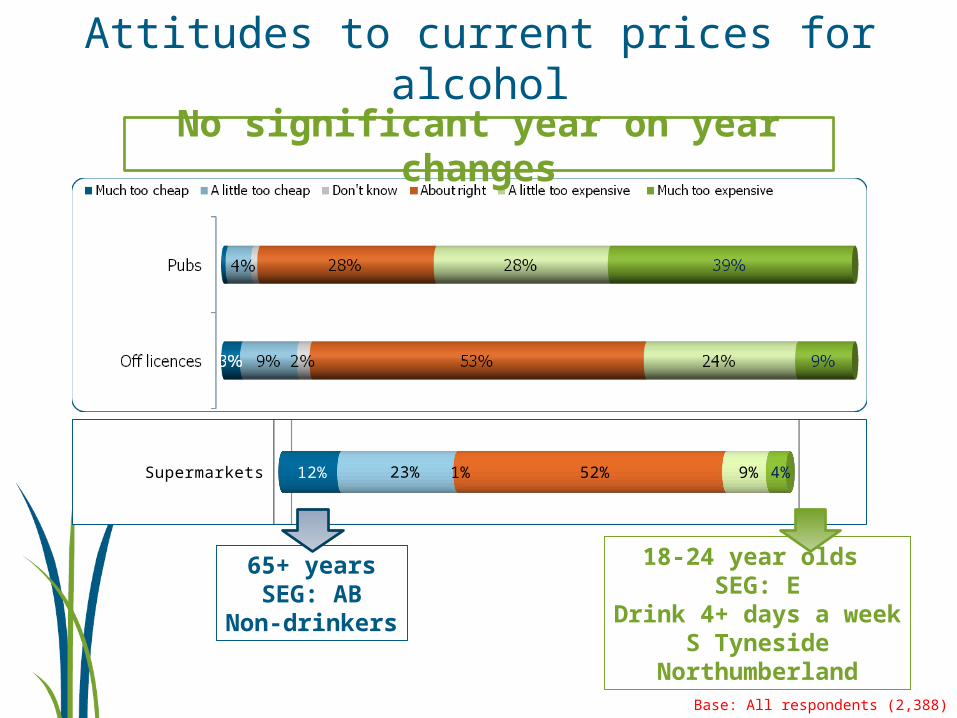
Attitudes to current prices for alcohol
Supermarkets 12% 23% 1% 52% 9% 4%
Base: All respondents (2,388)
65+ yearsSEG: AB
Non-drinkers
18-24 year olds SEG: E
Drink 4+ days a weekS Tyneside
Northumberland
No significant year on year changes
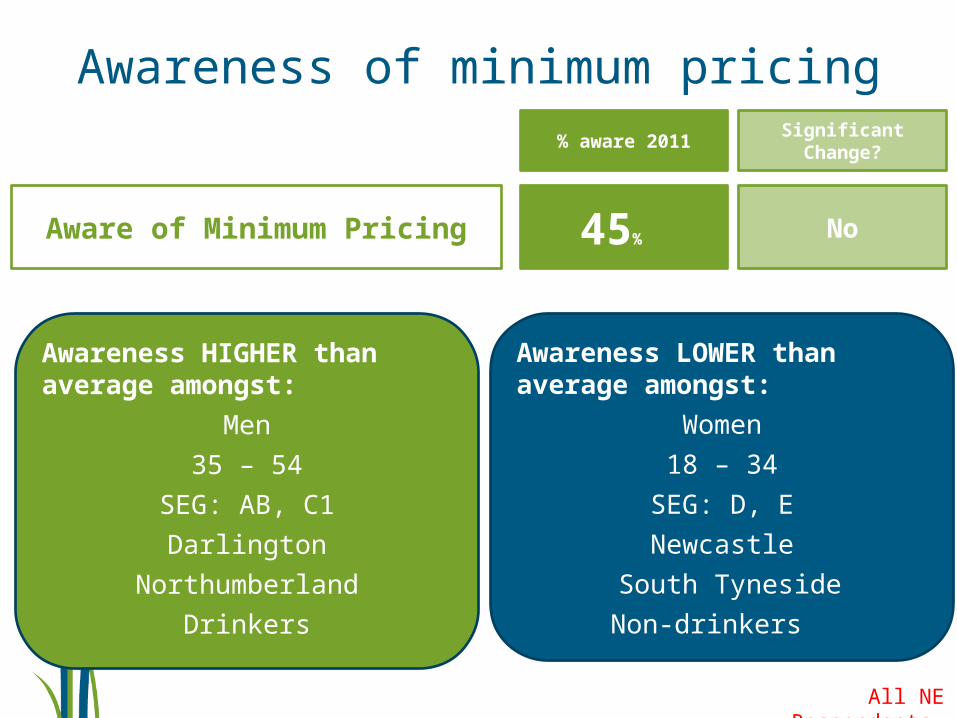
Awareness of minimum pricing
Aware of Minimum Pricing
% aware 2011Significant Change?
45% No
Awareness HIGHER than average amongst:
Men
35 – 54
SEG: AB, C1
Darlington
Northumberland
Drinkers
Awareness LOWER than average amongst:
Women
18 – 34
SEG: D, E
Newcastle
South Tyneside
Non-drinkers
All NE Respondents
All NE Respondents
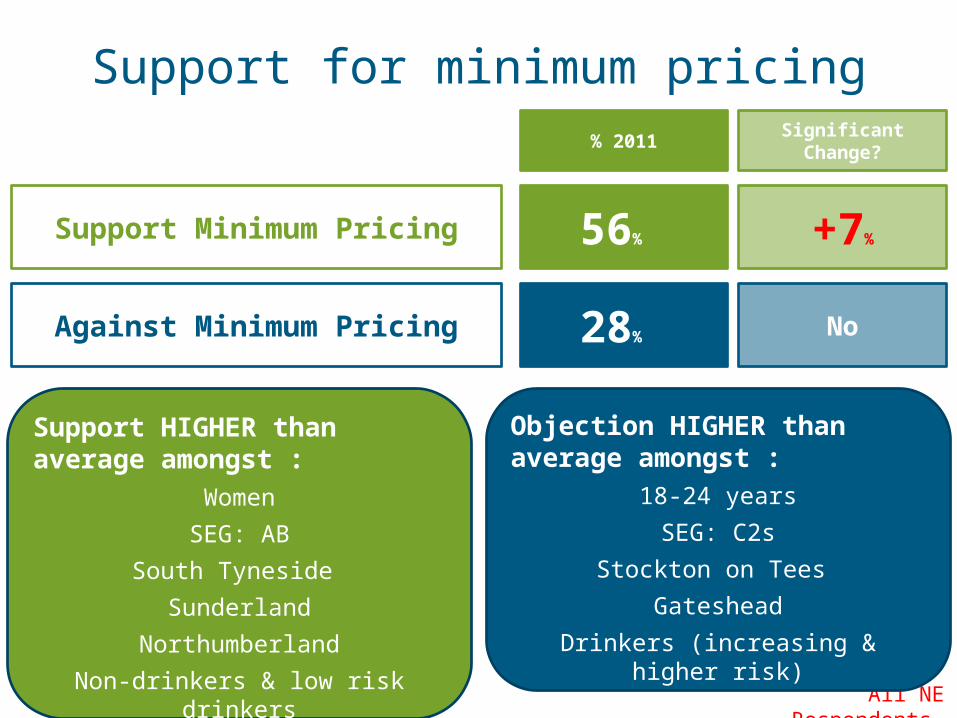
Support for minimum pricing% 2011
Significant Change?
Support Minimum Pricing 56% +7%
Against Minimum Pricing 28% No
Support HIGHER than average amongst :
Women
SEG: AB
South Tyneside
Sunderland
Northumberland
Non-drinkers & low risk drinkers
Objection HIGHER than average amongst :
18-24 years
SEG: C2s
Stockton on Tees
Gateshead
Drinkers (increasing & higher risk)
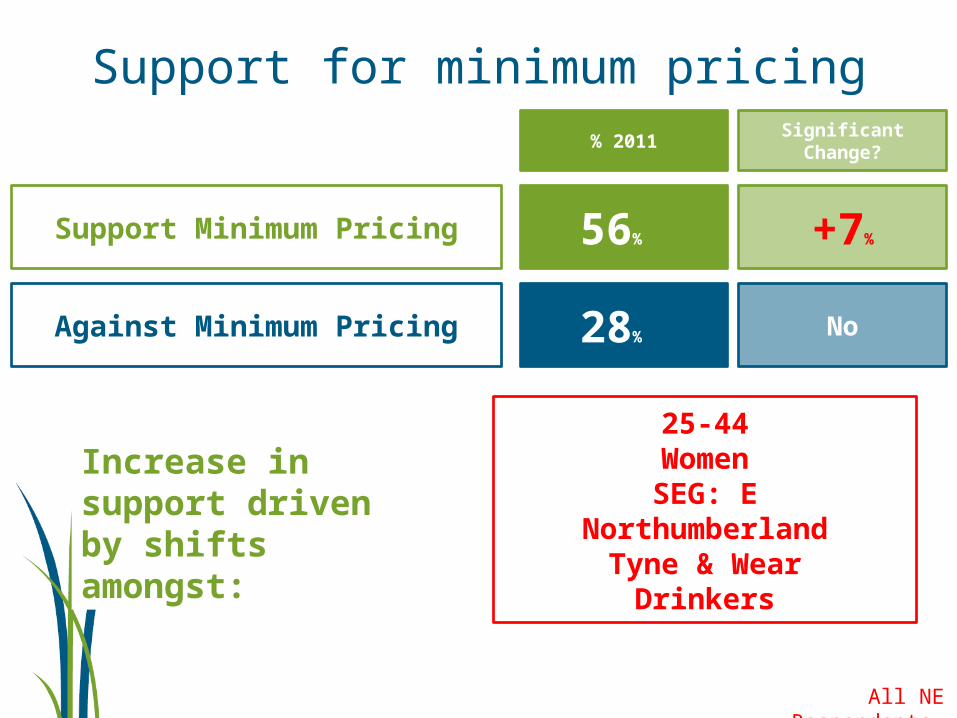
Support for minimum pricing% 2011
Significant Change?
Support Minimum Pricing 56% +7%
Against Minimum Pricing 28% No
Increase in support driven by shifts amongst:
25-44WomenSEG: E
NorthumberlandTyne & Wear
Drinkers
All NE Respondents
All NE Respondents
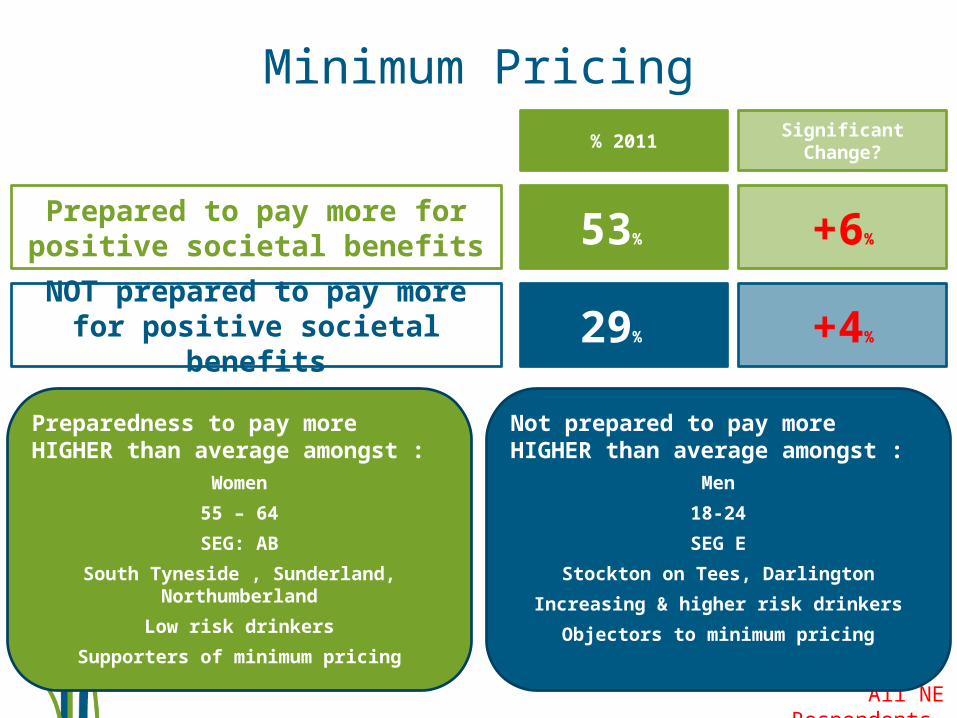
Minimum Pricing% 2011
Significant Change?
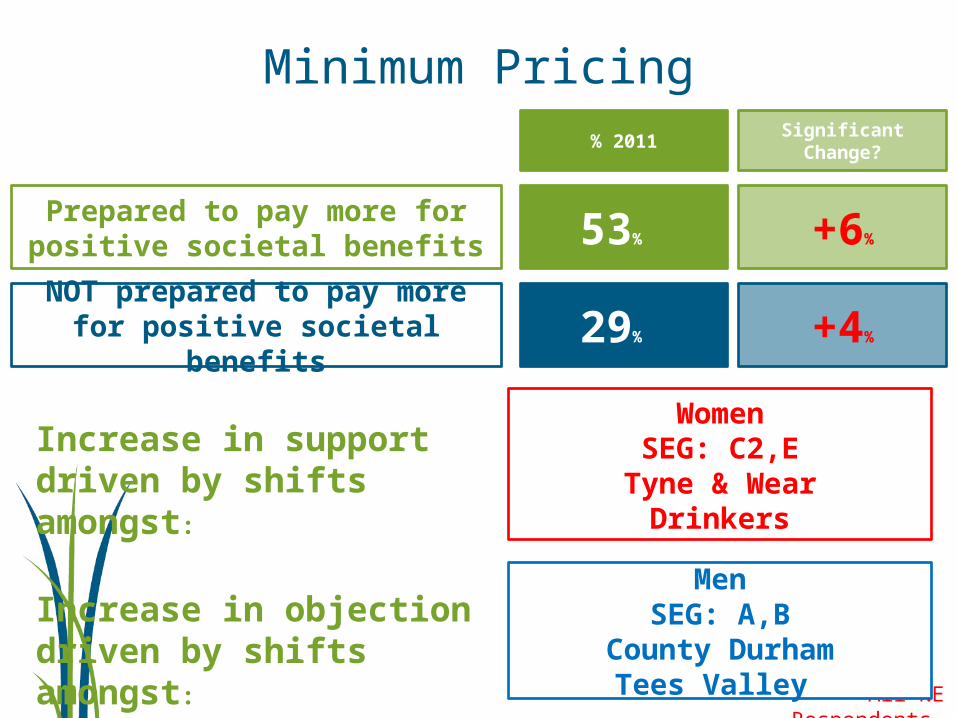
Prepared to pay more for positive societal benefits 53% +6%
NOT prepared to pay more for positive societal
benefits29% +4%
Preparedness to pay more HIGHER than average amongst :
Women
55 – 64
SEG: AB
South Tyneside , Sunderland, Northumberland
Low risk drinkers
Supporters of minimum pricing
Not prepared to pay more HIGHER than average amongst :
Men
18-24
SEG E
Stockton on Tees, Darlington
Increasing & higher risk drinkers
Objectors to minimum pricing
All NE Respondents
Minimum Pricing% 2011
Significant Change?
Prepared to pay more for positive societal benefits 53% +6%
NOT prepared to pay more for positive societal
benefits29% +4%
Increase in support driven by shifts amongst:
WomenSEG: C2,E
Tyne & WearDrinkers
Increase in objection driven by shifts amongst:
MenSEG: A,B
County DurhamTees Valley
All NE Respondents
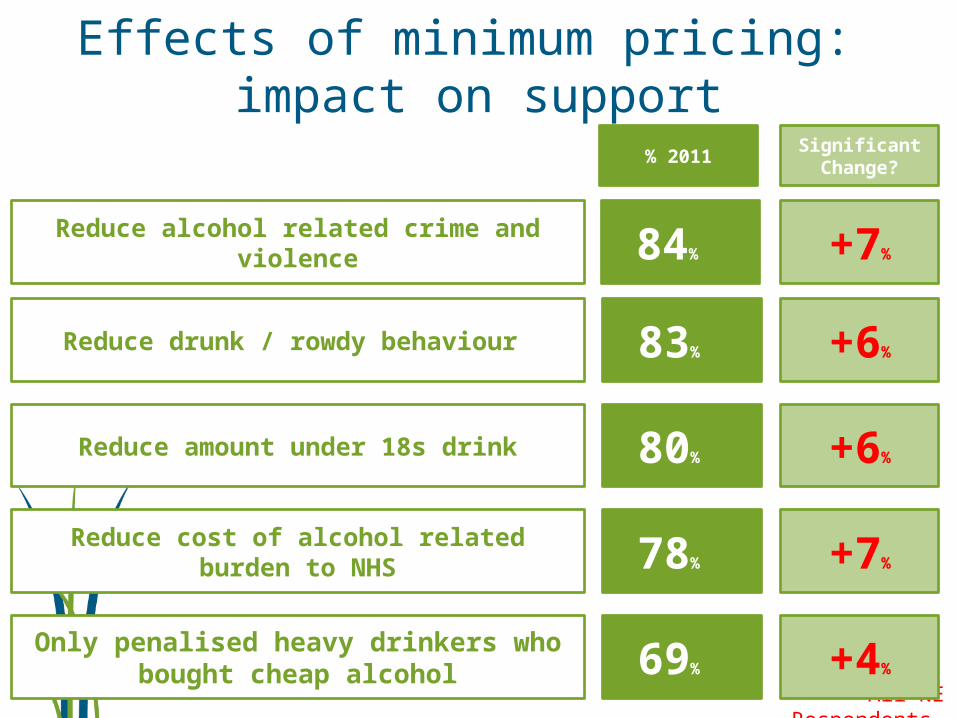
Effects of minimum pricing: impact on support
Reduce alcohol related crime and violence
% 2011Significant Change?
84% +7%
Reduce drunk / rowdy behaviour 83% +6%
Reduce amount under 18s drink 80% +6%
Reduce cost of alcohol related burden to NHS 78% +7%
Only penalised heavy drinkers who bought cheap alcohol 69% +4%
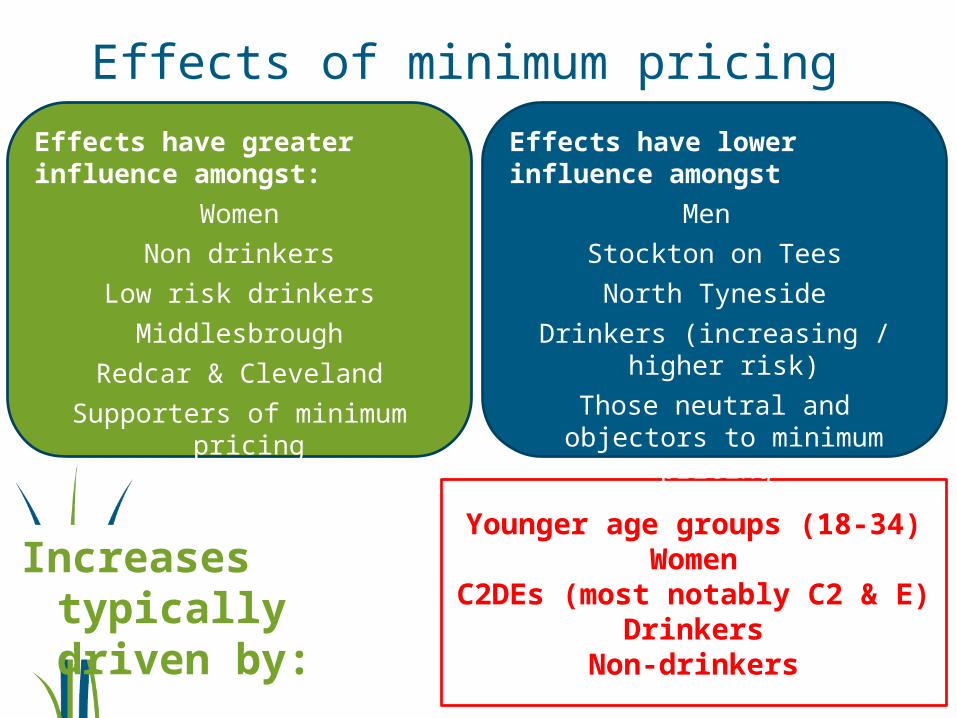
Effects of minimum pricing
Increases typically driven by:
Younger age groups (18-34)Women
C2DEs (most notably C2 & E)Drinkers
Non-drinkers
Effects have greater influence amongst:
Women
Non drinkers
Low risk drinkers
Middlesbrough
Redcar & Cleveland
Supporters of minimum pricing
Effects have lower influence amongst
Men
Stockton on Tees
North Tyneside
Drinkers (increasing / higher risk)
Those neutral and objectors to minimum pricing
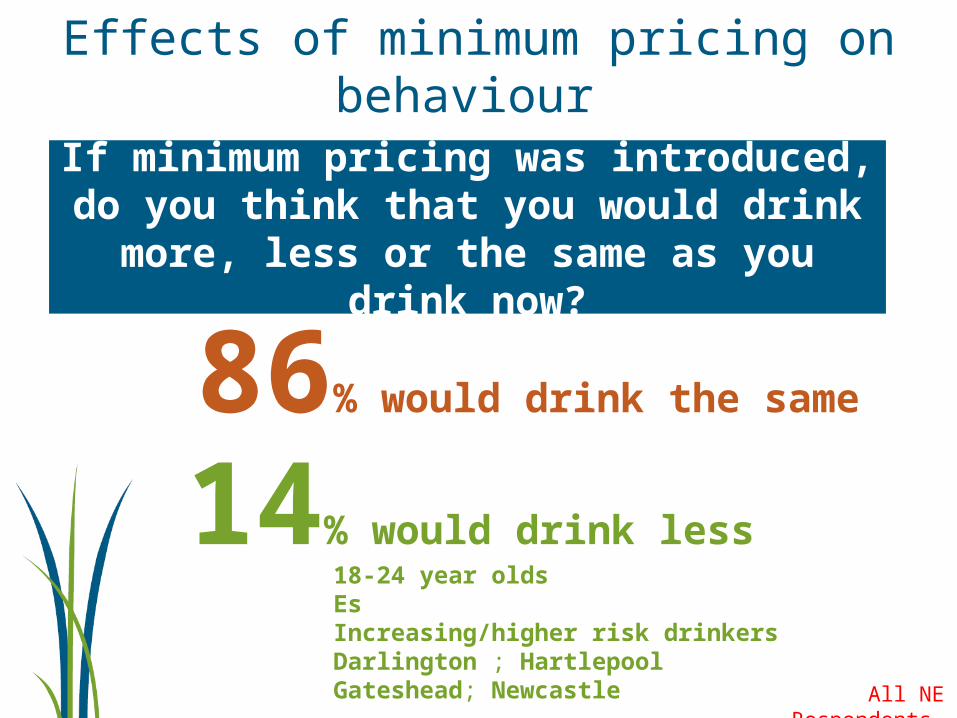
14% would drink less
86% would drink the
same
Effects of minimum pricing on behaviour
If minimum pricing was introduced, do you think that you would drink
more, less or the same as you drink now?
18-24 year olds EsIncreasing/higher risk drinkersDarlington ; HartlepoolGateshead; Newcastle All NE
Respondents
Children & Alcohol
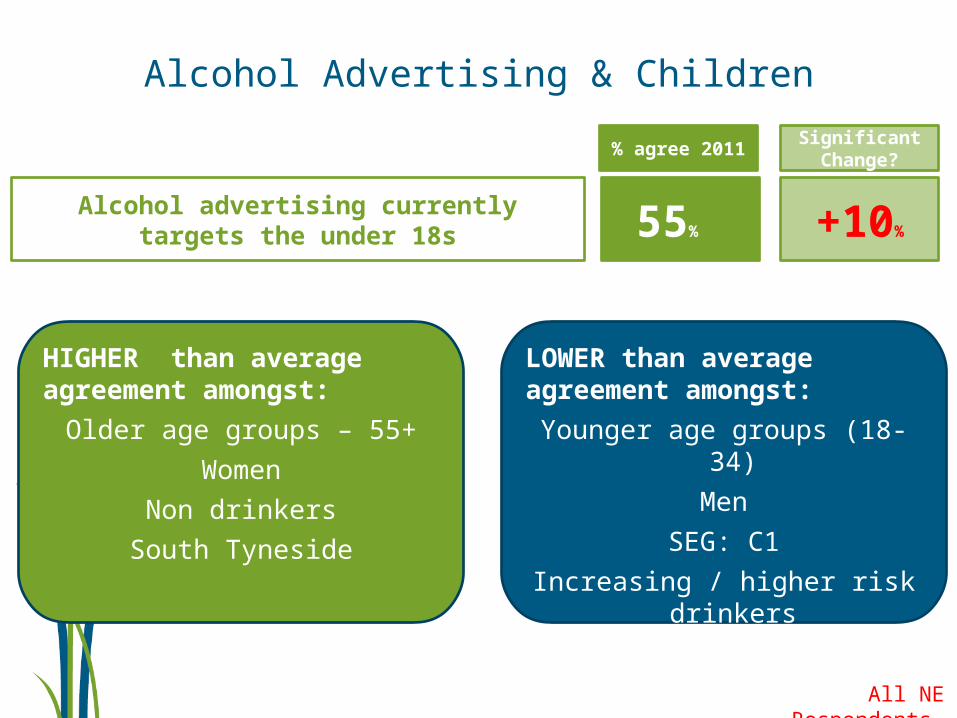
Alcohol Advertising & Children
Alcohol advertising currently targets the under 18s
% agree 2011
Significant Change?
55% +10%
HIGHER than average agreement amongst:
Older age groups – 55+
Women
Non drinkers
South Tyneside
LOWER than average agreement amongst:
Younger age groups (18-34)
Men
SEG: C1
Increasing / higher risk drinkers
Darlington; N Tyneside
All NE Respondents
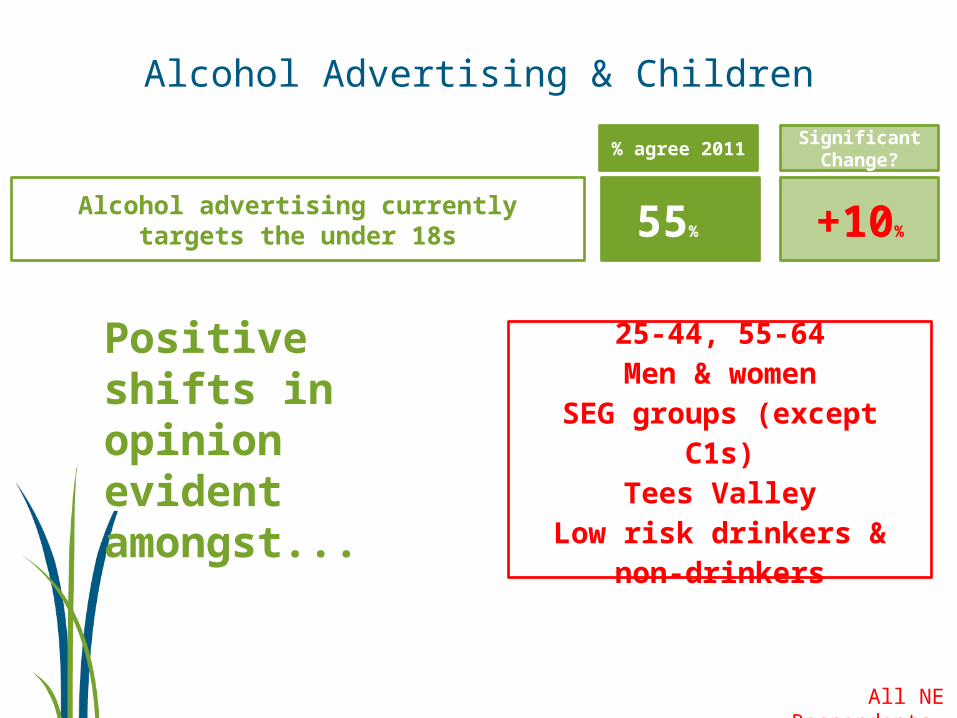
Alcohol Advertising & Children
Alcohol advertising currently targets the under 18s
% agree 2011
Significant Change?
55% +10%
25-44, 55-64Men & women
SEG groups (except C1s)
Tees ValleyLow risk drinkers & non-
drinkers
Positive shifts in opinion evident amongst...
All NE Respondents
All NE Respondents
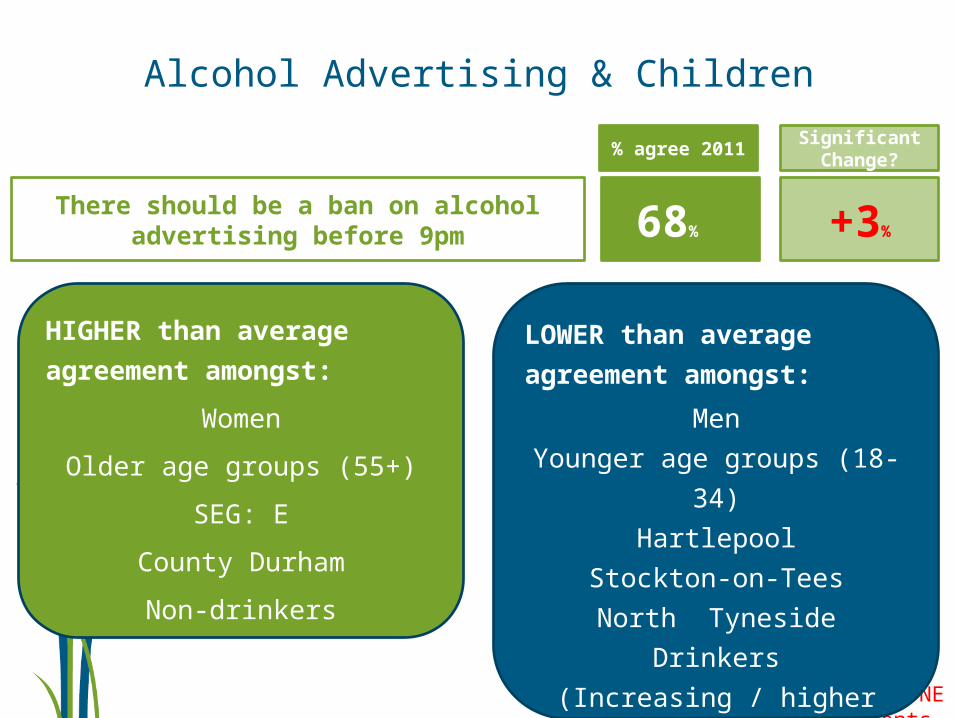
Alcohol Advertising & Children
There should be a ban on alcohol advertising before 9pm
% agree 2011
Significant Change?
68% +3%
HIGHER than average
agreement amongst:
Women
Older age groups (55+)
SEG: E
County Durham
Non-drinkers
LOWER than average
agreement amongst:
Men
Younger age groups (18-34)
Hartlepool
Stockton-on-Tees
North Tyneside
Drinkers
(Increasing / higher risk)
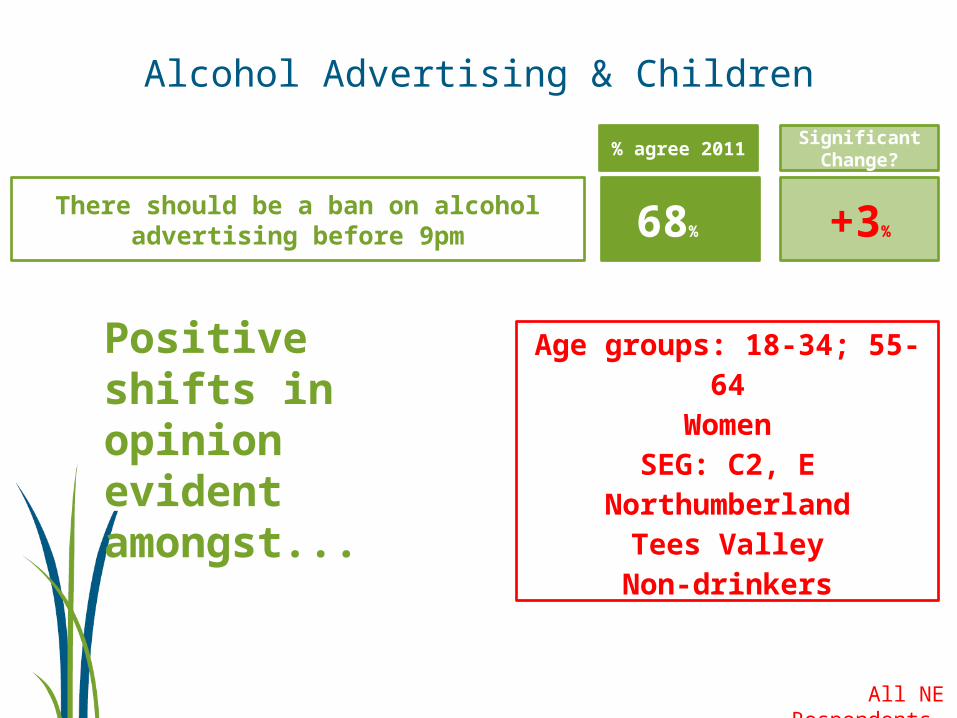
Alcohol Advertising & Children
There should be a ban on alcohol advertising before 9pm
% agree 2011
Significant Change?
68% +3%
Age groups: 18-34; 55-64
WomenSEG: C2, E
NorthumberlandTees Valley
Non-drinkers
Positive shifts in opinion evident amongst...
All NE Respondents
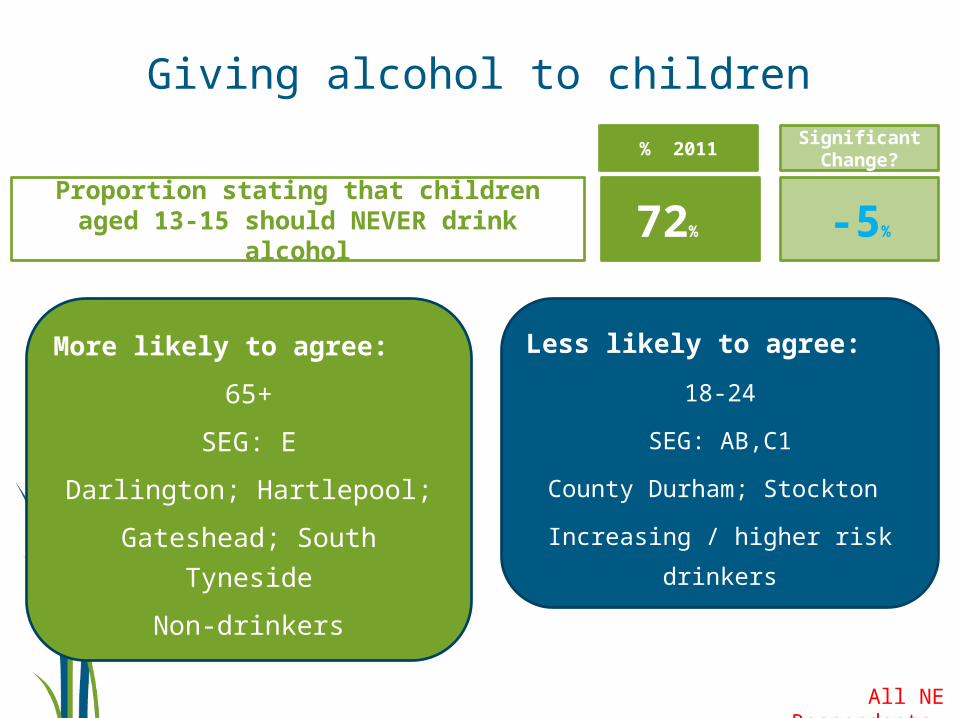
Giving alcohol to children
Proportion stating that children aged 13-15 should NEVER drink alcohol
% 2011Significant Change?
72% -5%
More likely to agree:
65+
SEG: E
Darlington; Hartlepool;
Gateshead; South Tyneside
Non-drinkers
Lower risk drinkers
Less likely to agree:
18-24
SEG: AB,C1
County Durham; Stockton
Increasing / higher risk drinkers
All NE Respondents
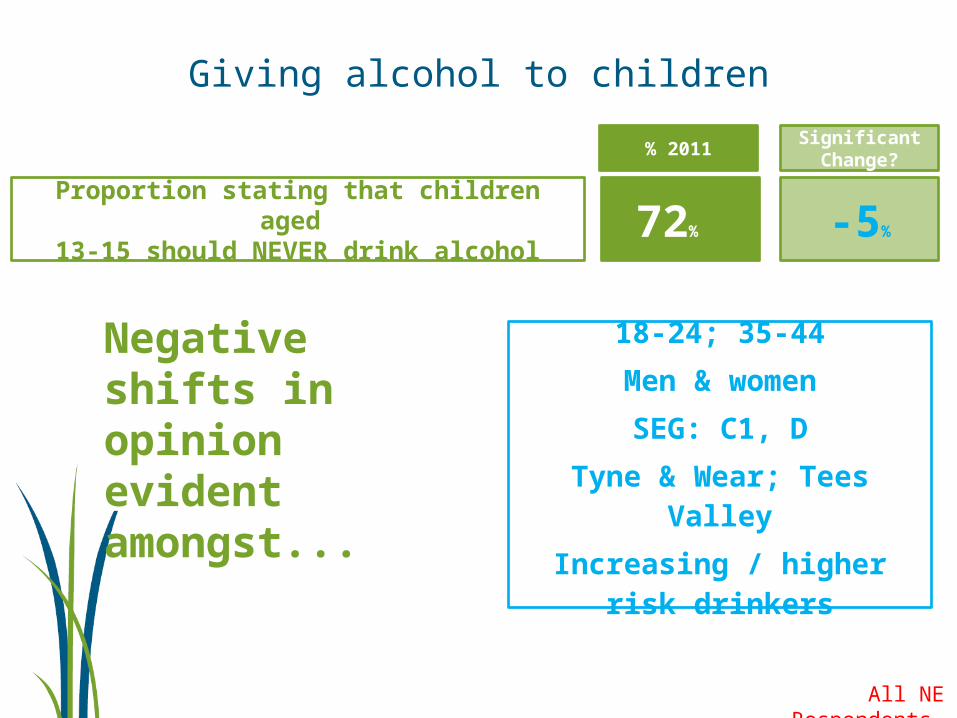
Giving alcohol to children
Proportion stating that children aged 13-15 should NEVER drink alcohol
% 2011Significant Change?
72% -5%
Negative shifts in opinion evident amongst...
18-24; 35-44
Men & women
SEG: C1, D
Tyne & Wear; Tees Valley
Increasing / higher risk drinkers
All NE Respondents
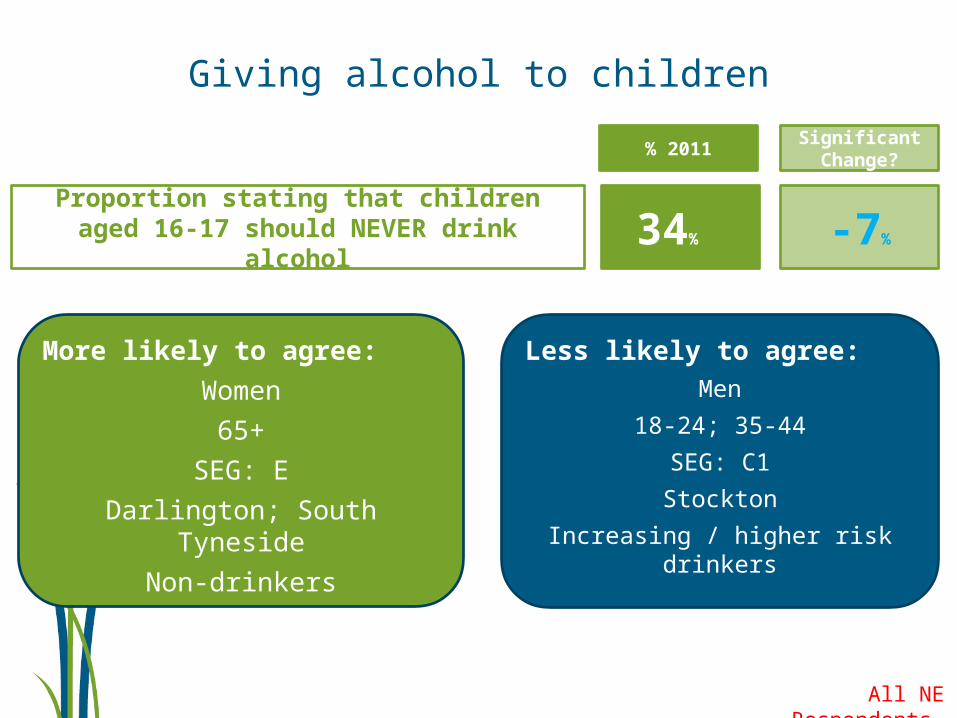
Giving alcohol to children
% 2011Significant Change?
Proportion stating that children aged 16-17 should NEVER drink alcohol 34% -7%
More likely to agree:
Women
65+
SEG: E
Darlington; South Tyneside
Non-drinkers
Less likely to agree:Men
18-24; 35-44
SEG: C1
Stockton
Increasing / higher risk drinkers
All NE Respondents
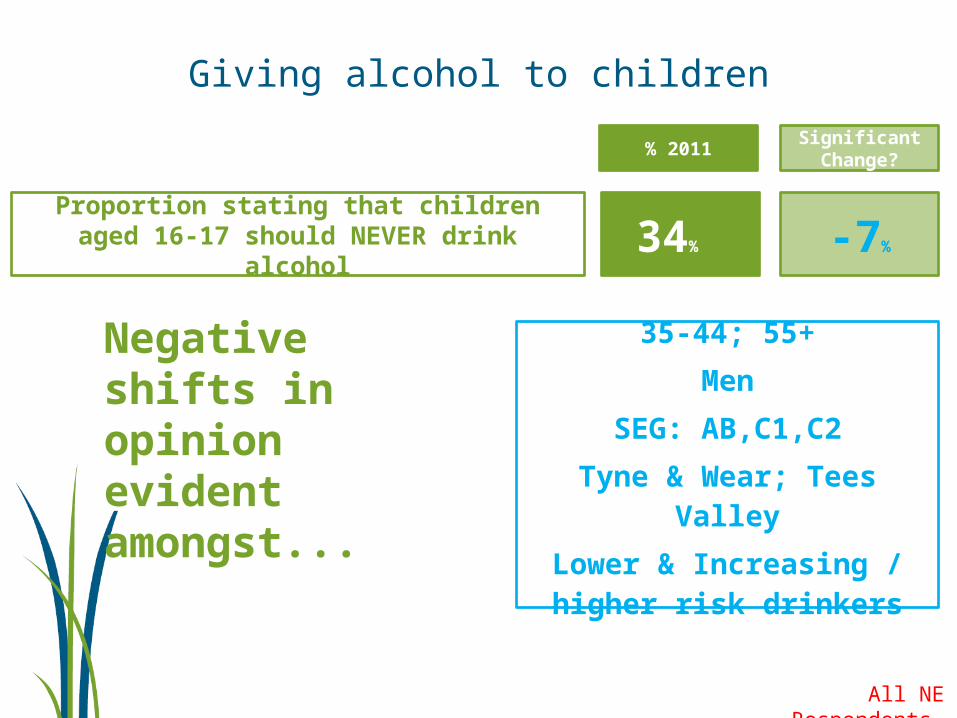
Giving alcohol to children
% 2011Significant Change?
Proportion stating that children aged 16-17 should NEVER drink alcohol 34% -7%
Negative shifts in opinion evident amongst...
35-44; 55+
Men
SEG: AB,C1,C2
Tyne & Wear; Tees Valley
Lower & Increasing / higher risk drinkers
All NE Respondents
Normalisation
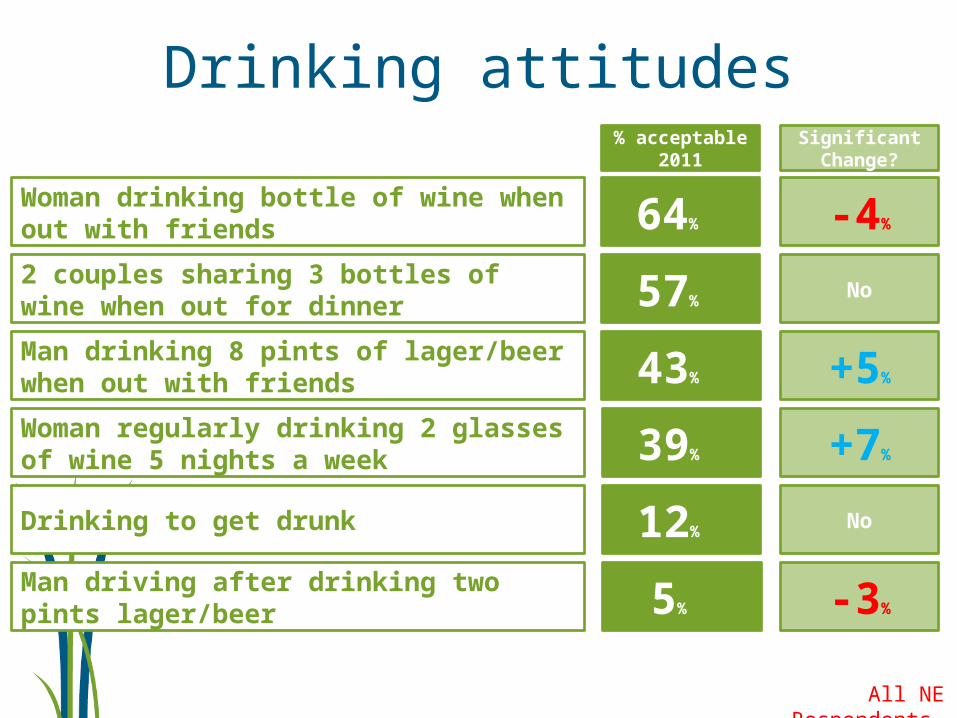
Drinking attitudes
Woman drinking bottle of wine when out with friends
% acceptable
2011
Significant Change?
64% -4%
2 couples sharing 3 bottles of wine when out for dinner 57% No
Man drinking 8 pints of lager/beer when out with friends 43% +5%
Woman regularly drinking 2 glasses of wine 5 nights a week 39% +7%
Drinking to get drunk 12% No
Man driving after drinking two pints lager/beer 5% -3%
All NE Respondents
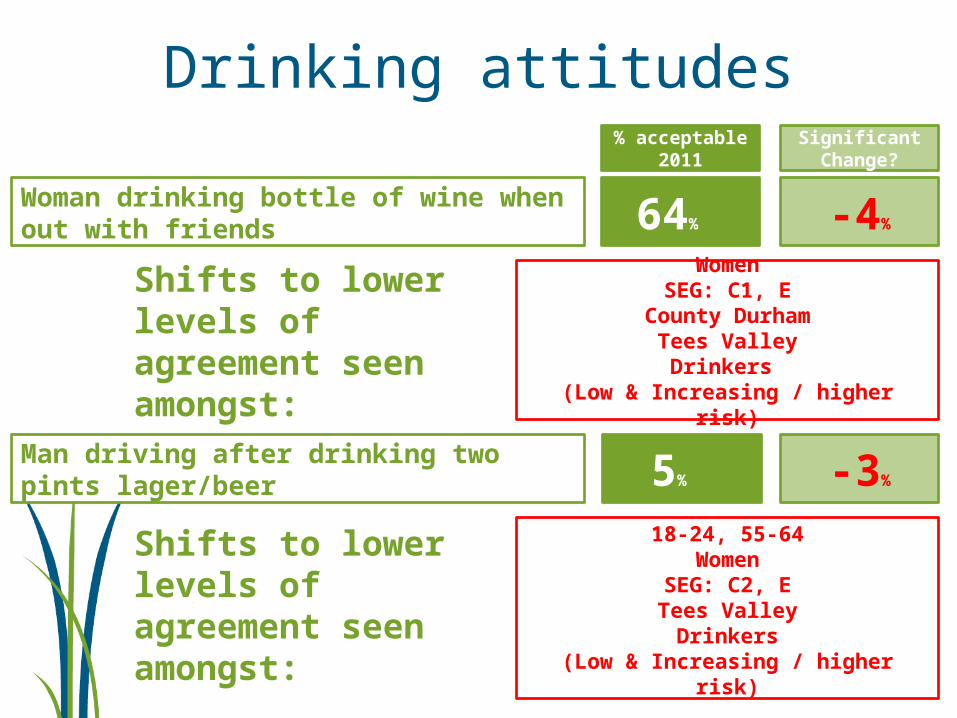
Drinking attitudes
Woman drinking bottle of wine when out with friends
% acceptable
2011
Significant Change?
64% -4%
Man driving after drinking two pints lager/beer 5% -3%
WomenSEG: C1, E
County DurhamTees ValleyDrinkers
(Low & Increasing / higher risk)
Shifts to lower levels of agreement seen amongst:
18-24, 55-64Women
SEG: C2, ETees Valley
Drinkers(Low & Increasing / higher risk)
Shifts to lower levels of agreement seen amongst:
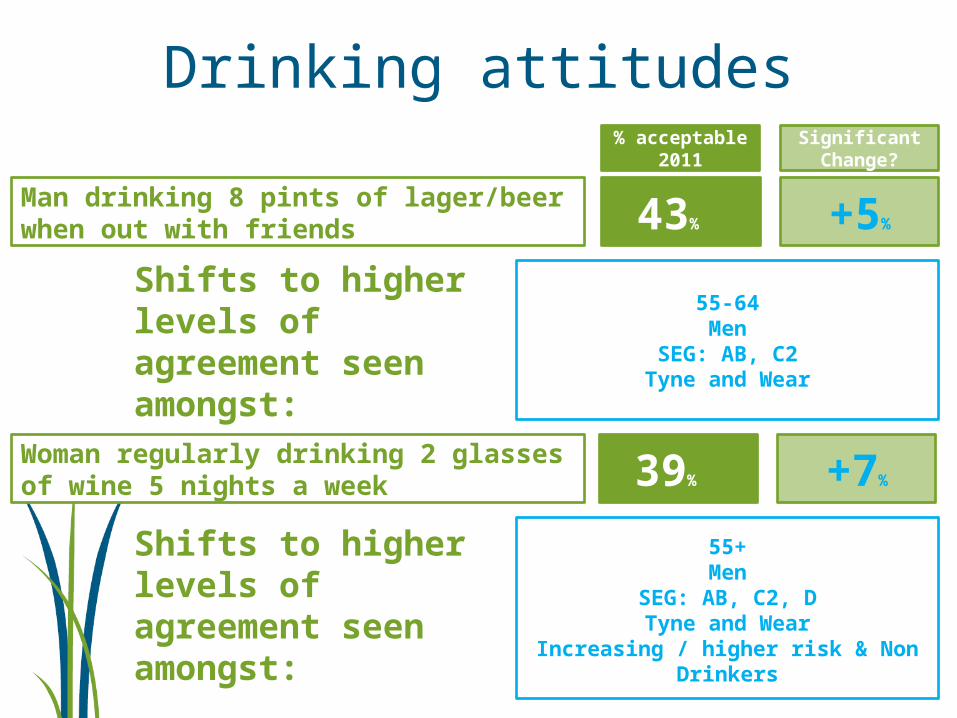
Drinking attitudes
Man drinking 8 pints of lager/beer when out with friends
% acceptable
2011
Significant Change?
Woman regularly drinking 2 glasses of wine 5 nights a week
55-64Men
SEG: AB, C2Tyne and Wear
Shifts to higher levels of agreement seen amongst:
55+Men
SEG: AB, C2, DTyne and Wear
Increasing / higher risk & Non Drinkers
Shifts to higher levels of agreement seen amongst:
43% +5%
39% +7%
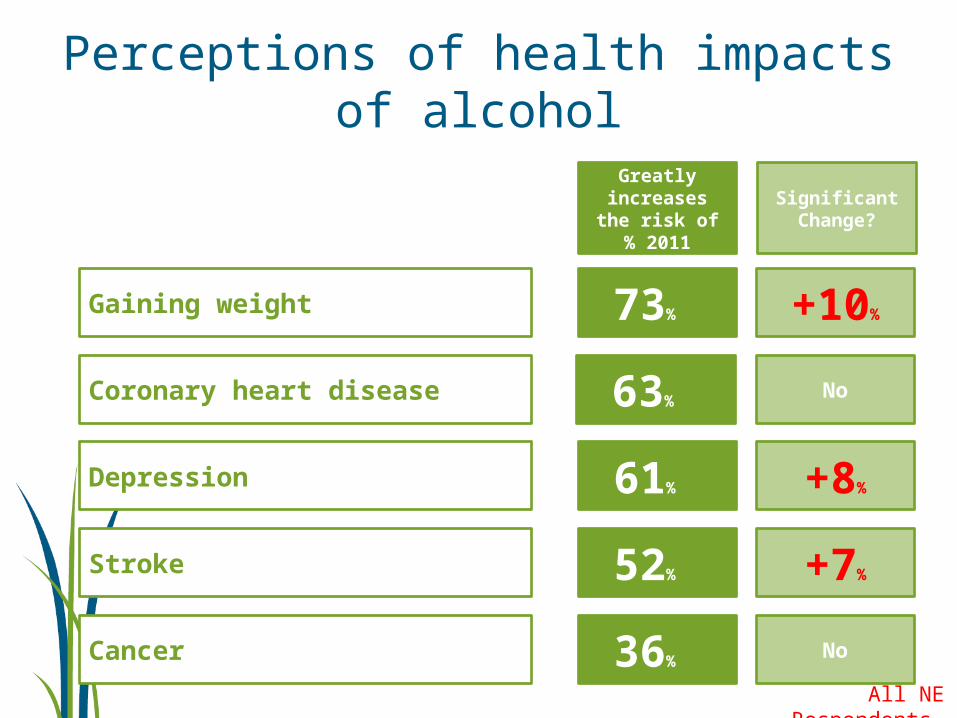
Coronary heart disease
Greatly increases the risk of
% 2011
Significant Change?
63% No
Depression 61% +8%
Cancer 36% No
Stroke 52% +7%
Gaining weight 73% +10%
Perceptions of health impacts of alcohol
All NE Respondents
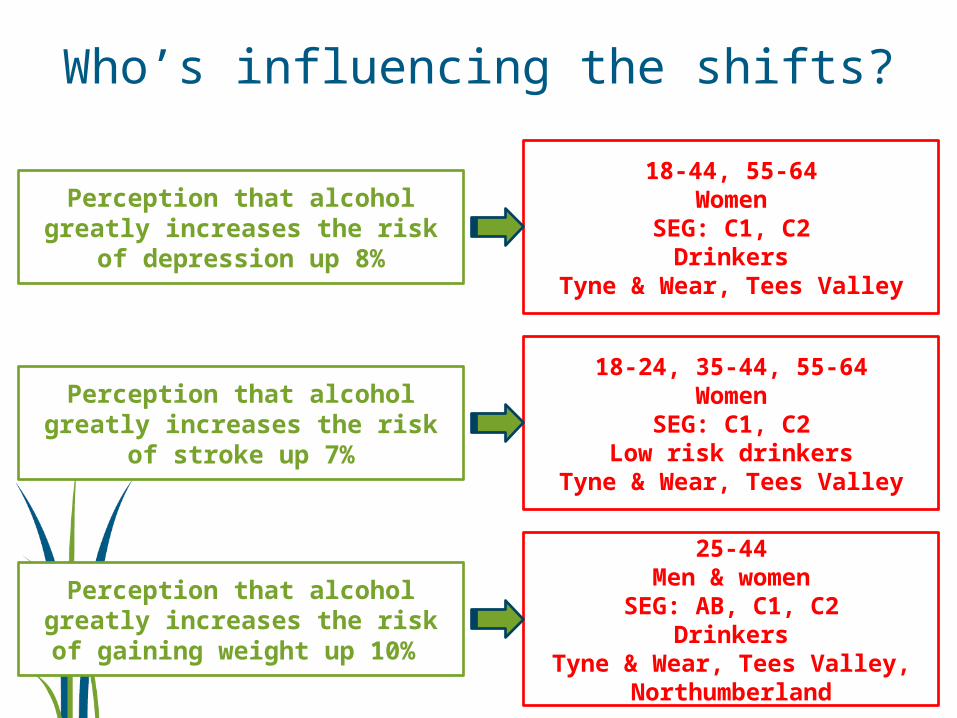
Who’s influencing the shifts?
18-44, 55-64Women
SEG: C1, C2Drinkers
Tyne & Wear, Tees Valley
18-24, 35-44, 55-64Women
SEG: C1, C2Low risk drinkers
Tyne & Wear, Tees Valley
25-44Men & women
SEG: AB, C1, C2Drinkers
Tyne & Wear, Tees Valley, Northumberland
Perception that alcohol greatly increases the risk of
depression up 8%
Perception that alcohol greatly increases the risk of
stroke up 7%
Perception that alcohol greatly increases the risk of
gaining weight up 10%
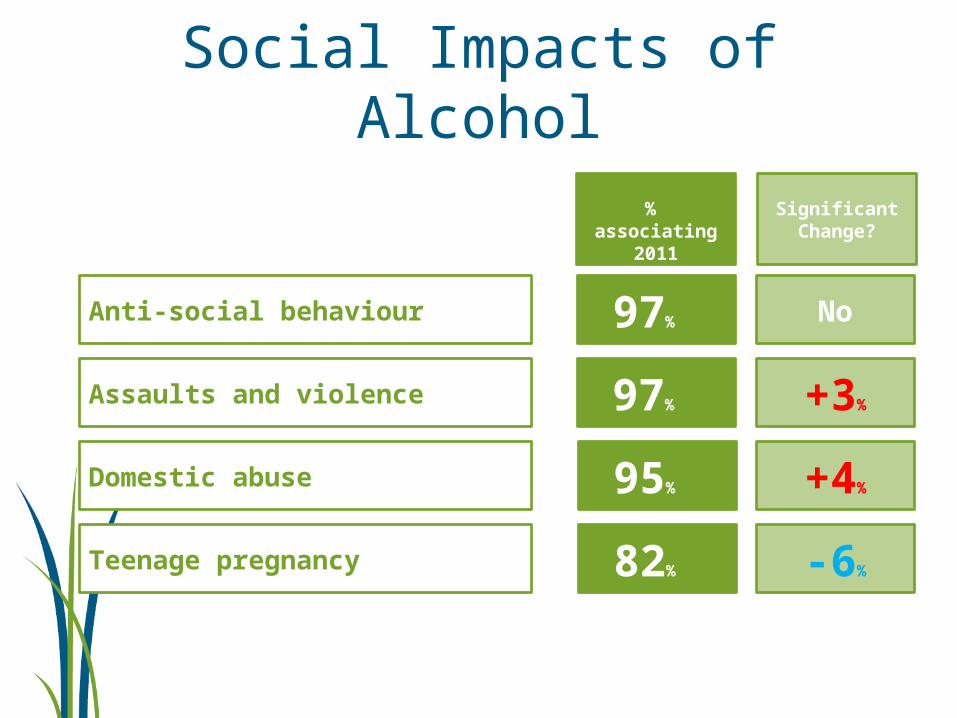
Assaults and violence
% associating
2011
Significant Change?
97% +3%
Domestic abuse 95% +4%
Teenage pregnancy 82% -6%
Anti-social behaviour 97% No
Social Impacts of Alcohol
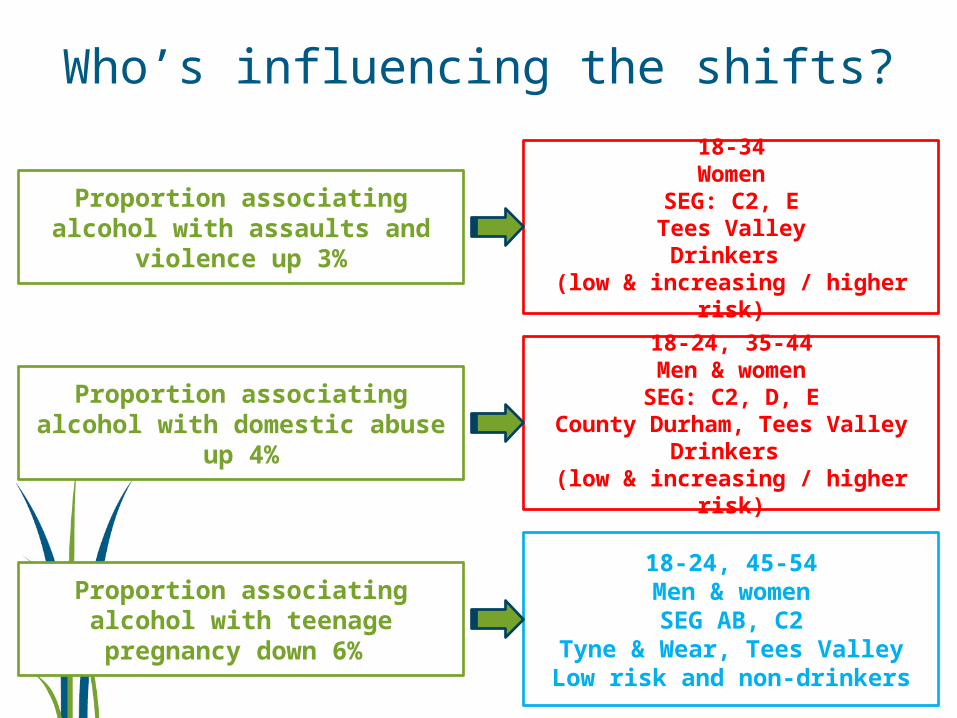
Who’s influencing the shifts?
18-34Women
SEG: C2, ETees ValleyDrinkers
(low & increasing / higher risk)
18-24, 35-44Men & womenSEG: C2, D, E
County Durham, Tees ValleyDrinkers
(low & increasing / higher risk)
18-24, 45-54Men & women
SEG AB, C2Tyne & Wear, Tees Valley
Low risk and non-drinkers
Proportion associating alcohol with assaults and
violence up 3%
Proportion associating alcohol with domestic abuse
up 4%
Proportion associating alcohol with teenage pregnancy down 6%
Summary
Summary
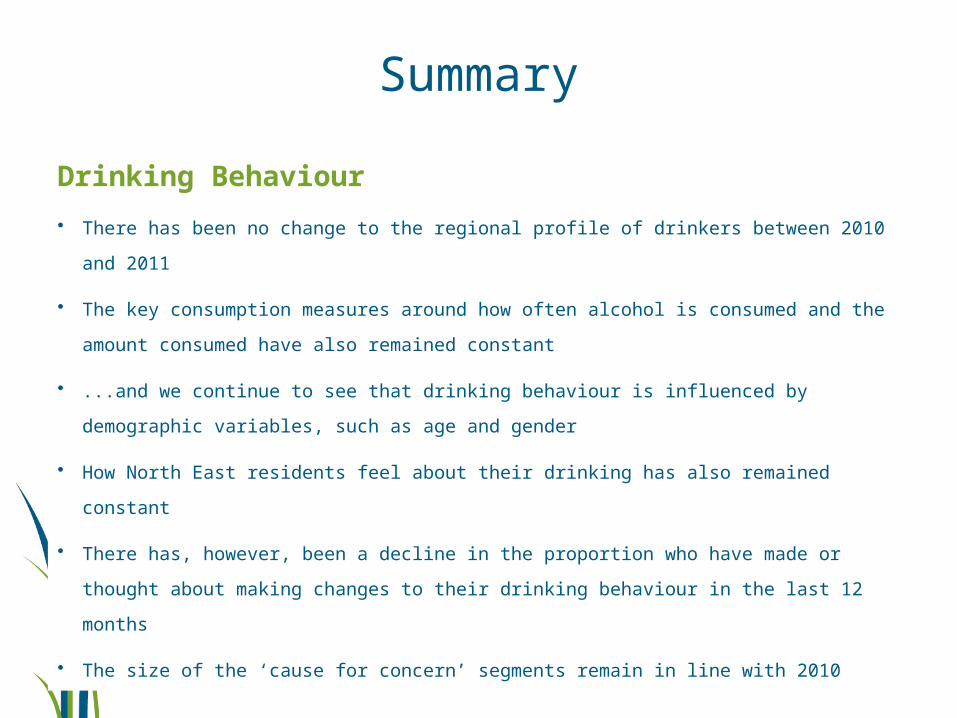
Drinking Behaviour
• There has been no change to the regional profile of drinkers between 2010
and 2011
• The key consumption measures around how often alcohol is consumed and
the amount consumed have also remained constant
• ...and we continue to see that drinking behaviour is influenced by
demographic variables, such as age and gender
• How North East residents feel about their drinking has also remained constant
• There has, however, been a decline in the proportion who have made or
thought about making changes to their drinking behaviour in the last 12
months
• The size of the ‘cause for concern’ segments remain in line with 2010
Summary
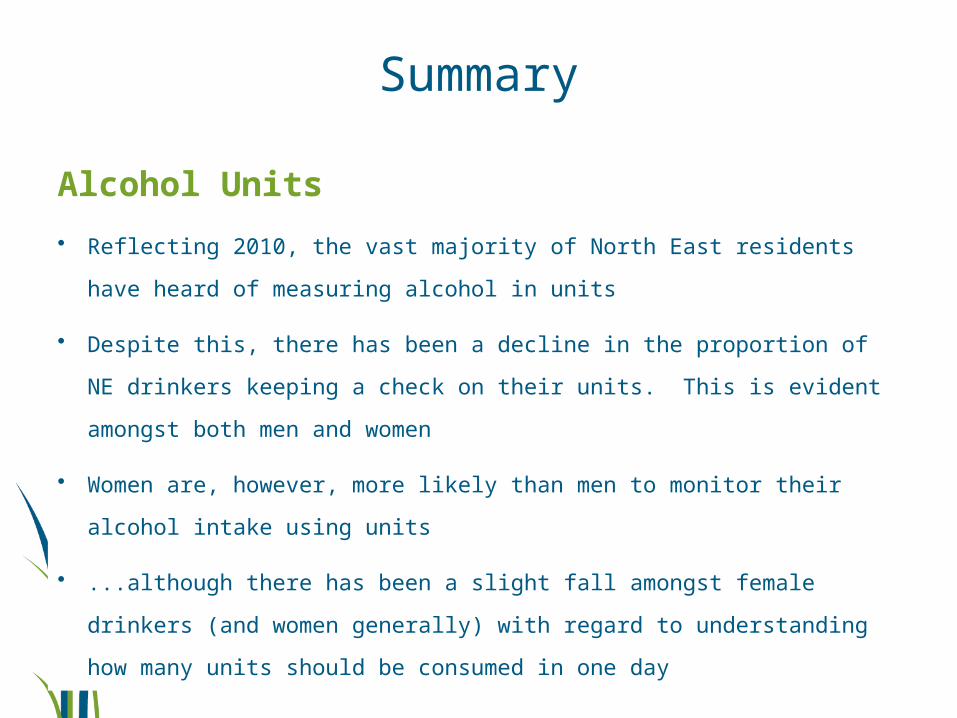
Alcohol Units
• Reflecting 2010, the vast majority of North East residents have heard
of measuring alcohol in units
• Despite this, there has been a decline in the proportion of NE
drinkers keeping a check on their units. This is evident amongst both
men and women
• Women are, however, more likely than men to monitor their alcohol
intake using units
• ...although there has been a slight fall amongst female drinkers (and
women generally) with regard to understanding how many units
should be consumed in one day
Summary
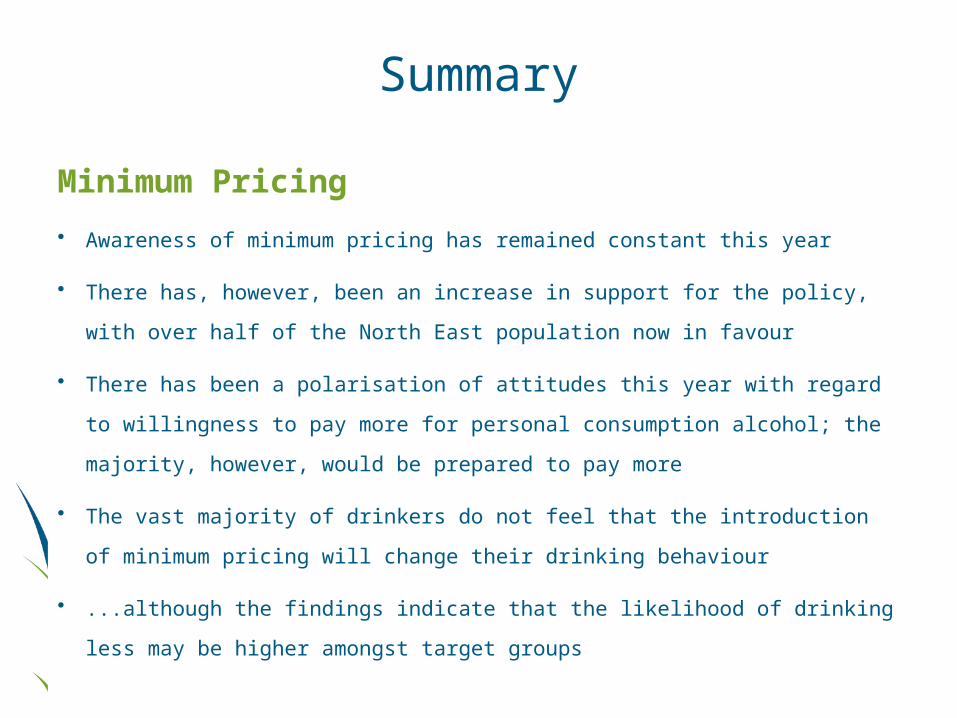
Minimum Pricing
• Awareness of minimum pricing has remained constant this year
• There has, however, been an increase in support for the policy, with
over half of the North East population now in favour
• There has been a polarisation of attitudes this year with regard to
willingness to pay more for personal consumption alcohol; the
majority, however, would be prepared to pay more
• The vast majority of drinkers do not feel that the introduction of
minimum pricing will change their drinking behaviour
• ...although the findings indicate that the likelihood of drinking less
may be higher amongst target groups
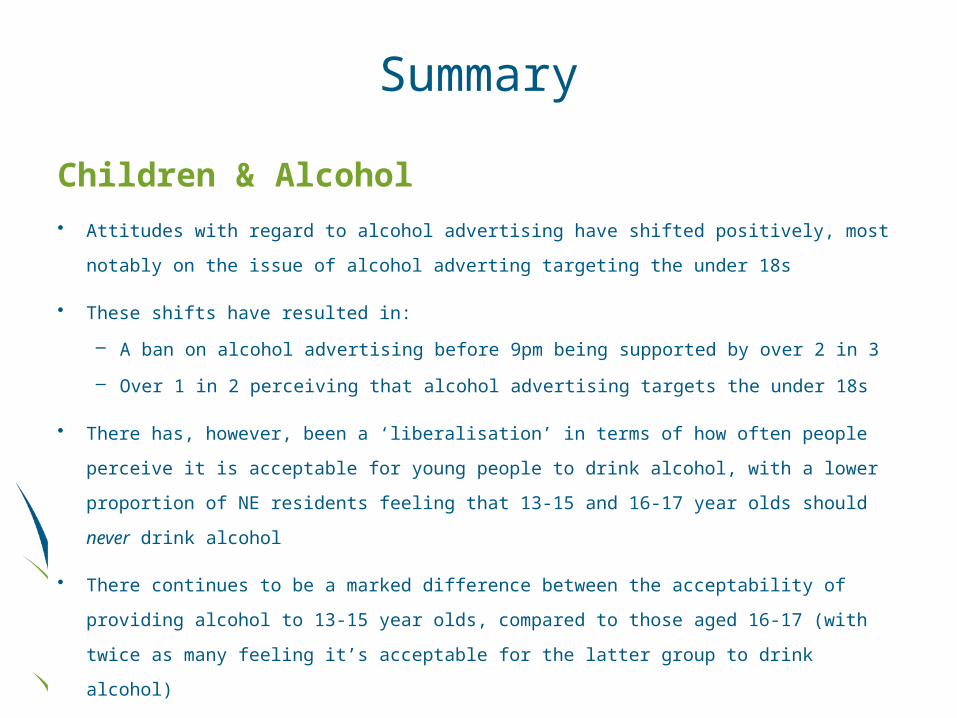
Summary
Children & Alcohol• Attitudes with regard to alcohol advertising have shifted positively, most
notably on the issue of alcohol adverting targeting the under 18s
• These shifts have resulted in:
– A ban on alcohol advertising before 9pm being supported by over 2 in 3
– Over 1 in 2 perceiving that alcohol advertising targets the under 18s
• There has, however, been a ‘liberalisation’ in terms of how often people
perceive it is acceptable for young people to drink alcohol, with a lower
proportion of NE residents feeling that 13-15 and 16-17 year olds should
never drink alcohol
• There continues to be a marked difference between the acceptability of
providing alcohol to 13-15 year olds, compared to those aged 16-17 (with
twice as many feeling it’s acceptable for the latter group to drink alcohol)
Summary
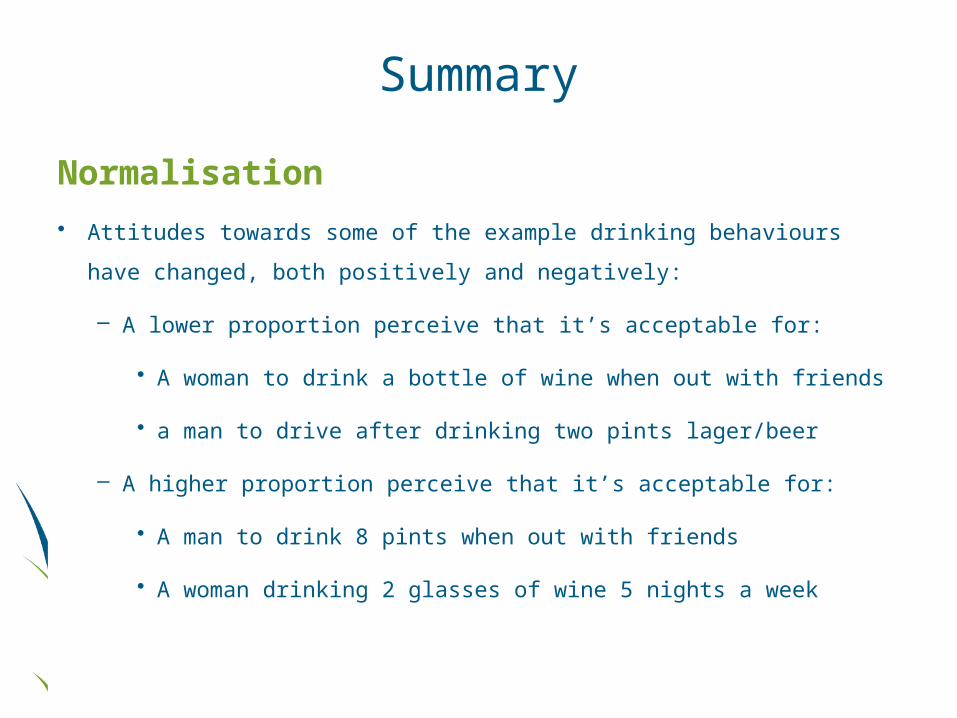
Normalisation
• Attitudes towards some of the example drinking behaviours have
changed, both positively and negatively:
– A lower proportion perceive that it’s acceptable for:
• A woman to drink a bottle of wine when out with friends
• a man to drive after drinking two pints lager/beer
– A higher proportion perceive that it’s acceptable for:
• A man to drink 8 pints when out with friends
• A woman drinking 2 glasses of wine 5 nights a week
Summary
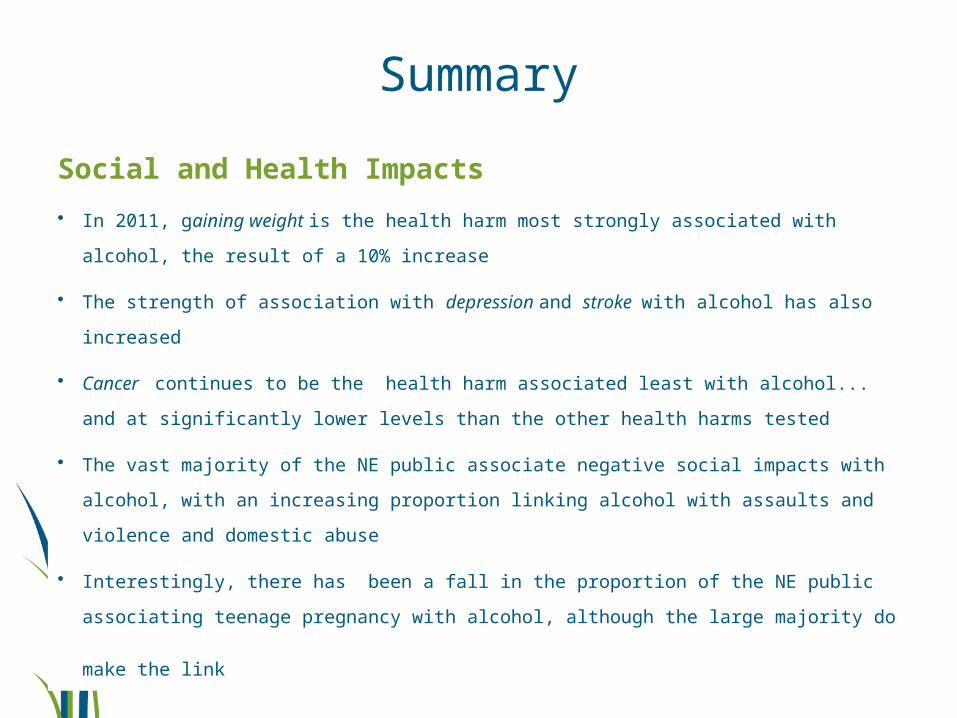
Social and Health Impacts
• In 2011, gaining weight is the health harm most strongly associated with alcohol,
the result of a 10% increase
• The strength of association with depression and stroke with alcohol has also
increased
• Cancer continues to be the health harm associated least with alcohol... and at
significantly lower levels than the other health harms tested
• The vast majority of the NE public associate negative social impacts with alcohol,
with an increasing proportion linking alcohol with assaults and violence and
domestic abuse
• Interestingly, there has been a fall in the proportion of the NE public associating
teenage pregnancy with alcohol, although the large majority do make the link
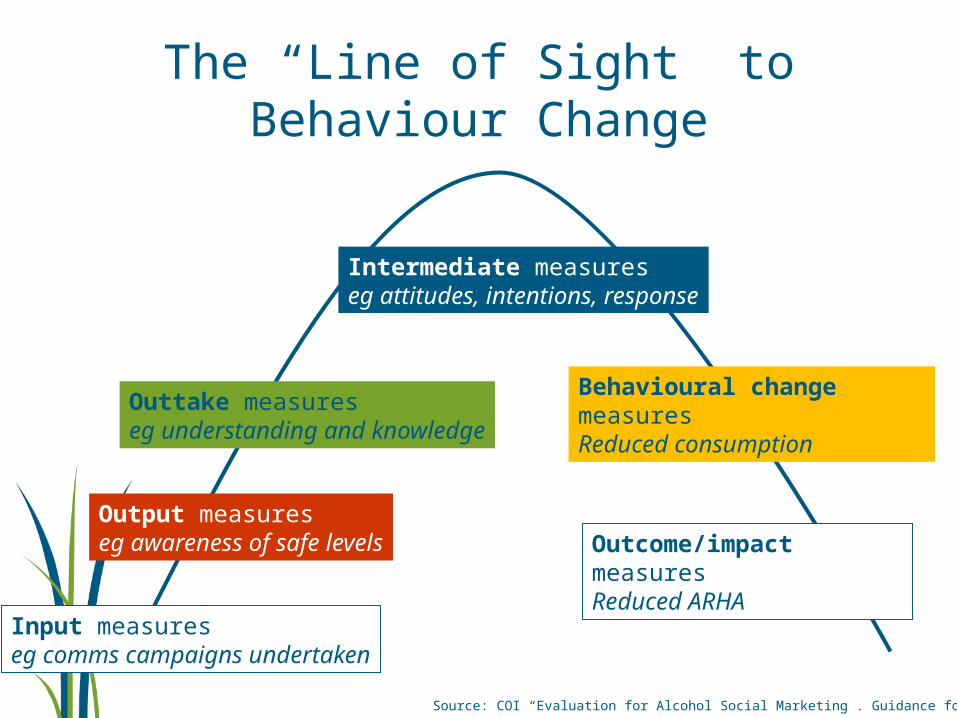
The “Line of Sight” to Behaviour Change
Input measureseg comms campaigns undertaken
Output measureseg awareness of safe levels
Outtake measureseg understanding and knowledge
Intermediate measureseg attitudes, intentions, response
Behavioural change measuresReduced consumption
Outcome/impact measuresReduced ARHA
Source: COI “Evaluation for Alcohol Social Marketing . Guidance for PCTs”
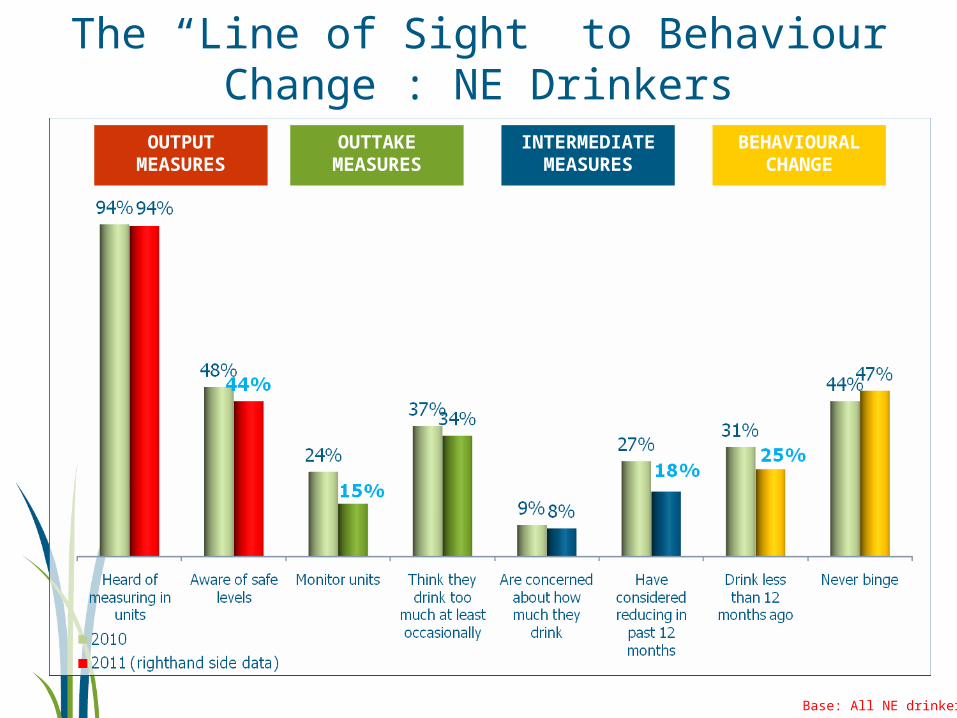
The “Line of Sight” to Behaviour Change : NE Drinkers
Base: All NE drinkers
BEHAVIOURAL CHANGE
INTERMEDIATE MEASURES
OUTTAKE MEASURES
OUTPUT MEASURES
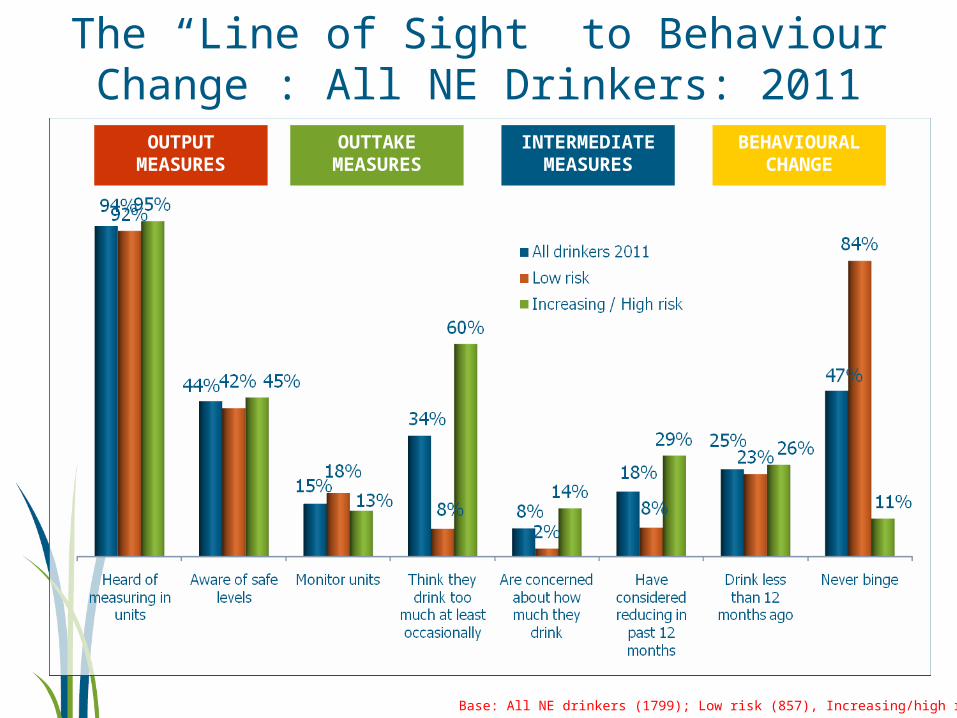
The “Line of Sight” to Behaviour Change : All NE Drinkers: 2011
BEHAVIOURAL CHANGE
INTERMEDIATE MEASURES
OUTTAKE MEASURES
OUTPUT MEASURES
Base: All NE drinkers (1799); Low risk (857), Increasing/high risk (942)