Embed Size (px)
Citation preview
Bakerboard Analog Electronics Trainer v1.1Operator's Guide
Written by Jonathan BaumgardnerCopyright © 2016
LumiDax Electronics Inc. Bakerboard v1.1 Operator's Manual Jonathan Baumgardner
Introduction
The LumiDax ® Bakerboard Analog Trainer (v1.1) is an all-in-one electronics lab. It features three power supplies, an audio-range function generator, oscilloscope, spectrum analyzer, and resistance checker - all conveniently attached to a large-surface breadboard for prototyping your projects. With this system, analog circuits such as operational amplifier circuits can be constructedeasily and tested for proper function.
Main Features
The Bakerboard is equipped with several useful pieces of test equipment in one convenient package. Figure 1, shown below, is a diagram showing the layout of the Bakerboard Analog Trainer.
Figure 1: Features of the LumiDax Bakerboard v1.1.
Table 1: List of Bakerboard v1.1 features.
1 Function generator control knobs. 8 Oscilloscope / analyzer cursor keys.
2 Function generator waveform select keys.
9 Function generator output.
3 Function generator range select keys. 10 Dual-channel oscilloscope inputs.
4 Function generator waveform / range ind.
11 Resistance checker terminals.
5 Full color 2.8” TFT display. 12 TTL clock output.
Page - 1 -
1
2
3
4
5
6
7
8
9
1011 12
1413
LumiDax Electronics Inc. Bakerboard v1.1 Operator's Manual Jonathan Baumgardner
6 DC jack for power supply (included.) 13 Solderless breadboard (attached below.)
7 Power switch. 14 -12V, +5V, +12V power supplies.Solderless Breadboard
One of the most useful features of the Bakerboard is the solderless breadboard, which allows you to build and test circuits without the need for solder and soldering irons. The solderless breadboardis designed such that the holes will accept leads for most electronics components and solid wires (don't use stranded wire – you'll never get it in,) holding them firmly and securely. Simply bend the leads, trim them with a pair of diagonal cutters, and push the wires into the holes. Removal is easy too - just gently pull. Take a look at Figure 2, shown below.
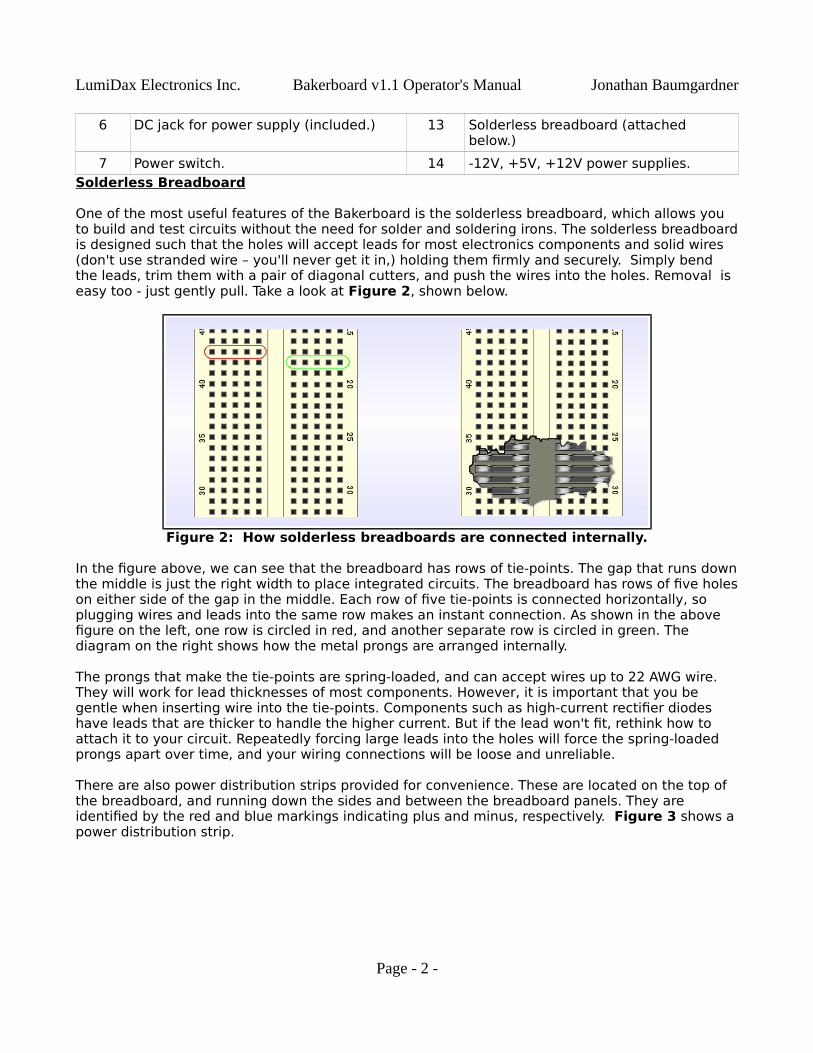
Figure 2: How solderless breadboards are connected internally.
In the figure above, we can see that the breadboard has rows of tie-points. The gap that runs downthe middle is just the right width to place integrated circuits. The breadboard has rows of five holeson either side of the gap in the middle. Each row of five tie-points is connected horizontally, so plugging wires and leads into the same row makes an instant connection. As shown in the above figure on the left, one row is circled in red, and another separate row is circled in green. The diagram on the right shows how the metal prongs are arranged internally.
The prongs that make the tie-points are spring-loaded, and can accept wires up to 22 AWG wire. They will work for lead thicknesses of most components. However, it is important that you be gentle when inserting wire into the tie-points. Components such as high-current rectifier diodes have leads that are thicker to handle the higher current. But if the lead won't fit, rethink how to attach it to your circuit. Repeatedly forcing large leads into the holes will force the spring-loaded prongs apart over time, and your wiring connections will be loose and unreliable.
There are also power distribution strips provided for convenience. These are located on the top of the breadboard, and running down the sides and between the breadboard panels. They are identified by the red and blue markings indicating plus and minus, respectively. Figure 3 shows a power distribution strip.
Page - 2 -
LumiDax Electronics Inc. Bakerboard v1.1 Operator's Manual Jonathan Baumgardner
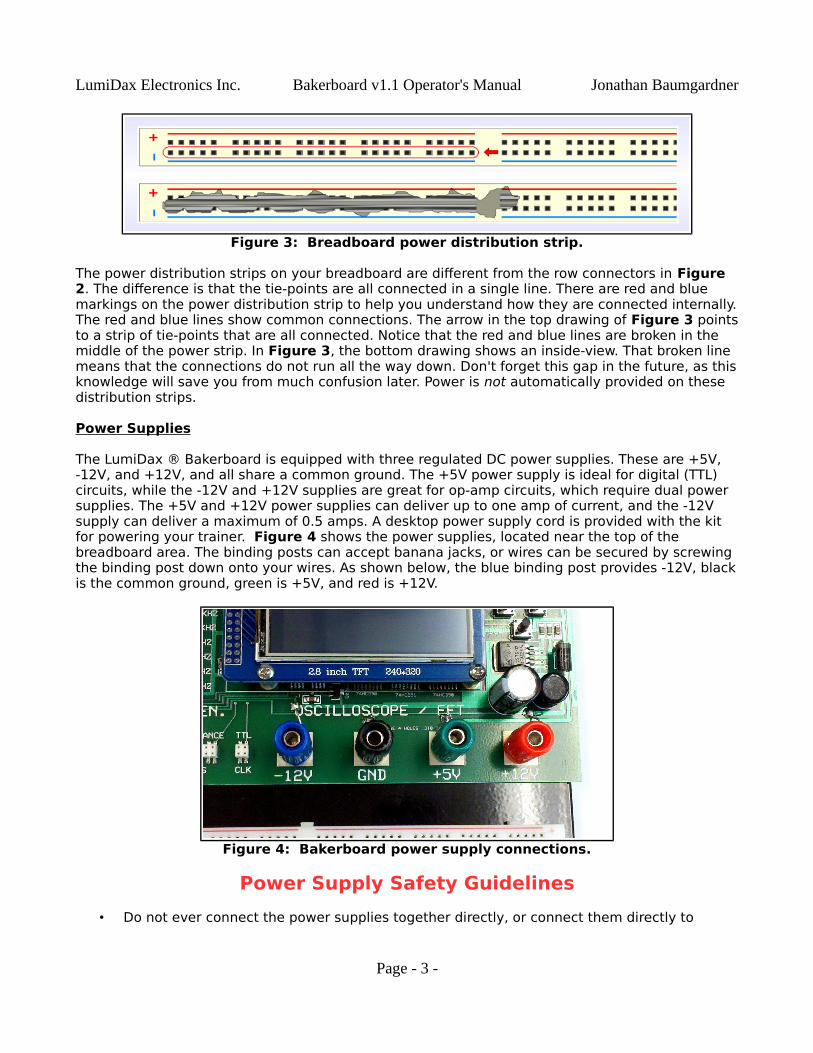
Figure 3: Breadboard power distribution strip.
The power distribution strips on your breadboard are different from the row connectors in Figure 2. The difference is that the tie-points are all connected in a single line. There are red and blue markings on the power distribution strip to help you understand how they are connected internally.The red and blue lines show common connections. The arrow in the top drawing of Figure 3 pointsto a strip of tie-points that are all connected. Notice that the red and blue lines are broken in the middle of the power strip. In Figure 3, the bottom drawing shows an inside-view. That broken line means that the connections do not run all the way down. Don't forget this gap in the future, as thisknowledge will save you from much confusion later. Power is not automatically provided on these distribution strips.
Power Supplies
The LumiDax ® Bakerboard is equipped with three regulated DC power supplies. These are +5V, -12V, and +12V, and all share a common ground. The +5V power supply is ideal for digital (TTL) circuits, while the -12V and +12V supplies are great for op-amp circuits, which require dual power supplies. The +5V and +12V power supplies can deliver up to one amp of current, and the -12V supply can deliver a maximum of 0.5 amps. A desktop power supply cord is provided with the kit for powering your trainer. Figure 4 shows the power supplies, located near the top of the breadboard area. The binding posts can accept banana jacks, or wires can be secured by screwing the binding post down onto your wires. As shown below, the blue binding post provides -12V, blackis the common ground, green is +5V, and red is +12V.
Figure 4: Bakerboard power supply connections.
Power Supply Safety Guidelines
• Do not ever connect the power supplies together directly, or connect them directly to
Page - 3 -
LumiDax Electronics Inc. Bakerboard v1.1 Operator's Manual Jonathan Baumgardner
ground.• Make sure your components can handle the power they are trying to dissipate.• These voltages are safe to handle with bare hands. Even so, please be aware of causing
shorts.• Don't spill liquids on the unit or expose to high levels of moisture. • Do not EVER use power supplies other than those provided with your unit. If you use a
higher voltage or current power supply, you risk damaging the test equipment, the breadboard, and your health.
• Try to keep your wiring neat. Loose wires and leads that are too long will encourage shorting.
• When removing integrated circuits (ICs,) use an IC puller. Using a screwdriver may damageyour unit.
• Don't eat over the Bakerboard Analog Trainer. Food will enter the holes, and will be very hard to clean.
• Try to keep the Bakerboard Analog Trainer in a safe place. A fall may damage the unit.• If you get a white screen, you have a short. Quickly unplug the unit and check your circuit.
Function Generator
The Bakerboard Analog Trainer features a function generator that can provide seven different waveforms in six different frequency ranges. Not only can the function generator create familiar sine, square, and triangle waveforms, but also ramp waves, narrow pulses, and white noise. This makes the function generator ideal for testing audio amplifiers and filters. Output frequency rangeis from 1 Hz to 32 KHz.
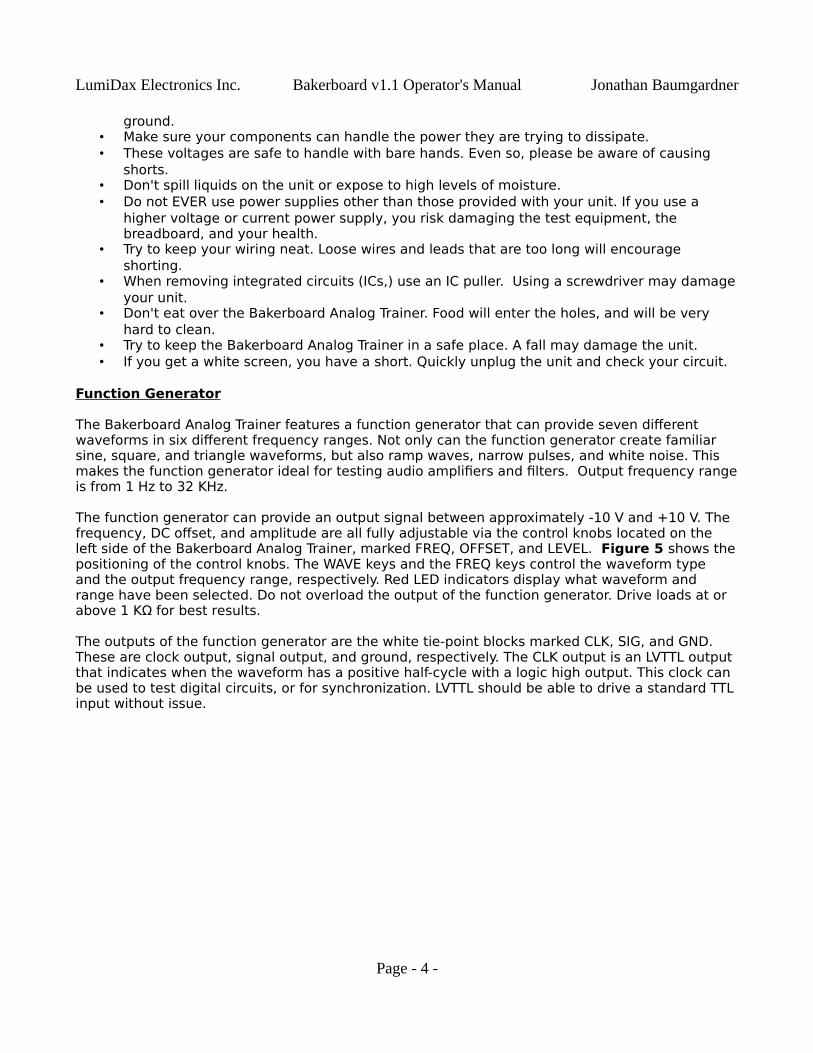
The function generator can provide an output signal between approximately -10 V and +10 V. The frequency, DC offset, and amplitude are all fully adjustable via the control knobs located on the left side of the Bakerboard Analog Trainer, marked FREQ, OFFSET, and LEVEL. Figure 5 shows thepositioning of the control knobs. The WAVE keys and the FREQ keys control the waveform type and the output frequency range, respectively. Red LED indicators display what waveform and range have been selected. Do not overload the output of the function generator. Drive loads at or above 1 KΩ for best results.
The outputs of the function generator are the white tie-point blocks marked CLK, SIG, and GND. These are clock output, signal output, and ground, respectively. The CLK output is an LVTTL output that indicates when the waveform has a positive half-cycle with a logic high output. This clock can be used to test digital circuits, or for synchronization. LVTTL should be able to drive a standard TTL input without issue.
Page - 4 -
LumiDax Electronics Inc. Bakerboard v1.1 Operator's Manual Jonathan Baumgardner
Figure 5: Function generator controls.Oscilloscope
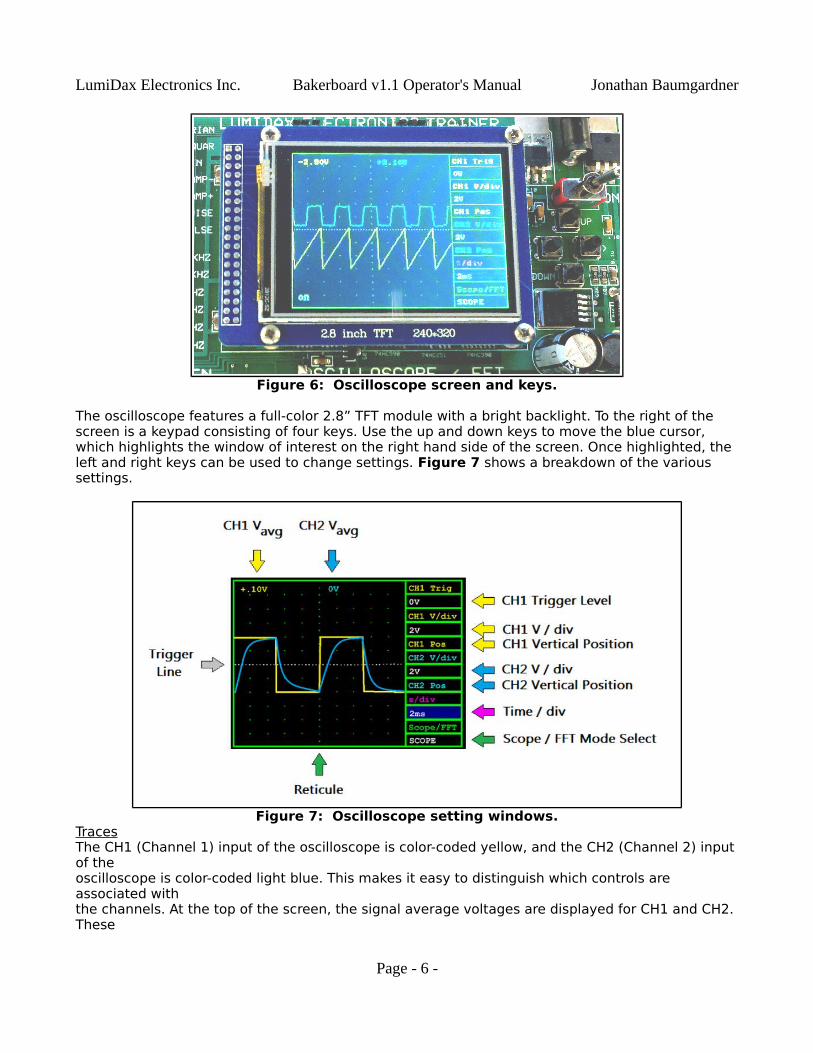
The Bakerboard Analog Trainer features a dual-channel 32 Khz (audio range) oscilloscope. It is ideal for testing audio amplifier circuits. It has an advanced front-end filter that prevents aliasing, or artifacts due to signals being outside the selected range. Figure 6 shows the position of the oscilloscope output screen and cursor control keys.
Page - 5 -
LumiDax Electronics Inc. Bakerboard v1.1 Operator's Manual Jonathan Baumgardner
Figure 6: Oscilloscope screen and keys.
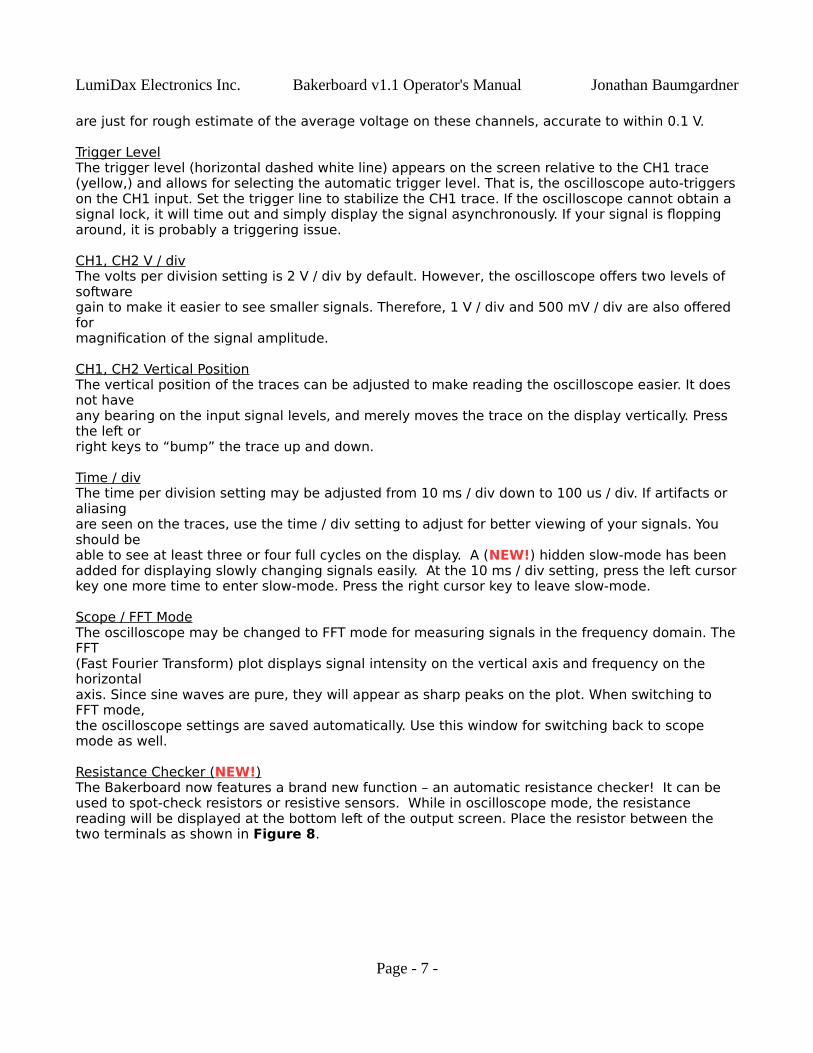
The oscilloscope features a full-color 2.8” TFT module with a bright backlight. To the right of the screen is a keypad consisting of four keys. Use the up and down keys to move the blue cursor, which highlights the window of interest on the right hand side of the screen. Once highlighted, the left and right keys can be used to change settings. Figure 7 shows a breakdown of the various settings.
Figure 7: Oscilloscope setting windows.TracesThe CH1 (Channel 1) input of the oscilloscope is color-coded yellow, and the CH2 (Channel 2) inputof the oscilloscope is color-coded light blue. This makes it easy to distinguish which controls are associated with the channels. At the top of the screen, the signal average voltages are displayed for CH1 and CH2. These
Page - 6 -
LumiDax Electronics Inc. Bakerboard v1.1 Operator's Manual Jonathan Baumgardner
are just for rough estimate of the average voltage on these channels, accurate to within 0.1 V.
Trigger LevelThe trigger level (horizontal dashed white line) appears on the screen relative to the CH1 trace (yellow,) and allows for selecting the automatic trigger level. That is, the oscilloscope auto-triggerson the CH1 input. Set the trigger line to stabilize the CH1 trace. If the oscilloscope cannot obtain a signal lock, it will time out and simply display the signal asynchronously. If your signal is flopping around, it is probably a triggering issue.
CH1, CH2 V / divThe volts per division setting is 2 V / div by default. However, the oscilloscope offers two levels of software gain to make it easier to see smaller signals. Therefore, 1 V / div and 500 mV / div are also offered for magnification of the signal amplitude.
CH1, CH2 Vertical PositionThe vertical position of the traces can be adjusted to make reading the oscilloscope easier. It does not have any bearing on the input signal levels, and merely moves the trace on the display vertically. Press the left or right keys to “bump” the trace up and down.
Time / divThe time per division setting may be adjusted from 10 ms / div down to 100 us / div. If artifacts or aliasing are seen on the traces, use the time / div setting to adjust for better viewing of your signals. You should be able to see at least three or four full cycles on the display. A (NEW!) hidden slow-mode has been added for displaying slowly changing signals easily. At the 10 ms / div setting, press the left cursorkey one more time to enter slow-mode. Press the right cursor key to leave slow-mode.
Scope / FFT ModeThe oscilloscope may be changed to FFT mode for measuring signals in the frequency domain. TheFFT (Fast Fourier Transform) plot displays signal intensity on the vertical axis and frequency on the horizontal axis. Since sine waves are pure, they will appear as sharp peaks on the plot. When switching to FFT mode,the oscilloscope settings are saved automatically. Use this window for switching back to scope mode as well.
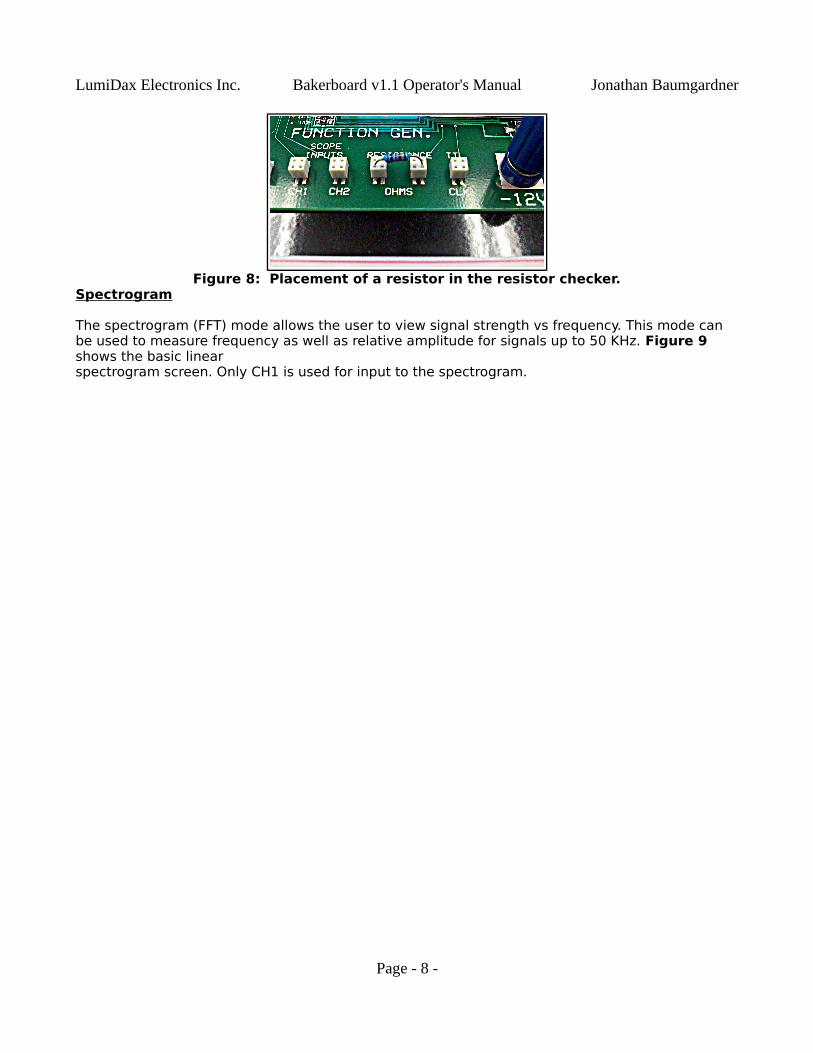
Resistance Checker ( NEW! )The Bakerboard now features a brand new function – an automatic resistance checker! It can be used to spot-check resistors or resistive sensors. While in oscilloscope mode, the resistance reading will be displayed at the bottom left of the output screen. Place the resistor between the two terminals as shown in Figure 8.
Page - 7 -
LumiDax Electronics Inc. Bakerboard v1.1 Operator's Manual Jonathan Baumgardner
Figure 8: Placement of a resistor in the resistor checker.Spectrogram
The spectrogram (FFT) mode allows the user to view signal strength vs frequency. This mode can be used to measure frequency as well as relative amplitude for signals up to 50 KHz. Figure 9 shows the basic linearspectrogram screen. Only CH1 is used for input to the spectrogram.
Page - 8 -
LumiDax Electronics Inc. Bakerboard v1.1 Operator's Manual Jonathan Baumgardner
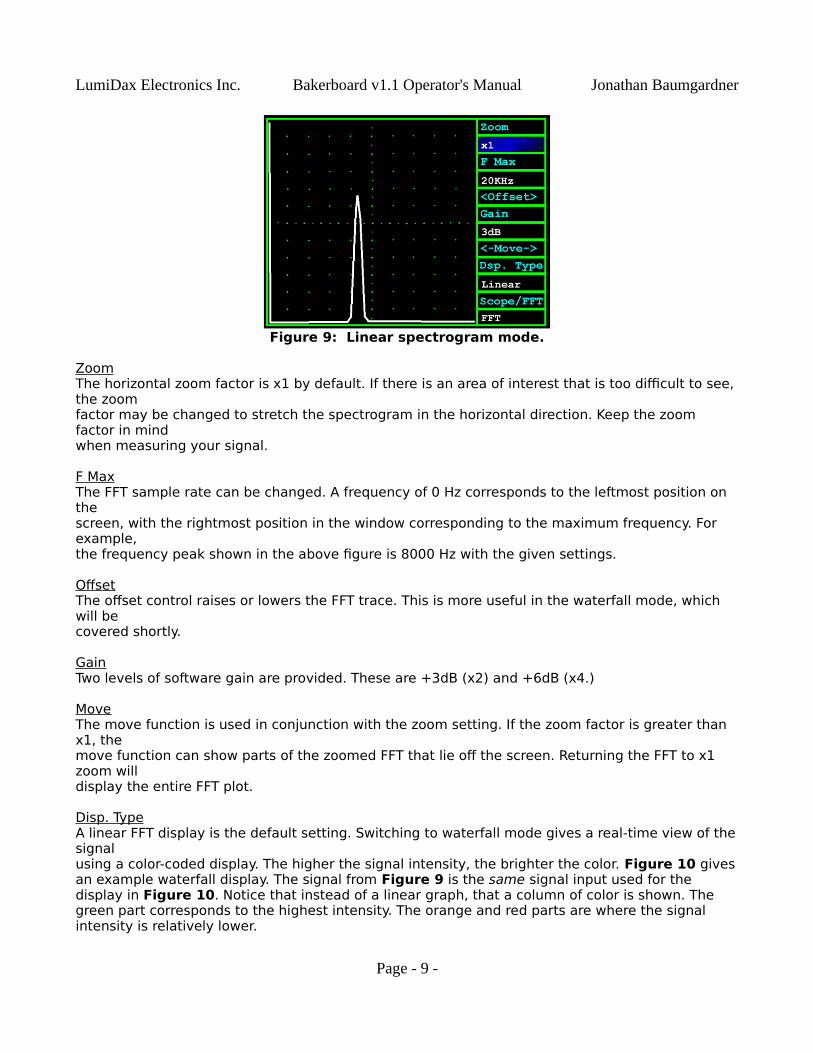
Figure 9: Linear spectrogram mode.
ZoomThe horizontal zoom factor is x1 by default. If there is an area of interest that is too difficult to see,the zoom factor may be changed to stretch the spectrogram in the horizontal direction. Keep the zoom factor in mind when measuring your signal.
F MaxThe FFT sample rate can be changed. A frequency of 0 Hz corresponds to the leftmost position on the screen, with the rightmost position in the window corresponding to the maximum frequency. For example, the frequency peak shown in the above figure is 8000 Hz with the given settings.
OffsetThe offset control raises or lowers the FFT trace. This is more useful in the waterfall mode, which will be covered shortly.
GainTwo levels of software gain are provided. These are +3dB (x2) and +6dB (x4.)
MoveThe move function is used in conjunction with the zoom setting. If the zoom factor is greater than x1, the move function can show parts of the zoomed FFT that lie off the screen. Returning the FFT to x1 zoom will display the entire FFT plot.
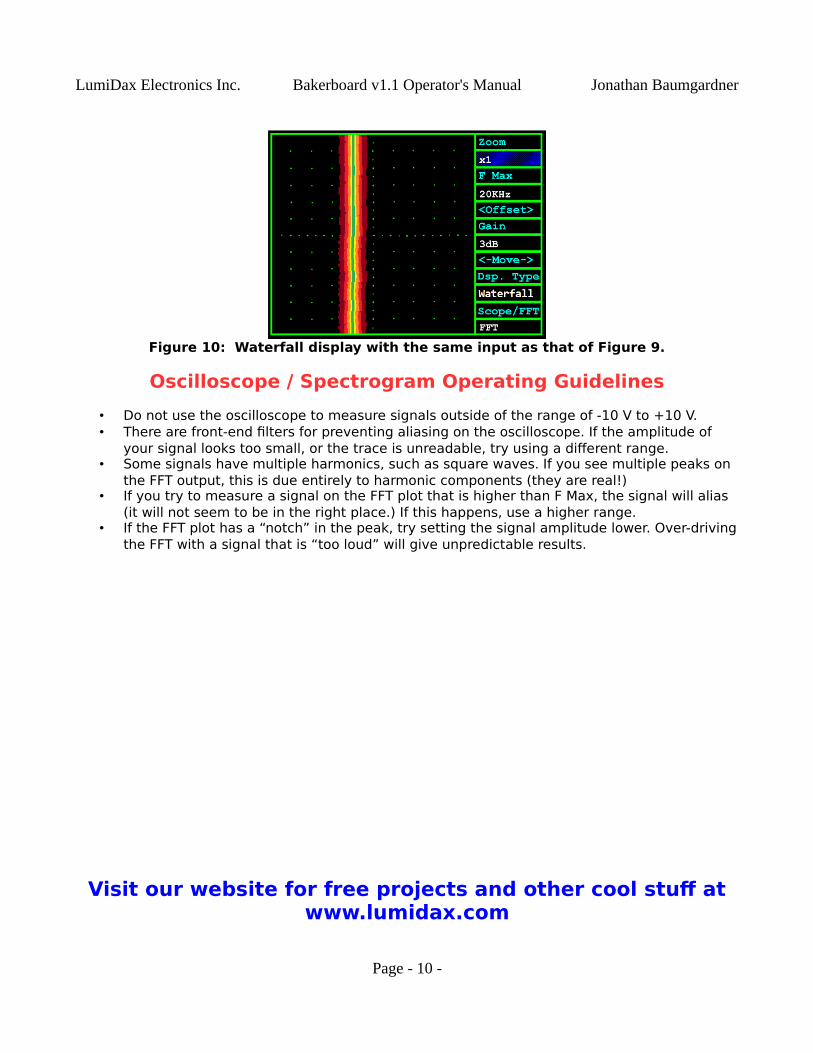
Disp. TypeA linear FFT display is the default setting. Switching to waterfall mode gives a real-time view of thesignal using a color-coded display. The higher the signal intensity, the brighter the color. Figure 10 givesan example waterfall display. The signal from Figure 9 is the same signal input used for the display in Figure 10. Notice that instead of a linear graph, that a column of color is shown. The green part corresponds to the highest intensity. The orange and red parts are where the signal intensity is relatively lower.
Page - 9 -
LumiDax Electronics Inc. Bakerboard v1.1 Operator's Manual Jonathan Baumgardner
Figure 10: Waterfall display with the same input as that of Figure 9.
Oscilloscope / Spectrogram Operating Guidelines
• Do not use the oscilloscope to measure signals outside of the range of -10 V to +10 V.• There are front-end filters for preventing aliasing on the oscilloscope. If the amplitude of
your signal looks too small, or the trace is unreadable, try using a different range.• Some signals have multiple harmonics, such as square waves. If you see multiple peaks on
the FFT output, this is due entirely to harmonic components (they are real!) • If you try to measure a signal on the FFT plot that is higher than F Max, the signal will alias
(it will not seem to be in the right place.) If this happens, use a higher range.• If the FFT plot has a “notch” in the peak, try setting the signal amplitude lower. Over-driving
the FFT with a signal that is “too loud” will give unpredictable results.
Visit our website for free projects and other cool stuff atwww.lumidax.com
Page - 10 -