Embed Size (px)
Citation preview
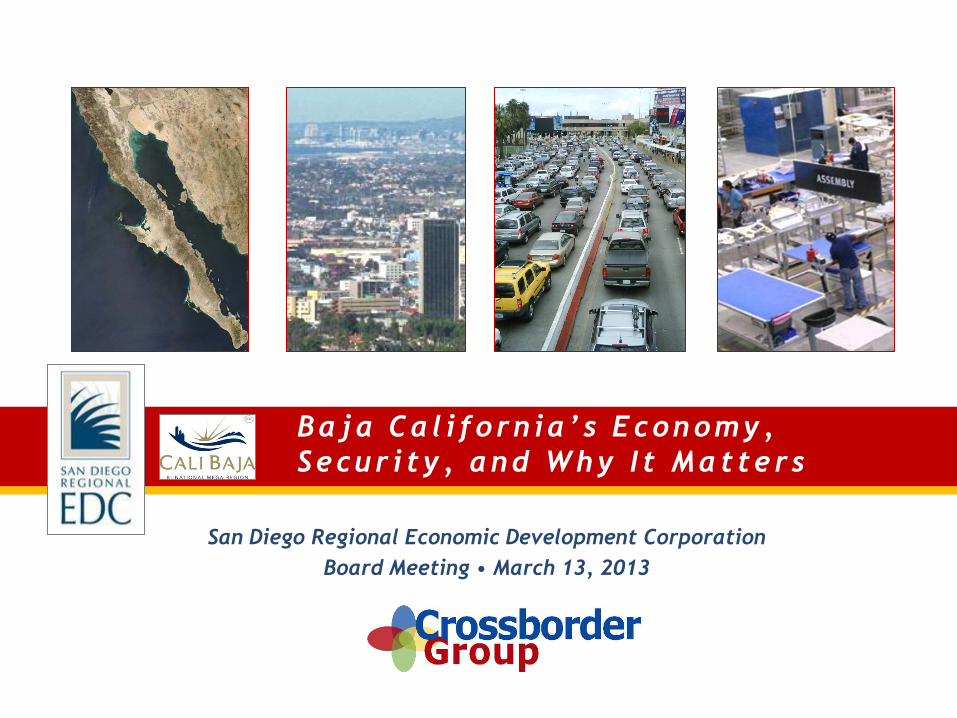
Baja Ca l i forn ia’ s Economy,
Secur i ty , and Why I t Matters
San Diego Regional Economic Development Corporation
Board Meeting • March 13, 2013
…Some (Possibly)
Surprising Manufacturing
& Trade Numbers
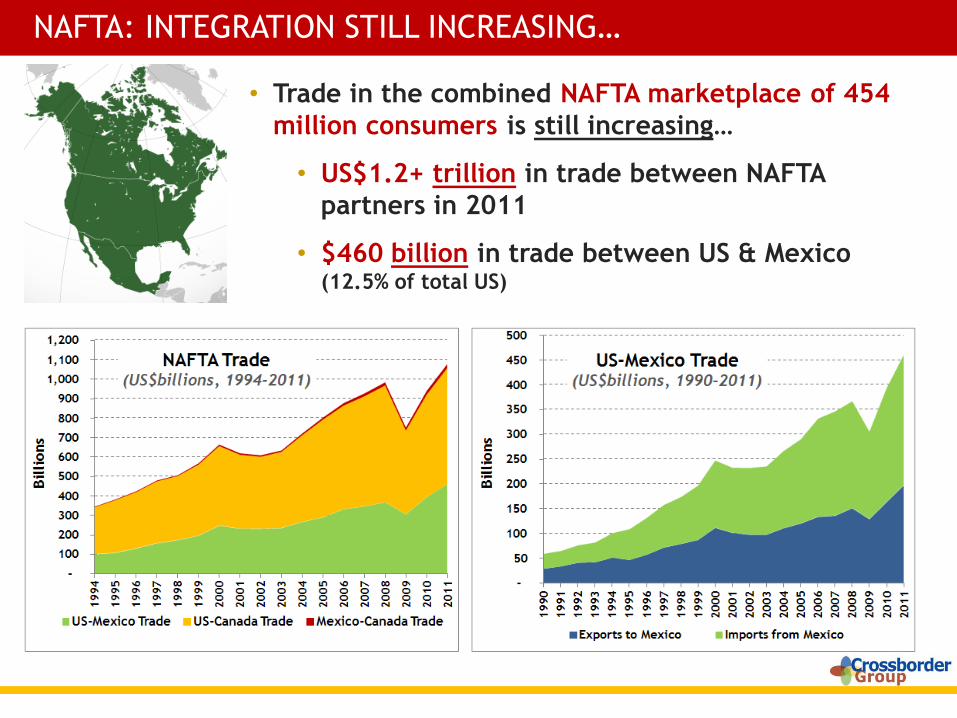
• Trade in the combined NAFTA marketplace of 454
million consumers is still increasing…
• US$1.2+ trillion in trade between NAFTA
partners in 2011
• $460 billion in trade between US & Mexico (12.5% of total US)
NAFTA: INTEGRATION STILL INCREASING…
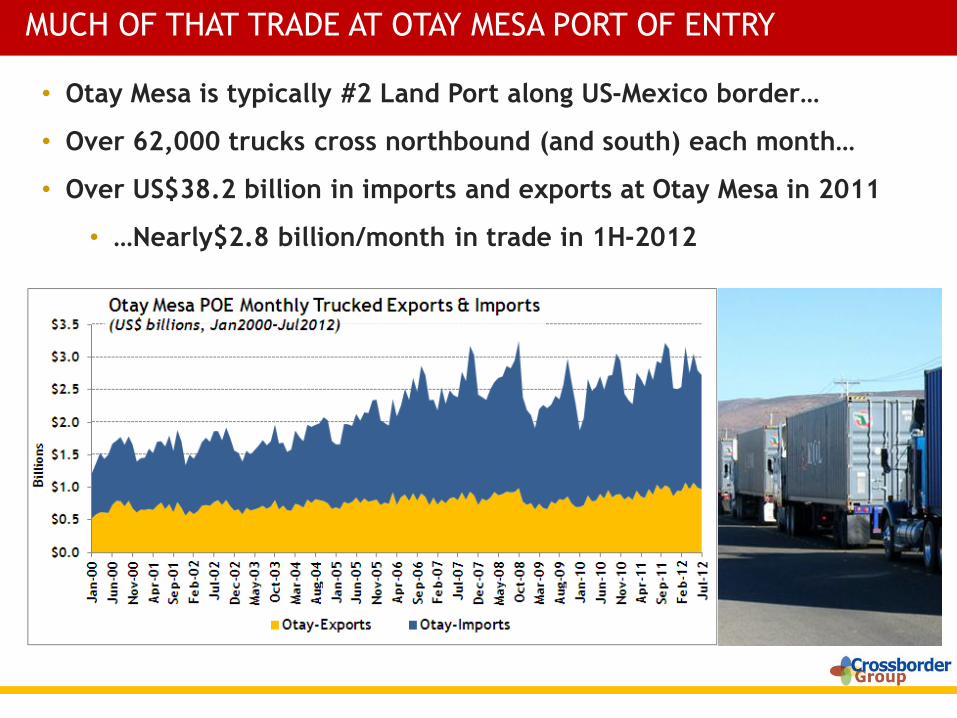
• Otay Mesa is typically #2 Land Port along US-Mexico border…
• Over 62,000 trucks cross northbound (and south) each month…
• Over US$38.2 billion in imports and exports at Otay Mesa in 2011
• …Nearly$2.8 billion/month in trade in 1H-2012
MUCH OF THAT TRADE AT OTAY MESA PORT OF ENTRY
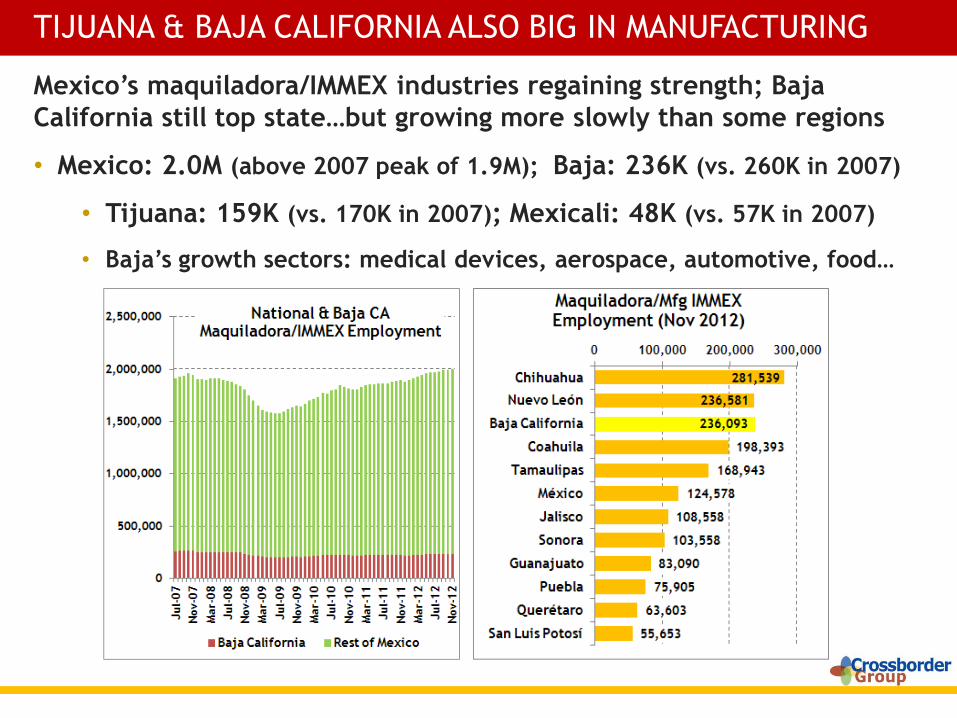
Mexico’s maquiladora/IMMEX industries regaining strength; Baja
California still top state…but growing more slowly than some regions
• Mexico: 2.0M (above 2007 peak of 1.9M); Baja: 236K (vs. 260K in 2007)
• Tijuana: 159K (vs. 170K in 2007); Mexicali: 48K (vs. 57K in 2007)
• Baja’s growth sectors: medical devices, aerospace, automotive, food…
TIJUANA & BAJA CALIFORNIA ALSO BIG IN MANUFACTURING
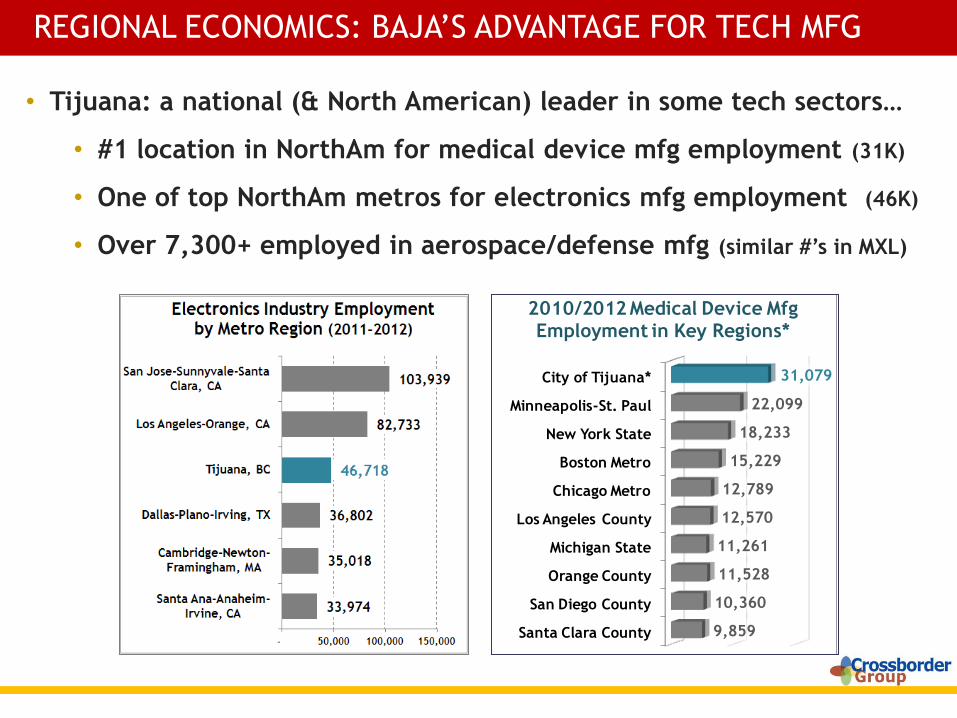
• Tijuana: a national (& North American) leader in some tech sectors…
• #1 location in NorthAm for medical device mfg employment (31K)
• One of top NorthAm metros for electronics mfg employment (46K)
• Over 7,300+ employed in aerospace/defense mfg (similar #’s in MXL)
REGIONAL ECONOMICS: BAJA’S ADVANTAGE FOR TECH MFG
Santa Clara County
San Diego County
Orange County
Michigan State
Los Angeles County
Chicago Metro
Boston Metro
New York State
Minneapolis-St. Paul
City of Tijuana*
9,859
10,360
11,528
11,261
12,570
12,789
15,229
18,233
22,099
31,079
2010/2012 Medical Device Mfg Employment in Key Regions*
*data for Q2-2012 *see endnotes for estimation methodology used

WHY IS MEXICO’S MANUFACTURING GROWING?
There has been persistent trend for manufacturing labor cost
increases in rest of North America…and many other markets
• Labors costs for Mexico manufacturing have relatively flat (in US$)
• Costs higher in Brazil – and (possibly) soon China
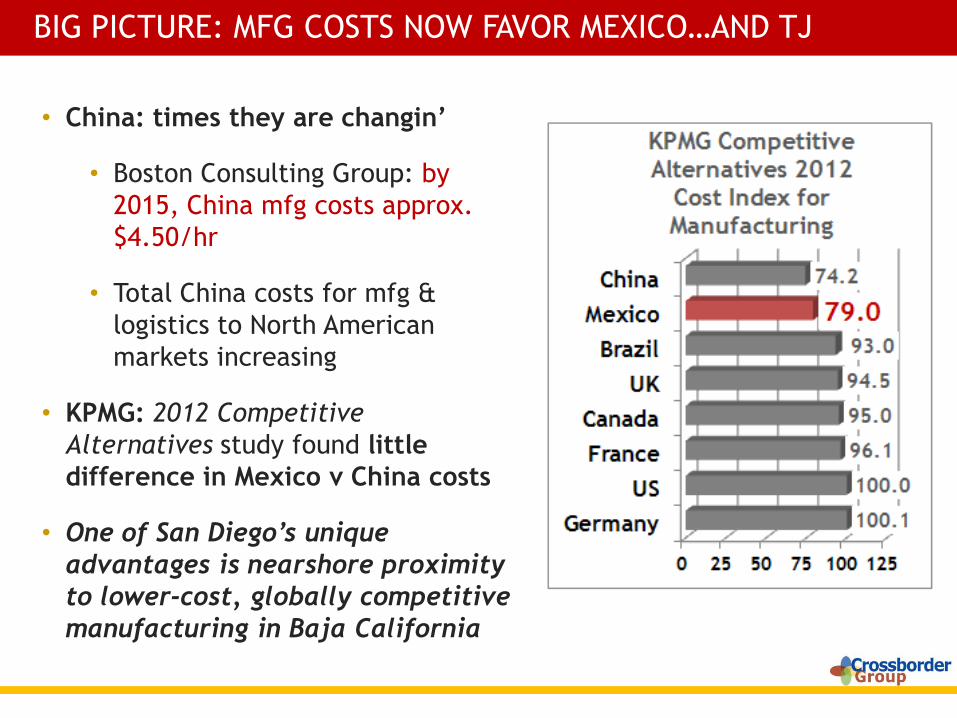
• China: times they are changin’
• Boston Consulting Group: by
2015, China mfg costs approx.
$4.50/hr
• Total China costs for mfg &
logistics to North American
markets increasing
• KPMG: 2012 Competitive
Alternatives study found little
difference in Mexico v China costs
• One of San Diego’s unique
advantages is nearshore proximity
to lower-cost, globally competitive
manufacturing in Baja California
BIG PICTURE: MFG COSTS NOW FAVOR MEXICO…AND TJ
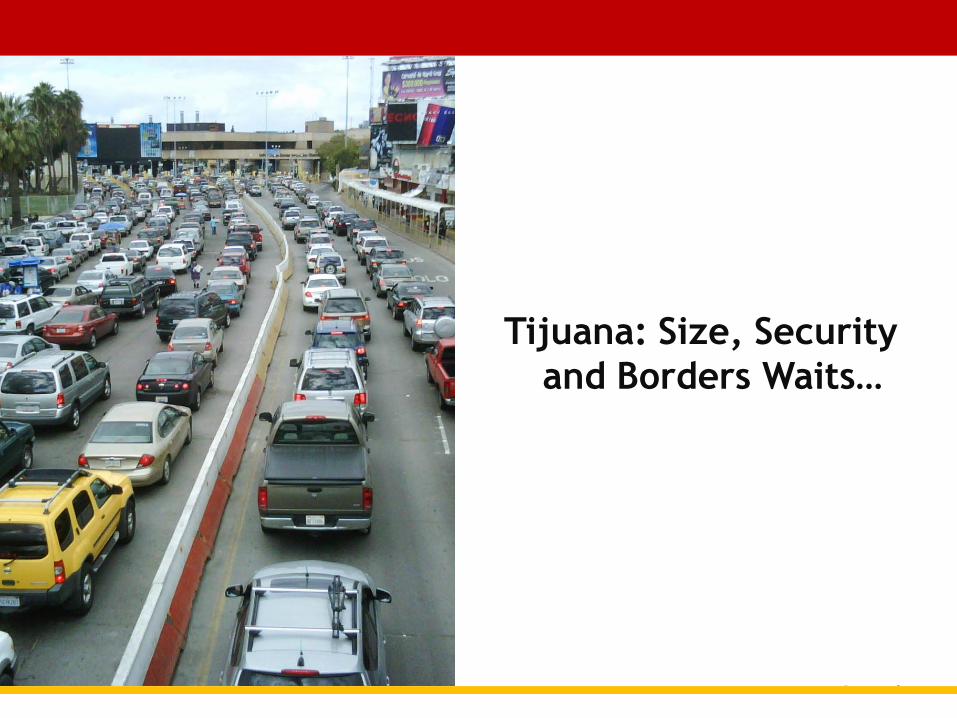
Tijuana: Size, Security
and Borders Waits…
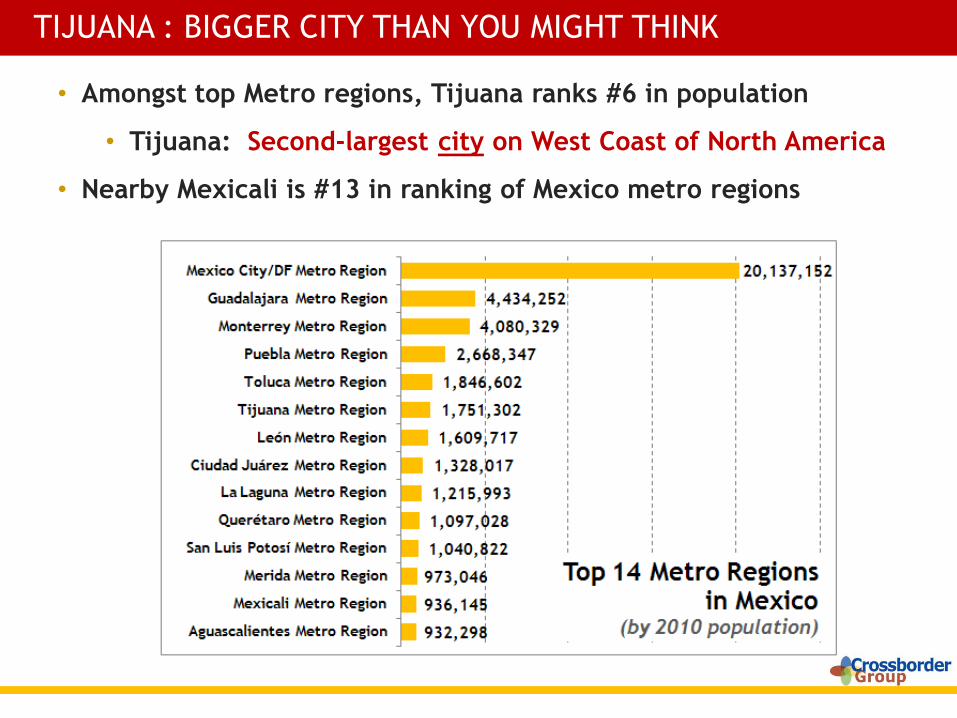
• Amongst top Metro regions, Tijuana ranks #6 in population
• Tijuana: Second-largest city on West Coast of North America
• Nearby Mexicali is #13 in ranking of Mexico metro regions
TIJUANA : BIGGER CITY THAN YOU MIGHT THINK
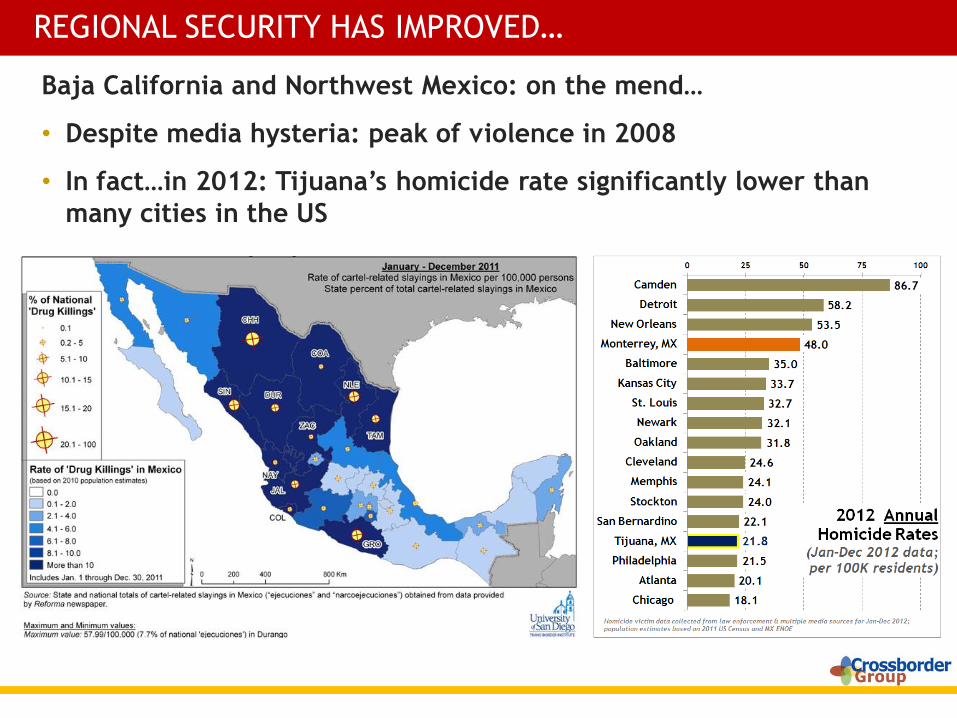
Baja California and Northwest Mexico: on the mend…
• Despite media hysteria: peak of violence in 2008
• In fact…in 2012: Tijuana’s homicide rate significantly lower than
many cities in the US
REGIONAL SECURITY HAS IMPROVED…
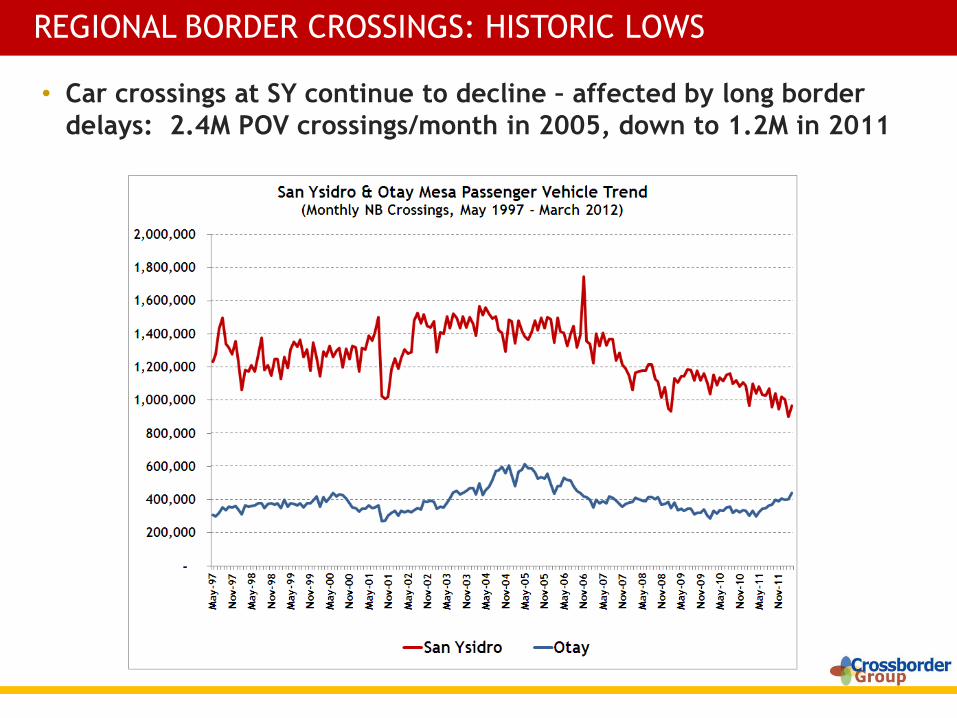
• Car crossings at SY continue to decline – affected by long border
delays: 2.4M POV crossings/month in 2005, down to 1.2M in 2011
REGIONAL BORDER CROSSINGS: HISTORIC LOWS

• To-date, very few efforts to accurately measure border wait times
at San Ysidro and Otay Mesa…
• SANDAG & Caltrans changing that: border wait time study
underway (with a bit of help from Crossborder Group)
LITTLE BORDER DELAY DATA…SO FAR

• Yet: too-little (+ delayed) funds for POEs (SY, Otay & Otay East)
• Around $2-3 billion needed just for California-Baja CA POEs
BORDER CROSSINGS – PLANNED…BUT NOT ENOUGH $$
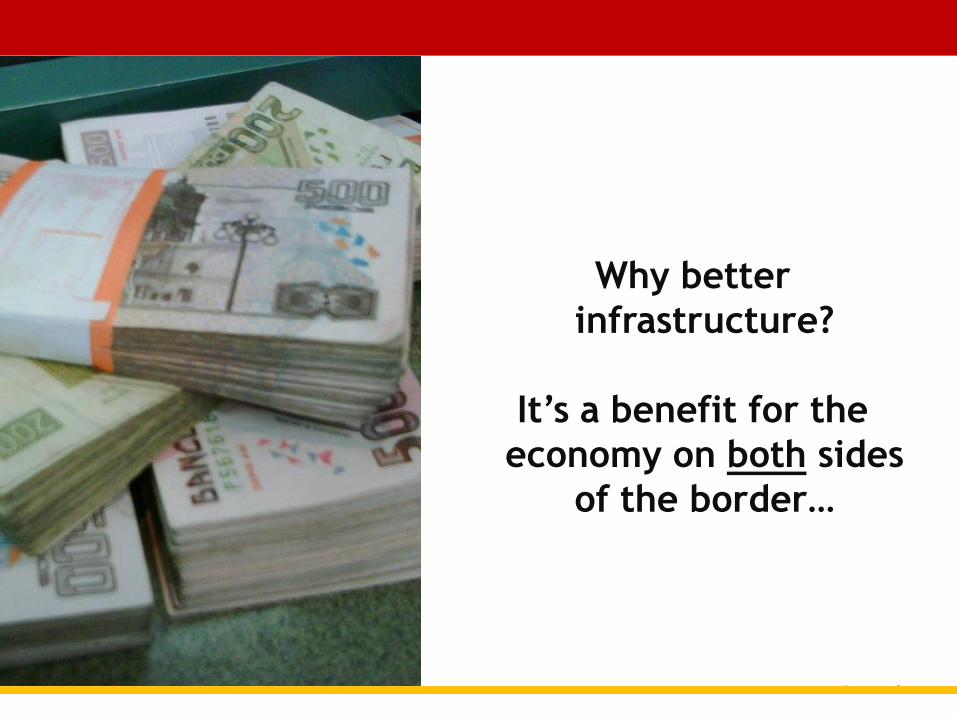
Why better
infrastructure?
It’s a benefit for the
economy on both sides
of the border…
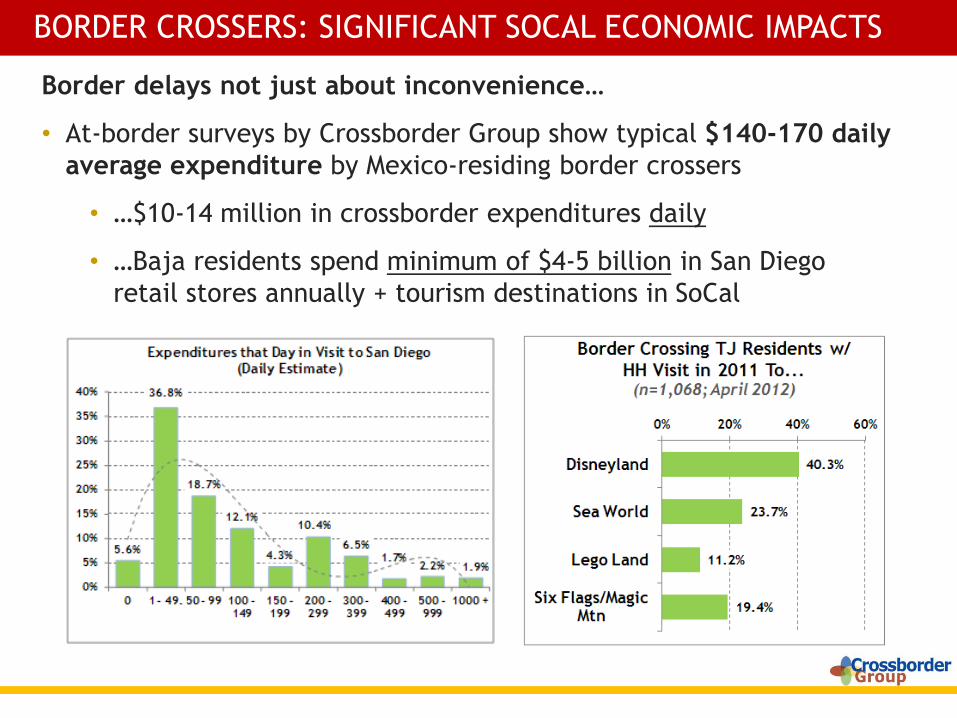
Border delays not just about inconvenience…
• At-border surveys by Crossborder Group show typical $140-170 daily
average expenditure by Mexico-residing border crossers
• …$10-14 million in crossborder expenditures daily
• …Baja residents spend minimum of $4-5 billion in San Diego
retail stores annually + tourism destinations in SoCal
BORDER CROSSERS: SIGNIFICANT SOCAL ECONOMIC IMPACTS
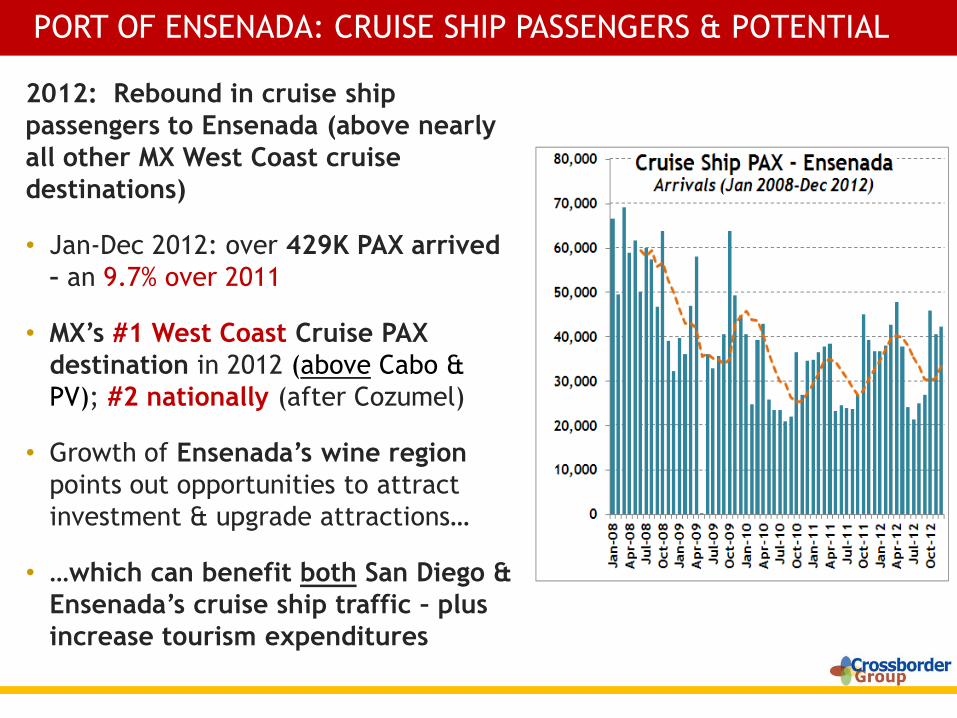
2012: Rebound in cruise ship
passengers to Ensenada (above nearly
all other MX West Coast cruise
destinations)
• Jan-Dec 2012: over 429K PAX arrived
– an 9.7% over 2011
• MX’s #1 West Coast Cruise PAX
destination in 2012 (above Cabo &
PV); #2 nationally (after Cozumel)
• Growth of Ensenada’s wine region
points out opportunities to attract
investment & upgrade attractions…
• …which can benefit both San Diego &
Ensenada’s cruise ship traffic – plus
increase tourism expenditures
PORT OF ENSENADA: CRUISE SHIP PASSENGERS & POTENTIAL
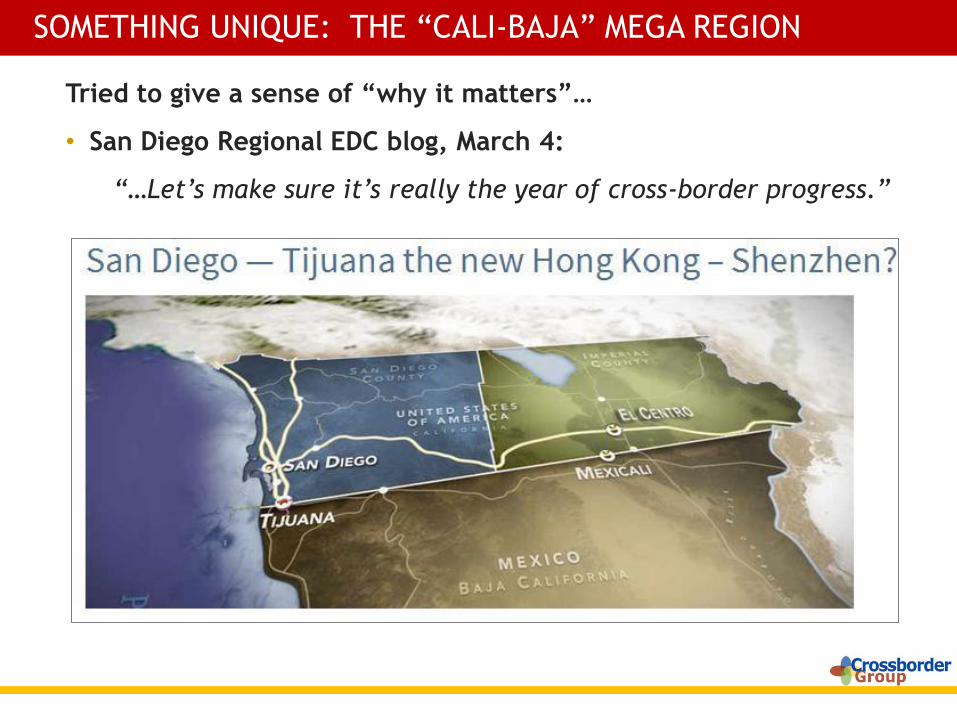
SOMETHING UNIQUE: THE “CALI-BAJA” MEGA REGION
Tried to give a sense of “why it matters”…
• San Diego Regional EDC blog, March 4:
“…Let’s make sure it’s really the year of cross-border progress.”
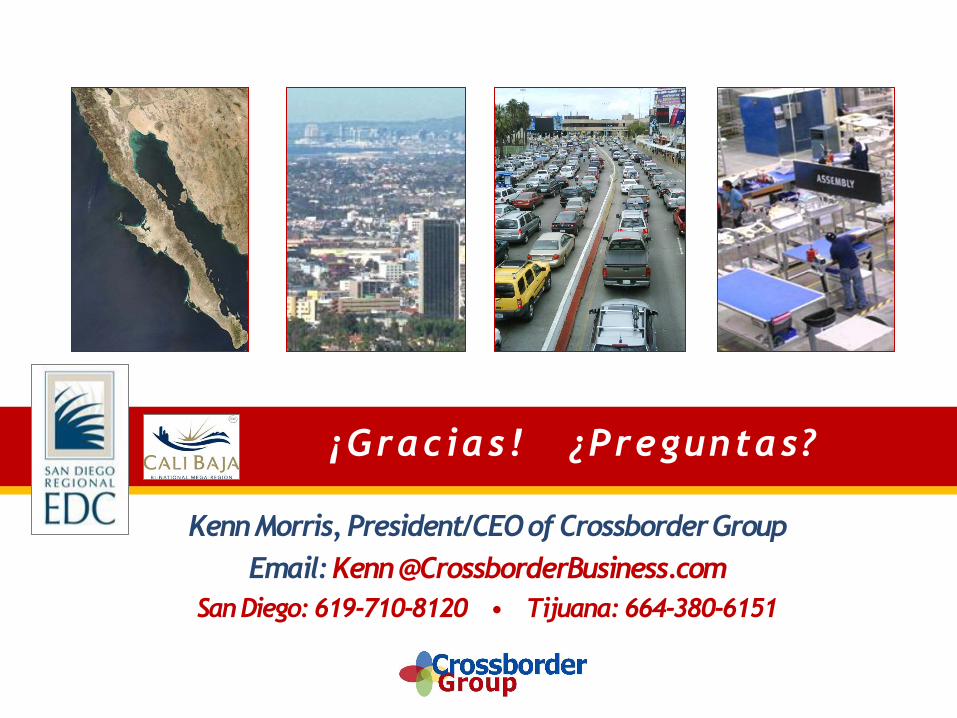
¡Gracias! ¿Preguntas?
Kenn Morris, President/CEO of Crossborder Group
Email: Kenn @CrossborderBusiness.com
San Diego: 619-710-8120 • Tijuana: 664-380-6151


![[Please list the analysis conducted] - Baja SAE Baja SAE Redesign Comparison... · Web view2016 Baja SAE Design Comparison Document 2016 Baja SAE Design Comparison Document 2016 Baja](https://img.pdfslide.us/doc/110x75/5ab1e61b7f8b9a284c8d112e/please-list-the-analysis-conducted-baja-baja-sae-redesign-comparisonweb-view2016.jpg)