Embed Size (px)
Citation preview
7222019 Bain amp Co- European Banking Report
httpslidepdfcomreaderfullbain-co-european-banking-report 132
EUROPEAN BANKING
Striking the right balance between risk and return
By Walter Sinn Rocco DrsquoAcunto and Andrea Oldrini
7222019 Bain amp Co- European Banking Report
httpslidepdfcomreaderfullbain-co-european-banking-report 232
Copyright copy 2013 Bain amp Company Inc All rights reserved
Walter Sinn is a Bain amp Company partner based in the firmrsquos Frankfurt office
Rocco DrsquoAcunto is a partner based in Bainrsquos Milan office Andrea Oldrini is a
manager based in Milan They are all members of Bainrsquos European Financial
Services practice
7222019 Bain amp Co- European Banking Report
httpslidepdfcomreaderfullbain-co-european-banking-report 332
European banking | Bain amp Company Inc
Page 1
Contents
European banking Striking the right balance between risk and return 2
1 Five years of RoRWA in Europe A bumpy landscape 7
2 Country and cluster league tables 17
3 Strategic perspectives and implications for management 23
7222019 Bain amp Co- European Banking Report
httpslidepdfcomreaderfullbain-co-european-banking-report 432
European banking | Bain amp Company Inc
Page 2
European banking Striking the right balance between risk and return
Now that risk figures so prominently in European banking itrsquos time to raise the profile of a metric that has playeda minor role to date
This benchmarkmdashthe rate of return on risk-weighted assets or RoRWAmdashreliably integrates a balance-sheet-
management perspective with the revenue and cost side of the business Based on a comprehensive analysis of
121 banks across Europe by Bain amp Company RoRWA clearly emerges as the single most practical measure to
help senior bank executives manage their companiesrsquo performance and make savvy risk-reward decisions
Our analysis shows how and where the quality of management plays a major role in determining performance
Thatrsquos especially true in the core European countries where banks canrsquot rely on economic growth to lift their fortunes
Why does RoRWA deserve more respect now Five years since the global financial crisis bankers across Europe
still find themselves waging battle on many fronts Low interest rates a loss of customersrsquo trust stiff new targetcapital requirements and regulatory mandates have compounded the difficulty of operating in weak eurozone
economies On the cost side moreover banks are reconfiguring their distribution networks and streamlining
operations Yet even as revenue growth flattens and new digital technologies push up capital investments banks
are not making much headway on reining in costs
Indeed the banking industry is going through a major restructuring and only the fittest will survive this Darwinian
process The traditional tools that bankers have used to chart their competitive courses provide an inadequate map
for navigating treacherous new terrain With capital adequacy asset quality and broad macroeconomic trends
playing more prominent roles in shaping a bankrsquos financial performance it is the balance sheet not the profit-
and-loss statement which better captures the bankrsquos overall health and points to the areas that most need improvement
Todayrsquos environment of disruptive change calls for a holistic yet simple view of the returns that banks generate
on every unit of capital they commit to their businesses on a risk-adjusted basis
RoRWA fits the bill Other measures may be more precise in understanding risk theoretically but theyrsquore
impractical to use in managing the enterprise RoRWArsquos strength lies in using a well-understood measuremdash
risk-weighted assetsmdashas a denominator making it a good proxy for risk
For business leaders RoRWA and the analysis of key components can provide practical guidance to optimize
bank performance across four dimensions
bull First RoRWA tracks how well a bank manages its balance sheet and appetite for risk Managers can see
whether they are properly pricing offerings to reflect their risk and cost and how well they are allocating
capital to business areas and products that generate higher returns
bull Second the benchmark guides decisions on how a bank factors in risk to its cross-selling opportunities that
bring in fees commissions and other revenues
bull Third on the cost side a RoRWA approach reveals the cost efficiency per unit of risk for the volume of
business a bank generates
bull Fourth RoRWA shines a light on the cost of risk by disclosing how well a bank is able to minimize its loan-loss
provisions on a risk-adjusted basis
7222019 Bain amp Co- European Banking Report
httpslidepdfcomreaderfullbain-co-european-banking-report 532
European banking | Bain amp Company Inc
Page 3
Beyond its value as a guide for bringing risk and capital to the forefront in managing a bankrsquos internal performance
RoRWA also can serve as a powerful tool for external communications Executives regulators and investors can
see in a single number (supported by a few key components) how a bank stacks up against its direct competitorsacross different regions
Based on the RoRWA metric Bain undertook a comprehensive analysis of conditions influencing risk-weighted
returns across Europe Our analysis spans 12 core EU countries and the four fast-growing markets of the
Commonwealth of Independent States (CIS) Poland South Africa and Turkey from the onset of the global
economic crisis in 2008 through the end of 2012 We conducted an in-depth examination of 121 banks ranging
from the largest globe-spanning institutions headquartered in Europe and other large banks that operate sub-
sidiaries beyond their home countries to smaller local or regional banks Together the institutions we evaluated
cover at least 70 of their respective markets
The charts on the following pages highlight three major findings
Economic growth counts but management effectiveness plays a critical role Overall RoRWA correlated strongly
with GDP growth trends in the markets we examined Our analysis revealed a dramatic gap between the general
underperformance of banks in the core European countriesmdashwhose economies have largely stagnated or re-
mained mired in recessionmdashand the stronger risk-weighted returns posted by banks based in markets that experi-
enced more rapidly expanding GDP
Yet analysis of bank-level data also showed a wide variance in the performance of institutions competing within
individual markets For example in the slow-growth mostly core European markets where GDP ranged from
RoRWA reflects performance across four key dimensions
Source Bain analysis
= Net interest incomeRWA + + ndashndashFinancial margin
RWA
Fees andcommissions
andother revenues
RWA
Operatingexpenditure
RWA
Loan-lossprovisions
RWA
Measures abankrsquos abilityto cross-sellreflecting theindividual clientrsquos
level of risk
Cross-selling
Measures thecost efficiencyof productionindependent of any pricing and
income effects
Cost structure
Measures thelosses writtenoff against theamount ofrisk taken
Cost of risk
Combines two skills
bull Pricing based on risk and cost
bull Better allocation of capital to business areas and products
with higher returns
Balance-sheet management
Pretax operating results
Total RWA
7222019 Bain amp Co- European Banking Report
httpslidepdfcomreaderfullbain-co-european-banking-report 632
European banking | Bain amp Company Inc
Page 4
negative 10 to 5 over the five-year period RoRWA by bank varied widely in every year Clearly for these
markets the quality of an individual bankrsquos management plays a major role in determining performance
In markets where GDP growth exceeded 5 by contrast we found considerably less variation in bank-level
RoRWA performance As the rising tide lifted all banks managementrsquos role in shaping returns appears to have
been more circumscribed
Most banks fail to earn their cost of capital Bain determined that the RoRWA required for banks to cover their
cost of capital fell within a range of 16 to 21 depending on a bankrsquos size and the country in which it is based
The RoRWA of most banks has failed to clear that cost-of-capital hurdle on average in any year since 2008
falling well short in every year except 2010 Once again however we found a wide variation between the bank
performance in the core European countries where RoRWA was consistently below the cost of capital and that
in the high-growth countries where RoRWA easily cleared the capital-cost bar
Looking at the banksrsquo underlying strengths and weaknesses by market we identified several major pain points
that pinched banksrsquo RoRWAs in the core European countries
The need to shed debt and rely on higher-cost equity to strengthen their balance sheets reduced these banksrsquo total
risk-weighted assets by nearly 8 between 2008 and 2012 Meanwhile their cost of risk increased sharply as
stagnant or shrinking economies forced them to boost their loan-loss provisions in the face of steeper write-offs
of bad credit Interest margins that remained at low levels shrinking fee incomes and higher operating costs also
added downward pressure to banksrsquo RoRWAs
Size matters Within core Europe the 10 biggest pan-European banks (by total assets and market capitalization)
fared best overall Helped by large increases in net interest income and strong improvements in financial margins
their RoRWAs came closest to earning their cost of capital
Other large European banks with subsidiaries outside their home countries reduced their operating costs partially
offsetting declines in risk-weighted fee income and higher loan-loss provisions But the RoRWAs for these
banks still failed to clear their cost-of-capital hurdle
Local banks in core Europe struggled weighed down by nonperforming loans and flat revenues Their RoRWAs
were negative in both 2008 and 2012 and did not come close to covering their cost of capital
Turning to country differences the four high-growth countries on the fringe of Europe the Middle East and Africa
have the wind at their backs Turkey ranked first in RoRWA for 2012 and it has jockeyed for top billing with
Poland and South Africa over the past five years
Countries in core Europersquos northern tier occupied the middle ranks of the national league tables with the Nordic
and Austrian banks showing the most consistent performance since 2008 Dutch Belgian and German banks
have been on an upswing since the financial crisis hit UK and French banks have been treading water although
Standard Chartered Bank and HSBC in the UK and BNP Paribas in France all ranked among the top 15 banks
in core European countries
Not surprisingly banks in Italy Portugal Spain and Irelandmdashall feeling the sting of the sovereign debt crisis and
deep economic recessionsmdashhave turned in the weakest RoRWAs
7222019 Bain amp Co- European Banking Report
httpslidepdfcomreaderfullbain-co-european-banking-report 732
European banking | Bain amp Company Inc
Page 5
Illuminating the road ahead
While most European banks are moving in the right direction to meet Basel III requirements they could benefit
from using RoRWA to better anticipate and navigate the road ruts that lie ahead
Devising sustainable business models and bringing profitability back to attractive levelsmdashmeaning above the
cost of capitalmdashwill not be easy In the current market environment we expect continued pressure on interest
as well as on fee income For most banks managing the cost of risk will also be a challenge as stagnant economies
tend to drive up this cost
Getting a better grip on operating cost therefore will lead the agenda for most banks Structural costs can be
addressed using several means adopting new digital technologies and modernizing IT platforms optimizing
processes from end to end through such approaches as outsourcing and offshoring and expanding global pro-
curement initiatives
Local banks in core European countries face perhaps the stiffest challenges as restructuring will continue in the
face of stagnant economies and a higher cost of risk We expect to see further consolidation in this group For
the surviving institutions higher performance will hinge on better management of the deleveraging process
containment of the cost of raising new capital and more accurate factoring of risk into their price structures
High-growth countries still offer the most promising opportunities for the 10 biggest and other large pan-Euro-
pean players that aim to diversify their portfolios The best performers will be those banks that keep tight control
of the reins as they ride these booming economies
Regardless of a bankrsquos home country asset size or loan portfolio RoRWA analysis illuminates the ruts and holes
on the road ahead With just a few metrics senior managers can understand how their bank compares with its
peers and which factors to work on in order to create valuemdasha highly pragmatic means of improving the bankrsquos
risk-return profile
7222019 Bain amp Co- European Banking Report
httpslidepdfcomreaderfullbain-co-european-banking-report 832
7222019 Bain amp Co- European Banking Report
httpslidepdfcomreaderfullbain-co-european-banking-report 932
bull European banksrsquo return on risk recovered from the2008 financial crisis peaking in 2010 with an aver-age 13 RoRWA Since then however RoRWA
has declined to 05 on average This translatesto a level of profitability below the cost of capitalwhich means banks are destroying value
bull Looking beneath the average European banksrsquoRoRWAs correlated closely with economic growthover the past five years Banks in countries that sawstrong GDP growth like Turkey posted dramaticallyhigher performance and growth in both assetsand risk-weighted assets (RWA) than those in thecore European countries
bull Banks in high-growth countries also consistently
exceeded their cost of capital whereas banks incore Europe have not covered their cost of capitalonly coming close to that bar in 2010 Core Europeexperienced a major amount of deleveragingdespite extraordinary initiatives such as theEuropean Central Bankrsquos long-term refinancingoperation (LTRO)
bull The quality of management plays a major role inindividual bank performance particularly in theslow-growth countries There was a wide rangeof RoRWAs among banks in those markets for each
of the five yearsbull In 2012 the biggest factors determining significant
value destruction were cost of risk as loan-lossprovisions rose and increased operating costwhich trended up as a percent of risk-weightedassets More active management of the balance sheethelped raise revenues but fees and commissionsprogressively declined
bull The larger the bank the better its performance onaverage The 10 biggest banks used their improve-
ments in financial margins and lower risk costs tocome close to earning their cost of capital
bull Other large regional banks managed to keep oper-ating costs lower than the 10 biggest but still fellwell short of their capital hurdle Smaller local banksfared the worst posting a negative RoRWA in 2012They have been forced to undertake a major de-leveraging of their balance sheets
1Five years of
RoRWA in Europe
A bumpy
landscape
7222019 Bain amp Co- European Banking Report
httpslidepdfcomreaderfullbain-co-european-banking-report 1032
European banking | Bain amp Company Inc
Page 8
Although RoRWA correlates with economic growth there is still substantial variation among banks
Note Each observation is composed of a bankrsquos RoRWA in a given year and the respective countryrsquos year-over-year GDP growth rate in that yearSources Banksrsquo financial statements 2008ndash2012 n=605 Bureau van Dijk Bain analysis
RoRWA per bank and year 2008ndash2012
-5
-3
0
3
5
-10 0 10 20 30
95 ofobservationsfall withinthis band
Recessionno growthManagement has a major role
in determining RoRWA
Mediumhigh growthManagement has amore limited role in
achieving high RoRWA
Very high growthManagementrsquos most important role
is to optimize strategic asset allocationfor revenue generation
GDP growth by country and year 2008ndash2012
Bank profitability has eroded since the post-crisis peak of 2010
Return on equity (ROE) = Pretax profitaverage shareholdersrsquo equitySources Banksrsquo financial statements 2008ndash2012 n=121 Bureau van Dijk Bain analysis
European-wide RoRWA
0
1
2
200800
2009
07
2010 2011
09
2012
05
RWA (euroB)
33576
08
11690
44
30229
64
11555
-32
31770
104
11726
52
33528
75
11986
53
33028
49
11207
29
Total assets (euroB)
Annual GDP growth ()
ROE ()
13
7222019 Bain amp Co- European Banking Report
httpslidepdfcomreaderfullbain-co-european-banking-report 1132
European banking | Bain amp Company Inc
Page 9
Banks in core Europe have not covered their cost of capital over the past five years
The range represents the level of RoRWA required to cover the banksrsquo cost of capital and varies by bank size and country analysis of 88 banks based in AustriaBelgium France Germany Ireland Italy the Netherlands the Nordics Portugal Spain Switzerland and the UKSources Banksrsquo financial statements 2008ndash2012 Bain analysis
RoRWA weighted average
RWA (euroB)
32373
-15
10899
29129
51
10846
30366
88
10785
31957
53
10869
31219
22
10047
Total assets (euroB)
ROE ()
2008
-01
2009
06
2010 2011
06
2012
01
Range ofRoRWArequiredto coverthe costof capital
11
-1
0
1
2
3
4
1816
while banks in high-growth countries consistently exceeded their cost of capital
The range represents the level of RoRWA required to cover the banksrsquo cost of capital and varies by bank size and country analysis of 33 banks based in theCommonwealth of Independent States (CIS) Poland South Africa and TurkeySources Banksrsquo financial statements 2008ndash2012 Bain analysis
RoRWA weighted average
RWA (euroB)
1203
226
791
1100
206
708
Total assets (euroB)
ROE ()
Range ofRoRWArequiredto coverthe costof capital
0
1
2
3
4
2008
24
2009
22
1404
250
941
2010
32
1571
267
1117
2011
31
1810
247
1160
2012
33
2119
7222019 Bain amp Co- European Banking Report
httpslidepdfcomreaderfullbain-co-european-banking-report 1232
European banking | Bain amp Company Inc
Page 10
Higher operating expenditure and cost of risk caused banksrsquo value destruction in 2012
Long-term refinancing operations (LTRO) 2011 ~euro500 billion LTRO 2012 ~euro750 billion (including repayment) corresponding to 2011 total assets of ~euro330 trillionand 2012 total assets of ~euro322 trillionSources Banksrsquo financial statements 2008ndash2012 n=121 Bain analysis
20122010 2011
RoRWA ()
Total assets (euroB)
Tier 1 capital (euroB)
RWAtotal assets ()
Net interest incomeRWA ()
Financial marginRWA ()
Fees and commissions +
other revenuesRWA ()
Operating expenditureRWA ()
Loan-loss provisionsRWA ()
05
33028
1510
34
36
09
17
43
15
13
31770
1363
37
35
10
17
37
12
09
33528
1426
36
35
05
20
40
12
2009
07
30229
1261
38
34
09
17
35
18
00
33576
1079
35
31
-07
22
36
11
2008Main components in
European-wide RoRWA Major trends
Partial deleveraging of assets
Strengthening of capital
Fairly constant risk profile despite
deleveraging of assets
Overall margin from balance-sheet
management increasing
Continuous pressure on fees
and commissions
Inability to reduce costs in
proportion to deleveraging
Rising cost of credit
7222019 Bain amp Co- European Banking Report
httpslidepdfcomreaderfullbain-co-european-banking-report 1332
European banking | Bain amp Company Inc
Page 11
In core Europe banks increased capital ratios and revenues but did not optimize costs
Notes Components in bold are direct components of the RoRWA calculation changes in red are negative trendsSources Banksrsquo financial statements 2008ndash2012 n=88 Bain analysis
2012 Change2008minus20122010 2011
Total RWA (euroB)
Total assets (euroB)
RWAtotal assets ()
Tier 1 ratio ()
Total Tier 1 (euroB)
Net interest incomeRWA ()
Financial marginRWA ()
Net interest incometotal assets ()
Financial margintotal assets ()
Net interest income + financial marginRWA ()
Fees + other revenuesRWA ()
OpexRWA ()
Costincome ()
Loan-loss provisionsRWA ()
Nonperforming loan ratio ()
Coverage ratio ()
10047
31219
32
133
1336
34
09
11
03
43
16
43
70
15
55
49
-78
-36
-2 pts
+43 pts
+36
+05 pts
+16 pts
+01 pts
+05 pts
+21 pts
-06 pts
+07 pts
-10 pts
+05 pts
+30 pts
-12 pts
10785
30366
36
114
1230
33
10
12
04
43
16
37
62
12
46
50
10869
31957
34
118
1280
33
05
11
02
39
19
40
68
12
47
51
2009
10846
29129
37
107
1159
32
09
12
03
41
17
35
61
17
40
54
10899
32373
34
90
981
29
-07
10
-02
22
22
35
80Opextotal assets () 14 +02 pts13 141312
10
25
61
Cross-selling
Asset leverage
Balance-sheet management
Cost structure
Cost of risk
2008Components
In high-growth countries higher financial margins offset lower fees and relatively high nonperforming loans
affected cost of risk
Notes Components in bold are direct components of the RoRWA calculation changes in red are negative trendsSources Banksrsquo financial statements 2008ndash2012 n=33 Bain analysis
2012 Change2008minus2012
2010 2011
Total RWA (euroB)
Total assets (euroB)
RWAtotal assets ()
Tier 1 ratio ()
Total Tier 1 (euroB)
Net interest incomeRWA ()
Financial marginRWA ()
Net interest incometotal assets ()
Financial margintotal assets ()
Net interest income + financial marginRWA ()
Fees + other revenuesRWA ()OpexRWA ()
Costincome ()
Opextotal assets ()
Loan-loss provisionsRWA ()
Nonperforming loan ratio ()
Coverage ratio ()
1160
1810
64
150
174
57
05
36
04
62
2543
45
27
11
49
64
+47
+50
-2 pts
+27 pts
+78
-01 pts
+05 pts
-02 pts
+04 pts
+05 pts
-02 pts+01 pts
-2 pts
-01 pts
-07 pts
+12 pts
+5 pts
941
1404
67
141
133
55
05
37
04
60
2741
43
28
15
69
63
1117
1571
71
131
147
50
03
35
02
53
2438
45
27
08
55
64
2009
708
1100
64
144
102
67
08
43
05
75
2743
39
28
36
82
57
791
1203
66
123
97
58
00
38
00
58
2742
47
28
18
37
59
Cross-selling
Asset leverage
Balance-sheet management
Cost structure
Cost of risk
2008Components
7222019 Bain amp Co- European Banking Report
httpslidepdfcomreaderfullbain-co-european-banking-report 1432
European banking | Bain amp Company Inc
Page 12
Europersquos 10 biggest banks come closest to earning their cost of capital
The range represents the level of RoRWA required to cover the banksrsquo cost of capital and varies by bank size and country Analysis of the 10 largest Europe-headquarteredbanks by market capitalization with a pan-European presence a universal bank business model and assets of at least euro650 billion (Barclays BNP ParibasCreacutedit Agricole Credit Suisse Deutsche Bank HSBC Nordea Santander UBS and UniCredit)Sources Banksrsquo financial statements 2008ndash2012 Bain analysis
RoRWA weighted average
RWA (euroB)
1340922
3514
1133694
3474
Total assets (euroB)
ROE ()
Range ofRoRWArequiredto coverthe costof capital
12395123
3698
13239107
3765
1338559
3639
2008
02
2009 2010
17
2011
14
2012
09
12
0
1
2
18
16
Among the 10 biggest banks lower risk costs and improved margins offset high Opex
Notes Components in bold are direct components of the RoRWA calculation changes in red are negative trendsSources Banksrsquo financial statements 2008ndash2012 n=10 Bain analysis
2012 Change2008minus2012
2010 2011
Total RWA (euroB)
Total assets (euroB)
RWAtotal assets ()
Tier 1 ratio ()
Total Tier 1 (euroB)
Net interest incomeRWA ()
Financial marginRWA ()
Net interest incometotal assets ()
Financial margintotal assets ()
Net interest income + financial marginRWA ()
Fees + other revenuesRWA ()OpexRWA ()
Costincome ()
Opextotal assets ()
Loan-loss provisionsRWA ()
Nonperforming loan ratio ()
Coverage ratio ()
3639
13385
27
131
477
38
10
10
03
49
2452
71
14
12
45
54
+36
-02
+1 pts
+46 pts
+60
+05 pts
+18 pts
+02 pts
+05 pts
+23 pts
-06 pts+09 pts
-6 pts
+03 pts
+01 pts
+21 pts
-24 pts
3698
12395
30
115
426
37
14
11
04
51
2346
62
14
11
46
52
3765
13239
28
116
437
38
09
11
03
47
2648
65
14
11
44
53
2009
3474
11336
31
110
380
37
14
11
04
51
2244
60
13
17
35
71
3514
13409
26
85
299
33
-07
09
-02
26
3043
77
11
11
24
78
Cross-selling
Asset leverage
Balance-sheet management
Cost structure
Cost of risk
2008Components
7222019 Bain amp Co- European Banking Report
httpslidepdfcomreaderfullbain-co-european-banking-report 1532
European banking | Bain amp Company Inc
Page 13
Other large European banks have fallen well short of earning their cost of capital
The range represents the level of RoRWA required to cover the banksrsquo cost of capital and varies by bank size and country Analysis of 13 banks with assets of at leasteuro200 billion a universal bank business model and small to medium-sized subsidiaries outside their core geography (ABN AMRO Group BBVA Commerzbank Danske BankErste ING Intesa Sanpaolo KBC Lloyds Rabobank RBS Socieacuteteacute Geacuteneacuterale and Standard Chartered)Sources Banksrsquo financial statements 2008ndash2012 Bain analysis
RoRWA weighted average
RWA (euroB)
Total assets (euroB)
ROE ()
Range ofRoRWArequiredto coverthe costof capital
861607
3188
2008
01
822237
3468
2009
04
850978
3339
2010
867422
3214
2011
03
888640
3115
2012
06
10
0
1
2
18
16
Other large European banks had Opex lower than the big 10 which offset pressure on fee income and
higher cost of risk
Notes Components in bold are direct components of the RoRWA calculation changes in red are negative trendsSources Banksrsquo financial statements 2008ndash2012 n=13 Bain analysis
2012 Change2008minus2012
2010 2011
Total RWA (euroB)
Total assets (euroB)
RWAtotal assets ()
Tier 1 ratio ()
Total Tier 1 (euroB)
Net interest incomeRWA ()
Financial marginRWA ()
Net interest incometotal assets ()
Financial margintotal assets ()
Net interest income + financial marginRWA ()
Fees + other revenuesRWA ()OpexRWA ()
Costincome ()
Opextotal assets ()
Loan-loss provisionsRWA ()
Nonperforming loan ratio ()
Coverage ratio ()
3115
8886
35
129
402
35
12
12
04
47
1239
66
14
14
56
50
-23
+31
-19 pts
+39 pts
+40
+04 pts
+17 pts
+01 pts
+06 pts
+21 pts
-09 pts+02 pts
-12 pts
No change
+04 pts
+22 pts
+3 pts
3339
8509
39
114
382
34
11
13
04
45
1233
57
13
14
54
48
3214
8674
37
119
382
35
03
13
01
38
1739
70
14
14
57
48
2009
3468
8222
42
102
353
31
10
13
04
41
1532
58
14
19
50
46
3188
8616
37
90
287
31
-05
12
-02
26
2137
78
14
10
34
47
Cross-selling
Asset leverage
Balance-sheet management
Cost structure
Cost of risk
2008Components
7222019 Bain amp Co- European Banking Report
httpslidepdfcomreaderfullbain-co-european-banking-report 1632
European banking | Bain amp Company Inc
Page 14
Local banks have seen their RoRWA sharply deteriorate in recent years
The range represents the level of RoRWA required to cover the banksrsquo cost of capital and varies by bank size and country analysis of 65 banks operating exclusivelywithin a single national or regional marketSources Banksrsquo financial statements 2008ndash2012 Bain analysis
RoRWA weighted average
RWA (euroB)
Total assets (euroB)
ROE ()
Range ofRoRWArequiredto coverthe costof capital
10347
-68
4198
9571
20
3904
9462
59
3748
10044
20
3890
8948
-42
3293
2008
-06
2009
02
2010
07
2011
02
2012
-11
-2
-1
0
1
21816
Local banks have experienced sharp deleveraging higher cost of risk more nonperforming loans and flat revenues
Notes Components in bold are direct components of the RoRWA calculation changes in red are negative trendsSources Banksrsquo financial statements 2008ndash2012 n=65 Bain analysis
2012 Change2008minus2012
2010 2011
Total RWA (euroB)
Total assets (euroB)
RWAtotal assets ()
Tier 1 ratio ()
Total Tier 1 (euroB)
Net interest incomeRWA ()
Financial marginRWA ()
Net interest incometotal assets ()
Financial margintotal assets ()
Net interest income + financial marginRWA ()
Fees + other revenuesRWA ()OpexRWA ()
Costincome ()
Opextotal assets ()
Loan-loss provisionsRWA ()
Nonperforming loan ratio ()
Coverage ratio ()
3293
8948
37
139
457
28
06
10
02
34
1135
71
13
20
64
46
-215
-135
-38 pts
+44 pts
+15
+03 pts
+14 pts
No change
+06 pts
+17 pts
-05 pts+08 pts
-17 pts
+02 pts
+1 pts
+44 pts
-18 pts
3748
9462
40
113
422
28
05
11
02
33
1430
65
12
09
40
52
3890
10044
39
118
461
28
03
11
01
31
1532
69
13
12
43
51
2009
3904
9571
41
109
426
28
04
11
02
32
1430
65
12
14
36
51
4198
10347
41
94
396
25
-09
10
-04
16
1628
87
11
10
20
64
Cross-selling
Asset leverage
Balance-sheet management
Cost control
Cost of risk
2008Components
7222019 Bain amp Co- European Banking Report
httpslidepdfcomreaderfullbain-co-european-banking-report 1732
European banking | Bain amp Company Inc
Page 15
7222019 Bain amp Co- European Banking Report
httpslidepdfcomreaderfullbain-co-european-banking-report 1832
7222019 Bain amp Co- European Banking Report
httpslidepdfcomreaderfullbain-co-european-banking-report 1932
bull Countries with strong economic growth led the2012 RoRWA rankings Turkey took pole positionwith a 49 RoRWA In core Europe the Nordic
countries posed the strongest performance witha 19 RoRWA followed by Austria and theNetherlands The largest economies of Germanythe UK and France trailed behind
bull Banks in Italy Portugal Spain and Ireland whichhave been mired in the sovereign debt crisis anddeep economic recessions turned in the weakestRoRWA performances
bull Among the core European countries changes inRoRWAs from 2008 to 2012 stemmed mainly
from changes in three components net interestincome financial margin and loan-loss provisions
bull Countries that posted large positive changesmdashincluding Germany the Netherlands the Nordiccountries and the UKmdashbenefited from higherfinancial margins more control of operatingexpenditure and lower cost of risk Countries withlarge drops in RoRWAs were hurt by infl exiblecost structures which prevented them from shrinkingtheir production costs and a cost of risk that was
almost double the averagebull Northern Europe dominated the league tables
whether one looks at the 2012 leaders or themost improved banks For example the RoRWAleaders among both local and the 10 biggestbanks included banks in the Nordic countriesfollowed by those in the UK France Austria andthe Netherlands
bull In the most improved group banks in Switzer-land the Netherlands and Germany made a
strong showing
bull In high-growth countries Turkey and the Common-wealth of Independent States (CIS) took leadingpositions for the most improved banks and Turkeyfor the 2012 leaders
2Country and cluster
league tables
7222019 Bain amp Co- European Banking Report
httpslidepdfcomreaderfullbain-co-european-banking-report 2032
European banking | Bain amp Company Inc
Page 18
High-growth countries led the RoRWA rankings in 2012
Note For CIS the Netherlands Belgium Germany UK France Portugal and Spain one or two Tier-3 banks had not reported 2012 data by time of publicationso the analysis used 2011 data for those few banksSources Banksrsquo financial statements 2008ndash2012 n=121 Bain analysis
Rank 2012 RoRWA ()
Turkey
Poland
South Africa
CIS
Nordics
Austria
Netherlands
Belgium
Germany
UK
France
Switzerland
Italy
Portugal
Spain
Ireland
1
2
3
4
5
6
7
8
9
10
11
12
13
14
15
16
49
47
31
27
19
12
10
08
07
05
03
01
-06
-08
-17
-48
480
167
340
826
2357
334
2186
911
5514
7062
6320
1812
2127
426
2917
312
2012 total assets (euroB)Country 2008 RoRWA ()
33
41
35
10
13
19
-20
-25
-14
00
08
-76
07
10
19
10
7222019 Bain amp Co- European Banking Report
httpslidepdfcomreaderfullbain-co-european-banking-report 2132
European banking | Bain amp Company Inc
Page 19
In core European countries RoRWA changes from 2008 to 2012hellip
Note Averages are weighted for the total size of the respective components in each countrySources Banksrsquo financial statements 2008ndash2012 n=71 Bain analysis
RoRWA weighted average
-3
-2
-1
0
1
2
2008 average2012 average
UK
05
France
08
Germany
-14
07
Spain
19
-17
Nordics
13
19
Italy
07
-06
Netherlands
-20
10
2008 2012
0003
hellipwere spurred mainly by net interest income financial margin and loan-loss provisions
Note Averages are weighted for the total sizes of the respective indicators in each countrySources Banksrsquo financial statements 2008-2012 n=71 Bain analysis
NordicsGermany Spain
Total assets (euroB)
Total RWA (euroB)
Net interest incomeRWA ()
Financial marginRWA ()
Fees and commissions +other revenuesRWA ()
OpexRWA ()
Loan-loss provisionsRWA ()
France
7751
UK
2008 2012
AverageItaly Netherlands
7039
2474 2467
31 30
-02 12
26 15
41 42
14 10
5857 5715
1532 1327
26 38
-03 16
30 13
40 54
05 10
6054 5419
1534 1317
26 32
-19 07
14 17
27 43
08 06
1976 2917
1068 1315
36 43
06 06
17 10
27 35
13 41
1960 2357
790 735
27 32
-02 12
17 10
24 28
05 05
1990 2127
1266 1139
32 28
01 04
18 18
33 35
10 22
2263 2054
729 656
29 41
-17 06
15 10
39 38
09 09
2071 3947
928 1279
30 34
-05 10
17 14
32 41
08 15
7222019 Bain amp Co- European Banking Report
httpslidepdfcomreaderfullbain-co-european-banking-report 2232
European banking | Bain amp Company Inc
Page 20
These banks are the 2012 RoRWA leaders of their geographic cluster
Sources Banksrsquo financial statements 2008ndash2012 Bain analysis
Rank 2012 RoRWA ()
Nordics
UK
France
UK
Austria
Netherlands
Nordics
Nordics
Nordics
Turkey
Turkey
Turkey
1
2
3
1
2
3
1
2
3
1
2
3
19
18
16
23
17
16
40
39
36
158
132
48
Nordea
HSBC
BNP Paribas
Standard Chartered
Erste
ING
Swedbank
Sparebank 1 Group
Handelsbanken
Ziraat Bankasi
Akbank
Tuumlrkiye Halk
Bank Country 2008 RoRWA ()
16
08
06
24
19
02
20
NA
21
193
106
38
10biggest
Otherlarge
European
Local
High-growthcountries
These banks showed the biggest improvements in RoRWA over the past five years
Sources Banksrsquo financial statements 2008ndash2012 Bain analysis
Rank 2008ndash2012 change( points)
Switzerland
Switzerland
Germany
Belgium
UK
Netherlands
Netherlands
Belgium
Germany
CIS
Turkey
CIS
1
2
3
1
2
3
1
2
3
1
2
3
+83
+68
+21
+29
+26
+14
+64
+50
+33
+71
+26
+13
UBS
Credit Suisse
Deutsche Bank
KBC
RBS
ING
RBS Holdings NV
BNP Paribas Fortis
Bayerische Landesbank
Gazprombank
Akbank
VTB 24
Bank Country 2008 RoRWA ()
-92
-58
-19
-19
-37
02
-91
-45
-26
-56
106
05
10biggest
Otherlarge
European
Local
High-growthcountries
7222019 Bain amp Co- European Banking Report
httpslidepdfcomreaderfullbain-co-european-banking-report 2332
European banking | Bain amp Company Inc
Page 21
7222019 Bain amp Co- European Banking Report
httpslidepdfcomreaderfullbain-co-european-banking-report 2432
7222019 Bain amp Co- European Banking Report
httpslidepdfcomreaderfullbain-co-european-banking-report 2532
bull Europersquos environment continues to be volatile andinvestors are seeking better information about abankrsquos stability asset quality and key factors that
generate value RoRWA plays a useful role hereby focusing on the balance sheetmdashwhich enablescomparison between a bank and its peersmdashand byidentifying the factors influencing bank performance
bull Banks still need to address challenges along eachdimension of RoRWA in order to lift their profit-ability levels above the cost of capital In recent
years the profitability of lending assets has beensustained mainly by the fi nancial componentsincluding a boost from LTRO To raise asset prof-itability banks will have to better manage their
capital allocations and risk profilesbull The pressure on fee income will continue To offset
that trend banks should turn to their close clientrelationships for new sources of revenues
bull Lowering operating costs is the dimension thatwarrants managementrsquos attention at any bankregardless of size or location Initiatives that havethe greatest potential for tackling structural costsinclude adopting digital technologies and modern-izing IT platforms optimizing processes from endto end through outsourcing offshoring and other
means and expanding global procurement Suchinitiatives are essential for survival in an industrygoing through discontinuous change
bull Deleveraging the loan portfolio for riskier clients isa pressing issue which still poses significant threatsfor local banks In countries with a higher cost ofrisk and stagnant or negative GDP growth rateslocal banks may face further painful restructuring
bull Astute management of the cost of risk includingtaking a portfolio perspective offers opportunities
for most banksmdashin part to meet the new require-ments of Basel III and reassure rating agencies
bull Further consolidation of the local and other largebanks over the coming years will likely benefitthe 10 biggest banks and those in high-growthcountries These high-growth countries offer thegreatest opportunities for RoRWA growth for largeand pan-European players looking to diversifytheir portfolios
3Strategic
perspectives and
implications for
management
7222019 Bain amp Co- European Banking Report
httpslidepdfcomreaderfullbain-co-european-banking-report 2632
European banking | Bain amp Company Inc
Page 24
Significant restructuring is warranted for all banks but the nature of the challenge varies by geography
Source Bain analysis
10 biggest Strategic issueHigh-growth
countries
Other large
EuropeanLocal
Cross-selling
Balance-sheet
management
Cost structure
Cost of risk
Major threatThreatOpportunityMajor opportunity
Profitability of the asset portfolio has been sustained mainly by the
financial component Deleveraging of the loan portfolio for riskier
clients has been only partially successful and the risk profile of
the portfolio still has a long way to go
To counter pressure on fees banks should work systematically on
cross-selling opportunities through initiatives like client-focused
service models and CRM support
To further reduce costs banks should pursue new digital technologies
optimized processes through such means as outsourcing and offshoring
modernized IT platforms and global procurement initiatives
Active management of cost of risk demands more systematic solutions
bull NPL and LLP trends are threatening the stability of the overall
system and not only in individual countries such as Greece
bull Management of risky clients has become a core business and capability
bull Managing costs of risk demands an integrated portfolio approach
7222019 Bain amp Co- European Banking Report
httpslidepdfcomreaderfullbain-co-european-banking-report 2732
European banking | Bain amp Company Inc
Page 25
Assets (euroB)
Erste (AT)
Raiffeisen Bank (AT)
BNP Paribas Fortis
KBC
Belfius Banque
ING Belgium SANV
Creacutedit Agricole Groupe
BNP Paribas
Groupe Socieacuteteacute Geacuteneacuterale
Groupe BPCE
Creacutedit Mutuel
Deutsche Bank
Commerzbank AGKfW
DZ Bank AG
UniCredit Bank AG
2138
1202
2723
2569
2129
1691
17930
15439
12307
11475
6051
20123
63595116
4072
3483
Austria
Belgium
France
Germany
Country Bank Cluster
Other large
Local
Local
Other large
Local
Local
10 biggest
10 biggest
Other large
Local
Local
10 biggest
Other largeLocal
Local
Local
Ireland
Landesbank Baden-Wuumlrttemberg
Bayerische Landesbank
NORDLB
Helaba
HSH Nordbank
DekaBank
Landesbank Berlin Holding
Santander Consumer Bank
Hamburger Sparkasse
Deutsche Apotheker - und Aumlrztebank
Sparkasse KoumllnBonn
Kreissparkasse Koumlln
Bank of Ireland
Allied Irish Banks
permanent tsb Group Hldgs Plc
Intesa Sanpaolo
3363
2868
2256
1993
1306
1297
1183
403
396
379
299
248
1481
1225
409
6735
Local
Local
Local
Local
Local
Local
Local
Local
Local
Local
Local
Local
Other large
10 biggest
Local
Other large
Unicredit Group
Monte dei Paschi di Siena
4639
2189
10 biggest
Local
UBI Banca Group
Banco Popolare
BNL
Banca Popolare dellrsquoEmilia Romagna
Banca Popolare di Milano
Gruppo Banca Carige
Cariparma
Banca Popolare di Vicenza
Veneto Banca
1324
1319
912
616
525
493
493
467
402
Local
Local
Local
Local
Local
Local
Local
Local
Local
Italy
2011 assets
Bca Popdi Sondrio 322 Local
Credito Emiliano
Credito Valtellinese
Banca delle Marche
307
299
227
Local
Local
Local
List of banks analyzed by country and assets
10 biggest other large local
7222019 Bain amp Co- European Banking Report
httpslidepdfcomreaderfullbain-co-european-banking-report 2832
European banking | Bain amp Company Inc
Page 26
Assets (euroB)Country Bank Cluster
ING
Rabobank Group
ABN AMRO Group
SNS Reaal
RBS Holdings NV
8361
7524
3944
1322
710
Netherlands
Other large
Other large
Other large
Local
Local
Nordea 6774 10 biggest
Danske Bank
DNB
4682
3028
Other large
Local
SEB
Handelsbanken
Swedbank
Pohjola Bank
2818
2742
2121
998
Local
Local
Local
Local
Nordics
Jyske Bank 347 Local
Sparebank 1 Group 62 Local
Caixa Geral de Depositos 1169 Local
Millenium BCP
Banco Espiacuterito Santo
897
837
Local
Local
Banco BPI
Santander Totta SGPS
Caixa Econoacutemica Montepio Geral
Creacutedito Agriacutecola Muacutetuo
446
414
215
142
Local
Local
Local
Local
Portugal
BANIF 140 Local
SantanderBBVA
la Caixa
Banco Financiero y de Ahorros
Banco Sabadell SA
122826378
3591
3092
1615
Spain
10 biggestOther large
Local
Local
Local
Banco Popular
Banco Mare Nostrum
1576
634
Local
Local
UBS
Credit Suisse
10448
7669Switzerland
10 biggest
10 biggest
HSBC 20939 10 biggest
Barclays
Royal Bank of Scotland
17603
11521
10 biggest
Other large
Lloyds Banking Group
Standard Chartered
Nationwide Building Society
Co-operative Bank
11395
4950
2417
611
Other large
Other large
Local
Local
UK
Clydesdale Bank 545 Local
Yorkshire Building Society 413 Local
Virgin Money 223 Local
2011 assets
List of banks analyzed by country and assets
10 biggest other large localmdashcontinued
7222019 Bain amp Co- European Banking Report
httpslidepdfcomreaderfullbain-co-european-banking-report 2932
European banking | Bain amp Company Inc
Page 27
Assets (euroB)
Sberbank
VTB 24
PKO BP
Bank Pekao
BRE Bank
ING Bank Slaski
Standard Bank
Absa
FirstRand
Nedbank
Investec
Tuumlrkiye İş Bankası
Tuumlrkiye Garanti
Ziraat Bankasi
Akbank
Yapı ve Kredi
3781
1857
463
361
244
187
928
766
729
647
330
869
777
708
706
568
CIS
Poland
South Africa
Turkey
Country Bank
Tuumlrkiye Halk Bankasi
Tuumlrkiye Vakıflar
Finansbank
471
467
239
Gazprombank
Russian Agricultural Bank
Alfa-Bank
Nomos-Bank
UniCredit Bank Russia
712
358
357
225
218
AKB Rosbank
Promsvyazbank
ZAO Raiffeisenbank
URALSIB Bank
Russian Standard Bank
AKB Probusinessbank
200
173
160
113
74
35
2011 assets
Bank Zachodni WBK + Kredyt Bank
Getin NobleBank
Bank Millennium
143
141
126
List of banks analyzed by country and assets
High-growth countries
7222019 Bain amp Co- European Banking Report
httpslidepdfcomreaderfullbain-co-european-banking-report 3032
European banking | Bain amp Company Inc
Page 28
Key contacts in Bainrsquos European Financial Services practice
Franco Baronio in Milan (francobaroniobaincom)Rocco DrsquoAcunto in Milan (roccodacuntobaincom)
Ada Di Marzo in Paris (adadimarzobaincom)
Bertrand Facq in Warsaw (bertrandfacqbaincom)
Fabrice Franzen in Johannesburg (fabricefranzenbaincom)
Thomas Herbeck in Frankfurt (thomasherbeckbaincom)
Karaca Kestelli in Istanbul (karacakestellibaincom)
Nicolaacutes Lopez in Madrid (nicolaslopezbaincom)
Niels Peder Nielsen in Copenhagen (nielspedernielsenbaincom)
Andrea Oldrini in Milan (andreaoldrinibaincom)
Mathijs Robbens in Amsterdam (mathijsrobbensbaincom)
Visar Sala in Moscow (visarsalabaincom)
Walter Sinn in Frankfurt (waltersinnbaincom)Joatildeo Soares in London (joaosoaresbaincom)
Acknowledgments
The authors would like to thank the following Bain colleagues for their valuable support in producing this report
Sonal Chawla Christian Duus Franccedilois Fastrez Farsan Ghassim and Shikha Mahato
See these related Bain perspectives at wwwbaincom
bull Managing risk and capital
bull How Europersquos banks can return to health
bull The digital challenge to retail banks
7222019 Bain amp Co- European Banking Report
httpslidepdfcomreaderfullbain-co-european-banking-report 3132
7222019 Bain amp Co- European Banking Report
httpslidepdfcomreaderfullbain-co-european-banking-report 3232
For more information visit wwwbaincom
Share983140 983105m983138io983150 Tru Rs983157983148ts
Bain amp Company is the management consulting firm that the worldrsquos business leaders come to whenthey want results
Bain advises clients on strategy operations technology organization private equity and mergers and acquisitions We develop
practical customized insights that clients act on and transfer skills that make change stick Founded in 1973 Bain has
48 offices in 31 countries and our deep expertise and client roster cross every industry and economic sector Our clients
have outperformed the stock market 4 to 1
What sets us apart
We believe a consulting firm should be more than an adviser So we put ourselves in our clientsrsquo shoes selling outcomes not
projects We align our incentives with our clientsrsquo by linking our fees to their results and collaborate to unlock the full potential
of their business Our Results Deliveryreg process builds our clientsrsquo capabilities and our True North values mean we do theright thing for our clients people and communitiesmdashalways

7222019 Bain amp Co- European Banking Report
httpslidepdfcomreaderfullbain-co-european-banking-report 232
Copyright copy 2013 Bain amp Company Inc All rights reserved
Walter Sinn is a Bain amp Company partner based in the firmrsquos Frankfurt office
Rocco DrsquoAcunto is a partner based in Bainrsquos Milan office Andrea Oldrini is a
manager based in Milan They are all members of Bainrsquos European Financial
Services practice
7222019 Bain amp Co- European Banking Report
httpslidepdfcomreaderfullbain-co-european-banking-report 332
European banking | Bain amp Company Inc
Page 1
Contents
European banking Striking the right balance between risk and return 2
1 Five years of RoRWA in Europe A bumpy landscape 7
2 Country and cluster league tables 17
3 Strategic perspectives and implications for management 23
7222019 Bain amp Co- European Banking Report
httpslidepdfcomreaderfullbain-co-european-banking-report 432
European banking | Bain amp Company Inc
Page 2
European banking Striking the right balance between risk and return
Now that risk figures so prominently in European banking itrsquos time to raise the profile of a metric that has playeda minor role to date
This benchmarkmdashthe rate of return on risk-weighted assets or RoRWAmdashreliably integrates a balance-sheet-
management perspective with the revenue and cost side of the business Based on a comprehensive analysis of
121 banks across Europe by Bain amp Company RoRWA clearly emerges as the single most practical measure to
help senior bank executives manage their companiesrsquo performance and make savvy risk-reward decisions
Our analysis shows how and where the quality of management plays a major role in determining performance
Thatrsquos especially true in the core European countries where banks canrsquot rely on economic growth to lift their fortunes
Why does RoRWA deserve more respect now Five years since the global financial crisis bankers across Europe
still find themselves waging battle on many fronts Low interest rates a loss of customersrsquo trust stiff new targetcapital requirements and regulatory mandates have compounded the difficulty of operating in weak eurozone
economies On the cost side moreover banks are reconfiguring their distribution networks and streamlining
operations Yet even as revenue growth flattens and new digital technologies push up capital investments banks
are not making much headway on reining in costs
Indeed the banking industry is going through a major restructuring and only the fittest will survive this Darwinian
process The traditional tools that bankers have used to chart their competitive courses provide an inadequate map
for navigating treacherous new terrain With capital adequacy asset quality and broad macroeconomic trends
playing more prominent roles in shaping a bankrsquos financial performance it is the balance sheet not the profit-
and-loss statement which better captures the bankrsquos overall health and points to the areas that most need improvement
Todayrsquos environment of disruptive change calls for a holistic yet simple view of the returns that banks generate
on every unit of capital they commit to their businesses on a risk-adjusted basis
RoRWA fits the bill Other measures may be more precise in understanding risk theoretically but theyrsquore
impractical to use in managing the enterprise RoRWArsquos strength lies in using a well-understood measuremdash
risk-weighted assetsmdashas a denominator making it a good proxy for risk
For business leaders RoRWA and the analysis of key components can provide practical guidance to optimize
bank performance across four dimensions
bull First RoRWA tracks how well a bank manages its balance sheet and appetite for risk Managers can see
whether they are properly pricing offerings to reflect their risk and cost and how well they are allocating
capital to business areas and products that generate higher returns
bull Second the benchmark guides decisions on how a bank factors in risk to its cross-selling opportunities that
bring in fees commissions and other revenues
bull Third on the cost side a RoRWA approach reveals the cost efficiency per unit of risk for the volume of
business a bank generates
bull Fourth RoRWA shines a light on the cost of risk by disclosing how well a bank is able to minimize its loan-loss
provisions on a risk-adjusted basis
7222019 Bain amp Co- European Banking Report
httpslidepdfcomreaderfullbain-co-european-banking-report 532
European banking | Bain amp Company Inc
Page 3
Beyond its value as a guide for bringing risk and capital to the forefront in managing a bankrsquos internal performance
RoRWA also can serve as a powerful tool for external communications Executives regulators and investors can
see in a single number (supported by a few key components) how a bank stacks up against its direct competitorsacross different regions
Based on the RoRWA metric Bain undertook a comprehensive analysis of conditions influencing risk-weighted
returns across Europe Our analysis spans 12 core EU countries and the four fast-growing markets of the
Commonwealth of Independent States (CIS) Poland South Africa and Turkey from the onset of the global
economic crisis in 2008 through the end of 2012 We conducted an in-depth examination of 121 banks ranging
from the largest globe-spanning institutions headquartered in Europe and other large banks that operate sub-
sidiaries beyond their home countries to smaller local or regional banks Together the institutions we evaluated
cover at least 70 of their respective markets
The charts on the following pages highlight three major findings
Economic growth counts but management effectiveness plays a critical role Overall RoRWA correlated strongly
with GDP growth trends in the markets we examined Our analysis revealed a dramatic gap between the general
underperformance of banks in the core European countriesmdashwhose economies have largely stagnated or re-
mained mired in recessionmdashand the stronger risk-weighted returns posted by banks based in markets that experi-
enced more rapidly expanding GDP
Yet analysis of bank-level data also showed a wide variance in the performance of institutions competing within
individual markets For example in the slow-growth mostly core European markets where GDP ranged from
RoRWA reflects performance across four key dimensions
Source Bain analysis
= Net interest incomeRWA + + ndashndashFinancial margin
RWA
Fees andcommissions
andother revenues
RWA
Operatingexpenditure
RWA
Loan-lossprovisions
RWA
Measures abankrsquos abilityto cross-sellreflecting theindividual clientrsquos
level of risk
Cross-selling
Measures thecost efficiencyof productionindependent of any pricing and
income effects
Cost structure
Measures thelosses writtenoff against theamount ofrisk taken
Cost of risk
Combines two skills
bull Pricing based on risk and cost
bull Better allocation of capital to business areas and products
with higher returns
Balance-sheet management
Pretax operating results
Total RWA
7222019 Bain amp Co- European Banking Report
httpslidepdfcomreaderfullbain-co-european-banking-report 632
European banking | Bain amp Company Inc
Page 4
negative 10 to 5 over the five-year period RoRWA by bank varied widely in every year Clearly for these
markets the quality of an individual bankrsquos management plays a major role in determining performance
In markets where GDP growth exceeded 5 by contrast we found considerably less variation in bank-level
RoRWA performance As the rising tide lifted all banks managementrsquos role in shaping returns appears to have
been more circumscribed
Most banks fail to earn their cost of capital Bain determined that the RoRWA required for banks to cover their
cost of capital fell within a range of 16 to 21 depending on a bankrsquos size and the country in which it is based
The RoRWA of most banks has failed to clear that cost-of-capital hurdle on average in any year since 2008
falling well short in every year except 2010 Once again however we found a wide variation between the bank
performance in the core European countries where RoRWA was consistently below the cost of capital and that
in the high-growth countries where RoRWA easily cleared the capital-cost bar
Looking at the banksrsquo underlying strengths and weaknesses by market we identified several major pain points
that pinched banksrsquo RoRWAs in the core European countries
The need to shed debt and rely on higher-cost equity to strengthen their balance sheets reduced these banksrsquo total
risk-weighted assets by nearly 8 between 2008 and 2012 Meanwhile their cost of risk increased sharply as
stagnant or shrinking economies forced them to boost their loan-loss provisions in the face of steeper write-offs
of bad credit Interest margins that remained at low levels shrinking fee incomes and higher operating costs also
added downward pressure to banksrsquo RoRWAs
Size matters Within core Europe the 10 biggest pan-European banks (by total assets and market capitalization)
fared best overall Helped by large increases in net interest income and strong improvements in financial margins
their RoRWAs came closest to earning their cost of capital
Other large European banks with subsidiaries outside their home countries reduced their operating costs partially
offsetting declines in risk-weighted fee income and higher loan-loss provisions But the RoRWAs for these
banks still failed to clear their cost-of-capital hurdle
Local banks in core Europe struggled weighed down by nonperforming loans and flat revenues Their RoRWAs
were negative in both 2008 and 2012 and did not come close to covering their cost of capital
Turning to country differences the four high-growth countries on the fringe of Europe the Middle East and Africa
have the wind at their backs Turkey ranked first in RoRWA for 2012 and it has jockeyed for top billing with
Poland and South Africa over the past five years
Countries in core Europersquos northern tier occupied the middle ranks of the national league tables with the Nordic
and Austrian banks showing the most consistent performance since 2008 Dutch Belgian and German banks
have been on an upswing since the financial crisis hit UK and French banks have been treading water although
Standard Chartered Bank and HSBC in the UK and BNP Paribas in France all ranked among the top 15 banks
in core European countries
Not surprisingly banks in Italy Portugal Spain and Irelandmdashall feeling the sting of the sovereign debt crisis and
deep economic recessionsmdashhave turned in the weakest RoRWAs
7222019 Bain amp Co- European Banking Report
httpslidepdfcomreaderfullbain-co-european-banking-report 732
European banking | Bain amp Company Inc
Page 5
Illuminating the road ahead
While most European banks are moving in the right direction to meet Basel III requirements they could benefit
from using RoRWA to better anticipate and navigate the road ruts that lie ahead
Devising sustainable business models and bringing profitability back to attractive levelsmdashmeaning above the
cost of capitalmdashwill not be easy In the current market environment we expect continued pressure on interest
as well as on fee income For most banks managing the cost of risk will also be a challenge as stagnant economies
tend to drive up this cost
Getting a better grip on operating cost therefore will lead the agenda for most banks Structural costs can be
addressed using several means adopting new digital technologies and modernizing IT platforms optimizing
processes from end to end through such approaches as outsourcing and offshoring and expanding global pro-
curement initiatives
Local banks in core European countries face perhaps the stiffest challenges as restructuring will continue in the
face of stagnant economies and a higher cost of risk We expect to see further consolidation in this group For
the surviving institutions higher performance will hinge on better management of the deleveraging process
containment of the cost of raising new capital and more accurate factoring of risk into their price structures
High-growth countries still offer the most promising opportunities for the 10 biggest and other large pan-Euro-
pean players that aim to diversify their portfolios The best performers will be those banks that keep tight control
of the reins as they ride these booming economies
Regardless of a bankrsquos home country asset size or loan portfolio RoRWA analysis illuminates the ruts and holes
on the road ahead With just a few metrics senior managers can understand how their bank compares with its
peers and which factors to work on in order to create valuemdasha highly pragmatic means of improving the bankrsquos
risk-return profile
7222019 Bain amp Co- European Banking Report
httpslidepdfcomreaderfullbain-co-european-banking-report 832
7222019 Bain amp Co- European Banking Report
httpslidepdfcomreaderfullbain-co-european-banking-report 932
bull European banksrsquo return on risk recovered from the2008 financial crisis peaking in 2010 with an aver-age 13 RoRWA Since then however RoRWA
has declined to 05 on average This translatesto a level of profitability below the cost of capitalwhich means banks are destroying value
bull Looking beneath the average European banksrsquoRoRWAs correlated closely with economic growthover the past five years Banks in countries that sawstrong GDP growth like Turkey posted dramaticallyhigher performance and growth in both assetsand risk-weighted assets (RWA) than those in thecore European countries
bull Banks in high-growth countries also consistently
exceeded their cost of capital whereas banks incore Europe have not covered their cost of capitalonly coming close to that bar in 2010 Core Europeexperienced a major amount of deleveragingdespite extraordinary initiatives such as theEuropean Central Bankrsquos long-term refinancingoperation (LTRO)
bull The quality of management plays a major role inindividual bank performance particularly in theslow-growth countries There was a wide rangeof RoRWAs among banks in those markets for each
of the five yearsbull In 2012 the biggest factors determining significant
value destruction were cost of risk as loan-lossprovisions rose and increased operating costwhich trended up as a percent of risk-weightedassets More active management of the balance sheethelped raise revenues but fees and commissionsprogressively declined
bull The larger the bank the better its performance onaverage The 10 biggest banks used their improve-
ments in financial margins and lower risk costs tocome close to earning their cost of capital
bull Other large regional banks managed to keep oper-ating costs lower than the 10 biggest but still fellwell short of their capital hurdle Smaller local banksfared the worst posting a negative RoRWA in 2012They have been forced to undertake a major de-leveraging of their balance sheets
1Five years of
RoRWA in Europe
A bumpy
landscape
7222019 Bain amp Co- European Banking Report
httpslidepdfcomreaderfullbain-co-european-banking-report 1032
European banking | Bain amp Company Inc
Page 8
Although RoRWA correlates with economic growth there is still substantial variation among banks
Note Each observation is composed of a bankrsquos RoRWA in a given year and the respective countryrsquos year-over-year GDP growth rate in that yearSources Banksrsquo financial statements 2008ndash2012 n=605 Bureau van Dijk Bain analysis
RoRWA per bank and year 2008ndash2012
-5
-3
0
3
5
-10 0 10 20 30
95 ofobservationsfall withinthis band
Recessionno growthManagement has a major role
in determining RoRWA
Mediumhigh growthManagement has amore limited role in
achieving high RoRWA
Very high growthManagementrsquos most important role
is to optimize strategic asset allocationfor revenue generation
GDP growth by country and year 2008ndash2012
Bank profitability has eroded since the post-crisis peak of 2010
Return on equity (ROE) = Pretax profitaverage shareholdersrsquo equitySources Banksrsquo financial statements 2008ndash2012 n=121 Bureau van Dijk Bain analysis
European-wide RoRWA
0
1
2
200800
2009
07
2010 2011
09
2012
05
RWA (euroB)
33576
08
11690
44
30229
64
11555
-32
31770
104
11726
52
33528
75
11986
53
33028
49
11207
29
Total assets (euroB)
Annual GDP growth ()
ROE ()
13
7222019 Bain amp Co- European Banking Report
httpslidepdfcomreaderfullbain-co-european-banking-report 1132
European banking | Bain amp Company Inc
Page 9
Banks in core Europe have not covered their cost of capital over the past five years
The range represents the level of RoRWA required to cover the banksrsquo cost of capital and varies by bank size and country analysis of 88 banks based in AustriaBelgium France Germany Ireland Italy the Netherlands the Nordics Portugal Spain Switzerland and the UKSources Banksrsquo financial statements 2008ndash2012 Bain analysis
RoRWA weighted average
RWA (euroB)
32373
-15
10899
29129
51
10846
30366
88
10785
31957
53
10869
31219
22
10047
Total assets (euroB)
ROE ()
2008
-01
2009
06
2010 2011
06
2012
01
Range ofRoRWArequiredto coverthe costof capital
11
-1
0
1
2
3
4
1816
while banks in high-growth countries consistently exceeded their cost of capital
The range represents the level of RoRWA required to cover the banksrsquo cost of capital and varies by bank size and country analysis of 33 banks based in theCommonwealth of Independent States (CIS) Poland South Africa and TurkeySources Banksrsquo financial statements 2008ndash2012 Bain analysis
RoRWA weighted average
RWA (euroB)
1203
226
791
1100
206
708
Total assets (euroB)
ROE ()
Range ofRoRWArequiredto coverthe costof capital
0
1
2
3
4
2008
24
2009
22
1404
250
941
2010
32
1571
267
1117
2011
31
1810
247
1160
2012
33
2119
7222019 Bain amp Co- European Banking Report
httpslidepdfcomreaderfullbain-co-european-banking-report 1232
European banking | Bain amp Company Inc
Page 10
Higher operating expenditure and cost of risk caused banksrsquo value destruction in 2012
Long-term refinancing operations (LTRO) 2011 ~euro500 billion LTRO 2012 ~euro750 billion (including repayment) corresponding to 2011 total assets of ~euro330 trillionand 2012 total assets of ~euro322 trillionSources Banksrsquo financial statements 2008ndash2012 n=121 Bain analysis
20122010 2011
RoRWA ()
Total assets (euroB)
Tier 1 capital (euroB)
RWAtotal assets ()
Net interest incomeRWA ()
Financial marginRWA ()
Fees and commissions +
other revenuesRWA ()
Operating expenditureRWA ()
Loan-loss provisionsRWA ()
05
33028
1510
34
36
09
17
43
15
13
31770
1363
37
35
10
17
37
12
09
33528
1426
36
35
05
20
40
12
2009
07
30229
1261
38
34
09
17
35
18
00
33576
1079
35
31
-07
22
36
11
2008Main components in
European-wide RoRWA Major trends
Partial deleveraging of assets
Strengthening of capital
Fairly constant risk profile despite
deleveraging of assets
Overall margin from balance-sheet
management increasing
Continuous pressure on fees
and commissions
Inability to reduce costs in
proportion to deleveraging
Rising cost of credit
7222019 Bain amp Co- European Banking Report
httpslidepdfcomreaderfullbain-co-european-banking-report 1332
European banking | Bain amp Company Inc
Page 11
In core Europe banks increased capital ratios and revenues but did not optimize costs
Notes Components in bold are direct components of the RoRWA calculation changes in red are negative trendsSources Banksrsquo financial statements 2008ndash2012 n=88 Bain analysis
2012 Change2008minus20122010 2011
Total RWA (euroB)
Total assets (euroB)
RWAtotal assets ()
Tier 1 ratio ()
Total Tier 1 (euroB)
Net interest incomeRWA ()
Financial marginRWA ()
Net interest incometotal assets ()
Financial margintotal assets ()
Net interest income + financial marginRWA ()
Fees + other revenuesRWA ()
OpexRWA ()
Costincome ()
Loan-loss provisionsRWA ()
Nonperforming loan ratio ()
Coverage ratio ()
10047
31219
32
133
1336
34
09
11
03
43
16
43
70
15
55
49
-78
-36
-2 pts
+43 pts
+36
+05 pts
+16 pts
+01 pts
+05 pts
+21 pts
-06 pts
+07 pts
-10 pts
+05 pts
+30 pts
-12 pts
10785
30366
36
114
1230
33
10
12
04
43
16
37
62
12
46
50
10869
31957
34
118
1280
33
05
11
02
39
19
40
68
12
47
51
2009
10846
29129
37
107
1159
32
09
12
03
41
17
35
61
17
40
54
10899
32373
34
90
981
29
-07
10
-02
22
22
35
80Opextotal assets () 14 +02 pts13 141312
10
25
61
Cross-selling
Asset leverage
Balance-sheet management
Cost structure
Cost of risk
2008Components
In high-growth countries higher financial margins offset lower fees and relatively high nonperforming loans
affected cost of risk
Notes Components in bold are direct components of the RoRWA calculation changes in red are negative trendsSources Banksrsquo financial statements 2008ndash2012 n=33 Bain analysis
2012 Change2008minus2012
2010 2011
Total RWA (euroB)
Total assets (euroB)
RWAtotal assets ()
Tier 1 ratio ()
Total Tier 1 (euroB)
Net interest incomeRWA ()
Financial marginRWA ()
Net interest incometotal assets ()
Financial margintotal assets ()
Net interest income + financial marginRWA ()
Fees + other revenuesRWA ()OpexRWA ()
Costincome ()
Opextotal assets ()
Loan-loss provisionsRWA ()
Nonperforming loan ratio ()
Coverage ratio ()
1160
1810
64
150
174
57
05
36
04
62
2543
45
27
11
49
64
+47
+50
-2 pts
+27 pts
+78
-01 pts
+05 pts
-02 pts
+04 pts
+05 pts
-02 pts+01 pts
-2 pts
-01 pts
-07 pts
+12 pts
+5 pts
941
1404
67
141
133
55
05
37
04
60
2741
43
28
15
69
63
1117
1571
71
131
147
50
03
35
02
53
2438
45
27
08
55
64
2009
708
1100
64
144
102
67
08
43
05
75
2743
39
28
36
82
57
791
1203
66
123
97
58
00
38
00
58
2742
47
28
18
37
59
Cross-selling
Asset leverage
Balance-sheet management
Cost structure
Cost of risk
2008Components
7222019 Bain amp Co- European Banking Report
httpslidepdfcomreaderfullbain-co-european-banking-report 1432
European banking | Bain amp Company Inc
Page 12
Europersquos 10 biggest banks come closest to earning their cost of capital
The range represents the level of RoRWA required to cover the banksrsquo cost of capital and varies by bank size and country Analysis of the 10 largest Europe-headquarteredbanks by market capitalization with a pan-European presence a universal bank business model and assets of at least euro650 billion (Barclays BNP ParibasCreacutedit Agricole Credit Suisse Deutsche Bank HSBC Nordea Santander UBS and UniCredit)Sources Banksrsquo financial statements 2008ndash2012 Bain analysis
RoRWA weighted average
RWA (euroB)
1340922
3514
1133694
3474
Total assets (euroB)
ROE ()
Range ofRoRWArequiredto coverthe costof capital
12395123
3698
13239107
3765
1338559
3639
2008
02
2009 2010
17
2011
14
2012
09
12
0
1
2
18
16
Among the 10 biggest banks lower risk costs and improved margins offset high Opex
Notes Components in bold are direct components of the RoRWA calculation changes in red are negative trendsSources Banksrsquo financial statements 2008ndash2012 n=10 Bain analysis
2012 Change2008minus2012
2010 2011
Total RWA (euroB)
Total assets (euroB)
RWAtotal assets ()
Tier 1 ratio ()
Total Tier 1 (euroB)
Net interest incomeRWA ()
Financial marginRWA ()
Net interest incometotal assets ()
Financial margintotal assets ()
Net interest income + financial marginRWA ()
Fees + other revenuesRWA ()OpexRWA ()
Costincome ()
Opextotal assets ()
Loan-loss provisionsRWA ()
Nonperforming loan ratio ()
Coverage ratio ()
3639
13385
27
131
477
38
10
10
03
49
2452
71
14
12
45
54
+36
-02
+1 pts
+46 pts
+60
+05 pts
+18 pts
+02 pts
+05 pts
+23 pts
-06 pts+09 pts
-6 pts
+03 pts
+01 pts
+21 pts
-24 pts
3698
12395
30
115
426
37
14
11
04
51
2346
62
14
11
46
52
3765
13239
28
116
437
38
09
11
03
47
2648
65
14
11
44
53
2009
3474
11336
31
110
380
37
14
11
04
51
2244
60
13
17
35
71
3514
13409
26
85
299
33
-07
09
-02
26
3043
77
11
11
24
78
Cross-selling
Asset leverage
Balance-sheet management
Cost structure
Cost of risk
2008Components
7222019 Bain amp Co- European Banking Report
httpslidepdfcomreaderfullbain-co-european-banking-report 1532
European banking | Bain amp Company Inc
Page 13
Other large European banks have fallen well short of earning their cost of capital
The range represents the level of RoRWA required to cover the banksrsquo cost of capital and varies by bank size and country Analysis of 13 banks with assets of at leasteuro200 billion a universal bank business model and small to medium-sized subsidiaries outside their core geography (ABN AMRO Group BBVA Commerzbank Danske BankErste ING Intesa Sanpaolo KBC Lloyds Rabobank RBS Socieacuteteacute Geacuteneacuterale and Standard Chartered)Sources Banksrsquo financial statements 2008ndash2012 Bain analysis
RoRWA weighted average
RWA (euroB)
Total assets (euroB)
ROE ()
Range ofRoRWArequiredto coverthe costof capital
861607
3188
2008
01
822237
3468
2009
04
850978
3339
2010
867422
3214
2011
03
888640
3115
2012
06
10
0
1
2
18
16
Other large European banks had Opex lower than the big 10 which offset pressure on fee income and
higher cost of risk
Notes Components in bold are direct components of the RoRWA calculation changes in red are negative trendsSources Banksrsquo financial statements 2008ndash2012 n=13 Bain analysis
2012 Change2008minus2012
2010 2011
Total RWA (euroB)
Total assets (euroB)
RWAtotal assets ()
Tier 1 ratio ()
Total Tier 1 (euroB)
Net interest incomeRWA ()
Financial marginRWA ()
Net interest incometotal assets ()
Financial margintotal assets ()
Net interest income + financial marginRWA ()
Fees + other revenuesRWA ()OpexRWA ()
Costincome ()
Opextotal assets ()
Loan-loss provisionsRWA ()
Nonperforming loan ratio ()
Coverage ratio ()
3115
8886
35
129
402
35
12
12
04
47
1239
66
14
14
56
50
-23
+31
-19 pts
+39 pts
+40
+04 pts
+17 pts
+01 pts
+06 pts
+21 pts
-09 pts+02 pts
-12 pts
No change
+04 pts
+22 pts
+3 pts
3339
8509
39
114
382
34
11
13
04
45
1233
57
13
14
54
48
3214
8674
37
119
382
35
03
13
01
38
1739
70
14
14
57
48
2009
3468
8222
42
102
353
31
10
13
04
41
1532
58
14
19
50
46
3188
8616
37
90
287
31
-05
12
-02
26
2137
78
14
10
34
47
Cross-selling
Asset leverage
Balance-sheet management
Cost structure
Cost of risk
2008Components
7222019 Bain amp Co- European Banking Report
httpslidepdfcomreaderfullbain-co-european-banking-report 1632
European banking | Bain amp Company Inc
Page 14
Local banks have seen their RoRWA sharply deteriorate in recent years
The range represents the level of RoRWA required to cover the banksrsquo cost of capital and varies by bank size and country analysis of 65 banks operating exclusivelywithin a single national or regional marketSources Banksrsquo financial statements 2008ndash2012 Bain analysis
RoRWA weighted average
RWA (euroB)
Total assets (euroB)
ROE ()
Range ofRoRWArequiredto coverthe costof capital
10347
-68
4198
9571
20
3904
9462
59
3748
10044
20
3890
8948
-42
3293
2008
-06
2009
02
2010
07
2011
02
2012
-11
-2
-1
0
1
21816
Local banks have experienced sharp deleveraging higher cost of risk more nonperforming loans and flat revenues
Notes Components in bold are direct components of the RoRWA calculation changes in red are negative trendsSources Banksrsquo financial statements 2008ndash2012 n=65 Bain analysis
2012 Change2008minus2012
2010 2011
Total RWA (euroB)
Total assets (euroB)
RWAtotal assets ()
Tier 1 ratio ()
Total Tier 1 (euroB)
Net interest incomeRWA ()
Financial marginRWA ()
Net interest incometotal assets ()
Financial margintotal assets ()
Net interest income + financial marginRWA ()
Fees + other revenuesRWA ()OpexRWA ()
Costincome ()
Opextotal assets ()
Loan-loss provisionsRWA ()
Nonperforming loan ratio ()
Coverage ratio ()
3293
8948
37
139
457
28
06
10
02
34
1135
71
13
20
64
46
-215
-135
-38 pts
+44 pts
+15
+03 pts
+14 pts
No change
+06 pts
+17 pts
-05 pts+08 pts
-17 pts
+02 pts
+1 pts
+44 pts
-18 pts
3748
9462
40
113
422
28
05
11
02
33
1430
65
12
09
40
52
3890
10044
39
118
461
28
03
11
01
31
1532
69
13
12
43
51
2009
3904
9571
41
109
426
28
04
11
02
32
1430
65
12
14
36
51
4198
10347
41
94
396
25
-09
10
-04
16
1628
87
11
10
20
64
Cross-selling
Asset leverage
Balance-sheet management
Cost control
Cost of risk
2008Components
7222019 Bain amp Co- European Banking Report
httpslidepdfcomreaderfullbain-co-european-banking-report 1732
European banking | Bain amp Company Inc
Page 15
7222019 Bain amp Co- European Banking Report
httpslidepdfcomreaderfullbain-co-european-banking-report 1832
7222019 Bain amp Co- European Banking Report
httpslidepdfcomreaderfullbain-co-european-banking-report 1932
bull Countries with strong economic growth led the2012 RoRWA rankings Turkey took pole positionwith a 49 RoRWA In core Europe the Nordic
countries posed the strongest performance witha 19 RoRWA followed by Austria and theNetherlands The largest economies of Germanythe UK and France trailed behind
bull Banks in Italy Portugal Spain and Ireland whichhave been mired in the sovereign debt crisis anddeep economic recessions turned in the weakestRoRWA performances
bull Among the core European countries changes inRoRWAs from 2008 to 2012 stemmed mainly
from changes in three components net interestincome financial margin and loan-loss provisions
bull Countries that posted large positive changesmdashincluding Germany the Netherlands the Nordiccountries and the UKmdashbenefited from higherfinancial margins more control of operatingexpenditure and lower cost of risk Countries withlarge drops in RoRWAs were hurt by infl exiblecost structures which prevented them from shrinkingtheir production costs and a cost of risk that was
almost double the averagebull Northern Europe dominated the league tables
whether one looks at the 2012 leaders or themost improved banks For example the RoRWAleaders among both local and the 10 biggestbanks included banks in the Nordic countriesfollowed by those in the UK France Austria andthe Netherlands
bull In the most improved group banks in Switzer-land the Netherlands and Germany made a
strong showing
bull In high-growth countries Turkey and the Common-wealth of Independent States (CIS) took leadingpositions for the most improved banks and Turkeyfor the 2012 leaders
2Country and cluster
league tables
7222019 Bain amp Co- European Banking Report
httpslidepdfcomreaderfullbain-co-european-banking-report 2032
European banking | Bain amp Company Inc
Page 18
High-growth countries led the RoRWA rankings in 2012
Note For CIS the Netherlands Belgium Germany UK France Portugal and Spain one or two Tier-3 banks had not reported 2012 data by time of publicationso the analysis used 2011 data for those few banksSources Banksrsquo financial statements 2008ndash2012 n=121 Bain analysis
Rank 2012 RoRWA ()
Turkey
Poland
South Africa
CIS
Nordics
Austria
Netherlands
Belgium
Germany
UK
France
Switzerland
Italy
Portugal
Spain
Ireland
1
2
3
4
5
6
7
8
9
10
11
12
13
14
15
16
49
47
31
27
19
12
10
08
07
05
03
01
-06
-08
-17
-48
480
167
340
826
2357
334
2186
911
5514
7062
6320
1812
2127
426
2917
312
2012 total assets (euroB)Country 2008 RoRWA ()
33
41
35
10
13
19
-20
-25
-14
00
08
-76
07
10
19
10
7222019 Bain amp Co- European Banking Report
httpslidepdfcomreaderfullbain-co-european-banking-report 2132
European banking | Bain amp Company Inc
Page 19
In core European countries RoRWA changes from 2008 to 2012hellip
Note Averages are weighted for the total size of the respective components in each countrySources Banksrsquo financial statements 2008ndash2012 n=71 Bain analysis
RoRWA weighted average
-3
-2
-1
0
1
2
2008 average2012 average
UK
05
France
08
Germany
-14
07
Spain
19
-17
Nordics
13
19
Italy
07
-06
Netherlands
-20
10
2008 2012
0003
hellipwere spurred mainly by net interest income financial margin and loan-loss provisions
Note Averages are weighted for the total sizes of the respective indicators in each countrySources Banksrsquo financial statements 2008-2012 n=71 Bain analysis
NordicsGermany Spain
Total assets (euroB)
Total RWA (euroB)
Net interest incomeRWA ()
Financial marginRWA ()
Fees and commissions +other revenuesRWA ()
OpexRWA ()
Loan-loss provisionsRWA ()
France
7751
UK
2008 2012
AverageItaly Netherlands
7039
2474 2467
31 30
-02 12
26 15
41 42
14 10
5857 5715
1532 1327
26 38
-03 16
30 13
40 54
05 10
6054 5419
1534 1317
26 32
-19 07
14 17
27 43
08 06
1976 2917
1068 1315
36 43
06 06
17 10
27 35
13 41
1960 2357
790 735
27 32
-02 12
17 10
24 28
05 05
1990 2127
1266 1139
32 28
01 04
18 18
33 35
10 22
2263 2054
729 656
29 41
-17 06
15 10
39 38
09 09
2071 3947
928 1279
30 34
-05 10
17 14
32 41
08 15
7222019 Bain amp Co- European Banking Report
httpslidepdfcomreaderfullbain-co-european-banking-report 2232
European banking | Bain amp Company Inc
Page 20
These banks are the 2012 RoRWA leaders of their geographic cluster
Sources Banksrsquo financial statements 2008ndash2012 Bain analysis
Rank 2012 RoRWA ()
Nordics
UK
France
UK
Austria
Netherlands
Nordics
Nordics
Nordics
Turkey
Turkey
Turkey
1
2
3
1
2
3
1
2
3
1
2
3
19
18
16
23
17
16
40
39
36
158
132
48
Nordea
HSBC
BNP Paribas
Standard Chartered
Erste
ING
Swedbank
Sparebank 1 Group
Handelsbanken
Ziraat Bankasi
Akbank
Tuumlrkiye Halk
Bank Country 2008 RoRWA ()
16
08
06
24
19
02
20
NA
21
193
106
38
10biggest
Otherlarge
European
Local
High-growthcountries
These banks showed the biggest improvements in RoRWA over the past five years
Sources Banksrsquo financial statements 2008ndash2012 Bain analysis
Rank 2008ndash2012 change( points)
Switzerland
Switzerland
Germany
Belgium
UK
Netherlands
Netherlands
Belgium
Germany
CIS
Turkey
CIS
1
2
3
1
2
3
1
2
3
1
2
3
+83
+68
+21
+29
+26
+14
+64
+50
+33
+71
+26
+13
UBS
Credit Suisse
Deutsche Bank
KBC
RBS
ING
RBS Holdings NV
BNP Paribas Fortis
Bayerische Landesbank
Gazprombank
Akbank
VTB 24
Bank Country 2008 RoRWA ()
-92
-58
-19
-19
-37
02
-91
-45
-26
-56
106
05
10biggest
Otherlarge
European
Local
High-growthcountries
7222019 Bain amp Co- European Banking Report
httpslidepdfcomreaderfullbain-co-european-banking-report 2332
European banking | Bain amp Company Inc
Page 21
7222019 Bain amp Co- European Banking Report
httpslidepdfcomreaderfullbain-co-european-banking-report 2432
7222019 Bain amp Co- European Banking Report
httpslidepdfcomreaderfullbain-co-european-banking-report 2532
bull Europersquos environment continues to be volatile andinvestors are seeking better information about abankrsquos stability asset quality and key factors that
generate value RoRWA plays a useful role hereby focusing on the balance sheetmdashwhich enablescomparison between a bank and its peersmdashand byidentifying the factors influencing bank performance
bull Banks still need to address challenges along eachdimension of RoRWA in order to lift their profit-ability levels above the cost of capital In recent
years the profitability of lending assets has beensustained mainly by the fi nancial componentsincluding a boost from LTRO To raise asset prof-itability banks will have to better manage their
capital allocations and risk profilesbull The pressure on fee income will continue To offset
that trend banks should turn to their close clientrelationships for new sources of revenues
bull Lowering operating costs is the dimension thatwarrants managementrsquos attention at any bankregardless of size or location Initiatives that havethe greatest potential for tackling structural costsinclude adopting digital technologies and modern-izing IT platforms optimizing processes from endto end through outsourcing offshoring and other
means and expanding global procurement Suchinitiatives are essential for survival in an industrygoing through discontinuous change
bull Deleveraging the loan portfolio for riskier clients isa pressing issue which still poses significant threatsfor local banks In countries with a higher cost ofrisk and stagnant or negative GDP growth rateslocal banks may face further painful restructuring
bull Astute management of the cost of risk includingtaking a portfolio perspective offers opportunities
for most banksmdashin part to meet the new require-ments of Basel III and reassure rating agencies
bull Further consolidation of the local and other largebanks over the coming years will likely benefitthe 10 biggest banks and those in high-growthcountries These high-growth countries offer thegreatest opportunities for RoRWA growth for largeand pan-European players looking to diversifytheir portfolios
3Strategic
perspectives and
implications for
management
7222019 Bain amp Co- European Banking Report
httpslidepdfcomreaderfullbain-co-european-banking-report 2632
European banking | Bain amp Company Inc
Page 24
Significant restructuring is warranted for all banks but the nature of the challenge varies by geography
Source Bain analysis
10 biggest Strategic issueHigh-growth
countries
Other large
EuropeanLocal
Cross-selling
Balance-sheet
management
Cost structure
Cost of risk
Major threatThreatOpportunityMajor opportunity
Profitability of the asset portfolio has been sustained mainly by the
financial component Deleveraging of the loan portfolio for riskier
clients has been only partially successful and the risk profile of
the portfolio still has a long way to go
To counter pressure on fees banks should work systematically on
cross-selling opportunities through initiatives like client-focused
service models and CRM support
To further reduce costs banks should pursue new digital technologies
optimized processes through such means as outsourcing and offshoring
modernized IT platforms and global procurement initiatives
Active management of cost of risk demands more systematic solutions
bull NPL and LLP trends are threatening the stability of the overall
system and not only in individual countries such as Greece
bull Management of risky clients has become a core business and capability
bull Managing costs of risk demands an integrated portfolio approach
7222019 Bain amp Co- European Banking Report
httpslidepdfcomreaderfullbain-co-european-banking-report 2732
European banking | Bain amp Company Inc
Page 25
Assets (euroB)
Erste (AT)
Raiffeisen Bank (AT)
BNP Paribas Fortis
KBC
Belfius Banque
ING Belgium SANV
Creacutedit Agricole Groupe
BNP Paribas
Groupe Socieacuteteacute Geacuteneacuterale
Groupe BPCE
Creacutedit Mutuel
Deutsche Bank
Commerzbank AGKfW
DZ Bank AG
UniCredit Bank AG
2138
1202
2723
2569
2129
1691
17930
15439
12307
11475
6051
20123
63595116
4072
3483
Austria
Belgium
France
Germany
Country Bank Cluster
Other large
Local
Local
Other large
Local
Local
10 biggest
10 biggest
Other large
Local
Local
10 biggest
Other largeLocal
Local
Local
Ireland
Landesbank Baden-Wuumlrttemberg
Bayerische Landesbank
NORDLB
Helaba
HSH Nordbank
DekaBank
Landesbank Berlin Holding
Santander Consumer Bank
Hamburger Sparkasse
Deutsche Apotheker - und Aumlrztebank
Sparkasse KoumllnBonn
Kreissparkasse Koumlln
Bank of Ireland
Allied Irish Banks
permanent tsb Group Hldgs Plc
Intesa Sanpaolo
3363
2868
2256
1993
1306
1297
1183
403
396
379
299
248
1481
1225
409
6735
Local
Local
Local
Local
Local
Local
Local
Local
Local
Local
Local
Local
Other large
10 biggest
Local
Other large
Unicredit Group
Monte dei Paschi di Siena
4639
2189
10 biggest
Local
UBI Banca Group
Banco Popolare
BNL
Banca Popolare dellrsquoEmilia Romagna
Banca Popolare di Milano
Gruppo Banca Carige
Cariparma
Banca Popolare di Vicenza
Veneto Banca
1324
1319
912
616
525
493
493
467
402
Local
Local
Local
Local
Local
Local
Local
Local
Local
Italy
2011 assets
Bca Popdi Sondrio 322 Local
Credito Emiliano
Credito Valtellinese
Banca delle Marche
307
299
227
Local
Local
Local
List of banks analyzed by country and assets
10 biggest other large local
7222019 Bain amp Co- European Banking Report
httpslidepdfcomreaderfullbain-co-european-banking-report 2832
European banking | Bain amp Company Inc
Page 26
Assets (euroB)Country Bank Cluster
ING
Rabobank Group
ABN AMRO Group
SNS Reaal
RBS Holdings NV
8361
7524
3944
1322
710
Netherlands
Other large
Other large
Other large
Local
Local
Nordea 6774 10 biggest
Danske Bank
DNB
4682
3028
Other large
Local
SEB
Handelsbanken
Swedbank
Pohjola Bank
2818
2742
2121
998
Local
Local
Local
Local
Nordics
Jyske Bank 347 Local
Sparebank 1 Group 62 Local
Caixa Geral de Depositos 1169 Local
Millenium BCP
Banco Espiacuterito Santo
897
837
Local
Local
Banco BPI
Santander Totta SGPS
Caixa Econoacutemica Montepio Geral
Creacutedito Agriacutecola Muacutetuo
446
414
215
142
Local
Local
Local
Local
Portugal
BANIF 140 Local
SantanderBBVA
la Caixa
Banco Financiero y de Ahorros
Banco Sabadell SA
122826378
3591
3092
1615
Spain
10 biggestOther large
Local
Local
Local
Banco Popular
Banco Mare Nostrum
1576
634
Local
Local
UBS
Credit Suisse
10448
7669Switzerland
10 biggest
10 biggest
HSBC 20939 10 biggest
Barclays
Royal Bank of Scotland
17603
11521
10 biggest
Other large
Lloyds Banking Group
Standard Chartered
Nationwide Building Society
Co-operative Bank
11395
4950
2417
611
Other large
Other large
Local
Local
UK
Clydesdale Bank 545 Local
Yorkshire Building Society 413 Local
Virgin Money 223 Local
2011 assets
List of banks analyzed by country and assets
10 biggest other large localmdashcontinued
7222019 Bain amp Co- European Banking Report
httpslidepdfcomreaderfullbain-co-european-banking-report 2932
European banking | Bain amp Company Inc
Page 27
Assets (euroB)
Sberbank
VTB 24
PKO BP
Bank Pekao
BRE Bank
ING Bank Slaski
Standard Bank
Absa
FirstRand
Nedbank
Investec
Tuumlrkiye İş Bankası
Tuumlrkiye Garanti
Ziraat Bankasi
Akbank
Yapı ve Kredi
3781
1857
463
361
244
187
928
766
729
647
330
869
777
708
706
568
CIS
Poland
South Africa
Turkey
Country Bank
Tuumlrkiye Halk Bankasi
Tuumlrkiye Vakıflar
Finansbank
471
467
239
Gazprombank
Russian Agricultural Bank
Alfa-Bank
Nomos-Bank
UniCredit Bank Russia
712
358
357
225
218
AKB Rosbank
Promsvyazbank
ZAO Raiffeisenbank
URALSIB Bank
Russian Standard Bank
AKB Probusinessbank
200
173
160
113
74
35
2011 assets
Bank Zachodni WBK + Kredyt Bank
Getin NobleBank
Bank Millennium
143
141
126
List of banks analyzed by country and assets
High-growth countries
7222019 Bain amp Co- European Banking Report
httpslidepdfcomreaderfullbain-co-european-banking-report 3032
European banking | Bain amp Company Inc
Page 28
Key contacts in Bainrsquos European Financial Services practice
Franco Baronio in Milan (francobaroniobaincom)Rocco DrsquoAcunto in Milan (roccodacuntobaincom)
Ada Di Marzo in Paris (adadimarzobaincom)
Bertrand Facq in Warsaw (bertrandfacqbaincom)
Fabrice Franzen in Johannesburg (fabricefranzenbaincom)
Thomas Herbeck in Frankfurt (thomasherbeckbaincom)
Karaca Kestelli in Istanbul (karacakestellibaincom)
Nicolaacutes Lopez in Madrid (nicolaslopezbaincom)
Niels Peder Nielsen in Copenhagen (nielspedernielsenbaincom)
Andrea Oldrini in Milan (andreaoldrinibaincom)
Mathijs Robbens in Amsterdam (mathijsrobbensbaincom)
Visar Sala in Moscow (visarsalabaincom)
Walter Sinn in Frankfurt (waltersinnbaincom)Joatildeo Soares in London (joaosoaresbaincom)
Acknowledgments
The authors would like to thank the following Bain colleagues for their valuable support in producing this report
Sonal Chawla Christian Duus Franccedilois Fastrez Farsan Ghassim and Shikha Mahato
See these related Bain perspectives at wwwbaincom
bull Managing risk and capital
bull How Europersquos banks can return to health
bull The digital challenge to retail banks
7222019 Bain amp Co- European Banking Report
httpslidepdfcomreaderfullbain-co-european-banking-report 3132
7222019 Bain amp Co- European Banking Report
httpslidepdfcomreaderfullbain-co-european-banking-report 3232
For more information visit wwwbaincom
Share983140 983105m983138io983150 Tru Rs983157983148ts
Bain amp Company is the management consulting firm that the worldrsquos business leaders come to whenthey want results
Bain advises clients on strategy operations technology organization private equity and mergers and acquisitions We develop
practical customized insights that clients act on and transfer skills that make change stick Founded in 1973 Bain has
48 offices in 31 countries and our deep expertise and client roster cross every industry and economic sector Our clients
have outperformed the stock market 4 to 1
What sets us apart
We believe a consulting firm should be more than an adviser So we put ourselves in our clientsrsquo shoes selling outcomes not
projects We align our incentives with our clientsrsquo by linking our fees to their results and collaborate to unlock the full potential
of their business Our Results Deliveryreg process builds our clientsrsquo capabilities and our True North values mean we do theright thing for our clients people and communitiesmdashalways
7222019 Bain amp Co- European Banking Report
httpslidepdfcomreaderfullbain-co-european-banking-report 432
European banking | Bain amp Company Inc
Page 2
European banking Striking the right balance between risk and return
Now that risk figures so prominently in European banking itrsquos time to raise the profile of a metric that has playeda minor role to date
This benchmarkmdashthe rate of return on risk-weighted assets or RoRWAmdashreliably integrates a balance-sheet-
management perspective with the revenue and cost side of the business Based on a comprehensive analysis of
121 banks across Europe by Bain amp Company RoRWA clearly emerges as the single most practical measure to
help senior bank executives manage their companiesrsquo performance and make savvy risk-reward decisions
Our analysis shows how and where the quality of management plays a major role in determining performance
Thatrsquos especially true in the core European countries where banks canrsquot rely on economic growth to lift their fortunes
Why does RoRWA deserve more respect now Five years since the global financial crisis bankers across Europe
still find themselves waging battle on many fronts Low interest rates a loss of customersrsquo trust stiff new targetcapital requirements and regulatory mandates have compounded the difficulty of operating in weak eurozone
economies On the cost side moreover banks are reconfiguring their distribution networks and streamlining
operations Yet even as revenue growth flattens and new digital technologies push up capital investments banks
are not making much headway on reining in costs
Indeed the banking industry is going through a major restructuring and only the fittest will survive this Darwinian
process The traditional tools that bankers have used to chart their competitive courses provide an inadequate map
for navigating treacherous new terrain With capital adequacy asset quality and broad macroeconomic trends
playing more prominent roles in shaping a bankrsquos financial performance it is the balance sheet not the profit-
and-loss statement which better captures the bankrsquos overall health and points to the areas that most need improvement
Todayrsquos environment of disruptive change calls for a holistic yet simple view of the returns that banks generate
on every unit of capital they commit to their businesses on a risk-adjusted basis
RoRWA fits the bill Other measures may be more precise in understanding risk theoretically but theyrsquore
impractical to use in managing the enterprise RoRWArsquos strength lies in using a well-understood measuremdash
risk-weighted assetsmdashas a denominator making it a good proxy for risk
For business leaders RoRWA and the analysis of key components can provide practical guidance to optimize
bank performance across four dimensions
bull First RoRWA tracks how well a bank manages its balance sheet and appetite for risk Managers can see
whether they are properly pricing offerings to reflect their risk and cost and how well they are allocating
capital to business areas and products that generate higher returns
bull Second the benchmark guides decisions on how a bank factors in risk to its cross-selling opportunities that
bring in fees commissions and other revenues
bull Third on the cost side a RoRWA approach reveals the cost efficiency per unit of risk for the volume of
business a bank generates
bull Fourth RoRWA shines a light on the cost of risk by disclosing how well a bank is able to minimize its loan-loss
provisions on a risk-adjusted basis
7222019 Bain amp Co- European Banking Report
httpslidepdfcomreaderfullbain-co-european-banking-report 532
European banking | Bain amp Company Inc
Page 3
Beyond its value as a guide for bringing risk and capital to the forefront in managing a bankrsquos internal performance
RoRWA also can serve as a powerful tool for external communications Executives regulators and investors can
see in a single number (supported by a few key components) how a bank stacks up against its direct competitorsacross different regions
Based on the RoRWA metric Bain undertook a comprehensive analysis of conditions influencing risk-weighted
returns across Europe Our analysis spans 12 core EU countries and the four fast-growing markets of the
Commonwealth of Independent States (CIS) Poland South Africa and Turkey from the onset of the global
economic crisis in 2008 through the end of 2012 We conducted an in-depth examination of 121 banks ranging
from the largest globe-spanning institutions headquartered in Europe and other large banks that operate sub-
sidiaries beyond their home countries to smaller local or regional banks Together the institutions we evaluated
cover at least 70 of their respective markets
The charts on the following pages highlight three major findings
Economic growth counts but management effectiveness plays a critical role Overall RoRWA correlated strongly
with GDP growth trends in the markets we examined Our analysis revealed a dramatic gap between the general
underperformance of banks in the core European countriesmdashwhose economies have largely stagnated or re-
mained mired in recessionmdashand the stronger risk-weighted returns posted by banks based in markets that experi-
enced more rapidly expanding GDP
Yet analysis of bank-level data also showed a wide variance in the performance of institutions competing within
individual markets For example in the slow-growth mostly core European markets where GDP ranged from
RoRWA reflects performance across four key dimensions
Source Bain analysis
= Net interest incomeRWA + + ndashndashFinancial margin
RWA
Fees andcommissions
andother revenues
RWA
Operatingexpenditure
RWA
Loan-lossprovisions
RWA
Measures abankrsquos abilityto cross-sellreflecting theindividual clientrsquos
level of risk
Cross-selling
Measures thecost efficiencyof productionindependent of any pricing and
income effects
Cost structure
Measures thelosses writtenoff against theamount ofrisk taken
Cost of risk
Combines two skills
bull Pricing based on risk and cost
bull Better allocation of capital to business areas and products
with higher returns
Balance-sheet management
Pretax operating results
Total RWA
7222019 Bain amp Co- European Banking Report
httpslidepdfcomreaderfullbain-co-european-banking-report 632
European banking | Bain amp Company Inc
Page 4
negative 10 to 5 over the five-year period RoRWA by bank varied widely in every year Clearly for these
markets the quality of an individual bankrsquos management plays a major role in determining performance
In markets where GDP growth exceeded 5 by contrast we found considerably less variation in bank-level
RoRWA performance As the rising tide lifted all banks managementrsquos role in shaping returns appears to have
been more circumscribed
Most banks fail to earn their cost of capital Bain determined that the RoRWA required for banks to cover their
cost of capital fell within a range of 16 to 21 depending on a bankrsquos size and the country in which it is based
The RoRWA of most banks has failed to clear that cost-of-capital hurdle on average in any year since 2008
falling well short in every year except 2010 Once again however we found a wide variation between the bank
performance in the core European countries where RoRWA was consistently below the cost of capital and that
in the high-growth countries where RoRWA easily cleared the capital-cost bar
Looking at the banksrsquo underlying strengths and weaknesses by market we identified several major pain points
that pinched banksrsquo RoRWAs in the core European countries
The need to shed debt and rely on higher-cost equity to strengthen their balance sheets reduced these banksrsquo total
risk-weighted assets by nearly 8 between 2008 and 2012 Meanwhile their cost of risk increased sharply as
stagnant or shrinking economies forced them to boost their loan-loss provisions in the face of steeper write-offs
of bad credit Interest margins that remained at low levels shrinking fee incomes and higher operating costs also
added downward pressure to banksrsquo RoRWAs
Size matters Within core Europe the 10 biggest pan-European banks (by total assets and market capitalization)
fared best overall Helped by large increases in net interest income and strong improvements in financial margins
their RoRWAs came closest to earning their cost of capital
Other large European banks with subsidiaries outside their home countries reduced their operating costs partially
offsetting declines in risk-weighted fee income and higher loan-loss provisions But the RoRWAs for these
banks still failed to clear their cost-of-capital hurdle
Local banks in core Europe struggled weighed down by nonperforming loans and flat revenues Their RoRWAs
were negative in both 2008 and 2012 and did not come close to covering their cost of capital
Turning to country differences the four high-growth countries on the fringe of Europe the Middle East and Africa
have the wind at their backs Turkey ranked first in RoRWA for 2012 and it has jockeyed for top billing with
Poland and South Africa over the past five years
Countries in core Europersquos northern tier occupied the middle ranks of the national league tables with the Nordic
and Austrian banks showing the most consistent performance since 2008 Dutch Belgian and German banks
have been on an upswing since the financial crisis hit UK and French banks have been treading water although
Standard Chartered Bank and HSBC in the UK and BNP Paribas in France all ranked among the top 15 banks
in core European countries
Not surprisingly banks in Italy Portugal Spain and Irelandmdashall feeling the sting of the sovereign debt crisis and
deep economic recessionsmdashhave turned in the weakest RoRWAs
7222019 Bain amp Co- European Banking Report
httpslidepdfcomreaderfullbain-co-european-banking-report 732
European banking | Bain amp Company Inc
Page 5
Illuminating the road ahead
While most European banks are moving in the right direction to meet Basel III requirements they could benefit
from using RoRWA to better anticipate and navigate the road ruts that lie ahead
Devising sustainable business models and bringing profitability back to attractive levelsmdashmeaning above the
cost of capitalmdashwill not be easy In the current market environment we expect continued pressure on interest
as well as on fee income For most banks managing the cost of risk will also be a challenge as stagnant economies
tend to drive up this cost
Getting a better grip on operating cost therefore will lead the agenda for most banks Structural costs can be
addressed using several means adopting new digital technologies and modernizing IT platforms optimizing
processes from end to end through such approaches as outsourcing and offshoring and expanding global pro-
curement initiatives
Local banks in core European countries face perhaps the stiffest challenges as restructuring will continue in the
face of stagnant economies and a higher cost of risk We expect to see further consolidation in this group For
the surviving institutions higher performance will hinge on better management of the deleveraging process
containment of the cost of raising new capital and more accurate factoring of risk into their price structures
High-growth countries still offer the most promising opportunities for the 10 biggest and other large pan-Euro-
pean players that aim to diversify their portfolios The best performers will be those banks that keep tight control
of the reins as they ride these booming economies
Regardless of a bankrsquos home country asset size or loan portfolio RoRWA analysis illuminates the ruts and holes
on the road ahead With just a few metrics senior managers can understand how their bank compares with its
peers and which factors to work on in order to create valuemdasha highly pragmatic means of improving the bankrsquos
risk-return profile
7222019 Bain amp Co- European Banking Report
httpslidepdfcomreaderfullbain-co-european-banking-report 832
7222019 Bain amp Co- European Banking Report
httpslidepdfcomreaderfullbain-co-european-banking-report 932
bull European banksrsquo return on risk recovered from the2008 financial crisis peaking in 2010 with an aver-age 13 RoRWA Since then however RoRWA
has declined to 05 on average This translatesto a level of profitability below the cost of capitalwhich means banks are destroying value
bull Looking beneath the average European banksrsquoRoRWAs correlated closely with economic growthover the past five years Banks in countries that sawstrong GDP growth like Turkey posted dramaticallyhigher performance and growth in both assetsand risk-weighted assets (RWA) than those in thecore European countries
bull Banks in high-growth countries also consistently
exceeded their cost of capital whereas banks incore Europe have not covered their cost of capitalonly coming close to that bar in 2010 Core Europeexperienced a major amount of deleveragingdespite extraordinary initiatives such as theEuropean Central Bankrsquos long-term refinancingoperation (LTRO)
bull The quality of management plays a major role inindividual bank performance particularly in theslow-growth countries There was a wide rangeof RoRWAs among banks in those markets for each
of the five yearsbull In 2012 the biggest factors determining significant
value destruction were cost of risk as loan-lossprovisions rose and increased operating costwhich trended up as a percent of risk-weightedassets More active management of the balance sheethelped raise revenues but fees and commissionsprogressively declined
bull The larger the bank the better its performance onaverage The 10 biggest banks used their improve-
ments in financial margins and lower risk costs tocome close to earning their cost of capital
bull Other large regional banks managed to keep oper-ating costs lower than the 10 biggest but still fellwell short of their capital hurdle Smaller local banksfared the worst posting a negative RoRWA in 2012They have been forced to undertake a major de-leveraging of their balance sheets
1Five years of
RoRWA in Europe
A bumpy
landscape
7222019 Bain amp Co- European Banking Report
httpslidepdfcomreaderfullbain-co-european-banking-report 1032
European banking | Bain amp Company Inc
Page 8
Although RoRWA correlates with economic growth there is still substantial variation among banks
Note Each observation is composed of a bankrsquos RoRWA in a given year and the respective countryrsquos year-over-year GDP growth rate in that yearSources Banksrsquo financial statements 2008ndash2012 n=605 Bureau van Dijk Bain analysis
RoRWA per bank and year 2008ndash2012
-5
-3
0
3
5
-10 0 10 20 30
95 ofobservationsfall withinthis band
Recessionno growthManagement has a major role
in determining RoRWA
Mediumhigh growthManagement has amore limited role in
achieving high RoRWA
Very high growthManagementrsquos most important role
is to optimize strategic asset allocationfor revenue generation
GDP growth by country and year 2008ndash2012
Bank profitability has eroded since the post-crisis peak of 2010
Return on equity (ROE) = Pretax profitaverage shareholdersrsquo equitySources Banksrsquo financial statements 2008ndash2012 n=121 Bureau van Dijk Bain analysis
European-wide RoRWA
0
1
2
200800
2009
07
2010 2011
09
2012
05
RWA (euroB)
33576
08
11690
44
30229
64
11555
-32
31770
104
11726
52
33528
75
11986
53
33028
49
11207
29
Total assets (euroB)
Annual GDP growth ()
ROE ()
13
7222019 Bain amp Co- European Banking Report
httpslidepdfcomreaderfullbain-co-european-banking-report 1132
European banking | Bain amp Company Inc
Page 9
Banks in core Europe have not covered their cost of capital over the past five years
The range represents the level of RoRWA required to cover the banksrsquo cost of capital and varies by bank size and country analysis of 88 banks based in AustriaBelgium France Germany Ireland Italy the Netherlands the Nordics Portugal Spain Switzerland and the UKSources Banksrsquo financial statements 2008ndash2012 Bain analysis
RoRWA weighted average
RWA (euroB)
32373
-15
10899
29129
51
10846
30366
88
10785
31957
53
10869
31219
22
10047
Total assets (euroB)
ROE ()
2008
-01
2009
06
2010 2011
06
2012
01
Range ofRoRWArequiredto coverthe costof capital
11
-1
0
1
2
3
4
1816
while banks in high-growth countries consistently exceeded their cost of capital
The range represents the level of RoRWA required to cover the banksrsquo cost of capital and varies by bank size and country analysis of 33 banks based in theCommonwealth of Independent States (CIS) Poland South Africa and TurkeySources Banksrsquo financial statements 2008ndash2012 Bain analysis
RoRWA weighted average
RWA (euroB)
1203
226
791
1100
206
708
Total assets (euroB)
ROE ()
Range ofRoRWArequiredto coverthe costof capital
0
1
2
3
4
2008
24
2009
22
1404
250
941
2010
32
1571
267
1117
2011
31
1810
247
1160
2012
33
2119
7222019 Bain amp Co- European Banking Report
httpslidepdfcomreaderfullbain-co-european-banking-report 1232
European banking | Bain amp Company Inc
Page 10
Higher operating expenditure and cost of risk caused banksrsquo value destruction in 2012
Long-term refinancing operations (LTRO) 2011 ~euro500 billion LTRO 2012 ~euro750 billion (including repayment) corresponding to 2011 total assets of ~euro330 trillionand 2012 total assets of ~euro322 trillionSources Banksrsquo financial statements 2008ndash2012 n=121 Bain analysis
20122010 2011
RoRWA ()
Total assets (euroB)
Tier 1 capital (euroB)
RWAtotal assets ()
Net interest incomeRWA ()
Financial marginRWA ()
Fees and commissions +
other revenuesRWA ()
Operating expenditureRWA ()
Loan-loss provisionsRWA ()
05
33028
1510
34
36
09
17
43
15
13
31770
1363
37
35
10
17
37
12
09
33528
1426
36
35
05
20
40
12
2009
07
30229
1261
38
34
09
17
35
18
00
33576
1079
35
31
-07
22
36
11
2008Main components in
European-wide RoRWA Major trends
Partial deleveraging of assets
Strengthening of capital
Fairly constant risk profile despite
deleveraging of assets
Overall margin from balance-sheet
management increasing
Continuous pressure on fees
and commissions
Inability to reduce costs in
proportion to deleveraging
Rising cost of credit
7222019 Bain amp Co- European Banking Report
httpslidepdfcomreaderfullbain-co-european-banking-report 1332
European banking | Bain amp Company Inc
Page 11
In core Europe banks increased capital ratios and revenues but did not optimize costs
Notes Components in bold are direct components of the RoRWA calculation changes in red are negative trendsSources Banksrsquo financial statements 2008ndash2012 n=88 Bain analysis
2012 Change2008minus20122010 2011
Total RWA (euroB)
Total assets (euroB)
RWAtotal assets ()
Tier 1 ratio ()
Total Tier 1 (euroB)
Net interest incomeRWA ()
Financial marginRWA ()
Net interest incometotal assets ()
Financial margintotal assets ()
Net interest income + financial marginRWA ()
Fees + other revenuesRWA ()
OpexRWA ()
Costincome ()
Loan-loss provisionsRWA ()
Nonperforming loan ratio ()
Coverage ratio ()
10047
31219
32
133
1336
34
09
11
03
43
16
43
70
15
55
49
-78
-36
-2 pts
+43 pts
+36
+05 pts
+16 pts
+01 pts
+05 pts
+21 pts
-06 pts
+07 pts
-10 pts
+05 pts
+30 pts
-12 pts
10785
30366
36
114
1230
33
10
12
04
43
16
37
62
12
46
50
10869
31957
34
118
1280
33
05
11
02
39
19
40
68
12
47
51
2009
10846
29129
37
107
1159
32
09
12
03
41
17
35
61
17
40
54
10899
32373
34
90
981
29
-07
10
-02
22
22
35
80Opextotal assets () 14 +02 pts13 141312
10
25
61
Cross-selling
Asset leverage
Balance-sheet management
Cost structure
Cost of risk
2008Components
In high-growth countries higher financial margins offset lower fees and relatively high nonperforming loans
affected cost of risk
Notes Components in bold are direct components of the RoRWA calculation changes in red are negative trendsSources Banksrsquo financial statements 2008ndash2012 n=33 Bain analysis
2012 Change2008minus2012
2010 2011
Total RWA (euroB)
Total assets (euroB)
RWAtotal assets ()
Tier 1 ratio ()
Total Tier 1 (euroB)
Net interest incomeRWA ()
Financial marginRWA ()
Net interest incometotal assets ()
Financial margintotal assets ()
Net interest income + financial marginRWA ()
Fees + other revenuesRWA ()OpexRWA ()
Costincome ()
Opextotal assets ()
Loan-loss provisionsRWA ()
Nonperforming loan ratio ()
Coverage ratio ()
1160
1810
64
150
174
57
05
36
04
62
2543
45
27
11
49
64
+47
+50
-2 pts
+27 pts
+78
-01 pts
+05 pts
-02 pts
+04 pts
+05 pts
-02 pts+01 pts
-2 pts
-01 pts
-07 pts
+12 pts
+5 pts
941
1404
67
141
133
55
05
37
04
60
2741
43
28
15
69
63
1117
1571
71
131
147
50
03
35
02
53
2438
45
27
08
55
64
2009
708
1100
64
144
102
67
08
43
05
75
2743
39
28
36
82
57
791
1203
66
123
97
58
00
38
00
58
2742
47
28
18
37
59
Cross-selling
Asset leverage
Balance-sheet management
Cost structure
Cost of risk
2008Components
7222019 Bain amp Co- European Banking Report
httpslidepdfcomreaderfullbain-co-european-banking-report 1432
European banking | Bain amp Company Inc
Page 12
Europersquos 10 biggest banks come closest to earning their cost of capital
The range represents the level of RoRWA required to cover the banksrsquo cost of capital and varies by bank size and country Analysis of the 10 largest Europe-headquarteredbanks by market capitalization with a pan-European presence a universal bank business model and assets of at least euro650 billion (Barclays BNP ParibasCreacutedit Agricole Credit Suisse Deutsche Bank HSBC Nordea Santander UBS and UniCredit)Sources Banksrsquo financial statements 2008ndash2012 Bain analysis
RoRWA weighted average
RWA (euroB)
1340922
3514
1133694
3474
Total assets (euroB)
ROE ()
Range ofRoRWArequiredto coverthe costof capital
12395123
3698
13239107
3765
1338559
3639
2008
02
2009 2010
17
2011
14
2012
09
12
0
1
2
18
16
Among the 10 biggest banks lower risk costs and improved margins offset high Opex
Notes Components in bold are direct components of the RoRWA calculation changes in red are negative trendsSources Banksrsquo financial statements 2008ndash2012 n=10 Bain analysis
2012 Change2008minus2012
2010 2011
Total RWA (euroB)
Total assets (euroB)
RWAtotal assets ()
Tier 1 ratio ()
Total Tier 1 (euroB)
Net interest incomeRWA ()
Financial marginRWA ()
Net interest incometotal assets ()
Financial margintotal assets ()
Net interest income + financial marginRWA ()
Fees + other revenuesRWA ()OpexRWA ()
Costincome ()
Opextotal assets ()
Loan-loss provisionsRWA ()
Nonperforming loan ratio ()
Coverage ratio ()
3639
13385
27
131
477
38
10
10
03
49
2452
71
14
12
45
54
+36
-02
+1 pts
+46 pts
+60
+05 pts
+18 pts
+02 pts
+05 pts
+23 pts
-06 pts+09 pts
-6 pts
+03 pts
+01 pts
+21 pts
-24 pts
3698
12395
30
115
426
37
14
11
04
51
2346
62
14
11
46
52
3765
13239
28
116
437
38
09
11
03
47
2648
65
14
11
44
53
2009
3474
11336
31
110
380
37
14
11
04
51
2244
60
13
17
35
71
3514
13409
26
85
299
33
-07
09
-02
26
3043
77
11
11
24
78
Cross-selling
Asset leverage
Balance-sheet management
Cost structure
Cost of risk
2008Components
7222019 Bain amp Co- European Banking Report
httpslidepdfcomreaderfullbain-co-european-banking-report 1532
European banking | Bain amp Company Inc
Page 13
Other large European banks have fallen well short of earning their cost of capital
The range represents the level of RoRWA required to cover the banksrsquo cost of capital and varies by bank size and country Analysis of 13 banks with assets of at leasteuro200 billion a universal bank business model and small to medium-sized subsidiaries outside their core geography (ABN AMRO Group BBVA Commerzbank Danske BankErste ING Intesa Sanpaolo KBC Lloyds Rabobank RBS Socieacuteteacute Geacuteneacuterale and Standard Chartered)Sources Banksrsquo financial statements 2008ndash2012 Bain analysis
RoRWA weighted average
RWA (euroB)
Total assets (euroB)
ROE ()
Range ofRoRWArequiredto coverthe costof capital
861607
3188
2008
01
822237
3468
2009
04
850978
3339
2010
867422
3214
2011
03
888640
3115
2012
06
10
0
1
2
18
16
Other large European banks had Opex lower than the big 10 which offset pressure on fee income and
higher cost of risk
Notes Components in bold are direct components of the RoRWA calculation changes in red are negative trendsSources Banksrsquo financial statements 2008ndash2012 n=13 Bain analysis
2012 Change2008minus2012
2010 2011
Total RWA (euroB)
Total assets (euroB)
RWAtotal assets ()
Tier 1 ratio ()
Total Tier 1 (euroB)
Net interest incomeRWA ()
Financial marginRWA ()
Net interest incometotal assets ()
Financial margintotal assets ()
Net interest income + financial marginRWA ()
Fees + other revenuesRWA ()OpexRWA ()
Costincome ()
Opextotal assets ()
Loan-loss provisionsRWA ()
Nonperforming loan ratio ()
Coverage ratio ()
3115
8886
35
129
402
35
12
12
04
47
1239
66
14
14
56
50
-23
+31
-19 pts
+39 pts
+40
+04 pts
+17 pts
+01 pts
+06 pts
+21 pts
-09 pts+02 pts
-12 pts
No change
+04 pts
+22 pts
+3 pts
3339
8509
39
114
382
34
11
13
04
45
1233
57
13
14
54
48
3214
8674
37
119
382
35
03
13
01
38
1739
70
14
14
57
48
2009
3468
8222
42
102
353
31
10
13
04
41
1532
58
14
19
50
46
3188
8616
37
90
287
31
-05
12
-02
26
2137
78
14
10
34
47
Cross-selling
Asset leverage
Balance-sheet management
Cost structure
Cost of risk
2008Components
7222019 Bain amp Co- European Banking Report
httpslidepdfcomreaderfullbain-co-european-banking-report 1632
European banking | Bain amp Company Inc
Page 14
Local banks have seen their RoRWA sharply deteriorate in recent years
The range represents the level of RoRWA required to cover the banksrsquo cost of capital and varies by bank size and country analysis of 65 banks operating exclusivelywithin a single national or regional marketSources Banksrsquo financial statements 2008ndash2012 Bain analysis
RoRWA weighted average
RWA (euroB)
Total assets (euroB)
ROE ()
Range ofRoRWArequiredto coverthe costof capital
10347
-68
4198
9571
20
3904
9462
59
3748
10044
20
3890
8948
-42
3293
2008
-06
2009
02
2010
07
2011
02
2012
-11
-2
-1
0
1
21816
Local banks have experienced sharp deleveraging higher cost of risk more nonperforming loans and flat revenues
Notes Components in bold are direct components of the RoRWA calculation changes in red are negative trendsSources Banksrsquo financial statements 2008ndash2012 n=65 Bain analysis
2012 Change2008minus2012
2010 2011
Total RWA (euroB)
Total assets (euroB)
RWAtotal assets ()
Tier 1 ratio ()
Total Tier 1 (euroB)
Net interest incomeRWA ()
Financial marginRWA ()
Net interest incometotal assets ()
Financial margintotal assets ()
Net interest income + financial marginRWA ()
Fees + other revenuesRWA ()OpexRWA ()
Costincome ()
Opextotal assets ()
Loan-loss provisionsRWA ()
Nonperforming loan ratio ()
Coverage ratio ()
3293
8948
37
139
457
28
06
10
02
34
1135
71
13
20
64
46
-215
-135
-38 pts
+44 pts
+15
+03 pts
+14 pts
No change
+06 pts
+17 pts
-05 pts+08 pts
-17 pts
+02 pts
+1 pts
+44 pts
-18 pts
3748
9462
40
113
422
28
05
11
02
33
1430
65
12
09
40
52
3890
10044
39
118
461
28
03
11
01
31
1532
69
13
12
43
51
2009
3904
9571
41
109
426
28
04
11
02
32
1430
65
12
14
36
51
4198
10347
41
94
396
25
-09
10
-04
16
1628
87
11
10
20
64
Cross-selling
Asset leverage
Balance-sheet management
Cost control
Cost of risk
2008Components
7222019 Bain amp Co- European Banking Report
httpslidepdfcomreaderfullbain-co-european-banking-report 1732
European banking | Bain amp Company Inc
Page 15
7222019 Bain amp Co- European Banking Report
httpslidepdfcomreaderfullbain-co-european-banking-report 1832
7222019 Bain amp Co- European Banking Report
httpslidepdfcomreaderfullbain-co-european-banking-report 1932
bull Countries with strong economic growth led the2012 RoRWA rankings Turkey took pole positionwith a 49 RoRWA In core Europe the Nordic
countries posed the strongest performance witha 19 RoRWA followed by Austria and theNetherlands The largest economies of Germanythe UK and France trailed behind
bull Banks in Italy Portugal Spain and Ireland whichhave been mired in the sovereign debt crisis anddeep economic recessions turned in the weakestRoRWA performances
bull Among the core European countries changes inRoRWAs from 2008 to 2012 stemmed mainly
from changes in three components net interestincome financial margin and loan-loss provisions
bull Countries that posted large positive changesmdashincluding Germany the Netherlands the Nordiccountries and the UKmdashbenefited from higherfinancial margins more control of operatingexpenditure and lower cost of risk Countries withlarge drops in RoRWAs were hurt by infl exiblecost structures which prevented them from shrinkingtheir production costs and a cost of risk that was
almost double the averagebull Northern Europe dominated the league tables
whether one looks at the 2012 leaders or themost improved banks For example the RoRWAleaders among both local and the 10 biggestbanks included banks in the Nordic countriesfollowed by those in the UK France Austria andthe Netherlands
bull In the most improved group banks in Switzer-land the Netherlands and Germany made a
strong showing
bull In high-growth countries Turkey and the Common-wealth of Independent States (CIS) took leadingpositions for the most improved banks and Turkeyfor the 2012 leaders
2Country and cluster
league tables
7222019 Bain amp Co- European Banking Report
httpslidepdfcomreaderfullbain-co-european-banking-report 2032
European banking | Bain amp Company Inc
Page 18
High-growth countries led the RoRWA rankings in 2012
Note For CIS the Netherlands Belgium Germany UK France Portugal and Spain one or two Tier-3 banks had not reported 2012 data by time of publicationso the analysis used 2011 data for those few banksSources Banksrsquo financial statements 2008ndash2012 n=121 Bain analysis
Rank 2012 RoRWA ()
Turkey
Poland
South Africa
CIS
Nordics
Austria
Netherlands
Belgium
Germany
UK
France
Switzerland
Italy
Portugal
Spain
Ireland
1
2
3
4
5
6
7
8
9
10
11
12
13
14
15
16
49
47
31
27
19
12
10
08
07
05
03
01
-06
-08
-17
-48
480
167
340
826
2357
334
2186
911
5514
7062
6320
1812
2127
426
2917
312
2012 total assets (euroB)Country 2008 RoRWA ()
33
41
35
10
13
19
-20
-25
-14
00
08
-76
07
10
19
10
7222019 Bain amp Co- European Banking Report
httpslidepdfcomreaderfullbain-co-european-banking-report 2132
European banking | Bain amp Company Inc
Page 19
In core European countries RoRWA changes from 2008 to 2012hellip
Note Averages are weighted for the total size of the respective components in each countrySources Banksrsquo financial statements 2008ndash2012 n=71 Bain analysis
RoRWA weighted average
-3
-2
-1
0
1
2
2008 average2012 average
UK
05
France
08
Germany
-14
07
Spain
19
-17
Nordics
13
19
Italy
07
-06
Netherlands
-20
10
2008 2012
0003
hellipwere spurred mainly by net interest income financial margin and loan-loss provisions
Note Averages are weighted for the total sizes of the respective indicators in each countrySources Banksrsquo financial statements 2008-2012 n=71 Bain analysis
NordicsGermany Spain
Total assets (euroB)
Total RWA (euroB)
Net interest incomeRWA ()
Financial marginRWA ()
Fees and commissions +other revenuesRWA ()
OpexRWA ()
Loan-loss provisionsRWA ()
France
7751
UK
2008 2012
AverageItaly Netherlands
7039
2474 2467
31 30
-02 12
26 15
41 42
14 10
5857 5715
1532 1327
26 38
-03 16
30 13
40 54
05 10
6054 5419
1534 1317
26 32
-19 07
14 17
27 43
08 06
1976 2917
1068 1315
36 43
06 06
17 10
27 35
13 41
1960 2357
790 735
27 32
-02 12
17 10
24 28
05 05
1990 2127
1266 1139
32 28
01 04
18 18
33 35
10 22
2263 2054
729 656
29 41
-17 06
15 10
39 38
09 09
2071 3947
928 1279
30 34
-05 10
17 14
32 41
08 15
7222019 Bain amp Co- European Banking Report
httpslidepdfcomreaderfullbain-co-european-banking-report 2232
European banking | Bain amp Company Inc
Page 20
These banks are the 2012 RoRWA leaders of their geographic cluster
Sources Banksrsquo financial statements 2008ndash2012 Bain analysis
Rank 2012 RoRWA ()
Nordics
UK
France
UK
Austria
Netherlands
Nordics
Nordics
Nordics
Turkey
Turkey
Turkey
1
2
3
1
2
3
1
2
3
1
2
3
19
18
16
23
17
16
40
39
36
158
132
48
Nordea
HSBC
BNP Paribas
Standard Chartered
Erste
ING
Swedbank
Sparebank 1 Group
Handelsbanken
Ziraat Bankasi
Akbank
Tuumlrkiye Halk
Bank Country 2008 RoRWA ()
16
08
06
24
19
02
20
NA
21
193
106
38
10biggest
Otherlarge
European
Local
High-growthcountries
These banks showed the biggest improvements in RoRWA over the past five years
Sources Banksrsquo financial statements 2008ndash2012 Bain analysis
Rank 2008ndash2012 change( points)
Switzerland
Switzerland
Germany
Belgium
UK
Netherlands
Netherlands
Belgium
Germany
CIS
Turkey
CIS
1
2
3
1
2
3
1
2
3
1
2
3
+83
+68
+21
+29
+26
+14
+64
+50
+33
+71
+26
+13
UBS
Credit Suisse
Deutsche Bank
KBC
RBS
ING
RBS Holdings NV
BNP Paribas Fortis
Bayerische Landesbank
Gazprombank
Akbank
VTB 24
Bank Country 2008 RoRWA ()
-92
-58
-19
-19
-37
02
-91
-45
-26
-56
106
05
10biggest
Otherlarge
European
Local
High-growthcountries
7222019 Bain amp Co- European Banking Report
httpslidepdfcomreaderfullbain-co-european-banking-report 2332
European banking | Bain amp Company Inc
Page 21
7222019 Bain amp Co- European Banking Report
httpslidepdfcomreaderfullbain-co-european-banking-report 2432
7222019 Bain amp Co- European Banking Report
httpslidepdfcomreaderfullbain-co-european-banking-report 2532
bull Europersquos environment continues to be volatile andinvestors are seeking better information about abankrsquos stability asset quality and key factors that
generate value RoRWA plays a useful role hereby focusing on the balance sheetmdashwhich enablescomparison between a bank and its peersmdashand byidentifying the factors influencing bank performance
bull Banks still need to address challenges along eachdimension of RoRWA in order to lift their profit-ability levels above the cost of capital In recent
years the profitability of lending assets has beensustained mainly by the fi nancial componentsincluding a boost from LTRO To raise asset prof-itability banks will have to better manage their
capital allocations and risk profilesbull The pressure on fee income will continue To offset
that trend banks should turn to their close clientrelationships for new sources of revenues
bull Lowering operating costs is the dimension thatwarrants managementrsquos attention at any bankregardless of size or location Initiatives that havethe greatest potential for tackling structural costsinclude adopting digital technologies and modern-izing IT platforms optimizing processes from endto end through outsourcing offshoring and other
means and expanding global procurement Suchinitiatives are essential for survival in an industrygoing through discontinuous change
bull Deleveraging the loan portfolio for riskier clients isa pressing issue which still poses significant threatsfor local banks In countries with a higher cost ofrisk and stagnant or negative GDP growth rateslocal banks may face further painful restructuring
bull Astute management of the cost of risk includingtaking a portfolio perspective offers opportunities
for most banksmdashin part to meet the new require-ments of Basel III and reassure rating agencies
bull Further consolidation of the local and other largebanks over the coming years will likely benefitthe 10 biggest banks and those in high-growthcountries These high-growth countries offer thegreatest opportunities for RoRWA growth for largeand pan-European players looking to diversifytheir portfolios
3Strategic
perspectives and
implications for
management
7222019 Bain amp Co- European Banking Report
httpslidepdfcomreaderfullbain-co-european-banking-report 2632
European banking | Bain amp Company Inc
Page 24
Significant restructuring is warranted for all banks but the nature of the challenge varies by geography
Source Bain analysis
10 biggest Strategic issueHigh-growth
countries
Other large
EuropeanLocal
Cross-selling
Balance-sheet
management
Cost structure
Cost of risk
Major threatThreatOpportunityMajor opportunity
Profitability of the asset portfolio has been sustained mainly by the
financial component Deleveraging of the loan portfolio for riskier
clients has been only partially successful and the risk profile of
the portfolio still has a long way to go
To counter pressure on fees banks should work systematically on
cross-selling opportunities through initiatives like client-focused
service models and CRM support
To further reduce costs banks should pursue new digital technologies
optimized processes through such means as outsourcing and offshoring
modernized IT platforms and global procurement initiatives
Active management of cost of risk demands more systematic solutions
bull NPL and LLP trends are threatening the stability of the overall
system and not only in individual countries such as Greece
bull Management of risky clients has become a core business and capability
bull Managing costs of risk demands an integrated portfolio approach
7222019 Bain amp Co- European Banking Report
httpslidepdfcomreaderfullbain-co-european-banking-report 2732
European banking | Bain amp Company Inc
Page 25
Assets (euroB)
Erste (AT)
Raiffeisen Bank (AT)
BNP Paribas Fortis
KBC
Belfius Banque
ING Belgium SANV
Creacutedit Agricole Groupe
BNP Paribas
Groupe Socieacuteteacute Geacuteneacuterale
Groupe BPCE
Creacutedit Mutuel
Deutsche Bank
Commerzbank AGKfW
DZ Bank AG
UniCredit Bank AG
2138
1202
2723
2569
2129
1691
17930
15439
12307
11475
6051
20123
63595116
4072
3483
Austria
Belgium
France
Germany
Country Bank Cluster
Other large
Local
Local
Other large
Local
Local
10 biggest
10 biggest
Other large
Local
Local
10 biggest
Other largeLocal
Local
Local
Ireland
Landesbank Baden-Wuumlrttemberg
Bayerische Landesbank
NORDLB
Helaba
HSH Nordbank
DekaBank
Landesbank Berlin Holding
Santander Consumer Bank
Hamburger Sparkasse
Deutsche Apotheker - und Aumlrztebank
Sparkasse KoumllnBonn
Kreissparkasse Koumlln
Bank of Ireland
Allied Irish Banks
permanent tsb Group Hldgs Plc
Intesa Sanpaolo
3363
2868
2256
1993
1306
1297
1183
403
396
379
299
248
1481
1225
409
6735
Local
Local
Local
Local
Local
Local
Local
Local
Local
Local
Local
Local
Other large
10 biggest
Local
Other large
Unicredit Group
Monte dei Paschi di Siena
4639
2189
10 biggest
Local
UBI Banca Group
Banco Popolare
BNL
Banca Popolare dellrsquoEmilia Romagna
Banca Popolare di Milano
Gruppo Banca Carige
Cariparma
Banca Popolare di Vicenza
Veneto Banca
1324
1319
912
616
525
493
493
467
402
Local
Local
Local
Local
Local
Local
Local
Local
Local
Italy
2011 assets
Bca Popdi Sondrio 322 Local
Credito Emiliano
Credito Valtellinese
Banca delle Marche
307
299
227
Local
Local
Local
List of banks analyzed by country and assets
10 biggest other large local
7222019 Bain amp Co- European Banking Report
httpslidepdfcomreaderfullbain-co-european-banking-report 2832
European banking | Bain amp Company Inc
Page 26
Assets (euroB)Country Bank Cluster
ING
Rabobank Group
ABN AMRO Group
SNS Reaal
RBS Holdings NV
8361
7524
3944
1322
710
Netherlands
Other large
Other large
Other large
Local
Local
Nordea 6774 10 biggest
Danske Bank
DNB
4682
3028
Other large
Local
SEB
Handelsbanken
Swedbank
Pohjola Bank
2818
2742
2121
998
Local
Local
Local
Local
Nordics
Jyske Bank 347 Local
Sparebank 1 Group 62 Local
Caixa Geral de Depositos 1169 Local
Millenium BCP
Banco Espiacuterito Santo
897
837
Local
Local
Banco BPI
Santander Totta SGPS
Caixa Econoacutemica Montepio Geral
Creacutedito Agriacutecola Muacutetuo
446
414
215
142
Local
Local
Local
Local
Portugal
BANIF 140 Local
SantanderBBVA
la Caixa
Banco Financiero y de Ahorros
Banco Sabadell SA
122826378
3591
3092
1615
Spain
10 biggestOther large
Local
Local
Local
Banco Popular
Banco Mare Nostrum
1576
634
Local
Local
UBS
Credit Suisse
10448
7669Switzerland
10 biggest
10 biggest
HSBC 20939 10 biggest
Barclays
Royal Bank of Scotland
17603
11521
10 biggest
Other large
Lloyds Banking Group
Standard Chartered
Nationwide Building Society
Co-operative Bank
11395
4950
2417
611
Other large
Other large
Local
Local
UK
Clydesdale Bank 545 Local
Yorkshire Building Society 413 Local
Virgin Money 223 Local
2011 assets
List of banks analyzed by country and assets
10 biggest other large localmdashcontinued
7222019 Bain amp Co- European Banking Report
httpslidepdfcomreaderfullbain-co-european-banking-report 2932
European banking | Bain amp Company Inc
Page 27
Assets (euroB)
Sberbank
VTB 24
PKO BP
Bank Pekao
BRE Bank
ING Bank Slaski
Standard Bank
Absa
FirstRand
Nedbank
Investec
Tuumlrkiye İş Bankası
Tuumlrkiye Garanti
Ziraat Bankasi
Akbank
Yapı ve Kredi
3781
1857
463
361
244
187
928
766
729
647
330
869
777
708
706
568
CIS
Poland
South Africa
Turkey
Country Bank
Tuumlrkiye Halk Bankasi
Tuumlrkiye Vakıflar
Finansbank
471
467
239
Gazprombank
Russian Agricultural Bank
Alfa-Bank
Nomos-Bank
UniCredit Bank Russia
712
358
357
225
218
AKB Rosbank
Promsvyazbank
ZAO Raiffeisenbank
URALSIB Bank
Russian Standard Bank
AKB Probusinessbank
200
173
160
113
74
35
2011 assets
Bank Zachodni WBK + Kredyt Bank
Getin NobleBank
Bank Millennium
143
141
126
List of banks analyzed by country and assets
High-growth countries
7222019 Bain amp Co- European Banking Report
httpslidepdfcomreaderfullbain-co-european-banking-report 3032
European banking | Bain amp Company Inc
Page 28
Key contacts in Bainrsquos European Financial Services practice
Franco Baronio in Milan (francobaroniobaincom)Rocco DrsquoAcunto in Milan (roccodacuntobaincom)
Ada Di Marzo in Paris (adadimarzobaincom)
Bertrand Facq in Warsaw (bertrandfacqbaincom)
Fabrice Franzen in Johannesburg (fabricefranzenbaincom)
Thomas Herbeck in Frankfurt (thomasherbeckbaincom)
Karaca Kestelli in Istanbul (karacakestellibaincom)
Nicolaacutes Lopez in Madrid (nicolaslopezbaincom)
Niels Peder Nielsen in Copenhagen (nielspedernielsenbaincom)
Andrea Oldrini in Milan (andreaoldrinibaincom)
Mathijs Robbens in Amsterdam (mathijsrobbensbaincom)
Visar Sala in Moscow (visarsalabaincom)
Walter Sinn in Frankfurt (waltersinnbaincom)Joatildeo Soares in London (joaosoaresbaincom)
Acknowledgments
The authors would like to thank the following Bain colleagues for their valuable support in producing this report
Sonal Chawla Christian Duus Franccedilois Fastrez Farsan Ghassim and Shikha Mahato
See these related Bain perspectives at wwwbaincom
bull Managing risk and capital
bull How Europersquos banks can return to health
bull The digital challenge to retail banks
7222019 Bain amp Co- European Banking Report
httpslidepdfcomreaderfullbain-co-european-banking-report 3132
7222019 Bain amp Co- European Banking Report
httpslidepdfcomreaderfullbain-co-european-banking-report 3232
For more information visit wwwbaincom
Share983140 983105m983138io983150 Tru Rs983157983148ts
Bain amp Company is the management consulting firm that the worldrsquos business leaders come to whenthey want results
Bain advises clients on strategy operations technology organization private equity and mergers and acquisitions We develop
practical customized insights that clients act on and transfer skills that make change stick Founded in 1973 Bain has
48 offices in 31 countries and our deep expertise and client roster cross every industry and economic sector Our clients
have outperformed the stock market 4 to 1
What sets us apart
We believe a consulting firm should be more than an adviser So we put ourselves in our clientsrsquo shoes selling outcomes not
projects We align our incentives with our clientsrsquo by linking our fees to their results and collaborate to unlock the full potential
of their business Our Results Deliveryreg process builds our clientsrsquo capabilities and our True North values mean we do theright thing for our clients people and communitiesmdashalways
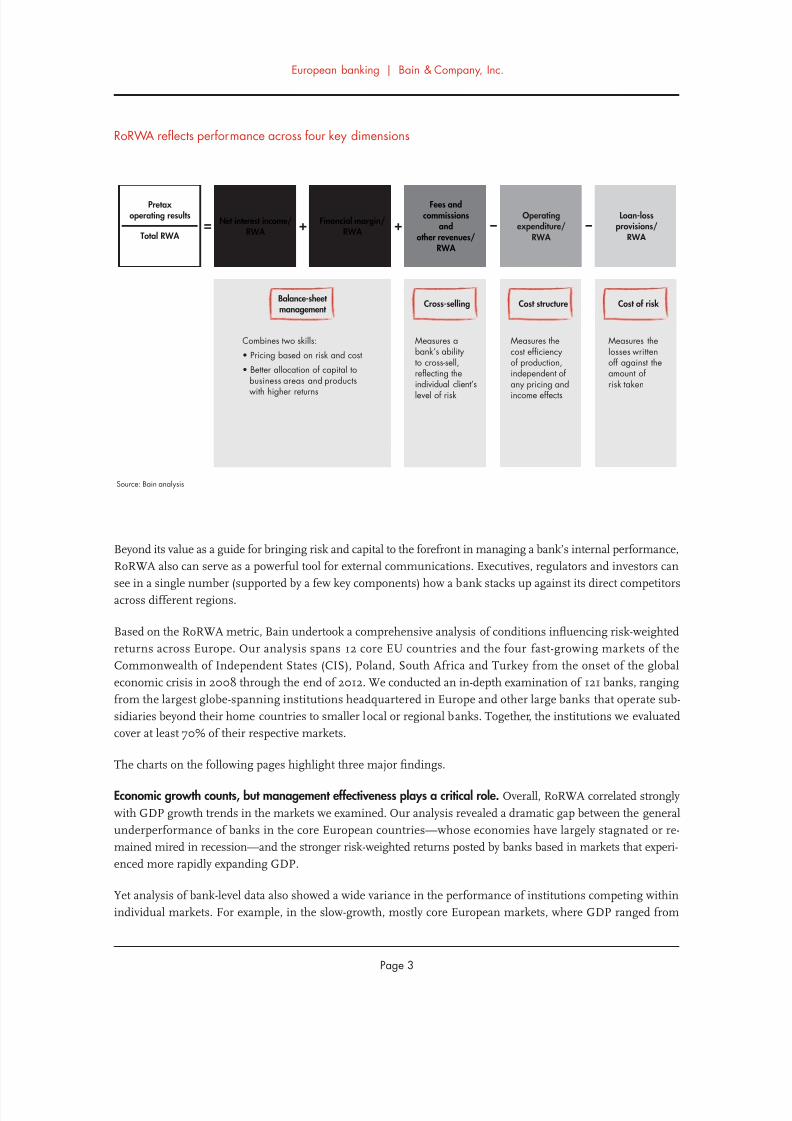
7222019 Bain amp Co- European Banking Report
httpslidepdfcomreaderfullbain-co-european-banking-report 532
European banking | Bain amp Company Inc
Page 3
Beyond its value as a guide for bringing risk and capital to the forefront in managing a bankrsquos internal performance
RoRWA also can serve as a powerful tool for external communications Executives regulators and investors can
see in a single number (supported by a few key components) how a bank stacks up against its direct competitorsacross different regions
Based on the RoRWA metric Bain undertook a comprehensive analysis of conditions influencing risk-weighted
returns across Europe Our analysis spans 12 core EU countries and the four fast-growing markets of the
Commonwealth of Independent States (CIS) Poland South Africa and Turkey from the onset of the global
economic crisis in 2008 through the end of 2012 We conducted an in-depth examination of 121 banks ranging
from the largest globe-spanning institutions headquartered in Europe and other large banks that operate sub-
sidiaries beyond their home countries to smaller local or regional banks Together the institutions we evaluated
cover at least 70 of their respective markets
The charts on the following pages highlight three major findings
Economic growth counts but management effectiveness plays a critical role Overall RoRWA correlated strongly
with GDP growth trends in the markets we examined Our analysis revealed a dramatic gap between the general
underperformance of banks in the core European countriesmdashwhose economies have largely stagnated or re-
mained mired in recessionmdashand the stronger risk-weighted returns posted by banks based in markets that experi-
enced more rapidly expanding GDP
Yet analysis of bank-level data also showed a wide variance in the performance of institutions competing within
individual markets For example in the slow-growth mostly core European markets where GDP ranged from
RoRWA reflects performance across four key dimensions
Source Bain analysis
= Net interest incomeRWA + + ndashndashFinancial margin
RWA
Fees andcommissions
andother revenues
RWA
Operatingexpenditure
RWA
Loan-lossprovisions
RWA
Measures abankrsquos abilityto cross-sellreflecting theindividual clientrsquos
level of risk
Cross-selling
Measures thecost efficiencyof productionindependent of any pricing and
income effects
Cost structure
Measures thelosses writtenoff against theamount ofrisk taken
Cost of risk
Combines two skills
bull Pricing based on risk and cost
bull Better allocation of capital to business areas and products
with higher returns
Balance-sheet management
Pretax operating results
Total RWA
7222019 Bain amp Co- European Banking Report
httpslidepdfcomreaderfullbain-co-european-banking-report 632
European banking | Bain amp Company Inc
Page 4
negative 10 to 5 over the five-year period RoRWA by bank varied widely in every year Clearly for these
markets the quality of an individual bankrsquos management plays a major role in determining performance
In markets where GDP growth exceeded 5 by contrast we found considerably less variation in bank-level
RoRWA performance As the rising tide lifted all banks managementrsquos role in shaping returns appears to have
been more circumscribed
Most banks fail to earn their cost of capital Bain determined that the RoRWA required for banks to cover their
cost of capital fell within a range of 16 to 21 depending on a bankrsquos size and the country in which it is based
The RoRWA of most banks has failed to clear that cost-of-capital hurdle on average in any year since 2008
falling well short in every year except 2010 Once again however we found a wide variation between the bank
performance in the core European countries where RoRWA was consistently below the cost of capital and that
in the high-growth countries where RoRWA easily cleared the capital-cost bar
Looking at the banksrsquo underlying strengths and weaknesses by market we identified several major pain points
that pinched banksrsquo RoRWAs in the core European countries
The need to shed debt and rely on higher-cost equity to strengthen their balance sheets reduced these banksrsquo total
risk-weighted assets by nearly 8 between 2008 and 2012 Meanwhile their cost of risk increased sharply as
stagnant or shrinking economies forced them to boost their loan-loss provisions in the face of steeper write-offs
of bad credit Interest margins that remained at low levels shrinking fee incomes and higher operating costs also
added downward pressure to banksrsquo RoRWAs
Size matters Within core Europe the 10 biggest pan-European banks (by total assets and market capitalization)
fared best overall Helped by large increases in net interest income and strong improvements in financial margins
their RoRWAs came closest to earning their cost of capital
Other large European banks with subsidiaries outside their home countries reduced their operating costs partially
offsetting declines in risk-weighted fee income and higher loan-loss provisions But the RoRWAs for these
banks still failed to clear their cost-of-capital hurdle
Local banks in core Europe struggled weighed down by nonperforming loans and flat revenues Their RoRWAs
were negative in both 2008 and 2012 and did not come close to covering their cost of capital
Turning to country differences the four high-growth countries on the fringe of Europe the Middle East and Africa
have the wind at their backs Turkey ranked first in RoRWA for 2012 and it has jockeyed for top billing with
Poland and South Africa over the past five years
Countries in core Europersquos northern tier occupied the middle ranks of the national league tables with the Nordic
and Austrian banks showing the most consistent performance since 2008 Dutch Belgian and German banks
have been on an upswing since the financial crisis hit UK and French banks have been treading water although
Standard Chartered Bank and HSBC in the UK and BNP Paribas in France all ranked among the top 15 banks
in core European countries
Not surprisingly banks in Italy Portugal Spain and Irelandmdashall feeling the sting of the sovereign debt crisis and
deep economic recessionsmdashhave turned in the weakest RoRWAs
7222019 Bain amp Co- European Banking Report
httpslidepdfcomreaderfullbain-co-european-banking-report 732
European banking | Bain amp Company Inc
Page 5
Illuminating the road ahead
While most European banks are moving in the right direction to meet Basel III requirements they could benefit
from using RoRWA to better anticipate and navigate the road ruts that lie ahead
Devising sustainable business models and bringing profitability back to attractive levelsmdashmeaning above the
cost of capitalmdashwill not be easy In the current market environment we expect continued pressure on interest
as well as on fee income For most banks managing the cost of risk will also be a challenge as stagnant economies
tend to drive up this cost
Getting a better grip on operating cost therefore will lead the agenda for most banks Structural costs can be
addressed using several means adopting new digital technologies and modernizing IT platforms optimizing
processes from end to end through such approaches as outsourcing and offshoring and expanding global pro-
curement initiatives
Local banks in core European countries face perhaps the stiffest challenges as restructuring will continue in the
face of stagnant economies and a higher cost of risk We expect to see further consolidation in this group For
the surviving institutions higher performance will hinge on better management of the deleveraging process
containment of the cost of raising new capital and more accurate factoring of risk into their price structures
High-growth countries still offer the most promising opportunities for the 10 biggest and other large pan-Euro-
pean players that aim to diversify their portfolios The best performers will be those banks that keep tight control
of the reins as they ride these booming economies
Regardless of a bankrsquos home country asset size or loan portfolio RoRWA analysis illuminates the ruts and holes
on the road ahead With just a few metrics senior managers can understand how their bank compares with its
peers and which factors to work on in order to create valuemdasha highly pragmatic means of improving the bankrsquos
risk-return profile
7222019 Bain amp Co- European Banking Report
httpslidepdfcomreaderfullbain-co-european-banking-report 832
7222019 Bain amp Co- European Banking Report
httpslidepdfcomreaderfullbain-co-european-banking-report 932
bull European banksrsquo return on risk recovered from the2008 financial crisis peaking in 2010 with an aver-age 13 RoRWA Since then however RoRWA
has declined to 05 on average This translatesto a level of profitability below the cost of capitalwhich means banks are destroying value
bull Looking beneath the average European banksrsquoRoRWAs correlated closely with economic growthover the past five years Banks in countries that sawstrong GDP growth like Turkey posted dramaticallyhigher performance and growth in both assetsand risk-weighted assets (RWA) than those in thecore European countries
bull Banks in high-growth countries also consistently
exceeded their cost of capital whereas banks incore Europe have not covered their cost of capitalonly coming close to that bar in 2010 Core Europeexperienced a major amount of deleveragingdespite extraordinary initiatives such as theEuropean Central Bankrsquos long-term refinancingoperation (LTRO)
bull The quality of management plays a major role inindividual bank performance particularly in theslow-growth countries There was a wide rangeof RoRWAs among banks in those markets for each
of the five yearsbull In 2012 the biggest factors determining significant
value destruction were cost of risk as loan-lossprovisions rose and increased operating costwhich trended up as a percent of risk-weightedassets More active management of the balance sheethelped raise revenues but fees and commissionsprogressively declined
bull The larger the bank the better its performance onaverage The 10 biggest banks used their improve-
ments in financial margins and lower risk costs tocome close to earning their cost of capital
bull Other large regional banks managed to keep oper-ating costs lower than the 10 biggest but still fellwell short of their capital hurdle Smaller local banksfared the worst posting a negative RoRWA in 2012They have been forced to undertake a major de-leveraging of their balance sheets
1Five years of
RoRWA in Europe
A bumpy
landscape
7222019 Bain amp Co- European Banking Report
httpslidepdfcomreaderfullbain-co-european-banking-report 1032
European banking | Bain amp Company Inc
Page 8
Although RoRWA correlates with economic growth there is still substantial variation among banks
Note Each observation is composed of a bankrsquos RoRWA in a given year and the respective countryrsquos year-over-year GDP growth rate in that yearSources Banksrsquo financial statements 2008ndash2012 n=605 Bureau van Dijk Bain analysis
RoRWA per bank and year 2008ndash2012
-5
-3
0
3
5
-10 0 10 20 30
95 ofobservationsfall withinthis band
Recessionno growthManagement has a major role
in determining RoRWA
Mediumhigh growthManagement has amore limited role in
achieving high RoRWA
Very high growthManagementrsquos most important role
is to optimize strategic asset allocationfor revenue generation
GDP growth by country and year 2008ndash2012
Bank profitability has eroded since the post-crisis peak of 2010
Return on equity (ROE) = Pretax profitaverage shareholdersrsquo equitySources Banksrsquo financial statements 2008ndash2012 n=121 Bureau van Dijk Bain analysis
European-wide RoRWA
0
1
2
200800
2009
07
2010 2011
09
2012
05
RWA (euroB)
33576
08
11690
44
30229
64
11555
-32
31770
104
11726
52
33528
75
11986
53
33028
49
11207
29
Total assets (euroB)
Annual GDP growth ()
ROE ()
13
7222019 Bain amp Co- European Banking Report
httpslidepdfcomreaderfullbain-co-european-banking-report 1132
European banking | Bain amp Company Inc
Page 9
Banks in core Europe have not covered their cost of capital over the past five years
The range represents the level of RoRWA required to cover the banksrsquo cost of capital and varies by bank size and country analysis of 88 banks based in AustriaBelgium France Germany Ireland Italy the Netherlands the Nordics Portugal Spain Switzerland and the UKSources Banksrsquo financial statements 2008ndash2012 Bain analysis
RoRWA weighted average
RWA (euroB)
32373
-15
10899
29129
51
10846
30366
88
10785
31957
53
10869
31219
22
10047
Total assets (euroB)
ROE ()
2008
-01
2009
06
2010 2011
06
2012
01
Range ofRoRWArequiredto coverthe costof capital
11
-1
0
1
2
3
4
1816
while banks in high-growth countries consistently exceeded their cost of capital
The range represents the level of RoRWA required to cover the banksrsquo cost of capital and varies by bank size and country analysis of 33 banks based in theCommonwealth of Independent States (CIS) Poland South Africa and TurkeySources Banksrsquo financial statements 2008ndash2012 Bain analysis
RoRWA weighted average
RWA (euroB)
1203
226
791
1100
206
708
Total assets (euroB)
ROE ()
Range ofRoRWArequiredto coverthe costof capital
0
1
2
3
4
2008
24
2009
22
1404
250
941
2010
32
1571
267
1117
2011
31
1810
247
1160
2012
33
2119
7222019 Bain amp Co- European Banking Report
httpslidepdfcomreaderfullbain-co-european-banking-report 1232
European banking | Bain amp Company Inc
Page 10
Higher operating expenditure and cost of risk caused banksrsquo value destruction in 2012
Long-term refinancing operations (LTRO) 2011 ~euro500 billion LTRO 2012 ~euro750 billion (including repayment) corresponding to 2011 total assets of ~euro330 trillionand 2012 total assets of ~euro322 trillionSources Banksrsquo financial statements 2008ndash2012 n=121 Bain analysis
20122010 2011
RoRWA ()
Total assets (euroB)
Tier 1 capital (euroB)
RWAtotal assets ()
Net interest incomeRWA ()
Financial marginRWA ()
Fees and commissions +
other revenuesRWA ()
Operating expenditureRWA ()
Loan-loss provisionsRWA ()
05
33028
1510
34
36
09
17
43
15
13
31770
1363
37
35
10
17
37
12
09
33528
1426
36
35
05
20
40
12
2009
07
30229
1261
38
34
09
17
35
18
00
33576
1079
35
31
-07
22
36
11
2008Main components in
European-wide RoRWA Major trends
Partial deleveraging of assets
Strengthening of capital
Fairly constant risk profile despite
deleveraging of assets
Overall margin from balance-sheet
management increasing
Continuous pressure on fees
and commissions
Inability to reduce costs in
proportion to deleveraging
Rising cost of credit
7222019 Bain amp Co- European Banking Report
httpslidepdfcomreaderfullbain-co-european-banking-report 1332
European banking | Bain amp Company Inc
Page 11
In core Europe banks increased capital ratios and revenues but did not optimize costs
Notes Components in bold are direct components of the RoRWA calculation changes in red are negative trendsSources Banksrsquo financial statements 2008ndash2012 n=88 Bain analysis
2012 Change2008minus20122010 2011
Total RWA (euroB)
Total assets (euroB)
RWAtotal assets ()
Tier 1 ratio ()
Total Tier 1 (euroB)
Net interest incomeRWA ()
Financial marginRWA ()
Net interest incometotal assets ()
Financial margintotal assets ()
Net interest income + financial marginRWA ()
Fees + other revenuesRWA ()
OpexRWA ()
Costincome ()
Loan-loss provisionsRWA ()
Nonperforming loan ratio ()
Coverage ratio ()
10047
31219
32
133
1336
34
09
11
03
43
16
43
70
15
55
49
-78
-36
-2 pts
+43 pts
+36
+05 pts
+16 pts
+01 pts
+05 pts
+21 pts
-06 pts
+07 pts
-10 pts
+05 pts
+30 pts
-12 pts
10785
30366
36
114
1230
33
10
12
04
43
16
37
62
12
46
50
10869
31957
34
118
1280
33
05
11
02
39
19
40
68
12
47
51
2009
10846
29129
37
107
1159
32
09
12
03
41
17
35
61
17
40
54
10899
32373
34
90
981
29
-07
10
-02
22
22
35
80Opextotal assets () 14 +02 pts13 141312
10
25
61
Cross-selling
Asset leverage
Balance-sheet management
Cost structure
Cost of risk
2008Components
In high-growth countries higher financial margins offset lower fees and relatively high nonperforming loans
affected cost of risk
Notes Components in bold are direct components of the RoRWA calculation changes in red are negative trendsSources Banksrsquo financial statements 2008ndash2012 n=33 Bain analysis
2012 Change2008minus2012
2010 2011
Total RWA (euroB)
Total assets (euroB)
RWAtotal assets ()
Tier 1 ratio ()
Total Tier 1 (euroB)
Net interest incomeRWA ()
Financial marginRWA ()
Net interest incometotal assets ()
Financial margintotal assets ()
Net interest income + financial marginRWA ()
Fees + other revenuesRWA ()OpexRWA ()
Costincome ()
Opextotal assets ()
Loan-loss provisionsRWA ()
Nonperforming loan ratio ()
Coverage ratio ()
1160
1810
64
150
174
57
05
36
04
62
2543
45
27
11
49
64
+47
+50
-2 pts
+27 pts
+78
-01 pts
+05 pts
-02 pts
+04 pts
+05 pts
-02 pts+01 pts
-2 pts
-01 pts
-07 pts
+12 pts
+5 pts
941
1404
67
141
133
55
05
37
04
60
2741
43
28
15
69
63
1117
1571
71
131
147
50
03
35
02
53
2438
45
27
08
55
64
2009
708
1100
64
144
102
67
08
43
05
75
2743
39
28
36
82
57
791
1203
66
123
97
58
00
38
00
58
2742
47
28
18
37
59
Cross-selling
Asset leverage
Balance-sheet management
Cost structure
Cost of risk
2008Components
7222019 Bain amp Co- European Banking Report
httpslidepdfcomreaderfullbain-co-european-banking-report 1432
European banking | Bain amp Company Inc
Page 12
Europersquos 10 biggest banks come closest to earning their cost of capital
The range represents the level of RoRWA required to cover the banksrsquo cost of capital and varies by bank size and country Analysis of the 10 largest Europe-headquarteredbanks by market capitalization with a pan-European presence a universal bank business model and assets of at least euro650 billion (Barclays BNP ParibasCreacutedit Agricole Credit Suisse Deutsche Bank HSBC Nordea Santander UBS and UniCredit)Sources Banksrsquo financial statements 2008ndash2012 Bain analysis
RoRWA weighted average
RWA (euroB)
1340922
3514
1133694
3474
Total assets (euroB)
ROE ()
Range ofRoRWArequiredto coverthe costof capital
12395123
3698
13239107
3765
1338559
3639
2008
02
2009 2010
17
2011
14
2012
09
12
0
1
2
18
16
Among the 10 biggest banks lower risk costs and improved margins offset high Opex
Notes Components in bold are direct components of the RoRWA calculation changes in red are negative trendsSources Banksrsquo financial statements 2008ndash2012 n=10 Bain analysis
2012 Change2008minus2012
2010 2011
Total RWA (euroB)
Total assets (euroB)
RWAtotal assets ()
Tier 1 ratio ()
Total Tier 1 (euroB)
Net interest incomeRWA ()
Financial marginRWA ()
Net interest incometotal assets ()
Financial margintotal assets ()
Net interest income + financial marginRWA ()
Fees + other revenuesRWA ()OpexRWA ()
Costincome ()
Opextotal assets ()
Loan-loss provisionsRWA ()
Nonperforming loan ratio ()
Coverage ratio ()
3639
13385
27
131
477
38
10
10
03
49
2452
71
14
12
45
54
+36
-02
+1 pts
+46 pts
+60
+05 pts
+18 pts
+02 pts
+05 pts
+23 pts
-06 pts+09 pts
-6 pts
+03 pts
+01 pts
+21 pts
-24 pts
3698
12395
30
115
426
37
14
11
04
51
2346
62
14
11
46
52
3765
13239
28
116
437
38
09
11
03
47
2648
65
14
11
44
53
2009
3474
11336
31
110
380
37
14
11
04
51
2244
60
13
17
35
71
3514
13409
26
85
299
33
-07
09
-02
26
3043
77
11
11
24
78
Cross-selling
Asset leverage
Balance-sheet management
Cost structure
Cost of risk
2008Components
7222019 Bain amp Co- European Banking Report
httpslidepdfcomreaderfullbain-co-european-banking-report 1532
European banking | Bain amp Company Inc
Page 13
Other large European banks have fallen well short of earning their cost of capital
The range represents the level of RoRWA required to cover the banksrsquo cost of capital and varies by bank size and country Analysis of 13 banks with assets of at leasteuro200 billion a universal bank business model and small to medium-sized subsidiaries outside their core geography (ABN AMRO Group BBVA Commerzbank Danske BankErste ING Intesa Sanpaolo KBC Lloyds Rabobank RBS Socieacuteteacute Geacuteneacuterale and Standard Chartered)Sources Banksrsquo financial statements 2008ndash2012 Bain analysis
RoRWA weighted average
RWA (euroB)
Total assets (euroB)
ROE ()
Range ofRoRWArequiredto coverthe costof capital
861607
3188
2008
01
822237
3468
2009
04
850978
3339
2010
867422
3214
2011
03
888640
3115
2012
06
10
0
1
2
18
16
Other large European banks had Opex lower than the big 10 which offset pressure on fee income and
higher cost of risk
Notes Components in bold are direct components of the RoRWA calculation changes in red are negative trendsSources Banksrsquo financial statements 2008ndash2012 n=13 Bain analysis
2012 Change2008minus2012
2010 2011
Total RWA (euroB)
Total assets (euroB)
RWAtotal assets ()
Tier 1 ratio ()
Total Tier 1 (euroB)
Net interest incomeRWA ()
Financial marginRWA ()
Net interest incometotal assets ()
Financial margintotal assets ()
Net interest income + financial marginRWA ()
Fees + other revenuesRWA ()OpexRWA ()
Costincome ()
Opextotal assets ()
Loan-loss provisionsRWA ()
Nonperforming loan ratio ()
Coverage ratio ()
3115
8886
35
129
402
35
12
12
04
47
1239
66
14
14
56
50
-23
+31
-19 pts
+39 pts
+40
+04 pts
+17 pts
+01 pts
+06 pts
+21 pts
-09 pts+02 pts
-12 pts
No change
+04 pts
+22 pts
+3 pts
3339
8509
39
114
382
34
11
13
04
45
1233
57
13
14
54
48
3214
8674
37
119
382
35
03
13
01
38
1739
70
14
14
57
48
2009
3468
8222
42
102
353
31
10
13
04
41
1532
58
14
19
50
46
3188
8616
37
90
287
31
-05
12
-02
26
2137
78
14
10
34
47
Cross-selling
Asset leverage
Balance-sheet management
Cost structure
Cost of risk
2008Components
7222019 Bain amp Co- European Banking Report
httpslidepdfcomreaderfullbain-co-european-banking-report 1632
European banking | Bain amp Company Inc
Page 14
Local banks have seen their RoRWA sharply deteriorate in recent years
The range represents the level of RoRWA required to cover the banksrsquo cost of capital and varies by bank size and country analysis of 65 banks operating exclusivelywithin a single national or regional marketSources Banksrsquo financial statements 2008ndash2012 Bain analysis
RoRWA weighted average
RWA (euroB)
Total assets (euroB)
ROE ()
Range ofRoRWArequiredto coverthe costof capital
10347
-68
4198
9571
20
3904
9462
59
3748
10044
20
3890
8948
-42
3293
2008
-06
2009
02
2010
07
2011
02
2012
-11
-2
-1
0
1
21816
Local banks have experienced sharp deleveraging higher cost of risk more nonperforming loans and flat revenues
Notes Components in bold are direct components of the RoRWA calculation changes in red are negative trendsSources Banksrsquo financial statements 2008ndash2012 n=65 Bain analysis
2012 Change2008minus2012
2010 2011
Total RWA (euroB)
Total assets (euroB)
RWAtotal assets ()
Tier 1 ratio ()
Total Tier 1 (euroB)
Net interest incomeRWA ()
Financial marginRWA ()
Net interest incometotal assets ()
Financial margintotal assets ()
Net interest income + financial marginRWA ()
Fees + other revenuesRWA ()OpexRWA ()
Costincome ()
Opextotal assets ()
Loan-loss provisionsRWA ()
Nonperforming loan ratio ()
Coverage ratio ()
3293
8948
37
139
457
28
06
10
02
34
1135
71
13
20
64
46
-215
-135
-38 pts
+44 pts
+15
+03 pts
+14 pts
No change
+06 pts
+17 pts
-05 pts+08 pts
-17 pts
+02 pts
+1 pts
+44 pts
-18 pts
3748
9462
40
113
422
28
05
11
02
33
1430
65
12
09
40
52
3890
10044
39
118
461
28
03
11
01
31
1532
69
13
12
43
51
2009
3904
9571
41
109
426
28
04
11
02
32
1430
65
12
14
36
51
4198
10347
41
94
396
25
-09
10
-04
16
1628
87
11
10
20
64
Cross-selling
Asset leverage
Balance-sheet management
Cost control
Cost of risk
2008Components
7222019 Bain amp Co- European Banking Report
httpslidepdfcomreaderfullbain-co-european-banking-report 1732
European banking | Bain amp Company Inc
Page 15
7222019 Bain amp Co- European Banking Report
httpslidepdfcomreaderfullbain-co-european-banking-report 1832
7222019 Bain amp Co- European Banking Report
httpslidepdfcomreaderfullbain-co-european-banking-report 1932
bull Countries with strong economic growth led the2012 RoRWA rankings Turkey took pole positionwith a 49 RoRWA In core Europe the Nordic
countries posed the strongest performance witha 19 RoRWA followed by Austria and theNetherlands The largest economies of Germanythe UK and France trailed behind
bull Banks in Italy Portugal Spain and Ireland whichhave been mired in the sovereign debt crisis anddeep economic recessions turned in the weakestRoRWA performances
bull Among the core European countries changes inRoRWAs from 2008 to 2012 stemmed mainly
from changes in three components net interestincome financial margin and loan-loss provisions
bull Countries that posted large positive changesmdashincluding Germany the Netherlands the Nordiccountries and the UKmdashbenefited from higherfinancial margins more control of operatingexpenditure and lower cost of risk Countries withlarge drops in RoRWAs were hurt by infl exiblecost structures which prevented them from shrinkingtheir production costs and a cost of risk that was
almost double the averagebull Northern Europe dominated the league tables
whether one looks at the 2012 leaders or themost improved banks For example the RoRWAleaders among both local and the 10 biggestbanks included banks in the Nordic countriesfollowed by those in the UK France Austria andthe Netherlands
bull In the most improved group banks in Switzer-land the Netherlands and Germany made a
strong showing
bull In high-growth countries Turkey and the Common-wealth of Independent States (CIS) took leadingpositions for the most improved banks and Turkeyfor the 2012 leaders
2Country and cluster
league tables
7222019 Bain amp Co- European Banking Report
httpslidepdfcomreaderfullbain-co-european-banking-report 2032
European banking | Bain amp Company Inc
Page 18
High-growth countries led the RoRWA rankings in 2012
Note For CIS the Netherlands Belgium Germany UK France Portugal and Spain one or two Tier-3 banks had not reported 2012 data by time of publicationso the analysis used 2011 data for those few banksSources Banksrsquo financial statements 2008ndash2012 n=121 Bain analysis
Rank 2012 RoRWA ()
Turkey
Poland
South Africa
CIS
Nordics
Austria
Netherlands
Belgium
Germany
UK
France
Switzerland
Italy
Portugal
Spain
Ireland
1
2
3
4
5
6
7
8
9
10
11
12
13
14
15
16
49
47
31
27
19
12
10
08
07
05
03
01
-06
-08
-17
-48
480
167
340
826
2357
334
2186
911
5514
7062
6320
1812
2127
426
2917
312
2012 total assets (euroB)Country 2008 RoRWA ()
33
41
35
10
13
19
-20
-25
-14
00
08
-76
07
10
19
10
7222019 Bain amp Co- European Banking Report
httpslidepdfcomreaderfullbain-co-european-banking-report 2132
European banking | Bain amp Company Inc
Page 19
In core European countries RoRWA changes from 2008 to 2012hellip
Note Averages are weighted for the total size of the respective components in each countrySources Banksrsquo financial statements 2008ndash2012 n=71 Bain analysis
RoRWA weighted average
-3
-2
-1
0
1
2
2008 average2012 average
UK
05
France
08
Germany
-14
07
Spain
19
-17
Nordics
13
19
Italy
07
-06
Netherlands
-20
10
2008 2012
0003
hellipwere spurred mainly by net interest income financial margin and loan-loss provisions
Note Averages are weighted for the total sizes of the respective indicators in each countrySources Banksrsquo financial statements 2008-2012 n=71 Bain analysis
NordicsGermany Spain
Total assets (euroB)
Total RWA (euroB)
Net interest incomeRWA ()
Financial marginRWA ()
Fees and commissions +other revenuesRWA ()
OpexRWA ()
Loan-loss provisionsRWA ()
France
7751
UK
2008 2012
AverageItaly Netherlands
7039
2474 2467
31 30
-02 12
26 15
41 42
14 10
5857 5715
1532 1327
26 38
-03 16
30 13
40 54
05 10
6054 5419
1534 1317
26 32
-19 07
14 17
27 43
08 06
1976 2917
1068 1315
36 43
06 06
17 10
27 35
13 41
1960 2357
790 735
27 32
-02 12
17 10
24 28
05 05
1990 2127
1266 1139
32 28
01 04
18 18
33 35
10 22
2263 2054
729 656
29 41
-17 06
15 10
39 38
09 09
2071 3947
928 1279
30 34
-05 10
17 14
32 41
08 15
7222019 Bain amp Co- European Banking Report
httpslidepdfcomreaderfullbain-co-european-banking-report 2232
European banking | Bain amp Company Inc
Page 20
These banks are the 2012 RoRWA leaders of their geographic cluster
Sources Banksrsquo financial statements 2008ndash2012 Bain analysis
Rank 2012 RoRWA ()
Nordics
UK
France
UK
Austria
Netherlands
Nordics
Nordics
Nordics
Turkey
Turkey
Turkey
1
2
3
1
2
3
1
2
3
1
2
3
19
18
16
23
17
16
40
39
36
158
132
48
Nordea
HSBC
BNP Paribas
Standard Chartered
Erste
ING
Swedbank
Sparebank 1 Group
Handelsbanken
Ziraat Bankasi
Akbank
Tuumlrkiye Halk
Bank Country 2008 RoRWA ()
16
08
06
24
19
02
20
NA
21
193
106
38
10biggest
Otherlarge
European
Local
High-growthcountries
These banks showed the biggest improvements in RoRWA over the past five years
Sources Banksrsquo financial statements 2008ndash2012 Bain analysis
Rank 2008ndash2012 change( points)
Switzerland
Switzerland
Germany
Belgium
UK
Netherlands
Netherlands
Belgium
Germany
CIS
Turkey
CIS
1
2
3
1
2
3
1
2
3
1
2
3
+83
+68
+21
+29
+26
+14
+64
+50
+33
+71
+26
+13
UBS
Credit Suisse
Deutsche Bank
KBC
RBS
ING
RBS Holdings NV
BNP Paribas Fortis
Bayerische Landesbank
Gazprombank
Akbank
VTB 24
Bank Country 2008 RoRWA ()
-92
-58
-19
-19
-37
02
-91
-45
-26
-56
106
05
10biggest
Otherlarge
European
Local
High-growthcountries
7222019 Bain amp Co- European Banking Report
httpslidepdfcomreaderfullbain-co-european-banking-report 2332
European banking | Bain amp Company Inc
Page 21
7222019 Bain amp Co- European Banking Report
httpslidepdfcomreaderfullbain-co-european-banking-report 2432
7222019 Bain amp Co- European Banking Report
httpslidepdfcomreaderfullbain-co-european-banking-report 2532
bull Europersquos environment continues to be volatile andinvestors are seeking better information about abankrsquos stability asset quality and key factors that
generate value RoRWA plays a useful role hereby focusing on the balance sheetmdashwhich enablescomparison between a bank and its peersmdashand byidentifying the factors influencing bank performance
bull Banks still need to address challenges along eachdimension of RoRWA in order to lift their profit-ability levels above the cost of capital In recent
years the profitability of lending assets has beensustained mainly by the fi nancial componentsincluding a boost from LTRO To raise asset prof-itability banks will have to better manage their
capital allocations and risk profilesbull The pressure on fee income will continue To offset
that trend banks should turn to their close clientrelationships for new sources of revenues
bull Lowering operating costs is the dimension thatwarrants managementrsquos attention at any bankregardless of size or location Initiatives that havethe greatest potential for tackling structural costsinclude adopting digital technologies and modern-izing IT platforms optimizing processes from endto end through outsourcing offshoring and other
means and expanding global procurement Suchinitiatives are essential for survival in an industrygoing through discontinuous change
bull Deleveraging the loan portfolio for riskier clients isa pressing issue which still poses significant threatsfor local banks In countries with a higher cost ofrisk and stagnant or negative GDP growth rateslocal banks may face further painful restructuring
bull Astute management of the cost of risk includingtaking a portfolio perspective offers opportunities
for most banksmdashin part to meet the new require-ments of Basel III and reassure rating agencies
bull Further consolidation of the local and other largebanks over the coming years will likely benefitthe 10 biggest banks and those in high-growthcountries These high-growth countries offer thegreatest opportunities for RoRWA growth for largeand pan-European players looking to diversifytheir portfolios
3Strategic
perspectives and
implications for
management
7222019 Bain amp Co- European Banking Report
httpslidepdfcomreaderfullbain-co-european-banking-report 2632
European banking | Bain amp Company Inc
Page 24
Significant restructuring is warranted for all banks but the nature of the challenge varies by geography
Source Bain analysis
10 biggest Strategic issueHigh-growth
countries
Other large
EuropeanLocal
Cross-selling
Balance-sheet
management
Cost structure
Cost of risk
Major threatThreatOpportunityMajor opportunity
Profitability of the asset portfolio has been sustained mainly by the
financial component Deleveraging of the loan portfolio for riskier
clients has been only partially successful and the risk profile of
the portfolio still has a long way to go
To counter pressure on fees banks should work systematically on
cross-selling opportunities through initiatives like client-focused
service models and CRM support
To further reduce costs banks should pursue new digital technologies
optimized processes through such means as outsourcing and offshoring
modernized IT platforms and global procurement initiatives
Active management of cost of risk demands more systematic solutions
bull NPL and LLP trends are threatening the stability of the overall
system and not only in individual countries such as Greece
bull Management of risky clients has become a core business and capability
bull Managing costs of risk demands an integrated portfolio approach
7222019 Bain amp Co- European Banking Report
httpslidepdfcomreaderfullbain-co-european-banking-report 2732
European banking | Bain amp Company Inc
Page 25
Assets (euroB)
Erste (AT)
Raiffeisen Bank (AT)
BNP Paribas Fortis
KBC
Belfius Banque
ING Belgium SANV
Creacutedit Agricole Groupe
BNP Paribas
Groupe Socieacuteteacute Geacuteneacuterale
Groupe BPCE
Creacutedit Mutuel
Deutsche Bank
Commerzbank AGKfW
DZ Bank AG
UniCredit Bank AG
2138
1202
2723
2569
2129
1691
17930
15439
12307
11475
6051
20123
63595116
4072
3483
Austria
Belgium
France
Germany
Country Bank Cluster
Other large
Local
Local
Other large
Local
Local
10 biggest
10 biggest
Other large
Local
Local
10 biggest
Other largeLocal
Local
Local
Ireland
Landesbank Baden-Wuumlrttemberg
Bayerische Landesbank
NORDLB
Helaba
HSH Nordbank
DekaBank
Landesbank Berlin Holding
Santander Consumer Bank
Hamburger Sparkasse
Deutsche Apotheker - und Aumlrztebank
Sparkasse KoumllnBonn
Kreissparkasse Koumlln
Bank of Ireland
Allied Irish Banks
permanent tsb Group Hldgs Plc
Intesa Sanpaolo
3363
2868
2256
1993
1306
1297
1183
403
396
379
299
248
1481
1225
409
6735
Local
Local
Local
Local
Local
Local
Local
Local
Local
Local
Local
Local
Other large
10 biggest
Local
Other large
Unicredit Group
Monte dei Paschi di Siena
4639
2189
10 biggest
Local
UBI Banca Group
Banco Popolare
BNL
Banca Popolare dellrsquoEmilia Romagna
Banca Popolare di Milano
Gruppo Banca Carige
Cariparma
Banca Popolare di Vicenza
Veneto Banca
1324
1319
912
616
525
493
493
467
402
Local
Local
Local
Local
Local
Local
Local
Local
Local
Italy
2011 assets
Bca Popdi Sondrio 322 Local
Credito Emiliano
Credito Valtellinese
Banca delle Marche
307
299
227
Local
Local
Local
List of banks analyzed by country and assets
10 biggest other large local
7222019 Bain amp Co- European Banking Report
httpslidepdfcomreaderfullbain-co-european-banking-report 2832
European banking | Bain amp Company Inc
Page 26
Assets (euroB)Country Bank Cluster
ING
Rabobank Group
ABN AMRO Group
SNS Reaal
RBS Holdings NV
8361
7524
3944
1322
710
Netherlands
Other large
Other large
Other large
Local
Local
Nordea 6774 10 biggest
Danske Bank
DNB
4682
3028
Other large
Local
SEB
Handelsbanken
Swedbank
Pohjola Bank
2818
2742
2121
998
Local
Local
Local
Local
Nordics
Jyske Bank 347 Local
Sparebank 1 Group 62 Local
Caixa Geral de Depositos 1169 Local
Millenium BCP
Banco Espiacuterito Santo
897
837
Local
Local
Banco BPI
Santander Totta SGPS
Caixa Econoacutemica Montepio Geral
Creacutedito Agriacutecola Muacutetuo
446
414
215
142
Local
Local
Local
Local
Portugal
BANIF 140 Local
SantanderBBVA
la Caixa
Banco Financiero y de Ahorros
Banco Sabadell SA
122826378
3591
3092
1615
Spain
10 biggestOther large
Local
Local
Local
Banco Popular
Banco Mare Nostrum
1576
634
Local
Local
UBS
Credit Suisse
10448
7669Switzerland
10 biggest
10 biggest
HSBC 20939 10 biggest
Barclays
Royal Bank of Scotland
17603
11521
10 biggest
Other large
Lloyds Banking Group
Standard Chartered
Nationwide Building Society
Co-operative Bank
11395
4950
2417
611
Other large
Other large
Local
Local
UK
Clydesdale Bank 545 Local
Yorkshire Building Society 413 Local
Virgin Money 223 Local
2011 assets
List of banks analyzed by country and assets
10 biggest other large localmdashcontinued
7222019 Bain amp Co- European Banking Report
httpslidepdfcomreaderfullbain-co-european-banking-report 2932
European banking | Bain amp Company Inc
Page 27
Assets (euroB)
Sberbank
VTB 24
PKO BP
Bank Pekao
BRE Bank
ING Bank Slaski
Standard Bank
Absa
FirstRand
Nedbank
Investec
Tuumlrkiye İş Bankası
Tuumlrkiye Garanti
Ziraat Bankasi
Akbank
Yapı ve Kredi
3781
1857
463
361
244
187
928
766
729
647
330
869
777
708
706
568
CIS
Poland
South Africa
Turkey
Country Bank
Tuumlrkiye Halk Bankasi
Tuumlrkiye Vakıflar
Finansbank
471
467
239
Gazprombank
Russian Agricultural Bank
Alfa-Bank
Nomos-Bank
UniCredit Bank Russia
712
358
357
225
218
AKB Rosbank
Promsvyazbank
ZAO Raiffeisenbank
URALSIB Bank
Russian Standard Bank
AKB Probusinessbank
200
173
160
113
74
35
2011 assets
Bank Zachodni WBK + Kredyt Bank
Getin NobleBank
Bank Millennium
143
141
126
List of banks analyzed by country and assets
High-growth countries
7222019 Bain amp Co- European Banking Report
httpslidepdfcomreaderfullbain-co-european-banking-report 3032
European banking | Bain amp Company Inc
Page 28
Key contacts in Bainrsquos European Financial Services practice
Franco Baronio in Milan (francobaroniobaincom)Rocco DrsquoAcunto in Milan (roccodacuntobaincom)
Ada Di Marzo in Paris (adadimarzobaincom)
Bertrand Facq in Warsaw (bertrandfacqbaincom)
Fabrice Franzen in Johannesburg (fabricefranzenbaincom)
Thomas Herbeck in Frankfurt (thomasherbeckbaincom)
Karaca Kestelli in Istanbul (karacakestellibaincom)
Nicolaacutes Lopez in Madrid (nicolaslopezbaincom)
Niels Peder Nielsen in Copenhagen (nielspedernielsenbaincom)
Andrea Oldrini in Milan (andreaoldrinibaincom)
Mathijs Robbens in Amsterdam (mathijsrobbensbaincom)
Visar Sala in Moscow (visarsalabaincom)
Walter Sinn in Frankfurt (waltersinnbaincom)Joatildeo Soares in London (joaosoaresbaincom)
Acknowledgments
The authors would like to thank the following Bain colleagues for their valuable support in producing this report
Sonal Chawla Christian Duus Franccedilois Fastrez Farsan Ghassim and Shikha Mahato
See these related Bain perspectives at wwwbaincom
bull Managing risk and capital
bull How Europersquos banks can return to health
bull The digital challenge to retail banks
7222019 Bain amp Co- European Banking Report
httpslidepdfcomreaderfullbain-co-european-banking-report 3132
7222019 Bain amp Co- European Banking Report
httpslidepdfcomreaderfullbain-co-european-banking-report 3232
For more information visit wwwbaincom
Share983140 983105m983138io983150 Tru Rs983157983148ts
Bain amp Company is the management consulting firm that the worldrsquos business leaders come to whenthey want results
Bain advises clients on strategy operations technology organization private equity and mergers and acquisitions We develop
practical customized insights that clients act on and transfer skills that make change stick Founded in 1973 Bain has
48 offices in 31 countries and our deep expertise and client roster cross every industry and economic sector Our clients
have outperformed the stock market 4 to 1
What sets us apart
We believe a consulting firm should be more than an adviser So we put ourselves in our clientsrsquo shoes selling outcomes not
projects We align our incentives with our clientsrsquo by linking our fees to their results and collaborate to unlock the full potential
of their business Our Results Deliveryreg process builds our clientsrsquo capabilities and our True North values mean we do theright thing for our clients people and communitiesmdashalways
7222019 Bain amp Co- European Banking Report
httpslidepdfcomreaderfullbain-co-european-banking-report 732
European banking | Bain amp Company Inc
Page 5
Illuminating the road ahead
While most European banks are moving in the right direction to meet Basel III requirements they could benefit
from using RoRWA to better anticipate and navigate the road ruts that lie ahead
Devising sustainable business models and bringing profitability back to attractive levelsmdashmeaning above the
cost of capitalmdashwill not be easy In the current market environment we expect continued pressure on interest
as well as on fee income For most banks managing the cost of risk will also be a challenge as stagnant economies
tend to drive up this cost
Getting a better grip on operating cost therefore will lead the agenda for most banks Structural costs can be
addressed using several means adopting new digital technologies and modernizing IT platforms optimizing
processes from end to end through such approaches as outsourcing and offshoring and expanding global pro-
curement initiatives
Local banks in core European countries face perhaps the stiffest challenges as restructuring will continue in the
face of stagnant economies and a higher cost of risk We expect to see further consolidation in this group For
the surviving institutions higher performance will hinge on better management of the deleveraging process
containment of the cost of raising new capital and more accurate factoring of risk into their price structures
High-growth countries still offer the most promising opportunities for the 10 biggest and other large pan-Euro-
pean players that aim to diversify their portfolios The best performers will be those banks that keep tight control
of the reins as they ride these booming economies
Regardless of a bankrsquos home country asset size or loan portfolio RoRWA analysis illuminates the ruts and holes
on the road ahead With just a few metrics senior managers can understand how their bank compares with its
peers and which factors to work on in order to create valuemdasha highly pragmatic means of improving the bankrsquos
risk-return profile
7222019 Bain amp Co- European Banking Report
httpslidepdfcomreaderfullbain-co-european-banking-report 832
7222019 Bain amp Co- European Banking Report
httpslidepdfcomreaderfullbain-co-european-banking-report 932
bull European banksrsquo return on risk recovered from the2008 financial crisis peaking in 2010 with an aver-age 13 RoRWA Since then however RoRWA
has declined to 05 on average This translatesto a level of profitability below the cost of capitalwhich means banks are destroying value
bull Looking beneath the average European banksrsquoRoRWAs correlated closely with economic growthover the past five years Banks in countries that sawstrong GDP growth like Turkey posted dramaticallyhigher performance and growth in both assetsand risk-weighted assets (RWA) than those in thecore European countries
bull Banks in high-growth countries also consistently
exceeded their cost of capital whereas banks incore Europe have not covered their cost of capitalonly coming close to that bar in 2010 Core Europeexperienced a major amount of deleveragingdespite extraordinary initiatives such as theEuropean Central Bankrsquos long-term refinancingoperation (LTRO)
bull The quality of management plays a major role inindividual bank performance particularly in theslow-growth countries There was a wide rangeof RoRWAs among banks in those markets for each
of the five yearsbull In 2012 the biggest factors determining significant
value destruction were cost of risk as loan-lossprovisions rose and increased operating costwhich trended up as a percent of risk-weightedassets More active management of the balance sheethelped raise revenues but fees and commissionsprogressively declined
bull The larger the bank the better its performance onaverage The 10 biggest banks used their improve-
ments in financial margins and lower risk costs tocome close to earning their cost of capital
bull Other large regional banks managed to keep oper-ating costs lower than the 10 biggest but still fellwell short of their capital hurdle Smaller local banksfared the worst posting a negative RoRWA in 2012They have been forced to undertake a major de-leveraging of their balance sheets
1Five years of
RoRWA in Europe
A bumpy
landscape
7222019 Bain amp Co- European Banking Report
httpslidepdfcomreaderfullbain-co-european-banking-report 1032
European banking | Bain amp Company Inc
Page 8
Although RoRWA correlates with economic growth there is still substantial variation among banks
Note Each observation is composed of a bankrsquos RoRWA in a given year and the respective countryrsquos year-over-year GDP growth rate in that yearSources Banksrsquo financial statements 2008ndash2012 n=605 Bureau van Dijk Bain analysis
RoRWA per bank and year 2008ndash2012
-5
-3
0
3
5
-10 0 10 20 30
95 ofobservationsfall withinthis band
Recessionno growthManagement has a major role
in determining RoRWA
Mediumhigh growthManagement has amore limited role in
achieving high RoRWA
Very high growthManagementrsquos most important role
is to optimize strategic asset allocationfor revenue generation
GDP growth by country and year 2008ndash2012
Bank profitability has eroded since the post-crisis peak of 2010
Return on equity (ROE) = Pretax profitaverage shareholdersrsquo equitySources Banksrsquo financial statements 2008ndash2012 n=121 Bureau van Dijk Bain analysis
European-wide RoRWA
0
1
2
200800
2009
07
2010 2011
09
2012
05
RWA (euroB)
33576
08
11690
44
30229
64
11555
-32
31770
104
11726
52
33528
75
11986
53
33028
49
11207
29
Total assets (euroB)
Annual GDP growth ()
ROE ()
13
7222019 Bain amp Co- European Banking Report
httpslidepdfcomreaderfullbain-co-european-banking-report 1132
European banking | Bain amp Company Inc
Page 9
Banks in core Europe have not covered their cost of capital over the past five years
The range represents the level of RoRWA required to cover the banksrsquo cost of capital and varies by bank size and country analysis of 88 banks based in AustriaBelgium France Germany Ireland Italy the Netherlands the Nordics Portugal Spain Switzerland and the UKSources Banksrsquo financial statements 2008ndash2012 Bain analysis
RoRWA weighted average
RWA (euroB)
32373
-15
10899
29129
51
10846
30366
88
10785
31957
53
10869
31219
22
10047
Total assets (euroB)
ROE ()
2008
-01
2009
06
2010 2011
06
2012
01
Range ofRoRWArequiredto coverthe costof capital
11
-1
0
1
2
3
4
1816
while banks in high-growth countries consistently exceeded their cost of capital
The range represents the level of RoRWA required to cover the banksrsquo cost of capital and varies by bank size and country analysis of 33 banks based in theCommonwealth of Independent States (CIS) Poland South Africa and TurkeySources Banksrsquo financial statements 2008ndash2012 Bain analysis
RoRWA weighted average
RWA (euroB)
1203
226
791
1100
206
708
Total assets (euroB)
ROE ()
Range ofRoRWArequiredto coverthe costof capital
0
1
2
3
4
2008
24
2009
22
1404
250
941
2010
32
1571
267
1117
2011
31
1810
247
1160
2012
33
2119
7222019 Bain amp Co- European Banking Report
httpslidepdfcomreaderfullbain-co-european-banking-report 1232
European banking | Bain amp Company Inc
Page 10
Higher operating expenditure and cost of risk caused banksrsquo value destruction in 2012
Long-term refinancing operations (LTRO) 2011 ~euro500 billion LTRO 2012 ~euro750 billion (including repayment) corresponding to 2011 total assets of ~euro330 trillionand 2012 total assets of ~euro322 trillionSources Banksrsquo financial statements 2008ndash2012 n=121 Bain analysis
20122010 2011
RoRWA ()
Total assets (euroB)
Tier 1 capital (euroB)
RWAtotal assets ()
Net interest incomeRWA ()
Financial marginRWA ()
Fees and commissions +
other revenuesRWA ()
Operating expenditureRWA ()
Loan-loss provisionsRWA ()
05
33028
1510
34
36
09
17
43
15
13
31770
1363
37
35
10
17
37
12
09
33528
1426
36
35
05
20
40
12
2009
07
30229
1261
38
34
09
17
35
18
00
33576
1079
35
31
-07
22
36
11
2008Main components in
European-wide RoRWA Major trends
Partial deleveraging of assets
Strengthening of capital
Fairly constant risk profile despite
deleveraging of assets
Overall margin from balance-sheet
management increasing
Continuous pressure on fees
and commissions
Inability to reduce costs in
proportion to deleveraging
Rising cost of credit
7222019 Bain amp Co- European Banking Report
httpslidepdfcomreaderfullbain-co-european-banking-report 1332
European banking | Bain amp Company Inc
Page 11
In core Europe banks increased capital ratios and revenues but did not optimize costs
Notes Components in bold are direct components of the RoRWA calculation changes in red are negative trendsSources Banksrsquo financial statements 2008ndash2012 n=88 Bain analysis
2012 Change2008minus20122010 2011
Total RWA (euroB)
Total assets (euroB)
RWAtotal assets ()
Tier 1 ratio ()
Total Tier 1 (euroB)
Net interest incomeRWA ()
Financial marginRWA ()
Net interest incometotal assets ()
Financial margintotal assets ()
Net interest income + financial marginRWA ()
Fees + other revenuesRWA ()
OpexRWA ()
Costincome ()
Loan-loss provisionsRWA ()
Nonperforming loan ratio ()
Coverage ratio ()
10047
31219
32
133
1336
34
09
11
03
43
16
43
70
15
55
49
-78
-36
-2 pts
+43 pts
+36
+05 pts
+16 pts
+01 pts
+05 pts
+21 pts
-06 pts
+07 pts
-10 pts
+05 pts
+30 pts
-12 pts
10785
30366
36
114
1230
33
10
12
04
43
16
37
62
12
46
50
10869
31957
34
118
1280
33
05
11
02
39
19
40
68
12
47
51
2009
10846
29129
37
107
1159
32
09
12
03
41
17
35
61
17
40
54
10899
32373
34
90
981
29
-07
10
-02
22
22
35
80Opextotal assets () 14 +02 pts13 141312
10
25
61
Cross-selling
Asset leverage
Balance-sheet management
Cost structure
Cost of risk
2008Components
In high-growth countries higher financial margins offset lower fees and relatively high nonperforming loans
affected cost of risk
Notes Components in bold are direct components of the RoRWA calculation changes in red are negative trendsSources Banksrsquo financial statements 2008ndash2012 n=33 Bain analysis
2012 Change2008minus2012
2010 2011
Total RWA (euroB)
Total assets (euroB)
RWAtotal assets ()
Tier 1 ratio ()
Total Tier 1 (euroB)
Net interest incomeRWA ()
Financial marginRWA ()
Net interest incometotal assets ()
Financial margintotal assets ()
Net interest income + financial marginRWA ()
Fees + other revenuesRWA ()OpexRWA ()
Costincome ()
Opextotal assets ()
Loan-loss provisionsRWA ()
Nonperforming loan ratio ()
Coverage ratio ()
1160
1810
64
150
174
57
05
36
04
62
2543
45
27
11
49
64
+47
+50
-2 pts
+27 pts
+78
-01 pts
+05 pts
-02 pts
+04 pts
+05 pts
-02 pts+01 pts
-2 pts
-01 pts
-07 pts
+12 pts
+5 pts
941
1404
67
141
133
55
05
37
04
60
2741
43
28
15
69
63
1117
1571
71
131
147
50
03
35
02
53
2438
45
27
08
55
64
2009
708
1100
64
144
102
67
08
43
05
75
2743
39
28
36
82
57
791
1203
66
123
97
58
00
38
00
58
2742
47
28
18
37
59
Cross-selling
Asset leverage
Balance-sheet management
Cost structure
Cost of risk
2008Components
7222019 Bain amp Co- European Banking Report
httpslidepdfcomreaderfullbain-co-european-banking-report 1432
European banking | Bain amp Company Inc
Page 12
Europersquos 10 biggest banks come closest to earning their cost of capital
The range represents the level of RoRWA required to cover the banksrsquo cost of capital and varies by bank size and country Analysis of the 10 largest Europe-headquarteredbanks by market capitalization with a pan-European presence a universal bank business model and assets of at least euro650 billion (Barclays BNP ParibasCreacutedit Agricole Credit Suisse Deutsche Bank HSBC Nordea Santander UBS and UniCredit)Sources Banksrsquo financial statements 2008ndash2012 Bain analysis
RoRWA weighted average
RWA (euroB)
1340922
3514
1133694
3474
Total assets (euroB)
ROE ()
Range ofRoRWArequiredto coverthe costof capital
12395123
3698
13239107
3765
1338559
3639
2008
02
2009 2010
17
2011
14
2012
09
12
0
1
2
18
16
Among the 10 biggest banks lower risk costs and improved margins offset high Opex
Notes Components in bold are direct components of the RoRWA calculation changes in red are negative trendsSources Banksrsquo financial statements 2008ndash2012 n=10 Bain analysis
2012 Change2008minus2012
2010 2011
Total RWA (euroB)
Total assets (euroB)
RWAtotal assets ()
Tier 1 ratio ()
Total Tier 1 (euroB)
Net interest incomeRWA ()
Financial marginRWA ()
Net interest incometotal assets ()
Financial margintotal assets ()
Net interest income + financial marginRWA ()
Fees + other revenuesRWA ()OpexRWA ()
Costincome ()
Opextotal assets ()
Loan-loss provisionsRWA ()
Nonperforming loan ratio ()
Coverage ratio ()
3639
13385
27
131
477
38
10
10
03
49
2452
71
14
12
45
54
+36
-02
+1 pts
+46 pts
+60
+05 pts
+18 pts
+02 pts
+05 pts
+23 pts
-06 pts+09 pts
-6 pts
+03 pts
+01 pts
+21 pts
-24 pts
3698
12395
30
115
426
37
14
11
04
51
2346
62
14
11
46
52
3765
13239
28
116
437
38
09
11
03
47
2648
65
14
11
44
53
2009
3474
11336
31
110
380
37
14
11
04
51
2244
60
13
17
35
71
3514
13409
26
85
299
33
-07
09
-02
26
3043
77
11
11
24
78
Cross-selling
Asset leverage
Balance-sheet management
Cost structure
Cost of risk
2008Components
7222019 Bain amp Co- European Banking Report
httpslidepdfcomreaderfullbain-co-european-banking-report 1532
European banking | Bain amp Company Inc
Page 13
Other large European banks have fallen well short of earning their cost of capital
The range represents the level of RoRWA required to cover the banksrsquo cost of capital and varies by bank size and country Analysis of 13 banks with assets of at leasteuro200 billion a universal bank business model and small to medium-sized subsidiaries outside their core geography (ABN AMRO Group BBVA Commerzbank Danske BankErste ING Intesa Sanpaolo KBC Lloyds Rabobank RBS Socieacuteteacute Geacuteneacuterale and Standard Chartered)Sources Banksrsquo financial statements 2008ndash2012 Bain analysis
RoRWA weighted average
RWA (euroB)
Total assets (euroB)
ROE ()
Range ofRoRWArequiredto coverthe costof capital
861607
3188
2008
01
822237
3468
2009
04
850978
3339
2010
867422
3214
2011
03
888640
3115
2012
06
10
0
1
2
18
16
Other large European banks had Opex lower than the big 10 which offset pressure on fee income and
higher cost of risk
Notes Components in bold are direct components of the RoRWA calculation changes in red are negative trendsSources Banksrsquo financial statements 2008ndash2012 n=13 Bain analysis
2012 Change2008minus2012
2010 2011
Total RWA (euroB)
Total assets (euroB)
RWAtotal assets ()
Tier 1 ratio ()
Total Tier 1 (euroB)
Net interest incomeRWA ()
Financial marginRWA ()
Net interest incometotal assets ()
Financial margintotal assets ()
Net interest income + financial marginRWA ()
Fees + other revenuesRWA ()OpexRWA ()
Costincome ()
Opextotal assets ()
Loan-loss provisionsRWA ()
Nonperforming loan ratio ()
Coverage ratio ()
3115
8886
35
129
402
35
12
12
04
47
1239
66
14
14
56
50
-23
+31
-19 pts
+39 pts
+40
+04 pts
+17 pts
+01 pts
+06 pts
+21 pts
-09 pts+02 pts
-12 pts
No change
+04 pts
+22 pts
+3 pts
3339
8509
39
114
382
34
11
13
04
45
1233
57
13
14
54
48
3214
8674
37
119
382
35
03
13
01
38
1739
70
14
14
57
48
2009
3468
8222
42
102
353
31
10
13
04
41
1532
58
14
19
50
46
3188
8616
37
90
287
31
-05
12
-02
26
2137
78
14
10
34
47
Cross-selling
Asset leverage
Balance-sheet management
Cost structure
Cost of risk
2008Components
7222019 Bain amp Co- European Banking Report
httpslidepdfcomreaderfullbain-co-european-banking-report 1632
European banking | Bain amp Company Inc
Page 14
Local banks have seen their RoRWA sharply deteriorate in recent years
The range represents the level of RoRWA required to cover the banksrsquo cost of capital and varies by bank size and country analysis of 65 banks operating exclusivelywithin a single national or regional marketSources Banksrsquo financial statements 2008ndash2012 Bain analysis
RoRWA weighted average
RWA (euroB)
Total assets (euroB)
ROE ()
Range ofRoRWArequiredto coverthe costof capital
10347
-68
4198
9571
20
3904
9462
59
3748
10044
20
3890
8948
-42
3293
2008
-06
2009
02
2010
07
2011
02
2012
-11
-2
-1
0
1
21816
Local banks have experienced sharp deleveraging higher cost of risk more nonperforming loans and flat revenues
Notes Components in bold are direct components of the RoRWA calculation changes in red are negative trendsSources Banksrsquo financial statements 2008ndash2012 n=65 Bain analysis
2012 Change2008minus2012
2010 2011
Total RWA (euroB)
Total assets (euroB)
RWAtotal assets ()
Tier 1 ratio ()
Total Tier 1 (euroB)
Net interest incomeRWA ()
Financial marginRWA ()
Net interest incometotal assets ()
Financial margintotal assets ()
Net interest income + financial marginRWA ()
Fees + other revenuesRWA ()OpexRWA ()
Costincome ()
Opextotal assets ()
Loan-loss provisionsRWA ()
Nonperforming loan ratio ()
Coverage ratio ()
3293
8948
37
139
457
28
06
10
02
34
1135
71
13
20
64
46
-215
-135
-38 pts
+44 pts
+15
+03 pts
+14 pts
No change
+06 pts
+17 pts
-05 pts+08 pts
-17 pts
+02 pts
+1 pts
+44 pts
-18 pts
3748
9462
40
113
422
28
05
11
02
33
1430
65
12
09
40
52
3890
10044
39
118
461
28
03
11
01
31
1532
69
13
12
43
51
2009
3904
9571
41
109
426
28
04
11
02
32
1430
65
12
14
36
51
4198
10347
41
94
396
25
-09
10
-04
16
1628
87
11
10
20
64
Cross-selling
Asset leverage
Balance-sheet management
Cost control
Cost of risk
2008Components
7222019 Bain amp Co- European Banking Report
httpslidepdfcomreaderfullbain-co-european-banking-report 1732
European banking | Bain amp Company Inc
Page 15
7222019 Bain amp Co- European Banking Report
httpslidepdfcomreaderfullbain-co-european-banking-report 1832
7222019 Bain amp Co- European Banking Report
httpslidepdfcomreaderfullbain-co-european-banking-report 1932
bull Countries with strong economic growth led the2012 RoRWA rankings Turkey took pole positionwith a 49 RoRWA In core Europe the Nordic
countries posed the strongest performance witha 19 RoRWA followed by Austria and theNetherlands The largest economies of Germanythe UK and France trailed behind
bull Banks in Italy Portugal Spain and Ireland whichhave been mired in the sovereign debt crisis anddeep economic recessions turned in the weakestRoRWA performances
bull Among the core European countries changes inRoRWAs from 2008 to 2012 stemmed mainly
from changes in three components net interestincome financial margin and loan-loss provisions
bull Countries that posted large positive changesmdashincluding Germany the Netherlands the Nordiccountries and the UKmdashbenefited from higherfinancial margins more control of operatingexpenditure and lower cost of risk Countries withlarge drops in RoRWAs were hurt by infl exiblecost structures which prevented them from shrinkingtheir production costs and a cost of risk that was
almost double the averagebull Northern Europe dominated the league tables
whether one looks at the 2012 leaders or themost improved banks For example the RoRWAleaders among both local and the 10 biggestbanks included banks in the Nordic countriesfollowed by those in the UK France Austria andthe Netherlands
bull In the most improved group banks in Switzer-land the Netherlands and Germany made a
strong showing
bull In high-growth countries Turkey and the Common-wealth of Independent States (CIS) took leadingpositions for the most improved banks and Turkeyfor the 2012 leaders
2Country and cluster
league tables
7222019 Bain amp Co- European Banking Report
httpslidepdfcomreaderfullbain-co-european-banking-report 2032
European banking | Bain amp Company Inc
Page 18
High-growth countries led the RoRWA rankings in 2012
Note For CIS the Netherlands Belgium Germany UK France Portugal and Spain one or two Tier-3 banks had not reported 2012 data by time of publicationso the analysis used 2011 data for those few banksSources Banksrsquo financial statements 2008ndash2012 n=121 Bain analysis
Rank 2012 RoRWA ()
Turkey
Poland
South Africa
CIS
Nordics
Austria
Netherlands
Belgium
Germany
UK
France
Switzerland
Italy
Portugal
Spain
Ireland
1
2
3
4
5
6
7
8
9
10
11
12
13
14
15
16
49
47
31
27
19
12
10
08
07
05
03
01
-06
-08
-17
-48
480
167
340
826
2357
334
2186
911
5514
7062
6320
1812
2127
426
2917
312
2012 total assets (euroB)Country 2008 RoRWA ()
33
41
35
10
13
19
-20
-25
-14
00
08
-76
07
10
19
10
7222019 Bain amp Co- European Banking Report
httpslidepdfcomreaderfullbain-co-european-banking-report 2132
European banking | Bain amp Company Inc
Page 19
In core European countries RoRWA changes from 2008 to 2012hellip
Note Averages are weighted for the total size of the respective components in each countrySources Banksrsquo financial statements 2008ndash2012 n=71 Bain analysis
RoRWA weighted average
-3
-2
-1
0
1
2
2008 average2012 average
UK
05
France
08
Germany
-14
07
Spain
19
-17
Nordics
13
19
Italy
07
-06
Netherlands
-20
10
2008 2012
0003
hellipwere spurred mainly by net interest income financial margin and loan-loss provisions
Note Averages are weighted for the total sizes of the respective indicators in each countrySources Banksrsquo financial statements 2008-2012 n=71 Bain analysis
NordicsGermany Spain
Total assets (euroB)
Total RWA (euroB)
Net interest incomeRWA ()
Financial marginRWA ()
Fees and commissions +other revenuesRWA ()
OpexRWA ()
Loan-loss provisionsRWA ()
France
7751
UK
2008 2012
AverageItaly Netherlands
7039
2474 2467
31 30
-02 12
26 15
41 42
14 10
5857 5715
1532 1327
26 38
-03 16
30 13
40 54
05 10
6054 5419
1534 1317
26 32
-19 07
14 17
27 43
08 06
1976 2917
1068 1315
36 43
06 06
17 10
27 35
13 41
1960 2357
790 735
27 32
-02 12
17 10
24 28
05 05
1990 2127
1266 1139
32 28
01 04
18 18
33 35
10 22
2263 2054
729 656
29 41
-17 06
15 10
39 38
09 09
2071 3947
928 1279
30 34
-05 10
17 14
32 41
08 15
7222019 Bain amp Co- European Banking Report
httpslidepdfcomreaderfullbain-co-european-banking-report 2232
European banking | Bain amp Company Inc
Page 20
These banks are the 2012 RoRWA leaders of their geographic cluster
Sources Banksrsquo financial statements 2008ndash2012 Bain analysis
Rank 2012 RoRWA ()
Nordics
UK
France
UK
Austria
Netherlands
Nordics
Nordics
Nordics
Turkey
Turkey
Turkey
1
2
3
1
2
3
1
2
3
1
2
3
19
18
16
23
17
16
40
39
36
158
132
48
Nordea
HSBC
BNP Paribas
Standard Chartered
Erste
ING
Swedbank
Sparebank 1 Group
Handelsbanken
Ziraat Bankasi
Akbank
Tuumlrkiye Halk
Bank Country 2008 RoRWA ()
16
08
06
24
19
02
20
NA
21
193
106
38
10biggest
Otherlarge
European
Local
High-growthcountries
These banks showed the biggest improvements in RoRWA over the past five years
Sources Banksrsquo financial statements 2008ndash2012 Bain analysis
Rank 2008ndash2012 change( points)
Switzerland
Switzerland
Germany
Belgium
UK
Netherlands
Netherlands
Belgium
Germany
CIS
Turkey
CIS
1
2
3
1
2
3
1
2
3
1
2
3
+83
+68
+21
+29
+26
+14
+64
+50
+33
+71
+26
+13
UBS
Credit Suisse
Deutsche Bank
KBC
RBS
ING
RBS Holdings NV
BNP Paribas Fortis
Bayerische Landesbank
Gazprombank
Akbank
VTB 24
Bank Country 2008 RoRWA ()
-92
-58
-19
-19
-37
02
-91
-45
-26
-56
106
05
10biggest
Otherlarge
European
Local
High-growthcountries
7222019 Bain amp Co- European Banking Report
httpslidepdfcomreaderfullbain-co-european-banking-report 2332
European banking | Bain amp Company Inc
Page 21
7222019 Bain amp Co- European Banking Report
httpslidepdfcomreaderfullbain-co-european-banking-report 2432
7222019 Bain amp Co- European Banking Report
httpslidepdfcomreaderfullbain-co-european-banking-report 2532
bull Europersquos environment continues to be volatile andinvestors are seeking better information about abankrsquos stability asset quality and key factors that
generate value RoRWA plays a useful role hereby focusing on the balance sheetmdashwhich enablescomparison between a bank and its peersmdashand byidentifying the factors influencing bank performance
bull Banks still need to address challenges along eachdimension of RoRWA in order to lift their profit-ability levels above the cost of capital In recent
years the profitability of lending assets has beensustained mainly by the fi nancial componentsincluding a boost from LTRO To raise asset prof-itability banks will have to better manage their
capital allocations and risk profilesbull The pressure on fee income will continue To offset
that trend banks should turn to their close clientrelationships for new sources of revenues
bull Lowering operating costs is the dimension thatwarrants managementrsquos attention at any bankregardless of size or location Initiatives that havethe greatest potential for tackling structural costsinclude adopting digital technologies and modern-izing IT platforms optimizing processes from endto end through outsourcing offshoring and other
means and expanding global procurement Suchinitiatives are essential for survival in an industrygoing through discontinuous change
bull Deleveraging the loan portfolio for riskier clients isa pressing issue which still poses significant threatsfor local banks In countries with a higher cost ofrisk and stagnant or negative GDP growth rateslocal banks may face further painful restructuring
bull Astute management of the cost of risk includingtaking a portfolio perspective offers opportunities
for most banksmdashin part to meet the new require-ments of Basel III and reassure rating agencies
bull Further consolidation of the local and other largebanks over the coming years will likely benefitthe 10 biggest banks and those in high-growthcountries These high-growth countries offer thegreatest opportunities for RoRWA growth for largeand pan-European players looking to diversifytheir portfolios
3Strategic
perspectives and
implications for
management
7222019 Bain amp Co- European Banking Report
httpslidepdfcomreaderfullbain-co-european-banking-report 2632
European banking | Bain amp Company Inc
Page 24
Significant restructuring is warranted for all banks but the nature of the challenge varies by geography
Source Bain analysis
10 biggest Strategic issueHigh-growth
countries
Other large
EuropeanLocal
Cross-selling
Balance-sheet
management
Cost structure
Cost of risk
Major threatThreatOpportunityMajor opportunity
Profitability of the asset portfolio has been sustained mainly by the
financial component Deleveraging of the loan portfolio for riskier
clients has been only partially successful and the risk profile of
the portfolio still has a long way to go
To counter pressure on fees banks should work systematically on
cross-selling opportunities through initiatives like client-focused
service models and CRM support
To further reduce costs banks should pursue new digital technologies
optimized processes through such means as outsourcing and offshoring
modernized IT platforms and global procurement initiatives
Active management of cost of risk demands more systematic solutions
bull NPL and LLP trends are threatening the stability of the overall
system and not only in individual countries such as Greece
bull Management of risky clients has become a core business and capability
bull Managing costs of risk demands an integrated portfolio approach
7222019 Bain amp Co- European Banking Report
httpslidepdfcomreaderfullbain-co-european-banking-report 2732
European banking | Bain amp Company Inc
Page 25
Assets (euroB)
Erste (AT)
Raiffeisen Bank (AT)
BNP Paribas Fortis
KBC
Belfius Banque
ING Belgium SANV
Creacutedit Agricole Groupe
BNP Paribas
Groupe Socieacuteteacute Geacuteneacuterale
Groupe BPCE
Creacutedit Mutuel
Deutsche Bank
Commerzbank AGKfW
DZ Bank AG
UniCredit Bank AG
2138
1202
2723
2569
2129
1691
17930
15439
12307
11475
6051
20123
63595116
4072
3483
Austria
Belgium
France
Germany
Country Bank Cluster
Other large
Local
Local
Other large
Local
Local
10 biggest
10 biggest
Other large
Local
Local
10 biggest
Other largeLocal
Local
Local
Ireland
Landesbank Baden-Wuumlrttemberg
Bayerische Landesbank
NORDLB
Helaba
HSH Nordbank
DekaBank
Landesbank Berlin Holding
Santander Consumer Bank
Hamburger Sparkasse
Deutsche Apotheker - und Aumlrztebank
Sparkasse KoumllnBonn
Kreissparkasse Koumlln
Bank of Ireland
Allied Irish Banks
permanent tsb Group Hldgs Plc
Intesa Sanpaolo
3363
2868
2256
1993
1306
1297
1183
403
396
379
299
248
1481
1225
409
6735
Local
Local
Local
Local
Local
Local
Local
Local
Local
Local
Local
Local
Other large
10 biggest
Local
Other large
Unicredit Group
Monte dei Paschi di Siena
4639
2189
10 biggest
Local
UBI Banca Group
Banco Popolare
BNL
Banca Popolare dellrsquoEmilia Romagna
Banca Popolare di Milano
Gruppo Banca Carige
Cariparma
Banca Popolare di Vicenza
Veneto Banca
1324
1319
912
616
525
493
493
467
402
Local
Local
Local
Local
Local
Local
Local
Local
Local
Italy
2011 assets
Bca Popdi Sondrio 322 Local
Credito Emiliano
Credito Valtellinese
Banca delle Marche
307
299
227
Local
Local
Local
List of banks analyzed by country and assets
10 biggest other large local
7222019 Bain amp Co- European Banking Report
httpslidepdfcomreaderfullbain-co-european-banking-report 2832
European banking | Bain amp Company Inc
Page 26
Assets (euroB)Country Bank Cluster
ING
Rabobank Group
ABN AMRO Group
SNS Reaal
RBS Holdings NV
8361
7524
3944
1322
710
Netherlands
Other large
Other large
Other large
Local
Local
Nordea 6774 10 biggest
Danske Bank
DNB
4682
3028
Other large
Local
SEB
Handelsbanken
Swedbank
Pohjola Bank
2818
2742
2121
998
Local
Local
Local
Local
Nordics
Jyske Bank 347 Local
Sparebank 1 Group 62 Local
Caixa Geral de Depositos 1169 Local
Millenium BCP
Banco Espiacuterito Santo
897
837
Local
Local
Banco BPI
Santander Totta SGPS
Caixa Econoacutemica Montepio Geral
Creacutedito Agriacutecola Muacutetuo
446
414
215
142
Local
Local
Local
Local
Portugal
BANIF 140 Local
SantanderBBVA
la Caixa
Banco Financiero y de Ahorros
Banco Sabadell SA
122826378
3591
3092
1615
Spain
10 biggestOther large
Local
Local
Local
Banco Popular
Banco Mare Nostrum
1576
634
Local
Local
UBS
Credit Suisse
10448
7669Switzerland
10 biggest
10 biggest
HSBC 20939 10 biggest
Barclays
Royal Bank of Scotland
17603
11521
10 biggest
Other large
Lloyds Banking Group
Standard Chartered
Nationwide Building Society
Co-operative Bank
11395
4950
2417
611
Other large
Other large
Local
Local
UK
Clydesdale Bank 545 Local
Yorkshire Building Society 413 Local
Virgin Money 223 Local
2011 assets
List of banks analyzed by country and assets
10 biggest other large localmdashcontinued
7222019 Bain amp Co- European Banking Report
httpslidepdfcomreaderfullbain-co-european-banking-report 2932
European banking | Bain amp Company Inc
Page 27
Assets (euroB)
Sberbank
VTB 24
PKO BP
Bank Pekao
BRE Bank
ING Bank Slaski
Standard Bank
Absa
FirstRand
Nedbank
Investec
Tuumlrkiye İş Bankası
Tuumlrkiye Garanti
Ziraat Bankasi
Akbank
Yapı ve Kredi
3781
1857
463
361
244
187
928
766
729
647
330
869
777
708
706
568
CIS
Poland
South Africa
Turkey
Country Bank
Tuumlrkiye Halk Bankasi
Tuumlrkiye Vakıflar
Finansbank
471
467
239
Gazprombank
Russian Agricultural Bank
Alfa-Bank
Nomos-Bank
UniCredit Bank Russia
712
358
357
225
218
AKB Rosbank
Promsvyazbank
ZAO Raiffeisenbank
URALSIB Bank
Russian Standard Bank
AKB Probusinessbank
200
173
160
113
74
35
2011 assets
Bank Zachodni WBK + Kredyt Bank
Getin NobleBank
Bank Millennium
143
141
126
List of banks analyzed by country and assets
High-growth countries
7222019 Bain amp Co- European Banking Report
httpslidepdfcomreaderfullbain-co-european-banking-report 3032
European banking | Bain amp Company Inc
Page 28
Key contacts in Bainrsquos European Financial Services practice
Franco Baronio in Milan (francobaroniobaincom)Rocco DrsquoAcunto in Milan (roccodacuntobaincom)
Ada Di Marzo in Paris (adadimarzobaincom)
Bertrand Facq in Warsaw (bertrandfacqbaincom)
Fabrice Franzen in Johannesburg (fabricefranzenbaincom)
Thomas Herbeck in Frankfurt (thomasherbeckbaincom)
Karaca Kestelli in Istanbul (karacakestellibaincom)
Nicolaacutes Lopez in Madrid (nicolaslopezbaincom)
Niels Peder Nielsen in Copenhagen (nielspedernielsenbaincom)
Andrea Oldrini in Milan (andreaoldrinibaincom)
Mathijs Robbens in Amsterdam (mathijsrobbensbaincom)
Visar Sala in Moscow (visarsalabaincom)
Walter Sinn in Frankfurt (waltersinnbaincom)Joatildeo Soares in London (joaosoaresbaincom)
Acknowledgments
The authors would like to thank the following Bain colleagues for their valuable support in producing this report
Sonal Chawla Christian Duus Franccedilois Fastrez Farsan Ghassim and Shikha Mahato
See these related Bain perspectives at wwwbaincom
bull Managing risk and capital
bull How Europersquos banks can return to health
bull The digital challenge to retail banks
7222019 Bain amp Co- European Banking Report
httpslidepdfcomreaderfullbain-co-european-banking-report 3132
7222019 Bain amp Co- European Banking Report
httpslidepdfcomreaderfullbain-co-european-banking-report 3232
For more information visit wwwbaincom
Share983140 983105m983138io983150 Tru Rs983157983148ts
Bain amp Company is the management consulting firm that the worldrsquos business leaders come to whenthey want results
Bain advises clients on strategy operations technology organization private equity and mergers and acquisitions We develop
practical customized insights that clients act on and transfer skills that make change stick Founded in 1973 Bain has
48 offices in 31 countries and our deep expertise and client roster cross every industry and economic sector Our clients
have outperformed the stock market 4 to 1
What sets us apart
We believe a consulting firm should be more than an adviser So we put ourselves in our clientsrsquo shoes selling outcomes not
projects We align our incentives with our clientsrsquo by linking our fees to their results and collaborate to unlock the full potential
of their business Our Results Deliveryreg process builds our clientsrsquo capabilities and our True North values mean we do theright thing for our clients people and communitiesmdashalways

7222019 Bain amp Co- European Banking Report
httpslidepdfcomreaderfullbain-co-european-banking-report 832
7222019 Bain amp Co- European Banking Report
httpslidepdfcomreaderfullbain-co-european-banking-report 932
bull European banksrsquo return on risk recovered from the2008 financial crisis peaking in 2010 with an aver-age 13 RoRWA Since then however RoRWA
has declined to 05 on average This translatesto a level of profitability below the cost of capitalwhich means banks are destroying value
bull Looking beneath the average European banksrsquoRoRWAs correlated closely with economic growthover the past five years Banks in countries that sawstrong GDP growth like Turkey posted dramaticallyhigher performance and growth in both assetsand risk-weighted assets (RWA) than those in thecore European countries
bull Banks in high-growth countries also consistently
exceeded their cost of capital whereas banks incore Europe have not covered their cost of capitalonly coming close to that bar in 2010 Core Europeexperienced a major amount of deleveragingdespite extraordinary initiatives such as theEuropean Central Bankrsquos long-term refinancingoperation (LTRO)
bull The quality of management plays a major role inindividual bank performance particularly in theslow-growth countries There was a wide rangeof RoRWAs among banks in those markets for each
of the five yearsbull In 2012 the biggest factors determining significant
value destruction were cost of risk as loan-lossprovisions rose and increased operating costwhich trended up as a percent of risk-weightedassets More active management of the balance sheethelped raise revenues but fees and commissionsprogressively declined
bull The larger the bank the better its performance onaverage The 10 biggest banks used their improve-
ments in financial margins and lower risk costs tocome close to earning their cost of capital
bull Other large regional banks managed to keep oper-ating costs lower than the 10 biggest but still fellwell short of their capital hurdle Smaller local banksfared the worst posting a negative RoRWA in 2012They have been forced to undertake a major de-leveraging of their balance sheets
1Five years of
RoRWA in Europe
A bumpy
landscape
7222019 Bain amp Co- European Banking Report
httpslidepdfcomreaderfullbain-co-european-banking-report 1032
European banking | Bain amp Company Inc
Page 8
Although RoRWA correlates with economic growth there is still substantial variation among banks
Note Each observation is composed of a bankrsquos RoRWA in a given year and the respective countryrsquos year-over-year GDP growth rate in that yearSources Banksrsquo financial statements 2008ndash2012 n=605 Bureau van Dijk Bain analysis
RoRWA per bank and year 2008ndash2012
-5
-3
0
3
5
-10 0 10 20 30
95 ofobservationsfall withinthis band
Recessionno growthManagement has a major role
in determining RoRWA
Mediumhigh growthManagement has amore limited role in
achieving high RoRWA
Very high growthManagementrsquos most important role
is to optimize strategic asset allocationfor revenue generation
GDP growth by country and year 2008ndash2012
Bank profitability has eroded since the post-crisis peak of 2010
Return on equity (ROE) = Pretax profitaverage shareholdersrsquo equitySources Banksrsquo financial statements 2008ndash2012 n=121 Bureau van Dijk Bain analysis
European-wide RoRWA
0
1
2
200800
2009
07
2010 2011
09
2012
05
RWA (euroB)
33576
08
11690
44
30229
64
11555
-32
31770
104
11726
52
33528
75
11986
53
33028
49
11207
29
Total assets (euroB)
Annual GDP growth ()
ROE ()
13
7222019 Bain amp Co- European Banking Report
httpslidepdfcomreaderfullbain-co-european-banking-report 1132
European banking | Bain amp Company Inc
Page 9
Banks in core Europe have not covered their cost of capital over the past five years
The range represents the level of RoRWA required to cover the banksrsquo cost of capital and varies by bank size and country analysis of 88 banks based in AustriaBelgium France Germany Ireland Italy the Netherlands the Nordics Portugal Spain Switzerland and the UKSources Banksrsquo financial statements 2008ndash2012 Bain analysis
RoRWA weighted average
RWA (euroB)
32373
-15
10899
29129
51
10846
30366
88
10785
31957
53
10869
31219
22
10047
Total assets (euroB)
ROE ()
2008
-01
2009
06
2010 2011
06
2012
01
Range ofRoRWArequiredto coverthe costof capital
11
-1
0
1
2
3
4
1816
while banks in high-growth countries consistently exceeded their cost of capital
The range represents the level of RoRWA required to cover the banksrsquo cost of capital and varies by bank size and country analysis of 33 banks based in theCommonwealth of Independent States (CIS) Poland South Africa and TurkeySources Banksrsquo financial statements 2008ndash2012 Bain analysis
RoRWA weighted average
RWA (euroB)
1203
226
791
1100
206
708
Total assets (euroB)
ROE ()
Range ofRoRWArequiredto coverthe costof capital
0
1
2
3
4
2008
24
2009
22
1404
250
941
2010
32
1571
267
1117
2011
31
1810
247
1160
2012
33
2119
7222019 Bain amp Co- European Banking Report
httpslidepdfcomreaderfullbain-co-european-banking-report 1232
European banking | Bain amp Company Inc
Page 10
Higher operating expenditure and cost of risk caused banksrsquo value destruction in 2012
Long-term refinancing operations (LTRO) 2011 ~euro500 billion LTRO 2012 ~euro750 billion (including repayment) corresponding to 2011 total assets of ~euro330 trillionand 2012 total assets of ~euro322 trillionSources Banksrsquo financial statements 2008ndash2012 n=121 Bain analysis
20122010 2011
RoRWA ()
Total assets (euroB)
Tier 1 capital (euroB)
RWAtotal assets ()
Net interest incomeRWA ()
Financial marginRWA ()
Fees and commissions +
other revenuesRWA ()
Operating expenditureRWA ()
Loan-loss provisionsRWA ()
05
33028
1510
34
36
09
17
43
15
13
31770
1363
37
35
10
17
37
12
09
33528
1426
36
35
05
20
40
12
2009
07
30229
1261
38
34
09
17
35
18
00
33576
1079
35
31
-07
22
36
11
2008Main components in
European-wide RoRWA Major trends
Partial deleveraging of assets
Strengthening of capital
Fairly constant risk profile despite
deleveraging of assets
Overall margin from balance-sheet
management increasing
Continuous pressure on fees
and commissions
Inability to reduce costs in
proportion to deleveraging
Rising cost of credit
7222019 Bain amp Co- European Banking Report
httpslidepdfcomreaderfullbain-co-european-banking-report 1332
European banking | Bain amp Company Inc
Page 11
In core Europe banks increased capital ratios and revenues but did not optimize costs
Notes Components in bold are direct components of the RoRWA calculation changes in red are negative trendsSources Banksrsquo financial statements 2008ndash2012 n=88 Bain analysis
2012 Change2008minus20122010 2011
Total RWA (euroB)
Total assets (euroB)
RWAtotal assets ()
Tier 1 ratio ()
Total Tier 1 (euroB)
Net interest incomeRWA ()
Financial marginRWA ()
Net interest incometotal assets ()
Financial margintotal assets ()
Net interest income + financial marginRWA ()
Fees + other revenuesRWA ()
OpexRWA ()
Costincome ()
Loan-loss provisionsRWA ()
Nonperforming loan ratio ()
Coverage ratio ()
10047
31219
32
133
1336
34
09
11
03
43
16
43
70
15
55
49
-78
-36
-2 pts
+43 pts
+36
+05 pts
+16 pts
+01 pts
+05 pts
+21 pts
-06 pts
+07 pts
-10 pts
+05 pts
+30 pts
-12 pts
10785
30366
36
114
1230
33
10
12
04
43
16
37
62
12
46
50
10869
31957
34
118
1280
33
05
11
02
39
19
40
68
12
47
51
2009
10846
29129
37
107
1159
32
09
12
03
41
17
35
61
17
40
54
10899
32373
34
90
981
29
-07
10
-02
22
22
35
80Opextotal assets () 14 +02 pts13 141312
10
25
61
Cross-selling
Asset leverage
Balance-sheet management
Cost structure
Cost of risk
2008Components
In high-growth countries higher financial margins offset lower fees and relatively high nonperforming loans
affected cost of risk
Notes Components in bold are direct components of the RoRWA calculation changes in red are negative trendsSources Banksrsquo financial statements 2008ndash2012 n=33 Bain analysis
2012 Change2008minus2012
2010 2011
Total RWA (euroB)
Total assets (euroB)
RWAtotal assets ()
Tier 1 ratio ()
Total Tier 1 (euroB)
Net interest incomeRWA ()
Financial marginRWA ()
Net interest incometotal assets ()
Financial margintotal assets ()
Net interest income + financial marginRWA ()
Fees + other revenuesRWA ()OpexRWA ()
Costincome ()
Opextotal assets ()
Loan-loss provisionsRWA ()
Nonperforming loan ratio ()
Coverage ratio ()
1160
1810
64
150
174
57
05
36
04
62
2543
45
27
11
49
64
+47
+50
-2 pts
+27 pts
+78
-01 pts
+05 pts
-02 pts
+04 pts
+05 pts
-02 pts+01 pts
-2 pts
-01 pts
-07 pts
+12 pts
+5 pts
941
1404
67
141
133
55
05
37
04
60
2741
43
28
15
69
63
1117
1571
71
131
147
50
03
35
02
53
2438
45
27
08
55
64
2009
708
1100
64
144
102
67
08
43
05
75
2743
39
28
36
82
57
791
1203
66
123
97
58
00
38
00
58
2742
47
28
18
37
59
Cross-selling
Asset leverage
Balance-sheet management
Cost structure
Cost of risk
2008Components
7222019 Bain amp Co- European Banking Report
httpslidepdfcomreaderfullbain-co-european-banking-report 1432
European banking | Bain amp Company Inc
Page 12
Europersquos 10 biggest banks come closest to earning their cost of capital
The range represents the level of RoRWA required to cover the banksrsquo cost of capital and varies by bank size and country Analysis of the 10 largest Europe-headquarteredbanks by market capitalization with a pan-European presence a universal bank business model and assets of at least euro650 billion (Barclays BNP ParibasCreacutedit Agricole Credit Suisse Deutsche Bank HSBC Nordea Santander UBS and UniCredit)Sources Banksrsquo financial statements 2008ndash2012 Bain analysis
RoRWA weighted average
RWA (euroB)
1340922
3514
1133694
3474
Total assets (euroB)
ROE ()
Range ofRoRWArequiredto coverthe costof capital
12395123
3698
13239107
3765
1338559
3639
2008
02
2009 2010
17
2011
14
2012
09
12
0
1
2
18
16
Among the 10 biggest banks lower risk costs and improved margins offset high Opex
Notes Components in bold are direct components of the RoRWA calculation changes in red are negative trendsSources Banksrsquo financial statements 2008ndash2012 n=10 Bain analysis
2012 Change2008minus2012
2010 2011
Total RWA (euroB)
Total assets (euroB)
RWAtotal assets ()
Tier 1 ratio ()
Total Tier 1 (euroB)
Net interest incomeRWA ()
Financial marginRWA ()
Net interest incometotal assets ()
Financial margintotal assets ()
Net interest income + financial marginRWA ()
Fees + other revenuesRWA ()OpexRWA ()
Costincome ()
Opextotal assets ()
Loan-loss provisionsRWA ()
Nonperforming loan ratio ()
Coverage ratio ()
3639
13385
27
131
477
38
10
10
03
49
2452
71
14
12
45
54
+36
-02
+1 pts
+46 pts
+60
+05 pts
+18 pts
+02 pts
+05 pts
+23 pts
-06 pts+09 pts
-6 pts
+03 pts
+01 pts
+21 pts
-24 pts
3698
12395
30
115
426
37
14
11
04
51
2346
62
14
11
46
52
3765
13239
28
116
437
38
09
11
03
47
2648
65
14
11
44
53
2009
3474
11336
31
110
380
37
14
11
04
51
2244
60
13
17
35
71
3514
13409
26
85
299
33
-07
09
-02
26
3043
77
11
11
24
78
Cross-selling
Asset leverage
Balance-sheet management
Cost structure
Cost of risk
2008Components
7222019 Bain amp Co- European Banking Report
httpslidepdfcomreaderfullbain-co-european-banking-report 1532
European banking | Bain amp Company Inc
Page 13
Other large European banks have fallen well short of earning their cost of capital
The range represents the level of RoRWA required to cover the banksrsquo cost of capital and varies by bank size and country Analysis of 13 banks with assets of at leasteuro200 billion a universal bank business model and small to medium-sized subsidiaries outside their core geography (ABN AMRO Group BBVA Commerzbank Danske BankErste ING Intesa Sanpaolo KBC Lloyds Rabobank RBS Socieacuteteacute Geacuteneacuterale and Standard Chartered)Sources Banksrsquo financial statements 2008ndash2012 Bain analysis
RoRWA weighted average
RWA (euroB)
Total assets (euroB)
ROE ()
Range ofRoRWArequiredto coverthe costof capital
861607
3188
2008
01
822237
3468
2009
04
850978
3339
2010
867422
3214
2011
03
888640
3115
2012
06
10
0
1
2
18
16
Other large European banks had Opex lower than the big 10 which offset pressure on fee income and
higher cost of risk
Notes Components in bold are direct components of the RoRWA calculation changes in red are negative trendsSources Banksrsquo financial statements 2008ndash2012 n=13 Bain analysis
2012 Change2008minus2012
2010 2011
Total RWA (euroB)
Total assets (euroB)
RWAtotal assets ()
Tier 1 ratio ()
Total Tier 1 (euroB)
Net interest incomeRWA ()
Financial marginRWA ()
Net interest incometotal assets ()
Financial margintotal assets ()
Net interest income + financial marginRWA ()
Fees + other revenuesRWA ()OpexRWA ()
Costincome ()
Opextotal assets ()
Loan-loss provisionsRWA ()
Nonperforming loan ratio ()
Coverage ratio ()
3115
8886
35
129
402
35
12
12
04
47
1239
66
14
14
56
50
-23
+31
-19 pts
+39 pts
+40
+04 pts
+17 pts
+01 pts
+06 pts
+21 pts
-09 pts+02 pts
-12 pts
No change
+04 pts
+22 pts
+3 pts
3339
8509
39
114
382
34
11
13
04
45
1233
57
13
14
54
48
3214
8674
37
119
382
35
03
13
01
38
1739
70
14
14
57
48
2009
3468
8222
42
102
353
31
10
13
04
41
1532
58
14
19
50
46
3188
8616
37
90
287
31
-05
12
-02
26
2137
78
14
10
34
47
Cross-selling
Asset leverage
Balance-sheet management
Cost structure
Cost of risk
2008Components
7222019 Bain amp Co- European Banking Report
httpslidepdfcomreaderfullbain-co-european-banking-report 1632
European banking | Bain amp Company Inc
Page 14
Local banks have seen their RoRWA sharply deteriorate in recent years
The range represents the level of RoRWA required to cover the banksrsquo cost of capital and varies by bank size and country analysis of 65 banks operating exclusivelywithin a single national or regional marketSources Banksrsquo financial statements 2008ndash2012 Bain analysis
RoRWA weighted average
RWA (euroB)
Total assets (euroB)
ROE ()
Range ofRoRWArequiredto coverthe costof capital
10347
-68
4198
9571
20
3904
9462
59
3748
10044
20
3890
8948
-42
3293
2008
-06
2009
02
2010
07
2011
02
2012
-11
-2
-1
0
1
21816
Local banks have experienced sharp deleveraging higher cost of risk more nonperforming loans and flat revenues
Notes Components in bold are direct components of the RoRWA calculation changes in red are negative trendsSources Banksrsquo financial statements 2008ndash2012 n=65 Bain analysis
2012 Change2008minus2012
2010 2011
Total RWA (euroB)
Total assets (euroB)
RWAtotal assets ()
Tier 1 ratio ()
Total Tier 1 (euroB)
Net interest incomeRWA ()
Financial marginRWA ()
Net interest incometotal assets ()
Financial margintotal assets ()
Net interest income + financial marginRWA ()
Fees + other revenuesRWA ()OpexRWA ()
Costincome ()
Opextotal assets ()
Loan-loss provisionsRWA ()
Nonperforming loan ratio ()
Coverage ratio ()
3293
8948
37
139
457
28
06
10
02
34
1135
71
13
20
64
46
-215
-135
-38 pts
+44 pts
+15
+03 pts
+14 pts
No change
+06 pts
+17 pts
-05 pts+08 pts
-17 pts
+02 pts
+1 pts
+44 pts
-18 pts
3748
9462
40
113
422
28
05
11
02
33
1430
65
12
09
40
52
3890
10044
39
118
461
28
03
11
01
31
1532
69
13
12
43
51
2009
3904
9571
41
109
426
28
04
11
02
32
1430
65
12
14
36
51
4198
10347
41
94
396
25
-09
10
-04
16
1628
87
11
10
20
64
Cross-selling
Asset leverage
Balance-sheet management
Cost control
Cost of risk
2008Components
7222019 Bain amp Co- European Banking Report
httpslidepdfcomreaderfullbain-co-european-banking-report 1732
European banking | Bain amp Company Inc
Page 15
7222019 Bain amp Co- European Banking Report
httpslidepdfcomreaderfullbain-co-european-banking-report 1832
7222019 Bain amp Co- European Banking Report
httpslidepdfcomreaderfullbain-co-european-banking-report 1932
bull Countries with strong economic growth led the2012 RoRWA rankings Turkey took pole positionwith a 49 RoRWA In core Europe the Nordic
countries posed the strongest performance witha 19 RoRWA followed by Austria and theNetherlands The largest economies of Germanythe UK and France trailed behind
bull Banks in Italy Portugal Spain and Ireland whichhave been mired in the sovereign debt crisis anddeep economic recessions turned in the weakestRoRWA performances
bull Among the core European countries changes inRoRWAs from 2008 to 2012 stemmed mainly
from changes in three components net interestincome financial margin and loan-loss provisions
bull Countries that posted large positive changesmdashincluding Germany the Netherlands the Nordiccountries and the UKmdashbenefited from higherfinancial margins more control of operatingexpenditure and lower cost of risk Countries withlarge drops in RoRWAs were hurt by infl exiblecost structures which prevented them from shrinkingtheir production costs and a cost of risk that was
almost double the averagebull Northern Europe dominated the league tables
whether one looks at the 2012 leaders or themost improved banks For example the RoRWAleaders among both local and the 10 biggestbanks included banks in the Nordic countriesfollowed by those in the UK France Austria andthe Netherlands
bull In the most improved group banks in Switzer-land the Netherlands and Germany made a
strong showing
bull In high-growth countries Turkey and the Common-wealth of Independent States (CIS) took leadingpositions for the most improved banks and Turkeyfor the 2012 leaders
2Country and cluster
league tables
7222019 Bain amp Co- European Banking Report
httpslidepdfcomreaderfullbain-co-european-banking-report 2032
European banking | Bain amp Company Inc
Page 18
High-growth countries led the RoRWA rankings in 2012
Note For CIS the Netherlands Belgium Germany UK France Portugal and Spain one or two Tier-3 banks had not reported 2012 data by time of publicationso the analysis used 2011 data for those few banksSources Banksrsquo financial statements 2008ndash2012 n=121 Bain analysis
Rank 2012 RoRWA ()
Turkey
Poland
South Africa
CIS
Nordics
Austria
Netherlands
Belgium
Germany
UK
France
Switzerland
Italy
Portugal
Spain
Ireland
1
2
3
4
5
6
7
8
9
10
11
12
13
14
15
16
49
47
31
27
19
12
10
08
07
05
03
01
-06
-08
-17
-48
480
167
340
826
2357
334
2186
911
5514
7062
6320
1812
2127
426
2917
312
2012 total assets (euroB)Country 2008 RoRWA ()
33
41
35
10
13
19
-20
-25
-14
00
08
-76
07
10
19
10
7222019 Bain amp Co- European Banking Report
httpslidepdfcomreaderfullbain-co-european-banking-report 2132
European banking | Bain amp Company Inc
Page 19
In core European countries RoRWA changes from 2008 to 2012hellip
Note Averages are weighted for the total size of the respective components in each countrySources Banksrsquo financial statements 2008ndash2012 n=71 Bain analysis
RoRWA weighted average
-3
-2
-1
0
1
2
2008 average2012 average
UK
05
France
08
Germany
-14
07
Spain
19
-17
Nordics
13
19
Italy
07
-06
Netherlands
-20
10
2008 2012
0003
hellipwere spurred mainly by net interest income financial margin and loan-loss provisions
Note Averages are weighted for the total sizes of the respective indicators in each countrySources Banksrsquo financial statements 2008-2012 n=71 Bain analysis
NordicsGermany Spain
Total assets (euroB)
Total RWA (euroB)
Net interest incomeRWA ()
Financial marginRWA ()
Fees and commissions +other revenuesRWA ()
OpexRWA ()
Loan-loss provisionsRWA ()
France
7751
UK
2008 2012
AverageItaly Netherlands
7039
2474 2467
31 30
-02 12
26 15
41 42
14 10
5857 5715
1532 1327
26 38
-03 16
30 13
40 54
05 10
6054 5419
1534 1317
26 32
-19 07
14 17
27 43
08 06
1976 2917
1068 1315
36 43
06 06
17 10
27 35
13 41
1960 2357
790 735
27 32
-02 12
17 10
24 28
05 05
1990 2127
1266 1139
32 28
01 04
18 18
33 35
10 22
2263 2054
729 656
29 41
-17 06
15 10
39 38
09 09
2071 3947
928 1279
30 34
-05 10
17 14
32 41
08 15
7222019 Bain amp Co- European Banking Report
httpslidepdfcomreaderfullbain-co-european-banking-report 2232
European banking | Bain amp Company Inc
Page 20
These banks are the 2012 RoRWA leaders of their geographic cluster
Sources Banksrsquo financial statements 2008ndash2012 Bain analysis
Rank 2012 RoRWA ()
Nordics
UK
France
UK
Austria
Netherlands
Nordics
Nordics
Nordics
Turkey
Turkey
Turkey
1
2
3
1
2
3
1
2
3
1
2
3
19
18
16
23
17
16
40
39
36
158
132
48
Nordea
HSBC
BNP Paribas
Standard Chartered
Erste
ING
Swedbank
Sparebank 1 Group
Handelsbanken
Ziraat Bankasi
Akbank
Tuumlrkiye Halk
Bank Country 2008 RoRWA ()
16
08
06
24
19
02
20
NA
21
193
106
38
10biggest
Otherlarge
European
Local
High-growthcountries
These banks showed the biggest improvements in RoRWA over the past five years
Sources Banksrsquo financial statements 2008ndash2012 Bain analysis
Rank 2008ndash2012 change( points)
Switzerland
Switzerland
Germany
Belgium
UK
Netherlands
Netherlands
Belgium
Germany
CIS
Turkey
CIS
1
2
3
1
2
3
1
2
3
1
2
3
+83
+68
+21
+29
+26
+14
+64
+50
+33
+71
+26
+13
UBS
Credit Suisse
Deutsche Bank
KBC
RBS
ING
RBS Holdings NV
BNP Paribas Fortis
Bayerische Landesbank
Gazprombank
Akbank
VTB 24
Bank Country 2008 RoRWA ()
-92
-58
-19
-19
-37
02
-91
-45
-26
-56
106
05
10biggest
Otherlarge
European
Local
High-growthcountries
7222019 Bain amp Co- European Banking Report
httpslidepdfcomreaderfullbain-co-european-banking-report 2332
European banking | Bain amp Company Inc
Page 21
7222019 Bain amp Co- European Banking Report
httpslidepdfcomreaderfullbain-co-european-banking-report 2432
7222019 Bain amp Co- European Banking Report
httpslidepdfcomreaderfullbain-co-european-banking-report 2532
bull Europersquos environment continues to be volatile andinvestors are seeking better information about abankrsquos stability asset quality and key factors that
generate value RoRWA plays a useful role hereby focusing on the balance sheetmdashwhich enablescomparison between a bank and its peersmdashand byidentifying the factors influencing bank performance
bull Banks still need to address challenges along eachdimension of RoRWA in order to lift their profit-ability levels above the cost of capital In recent
years the profitability of lending assets has beensustained mainly by the fi nancial componentsincluding a boost from LTRO To raise asset prof-itability banks will have to better manage their
capital allocations and risk profilesbull The pressure on fee income will continue To offset
that trend banks should turn to their close clientrelationships for new sources of revenues
bull Lowering operating costs is the dimension thatwarrants managementrsquos attention at any bankregardless of size or location Initiatives that havethe greatest potential for tackling structural costsinclude adopting digital technologies and modern-izing IT platforms optimizing processes from endto end through outsourcing offshoring and other
means and expanding global procurement Suchinitiatives are essential for survival in an industrygoing through discontinuous change
bull Deleveraging the loan portfolio for riskier clients isa pressing issue which still poses significant threatsfor local banks In countries with a higher cost ofrisk and stagnant or negative GDP growth rateslocal banks may face further painful restructuring
bull Astute management of the cost of risk includingtaking a portfolio perspective offers opportunities
for most banksmdashin part to meet the new require-ments of Basel III and reassure rating agencies
bull Further consolidation of the local and other largebanks over the coming years will likely benefitthe 10 biggest banks and those in high-growthcountries These high-growth countries offer thegreatest opportunities for RoRWA growth for largeand pan-European players looking to diversifytheir portfolios
3Strategic
perspectives and
implications for
management
7222019 Bain amp Co- European Banking Report
httpslidepdfcomreaderfullbain-co-european-banking-report 2632
European banking | Bain amp Company Inc
Page 24
Significant restructuring is warranted for all banks but the nature of the challenge varies by geography
Source Bain analysis
10 biggest Strategic issueHigh-growth
countries
Other large
EuropeanLocal
Cross-selling
Balance-sheet
management
Cost structure
Cost of risk
Major threatThreatOpportunityMajor opportunity
Profitability of the asset portfolio has been sustained mainly by the
financial component Deleveraging of the loan portfolio for riskier
clients has been only partially successful and the risk profile of
the portfolio still has a long way to go
To counter pressure on fees banks should work systematically on
cross-selling opportunities through initiatives like client-focused
service models and CRM support
To further reduce costs banks should pursue new digital technologies
optimized processes through such means as outsourcing and offshoring
modernized IT platforms and global procurement initiatives
Active management of cost of risk demands more systematic solutions
bull NPL and LLP trends are threatening the stability of the overall
system and not only in individual countries such as Greece
bull Management of risky clients has become a core business and capability
bull Managing costs of risk demands an integrated portfolio approach
7222019 Bain amp Co- European Banking Report
httpslidepdfcomreaderfullbain-co-european-banking-report 2732
European banking | Bain amp Company Inc
Page 25
Assets (euroB)
Erste (AT)
Raiffeisen Bank (AT)
BNP Paribas Fortis
KBC
Belfius Banque
ING Belgium SANV
Creacutedit Agricole Groupe
BNP Paribas
Groupe Socieacuteteacute Geacuteneacuterale
Groupe BPCE
Creacutedit Mutuel
Deutsche Bank
Commerzbank AGKfW
DZ Bank AG
UniCredit Bank AG
2138
1202
2723
2569
2129
1691
17930
15439
12307
11475
6051
20123
63595116
4072
3483
Austria
Belgium
France
Germany
Country Bank Cluster
Other large
Local
Local
Other large
Local
Local
10 biggest
10 biggest
Other large
Local
Local
10 biggest
Other largeLocal
Local
Local
Ireland
Landesbank Baden-Wuumlrttemberg
Bayerische Landesbank
NORDLB
Helaba
HSH Nordbank
DekaBank
Landesbank Berlin Holding
Santander Consumer Bank
Hamburger Sparkasse
Deutsche Apotheker - und Aumlrztebank
Sparkasse KoumllnBonn
Kreissparkasse Koumlln
Bank of Ireland
Allied Irish Banks
permanent tsb Group Hldgs Plc
Intesa Sanpaolo
3363
2868
2256
1993
1306
1297
1183
403
396
379
299
248
1481
1225
409
6735
Local
Local
Local
Local
Local
Local
Local
Local
Local
Local
Local
Local
Other large
10 biggest
Local
Other large
Unicredit Group
Monte dei Paschi di Siena
4639
2189
10 biggest
Local
UBI Banca Group
Banco Popolare
BNL
Banca Popolare dellrsquoEmilia Romagna
Banca Popolare di Milano
Gruppo Banca Carige
Cariparma
Banca Popolare di Vicenza
Veneto Banca
1324
1319
912
616
525
493
493
467
402
Local
Local
Local
Local
Local
Local
Local
Local
Local
Italy
2011 assets
Bca Popdi Sondrio 322 Local
Credito Emiliano
Credito Valtellinese
Banca delle Marche
307
299
227
Local
Local
Local
List of banks analyzed by country and assets
10 biggest other large local
7222019 Bain amp Co- European Banking Report
httpslidepdfcomreaderfullbain-co-european-banking-report 2832
European banking | Bain amp Company Inc
Page 26
Assets (euroB)Country Bank Cluster
ING
Rabobank Group
ABN AMRO Group
SNS Reaal
RBS Holdings NV
8361
7524
3944
1322
710
Netherlands
Other large
Other large
Other large
Local
Local
Nordea 6774 10 biggest
Danske Bank
DNB
4682
3028
Other large
Local
SEB
Handelsbanken
Swedbank
Pohjola Bank
2818
2742
2121
998
Local
Local
Local
Local
Nordics
Jyske Bank 347 Local
Sparebank 1 Group 62 Local
Caixa Geral de Depositos 1169 Local
Millenium BCP
Banco Espiacuterito Santo
897
837
Local
Local
Banco BPI
Santander Totta SGPS
Caixa Econoacutemica Montepio Geral
Creacutedito Agriacutecola Muacutetuo
446
414
215
142
Local
Local
Local
Local
Portugal
BANIF 140 Local
SantanderBBVA
la Caixa
Banco Financiero y de Ahorros
Banco Sabadell SA
122826378
3591
3092
1615
Spain
10 biggestOther large
Local
Local
Local
Banco Popular
Banco Mare Nostrum
1576
634
Local
Local
UBS
Credit Suisse
10448
7669Switzerland
10 biggest
10 biggest
HSBC 20939 10 biggest
Barclays
Royal Bank of Scotland
17603
11521
10 biggest
Other large
Lloyds Banking Group
Standard Chartered
Nationwide Building Society
Co-operative Bank
11395
4950
2417
611
Other large
Other large
Local
Local
UK
Clydesdale Bank 545 Local
Yorkshire Building Society 413 Local
Virgin Money 223 Local
2011 assets
List of banks analyzed by country and assets
10 biggest other large localmdashcontinued
7222019 Bain amp Co- European Banking Report
httpslidepdfcomreaderfullbain-co-european-banking-report 2932
European banking | Bain amp Company Inc
Page 27
Assets (euroB)
Sberbank
VTB 24
PKO BP
Bank Pekao
BRE Bank
ING Bank Slaski
Standard Bank
Absa
FirstRand
Nedbank
Investec
Tuumlrkiye İş Bankası
Tuumlrkiye Garanti
Ziraat Bankasi
Akbank
Yapı ve Kredi
3781
1857
463
361
244
187
928
766
729
647
330
869
777
708
706
568
CIS
Poland
South Africa
Turkey
Country Bank
Tuumlrkiye Halk Bankasi
Tuumlrkiye Vakıflar
Finansbank
471
467
239
Gazprombank
Russian Agricultural Bank
Alfa-Bank
Nomos-Bank
UniCredit Bank Russia
712
358
357
225
218
AKB Rosbank
Promsvyazbank
ZAO Raiffeisenbank
URALSIB Bank
Russian Standard Bank
AKB Probusinessbank
200
173
160
113
74
35
2011 assets
Bank Zachodni WBK + Kredyt Bank
Getin NobleBank
Bank Millennium
143
141
126
List of banks analyzed by country and assets
High-growth countries
7222019 Bain amp Co- European Banking Report
httpslidepdfcomreaderfullbain-co-european-banking-report 3032
European banking | Bain amp Company Inc
Page 28
Key contacts in Bainrsquos European Financial Services practice
Franco Baronio in Milan (francobaroniobaincom)Rocco DrsquoAcunto in Milan (roccodacuntobaincom)
Ada Di Marzo in Paris (adadimarzobaincom)
Bertrand Facq in Warsaw (bertrandfacqbaincom)
Fabrice Franzen in Johannesburg (fabricefranzenbaincom)
Thomas Herbeck in Frankfurt (thomasherbeckbaincom)
Karaca Kestelli in Istanbul (karacakestellibaincom)
Nicolaacutes Lopez in Madrid (nicolaslopezbaincom)
Niels Peder Nielsen in Copenhagen (nielspedernielsenbaincom)
Andrea Oldrini in Milan (andreaoldrinibaincom)
Mathijs Robbens in Amsterdam (mathijsrobbensbaincom)
Visar Sala in Moscow (visarsalabaincom)
Walter Sinn in Frankfurt (waltersinnbaincom)Joatildeo Soares in London (joaosoaresbaincom)
Acknowledgments
The authors would like to thank the following Bain colleagues for their valuable support in producing this report
Sonal Chawla Christian Duus Franccedilois Fastrez Farsan Ghassim and Shikha Mahato
See these related Bain perspectives at wwwbaincom
bull Managing risk and capital
bull How Europersquos banks can return to health
bull The digital challenge to retail banks
7222019 Bain amp Co- European Banking Report
httpslidepdfcomreaderfullbain-co-european-banking-report 3132
7222019 Bain amp Co- European Banking Report
httpslidepdfcomreaderfullbain-co-european-banking-report 3232
For more information visit wwwbaincom
Share983140 983105m983138io983150 Tru Rs983157983148ts
Bain amp Company is the management consulting firm that the worldrsquos business leaders come to whenthey want results
Bain advises clients on strategy operations technology organization private equity and mergers and acquisitions We develop
practical customized insights that clients act on and transfer skills that make change stick Founded in 1973 Bain has
48 offices in 31 countries and our deep expertise and client roster cross every industry and economic sector Our clients
have outperformed the stock market 4 to 1
What sets us apart
We believe a consulting firm should be more than an adviser So we put ourselves in our clientsrsquo shoes selling outcomes not
projects We align our incentives with our clientsrsquo by linking our fees to their results and collaborate to unlock the full potential
of their business Our Results Deliveryreg process builds our clientsrsquo capabilities and our True North values mean we do theright thing for our clients people and communitiesmdashalways
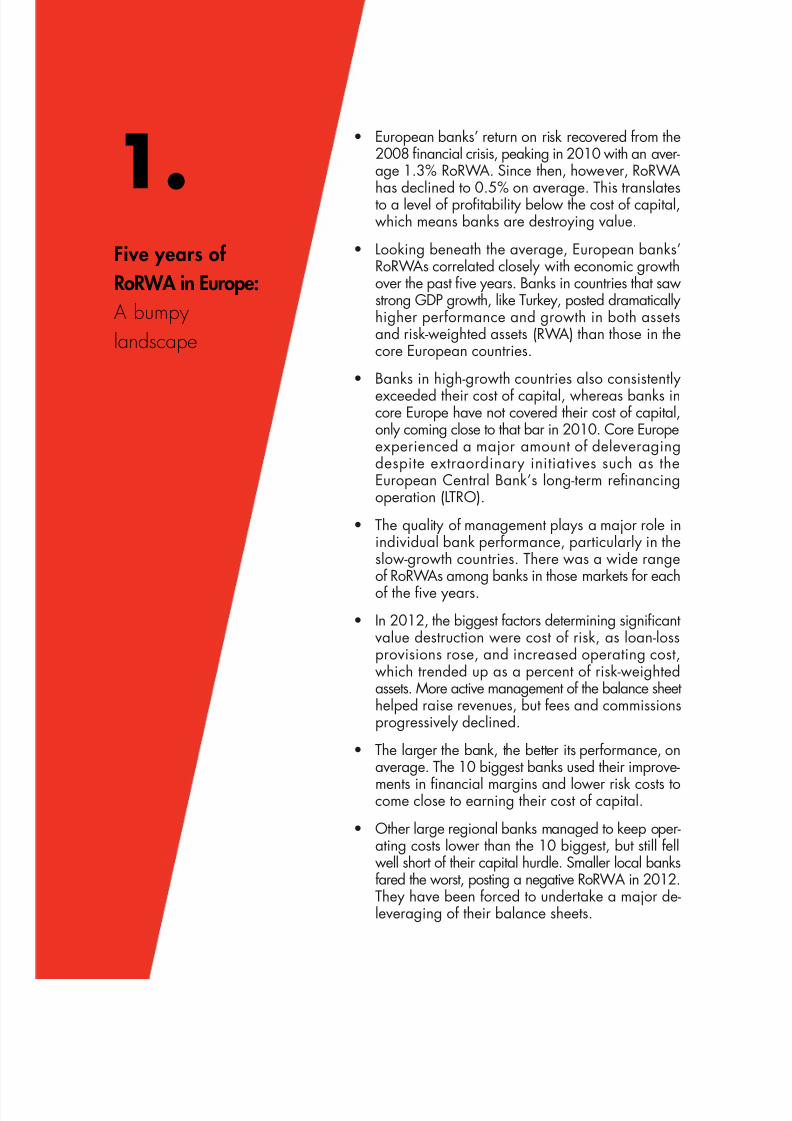
7222019 Bain amp Co- European Banking Report
httpslidepdfcomreaderfullbain-co-european-banking-report 932
bull European banksrsquo return on risk recovered from the2008 financial crisis peaking in 2010 with an aver-age 13 RoRWA Since then however RoRWA
has declined to 05 on average This translatesto a level of profitability below the cost of capitalwhich means banks are destroying value
bull Looking beneath the average European banksrsquoRoRWAs correlated closely with economic growthover the past five years Banks in countries that sawstrong GDP growth like Turkey posted dramaticallyhigher performance and growth in both assetsand risk-weighted assets (RWA) than those in thecore European countries
bull Banks in high-growth countries also consistently
exceeded their cost of capital whereas banks incore Europe have not covered their cost of capitalonly coming close to that bar in 2010 Core Europeexperienced a major amount of deleveragingdespite extraordinary initiatives such as theEuropean Central Bankrsquos long-term refinancingoperation (LTRO)
bull The quality of management plays a major role inindividual bank performance particularly in theslow-growth countries There was a wide rangeof RoRWAs among banks in those markets for each
of the five yearsbull In 2012 the biggest factors determining significant
value destruction were cost of risk as loan-lossprovisions rose and increased operating costwhich trended up as a percent of risk-weightedassets More active management of the balance sheethelped raise revenues but fees and commissionsprogressively declined
bull The larger the bank the better its performance onaverage The 10 biggest banks used their improve-
ments in financial margins and lower risk costs tocome close to earning their cost of capital
bull Other large regional banks managed to keep oper-ating costs lower than the 10 biggest but still fellwell short of their capital hurdle Smaller local banksfared the worst posting a negative RoRWA in 2012They have been forced to undertake a major de-leveraging of their balance sheets
1Five years of
RoRWA in Europe
A bumpy
landscape
7222019 Bain amp Co- European Banking Report
httpslidepdfcomreaderfullbain-co-european-banking-report 1032
European banking | Bain amp Company Inc
Page 8
Although RoRWA correlates with economic growth there is still substantial variation among banks
Note Each observation is composed of a bankrsquos RoRWA in a given year and the respective countryrsquos year-over-year GDP growth rate in that yearSources Banksrsquo financial statements 2008ndash2012 n=605 Bureau van Dijk Bain analysis
RoRWA per bank and year 2008ndash2012
-5
-3
0
3
5
-10 0 10 20 30
95 ofobservationsfall withinthis band
Recessionno growthManagement has a major role
in determining RoRWA
Mediumhigh growthManagement has amore limited role in
achieving high RoRWA
Very high growthManagementrsquos most important role
is to optimize strategic asset allocationfor revenue generation
GDP growth by country and year 2008ndash2012
Bank profitability has eroded since the post-crisis peak of 2010
Return on equity (ROE) = Pretax profitaverage shareholdersrsquo equitySources Banksrsquo financial statements 2008ndash2012 n=121 Bureau van Dijk Bain analysis
European-wide RoRWA
0
1
2
200800
2009
07
2010 2011
09
2012
05
RWA (euroB)
33576
08
11690
44
30229
64
11555
-32
31770
104
11726
52
33528
75
11986
53
33028
49
11207
29
Total assets (euroB)
Annual GDP growth ()
ROE ()
13
7222019 Bain amp Co- European Banking Report
httpslidepdfcomreaderfullbain-co-european-banking-report 1132
European banking | Bain amp Company Inc
Page 9
Banks in core Europe have not covered their cost of capital over the past five years
The range represents the level of RoRWA required to cover the banksrsquo cost of capital and varies by bank size and country analysis of 88 banks based in AustriaBelgium France Germany Ireland Italy the Netherlands the Nordics Portugal Spain Switzerland and the UKSources Banksrsquo financial statements 2008ndash2012 Bain analysis
RoRWA weighted average
RWA (euroB)
32373
-15
10899
29129
51
10846
30366
88
10785
31957
53
10869
31219
22
10047
Total assets (euroB)
ROE ()
2008
-01
2009
06
2010 2011
06
2012
01
Range ofRoRWArequiredto coverthe costof capital
11
-1
0
1
2
3
4
1816
while banks in high-growth countries consistently exceeded their cost of capital
The range represents the level of RoRWA required to cover the banksrsquo cost of capital and varies by bank size and country analysis of 33 banks based in theCommonwealth of Independent States (CIS) Poland South Africa and TurkeySources Banksrsquo financial statements 2008ndash2012 Bain analysis
RoRWA weighted average
RWA (euroB)
1203
226
791
1100
206
708
Total assets (euroB)
ROE ()
Range ofRoRWArequiredto coverthe costof capital
0
1
2
3
4
2008
24
2009
22
1404
250
941
2010
32
1571
267
1117
2011
31
1810
247
1160
2012
33
2119
7222019 Bain amp Co- European Banking Report
httpslidepdfcomreaderfullbain-co-european-banking-report 1232
European banking | Bain amp Company Inc
Page 10
Higher operating expenditure and cost of risk caused banksrsquo value destruction in 2012
Long-term refinancing operations (LTRO) 2011 ~euro500 billion LTRO 2012 ~euro750 billion (including repayment) corresponding to 2011 total assets of ~euro330 trillionand 2012 total assets of ~euro322 trillionSources Banksrsquo financial statements 2008ndash2012 n=121 Bain analysis
20122010 2011
RoRWA ()
Total assets (euroB)
Tier 1 capital (euroB)
RWAtotal assets ()
Net interest incomeRWA ()
Financial marginRWA ()
Fees and commissions +
other revenuesRWA ()
Operating expenditureRWA ()
Loan-loss provisionsRWA ()
05
33028
1510
34
36
09
17
43
15
13
31770
1363
37
35
10
17
37
12
09
33528
1426
36
35
05
20
40
12
2009
07
30229
1261
38
34
09
17
35
18
00
33576
1079
35
31
-07
22
36
11
2008Main components in
European-wide RoRWA Major trends
Partial deleveraging of assets
Strengthening of capital
Fairly constant risk profile despite
deleveraging of assets
Overall margin from balance-sheet
management increasing
Continuous pressure on fees
and commissions
Inability to reduce costs in
proportion to deleveraging
Rising cost of credit
7222019 Bain amp Co- European Banking Report
httpslidepdfcomreaderfullbain-co-european-banking-report 1332
European banking | Bain amp Company Inc
Page 11
In core Europe banks increased capital ratios and revenues but did not optimize costs
Notes Components in bold are direct components of the RoRWA calculation changes in red are negative trendsSources Banksrsquo financial statements 2008ndash2012 n=88 Bain analysis
2012 Change2008minus20122010 2011
Total RWA (euroB)
Total assets (euroB)
RWAtotal assets ()
Tier 1 ratio ()
Total Tier 1 (euroB)
Net interest incomeRWA ()
Financial marginRWA ()
Net interest incometotal assets ()
Financial margintotal assets ()
Net interest income + financial marginRWA ()
Fees + other revenuesRWA ()
OpexRWA ()
Costincome ()
Loan-loss provisionsRWA ()
Nonperforming loan ratio ()
Coverage ratio ()
10047
31219
32
133
1336
34
09
11
03
43
16
43
70
15
55
49
-78
-36
-2 pts
+43 pts
+36
+05 pts
+16 pts
+01 pts
+05 pts
+21 pts
-06 pts
+07 pts
-10 pts
+05 pts
+30 pts
-12 pts
10785
30366
36
114
1230
33
10
12
04
43
16
37
62
12
46
50
10869
31957
34
118
1280
33
05
11
02
39
19
40
68
12
47
51
2009
10846
29129
37
107
1159
32
09
12
03
41
17
35
61
17
40
54
10899
32373
34
90
981
29
-07
10
-02
22
22
35
80Opextotal assets () 14 +02 pts13 141312
10
25
61
Cross-selling
Asset leverage
Balance-sheet management
Cost structure
Cost of risk
2008Components
In high-growth countries higher financial margins offset lower fees and relatively high nonperforming loans
affected cost of risk
Notes Components in bold are direct components of the RoRWA calculation changes in red are negative trendsSources Banksrsquo financial statements 2008ndash2012 n=33 Bain analysis
2012 Change2008minus2012
2010 2011
Total RWA (euroB)
Total assets (euroB)
RWAtotal assets ()
Tier 1 ratio ()
Total Tier 1 (euroB)
Net interest incomeRWA ()
Financial marginRWA ()
Net interest incometotal assets ()
Financial margintotal assets ()
Net interest income + financial marginRWA ()
Fees + other revenuesRWA ()OpexRWA ()
Costincome ()
Opextotal assets ()
Loan-loss provisionsRWA ()
Nonperforming loan ratio ()
Coverage ratio ()
1160
1810
64
150
174
57
05
36
04
62
2543
45
27
11
49
64
+47
+50
-2 pts
+27 pts
+78
-01 pts
+05 pts
-02 pts
+04 pts
+05 pts
-02 pts+01 pts
-2 pts
-01 pts
-07 pts
+12 pts
+5 pts
941
1404
67
141
133
55
05
37
04
60
2741
43
28
15
69
63
1117
1571
71
131
147
50
03
35
02
53
2438
45
27
08
55
64
2009
708
1100
64
144
102
67
08
43
05
75
2743
39
28
36
82
57
791
1203
66
123
97
58
00
38
00
58
2742
47
28
18
37
59
Cross-selling
Asset leverage
Balance-sheet management
Cost structure
Cost of risk
2008Components
7222019 Bain amp Co- European Banking Report
httpslidepdfcomreaderfullbain-co-european-banking-report 1432
European banking | Bain amp Company Inc
Page 12
Europersquos 10 biggest banks come closest to earning their cost of capital
The range represents the level of RoRWA required to cover the banksrsquo cost of capital and varies by bank size and country Analysis of the 10 largest Europe-headquarteredbanks by market capitalization with a pan-European presence a universal bank business model and assets of at least euro650 billion (Barclays BNP ParibasCreacutedit Agricole Credit Suisse Deutsche Bank HSBC Nordea Santander UBS and UniCredit)Sources Banksrsquo financial statements 2008ndash2012 Bain analysis
RoRWA weighted average
RWA (euroB)
1340922
3514
1133694
3474
Total assets (euroB)
ROE ()
Range ofRoRWArequiredto coverthe costof capital
12395123
3698
13239107
3765
1338559
3639
2008
02
2009 2010
17
2011
14
2012
09
12
0
1
2
18
16
Among the 10 biggest banks lower risk costs and improved margins offset high Opex
Notes Components in bold are direct components of the RoRWA calculation changes in red are negative trendsSources Banksrsquo financial statements 2008ndash2012 n=10 Bain analysis
2012 Change2008minus2012
2010 2011
Total RWA (euroB)
Total assets (euroB)
RWAtotal assets ()
Tier 1 ratio ()
Total Tier 1 (euroB)
Net interest incomeRWA ()
Financial marginRWA ()
Net interest incometotal assets ()
Financial margintotal assets ()
Net interest income + financial marginRWA ()
Fees + other revenuesRWA ()OpexRWA ()
Costincome ()
Opextotal assets ()
Loan-loss provisionsRWA ()
Nonperforming loan ratio ()
Coverage ratio ()
3639
13385
27
131
477
38
10
10
03
49
2452
71
14
12
45
54
+36
-02
+1 pts
+46 pts
+60
+05 pts
+18 pts
+02 pts
+05 pts
+23 pts
-06 pts+09 pts
-6 pts
+03 pts
+01 pts
+21 pts
-24 pts
3698
12395
30
115
426
37
14
11
04
51
2346
62
14
11
46
52
3765
13239
28
116
437
38
09
11
03
47
2648
65
14
11
44
53
2009
3474
11336
31
110
380
37
14
11
04
51
2244
60
13
17
35
71
3514
13409
26
85
299
33
-07
09
-02
26
3043
77
11
11
24
78
Cross-selling
Asset leverage
Balance-sheet management
Cost structure
Cost of risk
2008Components
7222019 Bain amp Co- European Banking Report
httpslidepdfcomreaderfullbain-co-european-banking-report 1532
European banking | Bain amp Company Inc
Page 13
Other large European banks have fallen well short of earning their cost of capital
The range represents the level of RoRWA required to cover the banksrsquo cost of capital and varies by bank size and country Analysis of 13 banks with assets of at leasteuro200 billion a universal bank business model and small to medium-sized subsidiaries outside their core geography (ABN AMRO Group BBVA Commerzbank Danske BankErste ING Intesa Sanpaolo KBC Lloyds Rabobank RBS Socieacuteteacute Geacuteneacuterale and Standard Chartered)Sources Banksrsquo financial statements 2008ndash2012 Bain analysis
RoRWA weighted average
RWA (euroB)
Total assets (euroB)
ROE ()
Range ofRoRWArequiredto coverthe costof capital
861607
3188
2008
01
822237
3468
2009
04
850978
3339
2010
867422
3214
2011
03
888640
3115
2012
06
10
0
1
2
18
16
Other large European banks had Opex lower than the big 10 which offset pressure on fee income and
higher cost of risk
Notes Components in bold are direct components of the RoRWA calculation changes in red are negative trendsSources Banksrsquo financial statements 2008ndash2012 n=13 Bain analysis
2012 Change2008minus2012
2010 2011
Total RWA (euroB)
Total assets (euroB)
RWAtotal assets ()
Tier 1 ratio ()
Total Tier 1 (euroB)
Net interest incomeRWA ()
Financial marginRWA ()
Net interest incometotal assets ()
Financial margintotal assets ()
Net interest income + financial marginRWA ()
Fees + other revenuesRWA ()OpexRWA ()
Costincome ()
Opextotal assets ()
Loan-loss provisionsRWA ()
Nonperforming loan ratio ()
Coverage ratio ()
3115
8886
35
129
402
35
12
12
04
47
1239
66
14
14
56
50
-23
+31
-19 pts
+39 pts
+40
+04 pts
+17 pts
+01 pts
+06 pts
+21 pts
-09 pts+02 pts
-12 pts
No change
+04 pts
+22 pts
+3 pts
3339
8509
39
114
382
34
11
13
04
45
1233
57
13
14
54
48
3214
8674
37
119
382
35
03
13
01
38
1739
70
14
14
57
48
2009
3468
8222
42
102
353
31
10
13
04
41
1532
58
14
19
50
46
3188
8616
37
90
287
31
-05
12
-02
26
2137
78
14
10
34
47
Cross-selling
Asset leverage
Balance-sheet management
Cost structure
Cost of risk
2008Components
7222019 Bain amp Co- European Banking Report
httpslidepdfcomreaderfullbain-co-european-banking-report 1632
European banking | Bain amp Company Inc
Page 14
Local banks have seen their RoRWA sharply deteriorate in recent years
The range represents the level of RoRWA required to cover the banksrsquo cost of capital and varies by bank size and country analysis of 65 banks operating exclusivelywithin a single national or regional marketSources Banksrsquo financial statements 2008ndash2012 Bain analysis
RoRWA weighted average
RWA (euroB)
Total assets (euroB)
ROE ()
Range ofRoRWArequiredto coverthe costof capital
10347
-68
4198
9571
20
3904
9462
59
3748
10044
20
3890
8948
-42
3293
2008
-06
2009
02
2010
07
2011
02
2012
-11
-2
-1
0
1
21816
Local banks have experienced sharp deleveraging higher cost of risk more nonperforming loans and flat revenues
Notes Components in bold are direct components of the RoRWA calculation changes in red are negative trendsSources Banksrsquo financial statements 2008ndash2012 n=65 Bain analysis
2012 Change2008minus2012
2010 2011
Total RWA (euroB)
Total assets (euroB)
RWAtotal assets ()
Tier 1 ratio ()
Total Tier 1 (euroB)
Net interest incomeRWA ()
Financial marginRWA ()
Net interest incometotal assets ()
Financial margintotal assets ()
Net interest income + financial marginRWA ()
Fees + other revenuesRWA ()OpexRWA ()
Costincome ()
Opextotal assets ()
Loan-loss provisionsRWA ()
Nonperforming loan ratio ()
Coverage ratio ()
3293
8948
37
139
457
28
06
10
02
34
1135
71
13
20
64
46
-215
-135
-38 pts
+44 pts
+15
+03 pts
+14 pts
No change
+06 pts
+17 pts
-05 pts+08 pts
-17 pts
+02 pts
+1 pts
+44 pts
-18 pts
3748
9462
40
113
422
28
05
11
02
33
1430
65
12
09
40
52
3890
10044
39
118
461
28
03
11
01
31
1532
69
13
12
43
51
2009
3904
9571
41
109
426
28
04
11
02
32
1430
65
12
14
36
51
4198
10347
41
94
396
25
-09
10
-04
16
1628
87
11
10
20
64
Cross-selling
Asset leverage
Balance-sheet management
Cost control
Cost of risk
2008Components
7222019 Bain amp Co- European Banking Report
httpslidepdfcomreaderfullbain-co-european-banking-report 1732
European banking | Bain amp Company Inc
Page 15
7222019 Bain amp Co- European Banking Report
httpslidepdfcomreaderfullbain-co-european-banking-report 1832
7222019 Bain amp Co- European Banking Report
httpslidepdfcomreaderfullbain-co-european-banking-report 1932
bull Countries with strong economic growth led the2012 RoRWA rankings Turkey took pole positionwith a 49 RoRWA In core Europe the Nordic
countries posed the strongest performance witha 19 RoRWA followed by Austria and theNetherlands The largest economies of Germanythe UK and France trailed behind
bull Banks in Italy Portugal Spain and Ireland whichhave been mired in the sovereign debt crisis anddeep economic recessions turned in the weakestRoRWA performances
bull Among the core European countries changes inRoRWAs from 2008 to 2012 stemmed mainly
from changes in three components net interestincome financial margin and loan-loss provisions
bull Countries that posted large positive changesmdashincluding Germany the Netherlands the Nordiccountries and the UKmdashbenefited from higherfinancial margins more control of operatingexpenditure and lower cost of risk Countries withlarge drops in RoRWAs were hurt by infl exiblecost structures which prevented them from shrinkingtheir production costs and a cost of risk that was
almost double the averagebull Northern Europe dominated the league tables
whether one looks at the 2012 leaders or themost improved banks For example the RoRWAleaders among both local and the 10 biggestbanks included banks in the Nordic countriesfollowed by those in the UK France Austria andthe Netherlands
bull In the most improved group banks in Switzer-land the Netherlands and Germany made a
strong showing
bull In high-growth countries Turkey and the Common-wealth of Independent States (CIS) took leadingpositions for the most improved banks and Turkeyfor the 2012 leaders
2Country and cluster
league tables
7222019 Bain amp Co- European Banking Report
httpslidepdfcomreaderfullbain-co-european-banking-report 2032
European banking | Bain amp Company Inc
Page 18
High-growth countries led the RoRWA rankings in 2012
Note For CIS the Netherlands Belgium Germany UK France Portugal and Spain one or two Tier-3 banks had not reported 2012 data by time of publicationso the analysis used 2011 data for those few banksSources Banksrsquo financial statements 2008ndash2012 n=121 Bain analysis
Rank 2012 RoRWA ()
Turkey
Poland
South Africa
CIS
Nordics
Austria
Netherlands
Belgium
Germany
UK
France
Switzerland
Italy
Portugal
Spain
Ireland
1
2
3
4
5
6
7
8
9
10
11
12
13
14
15
16
49
47
31
27
19
12
10
08
07
05
03
01
-06
-08
-17
-48
480
167
340
826
2357
334
2186
911
5514
7062
6320
1812
2127
426
2917
312
2012 total assets (euroB)Country 2008 RoRWA ()
33
41
35
10
13
19
-20
-25
-14
00
08
-76
07
10
19
10
7222019 Bain amp Co- European Banking Report
httpslidepdfcomreaderfullbain-co-european-banking-report 2132
European banking | Bain amp Company Inc
Page 19
In core European countries RoRWA changes from 2008 to 2012hellip
Note Averages are weighted for the total size of the respective components in each countrySources Banksrsquo financial statements 2008ndash2012 n=71 Bain analysis
RoRWA weighted average
-3
-2
-1
0
1
2
2008 average2012 average
UK
05
France
08
Germany
-14
07
Spain
19
-17
Nordics
13
19
Italy
07
-06
Netherlands
-20
10
2008 2012
0003
hellipwere spurred mainly by net interest income financial margin and loan-loss provisions
Note Averages are weighted for the total sizes of the respective indicators in each countrySources Banksrsquo financial statements 2008-2012 n=71 Bain analysis
NordicsGermany Spain
Total assets (euroB)
Total RWA (euroB)
Net interest incomeRWA ()
Financial marginRWA ()
Fees and commissions +other revenuesRWA ()
OpexRWA ()
Loan-loss provisionsRWA ()
France
7751
UK
2008 2012
AverageItaly Netherlands
7039
2474 2467
31 30
-02 12
26 15
41 42
14 10
5857 5715
1532 1327
26 38
-03 16
30 13
40 54
05 10
6054 5419
1534 1317
26 32
-19 07
14 17
27 43
08 06
1976 2917
1068 1315
36 43
06 06
17 10
27 35
13 41
1960 2357
790 735
27 32
-02 12
17 10
24 28
05 05
1990 2127
1266 1139
32 28
01 04
18 18
33 35
10 22
2263 2054
729 656
29 41
-17 06
15 10
39 38
09 09
2071 3947
928 1279
30 34
-05 10
17 14
32 41
08 15
7222019 Bain amp Co- European Banking Report
httpslidepdfcomreaderfullbain-co-european-banking-report 2232
European banking | Bain amp Company Inc
Page 20
These banks are the 2012 RoRWA leaders of their geographic cluster
Sources Banksrsquo financial statements 2008ndash2012 Bain analysis
Rank 2012 RoRWA ()
Nordics
UK
France
UK
Austria
Netherlands
Nordics
Nordics
Nordics
Turkey
Turkey
Turkey
1
2
3
1
2
3
1
2
3
1
2
3
19
18
16
23
17
16
40
39
36
158
132
48
Nordea
HSBC
BNP Paribas
Standard Chartered
Erste
ING
Swedbank
Sparebank 1 Group
Handelsbanken
Ziraat Bankasi
Akbank
Tuumlrkiye Halk
Bank Country 2008 RoRWA ()
16
08
06
24
19
02
20
NA
21
193
106
38
10biggest
Otherlarge
European
Local
High-growthcountries
These banks showed the biggest improvements in RoRWA over the past five years
Sources Banksrsquo financial statements 2008ndash2012 Bain analysis
Rank 2008ndash2012 change( points)
Switzerland
Switzerland
Germany
Belgium
UK
Netherlands
Netherlands
Belgium
Germany
CIS
Turkey
CIS
1
2
3
1
2
3
1
2
3
1
2
3
+83
+68
+21
+29
+26
+14
+64
+50
+33
+71
+26
+13
UBS
Credit Suisse
Deutsche Bank
KBC
RBS
ING
RBS Holdings NV
BNP Paribas Fortis
Bayerische Landesbank
Gazprombank
Akbank
VTB 24
Bank Country 2008 RoRWA ()
-92
-58
-19
-19
-37
02
-91
-45
-26
-56
106
05
10biggest
Otherlarge
European
Local
High-growthcountries
7222019 Bain amp Co- European Banking Report
httpslidepdfcomreaderfullbain-co-european-banking-report 2332
European banking | Bain amp Company Inc
Page 21
7222019 Bain amp Co- European Banking Report
httpslidepdfcomreaderfullbain-co-european-banking-report 2432
7222019 Bain amp Co- European Banking Report
httpslidepdfcomreaderfullbain-co-european-banking-report 2532
bull Europersquos environment continues to be volatile andinvestors are seeking better information about abankrsquos stability asset quality and key factors that
generate value RoRWA plays a useful role hereby focusing on the balance sheetmdashwhich enablescomparison between a bank and its peersmdashand byidentifying the factors influencing bank performance
bull Banks still need to address challenges along eachdimension of RoRWA in order to lift their profit-ability levels above the cost of capital In recent
years the profitability of lending assets has beensustained mainly by the fi nancial componentsincluding a boost from LTRO To raise asset prof-itability banks will have to better manage their
capital allocations and risk profilesbull The pressure on fee income will continue To offset
that trend banks should turn to their close clientrelationships for new sources of revenues
bull Lowering operating costs is the dimension thatwarrants managementrsquos attention at any bankregardless of size or location Initiatives that havethe greatest potential for tackling structural costsinclude adopting digital technologies and modern-izing IT platforms optimizing processes from endto end through outsourcing offshoring and other
means and expanding global procurement Suchinitiatives are essential for survival in an industrygoing through discontinuous change
bull Deleveraging the loan portfolio for riskier clients isa pressing issue which still poses significant threatsfor local banks In countries with a higher cost ofrisk and stagnant or negative GDP growth rateslocal banks may face further painful restructuring
bull Astute management of the cost of risk includingtaking a portfolio perspective offers opportunities
for most banksmdashin part to meet the new require-ments of Basel III and reassure rating agencies
bull Further consolidation of the local and other largebanks over the coming years will likely benefitthe 10 biggest banks and those in high-growthcountries These high-growth countries offer thegreatest opportunities for RoRWA growth for largeand pan-European players looking to diversifytheir portfolios
3Strategic
perspectives and
implications for
management
7222019 Bain amp Co- European Banking Report
httpslidepdfcomreaderfullbain-co-european-banking-report 2632
European banking | Bain amp Company Inc
Page 24
Significant restructuring is warranted for all banks but the nature of the challenge varies by geography
Source Bain analysis
10 biggest Strategic issueHigh-growth
countries
Other large
EuropeanLocal
Cross-selling
Balance-sheet
management
Cost structure
Cost of risk
Major threatThreatOpportunityMajor opportunity
Profitability of the asset portfolio has been sustained mainly by the
financial component Deleveraging of the loan portfolio for riskier
clients has been only partially successful and the risk profile of
the portfolio still has a long way to go
To counter pressure on fees banks should work systematically on
cross-selling opportunities through initiatives like client-focused
service models and CRM support
To further reduce costs banks should pursue new digital technologies
optimized processes through such means as outsourcing and offshoring
modernized IT platforms and global procurement initiatives
Active management of cost of risk demands more systematic solutions
bull NPL and LLP trends are threatening the stability of the overall
system and not only in individual countries such as Greece
bull Management of risky clients has become a core business and capability
bull Managing costs of risk demands an integrated portfolio approach
7222019 Bain amp Co- European Banking Report
httpslidepdfcomreaderfullbain-co-european-banking-report 2732
European banking | Bain amp Company Inc
Page 25
Assets (euroB)
Erste (AT)
Raiffeisen Bank (AT)
BNP Paribas Fortis
KBC
Belfius Banque
ING Belgium SANV
Creacutedit Agricole Groupe
BNP Paribas
Groupe Socieacuteteacute Geacuteneacuterale
Groupe BPCE
Creacutedit Mutuel
Deutsche Bank
Commerzbank AGKfW
DZ Bank AG
UniCredit Bank AG
2138
1202
2723
2569
2129
1691
17930
15439
12307
11475
6051
20123
63595116
4072
3483
Austria
Belgium
France
Germany
Country Bank Cluster
Other large
Local
Local
Other large
Local
Local
10 biggest
10 biggest
Other large
Local
Local
10 biggest
Other largeLocal
Local
Local
Ireland
Landesbank Baden-Wuumlrttemberg
Bayerische Landesbank
NORDLB
Helaba
HSH Nordbank
DekaBank
Landesbank Berlin Holding
Santander Consumer Bank
Hamburger Sparkasse
Deutsche Apotheker - und Aumlrztebank
Sparkasse KoumllnBonn
Kreissparkasse Koumlln
Bank of Ireland
Allied Irish Banks
permanent tsb Group Hldgs Plc
Intesa Sanpaolo
3363
2868
2256
1993
1306
1297
1183
403
396
379
299
248
1481
1225
409
6735
Local
Local
Local
Local
Local
Local
Local
Local
Local
Local
Local
Local
Other large
10 biggest
Local
Other large
Unicredit Group
Monte dei Paschi di Siena
4639
2189
10 biggest
Local
UBI Banca Group
Banco Popolare
BNL
Banca Popolare dellrsquoEmilia Romagna
Banca Popolare di Milano
Gruppo Banca Carige
Cariparma
Banca Popolare di Vicenza
Veneto Banca
1324
1319
912
616
525
493
493
467
402
Local
Local
Local
Local
Local
Local
Local
Local
Local
Italy
2011 assets
Bca Popdi Sondrio 322 Local
Credito Emiliano
Credito Valtellinese
Banca delle Marche
307
299
227
Local
Local
Local
List of banks analyzed by country and assets
10 biggest other large local
7222019 Bain amp Co- European Banking Report
httpslidepdfcomreaderfullbain-co-european-banking-report 2832
European banking | Bain amp Company Inc
Page 26
Assets (euroB)Country Bank Cluster
ING
Rabobank Group
ABN AMRO Group
SNS Reaal
RBS Holdings NV
8361
7524
3944
1322
710
Netherlands
Other large
Other large
Other large
Local
Local
Nordea 6774 10 biggest
Danske Bank
DNB
4682
3028
Other large
Local
SEB
Handelsbanken
Swedbank
Pohjola Bank
2818
2742
2121
998
Local
Local
Local
Local
Nordics
Jyske Bank 347 Local
Sparebank 1 Group 62 Local
Caixa Geral de Depositos 1169 Local
Millenium BCP
Banco Espiacuterito Santo
897
837
Local
Local
Banco BPI
Santander Totta SGPS
Caixa Econoacutemica Montepio Geral
Creacutedito Agriacutecola Muacutetuo
446
414
215
142
Local
Local
Local
Local
Portugal
BANIF 140 Local
SantanderBBVA
la Caixa
Banco Financiero y de Ahorros
Banco Sabadell SA
122826378
3591
3092
1615
Spain
10 biggestOther large
Local
Local
Local
Banco Popular
Banco Mare Nostrum
1576
634
Local
Local
UBS
Credit Suisse
10448
7669Switzerland
10 biggest
10 biggest
HSBC 20939 10 biggest
Barclays
Royal Bank of Scotland
17603
11521
10 biggest
Other large
Lloyds Banking Group
Standard Chartered
Nationwide Building Society
Co-operative Bank
11395
4950
2417
611
Other large
Other large
Local
Local
UK
Clydesdale Bank 545 Local
Yorkshire Building Society 413 Local
Virgin Money 223 Local
2011 assets
List of banks analyzed by country and assets
10 biggest other large localmdashcontinued
7222019 Bain amp Co- European Banking Report
httpslidepdfcomreaderfullbain-co-european-banking-report 2932
European banking | Bain amp Company Inc
Page 27
Assets (euroB)
Sberbank
VTB 24
PKO BP
Bank Pekao
BRE Bank
ING Bank Slaski
Standard Bank
Absa
FirstRand
Nedbank
Investec
Tuumlrkiye İş Bankası
Tuumlrkiye Garanti
Ziraat Bankasi
Akbank
Yapı ve Kredi
3781
1857
463
361
244
187
928
766
729
647
330
869
777
708
706
568
CIS
Poland
South Africa
Turkey
Country Bank
Tuumlrkiye Halk Bankasi
Tuumlrkiye Vakıflar
Finansbank
471
467
239
Gazprombank
Russian Agricultural Bank
Alfa-Bank
Nomos-Bank
UniCredit Bank Russia
712
358
357
225
218
AKB Rosbank
Promsvyazbank
ZAO Raiffeisenbank
URALSIB Bank
Russian Standard Bank
AKB Probusinessbank
200
173
160
113
74
35
2011 assets
Bank Zachodni WBK + Kredyt Bank
Getin NobleBank
Bank Millennium
143
141
126
List of banks analyzed by country and assets
High-growth countries
7222019 Bain amp Co- European Banking Report
httpslidepdfcomreaderfullbain-co-european-banking-report 3032
European banking | Bain amp Company Inc
Page 28
Key contacts in Bainrsquos European Financial Services practice
Franco Baronio in Milan (francobaroniobaincom)Rocco DrsquoAcunto in Milan (roccodacuntobaincom)
Ada Di Marzo in Paris (adadimarzobaincom)
Bertrand Facq in Warsaw (bertrandfacqbaincom)
Fabrice Franzen in Johannesburg (fabricefranzenbaincom)
Thomas Herbeck in Frankfurt (thomasherbeckbaincom)
Karaca Kestelli in Istanbul (karacakestellibaincom)
Nicolaacutes Lopez in Madrid (nicolaslopezbaincom)
Niels Peder Nielsen in Copenhagen (nielspedernielsenbaincom)
Andrea Oldrini in Milan (andreaoldrinibaincom)
Mathijs Robbens in Amsterdam (mathijsrobbensbaincom)
Visar Sala in Moscow (visarsalabaincom)
Walter Sinn in Frankfurt (waltersinnbaincom)Joatildeo Soares in London (joaosoaresbaincom)
Acknowledgments
The authors would like to thank the following Bain colleagues for their valuable support in producing this report
Sonal Chawla Christian Duus Franccedilois Fastrez Farsan Ghassim and Shikha Mahato
See these related Bain perspectives at wwwbaincom
bull Managing risk and capital
bull How Europersquos banks can return to health
bull The digital challenge to retail banks
7222019 Bain amp Co- European Banking Report
httpslidepdfcomreaderfullbain-co-european-banking-report 3132
7222019 Bain amp Co- European Banking Report
httpslidepdfcomreaderfullbain-co-european-banking-report 3232
For more information visit wwwbaincom
Share983140 983105m983138io983150 Tru Rs983157983148ts
Bain amp Company is the management consulting firm that the worldrsquos business leaders come to whenthey want results
Bain advises clients on strategy operations technology organization private equity and mergers and acquisitions We develop
practical customized insights that clients act on and transfer skills that make change stick Founded in 1973 Bain has
48 offices in 31 countries and our deep expertise and client roster cross every industry and economic sector Our clients
have outperformed the stock market 4 to 1
What sets us apart
We believe a consulting firm should be more than an adviser So we put ourselves in our clientsrsquo shoes selling outcomes not
projects We align our incentives with our clientsrsquo by linking our fees to their results and collaborate to unlock the full potential
of their business Our Results Deliveryreg process builds our clientsrsquo capabilities and our True North values mean we do theright thing for our clients people and communitiesmdashalways
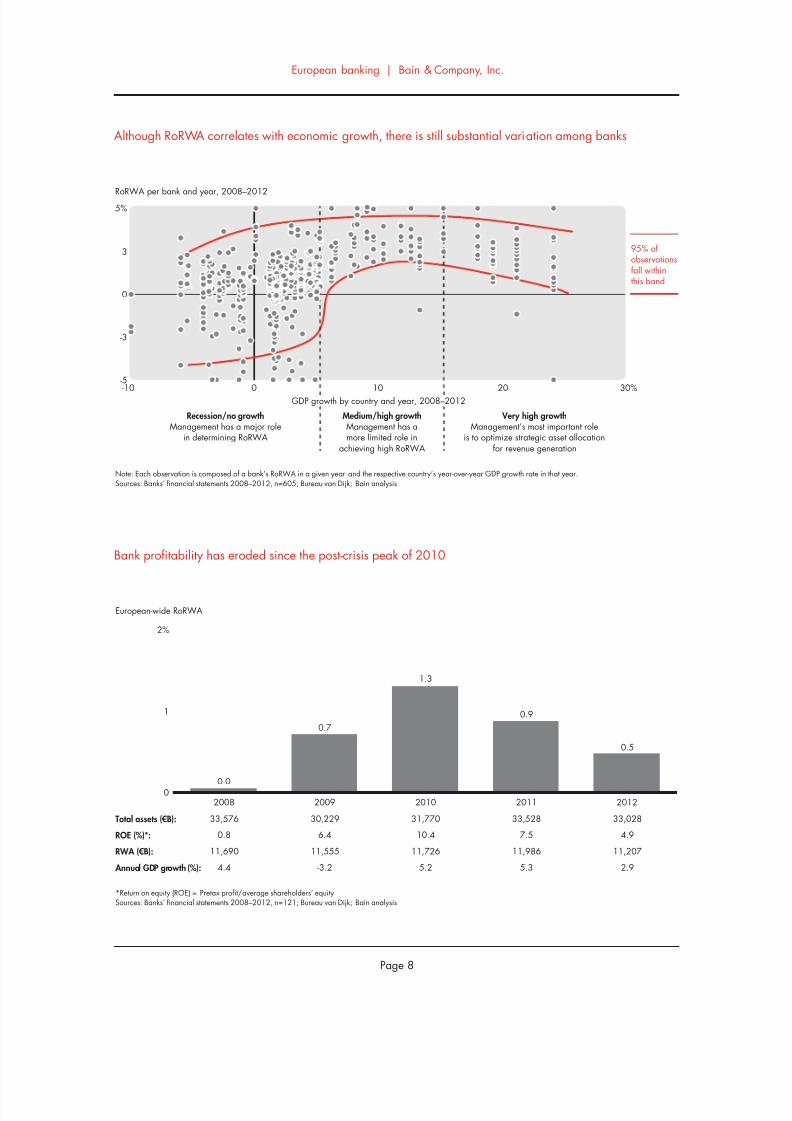
7222019 Bain amp Co- European Banking Report
httpslidepdfcomreaderfullbain-co-european-banking-report 1032
European banking | Bain amp Company Inc
Page 8
Although RoRWA correlates with economic growth there is still substantial variation among banks
Note Each observation is composed of a bankrsquos RoRWA in a given year and the respective countryrsquos year-over-year GDP growth rate in that yearSources Banksrsquo financial statements 2008ndash2012 n=605 Bureau van Dijk Bain analysis
RoRWA per bank and year 2008ndash2012
-5
-3
0
3
5
-10 0 10 20 30
95 ofobservationsfall withinthis band
Recessionno growthManagement has a major role
in determining RoRWA
Mediumhigh growthManagement has amore limited role in
achieving high RoRWA
Very high growthManagementrsquos most important role
is to optimize strategic asset allocationfor revenue generation
GDP growth by country and year 2008ndash2012
Bank profitability has eroded since the post-crisis peak of 2010
Return on equity (ROE) = Pretax profitaverage shareholdersrsquo equitySources Banksrsquo financial statements 2008ndash2012 n=121 Bureau van Dijk Bain analysis
European-wide RoRWA
0
1
2
200800
2009
07
2010 2011
09
2012
05
RWA (euroB)
33576
08
11690
44
30229
64
11555
-32
31770
104
11726
52
33528
75
11986
53
33028
49
11207
29
Total assets (euroB)
Annual GDP growth ()
ROE ()
13
7222019 Bain amp Co- European Banking Report
httpslidepdfcomreaderfullbain-co-european-banking-report 1132
European banking | Bain amp Company Inc
Page 9
Banks in core Europe have not covered their cost of capital over the past five years
The range represents the level of RoRWA required to cover the banksrsquo cost of capital and varies by bank size and country analysis of 88 banks based in AustriaBelgium France Germany Ireland Italy the Netherlands the Nordics Portugal Spain Switzerland and the UKSources Banksrsquo financial statements 2008ndash2012 Bain analysis
RoRWA weighted average
RWA (euroB)
32373
-15
10899
29129
51
10846
30366
88
10785
31957
53
10869
31219
22
10047
Total assets (euroB)
ROE ()
2008
-01
2009
06
2010 2011
06
2012
01
Range ofRoRWArequiredto coverthe costof capital
11
-1
0
1
2
3
4
1816
while banks in high-growth countries consistently exceeded their cost of capital
The range represents the level of RoRWA required to cover the banksrsquo cost of capital and varies by bank size and country analysis of 33 banks based in theCommonwealth of Independent States (CIS) Poland South Africa and TurkeySources Banksrsquo financial statements 2008ndash2012 Bain analysis
RoRWA weighted average
RWA (euroB)
1203
226
791
1100
206
708
Total assets (euroB)
ROE ()
Range ofRoRWArequiredto coverthe costof capital
0
1
2
3
4
2008
24
2009
22
1404
250
941
2010
32
1571
267
1117
2011
31
1810
247
1160
2012
33
2119
7222019 Bain amp Co- European Banking Report
httpslidepdfcomreaderfullbain-co-european-banking-report 1232
European banking | Bain amp Company Inc
Page 10
Higher operating expenditure and cost of risk caused banksrsquo value destruction in 2012
Long-term refinancing operations (LTRO) 2011 ~euro500 billion LTRO 2012 ~euro750 billion (including repayment) corresponding to 2011 total assets of ~euro330 trillionand 2012 total assets of ~euro322 trillionSources Banksrsquo financial statements 2008ndash2012 n=121 Bain analysis
20122010 2011
RoRWA ()
Total assets (euroB)
Tier 1 capital (euroB)
RWAtotal assets ()
Net interest incomeRWA ()
Financial marginRWA ()
Fees and commissions +
other revenuesRWA ()
Operating expenditureRWA ()
Loan-loss provisionsRWA ()
05
33028
1510
34
36
09
17
43
15
13
31770
1363
37
35
10
17
37
12
09
33528
1426
36
35
05
20
40
12
2009
07
30229
1261
38
34
09
17
35
18
00
33576
1079
35
31
-07
22
36
11
2008Main components in
European-wide RoRWA Major trends
Partial deleveraging of assets
Strengthening of capital
Fairly constant risk profile despite
deleveraging of assets
Overall margin from balance-sheet
management increasing
Continuous pressure on fees
and commissions
Inability to reduce costs in
proportion to deleveraging
Rising cost of credit
7222019 Bain amp Co- European Banking Report
httpslidepdfcomreaderfullbain-co-european-banking-report 1332
European banking | Bain amp Company Inc
Page 11
In core Europe banks increased capital ratios and revenues but did not optimize costs
Notes Components in bold are direct components of the RoRWA calculation changes in red are negative trendsSources Banksrsquo financial statements 2008ndash2012 n=88 Bain analysis
2012 Change2008minus20122010 2011
Total RWA (euroB)
Total assets (euroB)
RWAtotal assets ()
Tier 1 ratio ()
Total Tier 1 (euroB)
Net interest incomeRWA ()
Financial marginRWA ()
Net interest incometotal assets ()
Financial margintotal assets ()
Net interest income + financial marginRWA ()
Fees + other revenuesRWA ()
OpexRWA ()
Costincome ()
Loan-loss provisionsRWA ()
Nonperforming loan ratio ()
Coverage ratio ()
10047
31219
32
133
1336
34
09
11
03
43
16
43
70
15
55
49
-78
-36
-2 pts
+43 pts
+36
+05 pts
+16 pts
+01 pts
+05 pts
+21 pts
-06 pts
+07 pts
-10 pts
+05 pts
+30 pts
-12 pts
10785
30366
36
114
1230
33
10
12
04
43
16
37
62
12
46
50
10869
31957
34
118
1280
33
05
11
02
39
19
40
68
12
47
51
2009
10846
29129
37
107
1159
32
09
12
03
41
17
35
61
17
40
54
10899
32373
34
90
981
29
-07
10
-02
22
22
35
80Opextotal assets () 14 +02 pts13 141312
10
25
61
Cross-selling
Asset leverage
Balance-sheet management
Cost structure
Cost of risk
2008Components
In high-growth countries higher financial margins offset lower fees and relatively high nonperforming loans
affected cost of risk
Notes Components in bold are direct components of the RoRWA calculation changes in red are negative trendsSources Banksrsquo financial statements 2008ndash2012 n=33 Bain analysis
2012 Change2008minus2012
2010 2011
Total RWA (euroB)
Total assets (euroB)
RWAtotal assets ()
Tier 1 ratio ()
Total Tier 1 (euroB)
Net interest incomeRWA ()
Financial marginRWA ()
Net interest incometotal assets ()
Financial margintotal assets ()
Net interest income + financial marginRWA ()
Fees + other revenuesRWA ()OpexRWA ()
Costincome ()
Opextotal assets ()
Loan-loss provisionsRWA ()
Nonperforming loan ratio ()
Coverage ratio ()
1160
1810
64
150
174
57
05
36
04
62
2543
45
27
11
49
64
+47
+50
-2 pts
+27 pts
+78
-01 pts
+05 pts
-02 pts
+04 pts
+05 pts
-02 pts+01 pts
-2 pts
-01 pts
-07 pts
+12 pts
+5 pts
941
1404
67
141
133
55
05
37
04
60
2741
43
28
15
69
63
1117
1571
71
131
147
50
03
35
02
53
2438
45
27
08
55
64
2009
708
1100
64
144
102
67
08
43
05
75
2743
39
28
36
82
57
791
1203
66
123
97
58
00
38
00
58
2742
47
28
18
37
59
Cross-selling
Asset leverage
Balance-sheet management
Cost structure
Cost of risk
2008Components
7222019 Bain amp Co- European Banking Report
httpslidepdfcomreaderfullbain-co-european-banking-report 1432
European banking | Bain amp Company Inc
Page 12
Europersquos 10 biggest banks come closest to earning their cost of capital
The range represents the level of RoRWA required to cover the banksrsquo cost of capital and varies by bank size and country Analysis of the 10 largest Europe-headquarteredbanks by market capitalization with a pan-European presence a universal bank business model and assets of at least euro650 billion (Barclays BNP ParibasCreacutedit Agricole Credit Suisse Deutsche Bank HSBC Nordea Santander UBS and UniCredit)Sources Banksrsquo financial statements 2008ndash2012 Bain analysis
RoRWA weighted average
RWA (euroB)
1340922
3514
1133694
3474
Total assets (euroB)
ROE ()
Range ofRoRWArequiredto coverthe costof capital
12395123
3698
13239107
3765
1338559
3639
2008
02
2009 2010
17
2011
14
2012
09
12
0
1
2
18
16
Among the 10 biggest banks lower risk costs and improved margins offset high Opex
Notes Components in bold are direct components of the RoRWA calculation changes in red are negative trendsSources Banksrsquo financial statements 2008ndash2012 n=10 Bain analysis
2012 Change2008minus2012
2010 2011
Total RWA (euroB)
Total assets (euroB)
RWAtotal assets ()
Tier 1 ratio ()
Total Tier 1 (euroB)
Net interest incomeRWA ()
Financial marginRWA ()
Net interest incometotal assets ()
Financial margintotal assets ()
Net interest income + financial marginRWA ()
Fees + other revenuesRWA ()OpexRWA ()
Costincome ()
Opextotal assets ()
Loan-loss provisionsRWA ()
Nonperforming loan ratio ()
Coverage ratio ()
3639
13385
27
131
477
38
10
10
03
49
2452
71
14
12
45
54
+36
-02
+1 pts
+46 pts
+60
+05 pts
+18 pts
+02 pts
+05 pts
+23 pts
-06 pts+09 pts
-6 pts
+03 pts
+01 pts
+21 pts
-24 pts
3698
12395
30
115
426
37
14
11
04
51
2346
62
14
11
46
52
3765
13239
28
116
437
38
09
11
03
47
2648
65
14
11
44
53
2009
3474
11336
31
110
380
37
14
11
04
51
2244
60
13
17
35
71
3514
13409
26
85
299
33
-07
09
-02
26
3043
77
11
11
24
78
Cross-selling
Asset leverage
Balance-sheet management
Cost structure
Cost of risk
2008Components
7222019 Bain amp Co- European Banking Report
httpslidepdfcomreaderfullbain-co-european-banking-report 1532
European banking | Bain amp Company Inc
Page 13
Other large European banks have fallen well short of earning their cost of capital
The range represents the level of RoRWA required to cover the banksrsquo cost of capital and varies by bank size and country Analysis of 13 banks with assets of at leasteuro200 billion a universal bank business model and small to medium-sized subsidiaries outside their core geography (ABN AMRO Group BBVA Commerzbank Danske BankErste ING Intesa Sanpaolo KBC Lloyds Rabobank RBS Socieacuteteacute Geacuteneacuterale and Standard Chartered)Sources Banksrsquo financial statements 2008ndash2012 Bain analysis
RoRWA weighted average
RWA (euroB)
Total assets (euroB)
ROE ()
Range ofRoRWArequiredto coverthe costof capital
861607
3188
2008
01
822237
3468
2009
04
850978
3339
2010
867422
3214
2011
03
888640
3115
2012
06
10
0
1
2
18
16
Other large European banks had Opex lower than the big 10 which offset pressure on fee income and
higher cost of risk
Notes Components in bold are direct components of the RoRWA calculation changes in red are negative trendsSources Banksrsquo financial statements 2008ndash2012 n=13 Bain analysis
2012 Change2008minus2012
2010 2011
Total RWA (euroB)
Total assets (euroB)
RWAtotal assets ()
Tier 1 ratio ()
Total Tier 1 (euroB)
Net interest incomeRWA ()
Financial marginRWA ()
Net interest incometotal assets ()
Financial margintotal assets ()
Net interest income + financial marginRWA ()
Fees + other revenuesRWA ()OpexRWA ()
Costincome ()
Opextotal assets ()
Loan-loss provisionsRWA ()
Nonperforming loan ratio ()
Coverage ratio ()
3115
8886
35
129
402
35
12
12
04
47
1239
66
14
14
56
50
-23
+31
-19 pts
+39 pts
+40
+04 pts
+17 pts
+01 pts
+06 pts
+21 pts
-09 pts+02 pts
-12 pts
No change
+04 pts
+22 pts
+3 pts
3339
8509
39
114
382
34
11
13
04
45
1233
57
13
14
54
48
3214
8674
37
119
382
35
03
13
01
38
1739
70
14
14
57
48
2009
3468
8222
42
102
353
31
10
13
04
41
1532
58
14
19
50
46
3188
8616
37
90
287
31
-05
12
-02
26
2137
78
14
10
34
47
Cross-selling
Asset leverage
Balance-sheet management
Cost structure
Cost of risk
2008Components
7222019 Bain amp Co- European Banking Report
httpslidepdfcomreaderfullbain-co-european-banking-report 1632
European banking | Bain amp Company Inc
Page 14
Local banks have seen their RoRWA sharply deteriorate in recent years
The range represents the level of RoRWA required to cover the banksrsquo cost of capital and varies by bank size and country analysis of 65 banks operating exclusivelywithin a single national or regional marketSources Banksrsquo financial statements 2008ndash2012 Bain analysis
RoRWA weighted average
RWA (euroB)
Total assets (euroB)
ROE ()
Range ofRoRWArequiredto coverthe costof capital
10347
-68
4198
9571
20
3904
9462
59
3748
10044
20
3890
8948
-42
3293
2008
-06
2009
02
2010
07
2011
02
2012
-11
-2
-1
0
1
21816
Local banks have experienced sharp deleveraging higher cost of risk more nonperforming loans and flat revenues
Notes Components in bold are direct components of the RoRWA calculation changes in red are negative trendsSources Banksrsquo financial statements 2008ndash2012 n=65 Bain analysis
2012 Change2008minus2012
2010 2011
Total RWA (euroB)
Total assets (euroB)
RWAtotal assets ()
Tier 1 ratio ()
Total Tier 1 (euroB)
Net interest incomeRWA ()
Financial marginRWA ()
Net interest incometotal assets ()
Financial margintotal assets ()
Net interest income + financial marginRWA ()
Fees + other revenuesRWA ()OpexRWA ()
Costincome ()
Opextotal assets ()
Loan-loss provisionsRWA ()
Nonperforming loan ratio ()
Coverage ratio ()
3293
8948
37
139
457
28
06
10
02
34
1135
71
13
20
64
46
-215
-135
-38 pts
+44 pts
+15
+03 pts
+14 pts
No change
+06 pts
+17 pts
-05 pts+08 pts
-17 pts
+02 pts
+1 pts
+44 pts
-18 pts
3748
9462
40
113
422
28
05
11
02
33
1430
65
12
09
40
52
3890
10044
39
118
461
28
03
11
01
31
1532
69
13
12
43
51
2009
3904
9571
41
109
426
28
04
11
02
32
1430
65
12
14
36
51
4198
10347
41
94
396
25
-09
10
-04
16
1628
87
11
10
20
64
Cross-selling
Asset leverage
Balance-sheet management
Cost control
Cost of risk
2008Components
7222019 Bain amp Co- European Banking Report
httpslidepdfcomreaderfullbain-co-european-banking-report 1732
European banking | Bain amp Company Inc
Page 15
7222019 Bain amp Co- European Banking Report
httpslidepdfcomreaderfullbain-co-european-banking-report 1832
7222019 Bain amp Co- European Banking Report
httpslidepdfcomreaderfullbain-co-european-banking-report 1932
bull Countries with strong economic growth led the2012 RoRWA rankings Turkey took pole positionwith a 49 RoRWA In core Europe the Nordic
countries posed the strongest performance witha 19 RoRWA followed by Austria and theNetherlands The largest economies of Germanythe UK and France trailed behind
bull Banks in Italy Portugal Spain and Ireland whichhave been mired in the sovereign debt crisis anddeep economic recessions turned in the weakestRoRWA performances
bull Among the core European countries changes inRoRWAs from 2008 to 2012 stemmed mainly
from changes in three components net interestincome financial margin and loan-loss provisions
bull Countries that posted large positive changesmdashincluding Germany the Netherlands the Nordiccountries and the UKmdashbenefited from higherfinancial margins more control of operatingexpenditure and lower cost of risk Countries withlarge drops in RoRWAs were hurt by infl exiblecost structures which prevented them from shrinkingtheir production costs and a cost of risk that was
almost double the averagebull Northern Europe dominated the league tables
whether one looks at the 2012 leaders or themost improved banks For example the RoRWAleaders among both local and the 10 biggestbanks included banks in the Nordic countriesfollowed by those in the UK France Austria andthe Netherlands
bull In the most improved group banks in Switzer-land the Netherlands and Germany made a
strong showing
bull In high-growth countries Turkey and the Common-wealth of Independent States (CIS) took leadingpositions for the most improved banks and Turkeyfor the 2012 leaders
2Country and cluster
league tables
7222019 Bain amp Co- European Banking Report
httpslidepdfcomreaderfullbain-co-european-banking-report 2032
European banking | Bain amp Company Inc
Page 18
High-growth countries led the RoRWA rankings in 2012
Note For CIS the Netherlands Belgium Germany UK France Portugal and Spain one or two Tier-3 banks had not reported 2012 data by time of publicationso the analysis used 2011 data for those few banksSources Banksrsquo financial statements 2008ndash2012 n=121 Bain analysis
Rank 2012 RoRWA ()
Turkey
Poland
South Africa
CIS
Nordics
Austria
Netherlands
Belgium
Germany
UK
France
Switzerland
Italy
Portugal
Spain
Ireland
1
2
3
4
5
6
7
8
9
10
11
12
13
14
15
16
49
47
31
27
19
12
10
08
07
05
03
01
-06
-08
-17
-48
480
167
340
826
2357
334
2186
911
5514
7062
6320
1812
2127
426
2917
312
2012 total assets (euroB)Country 2008 RoRWA ()
33
41
35
10
13
19
-20
-25
-14
00
08
-76
07
10
19
10
7222019 Bain amp Co- European Banking Report
httpslidepdfcomreaderfullbain-co-european-banking-report 2132
European banking | Bain amp Company Inc
Page 19
In core European countries RoRWA changes from 2008 to 2012hellip
Note Averages are weighted for the total size of the respective components in each countrySources Banksrsquo financial statements 2008ndash2012 n=71 Bain analysis
RoRWA weighted average
-3
-2
-1
0
1
2
2008 average2012 average
UK
05
France
08
Germany
-14
07
Spain
19
-17
Nordics
13
19
Italy
07
-06
Netherlands
-20
10
2008 2012
0003
hellipwere spurred mainly by net interest income financial margin and loan-loss provisions
Note Averages are weighted for the total sizes of the respective indicators in each countrySources Banksrsquo financial statements 2008-2012 n=71 Bain analysis
NordicsGermany Spain
Total assets (euroB)
Total RWA (euroB)
Net interest incomeRWA ()
Financial marginRWA ()
Fees and commissions +other revenuesRWA ()
OpexRWA ()
Loan-loss provisionsRWA ()
France
7751
UK
2008 2012
AverageItaly Netherlands
7039
2474 2467
31 30
-02 12
26 15
41 42
14 10
5857 5715
1532 1327
26 38
-03 16
30 13
40 54
05 10
6054 5419
1534 1317
26 32
-19 07
14 17
27 43
08 06
1976 2917
1068 1315
36 43
06 06
17 10
27 35
13 41
1960 2357
790 735
27 32
-02 12
17 10
24 28
05 05
1990 2127
1266 1139
32 28
01 04
18 18
33 35
10 22
2263 2054
729 656
29 41
-17 06
15 10
39 38
09 09
2071 3947
928 1279
30 34
-05 10
17 14
32 41
08 15
7222019 Bain amp Co- European Banking Report
httpslidepdfcomreaderfullbain-co-european-banking-report 2232
European banking | Bain amp Company Inc
Page 20
These banks are the 2012 RoRWA leaders of their geographic cluster
Sources Banksrsquo financial statements 2008ndash2012 Bain analysis
Rank 2012 RoRWA ()
Nordics
UK
France
UK
Austria
Netherlands
Nordics
Nordics
Nordics
Turkey
Turkey
Turkey
1
2
3
1
2
3
1
2
3
1
2
3
19
18
16
23
17
16
40
39
36
158
132
48
Nordea
HSBC
BNP Paribas
Standard Chartered
Erste
ING
Swedbank
Sparebank 1 Group
Handelsbanken
Ziraat Bankasi
Akbank
Tuumlrkiye Halk
Bank Country 2008 RoRWA ()
16
08
06
24
19
02
20
NA
21
193
106
38
10biggest
Otherlarge
European
Local
High-growthcountries
These banks showed the biggest improvements in RoRWA over the past five years
Sources Banksrsquo financial statements 2008ndash2012 Bain analysis
Rank 2008ndash2012 change( points)
Switzerland
Switzerland
Germany
Belgium
UK
Netherlands
Netherlands
Belgium
Germany
CIS
Turkey
CIS
1
2
3
1
2
3
1
2
3
1
2
3
+83
+68
+21
+29
+26
+14
+64
+50
+33
+71
+26
+13
UBS
Credit Suisse
Deutsche Bank
KBC
RBS
ING
RBS Holdings NV
BNP Paribas Fortis
Bayerische Landesbank
Gazprombank
Akbank
VTB 24
Bank Country 2008 RoRWA ()
-92
-58
-19
-19
-37
02
-91
-45
-26
-56
106
05
10biggest
Otherlarge
European
Local
High-growthcountries
7222019 Bain amp Co- European Banking Report
httpslidepdfcomreaderfullbain-co-european-banking-report 2332
European banking | Bain amp Company Inc
Page 21
7222019 Bain amp Co- European Banking Report
httpslidepdfcomreaderfullbain-co-european-banking-report 2432
7222019 Bain amp Co- European Banking Report
httpslidepdfcomreaderfullbain-co-european-banking-report 2532
bull Europersquos environment continues to be volatile andinvestors are seeking better information about abankrsquos stability asset quality and key factors that
generate value RoRWA plays a useful role hereby focusing on the balance sheetmdashwhich enablescomparison between a bank and its peersmdashand byidentifying the factors influencing bank performance
bull Banks still need to address challenges along eachdimension of RoRWA in order to lift their profit-ability levels above the cost of capital In recent
years the profitability of lending assets has beensustained mainly by the fi nancial componentsincluding a boost from LTRO To raise asset prof-itability banks will have to better manage their
capital allocations and risk profilesbull The pressure on fee income will continue To offset
that trend banks should turn to their close clientrelationships for new sources of revenues
bull Lowering operating costs is the dimension thatwarrants managementrsquos attention at any bankregardless of size or location Initiatives that havethe greatest potential for tackling structural costsinclude adopting digital technologies and modern-izing IT platforms optimizing processes from endto end through outsourcing offshoring and other
means and expanding global procurement Suchinitiatives are essential for survival in an industrygoing through discontinuous change
bull Deleveraging the loan portfolio for riskier clients isa pressing issue which still poses significant threatsfor local banks In countries with a higher cost ofrisk and stagnant or negative GDP growth rateslocal banks may face further painful restructuring
bull Astute management of the cost of risk includingtaking a portfolio perspective offers opportunities
for most banksmdashin part to meet the new require-ments of Basel III and reassure rating agencies
bull Further consolidation of the local and other largebanks over the coming years will likely benefitthe 10 biggest banks and those in high-growthcountries These high-growth countries offer thegreatest opportunities for RoRWA growth for largeand pan-European players looking to diversifytheir portfolios
3Strategic
perspectives and
implications for
management
7222019 Bain amp Co- European Banking Report
httpslidepdfcomreaderfullbain-co-european-banking-report 2632
European banking | Bain amp Company Inc
Page 24
Significant restructuring is warranted for all banks but the nature of the challenge varies by geography
Source Bain analysis
10 biggest Strategic issueHigh-growth
countries
Other large
EuropeanLocal
Cross-selling
Balance-sheet
management
Cost structure
Cost of risk
Major threatThreatOpportunityMajor opportunity
Profitability of the asset portfolio has been sustained mainly by the
financial component Deleveraging of the loan portfolio for riskier
clients has been only partially successful and the risk profile of
the portfolio still has a long way to go
To counter pressure on fees banks should work systematically on
cross-selling opportunities through initiatives like client-focused
service models and CRM support
To further reduce costs banks should pursue new digital technologies
optimized processes through such means as outsourcing and offshoring
modernized IT platforms and global procurement initiatives
Active management of cost of risk demands more systematic solutions
bull NPL and LLP trends are threatening the stability of the overall
system and not only in individual countries such as Greece
bull Management of risky clients has become a core business and capability
bull Managing costs of risk demands an integrated portfolio approach
7222019 Bain amp Co- European Banking Report
httpslidepdfcomreaderfullbain-co-european-banking-report 2732
European banking | Bain amp Company Inc
Page 25
Assets (euroB)
Erste (AT)
Raiffeisen Bank (AT)
BNP Paribas Fortis
KBC
Belfius Banque
ING Belgium SANV
Creacutedit Agricole Groupe
BNP Paribas
Groupe Socieacuteteacute Geacuteneacuterale
Groupe BPCE
Creacutedit Mutuel
Deutsche Bank
Commerzbank AGKfW
DZ Bank AG
UniCredit Bank AG
2138
1202
2723
2569
2129
1691
17930
15439
12307
11475
6051
20123
63595116
4072
3483
Austria
Belgium
France
Germany
Country Bank Cluster
Other large
Local
Local
Other large
Local
Local
10 biggest
10 biggest
Other large
Local
Local
10 biggest
Other largeLocal
Local
Local
Ireland
Landesbank Baden-Wuumlrttemberg
Bayerische Landesbank
NORDLB
Helaba
HSH Nordbank
DekaBank
Landesbank Berlin Holding
Santander Consumer Bank
Hamburger Sparkasse
Deutsche Apotheker - und Aumlrztebank
Sparkasse KoumllnBonn
Kreissparkasse Koumlln
Bank of Ireland
Allied Irish Banks
permanent tsb Group Hldgs Plc
Intesa Sanpaolo
3363
2868
2256
1993
1306
1297
1183
403
396
379
299
248
1481
1225
409
6735
Local
Local
Local
Local
Local
Local
Local
Local
Local
Local
Local
Local
Other large
10 biggest
Local
Other large
Unicredit Group
Monte dei Paschi di Siena
4639
2189
10 biggest
Local
UBI Banca Group
Banco Popolare
BNL
Banca Popolare dellrsquoEmilia Romagna
Banca Popolare di Milano
Gruppo Banca Carige
Cariparma
Banca Popolare di Vicenza
Veneto Banca
1324
1319
912
616
525
493
493
467
402
Local
Local
Local
Local
Local
Local
Local
Local
Local
Italy
2011 assets
Bca Popdi Sondrio 322 Local
Credito Emiliano
Credito Valtellinese
Banca delle Marche
307
299
227
Local
Local
Local
List of banks analyzed by country and assets
10 biggest other large local
7222019 Bain amp Co- European Banking Report
httpslidepdfcomreaderfullbain-co-european-banking-report 2832
European banking | Bain amp Company Inc
Page 26
Assets (euroB)Country Bank Cluster
ING
Rabobank Group
ABN AMRO Group
SNS Reaal
RBS Holdings NV
8361
7524
3944
1322
710
Netherlands
Other large
Other large
Other large
Local
Local
Nordea 6774 10 biggest
Danske Bank
DNB
4682
3028
Other large
Local
SEB
Handelsbanken
Swedbank
Pohjola Bank
2818
2742
2121
998
Local
Local
Local
Local
Nordics
Jyske Bank 347 Local
Sparebank 1 Group 62 Local
Caixa Geral de Depositos 1169 Local
Millenium BCP
Banco Espiacuterito Santo
897
837
Local
Local
Banco BPI
Santander Totta SGPS
Caixa Econoacutemica Montepio Geral
Creacutedito Agriacutecola Muacutetuo
446
414
215
142
Local
Local
Local
Local
Portugal
BANIF 140 Local
SantanderBBVA
la Caixa
Banco Financiero y de Ahorros
Banco Sabadell SA
122826378
3591
3092
1615
Spain
10 biggestOther large
Local
Local
Local
Banco Popular
Banco Mare Nostrum
1576
634
Local
Local
UBS
Credit Suisse
10448
7669Switzerland
10 biggest
10 biggest
HSBC 20939 10 biggest
Barclays
Royal Bank of Scotland
17603
11521
10 biggest
Other large
Lloyds Banking Group
Standard Chartered
Nationwide Building Society
Co-operative Bank
11395
4950
2417
611
Other large
Other large
Local
Local
UK
Clydesdale Bank 545 Local
Yorkshire Building Society 413 Local
Virgin Money 223 Local
2011 assets
List of banks analyzed by country and assets
10 biggest other large localmdashcontinued
7222019 Bain amp Co- European Banking Report
httpslidepdfcomreaderfullbain-co-european-banking-report 2932
European banking | Bain amp Company Inc
Page 27
Assets (euroB)
Sberbank
VTB 24
PKO BP
Bank Pekao
BRE Bank
ING Bank Slaski
Standard Bank
Absa
FirstRand
Nedbank
Investec
Tuumlrkiye İş Bankası
Tuumlrkiye Garanti
Ziraat Bankasi
Akbank
Yapı ve Kredi
3781
1857
463
361
244
187
928
766
729
647
330
869
777
708
706
568
CIS
Poland
South Africa
Turkey
Country Bank
Tuumlrkiye Halk Bankasi
Tuumlrkiye Vakıflar
Finansbank
471
467
239
Gazprombank
Russian Agricultural Bank
Alfa-Bank
Nomos-Bank
UniCredit Bank Russia
712
358
357
225
218
AKB Rosbank
Promsvyazbank
ZAO Raiffeisenbank
URALSIB Bank
Russian Standard Bank
AKB Probusinessbank
200
173
160
113
74
35
2011 assets
Bank Zachodni WBK + Kredyt Bank
Getin NobleBank
Bank Millennium
143
141
126
List of banks analyzed by country and assets
High-growth countries
7222019 Bain amp Co- European Banking Report
httpslidepdfcomreaderfullbain-co-european-banking-report 3032
European banking | Bain amp Company Inc
Page 28
Key contacts in Bainrsquos European Financial Services practice
Franco Baronio in Milan (francobaroniobaincom)Rocco DrsquoAcunto in Milan (roccodacuntobaincom)
Ada Di Marzo in Paris (adadimarzobaincom)
Bertrand Facq in Warsaw (bertrandfacqbaincom)
Fabrice Franzen in Johannesburg (fabricefranzenbaincom)
Thomas Herbeck in Frankfurt (thomasherbeckbaincom)
Karaca Kestelli in Istanbul (karacakestellibaincom)
Nicolaacutes Lopez in Madrid (nicolaslopezbaincom)
Niels Peder Nielsen in Copenhagen (nielspedernielsenbaincom)
Andrea Oldrini in Milan (andreaoldrinibaincom)
Mathijs Robbens in Amsterdam (mathijsrobbensbaincom)
Visar Sala in Moscow (visarsalabaincom)
Walter Sinn in Frankfurt (waltersinnbaincom)Joatildeo Soares in London (joaosoaresbaincom)
Acknowledgments
The authors would like to thank the following Bain colleagues for their valuable support in producing this report
Sonal Chawla Christian Duus Franccedilois Fastrez Farsan Ghassim and Shikha Mahato
See these related Bain perspectives at wwwbaincom
bull Managing risk and capital
bull How Europersquos banks can return to health
bull The digital challenge to retail banks
7222019 Bain amp Co- European Banking Report
httpslidepdfcomreaderfullbain-co-european-banking-report 3132
7222019 Bain amp Co- European Banking Report
httpslidepdfcomreaderfullbain-co-european-banking-report 3232
For more information visit wwwbaincom
Share983140 983105m983138io983150 Tru Rs983157983148ts
Bain amp Company is the management consulting firm that the worldrsquos business leaders come to whenthey want results
Bain advises clients on strategy operations technology organization private equity and mergers and acquisitions We develop
practical customized insights that clients act on and transfer skills that make change stick Founded in 1973 Bain has
48 offices in 31 countries and our deep expertise and client roster cross every industry and economic sector Our clients
have outperformed the stock market 4 to 1
What sets us apart
We believe a consulting firm should be more than an adviser So we put ourselves in our clientsrsquo shoes selling outcomes not
projects We align our incentives with our clientsrsquo by linking our fees to their results and collaborate to unlock the full potential
of their business Our Results Deliveryreg process builds our clientsrsquo capabilities and our True North values mean we do theright thing for our clients people and communitiesmdashalways
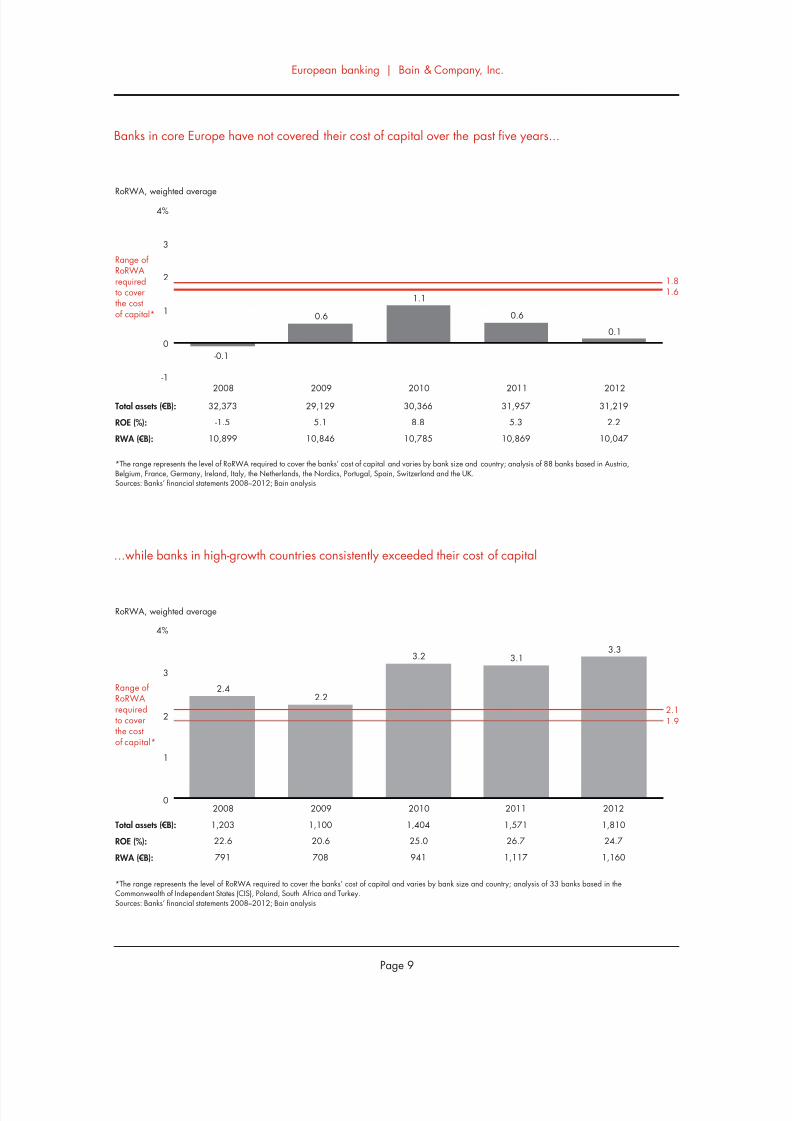
7222019 Bain amp Co- European Banking Report
httpslidepdfcomreaderfullbain-co-european-banking-report 1232
European banking | Bain amp Company Inc
Page 10
Higher operating expenditure and cost of risk caused banksrsquo value destruction in 2012
Long-term refinancing operations (LTRO) 2011 ~euro500 billion LTRO 2012 ~euro750 billion (including repayment) corresponding to 2011 total assets of ~euro330 trillionand 2012 total assets of ~euro322 trillionSources Banksrsquo financial statements 2008ndash2012 n=121 Bain analysis
20122010 2011
RoRWA ()
Total assets (euroB)
Tier 1 capital (euroB)
RWAtotal assets ()
Net interest incomeRWA ()
Financial marginRWA ()
Fees and commissions +
other revenuesRWA ()
Operating expenditureRWA ()
Loan-loss provisionsRWA ()
05
33028
1510
34
36
09
17
43
15
13
31770
1363
37
35
10
17
37
12
09
33528
1426
36
35
05
20
40
12
2009
07
30229
1261
38
34
09
17
35
18
00
33576
1079
35
31
-07
22
36
11
2008Main components in
European-wide RoRWA Major trends
Partial deleveraging of assets
Strengthening of capital
Fairly constant risk profile despite
deleveraging of assets
Overall margin from balance-sheet
management increasing
Continuous pressure on fees
and commissions
Inability to reduce costs in
proportion to deleveraging
Rising cost of credit
7222019 Bain amp Co- European Banking Report
httpslidepdfcomreaderfullbain-co-european-banking-report 1332
European banking | Bain amp Company Inc
Page 11
In core Europe banks increased capital ratios and revenues but did not optimize costs
Notes Components in bold are direct components of the RoRWA calculation changes in red are negative trendsSources Banksrsquo financial statements 2008ndash2012 n=88 Bain analysis
2012 Change2008minus20122010 2011
Total RWA (euroB)
Total assets (euroB)
RWAtotal assets ()
Tier 1 ratio ()
Total Tier 1 (euroB)
Net interest incomeRWA ()
Financial marginRWA ()
Net interest incometotal assets ()
Financial margintotal assets ()
Net interest income + financial marginRWA ()
Fees + other revenuesRWA ()
OpexRWA ()
Costincome ()
Loan-loss provisionsRWA ()
Nonperforming loan ratio ()
Coverage ratio ()
10047
31219
32
133
1336
34
09
11
03
43
16
43
70
15
55
49
-78
-36
-2 pts
+43 pts
+36
+05 pts
+16 pts
+01 pts
+05 pts
+21 pts
-06 pts
+07 pts
-10 pts
+05 pts
+30 pts
-12 pts
10785
30366
36
114
1230
33
10
12
04
43
16
37
62
12
46
50
10869
31957
34
118
1280
33
05
11
02
39
19
40
68
12
47
51
2009
10846
29129
37
107
1159
32
09
12
03
41
17
35
61
17
40
54
10899
32373
34
90
981
29
-07
10
-02
22
22
35
80Opextotal assets () 14 +02 pts13 141312
10
25
61
Cross-selling
Asset leverage
Balance-sheet management
Cost structure
Cost of risk
2008Components
In high-growth countries higher financial margins offset lower fees and relatively high nonperforming loans
affected cost of risk
Notes Components in bold are direct components of the RoRWA calculation changes in red are negative trendsSources Banksrsquo financial statements 2008ndash2012 n=33 Bain analysis
2012 Change2008minus2012
2010 2011
Total RWA (euroB)
Total assets (euroB)
RWAtotal assets ()
Tier 1 ratio ()
Total Tier 1 (euroB)
Net interest incomeRWA ()
Financial marginRWA ()
Net interest incometotal assets ()
Financial margintotal assets ()
Net interest income + financial marginRWA ()
Fees + other revenuesRWA ()OpexRWA ()
Costincome ()
Opextotal assets ()
Loan-loss provisionsRWA ()
Nonperforming loan ratio ()
Coverage ratio ()
1160
1810
64
150
174
57
05
36
04
62
2543
45
27
11
49
64
+47
+50
-2 pts
+27 pts
+78
-01 pts
+05 pts
-02 pts
+04 pts
+05 pts
-02 pts+01 pts
-2 pts
-01 pts
-07 pts
+12 pts
+5 pts
941
1404
67
141
133
55
05
37
04
60
2741
43
28
15
69
63
1117
1571
71
131
147
50
03
35
02
53
2438
45
27
08
55
64
2009
708
1100
64
144
102
67
08
43
05
75
2743
39
28
36
82
57
791
1203
66
123
97
58
00
38
00
58
2742
47
28
18
37
59
Cross-selling
Asset leverage
Balance-sheet management
Cost structure
Cost of risk
2008Components
7222019 Bain amp Co- European Banking Report
httpslidepdfcomreaderfullbain-co-european-banking-report 1432
European banking | Bain amp Company Inc
Page 12
Europersquos 10 biggest banks come closest to earning their cost of capital
The range represents the level of RoRWA required to cover the banksrsquo cost of capital and varies by bank size and country Analysis of the 10 largest Europe-headquarteredbanks by market capitalization with a pan-European presence a universal bank business model and assets of at least euro650 billion (Barclays BNP ParibasCreacutedit Agricole Credit Suisse Deutsche Bank HSBC Nordea Santander UBS and UniCredit)Sources Banksrsquo financial statements 2008ndash2012 Bain analysis
RoRWA weighted average
RWA (euroB)
1340922
3514
1133694
3474
Total assets (euroB)
ROE ()
Range ofRoRWArequiredto coverthe costof capital
12395123
3698
13239107
3765
1338559
3639
2008
02
2009 2010
17
2011
14
2012
09
12
0
1
2
18
16
Among the 10 biggest banks lower risk costs and improved margins offset high Opex
Notes Components in bold are direct components of the RoRWA calculation changes in red are negative trendsSources Banksrsquo financial statements 2008ndash2012 n=10 Bain analysis
2012 Change2008minus2012
2010 2011
Total RWA (euroB)
Total assets (euroB)
RWAtotal assets ()
Tier 1 ratio ()
Total Tier 1 (euroB)
Net interest incomeRWA ()
Financial marginRWA ()
Net interest incometotal assets ()
Financial margintotal assets ()
Net interest income + financial marginRWA ()
Fees + other revenuesRWA ()OpexRWA ()
Costincome ()
Opextotal assets ()
Loan-loss provisionsRWA ()
Nonperforming loan ratio ()
Coverage ratio ()
3639
13385
27
131
477
38
10
10
03
49
2452
71
14
12
45
54
+36
-02
+1 pts
+46 pts
+60
+05 pts
+18 pts
+02 pts
+05 pts
+23 pts
-06 pts+09 pts
-6 pts
+03 pts
+01 pts
+21 pts
-24 pts
3698
12395
30
115
426
37
14
11
04
51
2346
62
14
11
46
52
3765
13239
28
116
437
38
09
11
03
47
2648
65
14
11
44
53
2009
3474
11336
31
110
380
37
14
11
04
51
2244
60
13
17
35
71
3514
13409
26
85
299
33
-07
09
-02
26
3043
77
11
11
24
78
Cross-selling
Asset leverage
Balance-sheet management
Cost structure
Cost of risk
2008Components
7222019 Bain amp Co- European Banking Report
httpslidepdfcomreaderfullbain-co-european-banking-report 1532
European banking | Bain amp Company Inc
Page 13
Other large European banks have fallen well short of earning their cost of capital
The range represents the level of RoRWA required to cover the banksrsquo cost of capital and varies by bank size and country Analysis of 13 banks with assets of at leasteuro200 billion a universal bank business model and small to medium-sized subsidiaries outside their core geography (ABN AMRO Group BBVA Commerzbank Danske BankErste ING Intesa Sanpaolo KBC Lloyds Rabobank RBS Socieacuteteacute Geacuteneacuterale and Standard Chartered)Sources Banksrsquo financial statements 2008ndash2012 Bain analysis
RoRWA weighted average
RWA (euroB)
Total assets (euroB)
ROE ()
Range ofRoRWArequiredto coverthe costof capital
861607
3188
2008
01
822237
3468
2009
04
850978
3339
2010
867422
3214
2011
03
888640
3115
2012
06
10
0
1
2
18
16
Other large European banks had Opex lower than the big 10 which offset pressure on fee income and
higher cost of risk
Notes Components in bold are direct components of the RoRWA calculation changes in red are negative trendsSources Banksrsquo financial statements 2008ndash2012 n=13 Bain analysis
2012 Change2008minus2012
2010 2011
Total RWA (euroB)
Total assets (euroB)
RWAtotal assets ()
Tier 1 ratio ()
Total Tier 1 (euroB)
Net interest incomeRWA ()
Financial marginRWA ()
Net interest incometotal assets ()
Financial margintotal assets ()
Net interest income + financial marginRWA ()
Fees + other revenuesRWA ()OpexRWA ()
Costincome ()
Opextotal assets ()
Loan-loss provisionsRWA ()
Nonperforming loan ratio ()
Coverage ratio ()
3115
8886
35
129
402
35
12
12
04
47
1239
66
14
14
56
50
-23
+31
-19 pts
+39 pts
+40
+04 pts
+17 pts
+01 pts
+06 pts
+21 pts
-09 pts+02 pts
-12 pts
No change
+04 pts
+22 pts
+3 pts
3339
8509
39
114
382
34
11
13
04
45
1233
57
13
14
54
48
3214
8674
37
119
382
35
03
13
01
38
1739
70
14
14
57
48
2009
3468
8222
42
102
353
31
10
13
04
41
1532
58
14
19
50
46
3188
8616
37
90
287
31
-05
12
-02
26
2137
78
14
10
34
47
Cross-selling
Asset leverage
Balance-sheet management
Cost structure
Cost of risk
2008Components
7222019 Bain amp Co- European Banking Report
httpslidepdfcomreaderfullbain-co-european-banking-report 1632
European banking | Bain amp Company Inc
Page 14
Local banks have seen their RoRWA sharply deteriorate in recent years
The range represents the level of RoRWA required to cover the banksrsquo cost of capital and varies by bank size and country analysis of 65 banks operating exclusivelywithin a single national or regional marketSources Banksrsquo financial statements 2008ndash2012 Bain analysis
RoRWA weighted average
RWA (euroB)
Total assets (euroB)
ROE ()
Range ofRoRWArequiredto coverthe costof capital
10347
-68
4198
9571
20
3904
9462
59
3748
10044
20
3890
8948
-42
3293
2008
-06
2009
02
2010
07
2011
02
2012
-11
-2
-1
0
1
21816
Local banks have experienced sharp deleveraging higher cost of risk more nonperforming loans and flat revenues
Notes Components in bold are direct components of the RoRWA calculation changes in red are negative trendsSources Banksrsquo financial statements 2008ndash2012 n=65 Bain analysis
2012 Change2008minus2012
2010 2011
Total RWA (euroB)
Total assets (euroB)
RWAtotal assets ()
Tier 1 ratio ()
Total Tier 1 (euroB)
Net interest incomeRWA ()
Financial marginRWA ()
Net interest incometotal assets ()
Financial margintotal assets ()
Net interest income + financial marginRWA ()
Fees + other revenuesRWA ()OpexRWA ()
Costincome ()
Opextotal assets ()
Loan-loss provisionsRWA ()
Nonperforming loan ratio ()
Coverage ratio ()
3293
8948
37
139
457
28
06
10
02
34
1135
71
13
20
64
46
-215
-135
-38 pts
+44 pts
+15
+03 pts
+14 pts
No change
+06 pts
+17 pts
-05 pts+08 pts
-17 pts
+02 pts
+1 pts
+44 pts
-18 pts
3748
9462
40
113
422
28
05
11
02
33
1430
65
12
09
40
52
3890
10044
39
118
461
28
03
11
01
31
1532
69
13
12
43
51
2009
3904
9571
41
109
426
28
04
11
02
32
1430
65
12
14
36
51
4198
10347
41
94
396
25
-09
10
-04
16
1628
87
11
10
20
64
Cross-selling
Asset leverage
Balance-sheet management
Cost control
Cost of risk
2008Components
7222019 Bain amp Co- European Banking Report
httpslidepdfcomreaderfullbain-co-european-banking-report 1732
European banking | Bain amp Company Inc
Page 15
7222019 Bain amp Co- European Banking Report
httpslidepdfcomreaderfullbain-co-european-banking-report 1832
7222019 Bain amp Co- European Banking Report
httpslidepdfcomreaderfullbain-co-european-banking-report 1932
bull Countries with strong economic growth led the2012 RoRWA rankings Turkey took pole positionwith a 49 RoRWA In core Europe the Nordic
countries posed the strongest performance witha 19 RoRWA followed by Austria and theNetherlands The largest economies of Germanythe UK and France trailed behind
bull Banks in Italy Portugal Spain and Ireland whichhave been mired in the sovereign debt crisis anddeep economic recessions turned in the weakestRoRWA performances
bull Among the core European countries changes inRoRWAs from 2008 to 2012 stemmed mainly
from changes in three components net interestincome financial margin and loan-loss provisions
bull Countries that posted large positive changesmdashincluding Germany the Netherlands the Nordiccountries and the UKmdashbenefited from higherfinancial margins more control of operatingexpenditure and lower cost of risk Countries withlarge drops in RoRWAs were hurt by infl exiblecost structures which prevented them from shrinkingtheir production costs and a cost of risk that was
almost double the averagebull Northern Europe dominated the league tables
whether one looks at the 2012 leaders or themost improved banks For example the RoRWAleaders among both local and the 10 biggestbanks included banks in the Nordic countriesfollowed by those in the UK France Austria andthe Netherlands
bull In the most improved group banks in Switzer-land the Netherlands and Germany made a
strong showing
bull In high-growth countries Turkey and the Common-wealth of Independent States (CIS) took leadingpositions for the most improved banks and Turkeyfor the 2012 leaders
2Country and cluster
league tables
7222019 Bain amp Co- European Banking Report
httpslidepdfcomreaderfullbain-co-european-banking-report 2032
European banking | Bain amp Company Inc
Page 18
High-growth countries led the RoRWA rankings in 2012
Note For CIS the Netherlands Belgium Germany UK France Portugal and Spain one or two Tier-3 banks had not reported 2012 data by time of publicationso the analysis used 2011 data for those few banksSources Banksrsquo financial statements 2008ndash2012 n=121 Bain analysis
Rank 2012 RoRWA ()
Turkey
Poland
South Africa
CIS
Nordics
Austria
Netherlands
Belgium
Germany
UK
France
Switzerland
Italy
Portugal
Spain
Ireland
1
2
3
4
5
6
7
8
9
10
11
12
13
14
15
16
49
47
31
27
19
12
10
08
07
05
03
01
-06
-08
-17
-48
480
167
340
826
2357
334
2186
911
5514
7062
6320
1812
2127
426
2917
312
2012 total assets (euroB)Country 2008 RoRWA ()
33
41
35
10
13
19
-20
-25
-14
00
08
-76
07
10
19
10
7222019 Bain amp Co- European Banking Report
httpslidepdfcomreaderfullbain-co-european-banking-report 2132
European banking | Bain amp Company Inc
Page 19
In core European countries RoRWA changes from 2008 to 2012hellip
Note Averages are weighted for the total size of the respective components in each countrySources Banksrsquo financial statements 2008ndash2012 n=71 Bain analysis
RoRWA weighted average
-3
-2
-1
0
1
2
2008 average2012 average
UK
05
France
08
Germany
-14
07
Spain
19
-17
Nordics
13
19
Italy
07
-06
Netherlands
-20
10
2008 2012
0003
hellipwere spurred mainly by net interest income financial margin and loan-loss provisions
Note Averages are weighted for the total sizes of the respective indicators in each countrySources Banksrsquo financial statements 2008-2012 n=71 Bain analysis
NordicsGermany Spain
Total assets (euroB)
Total RWA (euroB)
Net interest incomeRWA ()
Financial marginRWA ()
Fees and commissions +other revenuesRWA ()
OpexRWA ()
Loan-loss provisionsRWA ()
France
7751
UK
2008 2012
AverageItaly Netherlands
7039
2474 2467
31 30
-02 12
26 15
41 42
14 10
5857 5715
1532 1327
26 38
-03 16
30 13
40 54
05 10
6054 5419
1534 1317
26 32
-19 07
14 17
27 43
08 06
1976 2917
1068 1315
36 43
06 06
17 10
27 35
13 41
1960 2357
790 735
27 32
-02 12
17 10
24 28
05 05
1990 2127
1266 1139
32 28
01 04
18 18
33 35
10 22
2263 2054
729 656
29 41
-17 06
15 10
39 38
09 09
2071 3947
928 1279
30 34
-05 10
17 14
32 41
08 15
7222019 Bain amp Co- European Banking Report
httpslidepdfcomreaderfullbain-co-european-banking-report 2232
European banking | Bain amp Company Inc
Page 20
These banks are the 2012 RoRWA leaders of their geographic cluster
Sources Banksrsquo financial statements 2008ndash2012 Bain analysis
Rank 2012 RoRWA ()
Nordics
UK
France
UK
Austria
Netherlands
Nordics
Nordics
Nordics
Turkey
Turkey
Turkey
1
2
3
1
2
3
1
2
3
1
2
3
19
18
16
23
17
16
40
39
36
158
132
48
Nordea
HSBC
BNP Paribas
Standard Chartered
Erste
ING
Swedbank
Sparebank 1 Group
Handelsbanken
Ziraat Bankasi
Akbank
Tuumlrkiye Halk
Bank Country 2008 RoRWA ()
16
08
06
24
19
02
20
NA
21
193
106
38
10biggest
Otherlarge
European
Local
High-growthcountries
These banks showed the biggest improvements in RoRWA over the past five years
Sources Banksrsquo financial statements 2008ndash2012 Bain analysis
Rank 2008ndash2012 change( points)
Switzerland
Switzerland
Germany
Belgium
UK
Netherlands
Netherlands
Belgium
Germany
CIS
Turkey
CIS
1
2
3
1
2
3
1
2
3
1
2
3
+83
+68
+21
+29
+26
+14
+64
+50
+33
+71
+26
+13
UBS
Credit Suisse
Deutsche Bank
KBC
RBS
ING
RBS Holdings NV
BNP Paribas Fortis
Bayerische Landesbank
Gazprombank
Akbank
VTB 24
Bank Country 2008 RoRWA ()
-92
-58
-19
-19
-37
02
-91
-45
-26
-56
106
05
10biggest
Otherlarge
European
Local
High-growthcountries
7222019 Bain amp Co- European Banking Report
httpslidepdfcomreaderfullbain-co-european-banking-report 2332
European banking | Bain amp Company Inc
Page 21
7222019 Bain amp Co- European Banking Report
httpslidepdfcomreaderfullbain-co-european-banking-report 2432
7222019 Bain amp Co- European Banking Report
httpslidepdfcomreaderfullbain-co-european-banking-report 2532
bull Europersquos environment continues to be volatile andinvestors are seeking better information about abankrsquos stability asset quality and key factors that
generate value RoRWA plays a useful role hereby focusing on the balance sheetmdashwhich enablescomparison between a bank and its peersmdashand byidentifying the factors influencing bank performance
bull Banks still need to address challenges along eachdimension of RoRWA in order to lift their profit-ability levels above the cost of capital In recent
years the profitability of lending assets has beensustained mainly by the fi nancial componentsincluding a boost from LTRO To raise asset prof-itability banks will have to better manage their
capital allocations and risk profilesbull The pressure on fee income will continue To offset
that trend banks should turn to their close clientrelationships for new sources of revenues
bull Lowering operating costs is the dimension thatwarrants managementrsquos attention at any bankregardless of size or location Initiatives that havethe greatest potential for tackling structural costsinclude adopting digital technologies and modern-izing IT platforms optimizing processes from endto end through outsourcing offshoring and other
means and expanding global procurement Suchinitiatives are essential for survival in an industrygoing through discontinuous change
bull Deleveraging the loan portfolio for riskier clients isa pressing issue which still poses significant threatsfor local banks In countries with a higher cost ofrisk and stagnant or negative GDP growth rateslocal banks may face further painful restructuring
bull Astute management of the cost of risk includingtaking a portfolio perspective offers opportunities
for most banksmdashin part to meet the new require-ments of Basel III and reassure rating agencies
bull Further consolidation of the local and other largebanks over the coming years will likely benefitthe 10 biggest banks and those in high-growthcountries These high-growth countries offer thegreatest opportunities for RoRWA growth for largeand pan-European players looking to diversifytheir portfolios
3Strategic
perspectives and
implications for
management
7222019 Bain amp Co- European Banking Report
httpslidepdfcomreaderfullbain-co-european-banking-report 2632
European banking | Bain amp Company Inc
Page 24
Significant restructuring is warranted for all banks but the nature of the challenge varies by geography
Source Bain analysis
10 biggest Strategic issueHigh-growth
countries
Other large
EuropeanLocal
Cross-selling
Balance-sheet
management
Cost structure
Cost of risk
Major threatThreatOpportunityMajor opportunity
Profitability of the asset portfolio has been sustained mainly by the
financial component Deleveraging of the loan portfolio for riskier
clients has been only partially successful and the risk profile of
the portfolio still has a long way to go
To counter pressure on fees banks should work systematically on
cross-selling opportunities through initiatives like client-focused
service models and CRM support
To further reduce costs banks should pursue new digital technologies
optimized processes through such means as outsourcing and offshoring
modernized IT platforms and global procurement initiatives
Active management of cost of risk demands more systematic solutions
bull NPL and LLP trends are threatening the stability of the overall
system and not only in individual countries such as Greece
bull Management of risky clients has become a core business and capability
bull Managing costs of risk demands an integrated portfolio approach
7222019 Bain amp Co- European Banking Report
httpslidepdfcomreaderfullbain-co-european-banking-report 2732
European banking | Bain amp Company Inc
Page 25
Assets (euroB)
Erste (AT)
Raiffeisen Bank (AT)
BNP Paribas Fortis
KBC
Belfius Banque
ING Belgium SANV
Creacutedit Agricole Groupe
BNP Paribas
Groupe Socieacuteteacute Geacuteneacuterale
Groupe BPCE
Creacutedit Mutuel
Deutsche Bank
Commerzbank AGKfW
DZ Bank AG
UniCredit Bank AG
2138
1202
2723
2569
2129
1691
17930
15439
12307
11475
6051
20123
63595116
4072
3483
Austria
Belgium
France
Germany
Country Bank Cluster
Other large
Local
Local
Other large
Local
Local
10 biggest
10 biggest
Other large
Local
Local
10 biggest
Other largeLocal
Local
Local
Ireland
Landesbank Baden-Wuumlrttemberg
Bayerische Landesbank
NORDLB
Helaba
HSH Nordbank
DekaBank
Landesbank Berlin Holding
Santander Consumer Bank
Hamburger Sparkasse
Deutsche Apotheker - und Aumlrztebank
Sparkasse KoumllnBonn
Kreissparkasse Koumlln
Bank of Ireland
Allied Irish Banks
permanent tsb Group Hldgs Plc
Intesa Sanpaolo
3363
2868
2256
1993
1306
1297
1183
403
396
379
299
248
1481
1225
409
6735
Local
Local
Local
Local
Local
Local
Local
Local
Local
Local
Local
Local
Other large
10 biggest
Local
Other large
Unicredit Group
Monte dei Paschi di Siena
4639
2189
10 biggest
Local
UBI Banca Group
Banco Popolare
BNL
Banca Popolare dellrsquoEmilia Romagna
Banca Popolare di Milano
Gruppo Banca Carige
Cariparma
Banca Popolare di Vicenza
Veneto Banca
1324
1319
912
616
525
493
493
467
402
Local
Local
Local
Local
Local
Local
Local
Local
Local
Italy
2011 assets
Bca Popdi Sondrio 322 Local
Credito Emiliano
Credito Valtellinese
Banca delle Marche
307
299
227
Local
Local
Local
List of banks analyzed by country and assets
10 biggest other large local
7222019 Bain amp Co- European Banking Report
httpslidepdfcomreaderfullbain-co-european-banking-report 2832
European banking | Bain amp Company Inc
Page 26
Assets (euroB)Country Bank Cluster
ING
Rabobank Group
ABN AMRO Group
SNS Reaal
RBS Holdings NV
8361
7524
3944
1322
710
Netherlands
Other large
Other large
Other large
Local
Local
Nordea 6774 10 biggest
Danske Bank
DNB
4682
3028
Other large
Local
SEB
Handelsbanken
Swedbank
Pohjola Bank
2818
2742
2121
998
Local
Local
Local
Local
Nordics
Jyske Bank 347 Local
Sparebank 1 Group 62 Local
Caixa Geral de Depositos 1169 Local
Millenium BCP
Banco Espiacuterito Santo
897
837
Local
Local
Banco BPI
Santander Totta SGPS
Caixa Econoacutemica Montepio Geral
Creacutedito Agriacutecola Muacutetuo
446
414
215
142
Local
Local
Local
Local
Portugal
BANIF 140 Local
SantanderBBVA
la Caixa
Banco Financiero y de Ahorros
Banco Sabadell SA
122826378
3591
3092
1615
Spain
10 biggestOther large
Local
Local
Local
Banco Popular
Banco Mare Nostrum
1576
634
Local
Local
UBS
Credit Suisse
10448
7669Switzerland
10 biggest
10 biggest
HSBC 20939 10 biggest
Barclays
Royal Bank of Scotland
17603
11521
10 biggest
Other large
Lloyds Banking Group
Standard Chartered
Nationwide Building Society
Co-operative Bank
11395
4950
2417
611
Other large
Other large
Local
Local
UK
Clydesdale Bank 545 Local
Yorkshire Building Society 413 Local
Virgin Money 223 Local
2011 assets
List of banks analyzed by country and assets
10 biggest other large localmdashcontinued
7222019 Bain amp Co- European Banking Report
httpslidepdfcomreaderfullbain-co-european-banking-report 2932
European banking | Bain amp Company Inc
Page 27
Assets (euroB)
Sberbank
VTB 24
PKO BP
Bank Pekao
BRE Bank
ING Bank Slaski
Standard Bank
Absa
FirstRand
Nedbank
Investec
Tuumlrkiye İş Bankası
Tuumlrkiye Garanti
Ziraat Bankasi
Akbank
Yapı ve Kredi
3781
1857
463
361
244
187
928
766
729
647
330
869
777
708
706
568
CIS
Poland
South Africa
Turkey
Country Bank
Tuumlrkiye Halk Bankasi
Tuumlrkiye Vakıflar
Finansbank
471
467
239
Gazprombank
Russian Agricultural Bank
Alfa-Bank
Nomos-Bank
UniCredit Bank Russia
712
358
357
225
218
AKB Rosbank
Promsvyazbank
ZAO Raiffeisenbank
URALSIB Bank
Russian Standard Bank
AKB Probusinessbank
200
173
160
113
74
35
2011 assets
Bank Zachodni WBK + Kredyt Bank
Getin NobleBank
Bank Millennium
143
141
126
List of banks analyzed by country and assets
High-growth countries
7222019 Bain amp Co- European Banking Report
httpslidepdfcomreaderfullbain-co-european-banking-report 3032
European banking | Bain amp Company Inc
Page 28
Key contacts in Bainrsquos European Financial Services practice
Franco Baronio in Milan (francobaroniobaincom)Rocco DrsquoAcunto in Milan (roccodacuntobaincom)
Ada Di Marzo in Paris (adadimarzobaincom)
Bertrand Facq in Warsaw (bertrandfacqbaincom)
Fabrice Franzen in Johannesburg (fabricefranzenbaincom)
Thomas Herbeck in Frankfurt (thomasherbeckbaincom)
Karaca Kestelli in Istanbul (karacakestellibaincom)
Nicolaacutes Lopez in Madrid (nicolaslopezbaincom)
Niels Peder Nielsen in Copenhagen (nielspedernielsenbaincom)
Andrea Oldrini in Milan (andreaoldrinibaincom)
Mathijs Robbens in Amsterdam (mathijsrobbensbaincom)
Visar Sala in Moscow (visarsalabaincom)
Walter Sinn in Frankfurt (waltersinnbaincom)Joatildeo Soares in London (joaosoaresbaincom)
Acknowledgments
The authors would like to thank the following Bain colleagues for their valuable support in producing this report
Sonal Chawla Christian Duus Franccedilois Fastrez Farsan Ghassim and Shikha Mahato
See these related Bain perspectives at wwwbaincom
bull Managing risk and capital
bull How Europersquos banks can return to health
bull The digital challenge to retail banks
7222019 Bain amp Co- European Banking Report
httpslidepdfcomreaderfullbain-co-european-banking-report 3132
7222019 Bain amp Co- European Banking Report
httpslidepdfcomreaderfullbain-co-european-banking-report 3232
For more information visit wwwbaincom
Share983140 983105m983138io983150 Tru Rs983157983148ts
Bain amp Company is the management consulting firm that the worldrsquos business leaders come to whenthey want results
Bain advises clients on strategy operations technology organization private equity and mergers and acquisitions We develop
practical customized insights that clients act on and transfer skills that make change stick Founded in 1973 Bain has
48 offices in 31 countries and our deep expertise and client roster cross every industry and economic sector Our clients
have outperformed the stock market 4 to 1
What sets us apart
We believe a consulting firm should be more than an adviser So we put ourselves in our clientsrsquo shoes selling outcomes not
projects We align our incentives with our clientsrsquo by linking our fees to their results and collaborate to unlock the full potential
of their business Our Results Deliveryreg process builds our clientsrsquo capabilities and our True North values mean we do theright thing for our clients people and communitiesmdashalways
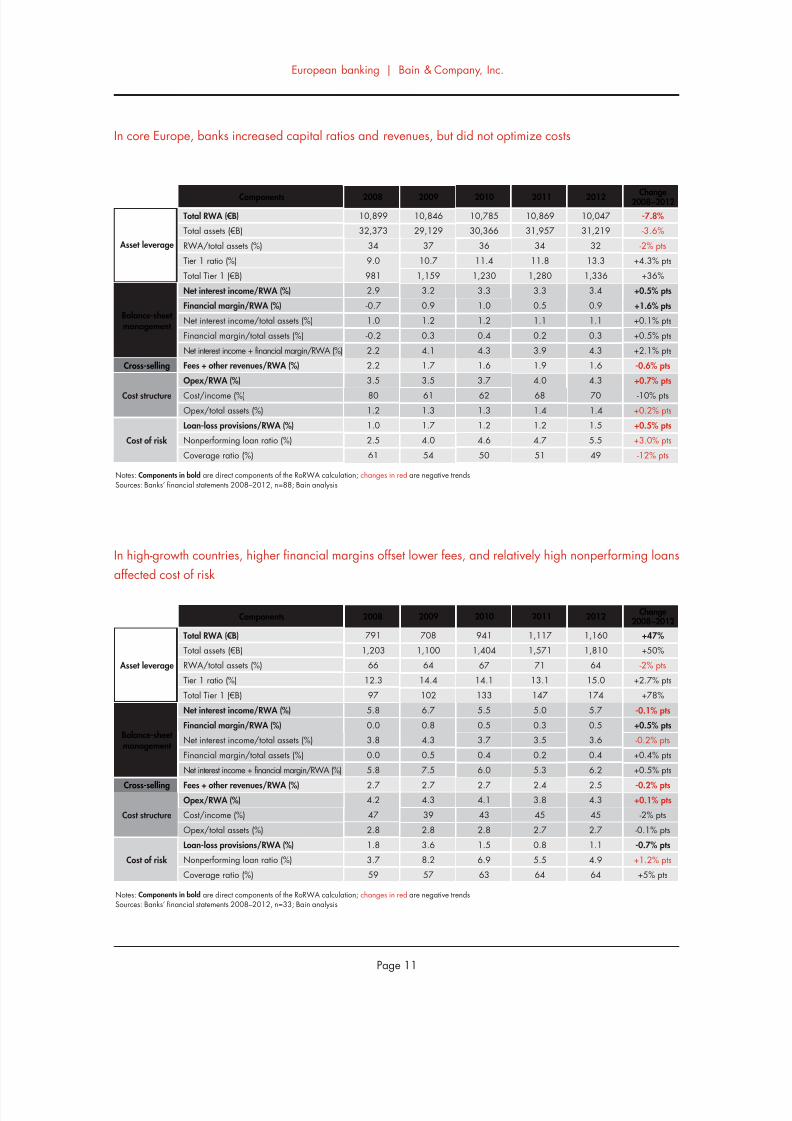
7222019 Bain amp Co- European Banking Report
httpslidepdfcomreaderfullbain-co-european-banking-report 1332
European banking | Bain amp Company Inc
Page 11
In core Europe banks increased capital ratios and revenues but did not optimize costs
Notes Components in bold are direct components of the RoRWA calculation changes in red are negative trendsSources Banksrsquo financial statements 2008ndash2012 n=88 Bain analysis
2012 Change2008minus20122010 2011
Total RWA (euroB)
Total assets (euroB)
RWAtotal assets ()
Tier 1 ratio ()
Total Tier 1 (euroB)
Net interest incomeRWA ()
Financial marginRWA ()
Net interest incometotal assets ()
Financial margintotal assets ()
Net interest income + financial marginRWA ()
Fees + other revenuesRWA ()
OpexRWA ()
Costincome ()
Loan-loss provisionsRWA ()
Nonperforming loan ratio ()
Coverage ratio ()
10047
31219
32
133
1336
34
09
11
03
43
16
43
70
15
55
49
-78
-36
-2 pts
+43 pts
+36
+05 pts
+16 pts
+01 pts
+05 pts
+21 pts
-06 pts
+07 pts
-10 pts
+05 pts
+30 pts
-12 pts
10785
30366
36
114
1230
33
10
12
04
43
16
37
62
12
46
50
10869
31957
34
118
1280
33
05
11
02
39
19
40
68
12
47
51
2009
10846
29129
37
107
1159
32
09
12
03
41
17
35
61
17
40
54
10899
32373
34
90
981
29
-07
10
-02
22
22
35
80Opextotal assets () 14 +02 pts13 141312
10
25
61
Cross-selling
Asset leverage
Balance-sheet management
Cost structure
Cost of risk
2008Components
In high-growth countries higher financial margins offset lower fees and relatively high nonperforming loans
affected cost of risk
Notes Components in bold are direct components of the RoRWA calculation changes in red are negative trendsSources Banksrsquo financial statements 2008ndash2012 n=33 Bain analysis
2012 Change2008minus2012
2010 2011
Total RWA (euroB)
Total assets (euroB)
RWAtotal assets ()
Tier 1 ratio ()
Total Tier 1 (euroB)
Net interest incomeRWA ()
Financial marginRWA ()
Net interest incometotal assets ()
Financial margintotal assets ()
Net interest income + financial marginRWA ()
Fees + other revenuesRWA ()OpexRWA ()
Costincome ()
Opextotal assets ()
Loan-loss provisionsRWA ()
Nonperforming loan ratio ()
Coverage ratio ()
1160
1810
64
150
174
57
05
36
04
62
2543
45
27
11
49
64
+47
+50
-2 pts
+27 pts
+78
-01 pts
+05 pts
-02 pts
+04 pts
+05 pts
-02 pts+01 pts
-2 pts
-01 pts
-07 pts
+12 pts
+5 pts
941
1404
67
141
133
55
05
37
04
60
2741
43
28
15
69
63
1117
1571
71
131
147
50
03
35
02
53
2438
45
27
08
55
64
2009
708
1100
64
144
102
67
08
43
05
75
2743
39
28
36
82
57
791
1203
66
123
97
58
00
38
00
58
2742
47
28
18
37
59
Cross-selling
Asset leverage
Balance-sheet management
Cost structure
Cost of risk
2008Components
7222019 Bain amp Co- European Banking Report
httpslidepdfcomreaderfullbain-co-european-banking-report 1432
European banking | Bain amp Company Inc
Page 12
Europersquos 10 biggest banks come closest to earning their cost of capital
The range represents the level of RoRWA required to cover the banksrsquo cost of capital and varies by bank size and country Analysis of the 10 largest Europe-headquarteredbanks by market capitalization with a pan-European presence a universal bank business model and assets of at least euro650 billion (Barclays BNP ParibasCreacutedit Agricole Credit Suisse Deutsche Bank HSBC Nordea Santander UBS and UniCredit)Sources Banksrsquo financial statements 2008ndash2012 Bain analysis
RoRWA weighted average
RWA (euroB)
1340922
3514
1133694
3474
Total assets (euroB)
ROE ()
Range ofRoRWArequiredto coverthe costof capital
12395123
3698
13239107
3765
1338559
3639
2008
02
2009 2010
17
2011
14
2012
09
12
0
1
2
18
16
Among the 10 biggest banks lower risk costs and improved margins offset high Opex
Notes Components in bold are direct components of the RoRWA calculation changes in red are negative trendsSources Banksrsquo financial statements 2008ndash2012 n=10 Bain analysis
2012 Change2008minus2012
2010 2011
Total RWA (euroB)
Total assets (euroB)
RWAtotal assets ()
Tier 1 ratio ()
Total Tier 1 (euroB)
Net interest incomeRWA ()
Financial marginRWA ()
Net interest incometotal assets ()
Financial margintotal assets ()
Net interest income + financial marginRWA ()
Fees + other revenuesRWA ()OpexRWA ()
Costincome ()
Opextotal assets ()
Loan-loss provisionsRWA ()
Nonperforming loan ratio ()
Coverage ratio ()
3639
13385
27
131
477
38
10
10
03
49
2452
71
14
12
45
54
+36
-02
+1 pts
+46 pts
+60
+05 pts
+18 pts
+02 pts
+05 pts
+23 pts
-06 pts+09 pts
-6 pts
+03 pts
+01 pts
+21 pts
-24 pts
3698
12395
30
115
426
37
14
11
04
51
2346
62
14
11
46
52
3765
13239
28
116
437
38
09
11
03
47
2648
65
14
11
44
53
2009
3474
11336
31
110
380
37
14
11
04
51
2244
60
13
17
35
71
3514
13409
26
85
299
33
-07
09
-02
26
3043
77
11
11
24
78
Cross-selling
Asset leverage
Balance-sheet management
Cost structure
Cost of risk
2008Components
7222019 Bain amp Co- European Banking Report
httpslidepdfcomreaderfullbain-co-european-banking-report 1532
European banking | Bain amp Company Inc
Page 13
Other large European banks have fallen well short of earning their cost of capital
The range represents the level of RoRWA required to cover the banksrsquo cost of capital and varies by bank size and country Analysis of 13 banks with assets of at leasteuro200 billion a universal bank business model and small to medium-sized subsidiaries outside their core geography (ABN AMRO Group BBVA Commerzbank Danske BankErste ING Intesa Sanpaolo KBC Lloyds Rabobank RBS Socieacuteteacute Geacuteneacuterale and Standard Chartered)Sources Banksrsquo financial statements 2008ndash2012 Bain analysis
RoRWA weighted average
RWA (euroB)
Total assets (euroB)
ROE ()
Range ofRoRWArequiredto coverthe costof capital
861607
3188
2008
01
822237
3468
2009
04
850978
3339
2010
867422
3214
2011
03
888640
3115
2012
06
10
0
1
2
18
16
Other large European banks had Opex lower than the big 10 which offset pressure on fee income and
higher cost of risk
Notes Components in bold are direct components of the RoRWA calculation changes in red are negative trendsSources Banksrsquo financial statements 2008ndash2012 n=13 Bain analysis
2012 Change2008minus2012
2010 2011
Total RWA (euroB)
Total assets (euroB)
RWAtotal assets ()
Tier 1 ratio ()
Total Tier 1 (euroB)
Net interest incomeRWA ()
Financial marginRWA ()
Net interest incometotal assets ()
Financial margintotal assets ()
Net interest income + financial marginRWA ()
Fees + other revenuesRWA ()OpexRWA ()
Costincome ()
Opextotal assets ()
Loan-loss provisionsRWA ()
Nonperforming loan ratio ()
Coverage ratio ()
3115
8886
35
129
402
35
12
12
04
47
1239
66
14
14
56
50
-23
+31
-19 pts
+39 pts
+40
+04 pts
+17 pts
+01 pts
+06 pts
+21 pts
-09 pts+02 pts
-12 pts
No change
+04 pts
+22 pts
+3 pts
3339
8509
39
114
382
34
11
13
04
45
1233
57
13
14
54
48
3214
8674
37
119
382
35
03
13
01
38
1739
70
14
14
57
48
2009
3468
8222
42
102
353
31
10
13
04
41
1532
58
14
19
50
46
3188
8616
37
90
287
31
-05
12
-02
26
2137
78
14
10
34
47
Cross-selling
Asset leverage
Balance-sheet management
Cost structure
Cost of risk
2008Components
7222019 Bain amp Co- European Banking Report
httpslidepdfcomreaderfullbain-co-european-banking-report 1632
European banking | Bain amp Company Inc
Page 14
Local banks have seen their RoRWA sharply deteriorate in recent years
The range represents the level of RoRWA required to cover the banksrsquo cost of capital and varies by bank size and country analysis of 65 banks operating exclusivelywithin a single national or regional marketSources Banksrsquo financial statements 2008ndash2012 Bain analysis
RoRWA weighted average
RWA (euroB)
Total assets (euroB)
ROE ()
Range ofRoRWArequiredto coverthe costof capital
10347
-68
4198
9571
20
3904
9462
59
3748
10044
20
3890
8948
-42
3293
2008
-06
2009
02
2010
07
2011
02
2012
-11
-2
-1
0
1
21816
Local banks have experienced sharp deleveraging higher cost of risk more nonperforming loans and flat revenues
Notes Components in bold are direct components of the RoRWA calculation changes in red are negative trendsSources Banksrsquo financial statements 2008ndash2012 n=65 Bain analysis
2012 Change2008minus2012
2010 2011
Total RWA (euroB)
Total assets (euroB)
RWAtotal assets ()
Tier 1 ratio ()
Total Tier 1 (euroB)
Net interest incomeRWA ()
Financial marginRWA ()
Net interest incometotal assets ()
Financial margintotal assets ()
Net interest income + financial marginRWA ()
Fees + other revenuesRWA ()OpexRWA ()
Costincome ()
Opextotal assets ()
Loan-loss provisionsRWA ()
Nonperforming loan ratio ()
Coverage ratio ()
3293
8948
37
139
457
28
06
10
02
34
1135
71
13
20
64
46
-215
-135
-38 pts
+44 pts
+15
+03 pts
+14 pts
No change
+06 pts
+17 pts
-05 pts+08 pts
-17 pts
+02 pts
+1 pts
+44 pts
-18 pts
3748
9462
40
113
422
28
05
11
02
33
1430
65
12
09
40
52
3890
10044
39
118
461
28
03
11
01
31
1532
69
13
12
43
51
2009
3904
9571
41
109
426
28
04
11
02
32
1430
65
12
14
36
51
4198
10347
41
94
396
25
-09
10
-04
16
1628
87
11
10
20
64
Cross-selling
Asset leverage
Balance-sheet management
Cost control
Cost of risk
2008Components
7222019 Bain amp Co- European Banking Report
httpslidepdfcomreaderfullbain-co-european-banking-report 1732
European banking | Bain amp Company Inc
Page 15
7222019 Bain amp Co- European Banking Report
httpslidepdfcomreaderfullbain-co-european-banking-report 1832
7222019 Bain amp Co- European Banking Report
httpslidepdfcomreaderfullbain-co-european-banking-report 1932
bull Countries with strong economic growth led the2012 RoRWA rankings Turkey took pole positionwith a 49 RoRWA In core Europe the Nordic
countries posed the strongest performance witha 19 RoRWA followed by Austria and theNetherlands The largest economies of Germanythe UK and France trailed behind
bull Banks in Italy Portugal Spain and Ireland whichhave been mired in the sovereign debt crisis anddeep economic recessions turned in the weakestRoRWA performances
bull Among the core European countries changes inRoRWAs from 2008 to 2012 stemmed mainly
from changes in three components net interestincome financial margin and loan-loss provisions
bull Countries that posted large positive changesmdashincluding Germany the Netherlands the Nordiccountries and the UKmdashbenefited from higherfinancial margins more control of operatingexpenditure and lower cost of risk Countries withlarge drops in RoRWAs were hurt by infl exiblecost structures which prevented them from shrinkingtheir production costs and a cost of risk that was
almost double the averagebull Northern Europe dominated the league tables
whether one looks at the 2012 leaders or themost improved banks For example the RoRWAleaders among both local and the 10 biggestbanks included banks in the Nordic countriesfollowed by those in the UK France Austria andthe Netherlands
bull In the most improved group banks in Switzer-land the Netherlands and Germany made a
strong showing
bull In high-growth countries Turkey and the Common-wealth of Independent States (CIS) took leadingpositions for the most improved banks and Turkeyfor the 2012 leaders
2Country and cluster
league tables
7222019 Bain amp Co- European Banking Report
httpslidepdfcomreaderfullbain-co-european-banking-report 2032
European banking | Bain amp Company Inc
Page 18
High-growth countries led the RoRWA rankings in 2012
Note For CIS the Netherlands Belgium Germany UK France Portugal and Spain one or two Tier-3 banks had not reported 2012 data by time of publicationso the analysis used 2011 data for those few banksSources Banksrsquo financial statements 2008ndash2012 n=121 Bain analysis
Rank 2012 RoRWA ()
Turkey
Poland
South Africa
CIS
Nordics
Austria
Netherlands
Belgium
Germany
UK
France
Switzerland
Italy
Portugal
Spain
Ireland
1
2
3
4
5
6
7
8
9
10
11
12
13
14
15
16
49
47
31
27
19
12
10
08
07
05
03
01
-06
-08
-17
-48
480
167
340
826
2357
334
2186
911
5514
7062
6320
1812
2127
426
2917
312
2012 total assets (euroB)Country 2008 RoRWA ()
33
41
35
10
13
19
-20
-25
-14
00
08
-76
07
10
19
10
7222019 Bain amp Co- European Banking Report
httpslidepdfcomreaderfullbain-co-european-banking-report 2132
European banking | Bain amp Company Inc
Page 19
In core European countries RoRWA changes from 2008 to 2012hellip
Note Averages are weighted for the total size of the respective components in each countrySources Banksrsquo financial statements 2008ndash2012 n=71 Bain analysis
RoRWA weighted average
-3
-2
-1
0
1
2
2008 average2012 average
UK
05
France
08
Germany
-14
07
Spain
19
-17
Nordics
13
19
Italy
07
-06
Netherlands
-20
10
2008 2012
0003
hellipwere spurred mainly by net interest income financial margin and loan-loss provisions
Note Averages are weighted for the total sizes of the respective indicators in each countrySources Banksrsquo financial statements 2008-2012 n=71 Bain analysis
NordicsGermany Spain
Total assets (euroB)
Total RWA (euroB)
Net interest incomeRWA ()
Financial marginRWA ()
Fees and commissions +other revenuesRWA ()
OpexRWA ()
Loan-loss provisionsRWA ()
France
7751
UK
2008 2012
AverageItaly Netherlands
7039
2474 2467
31 30
-02 12
26 15
41 42
14 10
5857 5715
1532 1327
26 38
-03 16
30 13
40 54
05 10
6054 5419
1534 1317
26 32
-19 07
14 17
27 43
08 06
1976 2917
1068 1315
36 43
06 06
17 10
27 35
13 41
1960 2357
790 735
27 32
-02 12
17 10
24 28
05 05
1990 2127
1266 1139
32 28
01 04
18 18
33 35
10 22
2263 2054
729 656
29 41
-17 06
15 10
39 38
09 09
2071 3947
928 1279
30 34
-05 10
17 14
32 41
08 15
7222019 Bain amp Co- European Banking Report
httpslidepdfcomreaderfullbain-co-european-banking-report 2232
European banking | Bain amp Company Inc
Page 20
These banks are the 2012 RoRWA leaders of their geographic cluster
Sources Banksrsquo financial statements 2008ndash2012 Bain analysis
Rank 2012 RoRWA ()
Nordics
UK
France
UK
Austria
Netherlands
Nordics
Nordics
Nordics
Turkey
Turkey
Turkey
1
2
3
1
2
3
1
2
3
1
2
3
19
18
16
23
17
16
40
39
36
158
132
48
Nordea
HSBC
BNP Paribas
Standard Chartered
Erste
ING
Swedbank
Sparebank 1 Group
Handelsbanken
Ziraat Bankasi
Akbank
Tuumlrkiye Halk
Bank Country 2008 RoRWA ()
16
08
06
24
19
02
20
NA
21
193
106
38
10biggest
Otherlarge
European
Local
High-growthcountries
These banks showed the biggest improvements in RoRWA over the past five years
Sources Banksrsquo financial statements 2008ndash2012 Bain analysis
Rank 2008ndash2012 change( points)
Switzerland
Switzerland
Germany
Belgium
UK
Netherlands
Netherlands
Belgium
Germany
CIS
Turkey
CIS
1
2
3
1
2
3
1
2
3
1
2
3
+83
+68
+21
+29
+26
+14
+64
+50
+33
+71
+26
+13
UBS
Credit Suisse
Deutsche Bank
KBC
RBS
ING
RBS Holdings NV
BNP Paribas Fortis
Bayerische Landesbank
Gazprombank
Akbank
VTB 24
Bank Country 2008 RoRWA ()
-92
-58
-19
-19
-37
02
-91
-45
-26
-56
106
05
10biggest
Otherlarge
European
Local
High-growthcountries
7222019 Bain amp Co- European Banking Report
httpslidepdfcomreaderfullbain-co-european-banking-report 2332
European banking | Bain amp Company Inc
Page 21
7222019 Bain amp Co- European Banking Report
httpslidepdfcomreaderfullbain-co-european-banking-report 2432
7222019 Bain amp Co- European Banking Report
httpslidepdfcomreaderfullbain-co-european-banking-report 2532
bull Europersquos environment continues to be volatile andinvestors are seeking better information about abankrsquos stability asset quality and key factors that
generate value RoRWA plays a useful role hereby focusing on the balance sheetmdashwhich enablescomparison between a bank and its peersmdashand byidentifying the factors influencing bank performance
bull Banks still need to address challenges along eachdimension of RoRWA in order to lift their profit-ability levels above the cost of capital In recent
years the profitability of lending assets has beensustained mainly by the fi nancial componentsincluding a boost from LTRO To raise asset prof-itability banks will have to better manage their
capital allocations and risk profilesbull The pressure on fee income will continue To offset
that trend banks should turn to their close clientrelationships for new sources of revenues
bull Lowering operating costs is the dimension thatwarrants managementrsquos attention at any bankregardless of size or location Initiatives that havethe greatest potential for tackling structural costsinclude adopting digital technologies and modern-izing IT platforms optimizing processes from endto end through outsourcing offshoring and other
means and expanding global procurement Suchinitiatives are essential for survival in an industrygoing through discontinuous change
bull Deleveraging the loan portfolio for riskier clients isa pressing issue which still poses significant threatsfor local banks In countries with a higher cost ofrisk and stagnant or negative GDP growth rateslocal banks may face further painful restructuring
bull Astute management of the cost of risk includingtaking a portfolio perspective offers opportunities
for most banksmdashin part to meet the new require-ments of Basel III and reassure rating agencies
bull Further consolidation of the local and other largebanks over the coming years will likely benefitthe 10 biggest banks and those in high-growthcountries These high-growth countries offer thegreatest opportunities for RoRWA growth for largeand pan-European players looking to diversifytheir portfolios
3Strategic
perspectives and
implications for
management
7222019 Bain amp Co- European Banking Report
httpslidepdfcomreaderfullbain-co-european-banking-report 2632
European banking | Bain amp Company Inc
Page 24
Significant restructuring is warranted for all banks but the nature of the challenge varies by geography
Source Bain analysis
10 biggest Strategic issueHigh-growth
countries
Other large
EuropeanLocal
Cross-selling
Balance-sheet
management
Cost structure
Cost of risk
Major threatThreatOpportunityMajor opportunity
Profitability of the asset portfolio has been sustained mainly by the
financial component Deleveraging of the loan portfolio for riskier
clients has been only partially successful and the risk profile of
the portfolio still has a long way to go
To counter pressure on fees banks should work systematically on
cross-selling opportunities through initiatives like client-focused
service models and CRM support
To further reduce costs banks should pursue new digital technologies
optimized processes through such means as outsourcing and offshoring
modernized IT platforms and global procurement initiatives
Active management of cost of risk demands more systematic solutions
bull NPL and LLP trends are threatening the stability of the overall
system and not only in individual countries such as Greece
bull Management of risky clients has become a core business and capability
bull Managing costs of risk demands an integrated portfolio approach
7222019 Bain amp Co- European Banking Report
httpslidepdfcomreaderfullbain-co-european-banking-report 2732
European banking | Bain amp Company Inc
Page 25
Assets (euroB)
Erste (AT)
Raiffeisen Bank (AT)
BNP Paribas Fortis
KBC
Belfius Banque
ING Belgium SANV
Creacutedit Agricole Groupe
BNP Paribas
Groupe Socieacuteteacute Geacuteneacuterale
Groupe BPCE
Creacutedit Mutuel
Deutsche Bank
Commerzbank AGKfW
DZ Bank AG
UniCredit Bank AG
2138
1202
2723
2569
2129
1691
17930
15439
12307
11475
6051
20123
63595116
4072
3483
Austria
Belgium
France
Germany
Country Bank Cluster
Other large
Local
Local
Other large
Local
Local
10 biggest
10 biggest
Other large
Local
Local
10 biggest
Other largeLocal
Local
Local
Ireland
Landesbank Baden-Wuumlrttemberg
Bayerische Landesbank
NORDLB
Helaba
HSH Nordbank
DekaBank
Landesbank Berlin Holding
Santander Consumer Bank
Hamburger Sparkasse
Deutsche Apotheker - und Aumlrztebank
Sparkasse KoumllnBonn
Kreissparkasse Koumlln
Bank of Ireland
Allied Irish Banks
permanent tsb Group Hldgs Plc
Intesa Sanpaolo
3363
2868
2256
1993
1306
1297
1183
403
396
379
299
248
1481
1225
409
6735
Local
Local
Local
Local
Local
Local
Local
Local
Local
Local
Local
Local
Other large
10 biggest
Local
Other large
Unicredit Group
Monte dei Paschi di Siena
4639
2189
10 biggest
Local
UBI Banca Group
Banco Popolare
BNL
Banca Popolare dellrsquoEmilia Romagna
Banca Popolare di Milano
Gruppo Banca Carige
Cariparma
Banca Popolare di Vicenza
Veneto Banca
1324
1319
912
616
525
493
493
467
402
Local
Local
Local
Local
Local
Local
Local
Local
Local
Italy
2011 assets
Bca Popdi Sondrio 322 Local
Credito Emiliano
Credito Valtellinese
Banca delle Marche
307
299
227
Local
Local
Local
List of banks analyzed by country and assets
10 biggest other large local
7222019 Bain amp Co- European Banking Report
httpslidepdfcomreaderfullbain-co-european-banking-report 2832
European banking | Bain amp Company Inc
Page 26
Assets (euroB)Country Bank Cluster
ING
Rabobank Group
ABN AMRO Group
SNS Reaal
RBS Holdings NV
8361
7524
3944
1322
710
Netherlands
Other large
Other large
Other large
Local
Local
Nordea 6774 10 biggest
Danske Bank
DNB
4682
3028
Other large
Local
SEB
Handelsbanken
Swedbank
Pohjola Bank
2818
2742
2121
998
Local
Local
Local
Local
Nordics
Jyske Bank 347 Local
Sparebank 1 Group 62 Local
Caixa Geral de Depositos 1169 Local
Millenium BCP
Banco Espiacuterito Santo
897
837
Local
Local
Banco BPI
Santander Totta SGPS
Caixa Econoacutemica Montepio Geral
Creacutedito Agriacutecola Muacutetuo
446
414
215
142
Local
Local
Local
Local
Portugal
BANIF 140 Local
SantanderBBVA
la Caixa
Banco Financiero y de Ahorros
Banco Sabadell SA
122826378
3591
3092
1615
Spain
10 biggestOther large
Local
Local
Local
Banco Popular
Banco Mare Nostrum
1576
634
Local
Local
UBS
Credit Suisse
10448
7669Switzerland
10 biggest
10 biggest
HSBC 20939 10 biggest
Barclays
Royal Bank of Scotland
17603
11521
10 biggest
Other large
Lloyds Banking Group
Standard Chartered
Nationwide Building Society
Co-operative Bank
11395
4950
2417
611
Other large
Other large
Local
Local
UK
Clydesdale Bank 545 Local
Yorkshire Building Society 413 Local
Virgin Money 223 Local
2011 assets
List of banks analyzed by country and assets
10 biggest other large localmdashcontinued
7222019 Bain amp Co- European Banking Report
httpslidepdfcomreaderfullbain-co-european-banking-report 2932
European banking | Bain amp Company Inc
Page 27
Assets (euroB)
Sberbank
VTB 24
PKO BP
Bank Pekao
BRE Bank
ING Bank Slaski
Standard Bank
Absa
FirstRand
Nedbank
Investec
Tuumlrkiye İş Bankası
Tuumlrkiye Garanti
Ziraat Bankasi
Akbank
Yapı ve Kredi
3781
1857
463
361
244
187
928
766
729
647
330
869
777
708
706
568
CIS
Poland
South Africa
Turkey
Country Bank
Tuumlrkiye Halk Bankasi
Tuumlrkiye Vakıflar
Finansbank
471
467
239
Gazprombank
Russian Agricultural Bank
Alfa-Bank
Nomos-Bank
UniCredit Bank Russia
712
358
357
225
218
AKB Rosbank
Promsvyazbank
ZAO Raiffeisenbank
URALSIB Bank
Russian Standard Bank
AKB Probusinessbank
200
173
160
113
74
35
2011 assets
Bank Zachodni WBK + Kredyt Bank
Getin NobleBank
Bank Millennium
143
141
126
List of banks analyzed by country and assets
High-growth countries
7222019 Bain amp Co- European Banking Report
httpslidepdfcomreaderfullbain-co-european-banking-report 3032
European banking | Bain amp Company Inc
Page 28
Key contacts in Bainrsquos European Financial Services practice
Franco Baronio in Milan (francobaroniobaincom)Rocco DrsquoAcunto in Milan (roccodacuntobaincom)
Ada Di Marzo in Paris (adadimarzobaincom)
Bertrand Facq in Warsaw (bertrandfacqbaincom)
Fabrice Franzen in Johannesburg (fabricefranzenbaincom)
Thomas Herbeck in Frankfurt (thomasherbeckbaincom)
Karaca Kestelli in Istanbul (karacakestellibaincom)
Nicolaacutes Lopez in Madrid (nicolaslopezbaincom)
Niels Peder Nielsen in Copenhagen (nielspedernielsenbaincom)
Andrea Oldrini in Milan (andreaoldrinibaincom)
Mathijs Robbens in Amsterdam (mathijsrobbensbaincom)
Visar Sala in Moscow (visarsalabaincom)
Walter Sinn in Frankfurt (waltersinnbaincom)Joatildeo Soares in London (joaosoaresbaincom)
Acknowledgments
The authors would like to thank the following Bain colleagues for their valuable support in producing this report
Sonal Chawla Christian Duus Franccedilois Fastrez Farsan Ghassim and Shikha Mahato
See these related Bain perspectives at wwwbaincom
bull Managing risk and capital
bull How Europersquos banks can return to health
bull The digital challenge to retail banks
7222019 Bain amp Co- European Banking Report
httpslidepdfcomreaderfullbain-co-european-banking-report 3132
7222019 Bain amp Co- European Banking Report
httpslidepdfcomreaderfullbain-co-european-banking-report 3232
For more information visit wwwbaincom
Share983140 983105m983138io983150 Tru Rs983157983148ts
Bain amp Company is the management consulting firm that the worldrsquos business leaders come to whenthey want results
Bain advises clients on strategy operations technology organization private equity and mergers and acquisitions We develop
practical customized insights that clients act on and transfer skills that make change stick Founded in 1973 Bain has
48 offices in 31 countries and our deep expertise and client roster cross every industry and economic sector Our clients
have outperformed the stock market 4 to 1
What sets us apart
We believe a consulting firm should be more than an adviser So we put ourselves in our clientsrsquo shoes selling outcomes not
projects We align our incentives with our clientsrsquo by linking our fees to their results and collaborate to unlock the full potential
of their business Our Results Deliveryreg process builds our clientsrsquo capabilities and our True North values mean we do theright thing for our clients people and communitiesmdashalways
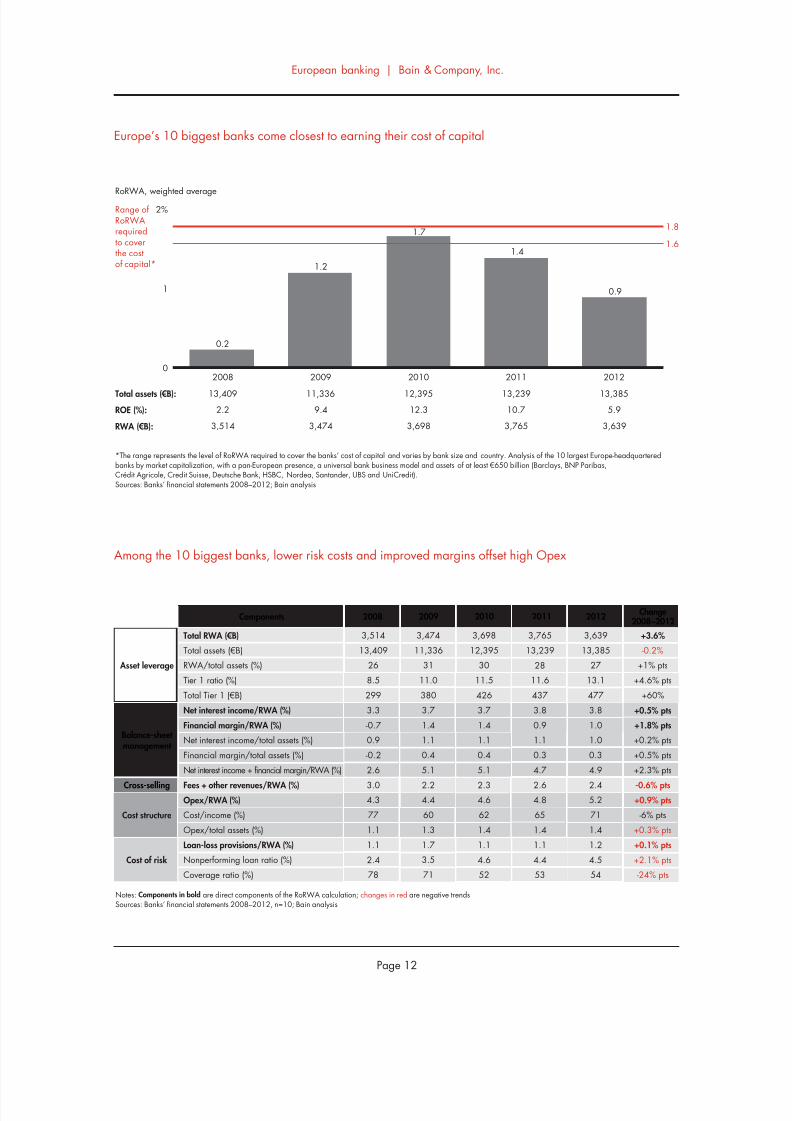
7222019 Bain amp Co- European Banking Report
httpslidepdfcomreaderfullbain-co-european-banking-report 1432
European banking | Bain amp Company Inc
Page 12
Europersquos 10 biggest banks come closest to earning their cost of capital
The range represents the level of RoRWA required to cover the banksrsquo cost of capital and varies by bank size and country Analysis of the 10 largest Europe-headquarteredbanks by market capitalization with a pan-European presence a universal bank business model and assets of at least euro650 billion (Barclays BNP ParibasCreacutedit Agricole Credit Suisse Deutsche Bank HSBC Nordea Santander UBS and UniCredit)Sources Banksrsquo financial statements 2008ndash2012 Bain analysis
RoRWA weighted average
RWA (euroB)
1340922
3514
1133694
3474
Total assets (euroB)
ROE ()
Range ofRoRWArequiredto coverthe costof capital
12395123
3698
13239107
3765
1338559
3639
2008
02
2009 2010
17
2011
14
2012
09
12
0
1
2
18
16
Among the 10 biggest banks lower risk costs and improved margins offset high Opex
Notes Components in bold are direct components of the RoRWA calculation changes in red are negative trendsSources Banksrsquo financial statements 2008ndash2012 n=10 Bain analysis
2012 Change2008minus2012
2010 2011
Total RWA (euroB)
Total assets (euroB)
RWAtotal assets ()
Tier 1 ratio ()
Total Tier 1 (euroB)
Net interest incomeRWA ()
Financial marginRWA ()
Net interest incometotal assets ()
Financial margintotal assets ()
Net interest income + financial marginRWA ()
Fees + other revenuesRWA ()OpexRWA ()
Costincome ()
Opextotal assets ()
Loan-loss provisionsRWA ()
Nonperforming loan ratio ()
Coverage ratio ()
3639
13385
27
131
477
38
10
10
03
49
2452
71
14
12
45
54
+36
-02
+1 pts
+46 pts
+60
+05 pts
+18 pts
+02 pts
+05 pts
+23 pts
-06 pts+09 pts
-6 pts
+03 pts
+01 pts
+21 pts
-24 pts
3698
12395
30
115
426
37
14
11
04
51
2346
62
14
11
46
52
3765
13239
28
116
437
38
09
11
03
47
2648
65
14
11
44
53
2009
3474
11336
31
110
380
37
14
11
04
51
2244
60
13
17
35
71
3514
13409
26
85
299
33
-07
09
-02
26
3043
77
11
11
24
78
Cross-selling
Asset leverage
Balance-sheet management
Cost structure
Cost of risk
2008Components
7222019 Bain amp Co- European Banking Report
httpslidepdfcomreaderfullbain-co-european-banking-report 1532
European banking | Bain amp Company Inc
Page 13
Other large European banks have fallen well short of earning their cost of capital
The range represents the level of RoRWA required to cover the banksrsquo cost of capital and varies by bank size and country Analysis of 13 banks with assets of at leasteuro200 billion a universal bank business model and small to medium-sized subsidiaries outside their core geography (ABN AMRO Group BBVA Commerzbank Danske BankErste ING Intesa Sanpaolo KBC Lloyds Rabobank RBS Socieacuteteacute Geacuteneacuterale and Standard Chartered)Sources Banksrsquo financial statements 2008ndash2012 Bain analysis
RoRWA weighted average
RWA (euroB)
Total assets (euroB)
ROE ()
Range ofRoRWArequiredto coverthe costof capital
861607
3188
2008
01
822237
3468
2009
04
850978
3339
2010
867422
3214
2011
03
888640
3115
2012
06
10
0
1
2
18
16
Other large European banks had Opex lower than the big 10 which offset pressure on fee income and
higher cost of risk
Notes Components in bold are direct components of the RoRWA calculation changes in red are negative trendsSources Banksrsquo financial statements 2008ndash2012 n=13 Bain analysis
2012 Change2008minus2012
2010 2011
Total RWA (euroB)
Total assets (euroB)
RWAtotal assets ()
Tier 1 ratio ()
Total Tier 1 (euroB)
Net interest incomeRWA ()
Financial marginRWA ()
Net interest incometotal assets ()
Financial margintotal assets ()
Net interest income + financial marginRWA ()
Fees + other revenuesRWA ()OpexRWA ()
Costincome ()
Opextotal assets ()
Loan-loss provisionsRWA ()
Nonperforming loan ratio ()
Coverage ratio ()
3115
8886
35
129
402
35
12
12
04
47
1239
66
14
14
56
50
-23
+31
-19 pts
+39 pts
+40
+04 pts
+17 pts
+01 pts
+06 pts
+21 pts
-09 pts+02 pts
-12 pts
No change
+04 pts
+22 pts
+3 pts
3339
8509
39
114
382
34
11
13
04
45
1233
57
13
14
54
48
3214
8674
37
119
382
35
03
13
01
38
1739
70
14
14
57
48
2009
3468
8222
42
102
353
31
10
13
04
41
1532
58
14
19
50
46
3188
8616
37
90
287
31
-05
12
-02
26
2137
78
14
10
34
47
Cross-selling
Asset leverage
Balance-sheet management
Cost structure
Cost of risk
2008Components
7222019 Bain amp Co- European Banking Report
httpslidepdfcomreaderfullbain-co-european-banking-report 1632
European banking | Bain amp Company Inc
Page 14
Local banks have seen their RoRWA sharply deteriorate in recent years
The range represents the level of RoRWA required to cover the banksrsquo cost of capital and varies by bank size and country analysis of 65 banks operating exclusivelywithin a single national or regional marketSources Banksrsquo financial statements 2008ndash2012 Bain analysis
RoRWA weighted average
RWA (euroB)
Total assets (euroB)
ROE ()
Range ofRoRWArequiredto coverthe costof capital
10347
-68
4198
9571
20
3904
9462
59
3748
10044
20
3890
8948
-42
3293
2008
-06
2009
02
2010
07
2011
02
2012
-11
-2
-1
0
1
21816
Local banks have experienced sharp deleveraging higher cost of risk more nonperforming loans and flat revenues
Notes Components in bold are direct components of the RoRWA calculation changes in red are negative trendsSources Banksrsquo financial statements 2008ndash2012 n=65 Bain analysis
2012 Change2008minus2012
2010 2011
Total RWA (euroB)
Total assets (euroB)
RWAtotal assets ()
Tier 1 ratio ()
Total Tier 1 (euroB)
Net interest incomeRWA ()
Financial marginRWA ()
Net interest incometotal assets ()
Financial margintotal assets ()
Net interest income + financial marginRWA ()
Fees + other revenuesRWA ()OpexRWA ()
Costincome ()
Opextotal assets ()
Loan-loss provisionsRWA ()
Nonperforming loan ratio ()
Coverage ratio ()
3293
8948
37
139
457
28
06
10
02
34
1135
71
13
20
64
46
-215
-135
-38 pts
+44 pts
+15
+03 pts
+14 pts
No change
+06 pts
+17 pts
-05 pts+08 pts
-17 pts
+02 pts
+1 pts
+44 pts
-18 pts
3748
9462
40
113
422
28
05
11
02
33
1430
65
12
09
40
52
3890
10044
39
118
461
28
03
11
01
31
1532
69
13
12
43
51
2009
3904
9571
41
109
426
28
04
11
02
32
1430
65
12
14
36
51
4198
10347
41
94
396
25
-09
10
-04
16
1628
87
11
10
20
64
Cross-selling
Asset leverage
Balance-sheet management
Cost control
Cost of risk
2008Components
7222019 Bain amp Co- European Banking Report
httpslidepdfcomreaderfullbain-co-european-banking-report 1732
European banking | Bain amp Company Inc
Page 15
7222019 Bain amp Co- European Banking Report
httpslidepdfcomreaderfullbain-co-european-banking-report 1832
7222019 Bain amp Co- European Banking Report
httpslidepdfcomreaderfullbain-co-european-banking-report 1932
bull Countries with strong economic growth led the2012 RoRWA rankings Turkey took pole positionwith a 49 RoRWA In core Europe the Nordic
countries posed the strongest performance witha 19 RoRWA followed by Austria and theNetherlands The largest economies of Germanythe UK and France trailed behind
bull Banks in Italy Portugal Spain and Ireland whichhave been mired in the sovereign debt crisis anddeep economic recessions turned in the weakestRoRWA performances
bull Among the core European countries changes inRoRWAs from 2008 to 2012 stemmed mainly
from changes in three components net interestincome financial margin and loan-loss provisions
bull Countries that posted large positive changesmdashincluding Germany the Netherlands the Nordiccountries and the UKmdashbenefited from higherfinancial margins more control of operatingexpenditure and lower cost of risk Countries withlarge drops in RoRWAs were hurt by infl exiblecost structures which prevented them from shrinkingtheir production costs and a cost of risk that was
almost double the averagebull Northern Europe dominated the league tables
whether one looks at the 2012 leaders or themost improved banks For example the RoRWAleaders among both local and the 10 biggestbanks included banks in the Nordic countriesfollowed by those in the UK France Austria andthe Netherlands
bull In the most improved group banks in Switzer-land the Netherlands and Germany made a
strong showing
bull In high-growth countries Turkey and the Common-wealth of Independent States (CIS) took leadingpositions for the most improved banks and Turkeyfor the 2012 leaders
2Country and cluster
league tables
7222019 Bain amp Co- European Banking Report
httpslidepdfcomreaderfullbain-co-european-banking-report 2032
European banking | Bain amp Company Inc
Page 18
High-growth countries led the RoRWA rankings in 2012
Note For CIS the Netherlands Belgium Germany UK France Portugal and Spain one or two Tier-3 banks had not reported 2012 data by time of publicationso the analysis used 2011 data for those few banksSources Banksrsquo financial statements 2008ndash2012 n=121 Bain analysis
Rank 2012 RoRWA ()
Turkey
Poland
South Africa
CIS
Nordics
Austria
Netherlands
Belgium
Germany
UK
France
Switzerland
Italy
Portugal
Spain
Ireland
1
2
3
4
5
6
7
8
9
10
11
12
13
14
15
16
49
47
31
27
19
12
10
08
07
05
03
01
-06
-08
-17
-48
480
167
340
826
2357
334
2186
911
5514
7062
6320
1812
2127
426
2917
312
2012 total assets (euroB)Country 2008 RoRWA ()
33
41
35
10
13
19
-20
-25
-14
00
08
-76
07
10
19
10
7222019 Bain amp Co- European Banking Report
httpslidepdfcomreaderfullbain-co-european-banking-report 2132
European banking | Bain amp Company Inc
Page 19
In core European countries RoRWA changes from 2008 to 2012hellip
Note Averages are weighted for the total size of the respective components in each countrySources Banksrsquo financial statements 2008ndash2012 n=71 Bain analysis
RoRWA weighted average
-3
-2
-1
0
1
2
2008 average2012 average
UK
05
France
08
Germany
-14
07
Spain
19
-17
Nordics
13
19
Italy
07
-06
Netherlands
-20
10
2008 2012
0003
hellipwere spurred mainly by net interest income financial margin and loan-loss provisions
Note Averages are weighted for the total sizes of the respective indicators in each countrySources Banksrsquo financial statements 2008-2012 n=71 Bain analysis
NordicsGermany Spain
Total assets (euroB)
Total RWA (euroB)
Net interest incomeRWA ()
Financial marginRWA ()
Fees and commissions +other revenuesRWA ()
OpexRWA ()
Loan-loss provisionsRWA ()
France
7751
UK
2008 2012
AverageItaly Netherlands
7039
2474 2467
31 30
-02 12
26 15
41 42
14 10
5857 5715
1532 1327
26 38
-03 16
30 13
40 54
05 10
6054 5419
1534 1317
26 32
-19 07
14 17
27 43
08 06
1976 2917
1068 1315
36 43
06 06
17 10
27 35
13 41
1960 2357
790 735
27 32
-02 12
17 10
24 28
05 05
1990 2127
1266 1139
32 28
01 04
18 18
33 35
10 22
2263 2054
729 656
29 41
-17 06
15 10
39 38
09 09
2071 3947
928 1279
30 34
-05 10
17 14
32 41
08 15
7222019 Bain amp Co- European Banking Report
httpslidepdfcomreaderfullbain-co-european-banking-report 2232
European banking | Bain amp Company Inc
Page 20
These banks are the 2012 RoRWA leaders of their geographic cluster
Sources Banksrsquo financial statements 2008ndash2012 Bain analysis
Rank 2012 RoRWA ()
Nordics
UK
France
UK
Austria
Netherlands
Nordics
Nordics
Nordics
Turkey
Turkey
Turkey
1
2
3
1
2
3
1
2
3
1
2
3
19
18
16
23
17
16
40
39
36
158
132
48
Nordea
HSBC
BNP Paribas
Standard Chartered
Erste
ING
Swedbank
Sparebank 1 Group
Handelsbanken
Ziraat Bankasi
Akbank
Tuumlrkiye Halk
Bank Country 2008 RoRWA ()
16
08
06
24
19
02
20
NA
21
193
106
38
10biggest
Otherlarge
European
Local
High-growthcountries
These banks showed the biggest improvements in RoRWA over the past five years
Sources Banksrsquo financial statements 2008ndash2012 Bain analysis
Rank 2008ndash2012 change( points)
Switzerland
Switzerland
Germany
Belgium
UK
Netherlands
Netherlands
Belgium
Germany
CIS
Turkey
CIS
1
2
3
1
2
3
1
2
3
1
2
3
+83
+68
+21
+29
+26
+14
+64
+50
+33
+71
+26
+13
UBS
Credit Suisse
Deutsche Bank
KBC
RBS
ING
RBS Holdings NV
BNP Paribas Fortis
Bayerische Landesbank
Gazprombank
Akbank
VTB 24
Bank Country 2008 RoRWA ()
-92
-58
-19
-19
-37
02
-91
-45
-26
-56
106
05
10biggest
Otherlarge
European
Local
High-growthcountries
7222019 Bain amp Co- European Banking Report
httpslidepdfcomreaderfullbain-co-european-banking-report 2332
European banking | Bain amp Company Inc
Page 21
7222019 Bain amp Co- European Banking Report
httpslidepdfcomreaderfullbain-co-european-banking-report 2432
7222019 Bain amp Co- European Banking Report
httpslidepdfcomreaderfullbain-co-european-banking-report 2532
bull Europersquos environment continues to be volatile andinvestors are seeking better information about abankrsquos stability asset quality and key factors that
generate value RoRWA plays a useful role hereby focusing on the balance sheetmdashwhich enablescomparison between a bank and its peersmdashand byidentifying the factors influencing bank performance
bull Banks still need to address challenges along eachdimension of RoRWA in order to lift their profit-ability levels above the cost of capital In recent
years the profitability of lending assets has beensustained mainly by the fi nancial componentsincluding a boost from LTRO To raise asset prof-itability banks will have to better manage their
capital allocations and risk profilesbull The pressure on fee income will continue To offset
that trend banks should turn to their close clientrelationships for new sources of revenues
bull Lowering operating costs is the dimension thatwarrants managementrsquos attention at any bankregardless of size or location Initiatives that havethe greatest potential for tackling structural costsinclude adopting digital technologies and modern-izing IT platforms optimizing processes from endto end through outsourcing offshoring and other
means and expanding global procurement Suchinitiatives are essential for survival in an industrygoing through discontinuous change
bull Deleveraging the loan portfolio for riskier clients isa pressing issue which still poses significant threatsfor local banks In countries with a higher cost ofrisk and stagnant or negative GDP growth rateslocal banks may face further painful restructuring
bull Astute management of the cost of risk includingtaking a portfolio perspective offers opportunities
for most banksmdashin part to meet the new require-ments of Basel III and reassure rating agencies
bull Further consolidation of the local and other largebanks over the coming years will likely benefitthe 10 biggest banks and those in high-growthcountries These high-growth countries offer thegreatest opportunities for RoRWA growth for largeand pan-European players looking to diversifytheir portfolios
3Strategic
perspectives and
implications for
management
7222019 Bain amp Co- European Banking Report
httpslidepdfcomreaderfullbain-co-european-banking-report 2632
European banking | Bain amp Company Inc
Page 24
Significant restructuring is warranted for all banks but the nature of the challenge varies by geography
Source Bain analysis
10 biggest Strategic issueHigh-growth
countries
Other large
EuropeanLocal
Cross-selling
Balance-sheet
management
Cost structure
Cost of risk
Major threatThreatOpportunityMajor opportunity
Profitability of the asset portfolio has been sustained mainly by the
financial component Deleveraging of the loan portfolio for riskier
clients has been only partially successful and the risk profile of
the portfolio still has a long way to go
To counter pressure on fees banks should work systematically on
cross-selling opportunities through initiatives like client-focused
service models and CRM support
To further reduce costs banks should pursue new digital technologies
optimized processes through such means as outsourcing and offshoring
modernized IT platforms and global procurement initiatives
Active management of cost of risk demands more systematic solutions
bull NPL and LLP trends are threatening the stability of the overall
system and not only in individual countries such as Greece
bull Management of risky clients has become a core business and capability
bull Managing costs of risk demands an integrated portfolio approach
7222019 Bain amp Co- European Banking Report
httpslidepdfcomreaderfullbain-co-european-banking-report 2732
European banking | Bain amp Company Inc
Page 25
Assets (euroB)
Erste (AT)
Raiffeisen Bank (AT)
BNP Paribas Fortis
KBC
Belfius Banque
ING Belgium SANV
Creacutedit Agricole Groupe
BNP Paribas
Groupe Socieacuteteacute Geacuteneacuterale
Groupe BPCE
Creacutedit Mutuel
Deutsche Bank
Commerzbank AGKfW
DZ Bank AG
UniCredit Bank AG
2138
1202
2723
2569
2129
1691
17930
15439
12307
11475
6051
20123
63595116
4072
3483
Austria
Belgium
France
Germany
Country Bank Cluster
Other large
Local
Local
Other large
Local
Local
10 biggest
10 biggest
Other large
Local
Local
10 biggest
Other largeLocal
Local
Local
Ireland
Landesbank Baden-Wuumlrttemberg
Bayerische Landesbank
NORDLB
Helaba
HSH Nordbank
DekaBank
Landesbank Berlin Holding
Santander Consumer Bank
Hamburger Sparkasse
Deutsche Apotheker - und Aumlrztebank
Sparkasse KoumllnBonn
Kreissparkasse Koumlln
Bank of Ireland
Allied Irish Banks
permanent tsb Group Hldgs Plc
Intesa Sanpaolo
3363
2868
2256
1993
1306
1297
1183
403
396
379
299
248
1481
1225
409
6735
Local
Local
Local
Local
Local
Local
Local
Local
Local
Local
Local
Local
Other large
10 biggest
Local
Other large
Unicredit Group
Monte dei Paschi di Siena
4639
2189
10 biggest
Local
UBI Banca Group
Banco Popolare
BNL
Banca Popolare dellrsquoEmilia Romagna
Banca Popolare di Milano
Gruppo Banca Carige
Cariparma
Banca Popolare di Vicenza
Veneto Banca
1324
1319
912
616
525
493
493
467
402
Local
Local
Local
Local
Local
Local
Local
Local
Local
Italy
2011 assets
Bca Popdi Sondrio 322 Local
Credito Emiliano
Credito Valtellinese
Banca delle Marche
307
299
227
Local
Local
Local
List of banks analyzed by country and assets
10 biggest other large local
7222019 Bain amp Co- European Banking Report
httpslidepdfcomreaderfullbain-co-european-banking-report 2832
European banking | Bain amp Company Inc
Page 26
Assets (euroB)Country Bank Cluster
ING
Rabobank Group
ABN AMRO Group
SNS Reaal
RBS Holdings NV
8361
7524
3944
1322
710
Netherlands
Other large
Other large
Other large
Local
Local
Nordea 6774 10 biggest
Danske Bank
DNB
4682
3028
Other large
Local
SEB
Handelsbanken
Swedbank
Pohjola Bank
2818
2742
2121
998
Local
Local
Local
Local
Nordics
Jyske Bank 347 Local
Sparebank 1 Group 62 Local
Caixa Geral de Depositos 1169 Local
Millenium BCP
Banco Espiacuterito Santo
897
837
Local
Local
Banco BPI
Santander Totta SGPS
Caixa Econoacutemica Montepio Geral
Creacutedito Agriacutecola Muacutetuo
446
414
215
142
Local
Local
Local
Local
Portugal
BANIF 140 Local
SantanderBBVA
la Caixa
Banco Financiero y de Ahorros
Banco Sabadell SA
122826378
3591
3092
1615
Spain
10 biggestOther large
Local
Local
Local
Banco Popular
Banco Mare Nostrum
1576
634
Local
Local
UBS
Credit Suisse
10448
7669Switzerland
10 biggest
10 biggest
HSBC 20939 10 biggest
Barclays
Royal Bank of Scotland
17603
11521
10 biggest
Other large
Lloyds Banking Group
Standard Chartered
Nationwide Building Society
Co-operative Bank
11395
4950
2417
611
Other large
Other large
Local
Local
UK
Clydesdale Bank 545 Local
Yorkshire Building Society 413 Local
Virgin Money 223 Local
2011 assets
List of banks analyzed by country and assets
10 biggest other large localmdashcontinued
7222019 Bain amp Co- European Banking Report
httpslidepdfcomreaderfullbain-co-european-banking-report 2932
European banking | Bain amp Company Inc
Page 27
Assets (euroB)
Sberbank
VTB 24
PKO BP
Bank Pekao
BRE Bank
ING Bank Slaski
Standard Bank
Absa
FirstRand
Nedbank
Investec
Tuumlrkiye İş Bankası
Tuumlrkiye Garanti
Ziraat Bankasi
Akbank
Yapı ve Kredi
3781
1857
463
361
244
187
928
766
729
647
330
869
777
708
706
568
CIS
Poland
South Africa
Turkey
Country Bank
Tuumlrkiye Halk Bankasi
Tuumlrkiye Vakıflar
Finansbank
471
467
239
Gazprombank
Russian Agricultural Bank
Alfa-Bank
Nomos-Bank
UniCredit Bank Russia
712
358
357
225
218
AKB Rosbank
Promsvyazbank
ZAO Raiffeisenbank
URALSIB Bank
Russian Standard Bank
AKB Probusinessbank
200
173
160
113
74
35
2011 assets
Bank Zachodni WBK + Kredyt Bank
Getin NobleBank
Bank Millennium
143
141
126
List of banks analyzed by country and assets
High-growth countries
7222019 Bain amp Co- European Banking Report
httpslidepdfcomreaderfullbain-co-european-banking-report 3032
European banking | Bain amp Company Inc
Page 28
Key contacts in Bainrsquos European Financial Services practice
Franco Baronio in Milan (francobaroniobaincom)Rocco DrsquoAcunto in Milan (roccodacuntobaincom)
Ada Di Marzo in Paris (adadimarzobaincom)
Bertrand Facq in Warsaw (bertrandfacqbaincom)
Fabrice Franzen in Johannesburg (fabricefranzenbaincom)
Thomas Herbeck in Frankfurt (thomasherbeckbaincom)
Karaca Kestelli in Istanbul (karacakestellibaincom)
Nicolaacutes Lopez in Madrid (nicolaslopezbaincom)
Niels Peder Nielsen in Copenhagen (nielspedernielsenbaincom)
Andrea Oldrini in Milan (andreaoldrinibaincom)
Mathijs Robbens in Amsterdam (mathijsrobbensbaincom)
Visar Sala in Moscow (visarsalabaincom)
Walter Sinn in Frankfurt (waltersinnbaincom)Joatildeo Soares in London (joaosoaresbaincom)
Acknowledgments
The authors would like to thank the following Bain colleagues for their valuable support in producing this report
Sonal Chawla Christian Duus Franccedilois Fastrez Farsan Ghassim and Shikha Mahato
See these related Bain perspectives at wwwbaincom
bull Managing risk and capital
bull How Europersquos banks can return to health
bull The digital challenge to retail banks
7222019 Bain amp Co- European Banking Report
httpslidepdfcomreaderfullbain-co-european-banking-report 3132
7222019 Bain amp Co- European Banking Report
httpslidepdfcomreaderfullbain-co-european-banking-report 3232
For more information visit wwwbaincom
Share983140 983105m983138io983150 Tru Rs983157983148ts
Bain amp Company is the management consulting firm that the worldrsquos business leaders come to whenthey want results
Bain advises clients on strategy operations technology organization private equity and mergers and acquisitions We develop
practical customized insights that clients act on and transfer skills that make change stick Founded in 1973 Bain has
48 offices in 31 countries and our deep expertise and client roster cross every industry and economic sector Our clients
have outperformed the stock market 4 to 1
What sets us apart
We believe a consulting firm should be more than an adviser So we put ourselves in our clientsrsquo shoes selling outcomes not
projects We align our incentives with our clientsrsquo by linking our fees to their results and collaborate to unlock the full potential
of their business Our Results Deliveryreg process builds our clientsrsquo capabilities and our True North values mean we do theright thing for our clients people and communitiesmdashalways
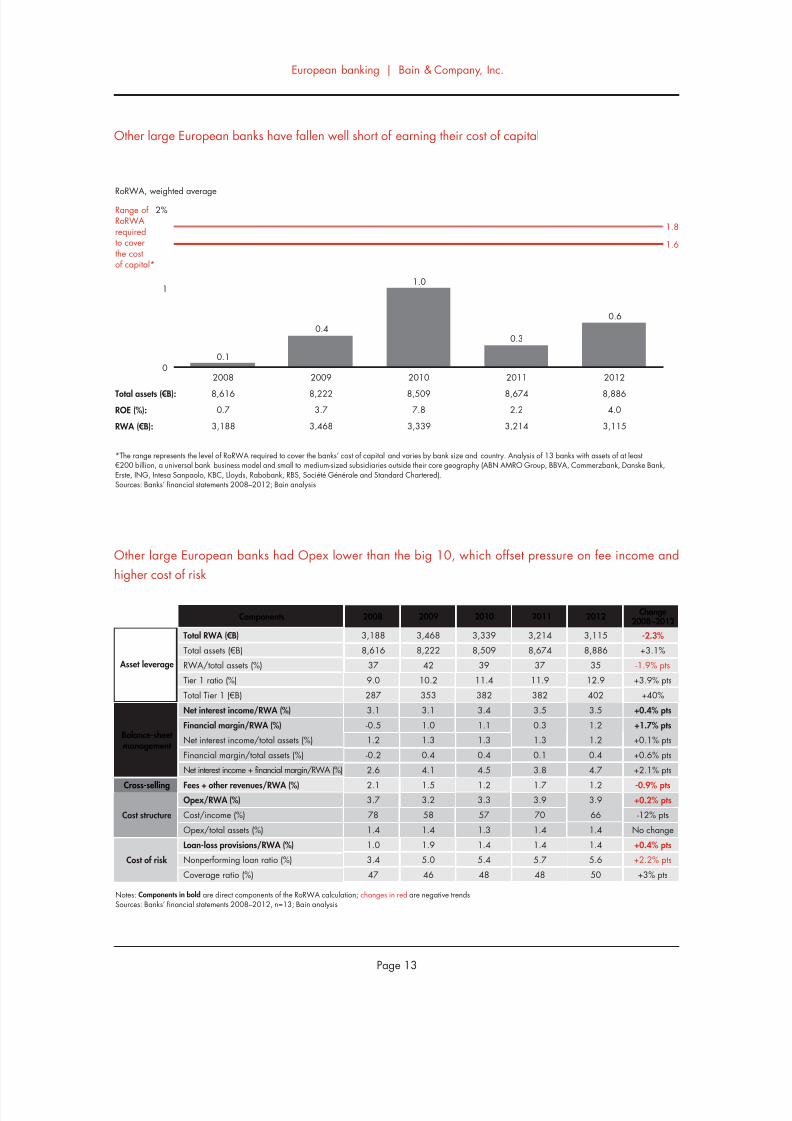
7222019 Bain amp Co- European Banking Report
httpslidepdfcomreaderfullbain-co-european-banking-report 1532
European banking | Bain amp Company Inc
Page 13
Other large European banks have fallen well short of earning their cost of capital
The range represents the level of RoRWA required to cover the banksrsquo cost of capital and varies by bank size and country Analysis of 13 banks with assets of at leasteuro200 billion a universal bank business model and small to medium-sized subsidiaries outside their core geography (ABN AMRO Group BBVA Commerzbank Danske BankErste ING Intesa Sanpaolo KBC Lloyds Rabobank RBS Socieacuteteacute Geacuteneacuterale and Standard Chartered)Sources Banksrsquo financial statements 2008ndash2012 Bain analysis
RoRWA weighted average
RWA (euroB)
Total assets (euroB)
ROE ()
Range ofRoRWArequiredto coverthe costof capital
861607
3188
2008
01
822237
3468
2009
04
850978
3339
2010
867422
3214
2011
03
888640
3115
2012
06
10
0
1
2
18
16
Other large European banks had Opex lower than the big 10 which offset pressure on fee income and
higher cost of risk
Notes Components in bold are direct components of the RoRWA calculation changes in red are negative trendsSources Banksrsquo financial statements 2008ndash2012 n=13 Bain analysis
2012 Change2008minus2012
2010 2011
Total RWA (euroB)
Total assets (euroB)
RWAtotal assets ()
Tier 1 ratio ()
Total Tier 1 (euroB)
Net interest incomeRWA ()
Financial marginRWA ()
Net interest incometotal assets ()
Financial margintotal assets ()
Net interest income + financial marginRWA ()
Fees + other revenuesRWA ()OpexRWA ()
Costincome ()
Opextotal assets ()
Loan-loss provisionsRWA ()
Nonperforming loan ratio ()
Coverage ratio ()
3115
8886
35
129
402
35
12
12
04
47
1239
66
14
14
56
50
-23
+31
-19 pts
+39 pts
+40
+04 pts
+17 pts
+01 pts
+06 pts
+21 pts
-09 pts+02 pts
-12 pts
No change
+04 pts
+22 pts
+3 pts
3339
8509
39
114
382
34
11
13
04
45
1233
57
13
14
54
48
3214
8674
37
119
382
35
03
13
01
38
1739
70
14
14
57
48
2009
3468
8222
42
102
353
31
10
13
04
41
1532
58
14
19
50
46
3188
8616
37
90
287
31
-05
12
-02
26
2137
78
14
10
34
47
Cross-selling
Asset leverage
Balance-sheet management
Cost structure
Cost of risk
2008Components
7222019 Bain amp Co- European Banking Report
httpslidepdfcomreaderfullbain-co-european-banking-report 1632
European banking | Bain amp Company Inc
Page 14
Local banks have seen their RoRWA sharply deteriorate in recent years
The range represents the level of RoRWA required to cover the banksrsquo cost of capital and varies by bank size and country analysis of 65 banks operating exclusivelywithin a single national or regional marketSources Banksrsquo financial statements 2008ndash2012 Bain analysis
RoRWA weighted average
RWA (euroB)
Total assets (euroB)
ROE ()
Range ofRoRWArequiredto coverthe costof capital
10347
-68
4198
9571
20
3904
9462
59
3748
10044
20
3890
8948
-42
3293
2008
-06
2009
02
2010
07
2011
02
2012
-11
-2
-1
0
1
21816
Local banks have experienced sharp deleveraging higher cost of risk more nonperforming loans and flat revenues
Notes Components in bold are direct components of the RoRWA calculation changes in red are negative trendsSources Banksrsquo financial statements 2008ndash2012 n=65 Bain analysis
2012 Change2008minus2012
2010 2011
Total RWA (euroB)
Total assets (euroB)
RWAtotal assets ()
Tier 1 ratio ()
Total Tier 1 (euroB)
Net interest incomeRWA ()
Financial marginRWA ()
Net interest incometotal assets ()
Financial margintotal assets ()
Net interest income + financial marginRWA ()
Fees + other revenuesRWA ()OpexRWA ()
Costincome ()
Opextotal assets ()
Loan-loss provisionsRWA ()
Nonperforming loan ratio ()
Coverage ratio ()
3293
8948
37
139
457
28
06
10
02
34
1135
71
13
20
64
46
-215
-135
-38 pts
+44 pts
+15
+03 pts
+14 pts
No change
+06 pts
+17 pts
-05 pts+08 pts
-17 pts
+02 pts
+1 pts
+44 pts
-18 pts
3748
9462
40
113
422
28
05
11
02
33
1430
65
12
09
40
52
3890
10044
39
118
461
28
03
11
01
31
1532
69
13
12
43
51
2009
3904
9571
41
109
426
28
04
11
02
32
1430
65
12
14
36
51
4198
10347
41
94
396
25
-09
10
-04
16
1628
87
11
10
20
64
Cross-selling
Asset leverage
Balance-sheet management
Cost control
Cost of risk
2008Components
7222019 Bain amp Co- European Banking Report
httpslidepdfcomreaderfullbain-co-european-banking-report 1732
European banking | Bain amp Company Inc
Page 15
7222019 Bain amp Co- European Banking Report
httpslidepdfcomreaderfullbain-co-european-banking-report 1832
7222019 Bain amp Co- European Banking Report
httpslidepdfcomreaderfullbain-co-european-banking-report 1932
bull Countries with strong economic growth led the2012 RoRWA rankings Turkey took pole positionwith a 49 RoRWA In core Europe the Nordic
countries posed the strongest performance witha 19 RoRWA followed by Austria and theNetherlands The largest economies of Germanythe UK and France trailed behind
bull Banks in Italy Portugal Spain and Ireland whichhave been mired in the sovereign debt crisis anddeep economic recessions turned in the weakestRoRWA performances
bull Among the core European countries changes inRoRWAs from 2008 to 2012 stemmed mainly
from changes in three components net interestincome financial margin and loan-loss provisions
bull Countries that posted large positive changesmdashincluding Germany the Netherlands the Nordiccountries and the UKmdashbenefited from higherfinancial margins more control of operatingexpenditure and lower cost of risk Countries withlarge drops in RoRWAs were hurt by infl exiblecost structures which prevented them from shrinkingtheir production costs and a cost of risk that was
almost double the averagebull Northern Europe dominated the league tables
whether one looks at the 2012 leaders or themost improved banks For example the RoRWAleaders among both local and the 10 biggestbanks included banks in the Nordic countriesfollowed by those in the UK France Austria andthe Netherlands
bull In the most improved group banks in Switzer-land the Netherlands and Germany made a
strong showing
bull In high-growth countries Turkey and the Common-wealth of Independent States (CIS) took leadingpositions for the most improved banks and Turkeyfor the 2012 leaders
2Country and cluster
league tables
7222019 Bain amp Co- European Banking Report
httpslidepdfcomreaderfullbain-co-european-banking-report 2032
European banking | Bain amp Company Inc
Page 18
High-growth countries led the RoRWA rankings in 2012
Note For CIS the Netherlands Belgium Germany UK France Portugal and Spain one or two Tier-3 banks had not reported 2012 data by time of publicationso the analysis used 2011 data for those few banksSources Banksrsquo financial statements 2008ndash2012 n=121 Bain analysis
Rank 2012 RoRWA ()
Turkey
Poland
South Africa
CIS
Nordics
Austria
Netherlands
Belgium
Germany
UK
France
Switzerland
Italy
Portugal
Spain
Ireland
1
2
3
4
5
6
7
8
9
10
11
12
13
14
15
16
49
47
31
27
19
12
10
08
07
05
03
01
-06
-08
-17
-48
480
167
340
826
2357
334
2186
911
5514
7062
6320
1812
2127
426
2917
312
2012 total assets (euroB)Country 2008 RoRWA ()
33
41
35
10
13
19
-20
-25
-14
00
08
-76
07
10
19
10
7222019 Bain amp Co- European Banking Report
httpslidepdfcomreaderfullbain-co-european-banking-report 2132
European banking | Bain amp Company Inc
Page 19
In core European countries RoRWA changes from 2008 to 2012hellip
Note Averages are weighted for the total size of the respective components in each countrySources Banksrsquo financial statements 2008ndash2012 n=71 Bain analysis
RoRWA weighted average
-3
-2
-1
0
1
2
2008 average2012 average
UK
05
France
08
Germany
-14
07
Spain
19
-17
Nordics
13
19
Italy
07
-06
Netherlands
-20
10
2008 2012
0003
hellipwere spurred mainly by net interest income financial margin and loan-loss provisions
Note Averages are weighted for the total sizes of the respective indicators in each countrySources Banksrsquo financial statements 2008-2012 n=71 Bain analysis
NordicsGermany Spain
Total assets (euroB)
Total RWA (euroB)
Net interest incomeRWA ()
Financial marginRWA ()
Fees and commissions +other revenuesRWA ()
OpexRWA ()
Loan-loss provisionsRWA ()
France
7751
UK
2008 2012
AverageItaly Netherlands
7039
2474 2467
31 30
-02 12
26 15
41 42
14 10
5857 5715
1532 1327
26 38
-03 16
30 13
40 54
05 10
6054 5419
1534 1317
26 32
-19 07
14 17
27 43
08 06
1976 2917
1068 1315
36 43
06 06
17 10
27 35
13 41
1960 2357
790 735
27 32
-02 12
17 10
24 28
05 05
1990 2127
1266 1139
32 28
01 04
18 18
33 35
10 22
2263 2054
729 656
29 41
-17 06
15 10
39 38
09 09
2071 3947
928 1279
30 34
-05 10
17 14
32 41
08 15
7222019 Bain amp Co- European Banking Report
httpslidepdfcomreaderfullbain-co-european-banking-report 2232
European banking | Bain amp Company Inc
Page 20
These banks are the 2012 RoRWA leaders of their geographic cluster
Sources Banksrsquo financial statements 2008ndash2012 Bain analysis
Rank 2012 RoRWA ()
Nordics
UK
France
UK
Austria
Netherlands
Nordics
Nordics
Nordics
Turkey
Turkey
Turkey
1
2
3
1
2
3
1
2
3
1
2
3
19
18
16
23
17
16
40
39
36
158
132
48
Nordea
HSBC
BNP Paribas
Standard Chartered
Erste
ING
Swedbank
Sparebank 1 Group
Handelsbanken
Ziraat Bankasi
Akbank
Tuumlrkiye Halk
Bank Country 2008 RoRWA ()
16
08
06
24
19
02
20
NA
21
193
106
38
10biggest
Otherlarge
European
Local
High-growthcountries
These banks showed the biggest improvements in RoRWA over the past five years
Sources Banksrsquo financial statements 2008ndash2012 Bain analysis
Rank 2008ndash2012 change( points)
Switzerland
Switzerland
Germany
Belgium
UK
Netherlands
Netherlands
Belgium
Germany
CIS
Turkey
CIS
1
2
3
1
2
3
1
2
3
1
2
3
+83
+68
+21
+29
+26
+14
+64
+50
+33
+71
+26
+13
UBS
Credit Suisse
Deutsche Bank
KBC
RBS
ING
RBS Holdings NV
BNP Paribas Fortis
Bayerische Landesbank
Gazprombank
Akbank
VTB 24
Bank Country 2008 RoRWA ()
-92
-58
-19
-19
-37
02
-91
-45
-26
-56
106
05
10biggest
Otherlarge
European
Local
High-growthcountries
7222019 Bain amp Co- European Banking Report
httpslidepdfcomreaderfullbain-co-european-banking-report 2332
European banking | Bain amp Company Inc
Page 21
7222019 Bain amp Co- European Banking Report
httpslidepdfcomreaderfullbain-co-european-banking-report 2432
7222019 Bain amp Co- European Banking Report
httpslidepdfcomreaderfullbain-co-european-banking-report 2532
bull Europersquos environment continues to be volatile andinvestors are seeking better information about abankrsquos stability asset quality and key factors that
generate value RoRWA plays a useful role hereby focusing on the balance sheetmdashwhich enablescomparison between a bank and its peersmdashand byidentifying the factors influencing bank performance
bull Banks still need to address challenges along eachdimension of RoRWA in order to lift their profit-ability levels above the cost of capital In recent
years the profitability of lending assets has beensustained mainly by the fi nancial componentsincluding a boost from LTRO To raise asset prof-itability banks will have to better manage their
capital allocations and risk profilesbull The pressure on fee income will continue To offset
that trend banks should turn to their close clientrelationships for new sources of revenues
bull Lowering operating costs is the dimension thatwarrants managementrsquos attention at any bankregardless of size or location Initiatives that havethe greatest potential for tackling structural costsinclude adopting digital technologies and modern-izing IT platforms optimizing processes from endto end through outsourcing offshoring and other
means and expanding global procurement Suchinitiatives are essential for survival in an industrygoing through discontinuous change
bull Deleveraging the loan portfolio for riskier clients isa pressing issue which still poses significant threatsfor local banks In countries with a higher cost ofrisk and stagnant or negative GDP growth rateslocal banks may face further painful restructuring
bull Astute management of the cost of risk includingtaking a portfolio perspective offers opportunities
for most banksmdashin part to meet the new require-ments of Basel III and reassure rating agencies
bull Further consolidation of the local and other largebanks over the coming years will likely benefitthe 10 biggest banks and those in high-growthcountries These high-growth countries offer thegreatest opportunities for RoRWA growth for largeand pan-European players looking to diversifytheir portfolios
3Strategic
perspectives and
implications for
management
7222019 Bain amp Co- European Banking Report
httpslidepdfcomreaderfullbain-co-european-banking-report 2632
European banking | Bain amp Company Inc
Page 24
Significant restructuring is warranted for all banks but the nature of the challenge varies by geography
Source Bain analysis
10 biggest Strategic issueHigh-growth
countries
Other large
EuropeanLocal
Cross-selling
Balance-sheet
management
Cost structure
Cost of risk
Major threatThreatOpportunityMajor opportunity
Profitability of the asset portfolio has been sustained mainly by the
financial component Deleveraging of the loan portfolio for riskier
clients has been only partially successful and the risk profile of
the portfolio still has a long way to go
To counter pressure on fees banks should work systematically on
cross-selling opportunities through initiatives like client-focused
service models and CRM support
To further reduce costs banks should pursue new digital technologies
optimized processes through such means as outsourcing and offshoring
modernized IT platforms and global procurement initiatives
Active management of cost of risk demands more systematic solutions
bull NPL and LLP trends are threatening the stability of the overall
system and not only in individual countries such as Greece
bull Management of risky clients has become a core business and capability
bull Managing costs of risk demands an integrated portfolio approach
7222019 Bain amp Co- European Banking Report
httpslidepdfcomreaderfullbain-co-european-banking-report 2732
European banking | Bain amp Company Inc
Page 25
Assets (euroB)
Erste (AT)
Raiffeisen Bank (AT)
BNP Paribas Fortis
KBC
Belfius Banque
ING Belgium SANV
Creacutedit Agricole Groupe
BNP Paribas
Groupe Socieacuteteacute Geacuteneacuterale
Groupe BPCE
Creacutedit Mutuel
Deutsche Bank
Commerzbank AGKfW
DZ Bank AG
UniCredit Bank AG
2138
1202
2723
2569
2129
1691
17930
15439
12307
11475
6051
20123
63595116
4072
3483
Austria
Belgium
France
Germany
Country Bank Cluster
Other large
Local
Local
Other large
Local
Local
10 biggest
10 biggest
Other large
Local
Local
10 biggest
Other largeLocal
Local
Local
Ireland
Landesbank Baden-Wuumlrttemberg
Bayerische Landesbank
NORDLB
Helaba
HSH Nordbank
DekaBank
Landesbank Berlin Holding
Santander Consumer Bank
Hamburger Sparkasse
Deutsche Apotheker - und Aumlrztebank
Sparkasse KoumllnBonn
Kreissparkasse Koumlln
Bank of Ireland
Allied Irish Banks
permanent tsb Group Hldgs Plc
Intesa Sanpaolo
3363
2868
2256
1993
1306
1297
1183
403
396
379
299
248
1481
1225
409
6735
Local
Local
Local
Local
Local
Local
Local
Local
Local
Local
Local
Local
Other large
10 biggest
Local
Other large
Unicredit Group
Monte dei Paschi di Siena
4639
2189
10 biggest
Local
UBI Banca Group
Banco Popolare
BNL
Banca Popolare dellrsquoEmilia Romagna
Banca Popolare di Milano
Gruppo Banca Carige
Cariparma
Banca Popolare di Vicenza
Veneto Banca
1324
1319
912
616
525
493
493
467
402
Local
Local
Local
Local
Local
Local
Local
Local
Local
Italy
2011 assets
Bca Popdi Sondrio 322 Local
Credito Emiliano
Credito Valtellinese
Banca delle Marche
307
299
227
Local
Local
Local
List of banks analyzed by country and assets
10 biggest other large local
7222019 Bain amp Co- European Banking Report
httpslidepdfcomreaderfullbain-co-european-banking-report 2832
European banking | Bain amp Company Inc
Page 26
Assets (euroB)Country Bank Cluster
ING
Rabobank Group
ABN AMRO Group
SNS Reaal
RBS Holdings NV
8361
7524
3944
1322
710
Netherlands
Other large
Other large
Other large
Local
Local
Nordea 6774 10 biggest
Danske Bank
DNB
4682
3028
Other large
Local
SEB
Handelsbanken
Swedbank
Pohjola Bank
2818
2742
2121
998
Local
Local
Local
Local
Nordics
Jyske Bank 347 Local
Sparebank 1 Group 62 Local
Caixa Geral de Depositos 1169 Local
Millenium BCP
Banco Espiacuterito Santo
897
837
Local
Local
Banco BPI
Santander Totta SGPS
Caixa Econoacutemica Montepio Geral
Creacutedito Agriacutecola Muacutetuo
446
414
215
142
Local
Local
Local
Local
Portugal
BANIF 140 Local
SantanderBBVA
la Caixa
Banco Financiero y de Ahorros
Banco Sabadell SA
122826378
3591
3092
1615
Spain
10 biggestOther large
Local
Local
Local
Banco Popular
Banco Mare Nostrum
1576
634
Local
Local
UBS
Credit Suisse
10448
7669Switzerland
10 biggest
10 biggest
HSBC 20939 10 biggest
Barclays
Royal Bank of Scotland
17603
11521
10 biggest
Other large
Lloyds Banking Group
Standard Chartered
Nationwide Building Society
Co-operative Bank
11395
4950
2417
611
Other large
Other large
Local
Local
UK
Clydesdale Bank 545 Local
Yorkshire Building Society 413 Local
Virgin Money 223 Local
2011 assets
List of banks analyzed by country and assets
10 biggest other large localmdashcontinued
7222019 Bain amp Co- European Banking Report
httpslidepdfcomreaderfullbain-co-european-banking-report 2932
European banking | Bain amp Company Inc
Page 27
Assets (euroB)
Sberbank
VTB 24
PKO BP
Bank Pekao
BRE Bank
ING Bank Slaski
Standard Bank
Absa
FirstRand
Nedbank
Investec
Tuumlrkiye İş Bankası
Tuumlrkiye Garanti
Ziraat Bankasi
Akbank
Yapı ve Kredi
3781
1857
463
361
244
187
928
766
729
647
330
869
777
708
706
568
CIS
Poland
South Africa
Turkey
Country Bank
Tuumlrkiye Halk Bankasi
Tuumlrkiye Vakıflar
Finansbank
471
467
239
Gazprombank
Russian Agricultural Bank
Alfa-Bank
Nomos-Bank
UniCredit Bank Russia
712
358
357
225
218
AKB Rosbank
Promsvyazbank
ZAO Raiffeisenbank
URALSIB Bank
Russian Standard Bank
AKB Probusinessbank
200
173
160
113
74
35
2011 assets
Bank Zachodni WBK + Kredyt Bank
Getin NobleBank
Bank Millennium
143
141
126
List of banks analyzed by country and assets
High-growth countries
7222019 Bain amp Co- European Banking Report
httpslidepdfcomreaderfullbain-co-european-banking-report 3032
European banking | Bain amp Company Inc
Page 28
Key contacts in Bainrsquos European Financial Services practice
Franco Baronio in Milan (francobaroniobaincom)Rocco DrsquoAcunto in Milan (roccodacuntobaincom)
Ada Di Marzo in Paris (adadimarzobaincom)
Bertrand Facq in Warsaw (bertrandfacqbaincom)
Fabrice Franzen in Johannesburg (fabricefranzenbaincom)
Thomas Herbeck in Frankfurt (thomasherbeckbaincom)
Karaca Kestelli in Istanbul (karacakestellibaincom)
Nicolaacutes Lopez in Madrid (nicolaslopezbaincom)
Niels Peder Nielsen in Copenhagen (nielspedernielsenbaincom)
Andrea Oldrini in Milan (andreaoldrinibaincom)
Mathijs Robbens in Amsterdam (mathijsrobbensbaincom)
Visar Sala in Moscow (visarsalabaincom)
Walter Sinn in Frankfurt (waltersinnbaincom)Joatildeo Soares in London (joaosoaresbaincom)
Acknowledgments
The authors would like to thank the following Bain colleagues for their valuable support in producing this report
Sonal Chawla Christian Duus Franccedilois Fastrez Farsan Ghassim and Shikha Mahato
See these related Bain perspectives at wwwbaincom
bull Managing risk and capital
bull How Europersquos banks can return to health
bull The digital challenge to retail banks
7222019 Bain amp Co- European Banking Report
httpslidepdfcomreaderfullbain-co-european-banking-report 3132
7222019 Bain amp Co- European Banking Report
httpslidepdfcomreaderfullbain-co-european-banking-report 3232
For more information visit wwwbaincom
Share983140 983105m983138io983150 Tru Rs983157983148ts
Bain amp Company is the management consulting firm that the worldrsquos business leaders come to whenthey want results
Bain advises clients on strategy operations technology organization private equity and mergers and acquisitions We develop
practical customized insights that clients act on and transfer skills that make change stick Founded in 1973 Bain has
48 offices in 31 countries and our deep expertise and client roster cross every industry and economic sector Our clients
have outperformed the stock market 4 to 1
What sets us apart
We believe a consulting firm should be more than an adviser So we put ourselves in our clientsrsquo shoes selling outcomes not
projects We align our incentives with our clientsrsquo by linking our fees to their results and collaborate to unlock the full potential
of their business Our Results Deliveryreg process builds our clientsrsquo capabilities and our True North values mean we do theright thing for our clients people and communitiesmdashalways
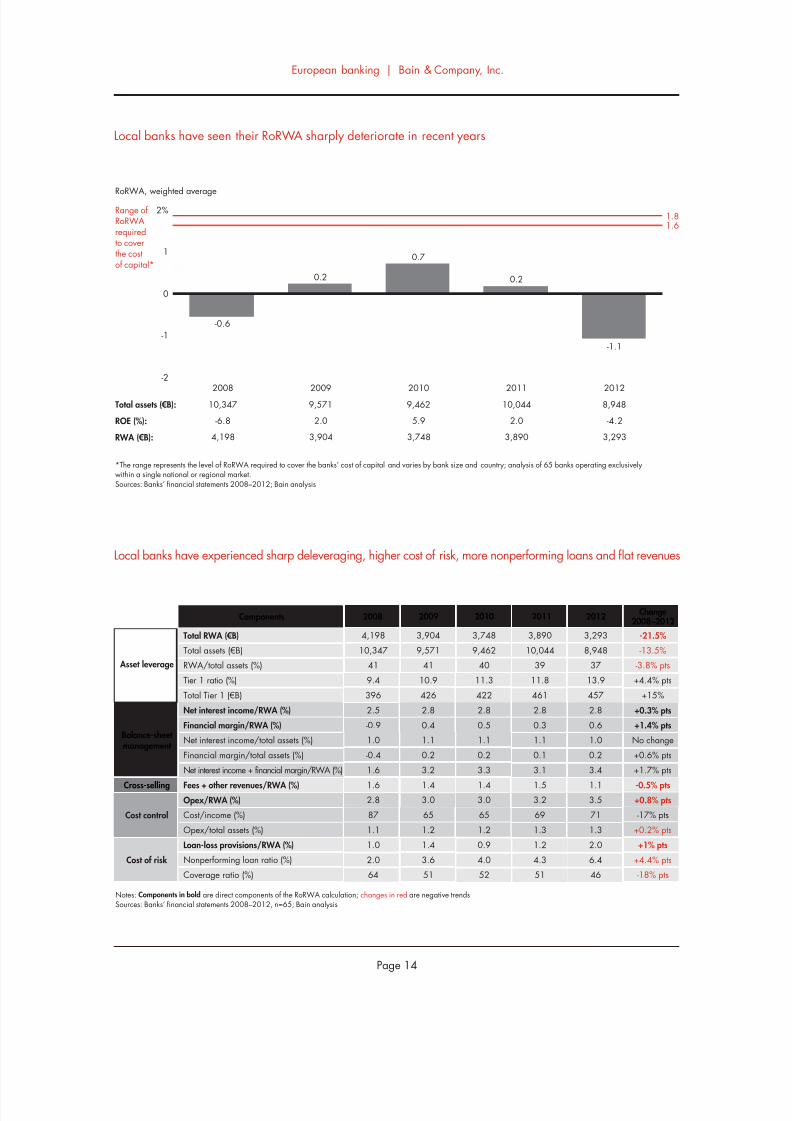
7222019 Bain amp Co- European Banking Report
httpslidepdfcomreaderfullbain-co-european-banking-report 1832
7222019 Bain amp Co- European Banking Report
httpslidepdfcomreaderfullbain-co-european-banking-report 1932
bull Countries with strong economic growth led the2012 RoRWA rankings Turkey took pole positionwith a 49 RoRWA In core Europe the Nordic
countries posed the strongest performance witha 19 RoRWA followed by Austria and theNetherlands The largest economies of Germanythe UK and France trailed behind
bull Banks in Italy Portugal Spain and Ireland whichhave been mired in the sovereign debt crisis anddeep economic recessions turned in the weakestRoRWA performances
bull Among the core European countries changes inRoRWAs from 2008 to 2012 stemmed mainly
from changes in three components net interestincome financial margin and loan-loss provisions
bull Countries that posted large positive changesmdashincluding Germany the Netherlands the Nordiccountries and the UKmdashbenefited from higherfinancial margins more control of operatingexpenditure and lower cost of risk Countries withlarge drops in RoRWAs were hurt by infl exiblecost structures which prevented them from shrinkingtheir production costs and a cost of risk that was
almost double the averagebull Northern Europe dominated the league tables
whether one looks at the 2012 leaders or themost improved banks For example the RoRWAleaders among both local and the 10 biggestbanks included banks in the Nordic countriesfollowed by those in the UK France Austria andthe Netherlands
bull In the most improved group banks in Switzer-land the Netherlands and Germany made a
strong showing
bull In high-growth countries Turkey and the Common-wealth of Independent States (CIS) took leadingpositions for the most improved banks and Turkeyfor the 2012 leaders
2Country and cluster
league tables
7222019 Bain amp Co- European Banking Report
httpslidepdfcomreaderfullbain-co-european-banking-report 2032
European banking | Bain amp Company Inc
Page 18
High-growth countries led the RoRWA rankings in 2012
Note For CIS the Netherlands Belgium Germany UK France Portugal and Spain one or two Tier-3 banks had not reported 2012 data by time of publicationso the analysis used 2011 data for those few banksSources Banksrsquo financial statements 2008ndash2012 n=121 Bain analysis
Rank 2012 RoRWA ()
Turkey
Poland
South Africa
CIS
Nordics
Austria
Netherlands
Belgium
Germany
UK
France
Switzerland
Italy
Portugal
Spain
Ireland
1
2
3
4
5
6
7
8
9
10
11
12
13
14
15
16
49
47
31
27
19
12
10
08
07
05
03
01
-06
-08
-17
-48
480
167
340
826
2357
334
2186
911
5514
7062
6320
1812
2127
426
2917
312
2012 total assets (euroB)Country 2008 RoRWA ()
33
41
35
10
13
19
-20
-25
-14
00
08
-76
07
10
19
10
7222019 Bain amp Co- European Banking Report
httpslidepdfcomreaderfullbain-co-european-banking-report 2132
European banking | Bain amp Company Inc
Page 19
In core European countries RoRWA changes from 2008 to 2012hellip
Note Averages are weighted for the total size of the respective components in each countrySources Banksrsquo financial statements 2008ndash2012 n=71 Bain analysis
RoRWA weighted average
-3
-2
-1
0
1
2
2008 average2012 average
UK
05
France
08
Germany
-14
07
Spain
19
-17
Nordics
13
19
Italy
07
-06
Netherlands
-20
10
2008 2012
0003
hellipwere spurred mainly by net interest income financial margin and loan-loss provisions
Note Averages are weighted for the total sizes of the respective indicators in each countrySources Banksrsquo financial statements 2008-2012 n=71 Bain analysis
NordicsGermany Spain
Total assets (euroB)
Total RWA (euroB)
Net interest incomeRWA ()
Financial marginRWA ()
Fees and commissions +other revenuesRWA ()
OpexRWA ()
Loan-loss provisionsRWA ()
France
7751
UK
2008 2012
AverageItaly Netherlands
7039
2474 2467
31 30
-02 12
26 15
41 42
14 10
5857 5715
1532 1327
26 38
-03 16
30 13
40 54
05 10
6054 5419
1534 1317
26 32
-19 07
14 17
27 43
08 06
1976 2917
1068 1315
36 43
06 06
17 10
27 35
13 41
1960 2357
790 735
27 32
-02 12
17 10
24 28
05 05
1990 2127
1266 1139
32 28
01 04
18 18
33 35
10 22
2263 2054
729 656
29 41
-17 06
15 10
39 38
09 09
2071 3947
928 1279
30 34
-05 10
17 14
32 41
08 15
7222019 Bain amp Co- European Banking Report
httpslidepdfcomreaderfullbain-co-european-banking-report 2232
European banking | Bain amp Company Inc
Page 20
These banks are the 2012 RoRWA leaders of their geographic cluster
Sources Banksrsquo financial statements 2008ndash2012 Bain analysis
Rank 2012 RoRWA ()
Nordics
UK
France
UK
Austria
Netherlands
Nordics
Nordics
Nordics
Turkey
Turkey
Turkey
1
2
3
1
2
3
1
2
3
1
2
3
19
18
16
23
17
16
40
39
36
158
132
48
Nordea
HSBC
BNP Paribas
Standard Chartered
Erste
ING
Swedbank
Sparebank 1 Group
Handelsbanken
Ziraat Bankasi
Akbank
Tuumlrkiye Halk
Bank Country 2008 RoRWA ()
16
08
06
24
19
02
20
NA
21
193
106
38
10biggest
Otherlarge
European
Local
High-growthcountries
These banks showed the biggest improvements in RoRWA over the past five years
Sources Banksrsquo financial statements 2008ndash2012 Bain analysis
Rank 2008ndash2012 change( points)
Switzerland
Switzerland
Germany
Belgium
UK
Netherlands
Netherlands
Belgium
Germany
CIS
Turkey
CIS
1
2
3
1
2
3
1
2
3
1
2
3
+83
+68
+21
+29
+26
+14
+64
+50
+33
+71
+26
+13
UBS
Credit Suisse
Deutsche Bank
KBC
RBS
ING
RBS Holdings NV
BNP Paribas Fortis
Bayerische Landesbank
Gazprombank
Akbank
VTB 24
Bank Country 2008 RoRWA ()
-92
-58
-19
-19
-37
02
-91
-45
-26
-56
106
05
10biggest
Otherlarge
European
Local
High-growthcountries
7222019 Bain amp Co- European Banking Report
httpslidepdfcomreaderfullbain-co-european-banking-report 2332
European banking | Bain amp Company Inc
Page 21
7222019 Bain amp Co- European Banking Report
httpslidepdfcomreaderfullbain-co-european-banking-report 2432
7222019 Bain amp Co- European Banking Report
httpslidepdfcomreaderfullbain-co-european-banking-report 2532
bull Europersquos environment continues to be volatile andinvestors are seeking better information about abankrsquos stability asset quality and key factors that
generate value RoRWA plays a useful role hereby focusing on the balance sheetmdashwhich enablescomparison between a bank and its peersmdashand byidentifying the factors influencing bank performance
bull Banks still need to address challenges along eachdimension of RoRWA in order to lift their profit-ability levels above the cost of capital In recent
years the profitability of lending assets has beensustained mainly by the fi nancial componentsincluding a boost from LTRO To raise asset prof-itability banks will have to better manage their
capital allocations and risk profilesbull The pressure on fee income will continue To offset
that trend banks should turn to their close clientrelationships for new sources of revenues
bull Lowering operating costs is the dimension thatwarrants managementrsquos attention at any bankregardless of size or location Initiatives that havethe greatest potential for tackling structural costsinclude adopting digital technologies and modern-izing IT platforms optimizing processes from endto end through outsourcing offshoring and other
means and expanding global procurement Suchinitiatives are essential for survival in an industrygoing through discontinuous change
bull Deleveraging the loan portfolio for riskier clients isa pressing issue which still poses significant threatsfor local banks In countries with a higher cost ofrisk and stagnant or negative GDP growth rateslocal banks may face further painful restructuring
bull Astute management of the cost of risk includingtaking a portfolio perspective offers opportunities
for most banksmdashin part to meet the new require-ments of Basel III and reassure rating agencies
bull Further consolidation of the local and other largebanks over the coming years will likely benefitthe 10 biggest banks and those in high-growthcountries These high-growth countries offer thegreatest opportunities for RoRWA growth for largeand pan-European players looking to diversifytheir portfolios
3Strategic
perspectives and
implications for
management
7222019 Bain amp Co- European Banking Report
httpslidepdfcomreaderfullbain-co-european-banking-report 2632
European banking | Bain amp Company Inc
Page 24
Significant restructuring is warranted for all banks but the nature of the challenge varies by geography
Source Bain analysis
10 biggest Strategic issueHigh-growth
countries
Other large
EuropeanLocal
Cross-selling
Balance-sheet
management
Cost structure
Cost of risk
Major threatThreatOpportunityMajor opportunity
Profitability of the asset portfolio has been sustained mainly by the
financial component Deleveraging of the loan portfolio for riskier
clients has been only partially successful and the risk profile of
the portfolio still has a long way to go
To counter pressure on fees banks should work systematically on
cross-selling opportunities through initiatives like client-focused
service models and CRM support
To further reduce costs banks should pursue new digital technologies
optimized processes through such means as outsourcing and offshoring
modernized IT platforms and global procurement initiatives
Active management of cost of risk demands more systematic solutions
bull NPL and LLP trends are threatening the stability of the overall
system and not only in individual countries such as Greece
bull Management of risky clients has become a core business and capability
bull Managing costs of risk demands an integrated portfolio approach
7222019 Bain amp Co- European Banking Report
httpslidepdfcomreaderfullbain-co-european-banking-report 2732
European banking | Bain amp Company Inc
Page 25
Assets (euroB)
Erste (AT)
Raiffeisen Bank (AT)
BNP Paribas Fortis
KBC
Belfius Banque
ING Belgium SANV
Creacutedit Agricole Groupe
BNP Paribas
Groupe Socieacuteteacute Geacuteneacuterale
Groupe BPCE
Creacutedit Mutuel
Deutsche Bank
Commerzbank AGKfW
DZ Bank AG
UniCredit Bank AG
2138
1202
2723
2569
2129
1691
17930
15439
12307
11475
6051
20123
63595116
4072
3483
Austria
Belgium
France
Germany
Country Bank Cluster
Other large
Local
Local
Other large
Local
Local
10 biggest
10 biggest
Other large
Local
Local
10 biggest
Other largeLocal
Local
Local
Ireland
Landesbank Baden-Wuumlrttemberg
Bayerische Landesbank
NORDLB
Helaba
HSH Nordbank
DekaBank
Landesbank Berlin Holding
Santander Consumer Bank
Hamburger Sparkasse
Deutsche Apotheker - und Aumlrztebank
Sparkasse KoumllnBonn
Kreissparkasse Koumlln
Bank of Ireland
Allied Irish Banks
permanent tsb Group Hldgs Plc
Intesa Sanpaolo
3363
2868
2256
1993
1306
1297
1183
403
396
379
299
248
1481
1225
409
6735
Local
Local
Local
Local
Local
Local
Local
Local
Local
Local
Local
Local
Other large
10 biggest
Local
Other large
Unicredit Group
Monte dei Paschi di Siena
4639
2189
10 biggest
Local
UBI Banca Group
Banco Popolare
BNL
Banca Popolare dellrsquoEmilia Romagna
Banca Popolare di Milano
Gruppo Banca Carige
Cariparma
Banca Popolare di Vicenza
Veneto Banca
1324
1319
912
616
525
493
493
467
402
Local
Local
Local
Local
Local
Local
Local
Local
Local
Italy
2011 assets
Bca Popdi Sondrio 322 Local
Credito Emiliano
Credito Valtellinese
Banca delle Marche
307
299
227
Local
Local
Local
List of banks analyzed by country and assets
10 biggest other large local
7222019 Bain amp Co- European Banking Report
httpslidepdfcomreaderfullbain-co-european-banking-report 2832
European banking | Bain amp Company Inc
Page 26
Assets (euroB)Country Bank Cluster
ING
Rabobank Group
ABN AMRO Group
SNS Reaal
RBS Holdings NV
8361
7524
3944
1322
710
Netherlands
Other large
Other large
Other large
Local
Local
Nordea 6774 10 biggest
Danske Bank
DNB
4682
3028
Other large
Local
SEB
Handelsbanken
Swedbank
Pohjola Bank
2818
2742
2121
998
Local
Local
Local
Local
Nordics
Jyske Bank 347 Local
Sparebank 1 Group 62 Local
Caixa Geral de Depositos 1169 Local
Millenium BCP
Banco Espiacuterito Santo
897
837
Local
Local
Banco BPI
Santander Totta SGPS
Caixa Econoacutemica Montepio Geral
Creacutedito Agriacutecola Muacutetuo
446
414
215
142
Local
Local
Local
Local
Portugal
BANIF 140 Local
SantanderBBVA
la Caixa
Banco Financiero y de Ahorros
Banco Sabadell SA
122826378
3591
3092
1615
Spain
10 biggestOther large
Local
Local
Local
Banco Popular
Banco Mare Nostrum
1576
634
Local
Local
UBS
Credit Suisse
10448
7669Switzerland
10 biggest
10 biggest
HSBC 20939 10 biggest
Barclays
Royal Bank of Scotland
17603
11521
10 biggest
Other large
Lloyds Banking Group
Standard Chartered
Nationwide Building Society
Co-operative Bank
11395
4950
2417
611
Other large
Other large
Local
Local
UK
Clydesdale Bank 545 Local
Yorkshire Building Society 413 Local
Virgin Money 223 Local
2011 assets
List of banks analyzed by country and assets
10 biggest other large localmdashcontinued
7222019 Bain amp Co- European Banking Report
httpslidepdfcomreaderfullbain-co-european-banking-report 2932
European banking | Bain amp Company Inc
Page 27
Assets (euroB)
Sberbank
VTB 24
PKO BP
Bank Pekao
BRE Bank
ING Bank Slaski
Standard Bank
Absa
FirstRand
Nedbank
Investec
Tuumlrkiye İş Bankası
Tuumlrkiye Garanti
Ziraat Bankasi
Akbank
Yapı ve Kredi
3781
1857
463
361
244
187
928
766
729
647
330
869
777
708
706
568
CIS
Poland
South Africa
Turkey
Country Bank
Tuumlrkiye Halk Bankasi
Tuumlrkiye Vakıflar
Finansbank
471
467
239
Gazprombank
Russian Agricultural Bank
Alfa-Bank
Nomos-Bank
UniCredit Bank Russia
712
358
357
225
218
AKB Rosbank
Promsvyazbank
ZAO Raiffeisenbank
URALSIB Bank
Russian Standard Bank
AKB Probusinessbank
200
173
160
113
74
35
2011 assets
Bank Zachodni WBK + Kredyt Bank
Getin NobleBank
Bank Millennium
143
141
126
List of banks analyzed by country and assets
High-growth countries
7222019 Bain amp Co- European Banking Report
httpslidepdfcomreaderfullbain-co-european-banking-report 3032
European banking | Bain amp Company Inc
Page 28
Key contacts in Bainrsquos European Financial Services practice
Franco Baronio in Milan (francobaroniobaincom)Rocco DrsquoAcunto in Milan (roccodacuntobaincom)
Ada Di Marzo in Paris (adadimarzobaincom)
Bertrand Facq in Warsaw (bertrandfacqbaincom)
Fabrice Franzen in Johannesburg (fabricefranzenbaincom)
Thomas Herbeck in Frankfurt (thomasherbeckbaincom)
Karaca Kestelli in Istanbul (karacakestellibaincom)
Nicolaacutes Lopez in Madrid (nicolaslopezbaincom)
Niels Peder Nielsen in Copenhagen (nielspedernielsenbaincom)
Andrea Oldrini in Milan (andreaoldrinibaincom)
Mathijs Robbens in Amsterdam (mathijsrobbensbaincom)
Visar Sala in Moscow (visarsalabaincom)
Walter Sinn in Frankfurt (waltersinnbaincom)Joatildeo Soares in London (joaosoaresbaincom)
Acknowledgments
The authors would like to thank the following Bain colleagues for their valuable support in producing this report
Sonal Chawla Christian Duus Franccedilois Fastrez Farsan Ghassim and Shikha Mahato
See these related Bain perspectives at wwwbaincom
bull Managing risk and capital
bull How Europersquos banks can return to health
bull The digital challenge to retail banks
7222019 Bain amp Co- European Banking Report
httpslidepdfcomreaderfullbain-co-european-banking-report 3132
7222019 Bain amp Co- European Banking Report
httpslidepdfcomreaderfullbain-co-european-banking-report 3232
For more information visit wwwbaincom
Share983140 983105m983138io983150 Tru Rs983157983148ts
Bain amp Company is the management consulting firm that the worldrsquos business leaders come to whenthey want results
Bain advises clients on strategy operations technology organization private equity and mergers and acquisitions We develop
practical customized insights that clients act on and transfer skills that make change stick Founded in 1973 Bain has
48 offices in 31 countries and our deep expertise and client roster cross every industry and economic sector Our clients
have outperformed the stock market 4 to 1
What sets us apart
We believe a consulting firm should be more than an adviser So we put ourselves in our clientsrsquo shoes selling outcomes not
projects We align our incentives with our clientsrsquo by linking our fees to their results and collaborate to unlock the full potential
of their business Our Results Deliveryreg process builds our clientsrsquo capabilities and our True North values mean we do theright thing for our clients people and communitiesmdashalways
7222019 Bain amp Co- European Banking Report
httpslidepdfcomreaderfullbain-co-european-banking-report 1932
bull Countries with strong economic growth led the2012 RoRWA rankings Turkey took pole positionwith a 49 RoRWA In core Europe the Nordic
countries posed the strongest performance witha 19 RoRWA followed by Austria and theNetherlands The largest economies of Germanythe UK and France trailed behind
bull Banks in Italy Portugal Spain and Ireland whichhave been mired in the sovereign debt crisis anddeep economic recessions turned in the weakestRoRWA performances
bull Among the core European countries changes inRoRWAs from 2008 to 2012 stemmed mainly
from changes in three components net interestincome financial margin and loan-loss provisions
bull Countries that posted large positive changesmdashincluding Germany the Netherlands the Nordiccountries and the UKmdashbenefited from higherfinancial margins more control of operatingexpenditure and lower cost of risk Countries withlarge drops in RoRWAs were hurt by infl exiblecost structures which prevented them from shrinkingtheir production costs and a cost of risk that was
almost double the averagebull Northern Europe dominated the league tables
whether one looks at the 2012 leaders or themost improved banks For example the RoRWAleaders among both local and the 10 biggestbanks included banks in the Nordic countriesfollowed by those in the UK France Austria andthe Netherlands
bull In the most improved group banks in Switzer-land the Netherlands and Germany made a
strong showing
bull In high-growth countries Turkey and the Common-wealth of Independent States (CIS) took leadingpositions for the most improved banks and Turkeyfor the 2012 leaders
2Country and cluster
league tables
7222019 Bain amp Co- European Banking Report
httpslidepdfcomreaderfullbain-co-european-banking-report 2032
European banking | Bain amp Company Inc
Page 18
High-growth countries led the RoRWA rankings in 2012
Note For CIS the Netherlands Belgium Germany UK France Portugal and Spain one or two Tier-3 banks had not reported 2012 data by time of publicationso the analysis used 2011 data for those few banksSources Banksrsquo financial statements 2008ndash2012 n=121 Bain analysis
Rank 2012 RoRWA ()
Turkey
Poland
South Africa
CIS
Nordics
Austria
Netherlands
Belgium
Germany
UK
France
Switzerland
Italy
Portugal
Spain
Ireland
1
2
3
4
5
6
7
8
9
10
11
12
13
14
15
16
49
47
31
27
19
12
10
08
07
05
03
01
-06
-08
-17
-48
480
167
340
826
2357
334
2186
911
5514
7062
6320
1812
2127
426
2917
312
2012 total assets (euroB)Country 2008 RoRWA ()
33
41
35
10
13
19
-20
-25
-14
00
08
-76
07
10
19
10
7222019 Bain amp Co- European Banking Report
httpslidepdfcomreaderfullbain-co-european-banking-report 2132
European banking | Bain amp Company Inc
Page 19
In core European countries RoRWA changes from 2008 to 2012hellip
Note Averages are weighted for the total size of the respective components in each countrySources Banksrsquo financial statements 2008ndash2012 n=71 Bain analysis
RoRWA weighted average
-3
-2
-1
0
1
2
2008 average2012 average
UK
05
France
08
Germany
-14
07
Spain
19
-17
Nordics
13
19
Italy
07
-06
Netherlands
-20
10
2008 2012
0003
hellipwere spurred mainly by net interest income financial margin and loan-loss provisions
Note Averages are weighted for the total sizes of the respective indicators in each countrySources Banksrsquo financial statements 2008-2012 n=71 Bain analysis
NordicsGermany Spain
Total assets (euroB)
Total RWA (euroB)
Net interest incomeRWA ()
Financial marginRWA ()
Fees and commissions +other revenuesRWA ()
OpexRWA ()
Loan-loss provisionsRWA ()
France
7751
UK
2008 2012
AverageItaly Netherlands
7039
2474 2467
31 30
-02 12
26 15
41 42
14 10
5857 5715
1532 1327
26 38
-03 16
30 13
40 54
05 10
6054 5419
1534 1317
26 32
-19 07
14 17
27 43
08 06
1976 2917
1068 1315
36 43
06 06
17 10
27 35
13 41
1960 2357
790 735
27 32
-02 12
17 10
24 28
05 05
1990 2127
1266 1139
32 28
01 04
18 18
33 35
10 22
2263 2054
729 656
29 41
-17 06
15 10
39 38
09 09
2071 3947
928 1279
30 34
-05 10
17 14
32 41
08 15
7222019 Bain amp Co- European Banking Report
httpslidepdfcomreaderfullbain-co-european-banking-report 2232
European banking | Bain amp Company Inc
Page 20
These banks are the 2012 RoRWA leaders of their geographic cluster
Sources Banksrsquo financial statements 2008ndash2012 Bain analysis
Rank 2012 RoRWA ()
Nordics
UK
France
UK
Austria
Netherlands
Nordics
Nordics
Nordics
Turkey
Turkey
Turkey
1
2
3
1
2
3
1
2
3
1
2
3
19
18
16
23
17
16
40
39
36
158
132
48
Nordea
HSBC
BNP Paribas
Standard Chartered
Erste
ING
Swedbank
Sparebank 1 Group
Handelsbanken
Ziraat Bankasi
Akbank
Tuumlrkiye Halk
Bank Country 2008 RoRWA ()
16
08
06
24
19
02
20
NA
21
193
106
38
10biggest
Otherlarge
European
Local
High-growthcountries
These banks showed the biggest improvements in RoRWA over the past five years
Sources Banksrsquo financial statements 2008ndash2012 Bain analysis
Rank 2008ndash2012 change( points)
Switzerland
Switzerland
Germany
Belgium
UK
Netherlands
Netherlands
Belgium
Germany
CIS
Turkey
CIS
1
2
3
1
2
3
1
2
3
1
2
3
+83
+68
+21
+29
+26
+14
+64
+50
+33
+71
+26
+13
UBS
Credit Suisse
Deutsche Bank
KBC
RBS
ING
RBS Holdings NV
BNP Paribas Fortis
Bayerische Landesbank
Gazprombank
Akbank
VTB 24
Bank Country 2008 RoRWA ()
-92
-58
-19
-19
-37
02
-91
-45
-26
-56
106
05
10biggest
Otherlarge
European
Local
High-growthcountries
7222019 Bain amp Co- European Banking Report
httpslidepdfcomreaderfullbain-co-european-banking-report 2332
European banking | Bain amp Company Inc
Page 21
7222019 Bain amp Co- European Banking Report
httpslidepdfcomreaderfullbain-co-european-banking-report 2432
7222019 Bain amp Co- European Banking Report
httpslidepdfcomreaderfullbain-co-european-banking-report 2532
bull Europersquos environment continues to be volatile andinvestors are seeking better information about abankrsquos stability asset quality and key factors that
generate value RoRWA plays a useful role hereby focusing on the balance sheetmdashwhich enablescomparison between a bank and its peersmdashand byidentifying the factors influencing bank performance
bull Banks still need to address challenges along eachdimension of RoRWA in order to lift their profit-ability levels above the cost of capital In recent
years the profitability of lending assets has beensustained mainly by the fi nancial componentsincluding a boost from LTRO To raise asset prof-itability banks will have to better manage their
capital allocations and risk profilesbull The pressure on fee income will continue To offset
that trend banks should turn to their close clientrelationships for new sources of revenues
bull Lowering operating costs is the dimension thatwarrants managementrsquos attention at any bankregardless of size or location Initiatives that havethe greatest potential for tackling structural costsinclude adopting digital technologies and modern-izing IT platforms optimizing processes from endto end through outsourcing offshoring and other
means and expanding global procurement Suchinitiatives are essential for survival in an industrygoing through discontinuous change
bull Deleveraging the loan portfolio for riskier clients isa pressing issue which still poses significant threatsfor local banks In countries with a higher cost ofrisk and stagnant or negative GDP growth rateslocal banks may face further painful restructuring
bull Astute management of the cost of risk includingtaking a portfolio perspective offers opportunities
for most banksmdashin part to meet the new require-ments of Basel III and reassure rating agencies
bull Further consolidation of the local and other largebanks over the coming years will likely benefitthe 10 biggest banks and those in high-growthcountries These high-growth countries offer thegreatest opportunities for RoRWA growth for largeand pan-European players looking to diversifytheir portfolios
3Strategic
perspectives and
implications for
management
7222019 Bain amp Co- European Banking Report
httpslidepdfcomreaderfullbain-co-european-banking-report 2632
European banking | Bain amp Company Inc
Page 24
Significant restructuring is warranted for all banks but the nature of the challenge varies by geography
Source Bain analysis
10 biggest Strategic issueHigh-growth
countries
Other large
EuropeanLocal
Cross-selling
Balance-sheet
management
Cost structure
Cost of risk
Major threatThreatOpportunityMajor opportunity
Profitability of the asset portfolio has been sustained mainly by the
financial component Deleveraging of the loan portfolio for riskier
clients has been only partially successful and the risk profile of
the portfolio still has a long way to go
To counter pressure on fees banks should work systematically on
cross-selling opportunities through initiatives like client-focused
service models and CRM support
To further reduce costs banks should pursue new digital technologies
optimized processes through such means as outsourcing and offshoring
modernized IT platforms and global procurement initiatives
Active management of cost of risk demands more systematic solutions
bull NPL and LLP trends are threatening the stability of the overall
system and not only in individual countries such as Greece
bull Management of risky clients has become a core business and capability
bull Managing costs of risk demands an integrated portfolio approach
7222019 Bain amp Co- European Banking Report
httpslidepdfcomreaderfullbain-co-european-banking-report 2732
European banking | Bain amp Company Inc
Page 25
Assets (euroB)
Erste (AT)
Raiffeisen Bank (AT)
BNP Paribas Fortis
KBC
Belfius Banque
ING Belgium SANV
Creacutedit Agricole Groupe
BNP Paribas
Groupe Socieacuteteacute Geacuteneacuterale
Groupe BPCE
Creacutedit Mutuel
Deutsche Bank
Commerzbank AGKfW
DZ Bank AG
UniCredit Bank AG
2138
1202
2723
2569
2129
1691
17930
15439
12307
11475
6051
20123
63595116
4072
3483
Austria
Belgium
France
Germany
Country Bank Cluster
Other large
Local
Local
Other large
Local
Local
10 biggest
10 biggest
Other large
Local
Local
10 biggest
Other largeLocal
Local
Local
Ireland
Landesbank Baden-Wuumlrttemberg
Bayerische Landesbank
NORDLB
Helaba
HSH Nordbank
DekaBank
Landesbank Berlin Holding
Santander Consumer Bank
Hamburger Sparkasse
Deutsche Apotheker - und Aumlrztebank
Sparkasse KoumllnBonn
Kreissparkasse Koumlln
Bank of Ireland
Allied Irish Banks
permanent tsb Group Hldgs Plc
Intesa Sanpaolo
3363
2868
2256
1993
1306
1297
1183
403
396
379
299
248
1481
1225
409
6735
Local
Local
Local
Local
Local
Local
Local
Local
Local
Local
Local
Local
Other large
10 biggest
Local
Other large
Unicredit Group
Monte dei Paschi di Siena
4639
2189
10 biggest
Local
UBI Banca Group
Banco Popolare
BNL
Banca Popolare dellrsquoEmilia Romagna
Banca Popolare di Milano
Gruppo Banca Carige
Cariparma
Banca Popolare di Vicenza
Veneto Banca
1324
1319
912
616
525
493
493
467
402
Local
Local
Local
Local
Local
Local
Local
Local
Local
Italy
2011 assets
Bca Popdi Sondrio 322 Local
Credito Emiliano
Credito Valtellinese
Banca delle Marche
307
299
227
Local
Local
Local
List of banks analyzed by country and assets
10 biggest other large local
7222019 Bain amp Co- European Banking Report
httpslidepdfcomreaderfullbain-co-european-banking-report 2832
European banking | Bain amp Company Inc
Page 26
Assets (euroB)Country Bank Cluster
ING
Rabobank Group
ABN AMRO Group
SNS Reaal
RBS Holdings NV
8361
7524
3944
1322
710
Netherlands
Other large
Other large
Other large
Local
Local
Nordea 6774 10 biggest
Danske Bank
DNB
4682
3028
Other large
Local
SEB
Handelsbanken
Swedbank
Pohjola Bank
2818
2742
2121
998
Local
Local
Local
Local
Nordics
Jyske Bank 347 Local
Sparebank 1 Group 62 Local
Caixa Geral de Depositos 1169 Local
Millenium BCP
Banco Espiacuterito Santo
897
837
Local
Local
Banco BPI
Santander Totta SGPS
Caixa Econoacutemica Montepio Geral
Creacutedito Agriacutecola Muacutetuo
446
414
215
142
Local
Local
Local
Local
Portugal
BANIF 140 Local
SantanderBBVA
la Caixa
Banco Financiero y de Ahorros
Banco Sabadell SA
122826378
3591
3092
1615
Spain
10 biggestOther large
Local
Local
Local
Banco Popular
Banco Mare Nostrum
1576
634
Local
Local
UBS
Credit Suisse
10448
7669Switzerland
10 biggest
10 biggest
HSBC 20939 10 biggest
Barclays
Royal Bank of Scotland
17603
11521
10 biggest
Other large
Lloyds Banking Group
Standard Chartered
Nationwide Building Society
Co-operative Bank
11395
4950
2417
611
Other large
Other large
Local
Local
UK
Clydesdale Bank 545 Local
Yorkshire Building Society 413 Local
Virgin Money 223 Local
2011 assets
List of banks analyzed by country and assets
10 biggest other large localmdashcontinued
7222019 Bain amp Co- European Banking Report
httpslidepdfcomreaderfullbain-co-european-banking-report 2932
European banking | Bain amp Company Inc
Page 27
Assets (euroB)
Sberbank
VTB 24
PKO BP
Bank Pekao
BRE Bank
ING Bank Slaski
Standard Bank
Absa
FirstRand
Nedbank
Investec
Tuumlrkiye İş Bankası
Tuumlrkiye Garanti
Ziraat Bankasi
Akbank
Yapı ve Kredi
3781
1857
463
361
244
187
928
766
729
647
330
869
777
708
706
568
CIS
Poland
South Africa
Turkey
Country Bank
Tuumlrkiye Halk Bankasi
Tuumlrkiye Vakıflar
Finansbank
471
467
239
Gazprombank
Russian Agricultural Bank
Alfa-Bank
Nomos-Bank
UniCredit Bank Russia
712
358
357
225
218
AKB Rosbank
Promsvyazbank
ZAO Raiffeisenbank
URALSIB Bank
Russian Standard Bank
AKB Probusinessbank
200
173
160
113
74
35
2011 assets
Bank Zachodni WBK + Kredyt Bank
Getin NobleBank
Bank Millennium
143
141
126
List of banks analyzed by country and assets
High-growth countries
7222019 Bain amp Co- European Banking Report
httpslidepdfcomreaderfullbain-co-european-banking-report 3032
European banking | Bain amp Company Inc
Page 28
Key contacts in Bainrsquos European Financial Services practice
Franco Baronio in Milan (francobaroniobaincom)Rocco DrsquoAcunto in Milan (roccodacuntobaincom)
Ada Di Marzo in Paris (adadimarzobaincom)
Bertrand Facq in Warsaw (bertrandfacqbaincom)
Fabrice Franzen in Johannesburg (fabricefranzenbaincom)
Thomas Herbeck in Frankfurt (thomasherbeckbaincom)
Karaca Kestelli in Istanbul (karacakestellibaincom)
Nicolaacutes Lopez in Madrid (nicolaslopezbaincom)
Niels Peder Nielsen in Copenhagen (nielspedernielsenbaincom)
Andrea Oldrini in Milan (andreaoldrinibaincom)
Mathijs Robbens in Amsterdam (mathijsrobbensbaincom)
Visar Sala in Moscow (visarsalabaincom)
Walter Sinn in Frankfurt (waltersinnbaincom)Joatildeo Soares in London (joaosoaresbaincom)
Acknowledgments
The authors would like to thank the following Bain colleagues for their valuable support in producing this report
Sonal Chawla Christian Duus Franccedilois Fastrez Farsan Ghassim and Shikha Mahato
See these related Bain perspectives at wwwbaincom
bull Managing risk and capital
bull How Europersquos banks can return to health
bull The digital challenge to retail banks
7222019 Bain amp Co- European Banking Report
httpslidepdfcomreaderfullbain-co-european-banking-report 3132
7222019 Bain amp Co- European Banking Report
httpslidepdfcomreaderfullbain-co-european-banking-report 3232
For more information visit wwwbaincom
Share983140 983105m983138io983150 Tru Rs983157983148ts
Bain amp Company is the management consulting firm that the worldrsquos business leaders come to whenthey want results
Bain advises clients on strategy operations technology organization private equity and mergers and acquisitions We develop
practical customized insights that clients act on and transfer skills that make change stick Founded in 1973 Bain has
48 offices in 31 countries and our deep expertise and client roster cross every industry and economic sector Our clients
have outperformed the stock market 4 to 1
What sets us apart
We believe a consulting firm should be more than an adviser So we put ourselves in our clientsrsquo shoes selling outcomes not
projects We align our incentives with our clientsrsquo by linking our fees to their results and collaborate to unlock the full potential
of their business Our Results Deliveryreg process builds our clientsrsquo capabilities and our True North values mean we do theright thing for our clients people and communitiesmdashalways
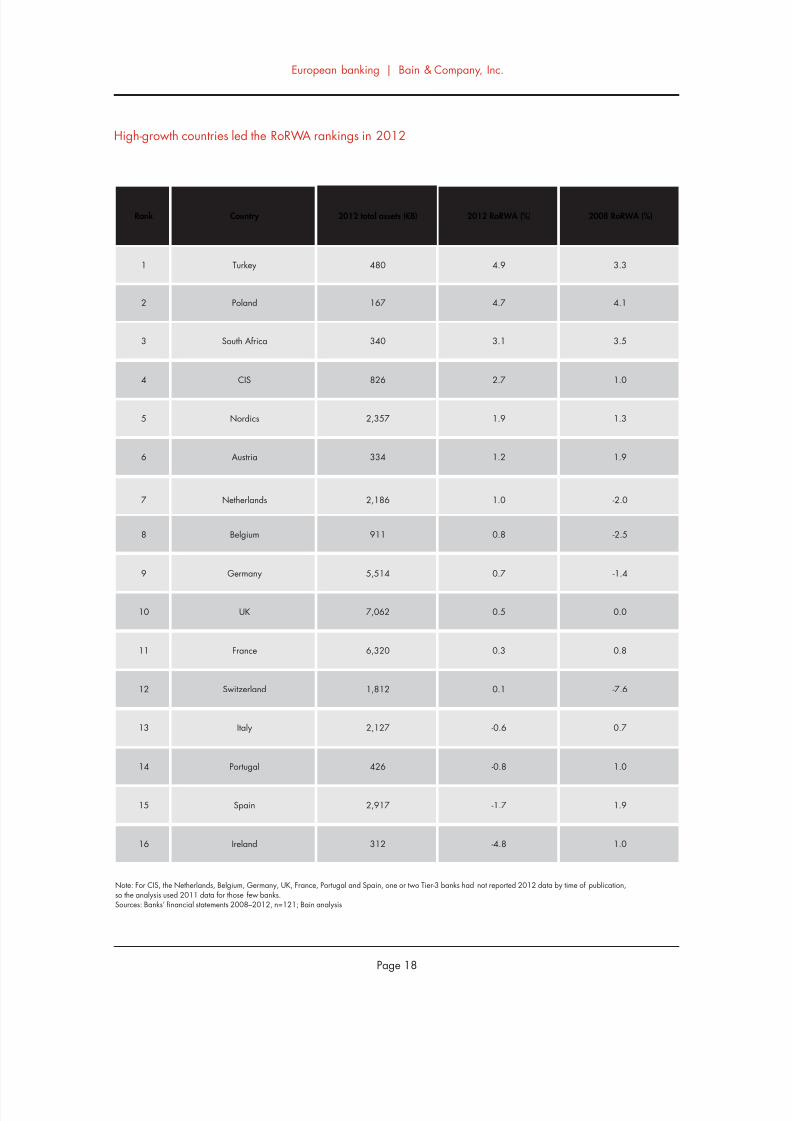
7222019 Bain amp Co- European Banking Report
httpslidepdfcomreaderfullbain-co-european-banking-report 2032
European banking | Bain amp Company Inc
Page 18
High-growth countries led the RoRWA rankings in 2012
Note For CIS the Netherlands Belgium Germany UK France Portugal and Spain one or two Tier-3 banks had not reported 2012 data by time of publicationso the analysis used 2011 data for those few banksSources Banksrsquo financial statements 2008ndash2012 n=121 Bain analysis
Rank 2012 RoRWA ()
Turkey
Poland
South Africa
CIS
Nordics
Austria
Netherlands
Belgium
Germany
UK
France
Switzerland
Italy
Portugal
Spain
Ireland
1
2
3
4
5
6
7
8
9
10
11
12
13
14
15
16
49
47
31
27
19
12
10
08
07
05
03
01
-06
-08
-17
-48
480
167
340
826
2357
334
2186
911
5514
7062
6320
1812
2127
426
2917
312
2012 total assets (euroB)Country 2008 RoRWA ()
33
41
35
10
13
19
-20
-25
-14
00
08
-76
07
10
19
10
7222019 Bain amp Co- European Banking Report
httpslidepdfcomreaderfullbain-co-european-banking-report 2132
European banking | Bain amp Company Inc
Page 19
In core European countries RoRWA changes from 2008 to 2012hellip
Note Averages are weighted for the total size of the respective components in each countrySources Banksrsquo financial statements 2008ndash2012 n=71 Bain analysis
RoRWA weighted average
-3
-2
-1
0
1
2
2008 average2012 average
UK
05
France
08
Germany
-14
07
Spain
19
-17
Nordics
13
19
Italy
07
-06
Netherlands
-20
10
2008 2012
0003
hellipwere spurred mainly by net interest income financial margin and loan-loss provisions
Note Averages are weighted for the total sizes of the respective indicators in each countrySources Banksrsquo financial statements 2008-2012 n=71 Bain analysis
NordicsGermany Spain
Total assets (euroB)
Total RWA (euroB)
Net interest incomeRWA ()
Financial marginRWA ()
Fees and commissions +other revenuesRWA ()
OpexRWA ()
Loan-loss provisionsRWA ()
France
7751
UK
2008 2012
AverageItaly Netherlands
7039
2474 2467
31 30
-02 12
26 15
41 42
14 10
5857 5715
1532 1327
26 38
-03 16
30 13
40 54
05 10
6054 5419
1534 1317
26 32
-19 07
14 17
27 43
08 06
1976 2917
1068 1315
36 43
06 06
17 10
27 35
13 41
1960 2357
790 735
27 32
-02 12
17 10
24 28
05 05
1990 2127
1266 1139
32 28
01 04
18 18
33 35
10 22
2263 2054
729 656
29 41
-17 06
15 10
39 38
09 09
2071 3947
928 1279
30 34
-05 10
17 14
32 41
08 15
7222019 Bain amp Co- European Banking Report
httpslidepdfcomreaderfullbain-co-european-banking-report 2232
European banking | Bain amp Company Inc
Page 20
These banks are the 2012 RoRWA leaders of their geographic cluster
Sources Banksrsquo financial statements 2008ndash2012 Bain analysis
Rank 2012 RoRWA ()
Nordics
UK
France
UK
Austria
Netherlands
Nordics
Nordics
Nordics
Turkey
Turkey
Turkey
1
2
3
1
2
3
1
2
3
1
2
3
19
18
16
23
17
16
40
39
36
158
132
48
Nordea
HSBC
BNP Paribas
Standard Chartered
Erste
ING
Swedbank
Sparebank 1 Group
Handelsbanken
Ziraat Bankasi
Akbank
Tuumlrkiye Halk
Bank Country 2008 RoRWA ()
16
08
06
24
19
02
20
NA
21
193
106
38
10biggest
Otherlarge
European
Local
High-growthcountries
These banks showed the biggest improvements in RoRWA over the past five years
Sources Banksrsquo financial statements 2008ndash2012 Bain analysis
Rank 2008ndash2012 change( points)
Switzerland
Switzerland
Germany
Belgium
UK
Netherlands
Netherlands
Belgium
Germany
CIS
Turkey
CIS
1
2
3
1
2
3
1
2
3
1
2
3
+83
+68
+21
+29
+26
+14
+64
+50
+33
+71
+26
+13
UBS
Credit Suisse
Deutsche Bank
KBC
RBS
ING
RBS Holdings NV
BNP Paribas Fortis
Bayerische Landesbank
Gazprombank
Akbank
VTB 24
Bank Country 2008 RoRWA ()
-92
-58
-19
-19
-37
02
-91
-45
-26
-56
106
05
10biggest
Otherlarge
European
Local
High-growthcountries
7222019 Bain amp Co- European Banking Report
httpslidepdfcomreaderfullbain-co-european-banking-report 2332
European banking | Bain amp Company Inc
Page 21
7222019 Bain amp Co- European Banking Report
httpslidepdfcomreaderfullbain-co-european-banking-report 2432
7222019 Bain amp Co- European Banking Report
httpslidepdfcomreaderfullbain-co-european-banking-report 2532
bull Europersquos environment continues to be volatile andinvestors are seeking better information about abankrsquos stability asset quality and key factors that
generate value RoRWA plays a useful role hereby focusing on the balance sheetmdashwhich enablescomparison between a bank and its peersmdashand byidentifying the factors influencing bank performance
bull Banks still need to address challenges along eachdimension of RoRWA in order to lift their profit-ability levels above the cost of capital In recent
years the profitability of lending assets has beensustained mainly by the fi nancial componentsincluding a boost from LTRO To raise asset prof-itability banks will have to better manage their
capital allocations and risk profilesbull The pressure on fee income will continue To offset
that trend banks should turn to their close clientrelationships for new sources of revenues
bull Lowering operating costs is the dimension thatwarrants managementrsquos attention at any bankregardless of size or location Initiatives that havethe greatest potential for tackling structural costsinclude adopting digital technologies and modern-izing IT platforms optimizing processes from endto end through outsourcing offshoring and other
means and expanding global procurement Suchinitiatives are essential for survival in an industrygoing through discontinuous change
bull Deleveraging the loan portfolio for riskier clients isa pressing issue which still poses significant threatsfor local banks In countries with a higher cost ofrisk and stagnant or negative GDP growth rateslocal banks may face further painful restructuring
bull Astute management of the cost of risk includingtaking a portfolio perspective offers opportunities
for most banksmdashin part to meet the new require-ments of Basel III and reassure rating agencies
bull Further consolidation of the local and other largebanks over the coming years will likely benefitthe 10 biggest banks and those in high-growthcountries These high-growth countries offer thegreatest opportunities for RoRWA growth for largeand pan-European players looking to diversifytheir portfolios
3Strategic
perspectives and
implications for
management
7222019 Bain amp Co- European Banking Report
httpslidepdfcomreaderfullbain-co-european-banking-report 2632
European banking | Bain amp Company Inc
Page 24
Significant restructuring is warranted for all banks but the nature of the challenge varies by geography
Source Bain analysis
10 biggest Strategic issueHigh-growth
countries
Other large
EuropeanLocal
Cross-selling
Balance-sheet
management
Cost structure
Cost of risk
Major threatThreatOpportunityMajor opportunity
Profitability of the asset portfolio has been sustained mainly by the
financial component Deleveraging of the loan portfolio for riskier
clients has been only partially successful and the risk profile of
the portfolio still has a long way to go
To counter pressure on fees banks should work systematically on
cross-selling opportunities through initiatives like client-focused
service models and CRM support
To further reduce costs banks should pursue new digital technologies
optimized processes through such means as outsourcing and offshoring
modernized IT platforms and global procurement initiatives
Active management of cost of risk demands more systematic solutions
bull NPL and LLP trends are threatening the stability of the overall
system and not only in individual countries such as Greece
bull Management of risky clients has become a core business and capability
bull Managing costs of risk demands an integrated portfolio approach
7222019 Bain amp Co- European Banking Report
httpslidepdfcomreaderfullbain-co-european-banking-report 2732
European banking | Bain amp Company Inc
Page 25
Assets (euroB)
Erste (AT)
Raiffeisen Bank (AT)
BNP Paribas Fortis
KBC
Belfius Banque
ING Belgium SANV
Creacutedit Agricole Groupe
BNP Paribas
Groupe Socieacuteteacute Geacuteneacuterale
Groupe BPCE
Creacutedit Mutuel
Deutsche Bank
Commerzbank AGKfW
DZ Bank AG
UniCredit Bank AG
2138
1202
2723
2569
2129
1691
17930
15439
12307
11475
6051
20123
63595116
4072
3483
Austria
Belgium
France
Germany
Country Bank Cluster
Other large
Local
Local
Other large
Local
Local
10 biggest
10 biggest
Other large
Local
Local
10 biggest
Other largeLocal
Local
Local
Ireland
Landesbank Baden-Wuumlrttemberg
Bayerische Landesbank
NORDLB
Helaba
HSH Nordbank
DekaBank
Landesbank Berlin Holding
Santander Consumer Bank
Hamburger Sparkasse
Deutsche Apotheker - und Aumlrztebank
Sparkasse KoumllnBonn
Kreissparkasse Koumlln
Bank of Ireland
Allied Irish Banks
permanent tsb Group Hldgs Plc
Intesa Sanpaolo
3363
2868
2256
1993
1306
1297
1183
403
396
379
299
248
1481
1225
409
6735
Local
Local
Local
Local
Local
Local
Local
Local
Local
Local
Local
Local
Other large
10 biggest
Local
Other large
Unicredit Group
Monte dei Paschi di Siena
4639
2189
10 biggest
Local
UBI Banca Group
Banco Popolare
BNL
Banca Popolare dellrsquoEmilia Romagna
Banca Popolare di Milano
Gruppo Banca Carige
Cariparma
Banca Popolare di Vicenza
Veneto Banca
1324
1319
912
616
525
493
493
467
402
Local
Local
Local
Local
Local
Local
Local
Local
Local
Italy
2011 assets
Bca Popdi Sondrio 322 Local
Credito Emiliano
Credito Valtellinese
Banca delle Marche
307
299
227
Local
Local
Local
List of banks analyzed by country and assets
10 biggest other large local
7222019 Bain amp Co- European Banking Report
httpslidepdfcomreaderfullbain-co-european-banking-report 2832
European banking | Bain amp Company Inc
Page 26
Assets (euroB)Country Bank Cluster
ING
Rabobank Group
ABN AMRO Group
SNS Reaal
RBS Holdings NV
8361
7524
3944
1322
710
Netherlands
Other large
Other large
Other large
Local
Local
Nordea 6774 10 biggest
Danske Bank
DNB
4682
3028
Other large
Local
SEB
Handelsbanken
Swedbank
Pohjola Bank
2818
2742
2121
998
Local
Local
Local
Local
Nordics
Jyske Bank 347 Local
Sparebank 1 Group 62 Local
Caixa Geral de Depositos 1169 Local
Millenium BCP
Banco Espiacuterito Santo
897
837
Local
Local
Banco BPI
Santander Totta SGPS
Caixa Econoacutemica Montepio Geral
Creacutedito Agriacutecola Muacutetuo
446
414
215
142
Local
Local
Local
Local
Portugal
BANIF 140 Local
SantanderBBVA
la Caixa
Banco Financiero y de Ahorros
Banco Sabadell SA
122826378
3591
3092
1615
Spain
10 biggestOther large
Local
Local
Local
Banco Popular
Banco Mare Nostrum
1576
634
Local
Local
UBS
Credit Suisse
10448
7669Switzerland
10 biggest
10 biggest
HSBC 20939 10 biggest
Barclays
Royal Bank of Scotland
17603
11521
10 biggest
Other large
Lloyds Banking Group
Standard Chartered
Nationwide Building Society
Co-operative Bank
11395
4950
2417
611
Other large
Other large
Local
Local
UK
Clydesdale Bank 545 Local
Yorkshire Building Society 413 Local
Virgin Money 223 Local
2011 assets
List of banks analyzed by country and assets
10 biggest other large localmdashcontinued
7222019 Bain amp Co- European Banking Report
httpslidepdfcomreaderfullbain-co-european-banking-report 2932
European banking | Bain amp Company Inc
Page 27
Assets (euroB)
Sberbank
VTB 24
PKO BP
Bank Pekao
BRE Bank
ING Bank Slaski
Standard Bank
Absa
FirstRand
Nedbank
Investec
Tuumlrkiye İş Bankası
Tuumlrkiye Garanti
Ziraat Bankasi
Akbank
Yapı ve Kredi
3781
1857
463
361
244
187
928
766
729
647
330
869
777
708
706
568
CIS
Poland
South Africa
Turkey
Country Bank
Tuumlrkiye Halk Bankasi
Tuumlrkiye Vakıflar
Finansbank
471
467
239
Gazprombank
Russian Agricultural Bank
Alfa-Bank
Nomos-Bank
UniCredit Bank Russia
712
358
357
225
218
AKB Rosbank
Promsvyazbank
ZAO Raiffeisenbank
URALSIB Bank
Russian Standard Bank
AKB Probusinessbank
200
173
160
113
74
35
2011 assets
Bank Zachodni WBK + Kredyt Bank
Getin NobleBank
Bank Millennium
143
141
126
List of banks analyzed by country and assets
High-growth countries
7222019 Bain amp Co- European Banking Report
httpslidepdfcomreaderfullbain-co-european-banking-report 3032
European banking | Bain amp Company Inc
Page 28
Key contacts in Bainrsquos European Financial Services practice
Franco Baronio in Milan (francobaroniobaincom)Rocco DrsquoAcunto in Milan (roccodacuntobaincom)
Ada Di Marzo in Paris (adadimarzobaincom)
Bertrand Facq in Warsaw (bertrandfacqbaincom)
Fabrice Franzen in Johannesburg (fabricefranzenbaincom)
Thomas Herbeck in Frankfurt (thomasherbeckbaincom)
Karaca Kestelli in Istanbul (karacakestellibaincom)
Nicolaacutes Lopez in Madrid (nicolaslopezbaincom)
Niels Peder Nielsen in Copenhagen (nielspedernielsenbaincom)
Andrea Oldrini in Milan (andreaoldrinibaincom)
Mathijs Robbens in Amsterdam (mathijsrobbensbaincom)
Visar Sala in Moscow (visarsalabaincom)
Walter Sinn in Frankfurt (waltersinnbaincom)Joatildeo Soares in London (joaosoaresbaincom)
Acknowledgments
The authors would like to thank the following Bain colleagues for their valuable support in producing this report
Sonal Chawla Christian Duus Franccedilois Fastrez Farsan Ghassim and Shikha Mahato
See these related Bain perspectives at wwwbaincom
bull Managing risk and capital
bull How Europersquos banks can return to health
bull The digital challenge to retail banks
7222019 Bain amp Co- European Banking Report
httpslidepdfcomreaderfullbain-co-european-banking-report 3132
7222019 Bain amp Co- European Banking Report
httpslidepdfcomreaderfullbain-co-european-banking-report 3232
For more information visit wwwbaincom
Share983140 983105m983138io983150 Tru Rs983157983148ts
Bain amp Company is the management consulting firm that the worldrsquos business leaders come to whenthey want results
Bain advises clients on strategy operations technology organization private equity and mergers and acquisitions We develop
practical customized insights that clients act on and transfer skills that make change stick Founded in 1973 Bain has
48 offices in 31 countries and our deep expertise and client roster cross every industry and economic sector Our clients
have outperformed the stock market 4 to 1
What sets us apart
We believe a consulting firm should be more than an adviser So we put ourselves in our clientsrsquo shoes selling outcomes not
projects We align our incentives with our clientsrsquo by linking our fees to their results and collaborate to unlock the full potential
of their business Our Results Deliveryreg process builds our clientsrsquo capabilities and our True North values mean we do theright thing for our clients people and communitiesmdashalways
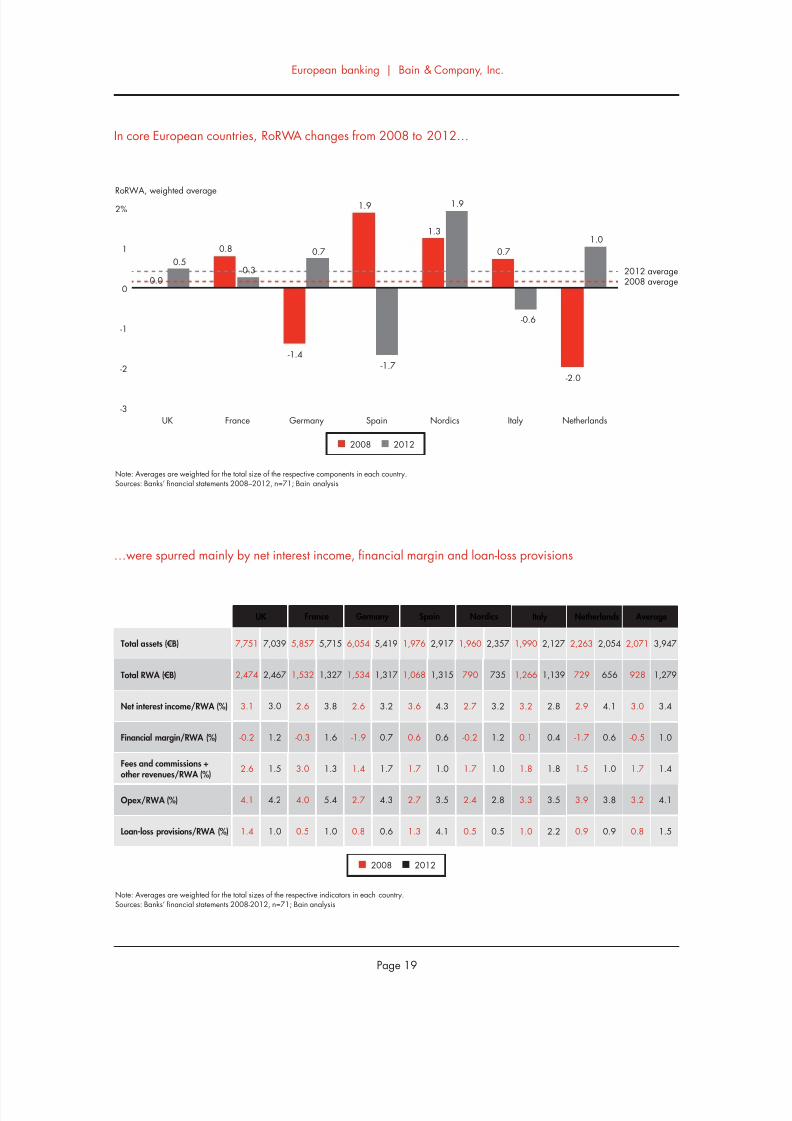
7222019 Bain amp Co- European Banking Report
httpslidepdfcomreaderfullbain-co-european-banking-report 2132
European banking | Bain amp Company Inc
Page 19
In core European countries RoRWA changes from 2008 to 2012hellip
Note Averages are weighted for the total size of the respective components in each countrySources Banksrsquo financial statements 2008ndash2012 n=71 Bain analysis
RoRWA weighted average
-3
-2
-1
0
1
2
2008 average2012 average
UK
05
France
08
Germany
-14
07
Spain
19
-17
Nordics
13
19
Italy
07
-06
Netherlands
-20
10
2008 2012
0003
hellipwere spurred mainly by net interest income financial margin and loan-loss provisions
Note Averages are weighted for the total sizes of the respective indicators in each countrySources Banksrsquo financial statements 2008-2012 n=71 Bain analysis
NordicsGermany Spain
Total assets (euroB)
Total RWA (euroB)
Net interest incomeRWA ()
Financial marginRWA ()
Fees and commissions +other revenuesRWA ()
OpexRWA ()
Loan-loss provisionsRWA ()
France
7751
UK
2008 2012
AverageItaly Netherlands
7039
2474 2467
31 30
-02 12
26 15
41 42
14 10
5857 5715
1532 1327
26 38
-03 16
30 13
40 54
05 10
6054 5419
1534 1317
26 32
-19 07
14 17
27 43
08 06
1976 2917
1068 1315
36 43
06 06
17 10
27 35
13 41
1960 2357
790 735
27 32
-02 12
17 10
24 28
05 05
1990 2127
1266 1139
32 28
01 04
18 18
33 35
10 22
2263 2054
729 656
29 41
-17 06
15 10
39 38
09 09
2071 3947
928 1279
30 34
-05 10
17 14
32 41
08 15
7222019 Bain amp Co- European Banking Report
httpslidepdfcomreaderfullbain-co-european-banking-report 2232
European banking | Bain amp Company Inc
Page 20
These banks are the 2012 RoRWA leaders of their geographic cluster
Sources Banksrsquo financial statements 2008ndash2012 Bain analysis
Rank 2012 RoRWA ()
Nordics
UK
France
UK
Austria
Netherlands
Nordics
Nordics
Nordics
Turkey
Turkey
Turkey
1
2
3
1
2
3
1
2
3
1
2
3
19
18
16
23
17
16
40
39
36
158
132
48
Nordea
HSBC
BNP Paribas
Standard Chartered
Erste
ING
Swedbank
Sparebank 1 Group
Handelsbanken
Ziraat Bankasi
Akbank
Tuumlrkiye Halk
Bank Country 2008 RoRWA ()
16
08
06
24
19
02
20
NA
21
193
106
38
10biggest
Otherlarge
European
Local
High-growthcountries
These banks showed the biggest improvements in RoRWA over the past five years
Sources Banksrsquo financial statements 2008ndash2012 Bain analysis
Rank 2008ndash2012 change( points)
Switzerland
Switzerland
Germany
Belgium
UK
Netherlands
Netherlands
Belgium
Germany
CIS
Turkey
CIS
1
2
3
1
2
3
1
2
3
1
2
3
+83
+68
+21
+29
+26
+14
+64
+50
+33
+71
+26
+13
UBS
Credit Suisse
Deutsche Bank
KBC
RBS
ING
RBS Holdings NV
BNP Paribas Fortis
Bayerische Landesbank
Gazprombank
Akbank
VTB 24
Bank Country 2008 RoRWA ()
-92
-58
-19
-19
-37
02
-91
-45
-26
-56
106
05
10biggest
Otherlarge
European
Local
High-growthcountries
7222019 Bain amp Co- European Banking Report
httpslidepdfcomreaderfullbain-co-european-banking-report 2332
European banking | Bain amp Company Inc
Page 21
7222019 Bain amp Co- European Banking Report
httpslidepdfcomreaderfullbain-co-european-banking-report 2432
7222019 Bain amp Co- European Banking Report
httpslidepdfcomreaderfullbain-co-european-banking-report 2532
bull Europersquos environment continues to be volatile andinvestors are seeking better information about abankrsquos stability asset quality and key factors that
generate value RoRWA plays a useful role hereby focusing on the balance sheetmdashwhich enablescomparison between a bank and its peersmdashand byidentifying the factors influencing bank performance
bull Banks still need to address challenges along eachdimension of RoRWA in order to lift their profit-ability levels above the cost of capital In recent
years the profitability of lending assets has beensustained mainly by the fi nancial componentsincluding a boost from LTRO To raise asset prof-itability banks will have to better manage their
capital allocations and risk profilesbull The pressure on fee income will continue To offset
that trend banks should turn to their close clientrelationships for new sources of revenues
bull Lowering operating costs is the dimension thatwarrants managementrsquos attention at any bankregardless of size or location Initiatives that havethe greatest potential for tackling structural costsinclude adopting digital technologies and modern-izing IT platforms optimizing processes from endto end through outsourcing offshoring and other
means and expanding global procurement Suchinitiatives are essential for survival in an industrygoing through discontinuous change
bull Deleveraging the loan portfolio for riskier clients isa pressing issue which still poses significant threatsfor local banks In countries with a higher cost ofrisk and stagnant or negative GDP growth rateslocal banks may face further painful restructuring
bull Astute management of the cost of risk includingtaking a portfolio perspective offers opportunities
for most banksmdashin part to meet the new require-ments of Basel III and reassure rating agencies
bull Further consolidation of the local and other largebanks over the coming years will likely benefitthe 10 biggest banks and those in high-growthcountries These high-growth countries offer thegreatest opportunities for RoRWA growth for largeand pan-European players looking to diversifytheir portfolios
3Strategic
perspectives and
implications for
management
7222019 Bain amp Co- European Banking Report
httpslidepdfcomreaderfullbain-co-european-banking-report 2632
European banking | Bain amp Company Inc
Page 24
Significant restructuring is warranted for all banks but the nature of the challenge varies by geography
Source Bain analysis
10 biggest Strategic issueHigh-growth
countries
Other large
EuropeanLocal
Cross-selling
Balance-sheet
management
Cost structure
Cost of risk
Major threatThreatOpportunityMajor opportunity
Profitability of the asset portfolio has been sustained mainly by the
financial component Deleveraging of the loan portfolio for riskier
clients has been only partially successful and the risk profile of
the portfolio still has a long way to go
To counter pressure on fees banks should work systematically on
cross-selling opportunities through initiatives like client-focused
service models and CRM support
To further reduce costs banks should pursue new digital technologies
optimized processes through such means as outsourcing and offshoring
modernized IT platforms and global procurement initiatives
Active management of cost of risk demands more systematic solutions
bull NPL and LLP trends are threatening the stability of the overall
system and not only in individual countries such as Greece
bull Management of risky clients has become a core business and capability
bull Managing costs of risk demands an integrated portfolio approach
7222019 Bain amp Co- European Banking Report
httpslidepdfcomreaderfullbain-co-european-banking-report 2732
European banking | Bain amp Company Inc
Page 25
Assets (euroB)
Erste (AT)
Raiffeisen Bank (AT)
BNP Paribas Fortis
KBC
Belfius Banque
ING Belgium SANV
Creacutedit Agricole Groupe
BNP Paribas
Groupe Socieacuteteacute Geacuteneacuterale
Groupe BPCE
Creacutedit Mutuel
Deutsche Bank
Commerzbank AGKfW
DZ Bank AG
UniCredit Bank AG
2138
1202
2723
2569
2129
1691
17930
15439
12307
11475
6051
20123
63595116
4072
3483
Austria
Belgium
France
Germany
Country Bank Cluster
Other large
Local
Local
Other large
Local
Local
10 biggest
10 biggest
Other large
Local
Local
10 biggest
Other largeLocal
Local
Local
Ireland
Landesbank Baden-Wuumlrttemberg
Bayerische Landesbank
NORDLB
Helaba
HSH Nordbank
DekaBank
Landesbank Berlin Holding
Santander Consumer Bank
Hamburger Sparkasse
Deutsche Apotheker - und Aumlrztebank
Sparkasse KoumllnBonn
Kreissparkasse Koumlln
Bank of Ireland
Allied Irish Banks
permanent tsb Group Hldgs Plc
Intesa Sanpaolo
3363
2868
2256
1993
1306
1297
1183
403
396
379
299
248
1481
1225
409
6735
Local
Local
Local
Local
Local
Local
Local
Local
Local
Local
Local
Local
Other large
10 biggest
Local
Other large
Unicredit Group
Monte dei Paschi di Siena
4639
2189
10 biggest
Local
UBI Banca Group
Banco Popolare
BNL
Banca Popolare dellrsquoEmilia Romagna
Banca Popolare di Milano
Gruppo Banca Carige
Cariparma
Banca Popolare di Vicenza
Veneto Banca
1324
1319
912
616
525
493
493
467
402
Local
Local
Local
Local
Local
Local
Local
Local
Local
Italy
2011 assets
Bca Popdi Sondrio 322 Local
Credito Emiliano
Credito Valtellinese
Banca delle Marche
307
299
227
Local
Local
Local
List of banks analyzed by country and assets
10 biggest other large local
7222019 Bain amp Co- European Banking Report
httpslidepdfcomreaderfullbain-co-european-banking-report 2832
European banking | Bain amp Company Inc
Page 26
Assets (euroB)Country Bank Cluster
ING
Rabobank Group
ABN AMRO Group
SNS Reaal
RBS Holdings NV
8361
7524
3944
1322
710
Netherlands
Other large
Other large
Other large
Local
Local
Nordea 6774 10 biggest
Danske Bank
DNB
4682
3028
Other large
Local
SEB
Handelsbanken
Swedbank
Pohjola Bank
2818
2742
2121
998
Local
Local
Local
Local
Nordics
Jyske Bank 347 Local
Sparebank 1 Group 62 Local
Caixa Geral de Depositos 1169 Local
Millenium BCP
Banco Espiacuterito Santo
897
837
Local
Local
Banco BPI
Santander Totta SGPS
Caixa Econoacutemica Montepio Geral
Creacutedito Agriacutecola Muacutetuo
446
414
215
142
Local
Local
Local
Local
Portugal
BANIF 140 Local
SantanderBBVA
la Caixa
Banco Financiero y de Ahorros
Banco Sabadell SA
122826378
3591
3092
1615
Spain
10 biggestOther large
Local
Local
Local
Banco Popular
Banco Mare Nostrum
1576
634
Local
Local
UBS
Credit Suisse
10448
7669Switzerland
10 biggest
10 biggest
HSBC 20939 10 biggest
Barclays
Royal Bank of Scotland
17603
11521
10 biggest
Other large
Lloyds Banking Group
Standard Chartered
Nationwide Building Society
Co-operative Bank
11395
4950
2417
611
Other large
Other large
Local
Local
UK
Clydesdale Bank 545 Local
Yorkshire Building Society 413 Local
Virgin Money 223 Local
2011 assets
List of banks analyzed by country and assets
10 biggest other large localmdashcontinued
7222019 Bain amp Co- European Banking Report
httpslidepdfcomreaderfullbain-co-european-banking-report 2932
European banking | Bain amp Company Inc
Page 27
Assets (euroB)
Sberbank
VTB 24
PKO BP
Bank Pekao
BRE Bank
ING Bank Slaski
Standard Bank
Absa
FirstRand
Nedbank
Investec
Tuumlrkiye İş Bankası
Tuumlrkiye Garanti
Ziraat Bankasi
Akbank
Yapı ve Kredi
3781
1857
463
361
244
187
928
766
729
647
330
869
777
708
706
568
CIS
Poland
South Africa
Turkey
Country Bank
Tuumlrkiye Halk Bankasi
Tuumlrkiye Vakıflar
Finansbank
471
467
239
Gazprombank
Russian Agricultural Bank
Alfa-Bank
Nomos-Bank
UniCredit Bank Russia
712
358
357
225
218
AKB Rosbank
Promsvyazbank
ZAO Raiffeisenbank
URALSIB Bank
Russian Standard Bank
AKB Probusinessbank
200
173
160
113
74
35
2011 assets
Bank Zachodni WBK + Kredyt Bank
Getin NobleBank
Bank Millennium
143
141
126
List of banks analyzed by country and assets
High-growth countries
7222019 Bain amp Co- European Banking Report
httpslidepdfcomreaderfullbain-co-european-banking-report 3032
European banking | Bain amp Company Inc
Page 28
Key contacts in Bainrsquos European Financial Services practice
Franco Baronio in Milan (francobaroniobaincom)Rocco DrsquoAcunto in Milan (roccodacuntobaincom)
Ada Di Marzo in Paris (adadimarzobaincom)
Bertrand Facq in Warsaw (bertrandfacqbaincom)
Fabrice Franzen in Johannesburg (fabricefranzenbaincom)
Thomas Herbeck in Frankfurt (thomasherbeckbaincom)
Karaca Kestelli in Istanbul (karacakestellibaincom)
Nicolaacutes Lopez in Madrid (nicolaslopezbaincom)
Niels Peder Nielsen in Copenhagen (nielspedernielsenbaincom)
Andrea Oldrini in Milan (andreaoldrinibaincom)
Mathijs Robbens in Amsterdam (mathijsrobbensbaincom)
Visar Sala in Moscow (visarsalabaincom)
Walter Sinn in Frankfurt (waltersinnbaincom)Joatildeo Soares in London (joaosoaresbaincom)
Acknowledgments
The authors would like to thank the following Bain colleagues for their valuable support in producing this report
Sonal Chawla Christian Duus Franccedilois Fastrez Farsan Ghassim and Shikha Mahato
See these related Bain perspectives at wwwbaincom
bull Managing risk and capital
bull How Europersquos banks can return to health
bull The digital challenge to retail banks
7222019 Bain amp Co- European Banking Report
httpslidepdfcomreaderfullbain-co-european-banking-report 3132
7222019 Bain amp Co- European Banking Report
httpslidepdfcomreaderfullbain-co-european-banking-report 3232
For more information visit wwwbaincom
Share983140 983105m983138io983150 Tru Rs983157983148ts
Bain amp Company is the management consulting firm that the worldrsquos business leaders come to whenthey want results
Bain advises clients on strategy operations technology organization private equity and mergers and acquisitions We develop
practical customized insights that clients act on and transfer skills that make change stick Founded in 1973 Bain has
48 offices in 31 countries and our deep expertise and client roster cross every industry and economic sector Our clients
have outperformed the stock market 4 to 1
What sets us apart
We believe a consulting firm should be more than an adviser So we put ourselves in our clientsrsquo shoes selling outcomes not
projects We align our incentives with our clientsrsquo by linking our fees to their results and collaborate to unlock the full potential
of their business Our Results Deliveryreg process builds our clientsrsquo capabilities and our True North values mean we do theright thing for our clients people and communitiesmdashalways
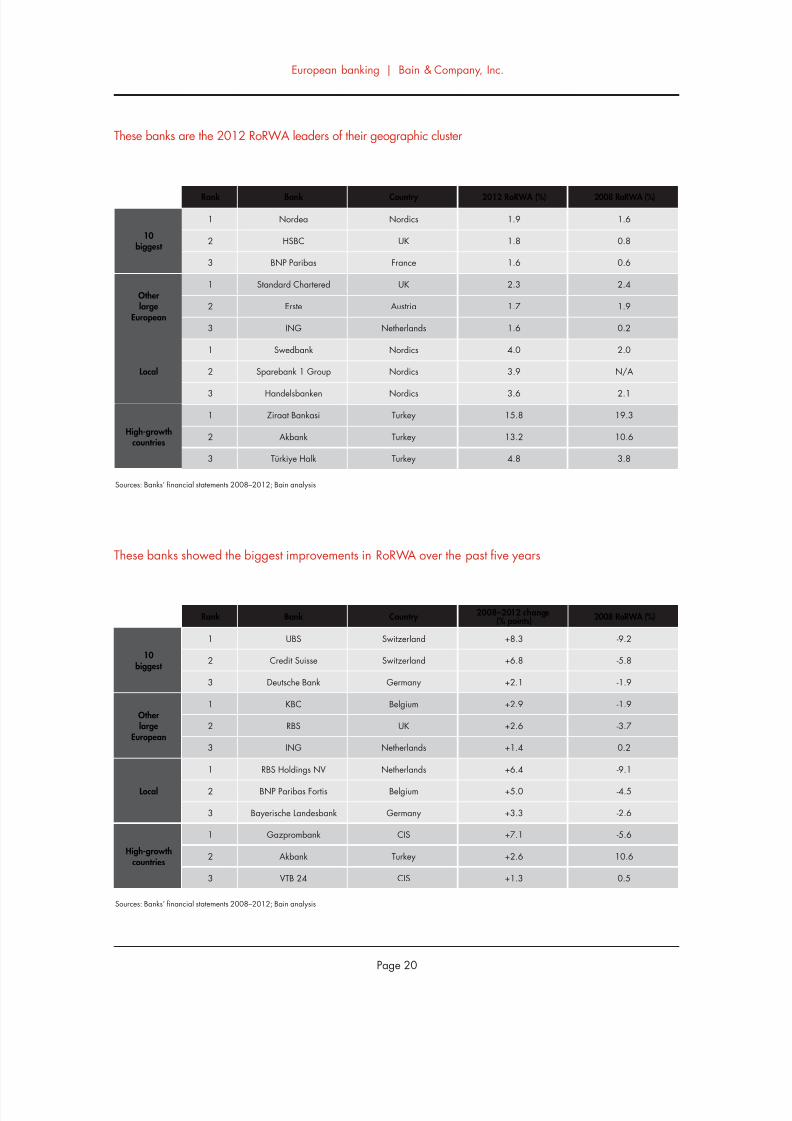
7222019 Bain amp Co- European Banking Report
httpslidepdfcomreaderfullbain-co-european-banking-report 2432
7222019 Bain amp Co- European Banking Report
httpslidepdfcomreaderfullbain-co-european-banking-report 2532
bull Europersquos environment continues to be volatile andinvestors are seeking better information about abankrsquos stability asset quality and key factors that
generate value RoRWA plays a useful role hereby focusing on the balance sheetmdashwhich enablescomparison between a bank and its peersmdashand byidentifying the factors influencing bank performance
bull Banks still need to address challenges along eachdimension of RoRWA in order to lift their profit-ability levels above the cost of capital In recent
years the profitability of lending assets has beensustained mainly by the fi nancial componentsincluding a boost from LTRO To raise asset prof-itability banks will have to better manage their
capital allocations and risk profilesbull The pressure on fee income will continue To offset
that trend banks should turn to their close clientrelationships for new sources of revenues
bull Lowering operating costs is the dimension thatwarrants managementrsquos attention at any bankregardless of size or location Initiatives that havethe greatest potential for tackling structural costsinclude adopting digital technologies and modern-izing IT platforms optimizing processes from endto end through outsourcing offshoring and other
means and expanding global procurement Suchinitiatives are essential for survival in an industrygoing through discontinuous change
bull Deleveraging the loan portfolio for riskier clients isa pressing issue which still poses significant threatsfor local banks In countries with a higher cost ofrisk and stagnant or negative GDP growth rateslocal banks may face further painful restructuring
bull Astute management of the cost of risk includingtaking a portfolio perspective offers opportunities
for most banksmdashin part to meet the new require-ments of Basel III and reassure rating agencies
bull Further consolidation of the local and other largebanks over the coming years will likely benefitthe 10 biggest banks and those in high-growthcountries These high-growth countries offer thegreatest opportunities for RoRWA growth for largeand pan-European players looking to diversifytheir portfolios
3Strategic
perspectives and
implications for
management
7222019 Bain amp Co- European Banking Report
httpslidepdfcomreaderfullbain-co-european-banking-report 2632
European banking | Bain amp Company Inc
Page 24
Significant restructuring is warranted for all banks but the nature of the challenge varies by geography
Source Bain analysis
10 biggest Strategic issueHigh-growth
countries
Other large
EuropeanLocal
Cross-selling
Balance-sheet
management
Cost structure
Cost of risk
Major threatThreatOpportunityMajor opportunity
Profitability of the asset portfolio has been sustained mainly by the
financial component Deleveraging of the loan portfolio for riskier
clients has been only partially successful and the risk profile of
the portfolio still has a long way to go
To counter pressure on fees banks should work systematically on
cross-selling opportunities through initiatives like client-focused
service models and CRM support
To further reduce costs banks should pursue new digital technologies
optimized processes through such means as outsourcing and offshoring
modernized IT platforms and global procurement initiatives
Active management of cost of risk demands more systematic solutions
bull NPL and LLP trends are threatening the stability of the overall
system and not only in individual countries such as Greece
bull Management of risky clients has become a core business and capability
bull Managing costs of risk demands an integrated portfolio approach
7222019 Bain amp Co- European Banking Report
httpslidepdfcomreaderfullbain-co-european-banking-report 2732
European banking | Bain amp Company Inc
Page 25
Assets (euroB)
Erste (AT)
Raiffeisen Bank (AT)
BNP Paribas Fortis
KBC
Belfius Banque
ING Belgium SANV
Creacutedit Agricole Groupe
BNP Paribas
Groupe Socieacuteteacute Geacuteneacuterale
Groupe BPCE
Creacutedit Mutuel
Deutsche Bank
Commerzbank AGKfW
DZ Bank AG
UniCredit Bank AG
2138
1202
2723
2569
2129
1691
17930
15439
12307
11475
6051
20123
63595116
4072
3483
Austria
Belgium
France
Germany
Country Bank Cluster
Other large
Local
Local
Other large
Local
Local
10 biggest
10 biggest
Other large
Local
Local
10 biggest
Other largeLocal
Local
Local
Ireland
Landesbank Baden-Wuumlrttemberg
Bayerische Landesbank
NORDLB
Helaba
HSH Nordbank
DekaBank
Landesbank Berlin Holding
Santander Consumer Bank
Hamburger Sparkasse
Deutsche Apotheker - und Aumlrztebank
Sparkasse KoumllnBonn
Kreissparkasse Koumlln
Bank of Ireland
Allied Irish Banks
permanent tsb Group Hldgs Plc
Intesa Sanpaolo
3363
2868
2256
1993
1306
1297
1183
403
396
379
299
248
1481
1225
409
6735
Local
Local
Local
Local
Local
Local
Local
Local
Local
Local
Local
Local
Other large
10 biggest
Local
Other large
Unicredit Group
Monte dei Paschi di Siena
4639
2189
10 biggest
Local
UBI Banca Group
Banco Popolare
BNL
Banca Popolare dellrsquoEmilia Romagna
Banca Popolare di Milano
Gruppo Banca Carige
Cariparma
Banca Popolare di Vicenza
Veneto Banca
1324
1319
912
616
525
493
493
467
402
Local
Local
Local
Local
Local
Local
Local
Local
Local
Italy
2011 assets
Bca Popdi Sondrio 322 Local
Credito Emiliano
Credito Valtellinese
Banca delle Marche
307
299
227
Local
Local
Local
List of banks analyzed by country and assets
10 biggest other large local
7222019 Bain amp Co- European Banking Report
httpslidepdfcomreaderfullbain-co-european-banking-report 2832
European banking | Bain amp Company Inc
Page 26
Assets (euroB)Country Bank Cluster
ING
Rabobank Group
ABN AMRO Group
SNS Reaal
RBS Holdings NV
8361
7524
3944
1322
710
Netherlands
Other large
Other large
Other large
Local
Local
Nordea 6774 10 biggest
Danske Bank
DNB
4682
3028
Other large
Local
SEB
Handelsbanken
Swedbank
Pohjola Bank
2818
2742
2121
998
Local
Local
Local
Local
Nordics
Jyske Bank 347 Local
Sparebank 1 Group 62 Local
Caixa Geral de Depositos 1169 Local
Millenium BCP
Banco Espiacuterito Santo
897
837
Local
Local
Banco BPI
Santander Totta SGPS
Caixa Econoacutemica Montepio Geral
Creacutedito Agriacutecola Muacutetuo
446
414
215
142
Local
Local
Local
Local
Portugal
BANIF 140 Local
SantanderBBVA
la Caixa
Banco Financiero y de Ahorros
Banco Sabadell SA
122826378
3591
3092
1615
Spain
10 biggestOther large
Local
Local
Local
Banco Popular
Banco Mare Nostrum
1576
634
Local
Local
UBS
Credit Suisse
10448
7669Switzerland
10 biggest
10 biggest
HSBC 20939 10 biggest
Barclays
Royal Bank of Scotland
17603
11521
10 biggest
Other large
Lloyds Banking Group
Standard Chartered
Nationwide Building Society
Co-operative Bank
11395
4950
2417
611
Other large
Other large
Local
Local
UK
Clydesdale Bank 545 Local
Yorkshire Building Society 413 Local
Virgin Money 223 Local
2011 assets
List of banks analyzed by country and assets
10 biggest other large localmdashcontinued
7222019 Bain amp Co- European Banking Report
httpslidepdfcomreaderfullbain-co-european-banking-report 2932
European banking | Bain amp Company Inc
Page 27
Assets (euroB)
Sberbank
VTB 24
PKO BP
Bank Pekao
BRE Bank
ING Bank Slaski
Standard Bank
Absa
FirstRand
Nedbank
Investec
Tuumlrkiye İş Bankası
Tuumlrkiye Garanti
Ziraat Bankasi
Akbank
Yapı ve Kredi
3781
1857
463
361
244
187
928
766
729
647
330
869
777
708
706
568
CIS
Poland
South Africa
Turkey
Country Bank
Tuumlrkiye Halk Bankasi
Tuumlrkiye Vakıflar
Finansbank
471
467
239
Gazprombank
Russian Agricultural Bank
Alfa-Bank
Nomos-Bank
UniCredit Bank Russia
712
358
357
225
218
AKB Rosbank
Promsvyazbank
ZAO Raiffeisenbank
URALSIB Bank
Russian Standard Bank
AKB Probusinessbank
200
173
160
113
74
35
2011 assets
Bank Zachodni WBK + Kredyt Bank
Getin NobleBank
Bank Millennium
143
141
126
List of banks analyzed by country and assets
High-growth countries
7222019 Bain amp Co- European Banking Report
httpslidepdfcomreaderfullbain-co-european-banking-report 3032
European banking | Bain amp Company Inc
Page 28
Key contacts in Bainrsquos European Financial Services practice
Franco Baronio in Milan (francobaroniobaincom)Rocco DrsquoAcunto in Milan (roccodacuntobaincom)
Ada Di Marzo in Paris (adadimarzobaincom)
Bertrand Facq in Warsaw (bertrandfacqbaincom)
Fabrice Franzen in Johannesburg (fabricefranzenbaincom)
Thomas Herbeck in Frankfurt (thomasherbeckbaincom)
Karaca Kestelli in Istanbul (karacakestellibaincom)
Nicolaacutes Lopez in Madrid (nicolaslopezbaincom)
Niels Peder Nielsen in Copenhagen (nielspedernielsenbaincom)
Andrea Oldrini in Milan (andreaoldrinibaincom)
Mathijs Robbens in Amsterdam (mathijsrobbensbaincom)
Visar Sala in Moscow (visarsalabaincom)
Walter Sinn in Frankfurt (waltersinnbaincom)Joatildeo Soares in London (joaosoaresbaincom)
Acknowledgments
The authors would like to thank the following Bain colleagues for their valuable support in producing this report
Sonal Chawla Christian Duus Franccedilois Fastrez Farsan Ghassim and Shikha Mahato
See these related Bain perspectives at wwwbaincom
bull Managing risk and capital
bull How Europersquos banks can return to health
bull The digital challenge to retail banks
7222019 Bain amp Co- European Banking Report
httpslidepdfcomreaderfullbain-co-european-banking-report 3132
7222019 Bain amp Co- European Banking Report
httpslidepdfcomreaderfullbain-co-european-banking-report 3232
For more information visit wwwbaincom
Share983140 983105m983138io983150 Tru Rs983157983148ts
Bain amp Company is the management consulting firm that the worldrsquos business leaders come to whenthey want results
Bain advises clients on strategy operations technology organization private equity and mergers and acquisitions We develop
practical customized insights that clients act on and transfer skills that make change stick Founded in 1973 Bain has
48 offices in 31 countries and our deep expertise and client roster cross every industry and economic sector Our clients
have outperformed the stock market 4 to 1
What sets us apart
We believe a consulting firm should be more than an adviser So we put ourselves in our clientsrsquo shoes selling outcomes not
projects We align our incentives with our clientsrsquo by linking our fees to their results and collaborate to unlock the full potential
of their business Our Results Deliveryreg process builds our clientsrsquo capabilities and our True North values mean we do theright thing for our clients people and communitiesmdashalways
7222019 Bain amp Co- European Banking Report
httpslidepdfcomreaderfullbain-co-european-banking-report 2532
bull Europersquos environment continues to be volatile andinvestors are seeking better information about abankrsquos stability asset quality and key factors that
generate value RoRWA plays a useful role hereby focusing on the balance sheetmdashwhich enablescomparison between a bank and its peersmdashand byidentifying the factors influencing bank performance
bull Banks still need to address challenges along eachdimension of RoRWA in order to lift their profit-ability levels above the cost of capital In recent
years the profitability of lending assets has beensustained mainly by the fi nancial componentsincluding a boost from LTRO To raise asset prof-itability banks will have to better manage their
capital allocations and risk profilesbull The pressure on fee income will continue To offset
that trend banks should turn to their close clientrelationships for new sources of revenues
bull Lowering operating costs is the dimension thatwarrants managementrsquos attention at any bankregardless of size or location Initiatives that havethe greatest potential for tackling structural costsinclude adopting digital technologies and modern-izing IT platforms optimizing processes from endto end through outsourcing offshoring and other
means and expanding global procurement Suchinitiatives are essential for survival in an industrygoing through discontinuous change
bull Deleveraging the loan portfolio for riskier clients isa pressing issue which still poses significant threatsfor local banks In countries with a higher cost ofrisk and stagnant or negative GDP growth rateslocal banks may face further painful restructuring
bull Astute management of the cost of risk includingtaking a portfolio perspective offers opportunities
for most banksmdashin part to meet the new require-ments of Basel III and reassure rating agencies
bull Further consolidation of the local and other largebanks over the coming years will likely benefitthe 10 biggest banks and those in high-growthcountries These high-growth countries offer thegreatest opportunities for RoRWA growth for largeand pan-European players looking to diversifytheir portfolios
3Strategic
perspectives and
implications for
management
7222019 Bain amp Co- European Banking Report
httpslidepdfcomreaderfullbain-co-european-banking-report 2632
European banking | Bain amp Company Inc
Page 24
Significant restructuring is warranted for all banks but the nature of the challenge varies by geography
Source Bain analysis
10 biggest Strategic issueHigh-growth
countries
Other large
EuropeanLocal
Cross-selling
Balance-sheet
management
Cost structure
Cost of risk
Major threatThreatOpportunityMajor opportunity
Profitability of the asset portfolio has been sustained mainly by the
financial component Deleveraging of the loan portfolio for riskier
clients has been only partially successful and the risk profile of
the portfolio still has a long way to go
To counter pressure on fees banks should work systematically on
cross-selling opportunities through initiatives like client-focused
service models and CRM support
To further reduce costs banks should pursue new digital technologies
optimized processes through such means as outsourcing and offshoring
modernized IT platforms and global procurement initiatives
Active management of cost of risk demands more systematic solutions
bull NPL and LLP trends are threatening the stability of the overall
system and not only in individual countries such as Greece
bull Management of risky clients has become a core business and capability
bull Managing costs of risk demands an integrated portfolio approach
7222019 Bain amp Co- European Banking Report
httpslidepdfcomreaderfullbain-co-european-banking-report 2732
European banking | Bain amp Company Inc
Page 25
Assets (euroB)
Erste (AT)
Raiffeisen Bank (AT)
BNP Paribas Fortis
KBC
Belfius Banque
ING Belgium SANV
Creacutedit Agricole Groupe
BNP Paribas
Groupe Socieacuteteacute Geacuteneacuterale
Groupe BPCE
Creacutedit Mutuel
Deutsche Bank
Commerzbank AGKfW
DZ Bank AG
UniCredit Bank AG
2138
1202
2723
2569
2129
1691
17930
15439
12307
11475
6051
20123
63595116
4072
3483
Austria
Belgium
France
Germany
Country Bank Cluster
Other large
Local
Local
Other large
Local
Local
10 biggest
10 biggest
Other large
Local
Local
10 biggest
Other largeLocal
Local
Local
Ireland
Landesbank Baden-Wuumlrttemberg
Bayerische Landesbank
NORDLB
Helaba
HSH Nordbank
DekaBank
Landesbank Berlin Holding
Santander Consumer Bank
Hamburger Sparkasse
Deutsche Apotheker - und Aumlrztebank
Sparkasse KoumllnBonn
Kreissparkasse Koumlln
Bank of Ireland
Allied Irish Banks
permanent tsb Group Hldgs Plc
Intesa Sanpaolo
3363
2868
2256
1993
1306
1297
1183
403
396
379
299
248
1481
1225
409
6735
Local
Local
Local
Local
Local
Local
Local
Local
Local
Local
Local
Local
Other large
10 biggest
Local
Other large
Unicredit Group
Monte dei Paschi di Siena
4639
2189
10 biggest
Local
UBI Banca Group
Banco Popolare
BNL
Banca Popolare dellrsquoEmilia Romagna
Banca Popolare di Milano
Gruppo Banca Carige
Cariparma
Banca Popolare di Vicenza
Veneto Banca
1324
1319
912
616
525
493
493
467
402
Local
Local
Local
Local
Local
Local
Local
Local
Local
Italy
2011 assets
Bca Popdi Sondrio 322 Local
Credito Emiliano
Credito Valtellinese
Banca delle Marche
307
299
227
Local
Local
Local
List of banks analyzed by country and assets
10 biggest other large local
7222019 Bain amp Co- European Banking Report
httpslidepdfcomreaderfullbain-co-european-banking-report 2832
European banking | Bain amp Company Inc
Page 26
Assets (euroB)Country Bank Cluster
ING
Rabobank Group
ABN AMRO Group
SNS Reaal
RBS Holdings NV
8361
7524
3944
1322
710
Netherlands
Other large
Other large
Other large
Local
Local
Nordea 6774 10 biggest
Danske Bank
DNB
4682
3028
Other large
Local
SEB
Handelsbanken
Swedbank
Pohjola Bank
2818
2742
2121
998
Local
Local
Local
Local
Nordics
Jyske Bank 347 Local
Sparebank 1 Group 62 Local
Caixa Geral de Depositos 1169 Local
Millenium BCP
Banco Espiacuterito Santo
897
837
Local
Local
Banco BPI
Santander Totta SGPS
Caixa Econoacutemica Montepio Geral
Creacutedito Agriacutecola Muacutetuo
446
414
215
142
Local
Local
Local
Local
Portugal
BANIF 140 Local
SantanderBBVA
la Caixa
Banco Financiero y de Ahorros
Banco Sabadell SA
122826378
3591
3092
1615
Spain
10 biggestOther large
Local
Local
Local
Banco Popular
Banco Mare Nostrum
1576
634
Local
Local
UBS
Credit Suisse
10448
7669Switzerland
10 biggest
10 biggest
HSBC 20939 10 biggest
Barclays
Royal Bank of Scotland
17603
11521
10 biggest
Other large
Lloyds Banking Group
Standard Chartered
Nationwide Building Society
Co-operative Bank
11395
4950
2417
611
Other large
Other large
Local
Local
UK
Clydesdale Bank 545 Local
Yorkshire Building Society 413 Local
Virgin Money 223 Local
2011 assets
List of banks analyzed by country and assets
10 biggest other large localmdashcontinued
7222019 Bain amp Co- European Banking Report
httpslidepdfcomreaderfullbain-co-european-banking-report 2932
European banking | Bain amp Company Inc
Page 27
Assets (euroB)
Sberbank
VTB 24
PKO BP
Bank Pekao
BRE Bank
ING Bank Slaski
Standard Bank
Absa
FirstRand
Nedbank
Investec
Tuumlrkiye İş Bankası
Tuumlrkiye Garanti
Ziraat Bankasi
Akbank
Yapı ve Kredi
3781
1857
463
361
244
187
928
766
729
647
330
869
777
708
706
568
CIS
Poland
South Africa
Turkey
Country Bank
Tuumlrkiye Halk Bankasi
Tuumlrkiye Vakıflar
Finansbank
471
467
239
Gazprombank
Russian Agricultural Bank
Alfa-Bank
Nomos-Bank
UniCredit Bank Russia
712
358
357
225
218
AKB Rosbank
Promsvyazbank
ZAO Raiffeisenbank
URALSIB Bank
Russian Standard Bank
AKB Probusinessbank
200
173
160
113
74
35
2011 assets
Bank Zachodni WBK + Kredyt Bank
Getin NobleBank
Bank Millennium
143
141
126
List of banks analyzed by country and assets
High-growth countries
7222019 Bain amp Co- European Banking Report
httpslidepdfcomreaderfullbain-co-european-banking-report 3032
European banking | Bain amp Company Inc
Page 28
Key contacts in Bainrsquos European Financial Services practice
Franco Baronio in Milan (francobaroniobaincom)Rocco DrsquoAcunto in Milan (roccodacuntobaincom)
Ada Di Marzo in Paris (adadimarzobaincom)
Bertrand Facq in Warsaw (bertrandfacqbaincom)
Fabrice Franzen in Johannesburg (fabricefranzenbaincom)
Thomas Herbeck in Frankfurt (thomasherbeckbaincom)
Karaca Kestelli in Istanbul (karacakestellibaincom)
Nicolaacutes Lopez in Madrid (nicolaslopezbaincom)
Niels Peder Nielsen in Copenhagen (nielspedernielsenbaincom)
Andrea Oldrini in Milan (andreaoldrinibaincom)
Mathijs Robbens in Amsterdam (mathijsrobbensbaincom)
Visar Sala in Moscow (visarsalabaincom)
Walter Sinn in Frankfurt (waltersinnbaincom)Joatildeo Soares in London (joaosoaresbaincom)
Acknowledgments
The authors would like to thank the following Bain colleagues for their valuable support in producing this report
Sonal Chawla Christian Duus Franccedilois Fastrez Farsan Ghassim and Shikha Mahato
See these related Bain perspectives at wwwbaincom
bull Managing risk and capital
bull How Europersquos banks can return to health
bull The digital challenge to retail banks
7222019 Bain amp Co- European Banking Report
httpslidepdfcomreaderfullbain-co-european-banking-report 3132
7222019 Bain amp Co- European Banking Report
httpslidepdfcomreaderfullbain-co-european-banking-report 3232
For more information visit wwwbaincom
Share983140 983105m983138io983150 Tru Rs983157983148ts
Bain amp Company is the management consulting firm that the worldrsquos business leaders come to whenthey want results
Bain advises clients on strategy operations technology organization private equity and mergers and acquisitions We develop
practical customized insights that clients act on and transfer skills that make change stick Founded in 1973 Bain has
48 offices in 31 countries and our deep expertise and client roster cross every industry and economic sector Our clients
have outperformed the stock market 4 to 1
What sets us apart
We believe a consulting firm should be more than an adviser So we put ourselves in our clientsrsquo shoes selling outcomes not
projects We align our incentives with our clientsrsquo by linking our fees to their results and collaborate to unlock the full potential
of their business Our Results Deliveryreg process builds our clientsrsquo capabilities and our True North values mean we do theright thing for our clients people and communitiesmdashalways
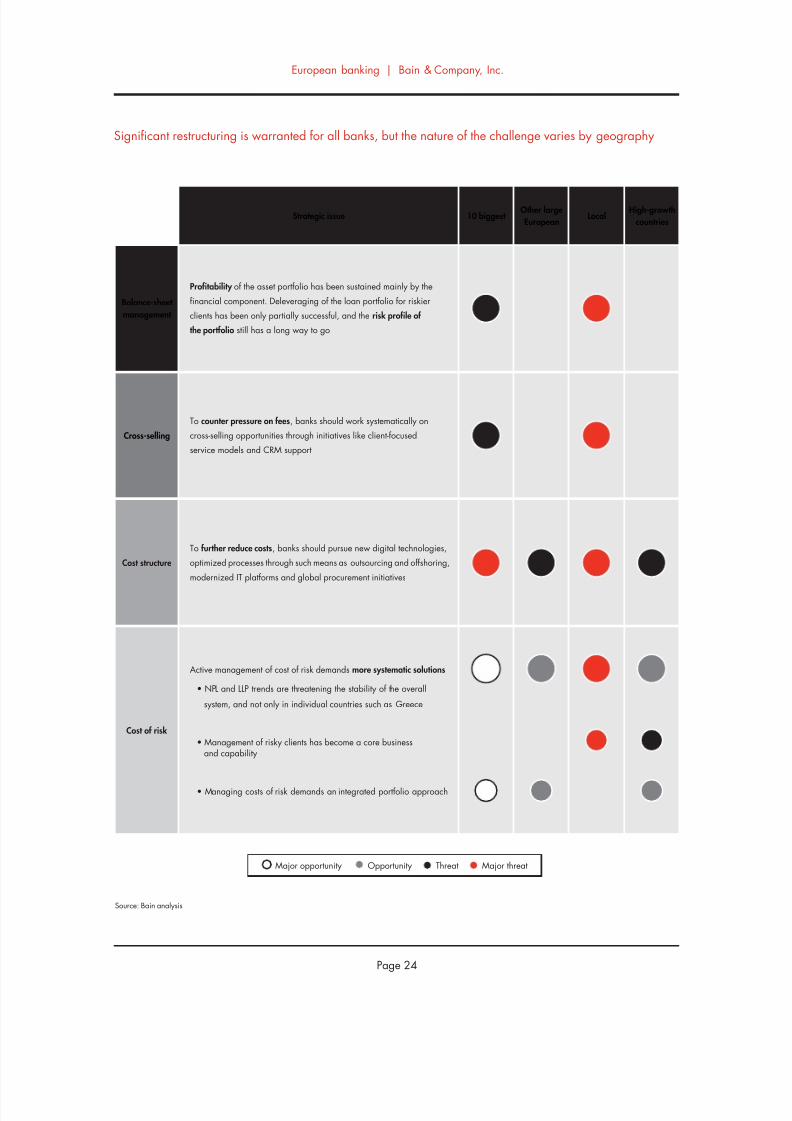
7222019 Bain amp Co- European Banking Report
httpslidepdfcomreaderfullbain-co-european-banking-report 2632
European banking | Bain amp Company Inc
Page 24
Significant restructuring is warranted for all banks but the nature of the challenge varies by geography
Source Bain analysis
10 biggest Strategic issueHigh-growth
countries
Other large
EuropeanLocal
Cross-selling
Balance-sheet
management
Cost structure
Cost of risk
Major threatThreatOpportunityMajor opportunity
Profitability of the asset portfolio has been sustained mainly by the
financial component Deleveraging of the loan portfolio for riskier
clients has been only partially successful and the risk profile of
the portfolio still has a long way to go
To counter pressure on fees banks should work systematically on
cross-selling opportunities through initiatives like client-focused
service models and CRM support
To further reduce costs banks should pursue new digital technologies
optimized processes through such means as outsourcing and offshoring
modernized IT platforms and global procurement initiatives
Active management of cost of risk demands more systematic solutions
bull NPL and LLP trends are threatening the stability of the overall
system and not only in individual countries such as Greece
bull Management of risky clients has become a core business and capability
bull Managing costs of risk demands an integrated portfolio approach
7222019 Bain amp Co- European Banking Report
httpslidepdfcomreaderfullbain-co-european-banking-report 2732
European banking | Bain amp Company Inc
Page 25
Assets (euroB)
Erste (AT)
Raiffeisen Bank (AT)
BNP Paribas Fortis
KBC
Belfius Banque
ING Belgium SANV
Creacutedit Agricole Groupe
BNP Paribas
Groupe Socieacuteteacute Geacuteneacuterale
Groupe BPCE
Creacutedit Mutuel
Deutsche Bank
Commerzbank AGKfW
DZ Bank AG
UniCredit Bank AG
2138
1202
2723
2569
2129
1691
17930
15439
12307
11475
6051
20123
63595116
4072
3483
Austria
Belgium
France
Germany
Country Bank Cluster
Other large
Local
Local
Other large
Local
Local
10 biggest
10 biggest
Other large
Local
Local
10 biggest
Other largeLocal
Local
Local
Ireland
Landesbank Baden-Wuumlrttemberg
Bayerische Landesbank
NORDLB
Helaba
HSH Nordbank
DekaBank
Landesbank Berlin Holding
Santander Consumer Bank
Hamburger Sparkasse
Deutsche Apotheker - und Aumlrztebank
Sparkasse KoumllnBonn
Kreissparkasse Koumlln
Bank of Ireland
Allied Irish Banks
permanent tsb Group Hldgs Plc
Intesa Sanpaolo
3363
2868
2256
1993
1306
1297
1183
403
396
379
299
248
1481
1225
409
6735
Local
Local
Local
Local
Local
Local
Local
Local
Local
Local
Local
Local
Other large
10 biggest
Local
Other large
Unicredit Group
Monte dei Paschi di Siena
4639
2189
10 biggest
Local
UBI Banca Group
Banco Popolare
BNL
Banca Popolare dellrsquoEmilia Romagna
Banca Popolare di Milano
Gruppo Banca Carige
Cariparma
Banca Popolare di Vicenza
Veneto Banca
1324
1319
912
616
525
493
493
467
402
Local
Local
Local
Local
Local
Local
Local
Local
Local
Italy
2011 assets
Bca Popdi Sondrio 322 Local
Credito Emiliano
Credito Valtellinese
Banca delle Marche
307
299
227
Local
Local
Local
List of banks analyzed by country and assets
10 biggest other large local
7222019 Bain amp Co- European Banking Report
httpslidepdfcomreaderfullbain-co-european-banking-report 2832
European banking | Bain amp Company Inc
Page 26
Assets (euroB)Country Bank Cluster
ING
Rabobank Group
ABN AMRO Group
SNS Reaal
RBS Holdings NV
8361
7524
3944
1322
710
Netherlands
Other large
Other large
Other large
Local
Local
Nordea 6774 10 biggest
Danske Bank
DNB
4682
3028
Other large
Local
SEB
Handelsbanken
Swedbank
Pohjola Bank
2818
2742
2121
998
Local
Local
Local
Local
Nordics
Jyske Bank 347 Local
Sparebank 1 Group 62 Local
Caixa Geral de Depositos 1169 Local
Millenium BCP
Banco Espiacuterito Santo
897
837
Local
Local
Banco BPI
Santander Totta SGPS
Caixa Econoacutemica Montepio Geral
Creacutedito Agriacutecola Muacutetuo
446
414
215
142
Local
Local
Local
Local
Portugal
BANIF 140 Local
SantanderBBVA
la Caixa
Banco Financiero y de Ahorros
Banco Sabadell SA
122826378
3591
3092
1615
Spain
10 biggestOther large
Local
Local
Local
Banco Popular
Banco Mare Nostrum
1576
634
Local
Local
UBS
Credit Suisse
10448
7669Switzerland
10 biggest
10 biggest
HSBC 20939 10 biggest
Barclays
Royal Bank of Scotland
17603
11521
10 biggest
Other large
Lloyds Banking Group
Standard Chartered
Nationwide Building Society
Co-operative Bank
11395
4950
2417
611
Other large
Other large
Local
Local
UK
Clydesdale Bank 545 Local
Yorkshire Building Society 413 Local
Virgin Money 223 Local
2011 assets
List of banks analyzed by country and assets
10 biggest other large localmdashcontinued
7222019 Bain amp Co- European Banking Report
httpslidepdfcomreaderfullbain-co-european-banking-report 2932
European banking | Bain amp Company Inc
Page 27
Assets (euroB)
Sberbank
VTB 24
PKO BP
Bank Pekao
BRE Bank
ING Bank Slaski
Standard Bank
Absa
FirstRand
Nedbank
Investec
Tuumlrkiye İş Bankası
Tuumlrkiye Garanti
Ziraat Bankasi
Akbank
Yapı ve Kredi
3781
1857
463
361
244
187
928
766
729
647
330
869
777
708
706
568
CIS
Poland
South Africa
Turkey
Country Bank
Tuumlrkiye Halk Bankasi
Tuumlrkiye Vakıflar
Finansbank
471
467
239
Gazprombank
Russian Agricultural Bank
Alfa-Bank
Nomos-Bank
UniCredit Bank Russia
712
358
357
225
218
AKB Rosbank
Promsvyazbank
ZAO Raiffeisenbank
URALSIB Bank
Russian Standard Bank
AKB Probusinessbank
200
173
160
113
74
35
2011 assets
Bank Zachodni WBK + Kredyt Bank
Getin NobleBank
Bank Millennium
143
141
126
List of banks analyzed by country and assets
High-growth countries
7222019 Bain amp Co- European Banking Report
httpslidepdfcomreaderfullbain-co-european-banking-report 3032
European banking | Bain amp Company Inc
Page 28
Key contacts in Bainrsquos European Financial Services practice
Franco Baronio in Milan (francobaroniobaincom)Rocco DrsquoAcunto in Milan (roccodacuntobaincom)
Ada Di Marzo in Paris (adadimarzobaincom)
Bertrand Facq in Warsaw (bertrandfacqbaincom)
Fabrice Franzen in Johannesburg (fabricefranzenbaincom)
Thomas Herbeck in Frankfurt (thomasherbeckbaincom)
Karaca Kestelli in Istanbul (karacakestellibaincom)
Nicolaacutes Lopez in Madrid (nicolaslopezbaincom)
Niels Peder Nielsen in Copenhagen (nielspedernielsenbaincom)
Andrea Oldrini in Milan (andreaoldrinibaincom)
Mathijs Robbens in Amsterdam (mathijsrobbensbaincom)
Visar Sala in Moscow (visarsalabaincom)
Walter Sinn in Frankfurt (waltersinnbaincom)Joatildeo Soares in London (joaosoaresbaincom)
Acknowledgments
The authors would like to thank the following Bain colleagues for their valuable support in producing this report
Sonal Chawla Christian Duus Franccedilois Fastrez Farsan Ghassim and Shikha Mahato
See these related Bain perspectives at wwwbaincom
bull Managing risk and capital
bull How Europersquos banks can return to health
bull The digital challenge to retail banks
7222019 Bain amp Co- European Banking Report
httpslidepdfcomreaderfullbain-co-european-banking-report 3132
7222019 Bain amp Co- European Banking Report
httpslidepdfcomreaderfullbain-co-european-banking-report 3232
For more information visit wwwbaincom
Share983140 983105m983138io983150 Tru Rs983157983148ts
Bain amp Company is the management consulting firm that the worldrsquos business leaders come to whenthey want results
Bain advises clients on strategy operations technology organization private equity and mergers and acquisitions We develop
practical customized insights that clients act on and transfer skills that make change stick Founded in 1973 Bain has
48 offices in 31 countries and our deep expertise and client roster cross every industry and economic sector Our clients
have outperformed the stock market 4 to 1
What sets us apart
We believe a consulting firm should be more than an adviser So we put ourselves in our clientsrsquo shoes selling outcomes not
projects We align our incentives with our clientsrsquo by linking our fees to their results and collaborate to unlock the full potential
of their business Our Results Deliveryreg process builds our clientsrsquo capabilities and our True North values mean we do theright thing for our clients people and communitiesmdashalways
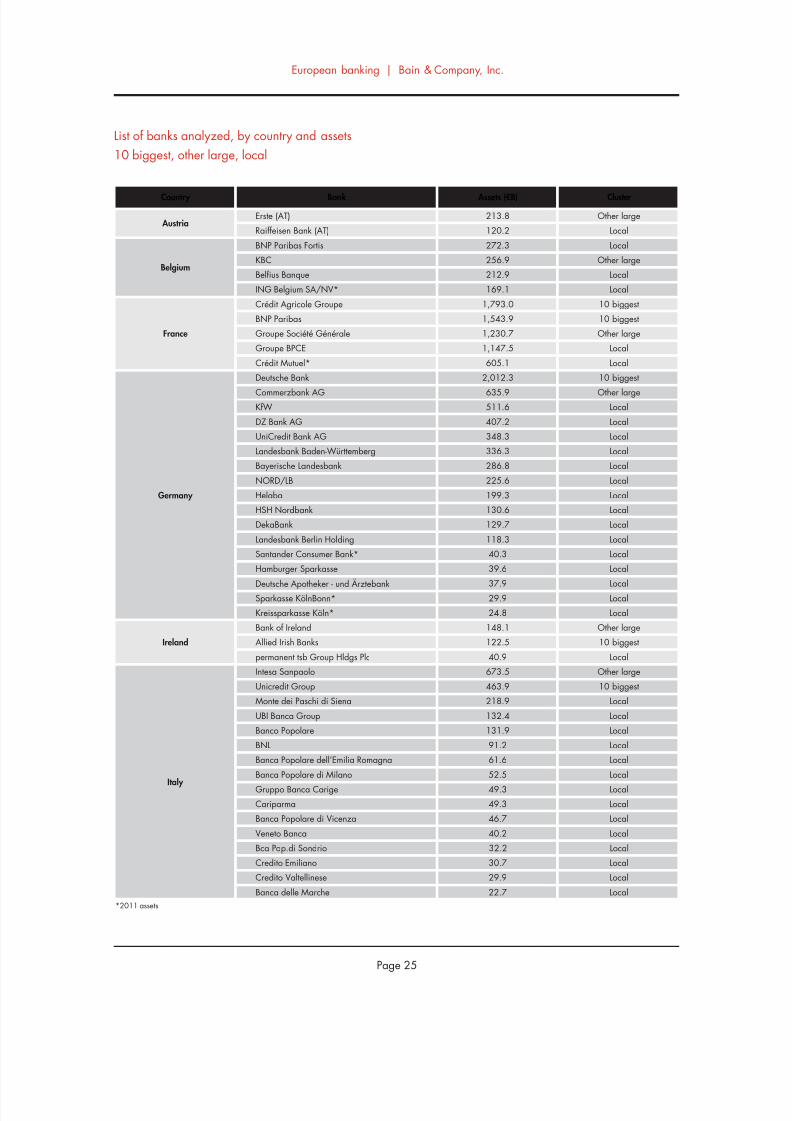
7222019 Bain amp Co- European Banking Report
httpslidepdfcomreaderfullbain-co-european-banking-report 2732
European banking | Bain amp Company Inc
Page 25
Assets (euroB)
Erste (AT)
Raiffeisen Bank (AT)
BNP Paribas Fortis
KBC
Belfius Banque
ING Belgium SANV
Creacutedit Agricole Groupe
BNP Paribas
Groupe Socieacuteteacute Geacuteneacuterale
Groupe BPCE
Creacutedit Mutuel
Deutsche Bank
Commerzbank AGKfW
DZ Bank AG
UniCredit Bank AG
2138
1202
2723
2569
2129
1691
17930
15439
12307
11475
6051
20123
63595116
4072
3483
Austria
Belgium
France
Germany
Country Bank Cluster
Other large
Local
Local
Other large
Local
Local
10 biggest
10 biggest
Other large
Local
Local
10 biggest
Other largeLocal
Local
Local
Ireland
Landesbank Baden-Wuumlrttemberg
Bayerische Landesbank
NORDLB
Helaba
HSH Nordbank
DekaBank
Landesbank Berlin Holding
Santander Consumer Bank
Hamburger Sparkasse
Deutsche Apotheker - und Aumlrztebank
Sparkasse KoumllnBonn
Kreissparkasse Koumlln
Bank of Ireland
Allied Irish Banks
permanent tsb Group Hldgs Plc
Intesa Sanpaolo
3363
2868
2256
1993
1306
1297
1183
403
396
379
299
248
1481
1225
409
6735
Local
Local
Local
Local
Local
Local
Local
Local
Local
Local
Local
Local
Other large
10 biggest
Local
Other large
Unicredit Group
Monte dei Paschi di Siena
4639
2189
10 biggest
Local
UBI Banca Group
Banco Popolare
BNL
Banca Popolare dellrsquoEmilia Romagna
Banca Popolare di Milano
Gruppo Banca Carige
Cariparma
Banca Popolare di Vicenza
Veneto Banca
1324
1319
912
616
525
493
493
467
402
Local
Local
Local
Local
Local
Local
Local
Local
Local
Italy
2011 assets
Bca Popdi Sondrio 322 Local
Credito Emiliano
Credito Valtellinese
Banca delle Marche
307
299
227
Local
Local
Local
List of banks analyzed by country and assets
10 biggest other large local
7222019 Bain amp Co- European Banking Report
httpslidepdfcomreaderfullbain-co-european-banking-report 2832
European banking | Bain amp Company Inc
Page 26
Assets (euroB)Country Bank Cluster
ING
Rabobank Group
ABN AMRO Group
SNS Reaal
RBS Holdings NV
8361
7524
3944
1322
710
Netherlands
Other large
Other large
Other large
Local
Local
Nordea 6774 10 biggest
Danske Bank
DNB
4682
3028
Other large
Local
SEB
Handelsbanken
Swedbank
Pohjola Bank
2818
2742
2121
998
Local
Local
Local
Local
Nordics
Jyske Bank 347 Local
Sparebank 1 Group 62 Local
Caixa Geral de Depositos 1169 Local
Millenium BCP
Banco Espiacuterito Santo
897
837
Local
Local
Banco BPI
Santander Totta SGPS
Caixa Econoacutemica Montepio Geral
Creacutedito Agriacutecola Muacutetuo
446
414
215
142
Local
Local
Local
Local
Portugal
BANIF 140 Local
SantanderBBVA
la Caixa
Banco Financiero y de Ahorros
Banco Sabadell SA
122826378
3591
3092
1615
Spain
10 biggestOther large
Local
Local
Local
Banco Popular
Banco Mare Nostrum
1576
634
Local
Local
UBS
Credit Suisse
10448
7669Switzerland
10 biggest
10 biggest
HSBC 20939 10 biggest
Barclays
Royal Bank of Scotland
17603
11521
10 biggest
Other large
Lloyds Banking Group
Standard Chartered
Nationwide Building Society
Co-operative Bank
11395
4950
2417
611
Other large
Other large
Local
Local
UK
Clydesdale Bank 545 Local
Yorkshire Building Society 413 Local
Virgin Money 223 Local
2011 assets
List of banks analyzed by country and assets
10 biggest other large localmdashcontinued
7222019 Bain amp Co- European Banking Report
httpslidepdfcomreaderfullbain-co-european-banking-report 2932
European banking | Bain amp Company Inc
Page 27
Assets (euroB)
Sberbank
VTB 24
PKO BP
Bank Pekao
BRE Bank
ING Bank Slaski
Standard Bank
Absa
FirstRand
Nedbank
Investec
Tuumlrkiye İş Bankası
Tuumlrkiye Garanti
Ziraat Bankasi
Akbank
Yapı ve Kredi
3781
1857
463
361
244
187
928
766
729
647
330
869
777
708
706
568
CIS
Poland
South Africa
Turkey
Country Bank
Tuumlrkiye Halk Bankasi
Tuumlrkiye Vakıflar
Finansbank
471
467
239
Gazprombank
Russian Agricultural Bank
Alfa-Bank
Nomos-Bank
UniCredit Bank Russia
712
358
357
225
218
AKB Rosbank
Promsvyazbank
ZAO Raiffeisenbank
URALSIB Bank
Russian Standard Bank
AKB Probusinessbank
200
173
160
113
74
35
2011 assets
Bank Zachodni WBK + Kredyt Bank
Getin NobleBank
Bank Millennium
143
141
126
List of banks analyzed by country and assets
High-growth countries
7222019 Bain amp Co- European Banking Report
httpslidepdfcomreaderfullbain-co-european-banking-report 3032
European banking | Bain amp Company Inc
Page 28
Key contacts in Bainrsquos European Financial Services practice
Franco Baronio in Milan (francobaroniobaincom)Rocco DrsquoAcunto in Milan (roccodacuntobaincom)
Ada Di Marzo in Paris (adadimarzobaincom)
Bertrand Facq in Warsaw (bertrandfacqbaincom)
Fabrice Franzen in Johannesburg (fabricefranzenbaincom)
Thomas Herbeck in Frankfurt (thomasherbeckbaincom)
Karaca Kestelli in Istanbul (karacakestellibaincom)
Nicolaacutes Lopez in Madrid (nicolaslopezbaincom)
Niels Peder Nielsen in Copenhagen (nielspedernielsenbaincom)
Andrea Oldrini in Milan (andreaoldrinibaincom)
Mathijs Robbens in Amsterdam (mathijsrobbensbaincom)
Visar Sala in Moscow (visarsalabaincom)
Walter Sinn in Frankfurt (waltersinnbaincom)Joatildeo Soares in London (joaosoaresbaincom)
Acknowledgments
The authors would like to thank the following Bain colleagues for their valuable support in producing this report
Sonal Chawla Christian Duus Franccedilois Fastrez Farsan Ghassim and Shikha Mahato
See these related Bain perspectives at wwwbaincom
bull Managing risk and capital
bull How Europersquos banks can return to health
bull The digital challenge to retail banks
7222019 Bain amp Co- European Banking Report
httpslidepdfcomreaderfullbain-co-european-banking-report 3132
7222019 Bain amp Co- European Banking Report
httpslidepdfcomreaderfullbain-co-european-banking-report 3232
For more information visit wwwbaincom
Share983140 983105m983138io983150 Tru Rs983157983148ts
Bain amp Company is the management consulting firm that the worldrsquos business leaders come to whenthey want results
Bain advises clients on strategy operations technology organization private equity and mergers and acquisitions We develop
practical customized insights that clients act on and transfer skills that make change stick Founded in 1973 Bain has
48 offices in 31 countries and our deep expertise and client roster cross every industry and economic sector Our clients
have outperformed the stock market 4 to 1
What sets us apart
We believe a consulting firm should be more than an adviser So we put ourselves in our clientsrsquo shoes selling outcomes not
projects We align our incentives with our clientsrsquo by linking our fees to their results and collaborate to unlock the full potential
of their business Our Results Deliveryreg process builds our clientsrsquo capabilities and our True North values mean we do theright thing for our clients people and communitiesmdashalways
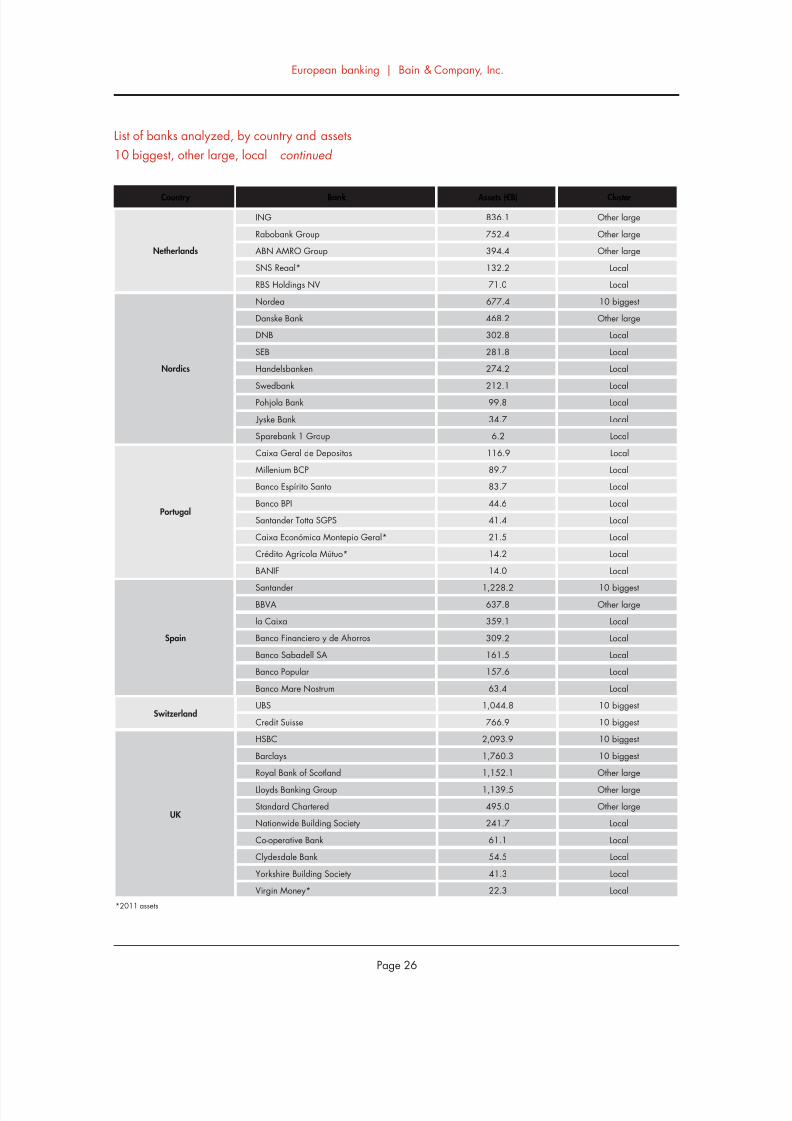
7222019 Bain amp Co- European Banking Report
httpslidepdfcomreaderfullbain-co-european-banking-report 2932
European banking | Bain amp Company Inc
Page 27
Assets (euroB)
Sberbank
VTB 24
PKO BP
Bank Pekao
BRE Bank
ING Bank Slaski
Standard Bank
Absa
FirstRand
Nedbank
Investec
Tuumlrkiye İş Bankası
Tuumlrkiye Garanti
Ziraat Bankasi
Akbank
Yapı ve Kredi
3781
1857
463
361
244
187
928
766
729
647
330
869
777
708
706
568
CIS
Poland
South Africa
Turkey
Country Bank
Tuumlrkiye Halk Bankasi
Tuumlrkiye Vakıflar
Finansbank
471
467
239
Gazprombank
Russian Agricultural Bank
Alfa-Bank
Nomos-Bank
UniCredit Bank Russia
712
358
357
225
218
AKB Rosbank
Promsvyazbank
ZAO Raiffeisenbank
URALSIB Bank
Russian Standard Bank
AKB Probusinessbank
200
173
160
113
74
35
2011 assets
Bank Zachodni WBK + Kredyt Bank
Getin NobleBank
Bank Millennium
143
141
126
List of banks analyzed by country and assets
High-growth countries
7222019 Bain amp Co- European Banking Report
httpslidepdfcomreaderfullbain-co-european-banking-report 3032
European banking | Bain amp Company Inc
Page 28
Key contacts in Bainrsquos European Financial Services practice
Franco Baronio in Milan (francobaroniobaincom)Rocco DrsquoAcunto in Milan (roccodacuntobaincom)
Ada Di Marzo in Paris (adadimarzobaincom)
Bertrand Facq in Warsaw (bertrandfacqbaincom)
Fabrice Franzen in Johannesburg (fabricefranzenbaincom)
Thomas Herbeck in Frankfurt (thomasherbeckbaincom)
Karaca Kestelli in Istanbul (karacakestellibaincom)
Nicolaacutes Lopez in Madrid (nicolaslopezbaincom)
Niels Peder Nielsen in Copenhagen (nielspedernielsenbaincom)
Andrea Oldrini in Milan (andreaoldrinibaincom)
Mathijs Robbens in Amsterdam (mathijsrobbensbaincom)
Visar Sala in Moscow (visarsalabaincom)
Walter Sinn in Frankfurt (waltersinnbaincom)Joatildeo Soares in London (joaosoaresbaincom)
Acknowledgments
The authors would like to thank the following Bain colleagues for their valuable support in producing this report
Sonal Chawla Christian Duus Franccedilois Fastrez Farsan Ghassim and Shikha Mahato
See these related Bain perspectives at wwwbaincom
bull Managing risk and capital
bull How Europersquos banks can return to health
bull The digital challenge to retail banks
7222019 Bain amp Co- European Banking Report
httpslidepdfcomreaderfullbain-co-european-banking-report 3132
7222019 Bain amp Co- European Banking Report
httpslidepdfcomreaderfullbain-co-european-banking-report 3232
For more information visit wwwbaincom
Share983140 983105m983138io983150 Tru Rs983157983148ts
Bain amp Company is the management consulting firm that the worldrsquos business leaders come to whenthey want results
Bain advises clients on strategy operations technology organization private equity and mergers and acquisitions We develop
practical customized insights that clients act on and transfer skills that make change stick Founded in 1973 Bain has
48 offices in 31 countries and our deep expertise and client roster cross every industry and economic sector Our clients
have outperformed the stock market 4 to 1
What sets us apart
We believe a consulting firm should be more than an adviser So we put ourselves in our clientsrsquo shoes selling outcomes not
projects We align our incentives with our clientsrsquo by linking our fees to their results and collaborate to unlock the full potential
of their business Our Results Deliveryreg process builds our clientsrsquo capabilities and our True North values mean we do theright thing for our clients people and communitiesmdashalways
7222019 Bain amp Co- European Banking Report
httpslidepdfcomreaderfullbain-co-european-banking-report 3032
European banking | Bain amp Company Inc
Page 28
Key contacts in Bainrsquos European Financial Services practice
Franco Baronio in Milan (francobaroniobaincom)Rocco DrsquoAcunto in Milan (roccodacuntobaincom)
Ada Di Marzo in Paris (adadimarzobaincom)
Bertrand Facq in Warsaw (bertrandfacqbaincom)
Fabrice Franzen in Johannesburg (fabricefranzenbaincom)
Thomas Herbeck in Frankfurt (thomasherbeckbaincom)
Karaca Kestelli in Istanbul (karacakestellibaincom)
Nicolaacutes Lopez in Madrid (nicolaslopezbaincom)
Niels Peder Nielsen in Copenhagen (nielspedernielsenbaincom)
Andrea Oldrini in Milan (andreaoldrinibaincom)
Mathijs Robbens in Amsterdam (mathijsrobbensbaincom)
Visar Sala in Moscow (visarsalabaincom)
Walter Sinn in Frankfurt (waltersinnbaincom)Joatildeo Soares in London (joaosoaresbaincom)
Acknowledgments
The authors would like to thank the following Bain colleagues for their valuable support in producing this report
Sonal Chawla Christian Duus Franccedilois Fastrez Farsan Ghassim and Shikha Mahato
See these related Bain perspectives at wwwbaincom
bull Managing risk and capital
bull How Europersquos banks can return to health
bull The digital challenge to retail banks
7222019 Bain amp Co- European Banking Report
httpslidepdfcomreaderfullbain-co-european-banking-report 3132
7222019 Bain amp Co- European Banking Report
httpslidepdfcomreaderfullbain-co-european-banking-report 3232
For more information visit wwwbaincom
Share983140 983105m983138io983150 Tru Rs983157983148ts
Bain amp Company is the management consulting firm that the worldrsquos business leaders come to whenthey want results
Bain advises clients on strategy operations technology organization private equity and mergers and acquisitions We develop
practical customized insights that clients act on and transfer skills that make change stick Founded in 1973 Bain has
48 offices in 31 countries and our deep expertise and client roster cross every industry and economic sector Our clients
have outperformed the stock market 4 to 1
What sets us apart
We believe a consulting firm should be more than an adviser So we put ourselves in our clientsrsquo shoes selling outcomes not
projects We align our incentives with our clientsrsquo by linking our fees to their results and collaborate to unlock the full potential
of their business Our Results Deliveryreg process builds our clientsrsquo capabilities and our True North values mean we do theright thing for our clients people and communitiesmdashalways

7222019 Bain amp Co- European Banking Report
httpslidepdfcomreaderfullbain-co-european-banking-report 3132
7222019 Bain amp Co- European Banking Report
httpslidepdfcomreaderfullbain-co-european-banking-report 3232
For more information visit wwwbaincom
Share983140 983105m983138io983150 Tru Rs983157983148ts
Bain amp Company is the management consulting firm that the worldrsquos business leaders come to whenthey want results
Bain advises clients on strategy operations technology organization private equity and mergers and acquisitions We develop
practical customized insights that clients act on and transfer skills that make change stick Founded in 1973 Bain has
48 offices in 31 countries and our deep expertise and client roster cross every industry and economic sector Our clients
have outperformed the stock market 4 to 1
What sets us apart
We believe a consulting firm should be more than an adviser So we put ourselves in our clientsrsquo shoes selling outcomes not
projects We align our incentives with our clientsrsquo by linking our fees to their results and collaborate to unlock the full potential
of their business Our Results Deliveryreg process builds our clientsrsquo capabilities and our True North values mean we do theright thing for our clients people and communitiesmdashalways