Embed Size (px)
Citation preview
BAHRAIN • KUWAIT • OMAN • EGYPT • IRAQ • LIBYA • UNITED KINGDOM

02 Group mission statement03 AUB operating divisions06 Financial highlights14 Board of Directors’ report18 Board of Directors20 Chairman’s statement22 Group Chief Executive Officer &
Managing Director’s statement
26 Corporate governance33 Group business and risk review38 Group organisation39 Group management40 Contact details41 Consolidated financial statements90 Pillar III disclosures - Basel II
Contents

With AUB on a more solid and assured footing, it is now moving forward in capitalizing on its strengths and targeting opportunities for growth and expansion across its business lines and geographies.
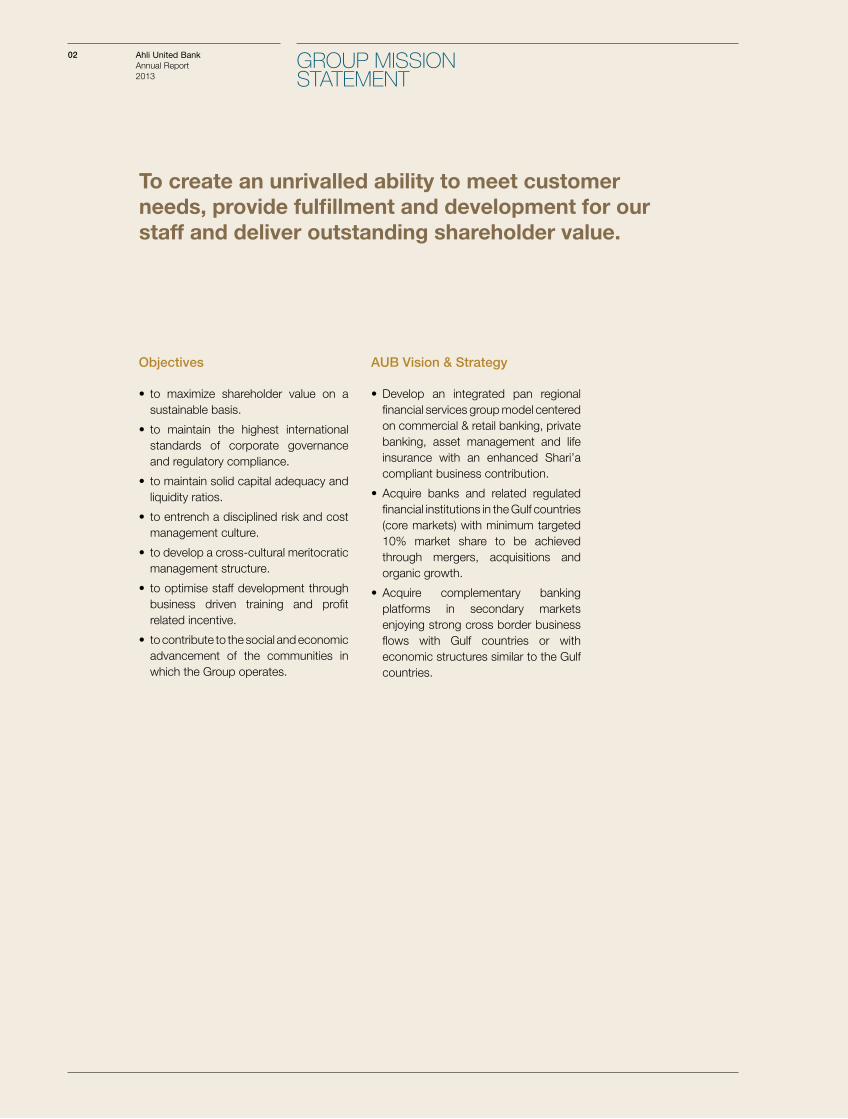
Objectives
• to maximize shareholder value on a sustainable basis.
• to maintain the highest international standards of corporate governance and regulatory compliance.
• to maintain solid capital adequacy and liquidity ratios.
• to entrench a disciplined risk and cost management culture.
• to develop a cross-cultural meritocratic management structure.
• to optimise staff development through business driven training and profit related incentive.
• to contribute to the social and economic advancement of the communities in which the Group operates.
AUB Vision & Strategy
• Develop an integrated pan regional financial services group model centered on commercial & retail banking, private banking, asset management and life insurance with an enhanced Shari’a compliant business contribution.
• Acquire banks and related regulated financial institutions in the Gulf countries (core markets) with minimum targeted 10% market share to be achieved through mergers, acquisitions and organic growth.
• Acquire complementary banking platforms in secondary markets enjoying strong cross border business flows with Gulf countries or with economic structures similar to the Gulf countries.
To create an unrivalled ability to meet customer needs, provide fulfillment and development for our staff and deliver outstanding shareholder value.
02 Ahli United BankAnnual Report 2013
GROUP MISSION STATEMENT
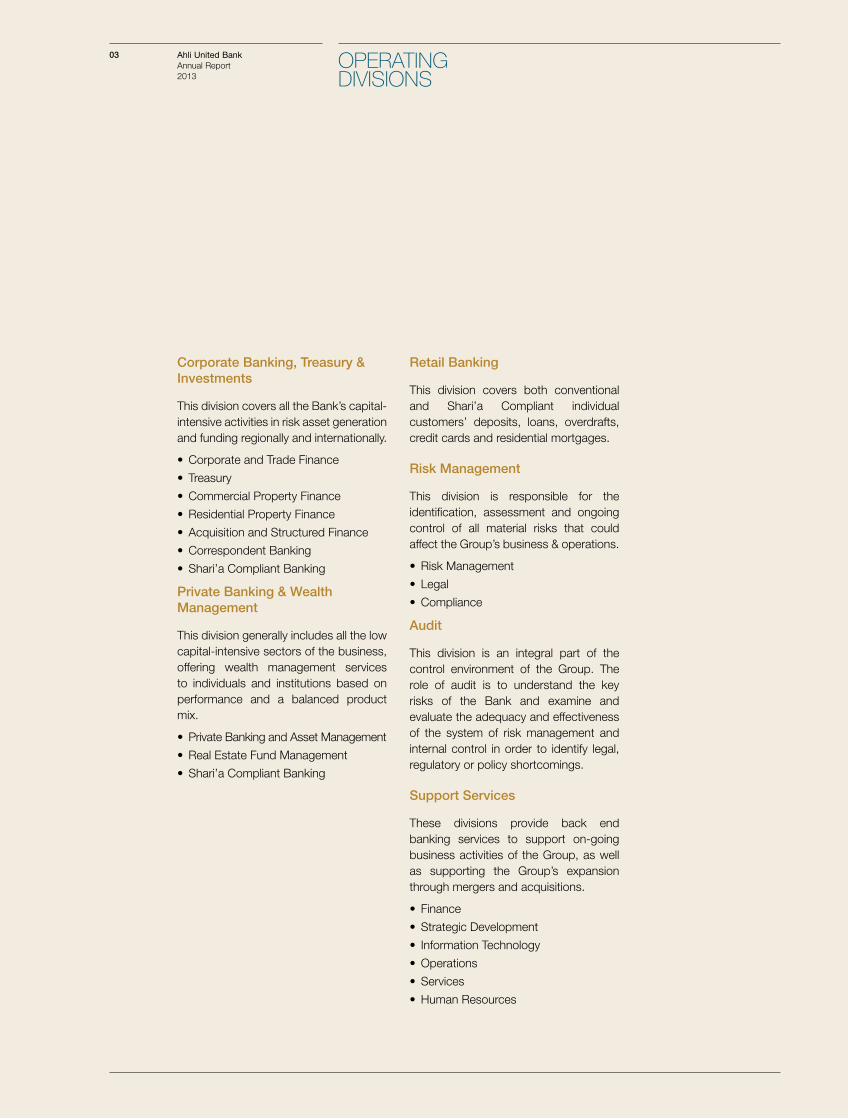
Corporate Banking, Treasury & Investments
This division covers all the Bank’s capital-intensive activities in risk asset generation and funding regionally and internationally.
• Corporate and Trade Finance
• Treasury
• Commercial Property Finance
• Residential Property Finance
• Acquisition and Structured Finance
• Correspondent Banking
• Shari’a Compliant Banking
Private Banking & Wealth Management
This division generally includes all the low capital-intensive sectors of the business, offering wealth management services to individuals and institutions based on performance and a balanced product mix.
• Private Banking and Asset Management
• Real Estate Fund Management
• Shari’a Compliant Banking
Retail Banking
This division covers both conventional and Shari’a Compliant individual customers’ deposits, loans, overdrafts, credit cards and residential mortgages.
Risk Management
This division is responsible for the identification, assessment and ongoing control of all material risks that could affect the Group’s business & operations.
• Risk Management
• Legal
• Compliance
Audit
This division is an integral part of the control environment of the Group. The role of audit is to understand the key risks of the Bank and examine and evaluate the adequacy and effectiveness of the system of risk management and internal control in order to identify legal, regulatory or policy shortcomings.
Support Services
These divisions provide back end banking services to support on-going business activities of the Group, as well as supporting the Group’s expansion through mergers and acquisitions.
• Finance
• Strategic Development
• Information Technology
• Operations
• Services
• Human Resources
03 Ahli United BankAnnual Report 2013
OPERATING DIVISIONS
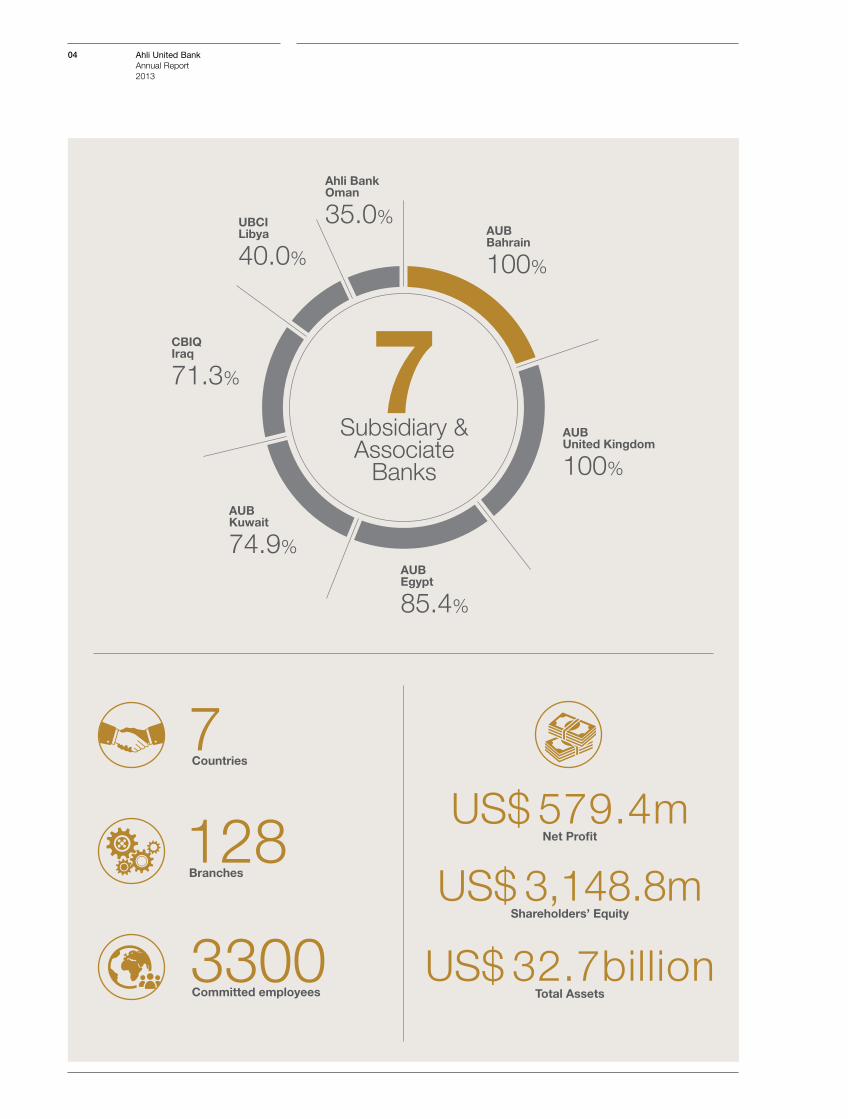
04 Ahli United BankAnnual Report 2013
7 Countries
128 Branches
3300 Committed employees
US$ 579.4mNet Profit
US$ 3,148.8mShareholders’ Equity
US$ 32.7billionTotal Assets
AUBUnited Kingdom
100%
AUBBahrain
100%
AUBEgypt
85.4%
CBIQIraq
71.3%
AUBKuwait
74.9%
UBCILibya
40.0%
Ahli BankOman
35.0%
7Subsidiary &
Associate Banks

05 Ahli United BankAnnual Report 2013
MOVING FORWARD...FOR YOUAUB has made a name for itself in being the trusted and truly dependable bank for its customers and counterparties, making good on its commitments in all circumstances and meeting their needs in good and adverse times.
06 Ahli United BankAnnual Report 2013
2009
2009
Total Loans US$ ‘000s Shareholders’ Equity US$ ‘000s
17,305,682
Net Profit US$ ‘000s Total Assets US$ ‘000s
2013
2013
2012
2012
2011
2011
2010
2010
2013
2013
2012
2012
2011
2011
2010
2010
2009
2009
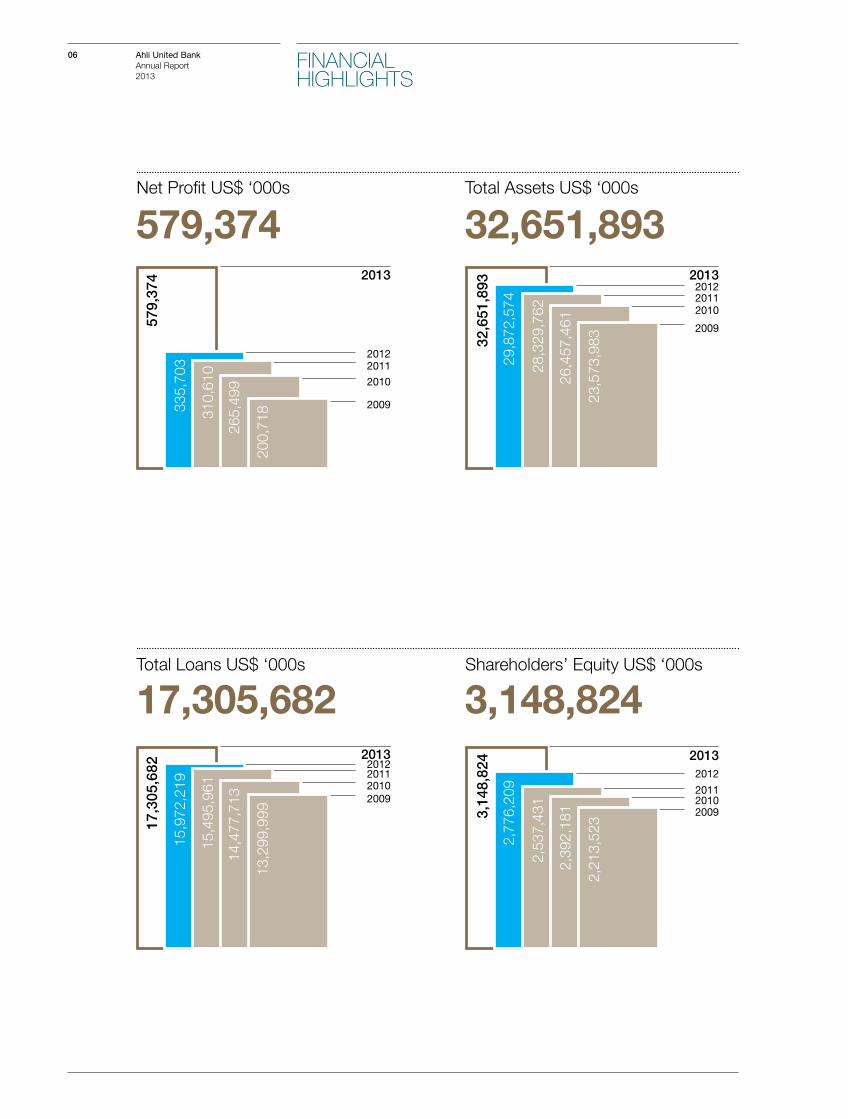
579,374 32,651,893
3,148,824
FINANCIAL HIGHLIGHTS
579
,374
1
7,30
5,68
2
32,
651,
893
200
,718
23,
573,
983
265
,499
26,
457,
461
310
,610
28,
329,
762
335
,703
29,
872,
574
13,
299,
999
14,
477,
713
15,
495,
961
15,9
72,2
19
3,1
48,8
24
2,2
13,5
23
2,3
92,1
81
2,5
37,4
31
2,7
76,2
09
07 Ahli United BankAnnual Report 2013
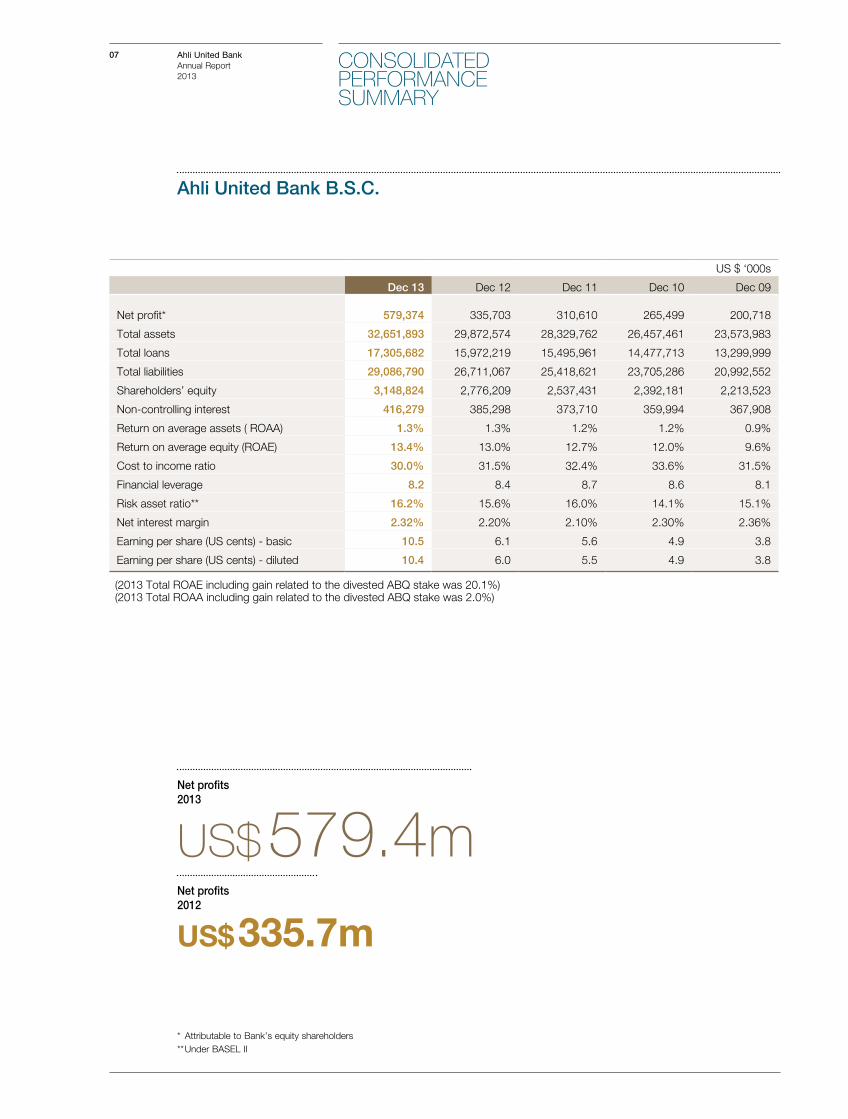
US $ ‘000s
Dec 13 Dec 12 Dec 11 Dec 10 Dec 09
Net profit* 579,374 335,703 310,610 265,499 200,718
Total assets 32,651,893 29,872,574 28,329,762 26,457,461 23,573,983
Total loans 17,305,682 15,972,219 15,495,961 14,477,713 13,299,999
Total liabilities 29,086,790 26,711,067 25,418,621 23,705,286 20,992,552
Shareholders’ equity 3,148,824 2,776,209 2,537,431 2,392,181 2,213,523
Non-controlling interest 416,279 385,298 373,710 359,994 367,908
Return on average assets ( ROAA) 1.3% 1.3% 1.2% 1.2% 0.9%
Return on average equity (ROAE) 13.4% 13.0% 12.7% 12.0% 9.6%
Cost to income ratio 30.0% 31.5% 32.4% 33.6% 31.5%
Financial leverage 8.2 8.4 8.7 8.6 8.1
Risk asset ratio** 16.2% 15.6% 16.0% 14.1% 15.1%
Net interest margin 2.32% 2.20% 2.10% 2.30% 2.36%
Earning per share (US cents) - basic 10.5 6.1 5.6 4.9 3.8
Earning per share (US cents) - diluted 10.4 6.0 5.5 4.9 3.8
CONSOLIDATED PERFORMANCE SUMMARY
Ahli United Bank B.S.C.
* Attributable to Bank’s equity shareholders** Under BASEL II
Net profits 2013
US$ 579.4mNet profits 2012
US$ 335.7m
(2013 Total ROAE including gain related to the divested ABQ stake was 20.1%)(2013 Total ROAA including gain related to the divested ABQ stake was 2.0%)
08 Ahli United BankAnnual Report 2013
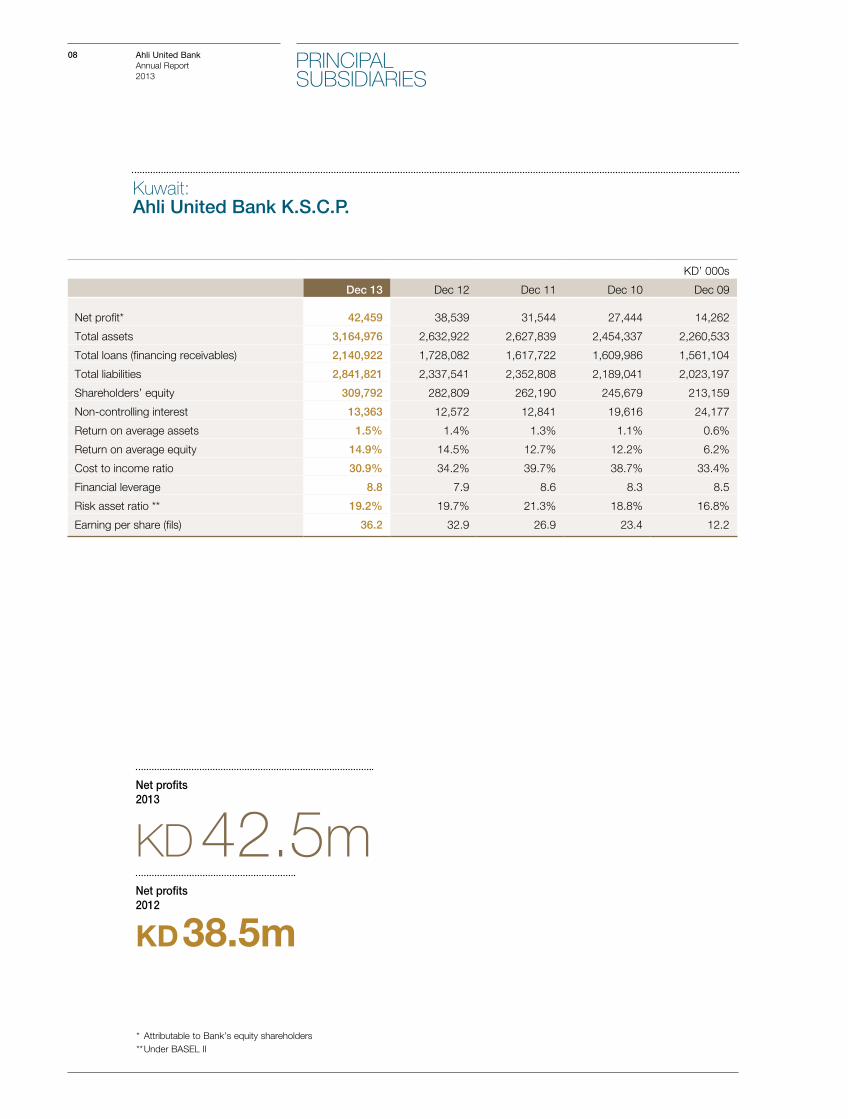
Kuwait:Ahli United Bank K.S.C.P.
* Attributable to Bank’s equity shareholders** Under BASEL II
PRINCIPAL SUBSIDIARIES
KD’ 000s
Dec 13 Dec 12 Dec 11 Dec 10 Dec 09
Net profit* 42,459 38,539 31,544 27,444 14,262
Total assets 3,164,976 2,632,922 2,627,839 2,454,337 2,260,533
Total loans (financing receivables) 2,140,922 1,728,082 1,617,722 1,609,986 1,561,104
Total liabilities 2,841,821 2,337,541 2,352,808 2,189,041 2,023,197
Shareholders’ equity 309,792 282,809 262,190 245,679 213,159
Non-controlling interest 13,363 12,572 12,841 19,616 24,177
Return on average assets 1.5% 1.4% 1.3% 1.1% 0.6%
Return on average equity 14.9% 14.5% 12.7% 12.2% 6.2%
Cost to income ratio 30.9% 34.2% 39.7% 38.7% 33.4%
Financial leverage 8.8 7.9 8.6 8.3 8.5
Risk asset ratio ** 19.2% 19.7% 21.3% 18.8% 16.8%
Earning per share (fils) 36.2 32.9 26.9 23.4 12.2
Net profits 2013
KD 42.5mNet profits 2012
KD 38.5m
09 Ahli United BankAnnual Report 2013
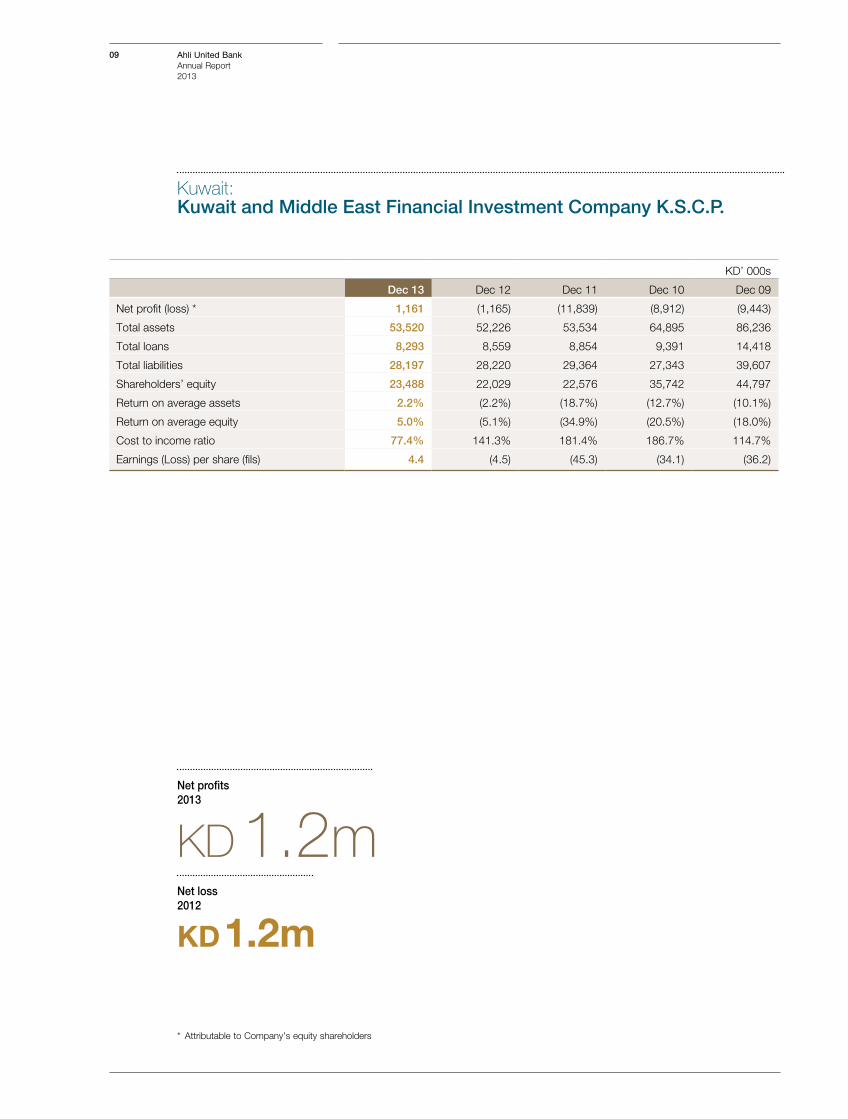
Kuwait:Kuwait and Middle East Financial Investment Company K.S.C.P.
* Attributable to Company’s equity shareholders
Net profits 2013
KD 1.2mNet loss 2012
KD 1.2m
KD’ 000s
Dec 13 Dec 12 Dec 11 Dec 10 Dec 09
Net profit (loss) * 1,161 (1,165) (11,839) (8,912) (9,443)
Total assets 53,520 52,226 53,534 64,895 86,236
Total loans 8,293 8,559 8,854 9,391 14,418
Total liabilities 28,197 28,220 29,364 27,343 39,607
Shareholders’ equity 23,488 22,029 22,576 35,742 44,797
Return on average assets 2.2% (2.2%) (18.7%) (12.7%) (10.1%)
Return on average equity 5.0% (5.1%) (34.9%) (20.5%) (18.0%)
Cost to income ratio 77.4% 141.3% 181.4% 186.7% 114.7%
Earnings (Loss) per share (fils) 4.4 (4.5) (45.3) (34.1) (36.2)
10 Ahli United BankAnnual Report 2013
PRINCIPAL SUBSIDIARIESCONTINUED
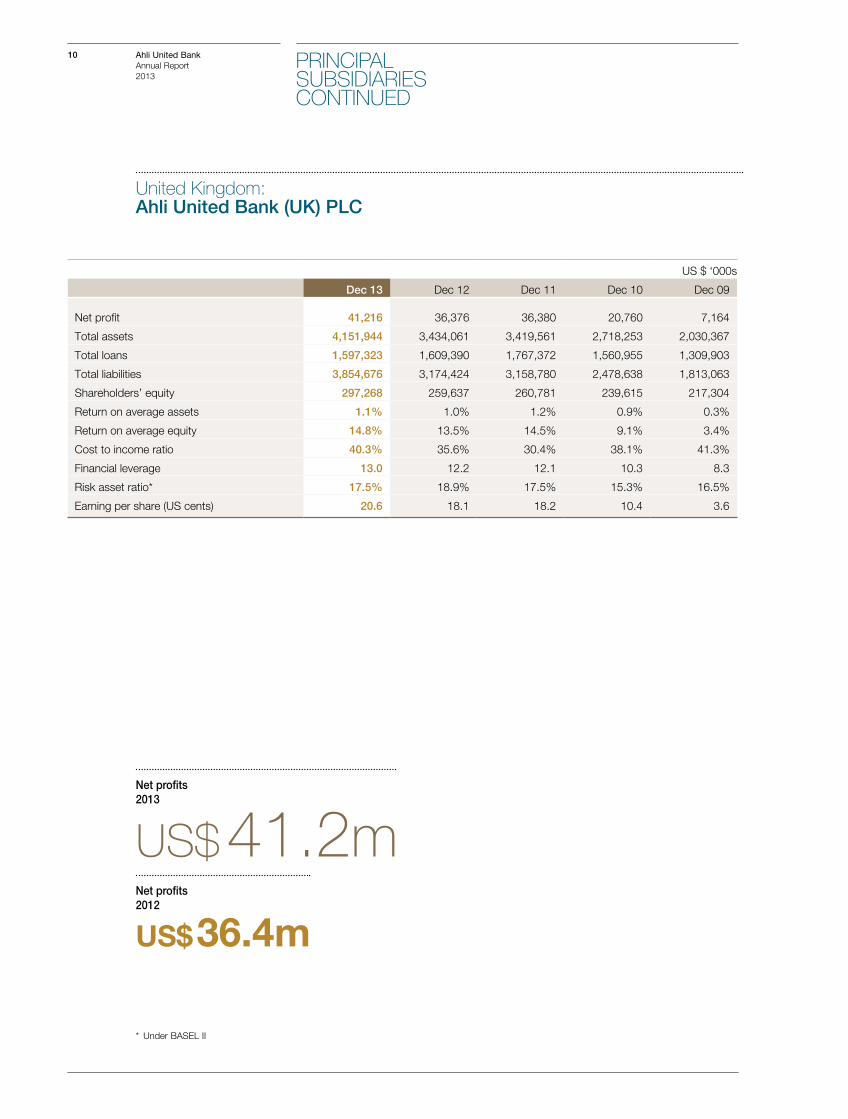
United Kingdom:Ahli United Bank (UK) PLC
* Under BASEL II
US $ ‘000s
Dec 13 Dec 12 Dec 11 Dec 10 Dec 09
Net profit 41,216 36,376 36,380 20,760 7,164
Total assets 4,151,944 3,434,061 3,419,561 2,718,253 2,030,367
Total loans 1,597,323 1,609,390 1,767,372 1,560,955 1,309,903
Total liabilities 3,854,676 3,174,424 3,158,780 2,478,638 1,813,063
Shareholders’ equity 297,268 259,637 260,781 239,615 217,304
Return on average assets 1.1% 1.0% 1.2% 0.9% 0.3%
Return on average equity 14.8% 13.5% 14.5% 9.1% 3.4%
Cost to income ratio 40.3% 35.6% 30.4% 38.1% 41.3%
Financial leverage 13.0 12.2 12.1 10.3 8.3
Risk asset ratio* 17.5% 18.9% 17.5% 15.3% 16.5%
Earning per share (US cents) 20.6 18.1 18.2 10.4 3.6
Net profits 2013
US$ 41.2mNet profits 2012
US$ 36.4m
11 Ahli United BankAnnual Report 2013
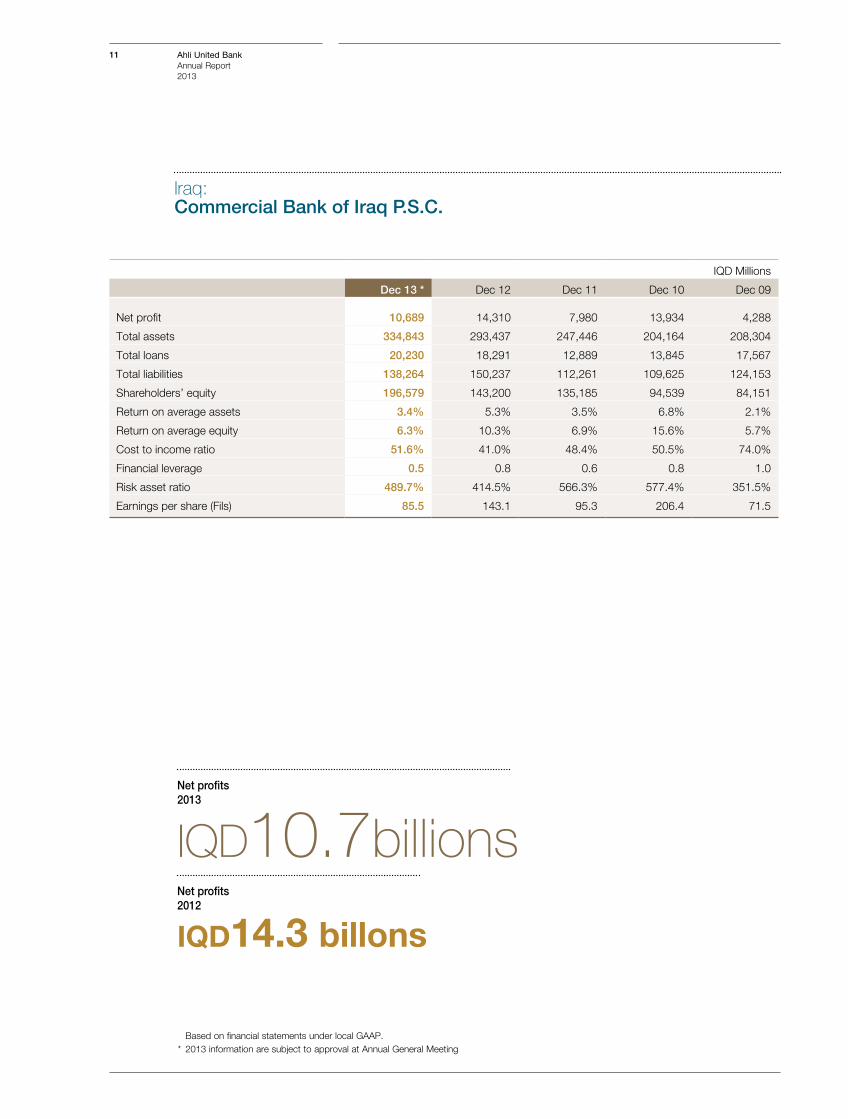
Iraq:Commercial Bank of Iraq P.S.C.
Based on financial statements under local GAAP. * 2013 information are subject to approval at Annual General Meeting
Net profits 2013
IQD 10.7billionsNet profits 2012
IQD 14.3 billons
IQD Millions
Dec 13 * Dec 12 Dec 11 Dec 10 Dec 09
Net profit 10,689 14,310 7,980 13,934 4,288
Total assets 334,843 293,437 247,446 204,164 208,304
Total loans 20,230 18,291 12,889 13,845 17,567
Total liabilities 138,264 150,237 112,261 109,625 124,153
Shareholders’ equity 196,579 143,200 135,185 94,539 84,151
Return on average assets 3.4% 5.3% 3.5% 6.8% 2.1%
Return on average equity 6.3% 10.3% 6.9% 15.6% 5.7%
Cost to income ratio 51.6% 41.0% 48.4% 50.5% 74.0%
Financial leverage 0.5 0.8 0.6 0.8 1.0
Risk asset ratio 489.7% 414.5% 566.3% 577.4% 351.5%
Earnings per share (Fils) 85.5 143.1 95.3 206.4 71.5
12 Ahli United BankAnnual Report 2013
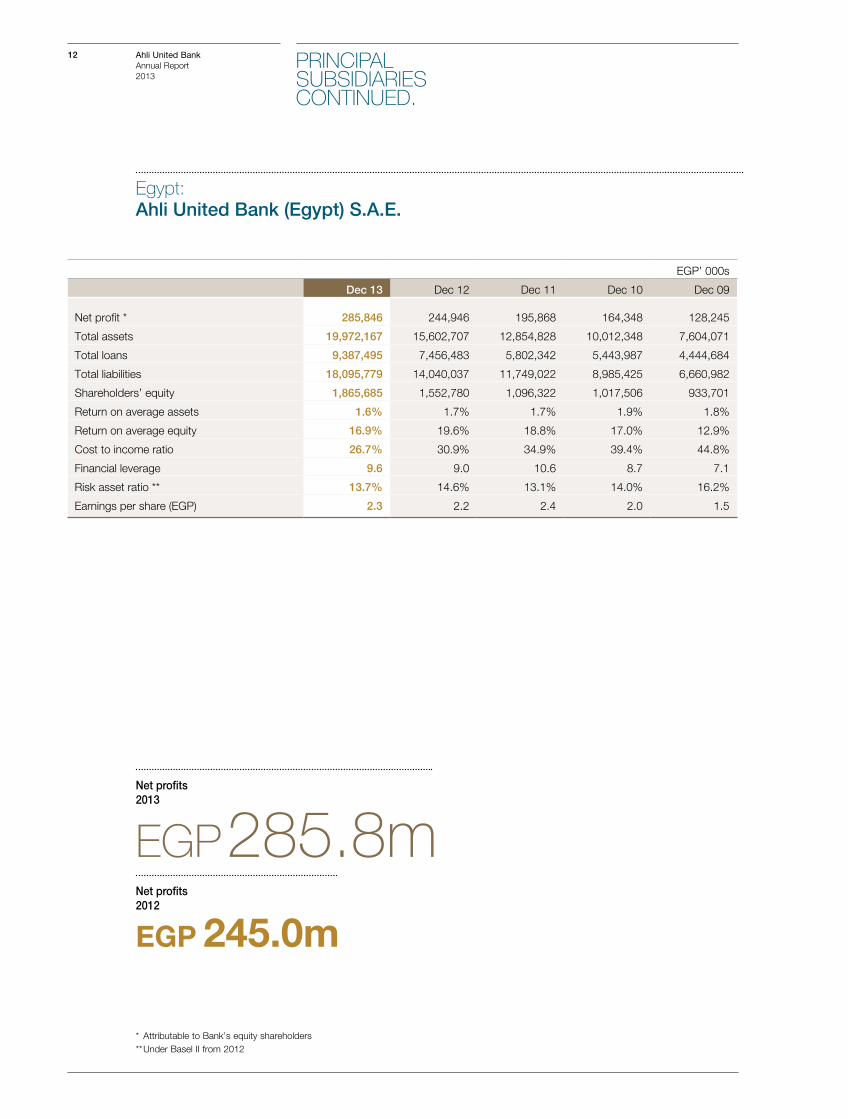
Egypt:Ahli United Bank (Egypt) S.A.E.
* Attributable to Bank’s equity shareholders ** Under Basel II from 2012
Net profits 2013
EGP 285.8mNet profits 2012
EGP 245.0m
EGP’ 000s
Dec 13 Dec 12 Dec 11 Dec 10 Dec 09
Net profit * 285,846 244,946 195,868 164,348 128,245
Total assets 19,972,167 15,602,707 12,854,828 10,012,348 7,604,071
Total loans 9,387,495 7,456,483 5,802,342 5,443,987 4,444,684
Total liabilities 18,095,779 14,040,037 11,749,022 8,985,425 6,660,982
Shareholders’ equity 1,865,685 1,552,780 1,096,322 1,017,506 933,701
Return on average assets 1.6% 1.7% 1.7% 1.9% 1.8%
Return on average equity 16.9% 19.6% 18.8% 17.0% 12.9%
Cost to income ratio 26.7% 30.9% 34.9% 39.4% 44.8%
Financial leverage 9.6 9.0 10.6 8.7 7.1
Risk asset ratio ** 13.7% 14.6% 13.1% 14.0% 16.2%
Earnings per share (EGP) 2.3 2.2 2.4 2.0 1.5
PRINCIPAL SUBSIDIARIESCONTINUED.
13 Ahli United BankAnnual Report 2013
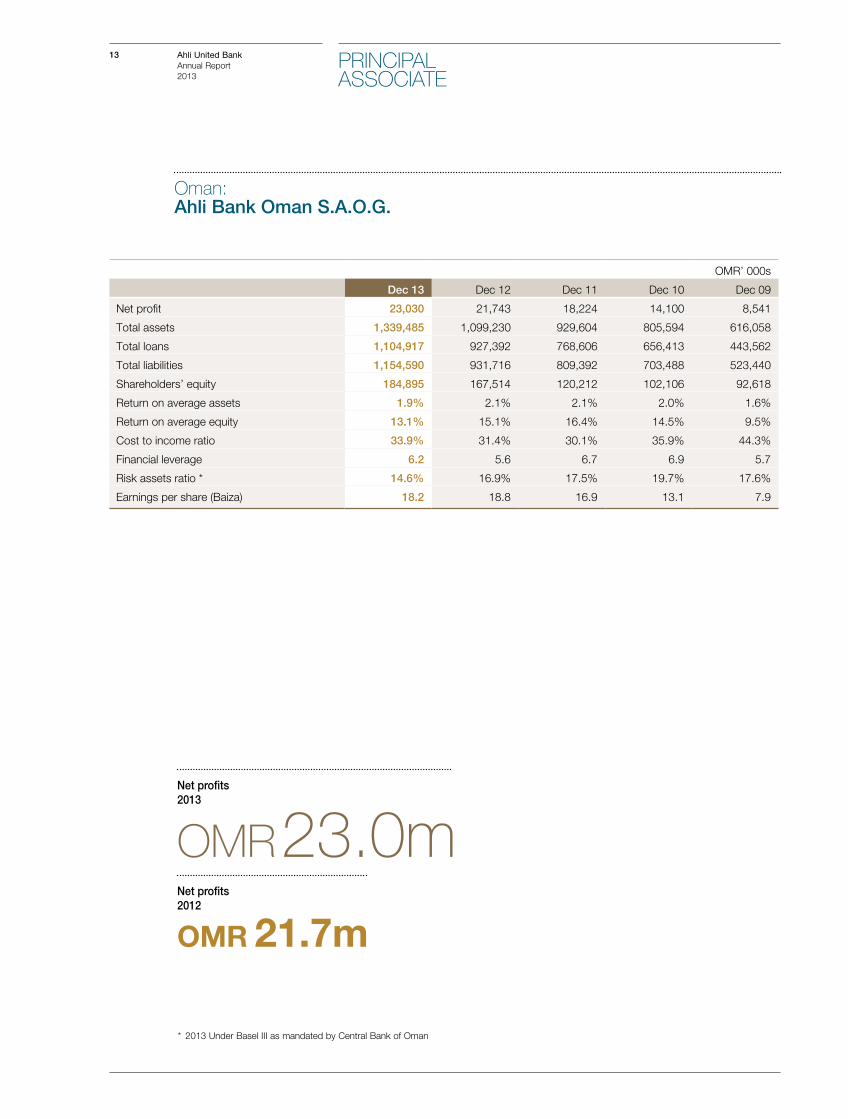
Oman:Ahli Bank Oman S.A.O.G.
* 2013 Under Basel III as mandated by Central Bank of Oman
Net profits 2013
OMR 23.0mNet profits 2012
OMR 21.7m
OMR’ 000s
Dec 13 Dec 12 Dec 11 Dec 10 Dec 09
Net profit 23,030 21,743 18,224 14,100 8,541
Total assets 1,339,485 1,099,230 929,604 805,594 616,058
Total loans 1,104,917 927,392 768,606 656,413 443,562
Total liabilities 1,154,590 931,716 809,392 703,488 523,440
Shareholders’ equity 184,895 167,514 120,212 102,106 92,618
Return on average assets 1.9% 2.1% 2.1% 2.0% 1.6%
Return on average equity 13.1% 15.1% 16.4% 14.5% 9.5%
Cost to income ratio 33.9% 31.4% 30.1% 35.9% 44.3%
Financial leverage 6.2 5.6 6.7 6.9 5.7
Risk assets ratio * 14.6% 16.9% 17.5% 19.7% 17.6%
Earnings per share (Baiza) 18.2 18.8 16.9 13.1 7.9
PRINCIPAL ASSOCIATE
14 Ahli United BankAnnual Report 2013
BOARD OFDIRECTORS’ REPORT
The Directors of Ahli United Bank (“AUB” or the “Bank”) are pleased to submit the Annual Report and accompanying consolidated financial statements for the year ended 31 December 2013.
General Operating Environment
The global economic environment in 2013 saw, on balance, an improvement over prior years across major economies, particularly the US economy, and across most of the AUB Group’s regional markets.
This note of relative optimism should however be taken with care and caution. Considerable downside risks continue to exist on the international and regional fronts arising from both political and economic risks and continue to place a shadow on the prospects of a smooth and sustainable path for development going forward.
The recovery in major economies has to be balanced against the sharp sell-off in emerging markets triggered by concerns on the effects of Fed tapering which is required to wean the US and rest of the world from over accommodative and unsustainable monetary policies.
Strong oil prices and buoyant stock markets in the GCC have improved business sentiment and opportunities but cannot mask the increasing tensions in other MENA countries still undergoing the throes of a very turbulent Arab Spring and its high associated economic and human costs.
As always, uncertainty even if tinged with a measure of optimism, dictates a prudent approach to our risk management and growth plans as we contemplate a new year and chart our course forward.
Performance Overview
Despite the continuing operating challenges faced by its main markets, AUB successfully delivered another record performance in 2013 clearly demonstrating the success and viability of its core business model based on prudent and diversified risk management, focused client centric marketing and intelligent spend practices.
The key highlights of its performance were:
• Consolidated net profit, attributable to the Bank’s equity shareholders, of US$ 579.4 million as against US$ 335.7 million in 2012, a growth of 72.6%. This included a non-recurring gain/income – US$ 212.9 million (2012: US$ 44.1 million) relating to divestment of its 29.4% stake in Ahli Bank, Qatar (ABQ) in Q/1. Excluding this item, the operating profit of the Bank was US$ 366.5 million, a 25.7% growth over 2012 comparable result.
• Total operating income increased by 12.9% to US$ 958.3 million from US$ 848.7 million in 2012 supported by a rise in Net Interest Income of US$ 76.9 million(+12.1%) together with fees and commissions increasing by US$ 19.7 million(+16.2%).
• Improved results from existing associates resulted in a net US$ 5.4 million higher profit share from associates (+23.5% over 2012).
• Asset quality was sustained with the NPL ratio contained at 2.6% (2012:2.4%). The Group’s coverage ratio of total provisions to impaired loans was 149.4% at the end of the year (2012: 149.8%). Specific provision coverage stood at 87.6% compared to 87.7% in 2012.
• Total assets increased by 9.3% to US$ 32.7 billion (2012: US$ 29.9 billion) contributed by:
i) Loans and advances portfolio which increased by 8.3% to US$ 17.3 billion (2012: US$ 16.0 billion).
ii) The non-trading investments portfolio grew by 6.4% to achieve business targets and to comply with liquidity regimes imposed by regulators.
iii) Inter-bank placements increased from US$ 3.8 billion as at 31 December 2012 to US$ 4.4 billion as at 31 December 2013.
• Customers’ deposits were up by 17.4% to US$ 22.0 billion (2012: US$ 18.8 billion) to fund the balanced growth in loans and advances of 8.3%. This is reflected in the year-end loans/total deposits ratio of 65.6% (2012: 68.3%).
• Customer deposit growth enabled further reduction in higher cost borrowings under re-purchase agreements by US$ 590.2 million.
• Continued focus on intelligent cost spends and enhancing productivity resulted in an improvement of the operating cost to income ratio during the year to 30.0% (2012: 31.5%).
• Returns on average equity and on average assets of 20.1% and 2.0% respectively were achieved. Excluding the non-recurring gain related to the divested ABQ stake, operating return on Average Equity increased to 13.4% (2012: 13.0%) while the operating return on Average Assets was sustained at 1.3%.
Strategic & Corporate Developments
During the first quarter of 2013, AUB divested its diluted stake of 29.4% in Ahli Bank Qatar (ABQ) by cash sale to the Qatar Foundation for Education, Science & Community Development at a price of QR 60 per share, generating a net exceptional profit of US$ 212.9 million. The decision to sell was triggered by AUB’s inability, due to legal factors, to maintain its shareholding above the minimum levels required for ABQ to qualify as a strategic core investment with associated management and reputational exposure as per the AUB Group Investments Policy.
The sale does not represent a reversal of our regional investment strategy and is solely driven by the specific legal constraints linked to this investment. AUB will continue to seek attractive opportunities to develop its banking franchise in the region through new acquisitions and the development of our existing banks to service our client base and enhance our shareholder value.
15 Ahli United BankAnnual Report 2013
In October 2013, the International Finance Corporation Capitalization (Equity) Fund (“IFC Fund”) actioned its decision to accelerate conversion of its entire holding in AUB’s US$125 million Mandatorily Convertible Preference Shares (MCPS) into AUB common shares. The execution of the requested conversion into common shares resulted in the issuance of 167,045,454 new AUB common shares to the IFC Fund at an effective conversion price of US 74.83 cents per share on 9 October 2013. Post conversion, the IFC Fund acquired a c.2.9% shareholding in AUB.
The IFC Fund’s decision to exercise its conversion option prior to the mandatory conversion date represented a solid vote of confidence in the fundamentals of AUB and its regional business strategy.
AUB received another boost on 19th December 2013 when Standard & Poor’s, the world’s leading source of credit ratings, raised its long-term counterparty credit rating on the Bank from “BBB” to “BBB+” with a Stable Outlook.
This upgrade reflects the underlying strength of AUB Group and is a strong endorsement for our regional business model which has proven to be effective and resilient over the years.
Recognition
AUB has been the recipient of a number of prestigious banking awards during the year:
• Best Bank in Bahrain 2013 – Euromoney (eighth consecutive year)
• Best Emerging Market Bank in Bahrain 2013 - Global Finance (eighth consecutive year)
• Bank of the Year, Bahrain 2013 - The Banker magazine (eighth consecutive year)
• Best Local Bank, Bahrain 2013 - EMEA Finance magazine (fourth consecutive year)
• Best Foreign Exchange Provider in Bahrain 2014 - Global Finance (eighth consecutive year)
• Elite Quality Recognition Award by J P Morgan Chase (fifteenth consecutive year)
Directors’ Shareholdings & Remuneration
As at 31 December 2013, Directors held directly and through related parties 800,101,491 ordinary shares (2012: 711,612,349). The Directors also held 68,232,928 convertible notes (2012: 98,631,221 convertible notes) that are subject to vesting and other criteria.
Directors’ fees, allowances, expenses, salaries and remuneration totaled to US$ 4,712,705 (2012: US$ 4,101,285). As at 31 December 2013, senior management held 9,885,885 convertible notes (2012: 18,237,650 notes) that are subject to vesting and other criteria.
Appropriations
On the basis of the results of the Bank for the year ended 31 December 2013, the Board of Directors recommends the following appropriations of the Bank’s net profit of US$ 579,374 thousand for approval by the shareholders:
US$ ‘000
Net profit attributable to Bank’s equity shareholders 579,374
Transfer to statutory reserve 57,937
IFC Mandatorily convertible preference shares dividend-pro-rated
3,217
Proposed cash dividend – ordinary shares at US cents 4.5 per share
251,496
Proposed donations 1,000
Transfer to retained earnings 265,724
Conclusion
In my capacity as the Chairman of the Board, it is once again my pleasure to thank our shareholders for their continuing support and confidence reposed in AUB. It is needless to state that our achievements during 2013 were only made possible through the guidance of our regulators, the support and trust of our clients, business partners and customers and the dedication, professionalism and resilience of our staff.
2014 is a new year which we, as always, start with focused plans and ambitions to exceed our past performances and meet the aspirations of all our stakeholders.
Fahad Al-RajaanChairman19 February 2014
16 Ahli United BankAnnual Report 2013
EVOLVING WITH THE NEEDS OF CUSTOMERS
17 Ahli United BankAnnual Report 2013
CONNECTINGFOR
REGIONALPROSPERITYAUB focused strategy goes beyond achieving growth and profitability for its business, to aim at contributing to the wellbeing and prosperity of the region, from financing economically viable and vital projects and industries to supporting local communities and homegrown civic initiatives.
18 Ahli United BankAnnual Report 2013
Rashid Ismail Al-Meer
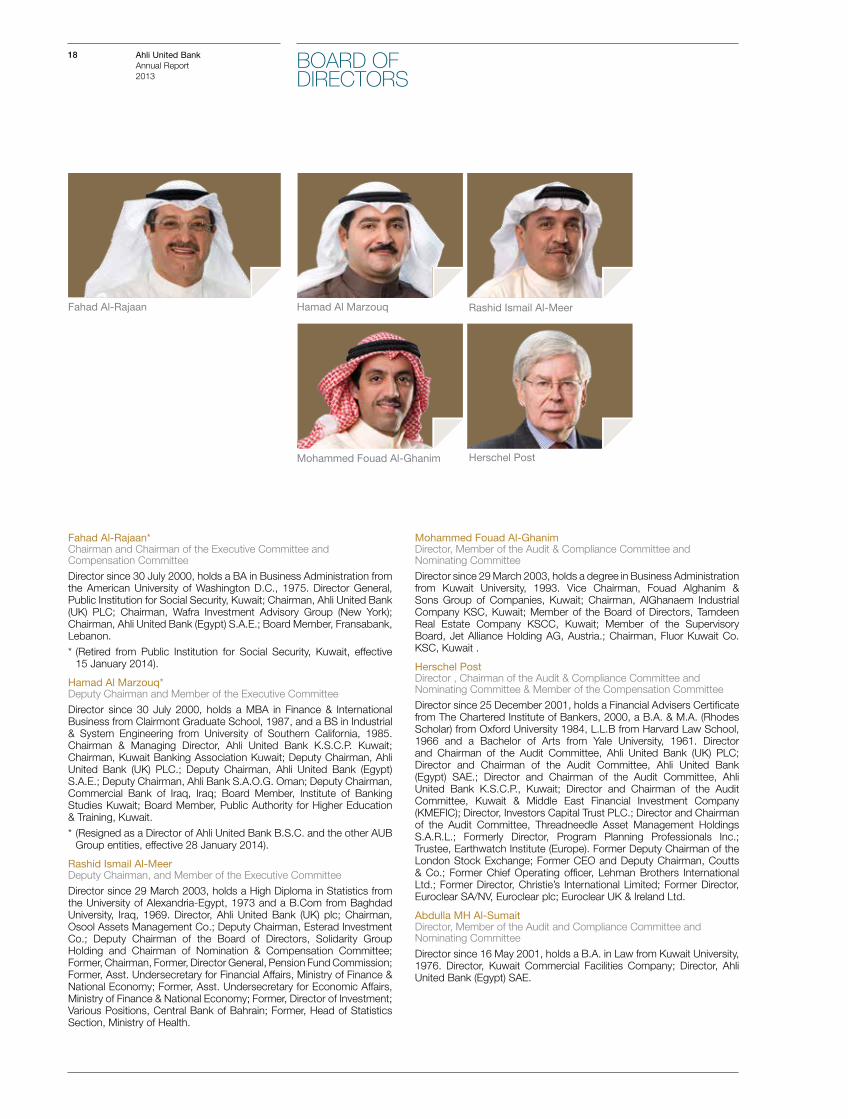
BOARD OF DIRECTORS
Fahad Al-Rajaan Hamad Al Marzouq
Mohammed Fouad Al-Ghanim Herschel Post
Fahad Al-Rajaan*Chairman and Chairman of the Executive Committee and Compensation Committee
Director since 30 July 2000, holds a BA in Business Administration from the American University of Washington D.C., 1975. Director General, Public Institution for Social Security, Kuwait; Chairman, Ahli United Bank (UK) PLC; Chairman, Wafra Investment Advisory Group (New York); Chairman, Ahli United Bank (Egypt) S.A.E.; Board Member, Fransabank, Lebanon.
* (Retired from Public Institution for Social Security, Kuwait, effective 15 January 2014).
Hamad Al Marzouq*Deputy Chairman and Member of the Executive Committee
Director since 30 July 2000, holds a MBA in Finance & International Business from Clairmont Graduate School, 1987, and a BS in Industrial & System Engineering from University of Southern California, 1985. Chairman & Managing Director, Ahli United Bank K.S.C.P. Kuwait; Chairman, Kuwait Banking Association Kuwait; Deputy Chairman, Ahli United Bank (UK) PLC.; Deputy Chairman, Ahli United Bank (Egypt) S.A.E.; Deputy Chairman, Ahli Bank S.A.O.G. Oman; Deputy Chairman, Commercial Bank of Iraq, Iraq; Board Member, Institute of Banking Studies Kuwait; Board Member, Public Authority for Higher Education & Training, Kuwait.
* (Resigned as a Director of Ahli United Bank B.S.C. and the other AUB Group entities, effective 28 January 2014).
Rashid Ismail Al-MeerDeputy Chairman, and Member of the Executive Committee
Director since 29 March 2003, holds a High Diploma in Statistics from the University of Alexandria-Egypt, 1973 and a B.Com from Baghdad University, Iraq, 1969. Director, Ahli United Bank (UK) plc; Chairman, Osool Assets Management Co.; Deputy Chairman, Esterad Investment Co.; Deputy Chairman of the Board of Directors, Solidarity Group Holding and Chairman of Nomination & Compensation Committee; Former, Chairman, Former, Director General, Pension Fund Commission; Former, Asst. Undersecretary for Financial Affairs, Ministry of Finance & National Economy; Former, Asst. Undersecretary for Economic Affairs, Ministry of Finance & National Economy; Former, Director of Investment; Various Positions, Central Bank of Bahrain; Former, Head of Statistics Section, Ministry of Health.
Mohammed Fouad Al-Ghanim Director, Member of the Audit & Compliance Committee and Nominating Committee
Director since 29 March 2003, holds a degree in Business Administration from Kuwait University, 1993. Vice Chairman, Fouad Alghanim & Sons Group of Companies, Kuwait; Chairman, AlGhanaem Industrial Company KSC, Kuwait; Member of the Board of Directors, Tamdeen Real Estate Company KSCC, Kuwait; Member of the Supervisory Board, Jet Alliance Holding AG, Austria.; Chairman, Fluor Kuwait Co. KSC, Kuwait .
Herschel PostDirector , Chairman of the Audit & Compliance Committee and Nominating Committee & Member of the Compensation Committee
Director since 25 December 2001, holds a Financial Advisers Certificate from The Chartered Institute of Bankers, 2000, a B.A. & M.A. (Rhodes Scholar) from Oxford University 1984, L.L.B from Harvard Law School, 1966 and a Bachelor of Arts from Yale University, 1961. Director and Chairman of the Audit Committee, Ahli United Bank (UK) PLC; Director and Chairman of the Audit Committee, Ahli United Bank (Egypt) SAE.; Director and Chairman of the Audit Committee, Ahli United Bank K.S.C.P., Kuwait; Director and Chairman of the Audit Committee, Kuwait & Middle East Financial Investment Company (KMEFIC); Director, Investors Capital Trust PLC.; Director and Chairman of the Audit Committee, Threadneedle Asset Management Holdings S.A.R.L.; Formerly Director, Program Planning Professionals Inc.; Trustee, Earthwatch Institute (Europe). Former Deputy Chairman of the London Stock Exchange; Former CEO and Deputy Chairman, Coutts & Co.; Former Chief Operating officer, Lehman Brothers International Ltd.; Former Director, Christie’s International Limited; Former Director, Euroclear SA/NV, Euroclear plc; Euroclear UK & Ireland Ltd.
Abdulla MH Al-SumaitDirector, Member of the Audit and Compliance Committee and Nominating Committee
Director since 16 May 2001, holds a B.A. in Law from Kuwait University, 1976. Director, Kuwait Commercial Facilities Company; Director, Ahli United Bank (Egypt) SAE.

19 Ahli United BankAnnual Report 2013
Abdulla MH Al-Sumait
Turki Bin Mohammed Al-Khater
Mohammed Saleh Behbehani Mohammed Jassim Al-Marzouq
Michael Essex Adel A. El-Labban
Mohammed Saleh Behbehani Director and Member of the Compensation Committee
Director since 30 July 2000 Partner & President, Mohammad Saleh & Reza Yousuf Behbehani Co; Partner, Mohammad Saleh Behbehani & Co. W.L.L; Partner & President, Shereen Travels, Kuwait; Partner, Behbehani Bros., W.L.L, Bahrain; Partner & President, Shereen Real Estate Co.; Partner & President, Behbehani Jeep Motors Co. W.L.L.; Partner & President, Shereen Investment Co; Board & Executive Committee Member, Ahli United Bank K.S.C.P.; Chairman, Kuwait Insurance Co. S.A.K; Partner & President, Shereen Motor Co.W.L.L; Partner & President, Behbehani Automall Co. W.L.L; Partner, Al Mulla & Behbehani Motor Co. W.L.L; Vice Chairman, United Beverage Co; Chairman, Maersk Kuwait Co. W.L.L; Chairman, Maersk Logistics Co. W.L.L.; Former Director, Purchase & Imports, Public Works Dept., Govt. of Kuwait; Former Dy. Chairman, Al Ahli Bank of Kuwait K.S.C.; Former Board & Executive Committee Member, Ahli United Bank (UK) Plc; Former Director, Swiss Kuwaiti Bank.; Former Director, UBAF (Hong Kong) Limited.
Mohammed Jassim Al-MarzouqDirector and Member of the Executive Committee*
Director since, 27 March 2006, holds a Bachelor of Commerce from Major Finance Kuwait University, 1991. CEO, Tamdeen Real Estate Co. Kuwait; Chairman, Tamdeen Shopping Centre, Kuwait; Chairman, Tamdeen Real Estate Co., Bahrain; Board Member, Fateh Al Khear Holding Co., Kuwait; Board Member of Al Maalem Holding Co, Bahrain; Formerly: Chairman, Tamdeen Real Estate Co, Kuwait; Board Member of Global Omani Development & Investment Co, Oman ; Former, Deputy Chairman, Tamdeen Shopping Centre Co, Kuwait; Former Board Member, Bank of Kuwait & The Middle East, Kuwait; Former, Vice Chairman, Tamdeen Investment Co, Kuwait; Former, Board Member, Al Ahli Bank of Kuwait, Kuwait; Former, Board Member, Kuwait National Cinema Co., Kuwait; Former Board Member, Arab Financial Consulting Co., Kuwait; Former, Chief of Executive Staff, Real Estate Investment Fund, Kuwait; Former, Board Member, The Public Warehousing Co., Kuwait;
* (Appointed as a Deputy Chairman of the AUB Board of Directors effective 19 February 2014)
Turki Bin Mohammed Al-Khater Director, Member of the Audit & Compliance Committee and Nominating Committee
Director since, 29 July 2009, holds a BSC in Economics & Social Science from Portland State University, U.S.A., 1982. President, General Retirement and Social Insurance Authority, Qatar; Chairman, United Development Co. (UDC) Qatar; Board Member, Masraf Al Rayan, Qatar; Board Member OOredoo, Qatar;
Michael Essex Director, Member of the Audit & Compliance Committee and Nominating Committee
Director since, 28 March 2012, holds an Executive Development Program Certificate from Harvard Business School, Boston-USA, 1997, M.A. Public Administration from Carleton University, Ottawa-Canada, 1975, B.A. Economics & Political Science from The University of Western Ontario London- Canada 1972. Board Member, Member of the Investment Committee, Member of the Investor Prudential Review Committee of Macquarie Bank India Infrastructure Fund; Formerly, International Finance Corporation’s Director of Investment & Advisory Operations for the MENA region- 20 Countries, Pakistan to Morocco; IFC-Deputy Director for Global Industry & Service Investments and Senior Risk Supervisor for Asia, Bank of Nova Scotia.
Adel A. El-LabbanDirector and Executive Committee Member
Director since 30 July 2000. Holds a Masters in Economics (Highest Honors) from the American University, Cairo, 1980, Bachelors in Economics (Highest Honors) from American University, Cairo, 1977 and a General Certificate of Education from London University, 1973. Group Chief Executive Officer & Managing Director, Ahli United Bank BSC, Bahrain; Director, Ahli United Bank (UK) PLC; Director, Ahli United Bank K.S.C.P., Kuwait; Director, Ahli United Bank (Egypt) SAE, Egypt; Director, Ahli Bank SAOG, Oman; Director, Commercial Bank of Iraq PSC, ; Deputy Chairman, United Bank for Commerce & Investment S.A.C. Libya;, Director, Bahrain Association of Banks, Bahrain; Former Chief Executive Officer and Director of the United Bank of Kuwait PLC, UK; Former Managing Director, Commercial International Bank of Egypt; Former Chairman, Commercial International Investment Company, Egypt; Former Vice President, Corporate Finance, Morgan Stanley, USA; Former Assistant Vice President, Arab Banking Corporation, Bahrain.
20 Ahli United BankAnnual Report 2013
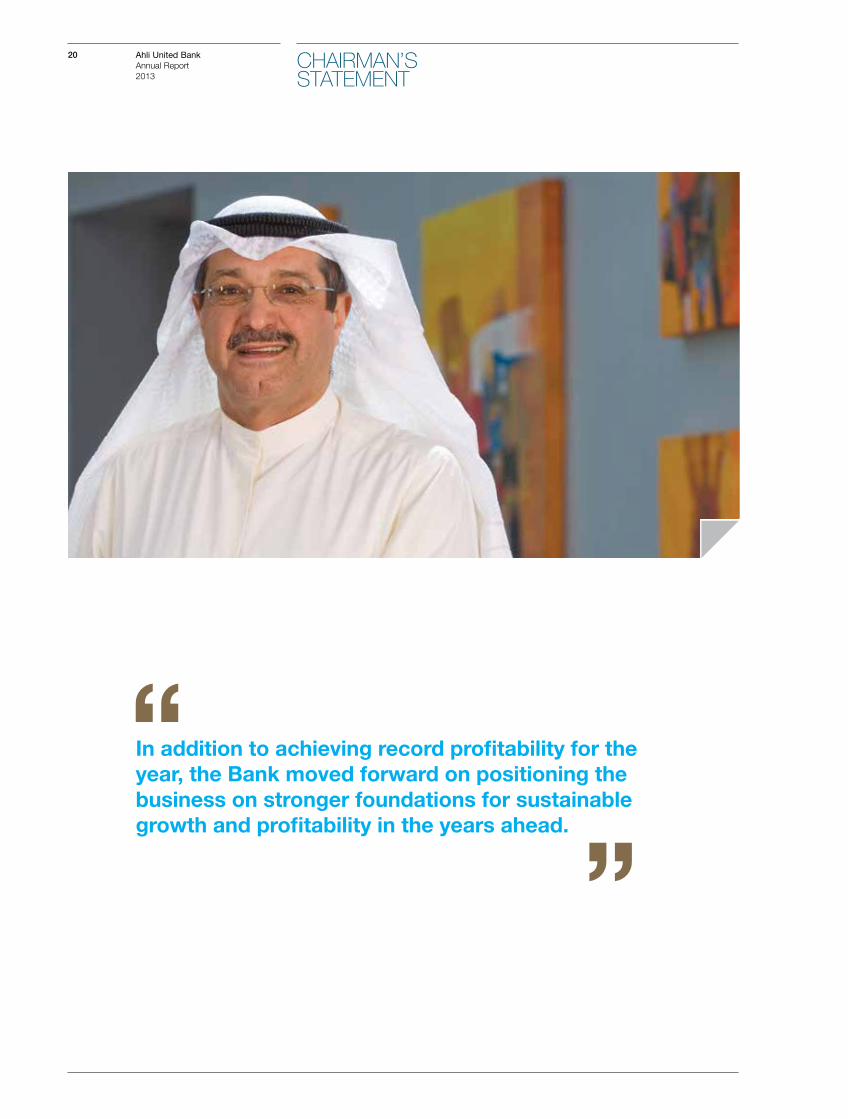
CHAIRMAN’SSTATEMENT
In addition to achieving record profitability for the year, the Bank moved forward on positioning the business on stronger foundations for sustainable growth and profitability in the years ahead.
21 Ahli United BankAnnual Report 2013
I am pleased to report that 2013 was a year of milestone results and significant progress for AUB. In addition to achieving record profitability for the year, the Bank moved forward on positioning the business on stronger foundations for sustainable growth and profitability in the years ahead. The Group’s performance was all the more notable against a continuing challenging background of global economic uncertainty and regional upheaval.
For the fiscal year 2013, the Bank’s net profit grew by 72.6% to the record level of US$ 579.4 million, which included an exceptional non-recurring gain of US$ 212.9 million on the sale of its 29.4% stake in Ahli Bank Qatar (ABQ). Excluding the impact of the Qatari affiliate sale, the 25.7% increase in net profit reflected the Bank’s focused development of business opportunities and its rigorous management of risks. The increase in profitability came from across the Group entities, clearly underlining AUB’s successful regional expansion strategy which provides a natural hedge against singular market disturbances.
Given the strong set of results achieved and in line with prudent capital planning for prospective growth opportunities, I am pleased to advise that the Board of Directors has recommended an increase in the cash dividend to US cents 4.5 per share (2012: US cents 4.0), together with a bonus ordinary share issue of 5% (2012: 5%).
Complementing the business performance, the Bank moved forward in making significant progress towards realising the Group vision to be the preferred and most dependable bank for our customers. Our teams focused on enhancing value and deepening commitment to providing clients with the superior quality products and services they seek and deserve under all including highly stressed operating circumstances without compromising staff or clients’ safety. Continued progress on meeting this objective is supported by increased investment in the key pillars that underpin our competitive advantage: people, harnessed technology and range of business offerings.
Investment and development in the online and mobile sphere were among the notable measures that bolstered the Bank’s forward momentum during the year. Our Business-to-Business platform for corporate customers, the first to be offered on a regional scale by a bank in the GCC, provides a one stop solution for seamless electronic execution of banking transactions and conducted business valued in excess of US$800 million during its first full year of operation. Another first was the launch, in partnership with Saxo Bank, of a global online trading platform
enabling trading in some 30,000 financial instruments across all the major markets worldwide. In addition, the launch of a mobile banking application has facilitated anywhere/anytime banking transactions for AUB customers, in a secure and convenient manner.
Acknowledgement by the banking industry of AUB’s performance and market leadership continued to extend across the Group. It was pleasing to note that, in addition to various awards received for the excellence of operations and services provided in Bahrain, AUB entities in Kuwait, Oman and Iraq also received recognition for achieving high performance standards.
Going forward, while global and regional uncertainties will undoubtedly present challenges in 2014, AUB will continue to pursue its strategy of regional expansion, seeking attractive opportunities to develop its banking franchise and focusing further on client service and technology to deliver optimum solutions for its customers. I am confident in AUB sustaining forward momentum and building growth to enhance shareholder value within a prudent risk management framework.
Early in 2014, Deputy Chairman, Hamad Al-Marzouq moved on to take up a new role and responsibilities that will see him serve his country and the industry in a new capacity. On behalf of the Board, I would like to thank him for the valuable contribution he has made as a Director of the Bank for over 14 years since the Bank’s inception.
In my capacity as Chairman of the Board, it is once again my pleasure to thank our shareholders for their continued commitment and support and our clients for placing their trust in our ability to service their needs across the AUB Group. The achievements in 2013 would not have been possible without the guidance and support received from our regulators, the commitment of our business partners and clients and the hard work, dedication and professionalism of our staff at all levels throughout the AUB Group.
Fahad Al-RajaanChairman

22 Ahli United BankAnnual Report 2013
GROUP CHIEF EXECUTIVE OFFICER &MANAGING DIRECTOR’SSTATEMENT
Our record results in 2014 testify to the success and viability of our core business model, based on prudent and diversified growth in operating income across business segments, proactive risk management, focused cost spending and continuous push on developing cross border business opportunities.
23 Ahli United BankAnnual Report 2013
The global economy showed gradual signs of improvement over 2013, albeit at a subdued and uneven pace, with the US providing the much needed lift which contrasted with the more sluggish upturn in the Eurozone and the increased volatility in emerging markets. The pace of growth in emerging markets was moderated, mainly on weak external demand, protectionist policies and jittery domestic markets over the expected tapering of the US stimulus program. Concerns over structural factors, labour markets and fiscal challenges in advanced economies, continue to temper prospects for a more resilient global recovery.
Closer to home, the MENA region faced a bifurcated state of affairs. Economic activity in the GCC countries remained generally buoyant on the back of strong public spending fuelled by robust oil prices, while major non-GCC economies continued to be impacted by heightened political and social instability, further weighing down on any policies for job creation or meaningful structural economic reforms for sustainable development.
Despite the challenging economic environment, the Group succeeded in delivering a very strong set of results, reporting its highest ever net profit, growing by 72.6% to US$ 579.4 million for the year 2013. This included an exceptional non-recurring gain of US$ 212.9 million on the sale of our 29.4% stake in Ahli Bank Qatar (ABQ). Excluding this item, the operating net profit of the Bank was US$ 366.5 million representing a 25.7% increase over the previous year. This record performance testifies to the success and viability of our core business model based on prudent and diversified growth in operating income across business segments, proactive risk management, focused cost spending and continuous push on developing cross border business opportunities.
Operating income increased by 12.9% from US$ 848.7 million to US$ 958.3 million in 2013, driven largely by a rise in net interest income (NII) of 12.1% to US$ 713.2 million (2012: US$ 636.4 million). Focused liability cost management, as reflected in reducing borrowings under repo and increasing deposit mobilisation, enabled the Bank to reduce the overall cost of funding by 35 basis points in 2013, and contributed to the increase in NII together with prudent growth in asset volumes within acceptable risk criteria. The Bank also expanded its non-interest revenues, as reflected in a 16.2% growth in fee income from US$ 121.4 million to US$ 141.1 million. Enhanced productivity and disciplined cost culture aligned to business needs across the AUB Group further improved the operating cost income ratio to a very satisfactory 30.0% (2012: 31.5%).
The loan portfolio grew by 8.3% to US$ 17.3 billion, a testament to our market responsive approach amidst a subdued underlying credit market. A notable point of satisfaction is the quality of our loan portfolio, with nonperforming loans contained to 2.6%, a result of prudent credit strategy, early problem recognition and prompt remedial action. This was backed by conservative provisioning coverage, inclusive of collective impairment provisions, of 149.4% as at 31 December 2013 and excluding available collaterals against recognized impaired loans.
Return on Average Equity increased to 20.1% (2012: 13.0%) with Return on Average Assets increasing to 2.0 % (2012: 1.3%). Adjusting for the exceptional non-recurring gain of US$ 212.9 million, Return on Average Equity increased to 13.4% while Return on Average Assets was sustained at 1.3%.
During the year, AUB moved forward with notable accomplishments across our different operating markets. In Kuwait, less than 3 years since it was fully converted to Shari’a compliant banking, AUB Kuwait strengthened its position as a preferred Islamic banking provider for its customers, generating attractive top-tier returns for its shareholders and earning recognition as Islamic Bank of the Year 2013 by a global financial publication.
In Oman, our Shari’a -compliant offering was expanded with the opening of more dedicated Islamic banking branches which are geared to tap into this new and exciting business opportunity. In Iraq, a market with enormous potential in demographic and economic terms, AUB Group increased its stake in the Commercial Bank of Iraq (CBIQ) to 71.3% in 2013 through a capital increase to comply with Central Bank of Iraq’s requirements. In Libya, pursuant to the granting of a license in May 2013, our first Islamic products on the retail side were launched, soon to be followed by the opening of our first Islamic branch in the Libyan market as a prelude to our full conversion to Islamic banking by 1 January 2015 as stipulated by regulatory decree for all Libyan banks.
The decision by IFC Capitalization Fund to acquire a 2.95% stake in AUB by accelerating the converting of its preference shares to common shares at a conversion price of US 74.83 cents per share, which represented an over 10% premium over the then prevailing AUB share price, was based on AUB’s solid financial and operational performance and signalled a strong vote of confidence by international institutions.
The prospects are promising for AUB. With a diversified business model and a rigorous, disciplined execution approach for its highly targeted strategy, AUB will continue to strengthen its position as a stronger regional player by seeking growth opportunities in new markets as well as enhancing its presence in existing markets.
Finally, I would like to express my gratitude to the Board of Directors for their active support and guidance. My sincere thanks are also due to the management and staff of the AUB Group whose professionalism, positive attitude and commitment has been fundamental to our strong performance this year and to paving the way forward for continued growth.
Adel A. El-LabbanGroup Chief Executive Officer & Managing Director
24 Ahli United BankAnnual Report 2013
TARGETED STRATEGY, SUSTAINABLE GROWTH
25 Ahli United BankAnnual Report 2013
WELL GOVERNED
BANKAUB has made great strides in ensuring that best Corporate Governance practices and controls are implemented across its operating areas and businesses for early detection and remedial treatment of any potential issues. Our goal is to ensure compliance with best international standards and applicable local regulatory requirements.
26 Ahli United BankAnnual Report 2013
Good Corporate Governance practices are important in creating and sustaining shareholder value and ensuring appropriate disclosure and transparency. The Bank’s Corporate Governance Policy provides the framework for the principles of effective Corporate Governance standards across the AUB Group.
The Board of Directors is committed to implementing robust Corporate Governance practices and to continually review and align these practices with international best practices, where appropriate.
The Bank’s management are committed to ensuring that procedures and processes are in place to reflect and support the Board approved Corporate Governance practices to ensure the highest standards of Corporate Governance throughout the AUB Group.
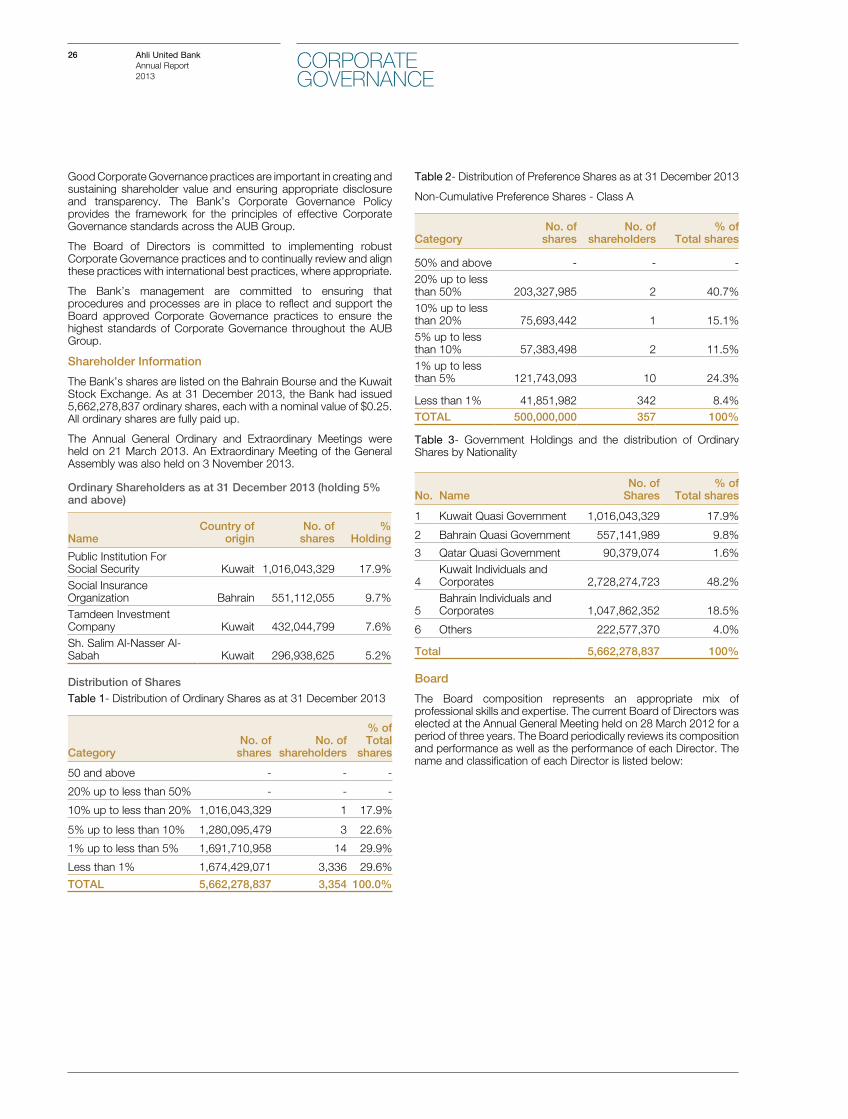
Shareholder Information
The Bank’s shares are listed on the Bahrain Bourse and the Kuwait Stock Exchange. As at 31 December 2013, the Bank had issued 5,662,278,837 ordinary shares, each with a nominal value of $0.25. All ordinary shares are fully paid up.
The Annual General Ordinary and Extraordinary Meetings were held on 21 March 2013. An Extraordinary Meeting of the General Assembly was also held on 3 November 2013.
Ordinary Shareholders as at 31 December 2013 (holding 5% and above)
NameCountry of
originNo. of
shares%
Holding
Public Institution For Social Security Kuwait 1,016,043,329 17.9%Social Insurance Organization Bahrain 551,112,055 9.7%Tamdeen Investment Company Kuwait 432,044,799 7.6%Sh. Salim Al-Nasser Al-Sabah Kuwait 296,938,625 5.2%
Distribution of Shares Table 1- Distribution of Ordinary Shares as at 31 December 2013
CategoryNo. of
sharesNo. of
shareholders
% of Total
shares
50 and above - - -
20% up to less than 50% - - -
10% up to less than 20% 1,016,043,329 1 17.9%
5% up to less than 10% 1,280,095,479 3 22.6%
1% up to less than 5% 1,691,710,958 14 29.9%
Less than 1% 1,674,429,071 3,336 29.6%
TOTAL 5,662,278,837 3,354 100.0%
Table 2- Distribution of Preference Shares as at 31 December 2013
Non-Cumulative Preference Shares - Class A
CategoryNo. of
sharesNo. of
shareholders% of
Total shares
50% and above - - -20% up to less than 50% 203,327,985 2 40.7%10% up to less than 20% 75,693,442 1 15.1%5% up to less than 10% 57,383,498 2 11.5%1% up to less than 5% 121,743,093 10 24.3%
Less than 1% 41,851,982 342 8.4%TOTAL 500,000,000 357 100%
Table 3- Government Holdings and the distribution of Ordinary Shares by Nationality
No. NameNo. of
Shares% of
Total shares
1 Kuwait Quasi Government 1,016,043,329 17.9%
2 Bahrain Quasi Government 557,141,989 9.8%
3 Qatar Quasi Government 90,379,074 1.6%
4Kuwait Individuals and Corporates 2,728,274,723 48.2%
5Bahrain Individuals and Corporates 1,047,862,352 18.5%
6 Others 222,577,370 4.0%
Total 5,662,278,837 100%
Board
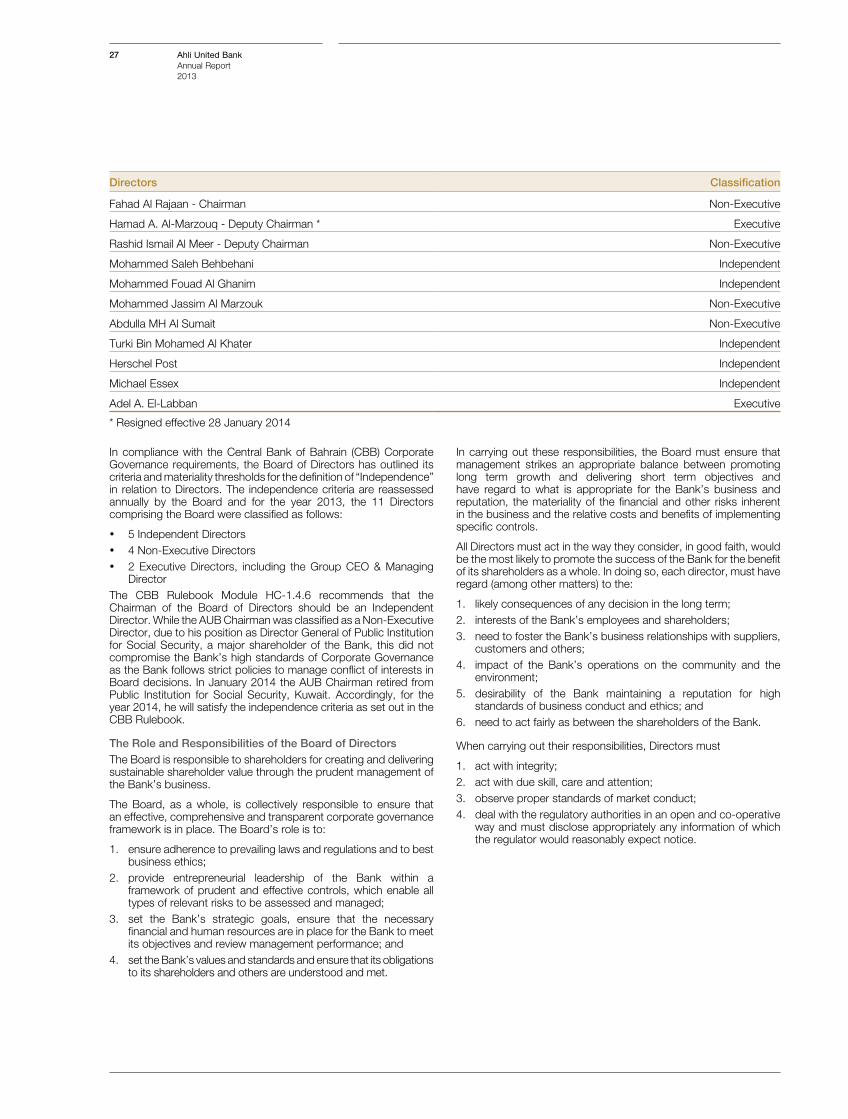
The Board composition represents an appropriate mix of professional skills and expertise. The current Board of Directors was elected at the Annual General Meeting held on 28 March 2012 for a period of three years. The Board periodically reviews its composition and performance as well as the performance of each Director. The name and classification of each Director is listed below:
CORPORATE GOVERNANCE
27 Ahli United BankAnnual Report 2013
Directors Classification
Fahad Al Rajaan - Chairman Non-Executive
Hamad A. Al-Marzouq - Deputy Chairman * Executive
Rashid Ismail Al Meer - Deputy Chairman Non-Executive
Mohammed Saleh Behbehani Independent
Mohammed Fouad Al Ghanim Independent
Mohammed Jassim Al Marzouk Non-Executive
Abdulla MH Al Sumait Non-Executive
Turki Bin Mohamed Al Khater Independent
Herschel Post Independent
Michael Essex Independent
Adel A. El-Labban Executive
* Resigned effective 28 January 2014
In compliance with the Central Bank of Bahrain (CBB) Corporate Governance requirements, the Board of Directors has outlined its criteria and materiality thresholds for the definition of “Independence” in relation to Directors. The independence criteria are reassessed annually by the Board and for the year 2013, the 11 Directors comprising the Board were classified as follows:
· 5 Independent Directors · 4 Non-Executive Directors· 2 Executive Directors, including the Group CEO & Managing
DirectorThe CBB Rulebook Module HC-1.4.6 recommends that the Chairman of the Board of Directors should be an Independent Director. While the AUB Chairman was classified as a Non-Executive Director, due to his position as Director General of Public Institution for Social Security, a major shareholder of the Bank, this did not compromise the Bank’s high standards of Corporate Governance as the Bank follows strict policies to manage conflict of interests in Board decisions. In January 2014 the AUB Chairman retired from Public Institution for Social Security, Kuwait. Accordingly, for the year 2014, he will satisfy the independence criteria as set out in the CBB Rulebook.
The Role and Responsibilities of the Board of Directors The Board is responsible to shareholders for creating and delivering sustainable shareholder value through the prudent management of the Bank’s business.
The Board, as a whole, is collectively responsible to ensure that an effective, comprehensive and transparent corporate governance framework is in place. The Board’s role is to:
1. ensure adherence to prevailing laws and regulations and to best business ethics;
2. provide entrepreneurial leadership of the Bank within a framework of prudent and effective controls, which enable all types of relevant risks to be assessed and managed;
3. set the Bank’s strategic goals, ensure that the necessary financial and human resources are in place for the Bank to meet its objectives and review management performance; and
4. set the Bank’s values and standards and ensure that its obligations to its shareholders and others are understood and met.
In carrying out these responsibilities, the Board must ensure that management strikes an appropriate balance between promoting long term growth and delivering short term objectives and have regard to what is appropriate for the Bank’s business and reputation, the materiality of the financial and other risks inherent in the business and the relative costs and benefits of implementing specific controls.
All Directors must act in the way they consider, in good faith, would be the most likely to promote the success of the Bank for the benefit of its shareholders as a whole. In doing so, each director, must have regard (among other matters) to the:
1. likely consequences of any decision in the long term; 2. interests of the Bank’s employees and shareholders; 3. need to foster the Bank’s business relationships with suppliers,
customers and others; 4. impact of the Bank’s operations on the community and the
environment; 5. desirability of the Bank maintaining a reputation for high
standards of business conduct and ethics; and 6. need to act fairly as between the shareholders of the Bank.
When carrying out their responsibilities, Directors must
1. act with integrity;2. act with due skill, care and attention; 3. observe proper standards of market conduct; 4. deal with the regulatory authorities in an open and co-operative
way and must disclose appropriately any information of which the regulator would reasonably expect notice.
28 Ahli United BankAnnual Report 2013
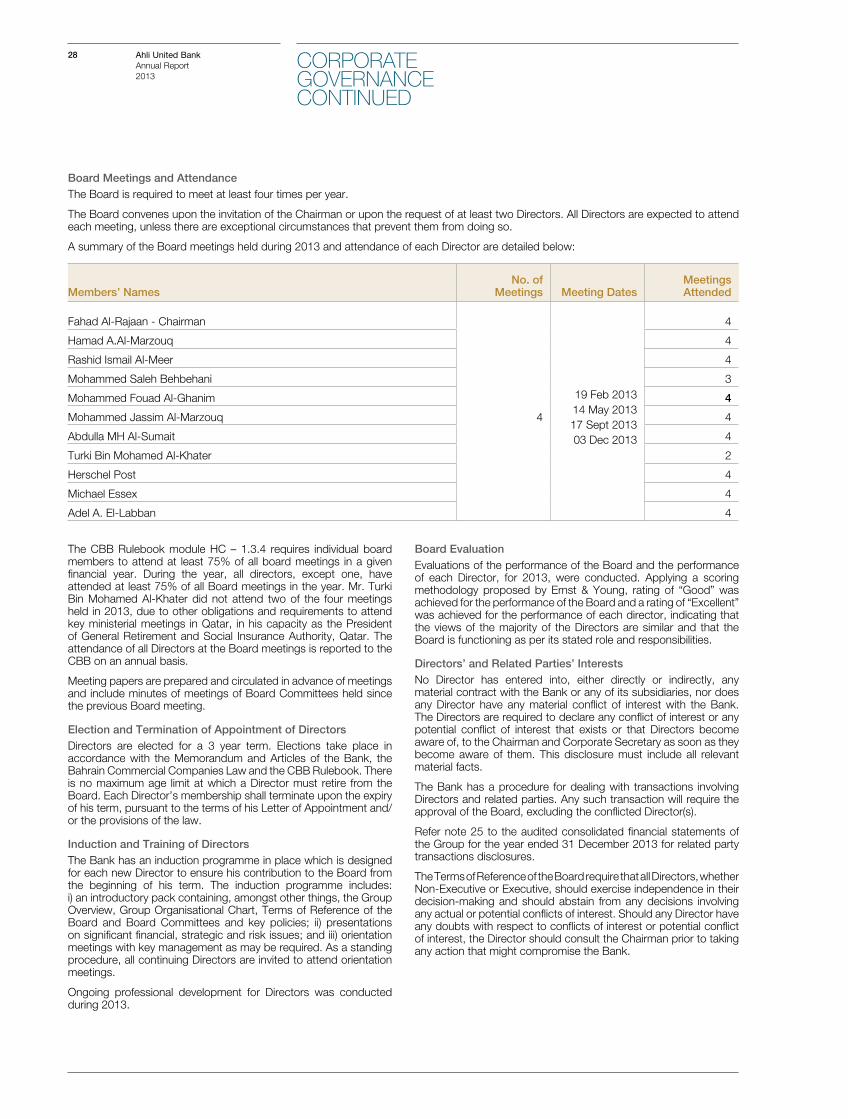
Board Meetings and Attendance The Board is required to meet at least four times per year.
The Board convenes upon the invitation of the Chairman or upon the request of at least two Directors. All Directors are expected to attend each meeting, unless there are exceptional circumstances that prevent them from doing so.
A summary of the Board meetings held during 2013 and attendance of each Director are detailed below:
Members’ NamesNo. of
Meetings Meeting DatesMeetingsAttended
Fahad Al-Rajaan - Chairman
4
19 Feb 2013 14 May 201317 Sept 2013 03 Dec 2013
4
Hamad A.Al-Marzouq 4
Rashid Ismail Al-Meer 4
Mohammed Saleh Behbehani 3
Mohammed Fouad Al-Ghanim 4
Mohammed Jassim Al-Marzouq 4
Abdulla MH Al-Sumait 4
Turki Bin Mohamed Al-Khater 2
Herschel Post 4
Michael Essex 4
Adel A. El-Labban 4
The CBB Rulebook module HC – 1.3.4 requires individual board members to attend at least 75% of all board meetings in a given financial year. During the year, all directors, except one, have attended at least 75% of all Board meetings in the year. Mr. Turki Bin Mohamed Al-Khater did not attend two of the four meetings held in 2013, due to other obligations and requirements to attend key ministerial meetings in Qatar, in his capacity as the President of General Retirement and Social Insurance Authority, Qatar. The attendance of all Directors at the Board meetings is reported to the CBB on an annual basis.
Meeting papers are prepared and circulated in advance of meetings and include minutes of meetings of Board Committees held since the previous Board meeting.
Election and Termination of Appointment of Directors Directors are elected for a 3 year term. Elections take place in accordance with the Memorandum and Articles of the Bank, the Bahrain Commercial Companies Law and the CBB Rulebook. There is no maximum age limit at which a Director must retire from the Board. Each Director’s membership shall terminate upon the expiry of his term, pursuant to the terms of his Letter of Appointment and/or the provisions of the law.
Induction and Training of DirectorsThe Bank has an induction programme in place which is designed for each new Director to ensure his contribution to the Board from the beginning of his term. The induction programme includes: i) an introductory pack containing, amongst other things, the Group Overview, Group Organisational Chart, Terms of Reference of the Board and Board Committees and key policies; ii) presentations on significant financial, strategic and risk issues; and iii) orientation meetings with key management as may be required. As a standing procedure, all continuing Directors are invited to attend orientation meetings.
Ongoing professional development for Directors was conducted during 2013.
Board EvaluationEvaluations of the performance of the Board and the performance of each Director, for 2013, were conducted. Applying a scoring methodology proposed by Ernst & Young, rating of “Good” was achieved for the performance of the Board and a rating of “Excellent” was achieved for the performance of each director, indicating that the views of the majority of the Directors are similar and that the Board is functioning as per its stated role and responsibilities.
Directors’ and Related Parties’ Interests No Director has entered into, either directly or indirectly, any material contract with the Bank or any of its subsidiaries, nor does any Director have any material conflict of interest with the Bank. The Directors are required to declare any conflict of interest or any potential conflict of interest that exists or that Directors become aware of, to the Chairman and Corporate Secretary as soon as they become aware of them. This disclosure must include all relevant material facts.
The Bank has a procedure for dealing with transactions involving Directors and related parties. Any such transaction will require the approval of the Board, excluding the conflicted Director(s).
Refer note 25 to the audited consolidated financial statements of the Group for the year ended 31 December 2013 for related party transactions disclosures.
The Terms of Reference of the Board require that all Directors, whether Non-Executive or Executive, should exercise independence in their decision-making and should abstain from any decisions involving any actual or potential conflicts of interest. Should any Director have any doubts with respect to conflicts of interest or potential conflict of interest, the Director should consult the Chairman prior to taking any action that might compromise the Bank.
CORPORATE GOVERNANCECONTINUED
29 Ahli United BankAnnual Report 2013
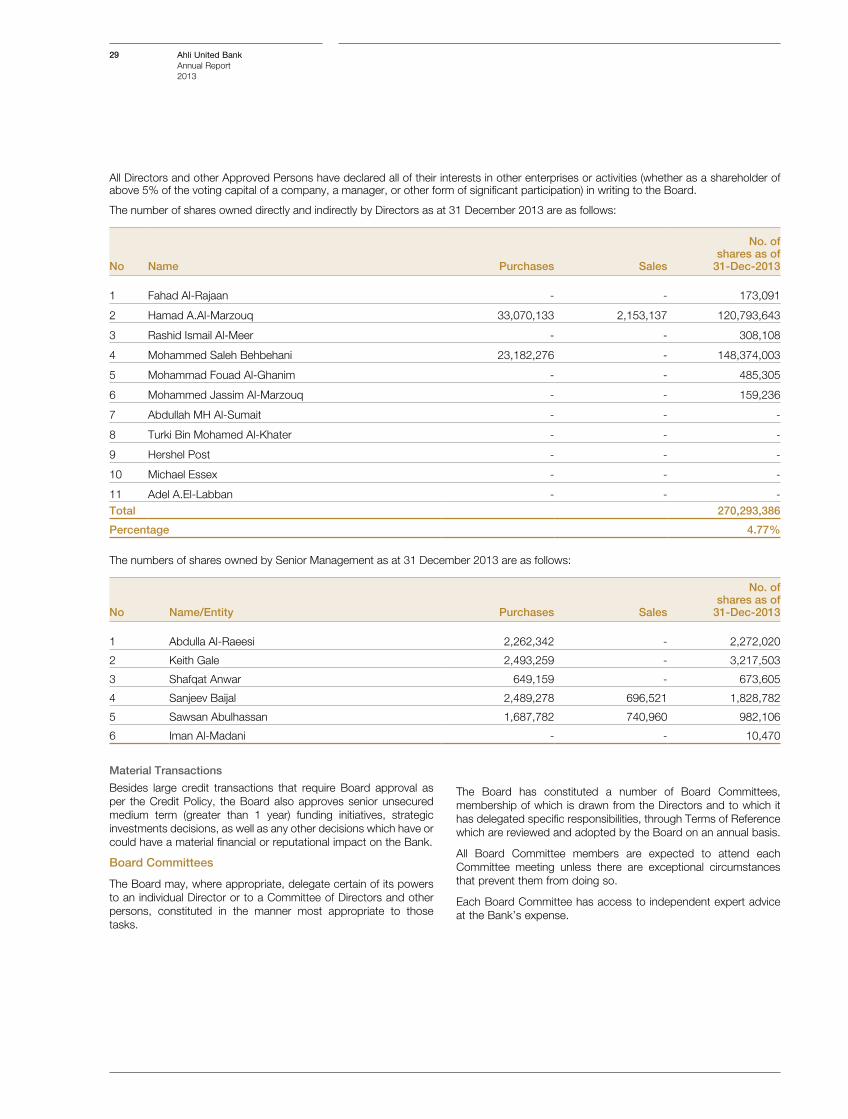
All Directors and other Approved Persons have declared all of their interests in other enterprises or activities (whether as a shareholder of above 5% of the voting capital of a company, a manager, or other form of significant participation) in writing to the Board.
The number of shares owned directly and indirectly by Directors as at 31 December 2013 are as follows:
No Name Purchases Sales
No. of shares as of
31-Dec-2013
1 Fahad Al-Rajaan - - 173,091
2 Hamad A.Al-Marzouq 33,070,133 2,153,137 120,793,643
3 Rashid Ismail Al-Meer - - 308,108
4 Mohammed Saleh Behbehani 23,182,276 - 148,374,003
5 Mohammad Fouad Al-Ghanim - - 485,305
6 Mohammed Jassim Al-Marzouq - - 159,236
7 Abdullah MH Al-Sumait - - -
8 Turki Bin Mohamed Al-Khater - - -
9 Hershel Post - - -
10 Michael Essex - - -
11 Adel A.El-Labban - - -Total 270,293,386
Percentage 4.77%
The numbers of shares owned by Senior Management as at 31 December 2013 are as follows:
No Name/Entity Purchases Sales
No. of shares as of
31-Dec-2013
1 Abdulla Al-Raeesi 2,262,342 - 2,272,020
2 Keith Gale 2,493,259 - 3,217,503
3 Shafqat Anwar 649,159 - 673,605
4 Sanjeev Baijal 2,489,278 696,521 1,828,782
5 Sawsan Abulhassan 1,687,782 740,960 982,106
6 Iman Al-Madani - - 10,470
Material Transactions
Besides large credit transactions that require Board approval as per the Credit Policy, the Board also approves senior unsecured medium term (greater than 1 year) funding initiatives, strategic investments decisions, as well as any other decisions which have or could have a material financial or reputational impact on the Bank.
Board Committees
The Board may, where appropriate, delegate certain of its powers to an individual Director or to a Committee of Directors and other persons, constituted in the manner most appropriate to those tasks.
The Board has constituted a number of Board Committees, membership of which is drawn from the Directors and to which it has delegated specific responsibilities, through Terms of Reference which are reviewed and adopted by the Board on an annual basis.
All Board Committee members are expected to attend each Committee meeting unless there are exceptional circumstances that prevent them from doing so.
Each Board Committee has access to independent expert advice at the Bank’s expense.
30 Ahli United BankAnnual Report 2013
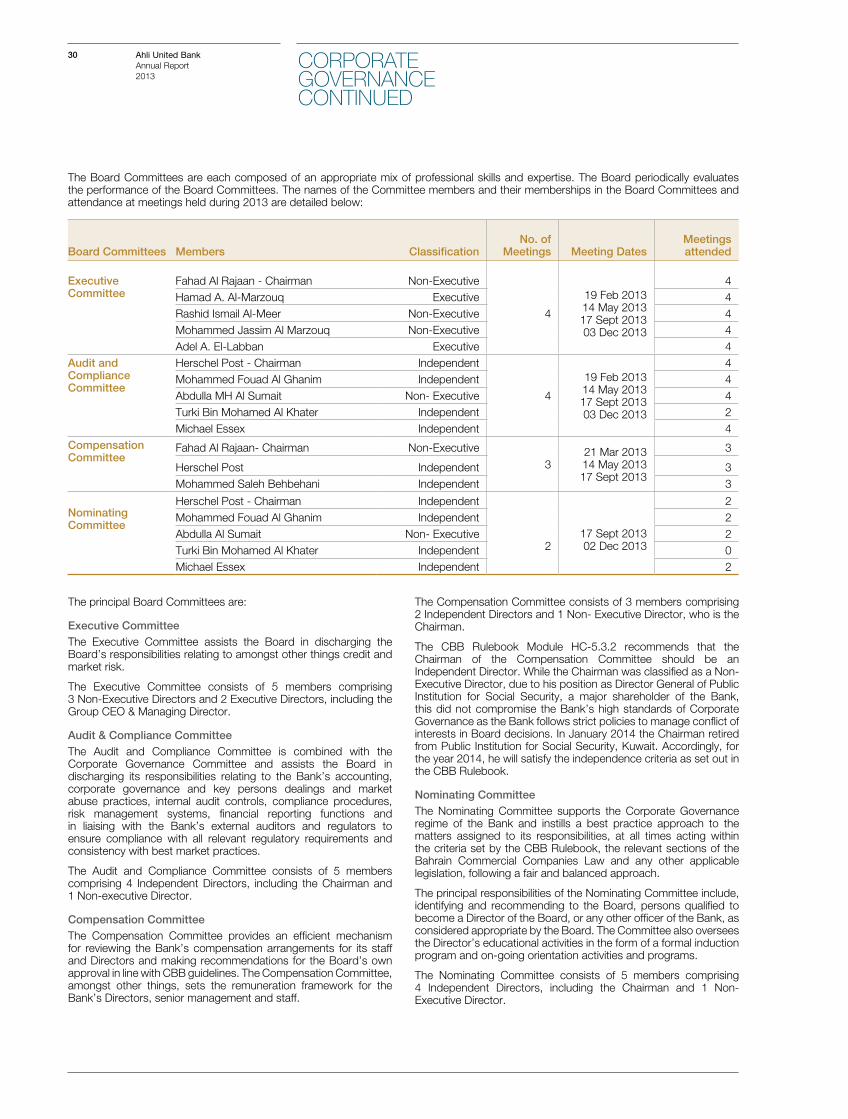
The Board Committees are each composed of an appropriate mix of professional skills and expertise. The Board periodically evaluates the performance of the Board Committees. The names of the Committee members and their memberships in the Board Committees and attendance at meetings held during 2013 are detailed below:
Board Committees Members ClassificationNo. of
Meetings Meeting DatesMeetings attended
Executive Committee
Fahad Al Rajaan - Chairman Non-Executive
4
19 Feb 2013 14 May 2013 17 Sept 2013 03 Dec 2013
4Hamad A. Al-Marzouq Executive 4Rashid Ismail Al-Meer Non-Executive 4Mohammed Jassim Al Marzouq Non-Executive 4Adel A. El-Labban Executive 4
Audit and Compliance Committee
Herschel Post - Chairman Independent
4
19 Feb 2013 14 May 2013 17 Sept 2013 03 Dec 2013
4Mohammed Fouad Al Ghanim Independent 4Abdulla MH Al Sumait Non- Executive 4Turki Bin Mohamed Al Khater Independent 2Michael Essex Independent 4
Compensation Committee
Fahad Al Rajaan- Chairman Non-Executive
321 Mar 201314 May 201317 Sept 2013
3
Herschel Post Independent 3Mohammed Saleh Behbehani Independent 3
Nominating Committee
Herschel Post - Chairman Independent
217 Sept 201302 Dec 2013
2Mohammed Fouad Al Ghanim Independent 2Abdulla Al Sumait Non- Executive 2Turki Bin Mohamed Al Khater Independent 0Michael Essex Independent 2
The principal Board Committees are:
Executive CommitteeThe Executive Committee assists the Board in discharging the Board’s responsibilities relating to amongst other things credit and market risk.
The Executive Committee consists of 5 members comprising 3 Non-Executive Directors and 2 Executive Directors, including the Group CEO & Managing Director.
Audit & Compliance CommitteeThe Audit and Compliance Committee is combined with the Corporate Governance Committee and assists the Board in discharging its responsibilities relating to the Bank’s accounting, corporate governance and key persons dealings and market abuse practices, internal audit controls, compliance procedures, risk management systems, financial reporting functions and in liaising with the Bank’s external auditors and regulators to ensure compliance with all relevant regulatory requirements and consistency with best market practices.
The Audit and Compliance Committee consists of 5 members comprising 4 Independent Directors, including the Chairman and 1 Non-executive Director.
Compensation CommitteeThe Compensation Committee provides an efficient mechanism for reviewing the Bank’s compensation arrangements for its staff and Directors and making recommendations for the Board’s own approval in line with CBB guidelines. The Compensation Committee, amongst other things, sets the remuneration framework for the Bank’s Directors, senior management and staff.
The Compensation Committee consists of 3 members comprising 2 Independent Directors and 1 Non- Executive Director, who is the Chairman.
The CBB Rulebook Module HC-5.3.2 recommends that the Chairman of the Compensation Committee should be an Independent Director. While the Chairman was classified as a Non-Executive Director, due to his position as Director General of Public Institution for Social Security, a major shareholder of the Bank, this did not compromise the Bank’s high standards of Corporate Governance as the Bank follows strict policies to manage conflict of interests in Board decisions. In January 2014 the Chairman retired from Public Institution for Social Security, Kuwait. Accordingly, for the year 2014, he will satisfy the independence criteria as set out in the CBB Rulebook.
Nominating CommitteeThe Nominating Committee supports the Corporate Governance regime of the Bank and instills a best practice approach to the matters assigned to its responsibilities, at all times acting within the criteria set by the CBB Rulebook, the relevant sections of the Bahrain Commercial Companies Law and any other applicable legislation, following a fair and balanced approach.
The principal responsibilities of the Nominating Committee include, identifying and recommending to the Board, persons qualified to become a Director of the Board, or any other officer of the Bank, as considered appropriate by the Board. The Committee also oversees the Director’s educational activities in the form of a formal induction program and on-going orientation activities and programs.
The Nominating Committee consists of 5 members comprising 4 Independent Directors, including the Chairman and 1 Non-Executive Director.
CORPORATE GOVERNANCECONTINUED
31 Ahli United BankAnnual Report 2013
Board Committee EvaluationEvaluations of the performance of the Board Committees have been conducted. Applying a scoring methodology proposed by Ernst & Young, a rating of “Excellent” was achieved for each, indicating that the Board Committees continue to operate with a high degree of effectiveness.
Senior Management
Names Title
Adel A. El-Labban Group CEO & Managing Director
Sanjeev Baijal Deputy Group CEO - Finance & Strategic Development
Keith Gale Deputy Group CEO - Risk, Legal & Compliance
Shafqat Anwar Deputy Group CEO - Operations & Technology
Abdulla Al-Raeesi Deputy Group CEO - Retail Banking
Sawsan Abulhassan Deputy Group CEO - Private Banking & Wealth Management
Amr Gadallah Deputy Group CEO - Treasury & Investments
Robert Jones Group Head of Audit
Iman Al-Madani Group Head – Human Resources & Development
James Forster CEO - Ahli United Bank (UK) P.L.C
Nevine El-Messeery CEO - Ahli United Bank (Egypt) S.A.E
Lloyd Maddock CEO - Ahli Bank S.A.O.G
Nouri Aldubaysi CEO - Commercial Bank of Iraq P.S.C
Ayman El-Gammal CEO - United Bank for Commerce & Investment S.A.C
Management Committees
The Board of Directors has established a management structure with clearly defined roles, responsibilities and reporting lines. The Bank’s management monitors the performance of the Bank and each of its subsidiaries and associates on an ongoing basis and reports this performance to the Board. The monitoring of performance is carried out through a regular assessment of performance trends against budget, and prior periods and peer Banks in each of the markets and collectively through AUB Group committees and sub committees at the parent bank and its subsidiary / affiliated banks’ level. Specific responsibilities as explained below, have been delegated to each committee, and the minutes of all management committees are sent to the Audit and Compliance Committee, that assesses the effectiveness of these committees.
Group Management Committee The Group Management Committee is the collective AUB Group management forum providing a formal framework for effective consultation and transparent decision-making by the Group CEO & Managing Director and senior management on cross-organisational matters. Appropriate checks and balances ensure the “four eyes” regulatory requirement is met. The Committee has broad mandate encompassing group wide as well as Bank and unit specific issues as determined by the Group CEO & Managing Director and other members of the Committee. It is chaired by the Group CEO & Managing Director and comprises of thirteen other members, including all Deputy Group CEO’s and CEO’s of subsidiary and affiliated banks.
Group Asset and Liability CommitteeThe Group Asset and Liability Committee sets, reviews and manages the liquidity, market risk and funding strategy of the AUB Group and reviews and allocates capacity on the balance sheet to achieve targeted return on capital, return on asset and liquidity ratios. It is chaired by the DGCEO-Treasury & Investment and has eight other members.
Group New Product Committee The Group New Product Committee reviews and approves new products, processes and services for wealth management, treasury, retail, commercial banking and other areas of the AUB Group. The committee assesses all related reputational, operational, credit, liquidity and market risk, IT, legal, compliance, control, staffing and capital/profit allocation issues related to approving new products. The approval by the Group New Product Committee follows the new product or process development requirements according to the New Product Approval and Development Procedure. It is chaired by DGCEO-Risk, Legal & Compliance and has nine other members.
Group Information Technology Steering CommitteeThe Group Information Technology Steering Committee oversees the information technology role, strategy formulation, prioritized implementation and delivery of IT projects of the AUB Group within an acceptable, secure and standardised framework. It recommends the annual IT budget to the Group CEO & Managing Director as part of the annual business planning/budgetary exercise for submission to the Board of Directors for review and final approval. It supervises the implementation of the approved IT annual plan within set deadlines and budgetary/Board approved allocations within the Bank’s overall capital expenditure policy. It is chaired by the DGCEO-Finance & Strategic Development and comprises of six other members.
Group Risk CommitteeThe Group Risk Committee reviews and manages the risk asset policies, approvals, exposures and recoveries related to credit, operational and compliance risks. It acts as a general forum for the discussions of any aspect of risk facing or which could potentially face the Bank or its subsidiaries and affiliates resulting in reputational or financial loss to the AUB Group. It also oversees the operation of the Group Operational Risk Sub-Committee and Group Special Assets Sub-Committee. It is chaired by the DGCEO-Risk, Legal & Compliance and has four other members.
32 Ahli United BankAnnual Report 2013
Group Operational Risk Sub-Committee Group Operational Risk Sub-Committee administers the management of operational risk throughout the AUB Group. It is chaired by the DGCEO-Operations & Technology and has eight other members.
Group Special Assets Sub-Committee The Group Special Assets Sub-Committee is responsible for the management of the criticized and non-performing assets of the Bank. It has responsibility for monitoring accounts downgraded to watch list and criticized asset status and ensuring that a focused and disciplined recovery strategy is adopted to maximize recoveries. It is chaired by DGCEO Risk, Legal & Compliance and has six other members.
Management CommitteeThe Management Committee is the senior collective management forum of the Bank, providing a formal framework for effective consultation and transparent decision-making on organisational matters. Appropriate checks and balances ensure the “four eyes” regulatory requirement is met. The committee operates in a flexible way with a minimum of formality and a broad mandate encompassing both Bank-wide and unit specific issues as determined by the GCEO & Managing Director and its other members in relation to the business of the Bank, as a legal entity. It is chaired by the GCEO & MD and has seven other members.
AUB Assets and Liability CommitteeAUB Assets and Liability Committee sets, reviews and manages the liquidity, market risk and funding strategy of AUB, the parent bank and reviews and allocates capacity on the balance sheet to achieve targeted return on capital, return on asset and liquidity ratios. It is chaired by the Group Head of Treasury and has eight other members.
Other Governance Measures
In addition to the Board and Management Committee structures, the Board of Directors has approved a number of AUB Group policies to ensure clarity and consistency in the operation of the AUB Group. These policies, which are communicated to staff, include Credit, Anti-money Laundering, Corporate Governance, Personal Account Dealing, Key Persons Dealings, Banking Integrity, Compliance, Legal and Human Resources policies.
Underpinning these policies is the Board approved Group Code of Business Conduct which prescribes standards of ethical business behavior and personal conduct for the Bank’s Directors, its senior management (officers) and its staff.
The Board of Directors of Ahli United Bank BSC annually reviews and adopts compensation and related policies and closely monitors the implementation of these policies and processes with respect to the Bank’s staff and Directors. The AUB Compensation Policy provides the remuneration framework for motivating employees and directors with financial motivation to deliver optimum Group performance. The policy aims at rewarding performance by individual contribution within a team oriented approach, remunerating individuals who achieve personal, divisional and Group results and providing a long term incentive to performing staff.
The Banking Integrity Policy, which includes detailed policy and procedures on whistle blowing is specifically designed to facilitate concerns raised with regard to misconduct occurring within, or associated with, the AUB Group.
The Board has also adopted a Group Communications Policy. This policy sets out the authority of AUB Group employees with respect to the communication of information to third parties in the course and scope of their employment. The Bank has an open policy on communication with its stakeholders, which includes:
(i) The disclosure of all relevant information to stakeholders on a timely basis in a timely manner; and
(ii) The provision of at least the last three years of financial data on the bank’s website.
Shareholders are invited by the AUB Chairman to attend the AGM. The AUB Chairman and other Directors attend the AGM and are available to answer any questions. The Bank is at all times mindful of its regulatory and statutory obligations regarding dissemination of information to its stakeholders.
The Bank provides information on all events that merit announcement, either on its website, www.ahliunited.com, Bahrain Bourse, and other forms of publications, such as press releases, the Bank’s annual report and quarterly financial statements, and the Corporate Governance Policy are all published on its website.
As a supporting governance measure, the Board also relies on the ongoing reviews performed by internal and external auditors on the AUB Group’s internal control functions. These reviews are conducted in order to identify any weaknesses, which then enable management to take remedial action.
CORPORATE GOVERNANCECONTINUED
33 Ahli United BankAnnual Report 2013
GROUP BUSINESS & RISK REVIEW
Corporate Banking
Despite challenging market conditions in a number of regional geographies, Corporate Banking was successful in performing to expectations in 2013, in terms of asset and liability growth and net profit, while the cost efficiency ratio remained best in class.
Judicious asset growth was undertaken in line with the introduction of Basel 3, which provides for enhanced capital requirements and lower leverage ratios. Accordingly, greater emphasis was placed upon generating increased fee income, specifically from off balance sheet and trade finance growth, whilst selective corporate loan bookings adhered to requisite parameters for return on capital. Also, higher cost liabilities were managed down which provided a positive impact on net interest margins.
Corporate Banking continued to be organised strategically around SMEs and specialized industry groups. The focus remained on the enhancement of relationships with local and regional corporates, plus government entities while, notable progress was achieved in selectively financing projects in the GCC. The unit was also successful in acquiring operating accounts and liability business from its corporate clients and maximising cross-border opportunities within AUB Group locations. Closer working relationships with the Treasury and Private Banking departments resulted in respective increases in foreign exchange revenues and residential mortgage income, mainly at Ahli United Bank plc, UK. The ongoing implementation of business to business integration and internet banking solutions continued across the AUB Group, leading to enhanced transaction volumes and low cost liability growth.
Going forward, the prospects for domestic growth in Kuwait, Oman and Bahrain appear positive. Potential opportunities for growth in the domestic markets of Egypt, Libya and Iraq will depend on local socio-political developments. Cross-border financing and trade finance remain core activities and will continue to support the expansion of corporate relationships throughout the region. Islamic banking will also continue to be a key growth area, with services successfully launched in Oman and Egypt during 2013.
Whilst net loan growth is expected to be moderate in 2014, profitability is forecast to continue on an upward trajectory, due to continued focus on cost control, lower impairment charges and increased fee based activities.
Retail Banking
AUB has established a robust retail presence spanning seven markets, supported by a commanding ATM and remote banking network. With the advantage of a strong regional network across GCC, Egypt, Iraq, Libya and UK, AUB is well positioned to provide its customers with a wealth of local knowledge, service and support across these markets.
During the year the Bank continued to grow the MyGlobal offering, actively encouraging customers including high net worth clients to establish relationships across AUB entities to facilitate their dual banking needs in both their country of residence and home country. MyGlobal customers are enabled to access the AUB network and services from any location and benefit from dedicated relationship managers with specialised local knowledge in their respective markets.
Growth in liabilities was further consolidated mainly due to strong demand for MyHassad Savings, AUB’s flagship product offered across participating entities. The scheme which supports the largest prize pool in the region witnessed significant growth during the year, providing a stable base of low cost funds to improve retail profitability as well as further enhancing household penetration and creating opportunities to cross sell. Focus was also assigned to targeting higher income segments where Retail Banking was further successful in introducing a number of innovative asset products and services.
Ongoing technology enhancements continued to position AUB at the forefront of product development and delivery, sustaining and strengthening the Bank’s competitive edge. A mobile banking application for IOS and Android smart phones was rolled out, enabling customers to access their accounts and conduct transactions using their Smart phones while providing the full range of banking services on an anywhere, anytime basis.
Significant enhancements were also made to the functionality of AUB’s online trading platform, ahli e.trade, which was the first ever online trading solution launched by a regional bank in the Middle East. Moreover, an advanced front-end branch banking system was finalised for implementation which will further enhance branch service capability, improve operational procedures and processes and reduce operational costs. In addition, the system’s customer relationship management capabilities will provide AUB front office staff with a 360 degree view of customer relationships, improve customer service and enhance cross selling opportunities. Strategy and planning capabilities will also benefit from the system’s capacity to provide customer profitability and campaign management functionality.
Focus on the development of AUB’s Islamic Banking offering continued to strengthen across its markets. A full range of Shari’a compliant banking products and services was introduced in Oman and distributed country-wide through seven dedicated Islamic branches. In Libya, the Bank’s first Islamic product was introduced with the launch of a Shari’a compliant auto finance product across the branch network and the Bank’s Islamic presence and product range continued to grow in Bahrain, Kuwait and the United Kingdom.
Point of Sale (POS) acquiring was further strengthened with the installation of state-of-the-art systems and terminals, supported by innovative features to meet customers’ changing needs. AUB’s dedicated sales and service team, a 24/7 help desk and systems that support real time fraud monitoring and control, enabled AUB to meet its objectives of providing enhanced merchant solutions in Bahrain.
In response to changing conditions in retail asset segments across GCC countries, AUB introduced a suite of new products and services linked to variable rate and flexi-repayment structures that provide retail borrowers with the most attractive and competitive product structures in the industry. In addition, the Bank partnered with the Social Housing Project, an initiative of Bahrain’s Ministry of Housing, in providing mortgage finance linked to subsidies to support future growth in the mortgage book.
Moving forward, AUB will continue to focus on generating fee income by distribution of Bancassurance life products through the joint venture with the UK based Legal & General Group, and with the introduction of online remittances and co-branded cards.
34 Ahli United BankAnnual Report 2013
GROUP BUSINESS & RISK REVIEWCONTINUED
Treasury
2013 presented yet another year of unprecedented challenges, with Central Banks policies continuing to focus on providing liquidity and maintaining interest rates at historically low levels. During the latter part of the year, market focus shifted away from the problems that had pressured banks into restructuring their balance sheets to concentrate more on developments in global markets. Monetary policy in the US was again in focus as concerns over potential withdrawal of liquidity, triggered by the expected tapering of the stimulus programme by the US Federal Reserve Bank, continued to weigh on emerging markets stocks and currencies.
The strategy for Treasury continued to prioritize broadening AUB’s liability base and further reducing the dependence on wholesale funding. Proactive and cost effective management of the liability base enabled the Group to maintain high liquidity levels throughout the year, meeting all of its financial obligations while continuing to remain a net provider of funds to the wholesale market.
Market volumes stabilized during 2013 mainly due to the global economic upturn. AUB’s market share remained secure with the Bank continuing to offer clients very competitive pricing in an exceptionally difficult trading environment. In further expanding Treasury services; the online trading unit became fully functional under the Treasury umbrella, enabling AUB to offer its customer base full access to both regional and international equity markets. In a testament to its ongoing commitment to high standards and exceptional customer support, AUB Bahrain was named as ‘Best Foreign Exchange Provider – Middle East’ and ‘Best Bank –Bahrain’ for the seventh consecutive year by Global Finance.
Following significant challenges in the global markets over the past five years, 2014 is expected to see continued global growth, albeit at nominal levels. Further market adjustments are expected due to an increase in volatility from the continuing effects of the European debt crisis and potential fallout from the recent emerging markets crisis. Central banks are also forecast to provide forward guidance on monetary policy based on measures required to smooth the transition to a less accommodative stance.
In anticipation of a broader economic recovery in 2014, the Bank will adopt a more dynamic approach to further strengthen our client focus and expand our range of product offerings for both risk and asset management. Treasury will strengthen focus on sourcing new products in order to enhance customers’ returns on deposits and reduce risk on their loan portfolios. The Group’s extensive regional presence will continue to be leveraged in enabling Treasury to provide a one-stop shop for portfolio management.
Private Banking & Wealth Management
2013 was another challenging year for Private Banking & Wealth Management with adverse market conditions impacting investor confidence and appetite, presenting a difficult business environment.
Economic and political uncertainties prevailed across the region and globally. In the US, the Federal Reserve Bank moved to taper the quantitative easing programme and while equity markets generally witnessed an upturn, bond yields remained tight. In line with the obligations of implementing the Retail Distribution Review in the UK, enhanced regulatory requirements were applied to investment products offered through AUB (UK).
Against this backdrop the Division focused on offering superior portfolios to clients tailored to match their risk profiling while enhancing the product platforms for both conventional and Shari’a compliant investment.
The Division was successful in achieving its objectives with the enhancement of the total relationship approach to the clientele base; in increasing the level of assets under management sales across the
different investment portfolios; in capitalising on investors’ appetite for direct property investment with continued financing of residential and commercial developments in the UK market offered through AUB (UK) and by increasing the number of new client acquisitions. Further requirements in regulatory obligations also supported and strengthened AUB’s prudent approach in delivering the right offering to the client base.
During the year, a number of products were successfully launched in order to meet clients’ differing requirements. Notable among them was the UK Commercial Property Income Fund, a closed end Guernsey based fund with the objective of assembling a portfolio of commercial properties in the UK providing a stable income return. From the outset, during its investment period, the fund was noteworthy in being able to distribute quarterly dividends. Additional conventional and Shari’a compliant equity and fixed income funds were also introduced as well as further bond and sukuk offerings.
As a result, in the markets in which we operate, AUB Private Banking succeeded in broadening the client base by acquiring more private banking clients across the Group and by meeting their onshore and offshore needs. The excellence of AUB Private Banking services was recognised and commended by several leading financial publications; notably Euromoney for the Best Private Bank in Bahrain for 2012 and by FTSE Global Markets for recognition as the region’s leading bank for asset management, as revealed in its inaugural MENA Asset Managers Survey 2013.
Going forward, despite economic and political volatility set to continue at both regional and international levels, Private Banking remains confident in meeting its objectives and growing the business with a focused approach and by continuing to provide innovative investment offerings.
For 2014, strategy will again focus on growing the client base with new acquisitions as well as enhancing offering to the existing clientele and increasing cross border activities. The introduction of new, creative products is targeted to attract a wider range of clients, elevating the investment proposition, while the systems platform will be further upgraded to facilitate direct access by clients to their portfolios and, internally, enable the Division to deliver better relationship management.
Information Technology
The Information Technology division is closely aligned to the Group’s business strategies by delivering customer focused, innovative and secured solutions. Customers’ banking needs are fulfilled through targeted application systems on an operationally robust and efficient technology platform.
During 2013, IT strategy continued to focus on standardization of services applied uniformly across the Group, wherever possible, to achieve the benefits associated with economies of scale while providing a common customer experience irrespective of location within the AUB banking network.
Our uncompromising commitment to improving customer services across the region was further underlined with significant progress in delivering electronic banking solutions. The successful launch of a ‘Mobile Banking App’ for retail customers, covering both Android and iPhone platforms, provided customers with an enriched user experience for conducting banking business ‘on the move’ with the assurance of a robust security framework. Retail internet banking services were also expanded to facilitate bill payments with a corresponding collection facility for utility companies.
The rollout of the B2B platform to corporate, SME and non-profit organisations across a variety of industry sectors facilitated a more efficient transaction execution service for those clients, together with improved cash management capabilities. Significant progress was also achieved in the straight-through processing of SWIFT
35 Ahli United BankAnnual Report 2013
messaging for clients’ vendor and salary payments, improving operational efficiency for the customer and the Bank. In addition, the suite of electronic banking products available to the customer base was further expanded with an internet portal enabling electronic initiation and tracking of trade finance business for our clients.
In recognising the value and importance of access to management information, AUB Group continued to invest in the enterprise-wide data warehousing solution as the single integrated source of consolidated data, supporting significant enhancements to the financial performance and credit risk modules. In the latter half of 2013, a new Asset-Liability Management system in Bahrain and UK was implemented with the phased introduction of a new funds transfer pricing methodology and advanced liquidity risk management capability, in preparation for adopting best practices in liquidity management as defined by the Basel III framework.
A major strategic focus for the year was placed on the consolidation, cost efficiency and integration of complementary processes, through an improved network infrastructure and server virtualisation program. Significant rationalisation was achieved on our intra-group communications network with specific emphasis on network security to pro-actively detect and realign defences against complex external threats. As more and more business applications are integrated into the IT infrastructure, significant priority was placed on improving load balancing to ensure minimum redundancy across the server infrastructure.
Information security remains an integral part of the IT undertaking across the Group. Constant and unequivocal attention to all aspects of information security remains of highest priority in order to assure customers of the continued security and confidentiality of their financial transactions. To this end, continued compliance with industry best practices and certification through Information Security Standards (ISO 27001 & PCI DSS) was rigorously maintained in Bahrain and Kuwait and a new accreditation achieved for Ahlibank S.A.O.G. New preventive and detective controls were introduced across all critical business channels, while information leakage prevention and monitoring controls were enhanced across the spectrum of customer end-point usage, network traffic and data storage.
During the year a number of IT initiatives contributed to the Bank’s green credentials. These included the introduction of B2B for corporate clients which provided a seamless straight through processing capability for banking transactions, eliminating redundant administrative paper-work. All customers, retail and corporate, are now actively encouraged to enable electronic statement generation, further reducing paper consumption. Migrating physical servers to virtual machines and consolidating the server requirement has resulted in lowering energy consumption and cooling needs thereby reducing the carbon footprint for the data centre.
Moving forward, a major initiative was launched in developing a front end system to assist customer facing staff in servicing and managing customer relationships in a more dynamic manner. The new system is scheduled for implementation across Group entities during the next two years.
Human Resources
At year end 2013, the AUB Group comprised over 3,300 employees in permanent positions, an increase of 8 per cent over the previous year, of which one third was female and the balance male. Together, the total staff represented 38 different nationalities, providing AUB services across the 7 countries in which the Group operates.
AUB is committed to the development and well-being of its employees with a focus on recruiting and retaining staff that possess superior competencies and skills required to implement the Bank’s strategy. Creating and maintaining an attractive and professionally stimulating work environment remained a key priority for the HR function.
In line with the recognition of AUB talent as drivers for sustained and competitive advantage, HR conducted specific leadership development and coaching programs in 5 countries covering 140 Managers. Career and management development continued to be enhanced with targeted retention interventions in addition to rewards and remuneration incentives and identifying clear succession planning opportunities to enhance competitiveness.
The internal Credit Academy concept program launched in 2012 in Egypt, in collaboration with leading international executive educators, has been an unrivaled success. The current program which is conducted over a 9 month period includes 700 hours of international courses, 160 hours of in-house training, 240 hours of real case studies and 480 hours of on the job rotation representing 10 per cent of the total professional training days within the Group. In 2013, the average of training days per staff member increased to 0.75 days, compared to 0.50 days the previous year.
The Bank’s corporate governance was strengthened further through HR processes that included oversight mechanisms and people management policies which were reviewed and aligned to guidelines set by regulators in all operating markets. Having developed a single repository for all employee information, the HR team has established a platform for Group-wide HR initiatives to reduce data integrity issues, improve workflow and provide better reporting. In addition, by accommodating all geographic requirements and removing duplicate systems, resources can be reallocated to support and strengthen Group infrastructure.
In line with fulfilling the Group’s corporate social responsibilities, AUB sustained its commitment to the development of social and economic environments. Significant contributions were made during the year to accredited societies, charities and NGOs and to local communities through youth scholarships, development projects and charitable donations. Notable was AUB’s continued role as a major donor to the Social Work Fund, managed and operated by Bahrain’s Ministry of Social Development. The Fund serves as the main conduit for channeling much needed financial support to numerous deserving NGOs with a strong record in supporting diverse sectors of Bahraini society including women, youth, charities, professional and community health organizations.
In 2013, the Human Resources function was successful in activating initiatives that increased the Group’s deployment of information technology systems including the provision of Human Resources IT systems to AUB employees. The Human Resource transformation process will continue with proactive measures initiated to change the methodology and content of various HR systems.
AUB’s Green Office credentials were further enhanced during the year with HR offering e-salary services as an alternative to the traditional paper pay slip across Group entities in a continuing drive to reduce our carbon footprint.
Moving forward, the strategic focus for the HR function will continue to help build and support a meritocratic culture that values professionalism and best practices by combining talent management business processes, infrastructure and technology.
Alignment to major regulatory changes, higher customer expectations and a changing customer structure that includes a growing number of youth and women as well as a tight labour market will be key factors in shaping HR response to 2014 and beyond. The need for the right skills to innovate and design new products and to manage operations effectively will be critical to success. Future policy requirements on mandatory local hiring coupled with a transient expatriate population present unique challenges, making AUB’s talent management strategy critical to increasing shareholder value.
36 Ahli United BankAnnual Report 2013
GROUP BUSINESS & RISK REVIEWCONTINUED
Risk Management
Risk management involves the identification, analysis, evaluation, acceptance and management of all financial and non-financial risks that could have a negative impact on the Group’s performance and reputation. The Risk management function provides an oversight and advice on the Board sanctioned risk appetite and strategy, development and maintenance of a supportive system for management of risks through procedures and training.
The major risks associated with AUB’s business are credit risk, market risk which includes foreign exchange, interest rate and equity price risk, liquidity risk, operational risk and reputational risk.
AUB’s risk management policies have been developed to:
• identify and analyse these risks,• set appropriate risk limits and controls,• monitor the risks and adherence to limits.
While risks that are embedded in the banking business cannot be completely eliminated, the risk management function aims to effectively manage these risks with the objective of earning competitive returns over the degree of assumed risk. Risk is evaluated based on the potential impact on income and asset value, taking into consideration changes in political, economic and market conditions, and the creditworthiness of the Bank’s clients.
The risk management function relies on the competence, experience and dedication of its professional staff, sound risk management policies and procedures, and ongoing investment in technology and training.
The Board of Directors and senior management are involved in the establishment of all risk policies and processes and the periodic oversight and guidance of the risk management function. The Board of Directors reviews and approves at least annually the Bank’s key Risk Management policies. The Risk Management processes are subject to additional scrutiny by independent internal and external auditors, and the Bank’s regulators which help further strengthen the risk management practices.
The risk management and control process is based on detailed policies and procedures that encompass:
• business line accountability for all risks taken. Each business line is responsible for developing a plan that includes adequate risk/return parameters, as well as risk acceptance criteria;
• a credit function that understands, monitors and independently controls each credit relationship ensuring that the appropriate approvals are obtained and a uniform risk management standard including objective risk ratings have been correctly assigned to each and every credit relationship;
• product and business policies, which are clearly understood, monitored and are in agreement with the overall credit policy and the Board approved risk framework;
• the ongoing assessment of portfolio credit risk and approval of new products; and
• an integrated limits structure that permits management to control exposures and monitor the assumption of risk against predetermined approved tolerances. The Board of Directors establishes global limits for each major type of risk which are sub allocated to individual business units.
Credit Risk
Credit risk is the risk of financial loss due to the failure of a counter party to perform according to agreed terms. It arises principally from lending, trade finance and treasury activities. The credit process is consistent for all forms of credit risk to a single obligor. Overall exposure is evaluated on an ongoing basis to ensure a broad diversification of credit risk. Potential concentrations by country, product, industry, and risk grade are regularly reviewed to avoid excessive exposure and ensure a broad diversification.
Credit risk within the Group is actively managed by a rigorous process from initiation to approval to disbursement. All day-to-day management is in accordance with well-defined credit policies and procedures (CP&P) that detail all credit approval requirements and are designed to identify at an early stage exposures which require more detailed review and closer monitoring. Specific impairment provisions are made against credit exposures where whole or a portion of the credit is considered doubtful of recovery. If an asset is considered unrecoverable, a mandatory write-off takes place. This is conducted by a risk management process, which is completely independent in reporting terms from the asset generating departments.
Risk rating of individual counterparties plays an important role in the approval and maintenance of credit limits. The risk rating process ensures that the quality of the credit portfolio of the Bank is maintained at the highest possible level and stays within board approved risk limits. The CP&P includes a robust risk rating system developed by a leading international rating agency, which provides a credit rating for each individual credit based on an extensive set of financial and non-financial parameters. This risk rating system is essential for the Bank to progress towards Basel II’s more advanced requirements.
The risk management function stratifies the credit portfolio by level of risk to monitor the credit quality and to be able to assess the pricing and aid in the prompt identification of problem exposures. Management of material problem exposures is vested with Special Assets Groups in the respective Group operating entities, all of which report to the Group Risk Management area. All exposures are subject to quarterly and in certain cases monthly reviews.
In addition to the Group Risk Management function, credit risk is overseen by the Group Risk Committee (GRC) which is vested with the overall day-to-day responsibility for all matters relating to group credit risk. Its responsibilities include the following:
• formulating and implementation of credit policies and monitoring compliance,
• acts as a credit approval body for credits within its delegated authority,
• recommends to the Executive Committee all policy issue changes related to credit risk as well as credits falling outside its discretion,
• determines appropriate pricing and security guidelines for all risk asset products,
• reviews the ongoing risk profile of the Group as a whole and by individual products, business sectors and countries,
• ensures the adequacy of specific and collective impairment provisions and makes appropriate recommendations to the Executive Committee.
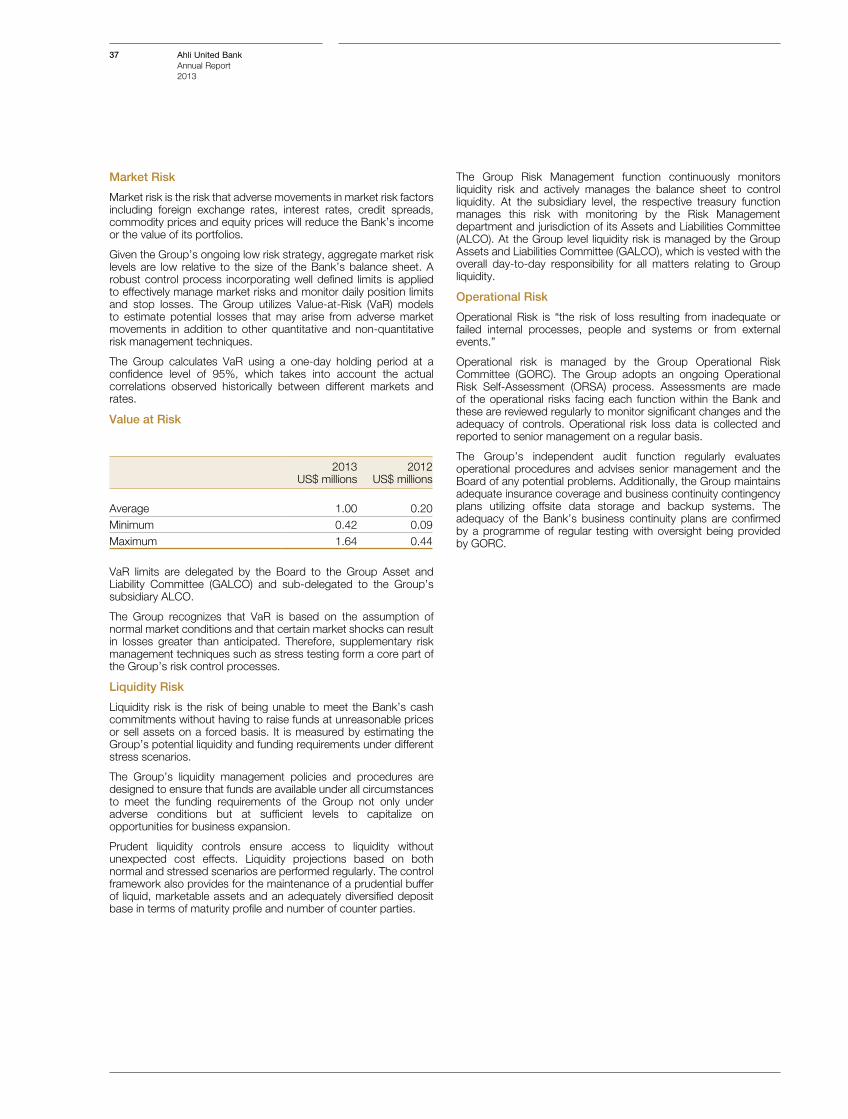
37 Ahli United BankAnnual Report 2013
Market Risk
Market risk is the risk that adverse movements in market risk factors including foreign exchange rates, interest rates, credit spreads, commodity prices and equity prices will reduce the Bank’s income or the value of its portfolios.
Given the Group’s ongoing low risk strategy, aggregate market risk levels are low relative to the size of the Bank’s balance sheet. A robust control process incorporating well defined limits is applied to effectively manage market risks and monitor daily position limits and stop losses. The Group utilizes Value-at-Risk (VaR) models to estimate potential losses that may arise from adverse market movements in addition to other quantitative and non-quantitative risk management techniques.
The Group calculates VaR using a one-day holding period at a confidence level of 95%, which takes into account the actual correlations observed historically between different markets and rates.
Value at Risk
2013US$ millions
2012US$ millions
Average 1.00 0.20Minimum 0.42 0.09Maximum 1.64 0.44
VaR limits are delegated by the Board to the Group Asset and Liability Committee (GALCO) and sub-delegated to the Group’s subsidiary ALCO.
The Group recognizes that VaR is based on the assumption of normal market conditions and that certain market shocks can result in losses greater than anticipated. Therefore, supplementary risk management techniques such as stress testing form a core part of the Group’s risk control processes.
Liquidity Risk
Liquidity risk is the risk of being unable to meet the Bank’s cash commitments without having to raise funds at unreasonable prices or sell assets on a forced basis. It is measured by estimating the Group’s potential liquidity and funding requirements under different stress scenarios.
The Group’s liquidity management policies and procedures are designed to ensure that funds are available under all circumstances to meet the funding requirements of the Group not only under adverse conditions but at sufficient levels to capitalize on opportunities for business expansion.
Prudent liquidity controls ensure access to liquidity without unexpected cost effects. Liquidity projections based on both normal and stressed scenarios are performed regularly. The control framework also provides for the maintenance of a prudential buffer of liquid, marketable assets and an adequately diversified deposit base in terms of maturity profile and number of counter parties.
The Group Risk Management function continuously monitors liquidity risk and actively manages the balance sheet to control liquidity. At the subsidiary level, the respective treasury function manages this risk with monitoring by the Risk Management department and jurisdiction of its Assets and Liabilities Committee (ALCO). At the Group level liquidity risk is managed by the Group Assets and Liabilities Committee (GALCO), which is vested with the overall day-to-day responsibility for all matters relating to Group liquidity.
Operational Risk
Operational Risk is “the risk of loss resulting from inadequate or failed internal processes, people and systems or from external events.”
Operational risk is managed by the Group Operational Risk Committee (GORC). The Group adopts an ongoing Operational Risk Self-Assessment (ORSA) process. Assessments are made of the operational risks facing each function within the Bank and these are reviewed regularly to monitor significant changes and the adequacy of controls. Operational risk loss data is collected and reported to senior management on a regular basis.
The Group’s independent audit function regularly evaluates operational procedures and advises senior management and the Board of any potential problems. Additionally, the Group maintains adequate insurance coverage and business continuity contingency plans utilizing offsite data storage and backup systems. The adequacy of the Bank’s business continuity plans are confirmed by a programme of regular testing with oversight being provided by GORC.
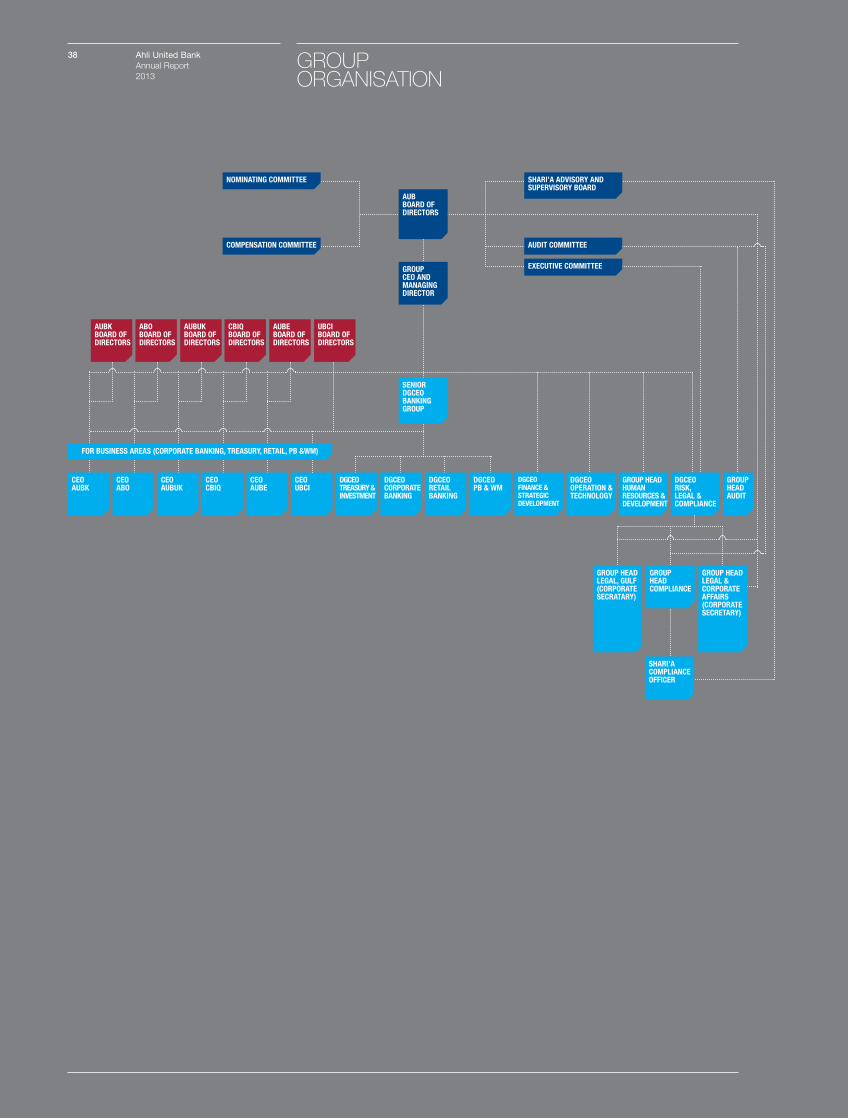
GROUP ORGANISATION
ABO BOARD OF DIRECTORS
CEO ABO
AUBK BOARD OF DIRECTORS
CEO AUBK
AUBUK BOARD OF DIRECTORS
CEO AUBUK
DGCEO TREASURY & INVESTMENT
CBIQ BOARD OF DIRECTORS
CEOCBIQ
DGCEO CORPORATE BANKING
AUBE BOARD OF DIRECTORS
CEO AUBE
DGCEO RETAIL BANKING
UBCI BOARD OF DIRECTORS
CEO UBCI
DGCEO PB & WM
GROUP CEO AND MANAGING DIRECTOR
AUB BOARD OF DIRECTORS
SHARI’A ADVISORY AND SUPERVISORY BOARD
AUDIT COMMITTEE
EXECUTIVE COMMITTEE
NOMINATING COMMITTEE
GROUP HEAD LEGAL, GULF (CORPORATE SECRATARY)
GROUP HEAD COMPLIANCE
SHARI’A COMPLIANCE OFFICER
GROUP HEAD LEGAL & CORPORATE AFFAIRS (CORPORATE SECRETARY)
DGCEO FINANCE & STRATEGICDEVELOPMENT
DGCEO OPERATION & TECHNOLOGY
GROUP HEAD HUMAN RESOURCES & DEVELOPMENT
DGCEO RISK, LEGAL & COMPLIANCE
GROUP HEAD AUDIT
COMPENSATION COMMITTEE
SENIOR DGCEO BANKING GROUP
FOR BUSINESS AREAS (CORPORATE BANKING, TREASURY, RETAIL, PB &WM)
38 Ahli United BankAnnual Report 2013
39 Ahli United BankAnnual Report 2013
Adel A. El-LabbanGroup Chief Executive Officer and Managing Director
Director since 30 July 2000. Holds a Masters in Economics (Highest Honors) from the American University, Cairo, 1980, Bachelors in Economics (Highest Honors) from American University, Cairo, 1977 and a General Certificate of Education from London University, 1973. Director, Ahli United Bank (UK) PLC; Director, Ahli United Bank K.S.C.P. Kuwait; Director, Ahli United Bank (Egypt) SAE, Egypt; Director, Ahli Bank SAOG, Oman; Director, Commercial Bank of Iraq PSC, ; Deputy Chairman, United Bank for Commerce & Investment S.A.C. Libya; Director, Bahrain Association of Banks, Bahrain; Former Chief Executive Officer and Director of the United Bank of Kuwait PLC, UK; Former Managing Director, Commercial International Bank of Egypt; Former Chairman, Commercial International Investment Company, Egypt; Former Vice President, Corporate Finance, Morgan Stanley, USA; Former Assistant Vice President, Arab Banking Corporation, Bahrain.
(Total years of experience: 35 years)
Sanjeev BaijalDeputy Group Chief Executive Officer - Finance and Strategic Development
Deputy Chairman Legal and General Gulf B.S.C.(c) & Legal and General Gulf Takaful B.S.C.(c), Bahrain; Director, Ahli United Bank K.S.C.P., Kuwait; Director, Ahli Bank S.A.O.G., Oman; Previous experience as Group Head of Finance, Ahli United Bank B.S.C., Bahrain; Financial Controller, Al-Ahli Commercial Bank, Bahrain; Held various positions at Ernst & Young, Bahrain and Price Waterhouse in India; Chartered Global Management Accountant under Association of International Certified Professional Accountants; Member of the American Institute of Certified Public Accountants (AICPA), and Associate Member of the Institute of Chartered Accountants of India (ACA).
(Total years of experience: 30 years)
Keith GaleDeputy Group Chief Executive Officer - Risk, Legal and Compliance
Director, Ahli United Bank K.S.C.P. Kuwait; Director, Ahli Bank S.A.O.G., Oman; Previously Group Head of Risk Management, Ahli United Bank, Bahrain; Former Head of Credit and Risk at ABC International Bank PLC; Former Assistant Vice President, Internal Audit Department, Arab Banking Corporation, Bahrain. Held various positions in the UK with KPMG and Ernst & Young. Associate Member of the Institute of Chartered Accountants England & Wales (ACA) and holds a BA (Hons) in Accounting and Finance from the University of Lancaster, UK.
(Total years of experience: 33 years)
Shafqat AnwarDeputy Group Chief Executive Officer - Operations and Technology
Director, Ahli Bank S.A.O.G., Oman; Former Director, Ahli United Finance Company, Egypt; Former Director, Ahli United Bank (Egypt) S.A.E.; Former Deputy Chief Executive Officer, Finance, Risk and Operations, Ahli United Bank (Egypt) S.A.E.; Former Group Head of Operations, Ahli United Bank B.S.C., Bahrain; Former Chief Operating Officer, Commercial Bank of Bahrain, Bahrain; Former Chief Operating Officer, Grindlays Bahrain Bank, Bahrain; Former Operations Manager Gulf, ANZ Grindlays Bank, UAE. Held various management positions with ANZ Banking Group in Bangladesh, the UK, the UAE and Australia. Holds a Master of Business Administration, a Master of Public Administration and a Bachelor of Social Sciences (BSS) with Honours in Public Administration from the University of Dhaka, Bangladesh.
(Total years of experience: 30 years)
Abdulla Al-RaeesiDeputy Group Chief Executive Officer - Retail Banking
Deputy Chairman, Ahli United Finance Company, Egypt (since May 2012); Director, Legal and General Gulf B.S.C.(c) & Legal & General Takaful B.S.C.(c), Bahrain since March 2009; Former Director, International Chamber of Commerce, Bahrain; Former Director, Benefit Company, Bahrain; Deputy Chief Executive Officer Retail Banking, Ahli United Bank B.S.C., Bahrain; AGM & Head of Delivery Channels, Commercial Bank of Qatar, Qatar; AGM, Support Group, Doha Bank, Qatar; Head of Business & Technology Consulting Group, Arthur Andersen. Holds an MBA in Business Administration from the United Kingdom.
(Total years of experience: 33 years)
Sawsan AbulhassanDeputy Group Chief Executive Officer - Private Banking and Wealth Management
Director, Ahli United Bank PLC, UK; Director, AUB Nominees Ltd.; Director, Securities & Investment Company (SICO), Bahrain; Director, The Family Bank, Bahrain; Previously with Citibank N.A. Bahrain, Resident Vice President, Wealth Management and Distribution; and Head of Wealth Management, Standard Chartered Bank, Bahrain. Holds an MBA in Finance (with distinction) and a B.Sc. in Management from the University of Bahrain.
(Total years of experience: 22 years)
Amr GadallahDeputy Group Chief Executive Officer – Treasury and Investments
Former Senior Vice President and Group Treasurer Arab Banking Corporation Bahrain , Former Director ABC Islamic Bank , ABC Investments Jordan , ABC Securities Bahrain and ABC Securities Egypt . Holds BA ( Honors ) and MA in Economics from American University in Cairo
(Total Years of Experience : 30 years )
GROUP MANAGEMENT
40 Ahli United BankAnnual Report 2013
Robert JonesGroup Head - Audit.
Former Deputy Chief Executive Officer, Finance, Risk, Operations and Technology at Ahli United Bank (UK) PLC, Former Head of Audit for AUB Bahrain, Former Audit Manager in the National Commercial Bank (Saudi Arabia). Has qualified the Information Systems Audit and Control Association (CISA) and the Institute of Chartered Secretaries & Administrators (ACIS) examinations.
(Total years of experience: 35 years)
Iman Al-MadaniGroup Head – Human Resources & Development.
Former Group Head of Human Resources & Head of Human Resources, Bank of Kuwait & Middle East (BKME). Former Assistant General Manager Human Resources, Burgan Bank, Kuwait. Holds a Bachelor of Science in Mathematics from the University of Denver, USA and an Associate Degree in Computer Science, Lane Collage, Oregon State, USA.
(Total years of experience: 30 years)
James ForsterChief Executive Officer at Ahli United Bank, UK.
Director, Ahli United Bank (UK) PLC. Former Deputy Chief Executive Officer, Corporate Banking & Treasury, Ahli United Bank (UK) PLC, Former Head of Structured Finance, Ahli United Bank (UK) PLC, Former Group Head of Leveraged Finance (Execution), The Fuji Bank Limited, UK. Completed education from Haileybury College, Hertfordshire, UK and Foundation Course in Chartered Accountancy from City of London Polytechnic.
(Total years of experience: 34 years)
Nevine El MesseeryChief Executive Officer at Ahli United Bank, Egypt.
Director, Ahli United Bank (Egypt) S.A.E. Former General Manager, Corporate Banking at Commercial International Bank (CIB), Egypt, Former Chairman of the Credit Committee, Former Chair of the Concession Tariff Committee, Former Member of the ALCO Committee, Former Member of the CIB Life Insurance Company Management Committee. Has held several roles as Chair of the Board of Directors in several investment companies and subsidiaries of CIB. Former General Manager, Egyptian American Bank (Credit Agricole). Holds a Graduate Degree, Faculty of Commerce from Cairo University, Egypt.
(Total years of experience: 33 years)
Nouri AldubaysiChief Executive Officer at Commercial Bank of Iraq.
Director, Commercial Bank of Iraq P.S.C., Iraq. Former Deputy General Manager, Rasheedi Bank, Iraq. Held senior management positions with Rafidain Bank and Al Rasheed Bank in Iraq. Holds a degree in Accounting from International Institute of Accountancy in Lebanon
(Total years of experience: 50 years)
Lloyd MaddockChief Executive Officer at Ahli Bank S.A.O.G, Oman.
Former Deputy Group Chief Executive Officer, Corporate Banking, Former Chief Executive Officer, HSBC Pakistan, Former Chief Executive Officer, HSBC Kuwait, Former Head of Wholsesale Credit & Risk, MENA region, HSBC apart from working in various senior management roles with HSBC covering Corporate Banking, Strategy & Risk Management. Holds a Bachelor in Engineering (Honours) Civil & Mining Engineering 1990 from the University of Exeter, UK.
(Total years of experience: 23 years)
Ayman El GammalChief Executive Officer at United Bank for Commerce & Investment, Libya.
Director, United Bank for Commerce & Investment S.A.C., Libya. Former Assistant Managing Director and Head of Investments, National Investment Bank, Egypt, Former Managing Director, Asset Management - Private Equity, NAEEM Holdings, Egypt, Former Managing Director, EFG Hermes Private Equity, Egypt, Former Executive Director, Commercial International Investment Company, Former Assistant General Manager, Commercial International Bank (CIB), Egypt. Holds a BA in Business from Cairo University, Egypt.
(Total years of experience: 30 years)
GROUP MANAGEMENTCONTINUED

41 Ahli United BankAnnual Report 2013
42 Ahli United BankAnnual Report 2013
AHLI UNITED BANK B.S.C.
Bldg. 2495, Road 2832Al Seef District 428P.O. Box 2424, ManamaKingdom of Bahrain
Telephone : +973 17 585 858Facsimile : +973 17 580 569
Email: [email protected]
AHLI UNITED BANK (UK) PLC
35 Portman Square, London W1H 6LRUnited Kingdom
Telephone : +44 20 7487 6500Facsimile : +44 20 7487 6808
Email: [email protected]
AHLI UNITED BANK K.S.C.P.
P.O. Box 71 Safat , 12168, Kuwait
Telephone : +965 1802000Facsimile : +965 22461430
Email: [email protected]
COMMERCIAL BANK OF IRAQ P.S.C.
Al Sadoon Street, Baghdad, Iraq
Telephone : +964 17 405 583Telephone : +973 17 566 468/9Facsimile : +964 17 184 312
AHLI UNITED BANK (EGYPT) S.A.E.
81, Ninety St., City Centre,The 5th Settlement, New CairoCairo, EgyptPostal Number: 11835P.O. Box: 413, the 5th Settlement
Tel.: +20 2 26149500 +20 2 26149600 +20 2 26149700Fax: +20 2 26135160
AHLI BANK S.A.O.G.
P.O. Box 545Postal Code 116Mina Al FahalSultanate of Oman
Telephone : +968 24577000Facsimile : +968 24568001
Email: [email protected]
UNITED BANK FOR COMMERCE & INVESTMENT S.A.C.
Gumhouria Street - Mansoura AreaTripoli, Libya
Telephone : +00218 213345602/3/4Facsimile : +00218 213345601
Email: [email protected]
KUWAIT AND MIDDLE EAST
FINANCIAL INVESTMENT COMPANY K.S.C.P.
P.O. Box 819, Safat 13009, Kuwait
Telephone : +965 22255000Facsimile : +965 22252563
Email: [email protected]
CONTACT DETAILS
Contents
44 Independent Auditors’ Report to the Shareholders45 Consolidated Statement Of Income46 Consolidated Statement of Comprehensive Income47 Consolidated Balance Sheet 48 Consolidated Statement of Cash Flows49-50 Consolidated Statement of Changes in Equity51-91 Notes to the Consolidated Financial Statements
CONSOLIDATED FINANCIAL STATEMENTS 2013
43 Ahli United BankAnnual Report 2013
44 Ahli United BankAnnual Report 2013
Report on the consolidated financial statements
We have audited the accompanying consolidated financial statements of Ahli United Bank B.S.C. (“the Bank”) and its subsidiaries (“the Group”), which comprise the consolidated balance sheet as at 31 December 2013, and the related consolidated statements of income, comprehensive income, cash flows and changes in equity for the year then ended, and a summary of significant accounting policies and other explanatory information.
Board of Directors’ responsibility for the consolidated financial statements
The Bank’s Board of Directors is responsible for the preparation and fair presentation of these consolidated financial statements in accordance with International Financial Reporting Standards, and for such internal control as the Board of Directors determines is necessary to enable the preparation of the consolidated financial statements that are free from material misstatement, whether due to fraud or error.
Auditors’ responsibility
Our responsibility is to express an opinion on these consolidated financial statements based on our audit. We conducted our audit in accordance with International Standards on Auditing. Those standards require that we comply with ethical requirements and plan and perform the audit to obtain reasonable assurance about whether the consolidated financial statements are free from material misstatement. An audit involves performing procedures to obtain audit evidence about the amounts and disclosures in the consolidated financial statements. The procedures selected depend on the auditors’ judgement, including the assessment of the risks of material misstatement of the consolidated financial statements, whether due to fraud or error. In making those risk assessments, the auditor considers internal control relevant to the entity’s preparation and fair presentation of the consolidated financial statements in order to design audit procedures that are appropriate in the circumstances, but not for the purpose of expressing an opinion on the effectiveness of the entity’s internal control. An audit also includes evaluating the appropriateness of accounting policies used and the reasonableness of accounting estimates made by the Board of Directors, as well as evaluating the overall presentation of the consolidated financial statements.
We believe that the audit evidence we have obtained is sufficient and appropriate to provide a basis for our audit opinion.
Opinion
In our opinion, the consolidated financial statements present fairly, in all material respects, the consolidated financial position of the Group as at 31 December 2013 and its consolidated financial performance and its cash flows for the year then ended in accordance with International Financial Reporting Standards.
Report on other regulatory requirements
As required by the Bahrain Commercial Companies Law and the Central Bank of Bahrain (CBB) Rule Book (Volume 1), we report that:
a) the Bank has maintained proper accounting records and the consolidated financial statements are in agreement therewith; and
b) the financial information contained in the Report of the Board of Directors is consistent with the consolidated financial statements.
We are not aware of any violations of the Bahrain Commercial Companies Law, the Central Bank of Bahrain and Financial Institutions Law, the CBB Rule Book (Volume 1 and applicable provisions of Volume 6) and CBB directives, regulations and associated resolutions, rules and procedures of the Bahrain Bourse or the terms of the Bank’s memorandum and articles of association during the year ended 31 December 2013 that might have had a material adverse effect on the business of the Bank or on its financial position. Satisfactory explanations and information have been provided to us by management in response to all our requests.
19 February 2014Manama, Kingdom of Bahrain.
Ernst & Young
P.O. Box 14014th Floor, South TowerBahrain World Trade Center
ManamaKingdom of Bahrain
Tel: +973 1753 5455 Fax: +973 1753 5405
[email protected] ey.com/mena
C.R. No. 6700
INDEPENDENT AUDITORS’ REPORT TO THE SHAREHOLDERS OF AHLI UNITED BANK B.S.C.
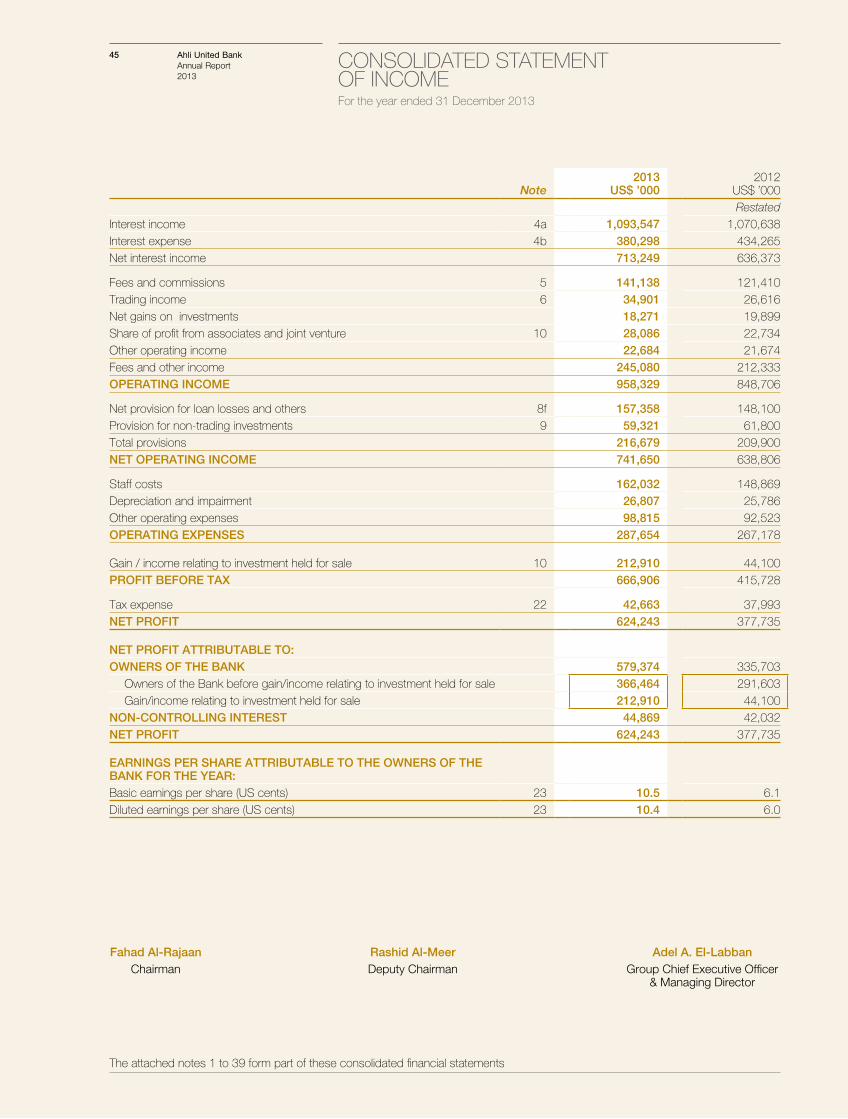
Note2013
US$ ’0002012
US$ ’000Restated
Interest income 4a 1,093,547 1,070,638Interest expense 4b 380,298 434,265Net interest income 713,249 636,373
Fees and commissions 5 141,138 121,410Trading income 6 34,901 26,616Net gains on investments 18,271 19,899Share of profit from associates and joint venture 10 28,086 22,734Other operating income 22,684 21,674Fees and other income 245,080 212,333OPERATING INCOME 958,329 848,706
Net provision for loan losses and others 8f 157,358 148,100Provision for non-trading investments 9 59,321 61,800Total provisions 216,679 209,900NET OPERATING INCOME 741,650 638,806
Staff costs 162,032 148,869Depreciation and impairment 26,807 25,786Other operating expenses 98,815 92,523OPERATING EXPENSES 287,654 267,178
Gain / income relating to investment held for sale 10 212,910 44,100PROFIT BEFORE TAX 666,906 415,728
Tax expense 22 42,663 37,993NET PROFIT 624,243 377,735
NET PROFIT ATTRIBUTABLE TO:OWNERS OF THE BANK 579,374 335,703
Owners of the Bank before gain/income relating to investment held for sale 366,464 291,603Gain/income relating to investment held for sale 212,910 44,100
NON-CONTROLLING INTEREST 44,869 42,032NET PROFIT 624,243 377,735
EARNINGS PER SHARE ATTRIBUTABLE TO THE OWNERS OF THE BANK FOR THE YEAR:Basic earnings per share (US cents) 23 10.5 6.1Diluted earnings per share (US cents) 23 10.4 6.0
The attached notes 1 to 39 form part of these consolidated financial statements
Fahad Al-RajaanChairman
Rashid Al-MeerDeputy Chairman
Adel A. El-LabbanGroup Chief Executive Officer
& Managing Director
45 Ahli United BankAnnual Report 2013
CONSOLIDATED STATEMENT OF INCOME For the year ended 31 December 2013
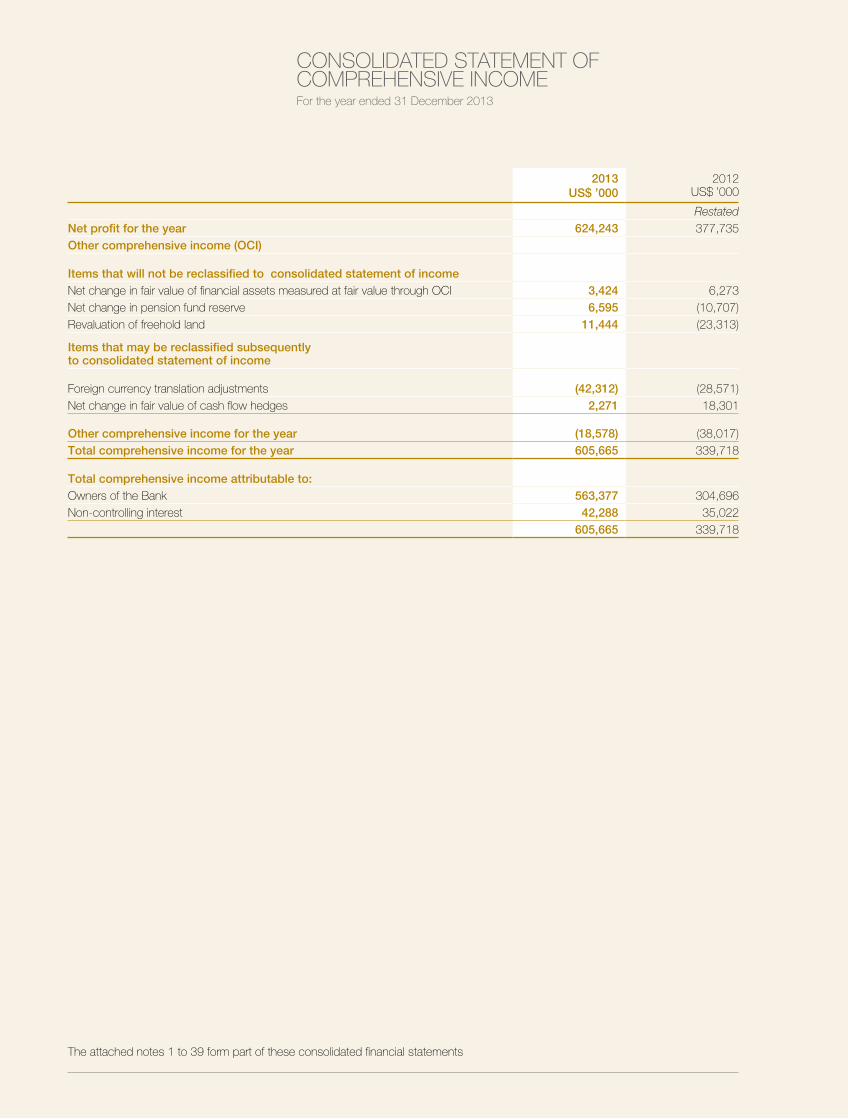
46 Ahli United BankAnnual Report 2013
2013US$ ’000
2012US$ ’000
RestatedNet profit for the year 624,243 377,735Other comprehensive income (OCI)
Items that will not be reclassified to consolidated statement of incomeNet change in fair value of financial assets measured at fair value through OCI 3,424 6,273Net change in pension fund reserve 6,595 (10,707)Revaluation of freehold land 11,444 (23,313)
Items that may be reclassified subsequently to consolidated statement of income
Foreign currency translation adjustments (42,312) (28,571)Net change in fair value of cash flow hedges 2,271 18,301
Other comprehensive income for the year (18,578) (38,017)Total comprehensive income for the year 605,665 339,718
Total comprehensive income attributable to:Owners of the Bank 563,377 304,696Non-controlling interest 42,288 35,022
605,665 339,718
CONSOLIDATED STATEMENT OF COMPREHENSIVE INCOME For the year ended 31 December 2013
The attached notes 1 to 39 form part of these consolidated financial statements
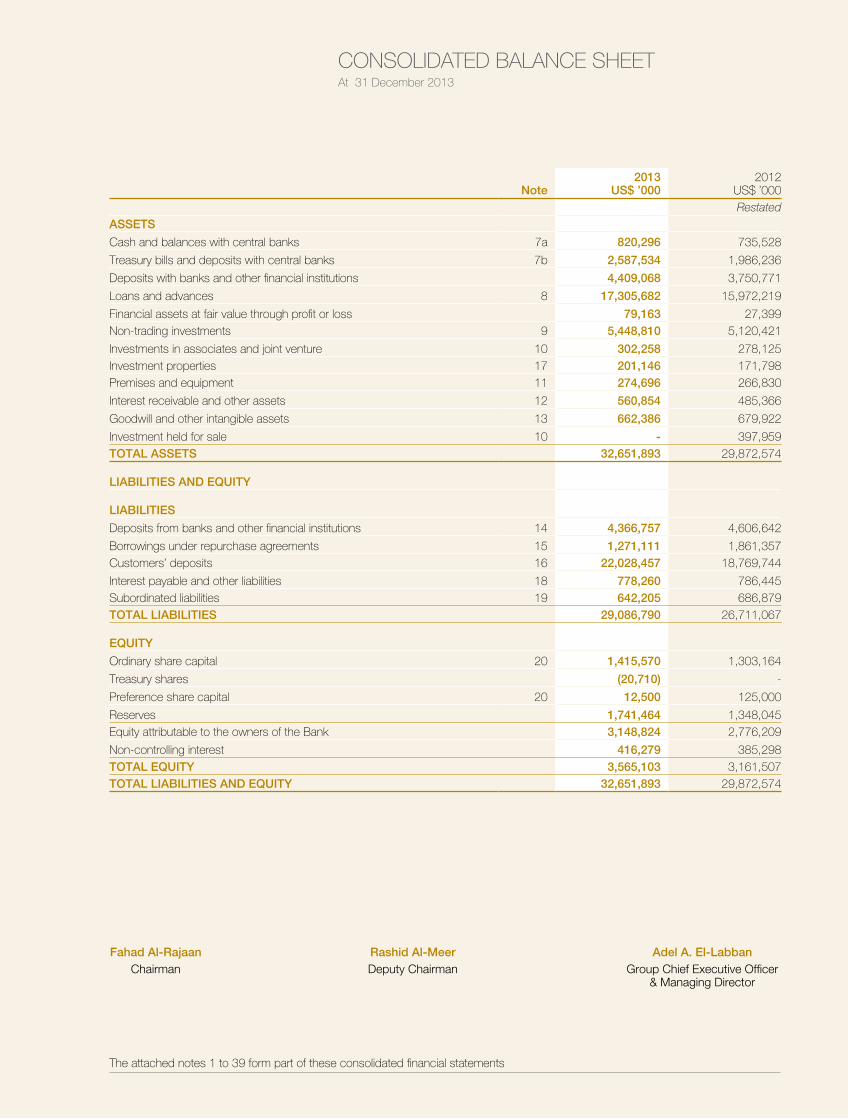
47 Ahli United BankAnnual Report 2013
Note2013
US$ ’0002012
US$ ’000Restated
ASSETS
Cash and balances with central banks 7a 820,296 735,528
Treasury bills and deposits with central banks 7b 2,587,534 1,986,236
Deposits with banks and other financial institutions 4,409,068 3,750,771
Loans and advances 8 17,305,682 15,972,219
Financial assets at fair value through profit or loss 79,163 27,399Non-trading investments 9 5,448,810 5,120,421
Investments in associates and joint venture 10 302,258 278,125Investment properties 17 201,146 171,798Premises and equipment 11 274,696 266,830
Interest receivable and other assets 12 560,854 485,366
Goodwill and other intangible assets 13 662,386 679,922
Investment held for sale 10 - 397,959TOTAL ASSETS 32,651,893 29,872,574
LIABILITIES AND EQUITY
LIABILITIES
Deposits from banks and other financial institutions 14 4,366,757 4,606,642
Borrowings under repurchase agreements 15 1,271,111 1,861,357Customers’ deposits 16 22,028,457 18,769,744
Interest payable and other liabilities 18 778,260 786,445Subordinated liabilities 19 642,205 686,879TOTAL LIABILITIES 29,086,790 26,711,067
EQUITY
Ordinary share capital 20 1,415,570 1,303,164
Treasury shares (20,710) -
Preference share capital 20 12,500 125,000
Reserves 1,741,464 1,348,045Equity attributable to the owners of the Bank 3,148,824 2,776,209
Non-controlling interest 416,279 385,298TOTAL EQUITY 3,565,103 3,161,507TOTAL LIABILITIES AND EQUITY 32,651,893 29,872,574
Fahad Al-RajaanChairman
Rashid Al-MeerDeputy Chairman
Adel A. El-LabbanGroup Chief Executive Officer
& Managing Director
CONSOLIDATED BALANCE SHEET At 31 December 2013
The attached notes 1 to 39 form part of these consolidated financial statements
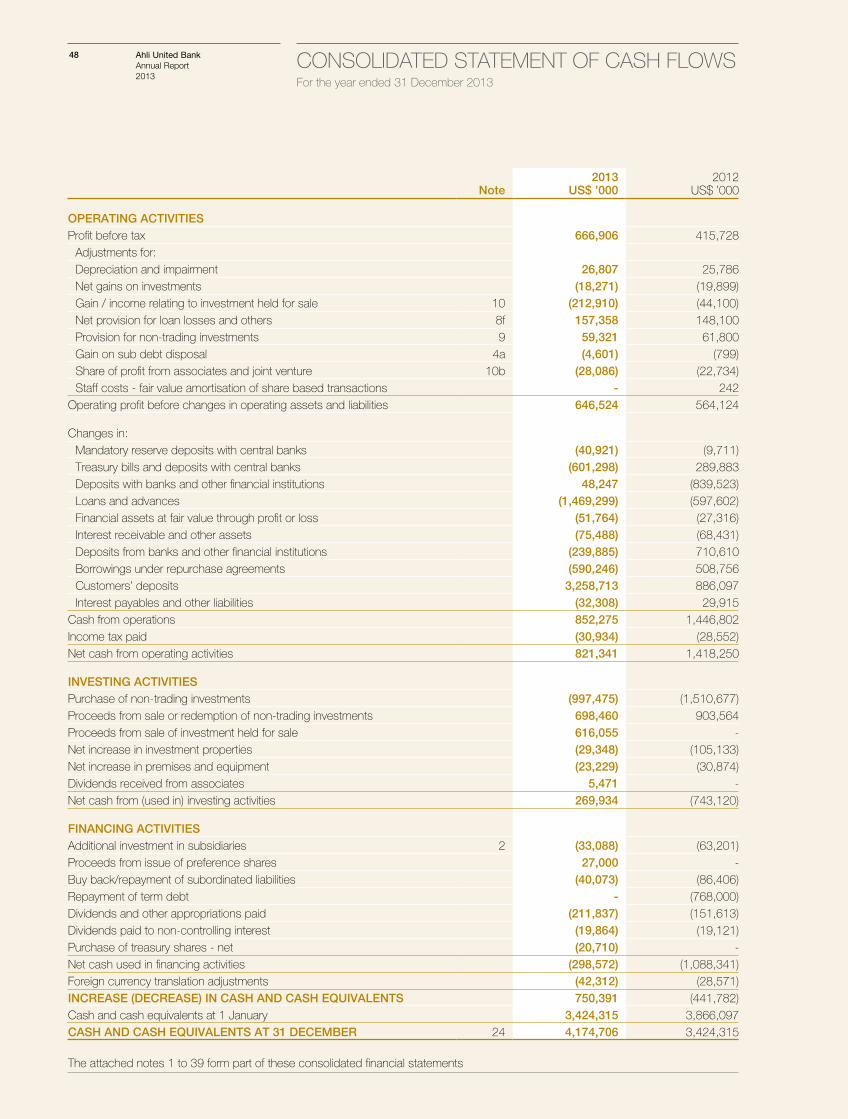
48 Ahli United BankAnnual Report 2013
Note2013
US$ ’0002012
US$ ’000
OPERATING ACTIVITIESProfit before tax 666,906 415,728
Adjustments for:Depreciation and impairment 26,807 25,786 Net gains on investments (18,271) (19,899)Gain / income relating to investment held for sale 10 (212,910) (44,100)Net provision for loan losses and others 8f 157,358 148,100 Provision for non-trading investments 9 59,321 61,800 Gain on sub debt disposal 4a (4,601) (799)Share of profit from associates and joint venture 10b (28,086) (22,734)Staff costs - fair value amortisation of share based transactions - 242
Operating profit before changes in operating assets and liabilities 646,524 564,124
Changes in:Mandatory reserve deposits with central banks (40,921) (9,711)Treasury bills and deposits with central banks (601,298) 289,883 Deposits with banks and other financial institutions 48,247 (839,523)Loans and advances (1,469,299) (597,602)Financial assets at fair value through profit or loss (51,764) (27,316)Interest receivable and other assets (75,488) (68,431)Deposits from banks and other financial institutions (239,885) 710,610 Borrowings under repurchase agreements (590,246) 508,756 Customers’ deposits 3,258,713 886,097 Interest payables and other liabilities (32,308) 29,915
Cash from operations 852,275 1,446,802 Income tax paid (30,934) (28,552)Net cash from operating activities 821,341 1,418,250
INVESTING ACTIVITIESPurchase of non-trading investments (997,475) (1,510,677)Proceeds from sale or redemption of non-trading investments 698,460 903,564 Proceeds from sale of investment held for sale 616,055 - Net increase in investment properties (29,348) (105,133)Net increase in premises and equipment (23,229) (30,874)Dividends received from associates 5,471 - Net cash from (used in) investing activities 269,934 (743,120)
FINANCING ACTIVITIESAdditional investment in subsidiaries 2 (33,088) (63,201)Proceeds from issue of preference shares 27,000 - Buy back/repayment of subordinated liabilities (40,073) (86,406)Repayment of term debt - (768,000)Dividends and other appropriations paid (211,837) (151,613)Dividends paid to non-controlling interest (19,864) (19,121)Purchase of treasury shares - net (20,710) - Net cash used in financing activities (298,572) (1,088,341)Foreign currency translation adjustments (42,312) (28,571)INCREASE (DECREASE) IN CASH AND CASH EQUIVALENTS 750,391 (441,782)Cash and cash equivalents at 1 January 3,424,315 3,866,097 CASH AND CASH EQUIVALENTS AT 31 DECEMBER 24 4,174,706 3,424,315
The attached notes 1 to 39 form part of these consolidated financial statements
CONSOLIDATED STATEMENT OF CASH FLOWS For the year ended 31 December 2013
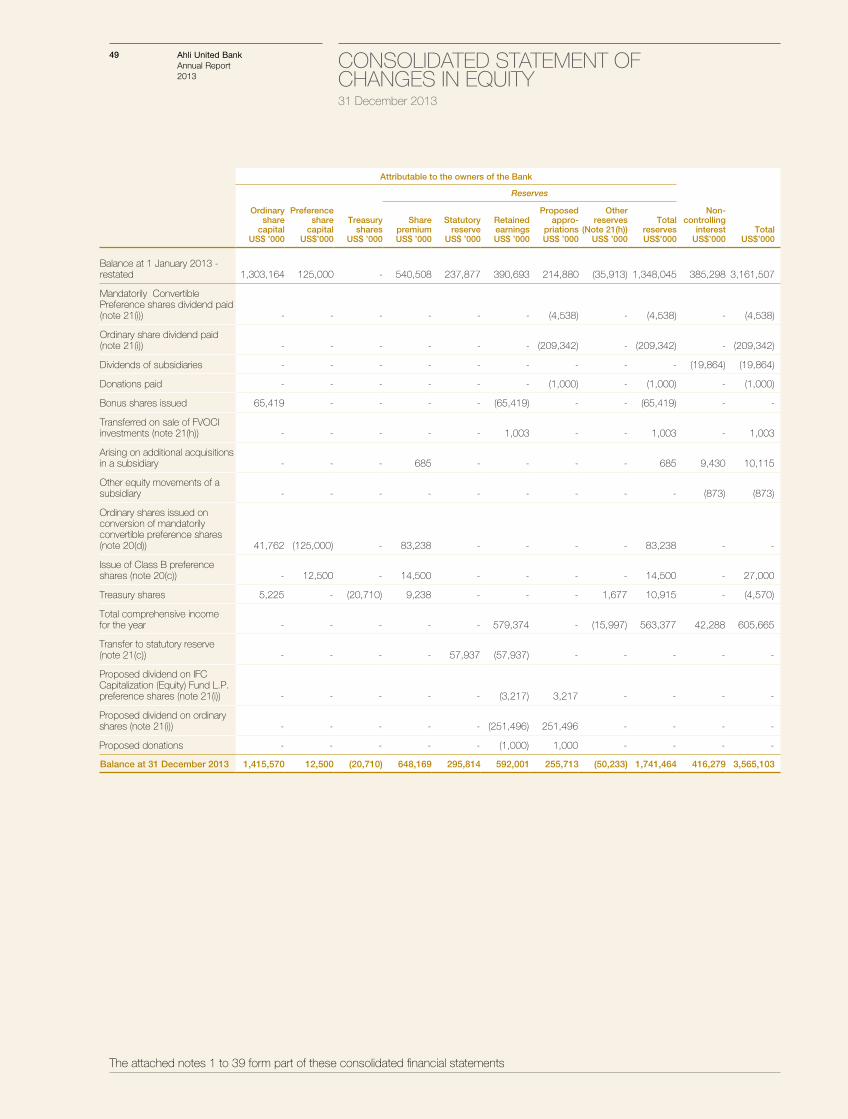
49 Ahli United BankAnnual Report 2013
Attributable to the owners of the Bank
Reserves
Ordinaryshare
capitalUS$ ’000
Preferenceshare
capitalUS$’000
Treasury shares
US$ ’000
SharepremiumUS$ ’000
Statutoryreserve
US$ ’000
RetainedearningsUS$ ’000
Proposedappro-
priationsUS$ ’000
Other reserves
(Note 21(h))US$ ’000
TotalreservesUS$’000
Non-controlling
interestUS$’000
TotalUS$’000
Balance at 1 January 2013 - restated 1,303,164 125,000 - 540,508 237,877 390,693 214,880 (35,913) 1,348,045 385,298 3,161,507
Mandatorily Convertible Preference shares dividend paid (note 21(i)) - - - - - - (4,538) - (4,538) - (4,538)
Ordinary share dividend paid (note 21(i)) - - - - - - (209,342) - (209,342) - (209,342)
Dividends of subsidiaries - - - - - - - - - (19,864) (19,864)
Donations paid - - - - - - (1,000) - (1,000) - (1,000)
Bonus shares issued 65,419 - - - - (65,419) - - (65,419) - -
Transferred on sale of FVOCI investments (note 21(h)) - - - - - 1,003 - - 1,003 - 1,003
Arising on additional acquisitions in a subsidiary - - - 685 - - - - 685 9,430 10,115
Other equity movements of a subsidiary - - - - - - - - - (873) (873)
Ordinary shares issued on conversion of mandatorily convertible preference shares (note 20(d)) 41,762 (125,000) - 83,238 - - - - 83,238 - -
Issue of Class B preference shares (note 20(c)) - 12,500 - 14,500 - - - - 14,500 - 27,000
Treasury shares 5,225 - (20,710) 9,238 - - - 1,677 10,915 - (4,570)
Total comprehensive income for the year - - - - - 579,374 - (15,997) 563,377 42,288 605,665
Transfer to statutory reserve (note 21(c)) - - - - 57,937 (57,937) - - - - -
Proposed dividend on IFC Capitalization (Equity) Fund L.P. preference shares (note 21(i)) - - - - - (3,217) 3,217 - - - -
Proposed dividend on ordinary shares (note 21(i)) - - - - - (251,496) 251,496 - - - -
Proposed donations - - - - - (1,000) 1,000 - - - -
Balance at 31 December 2013 1,415,570 12,500 (20,710) 648,169 295,814 592,001 255,713 (50,233) 1,741,464 416,279 3,565,103
The attached notes 1 to 39 form part of these consolidated financial statements
CONSOLIDATED STATEMENT OF CHANGES IN EQUITY 31 December 2013
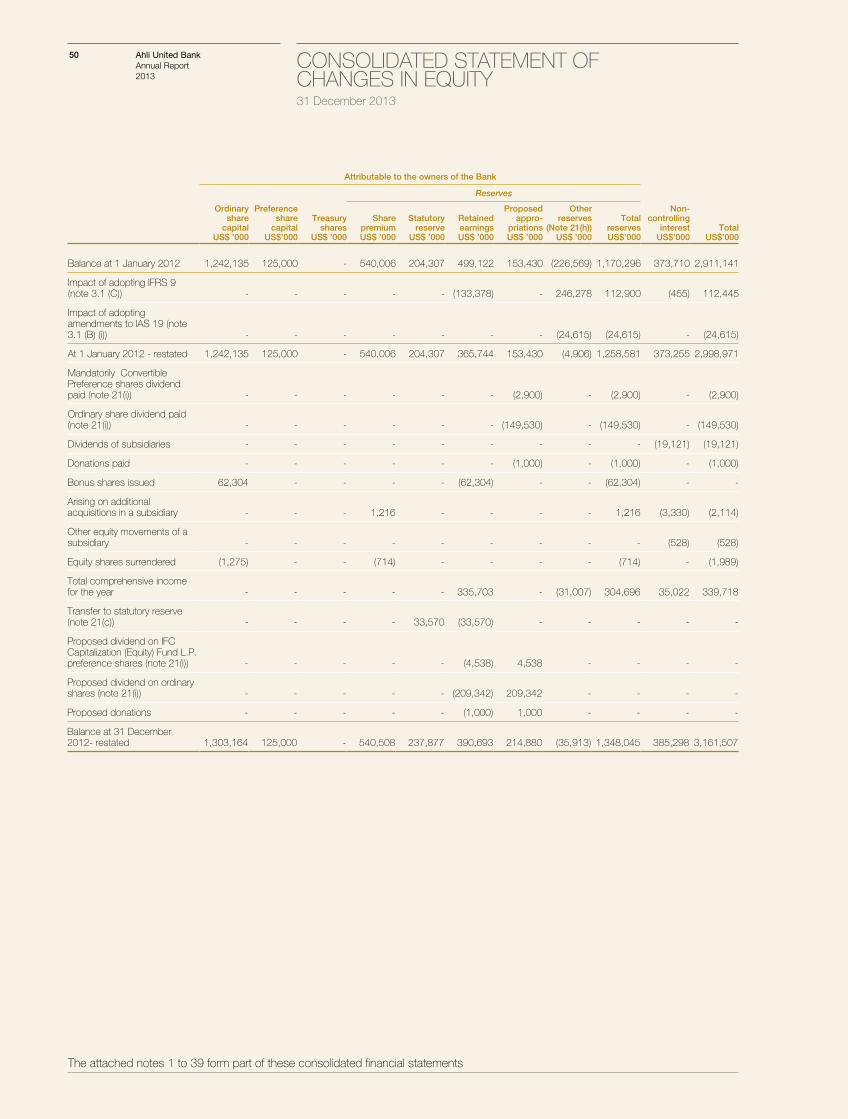
50 Ahli United BankAnnual Report 2013
Attributable to the owners of the Bank
Reserves
Ordinaryshare
capitalUS$ ’000
Preferenceshare
capitalUS$’000
Treasury shares
US$ ’000
SharepremiumUS$ ’000
Statutoryreserve
US$ ’000
RetainedearningsUS$ ’000
Proposedappro-
priationsUS$ ’000
Other reserves
(Note 21(h))US$ ’000
TotalreservesUS$’000
Non-controlling
interestUS$’000
TotalUS$’000
Balance at 1 January 2012 1,242,135 125,000 - 540,006 204,307 499,122 153,430 (226,569) 1,170,296 373,710 2,911,141
Impact of adopting IFRS 9 (note 3.1 (C)) - - - - - (133,378) - 246,278 112,900 (455) 112,445
Impact of adopting amendments to IAS 19 (note 3.1 (B) (i)) - - - - - - - (24,615) (24,615) - (24,615)
At 1 January 2012 - restated 1,242,135 125,000 - 540,006 204,307 365,744 153,430 (4,906) 1,258,581 373,255 2,998,971
Mandatorily Convertible Preference shares dividend paid (note 21(i)) - - - - - - (2,900) - (2,900) - (2,900)
Ordinary share dividend paid (note 21(i)) - - - - - - (149,530) - (149,530) - (149,530)
Dividends of subsidiaries - - - - - - - - - (19,121) (19,121)
Donations paid - - - - - - (1,000) - (1,000) - (1,000)
Bonus shares issued 62,304 - - - - (62,304) - - (62,304) - -
Arising on additional acquisitions in a subsidiary - - - 1,216 - - - - 1,216 (3,330) (2,114)
Other equity movements of a subsidiary - - - - - - - - - (528) (528)
Equity shares surrendered (1,275) - - (714) - - - - (714) - (1,989)
Total comprehensive income for the year - - - - - 335,703 - (31,007) 304,696 35,022 339,718
Transfer to statutory reserve (note 21(c)) - - - - 33,570 (33,570) - - - - -
Proposed dividend on IFC Capitalization (Equity) Fund L.P. preference shares (note 21(i)) - - - - - (4,538) 4,538 - - - -
Proposed dividend on ordinary shares (note 21(i)) - - - - - (209,342) 209,342 - - - -
Proposed donations - - - - - (1,000) 1,000 - - - -
Balance at 31 December 2012- restated 1,303,164 125,000 - 540,508 237,877 390,693 214,880 (35,913) 1,348,045 385,298 3,161,507
The attached notes 1 to 39 form part of these consolidated financial statements
CONSOLIDATED STATEMENT OF CHANGES IN EQUITY 31 December 2013
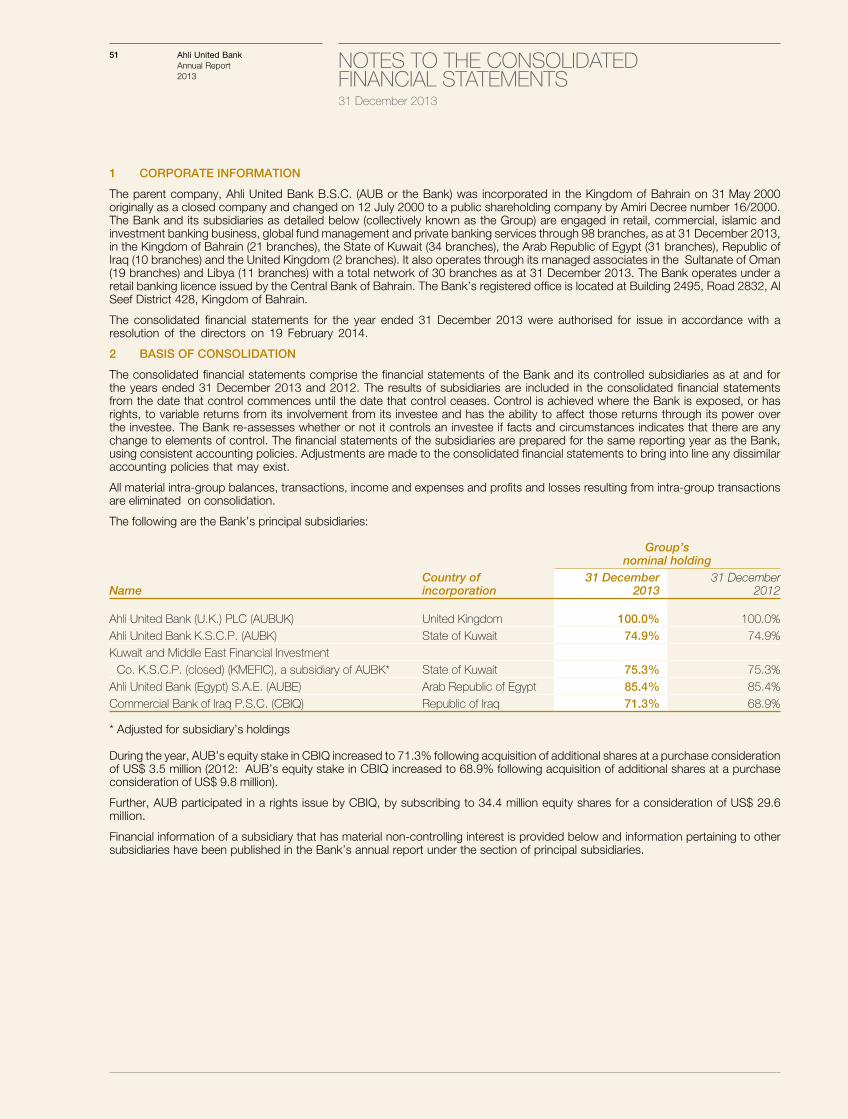
51 NOTES TO THE CONSOLIDATED FINANCIAL STATEMENTS 31 December 2013
Ahli United BankAnnual Report 2013
1 CORPORATE INFORMATION
The parent company, Ahli United Bank B.S.C. (AUB or the Bank) was incorporated in the Kingdom of Bahrain on 31 May 2000 originally as a closed company and changed on 12 July 2000 to a public shareholding company by Amiri Decree number 16/2000. The Bank and its subsidiaries as detailed below (collectively known as the Group) are engaged in retail, commercial, islamic and investment banking business, global fund management and private banking services through 98 branches, as at 31 December 2013, in the Kingdom of Bahrain (21 branches), the State of Kuwait (34 branches), the Arab Republic of Egypt (31 branches), Republic of Iraq (10 branches) and the United Kingdom (2 branches). It also operates through its managed associates in the Sultanate of Oman (19 branches) and Libya (11 branches) with a total network of 30 branches as at 31 December 2013. The Bank operates under a retail banking licence issued by the Central Bank of Bahrain. The Bank’s registered office is located at Building 2495, Road 2832, Al Seef District 428, Kingdom of Bahrain.
The consolidated financial statements for the year ended 31 December 2013 were authorised for issue in accordance with a resolution of the directors on 19 February 2014.
2 BASIS OF CONSOLIDATION
The consolidated financial statements comprise the financial statements of the Bank and its controlled subsidiaries as at and for the years ended 31 December 2013 and 2012. The results of subsidiaries are included in the consolidated financial statements from the date that control commences until the date that control ceases. Control is achieved where the Bank is exposed, or has rights, to variable returns from its involvement from its investee and has the ability to affect those returns through its power over the investee. The Bank re-assesses whether or not it controls an investee if facts and circumstances indicates that there are any change to elements of control. The financial statements of the subsidiaries are prepared for the same reporting year as the Bank, using consistent accounting policies. Adjustments are made to the consolidated financial statements to bring into line any dissimilar accounting policies that may exist.
All material intra-group balances, transactions, income and expenses and profits and losses resulting from intra-group transactions are eliminated on consolidation.
The following are the Bank’s principal subsidiaries:
Group’s nominal holding
NameCountry ofincorporation
31 December 2013
31 December2012
Ahli United Bank (U.K.) PLC (AUBUK) United Kingdom 100.0% 100.0%Ahli United Bank K.S.C.P. (AUBK) State of Kuwait 74.9% 74.9%Kuwait and Middle East Financial Investment
Co. K.S.C.P. (closed) (KMEFIC), a subsidiary of AUBK* State of Kuwait 75.3% 75.3%Ahli United Bank (Egypt) S.A.E. (AUBE) Arab Republic of Egypt 85.4% 85.4%Commercial Bank of Iraq P.S.C. (CBIQ) Republic of Iraq 71.3% 68.9%
* Adjusted for subsidiary’s holdings
During the year, AUB’s equity stake in CBIQ increased to 71.3% following acquisition of additional shares at a purchase consideration of US$ 3.5 million (2012: AUB’s equity stake in CBIQ increased to 68.9% following acquisition of additional shares at a purchase consideration of US$ 9.8 million).
Further, AUB participated in a rights issue by CBIQ, by subscribing to 34.4 million equity shares for a consideration of US$ 29.6 million.
Financial information of a subsidiary that has material non-controlling interest is provided below and information pertaining to other subsidiaries have been published in the Bank’s annual report under the section of principal subsidiaries.
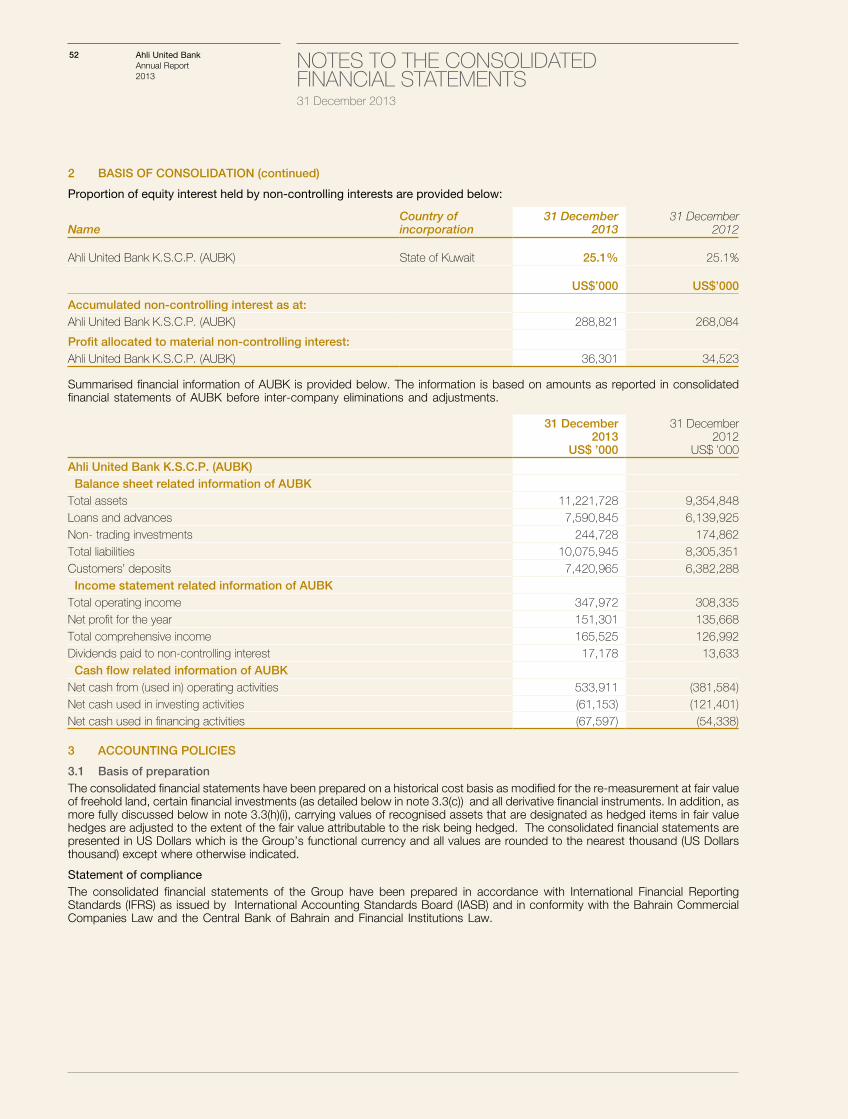
52 NOTES TO THE CONSOLIDATED FINANCIAL STATEMENTS 31 December 2013
Ahli United BankAnnual Report 2013
2 BASIS OF CONSOLIDATION (continued)
Proportion of equity interest held by non-controlling interests are provided below:
NameCountry ofincorporation
31 December 2013
31 December2012
Ahli United Bank K.S.C.P. (AUBK) State of Kuwait 25.1% 25.1%
US$’000 US$’000
Accumulated non-controlling interest as at: Ahli United Bank K.S.C.P. (AUBK) 288,821 268,084
Profit allocated to material non-controlling interest:Ahli United Bank K.S.C.P. (AUBK) 36,301 34,523
Summarised financial information of AUBK is provided below. The information is based on amounts as reported in consolidated financial statements of AUBK before inter-company eliminations and adjustments.
31 December 2013
US$ ’000
31 December2012
US$ ’000Ahli United Bank K.S.C.P. (AUBK) Balance sheet related information of AUBKTotal assets 11,221,728 9,354,848Loans and advances 7,590,845 6,139,925Non- trading investments 244,728 174,862Total liabilities 10,075,945 8,305,351Customers’ deposits 7,420,965 6,382,288 Income statement related information of AUBKTotal operating income 347,972 308,335Net profit for the year 151,301 135,668Total comprehensive income 165,525 126,992Dividends paid to non-controlling interest 17,178 13,633 Cash flow related information of AUBKNet cash from (used in) operating activities 533,911 (381,584)Net cash used in investing activities (61,153) (121,401)Net cash used in financing activities (67,597) (54,338)
3 ACCOUNTING POLICIES
3.1 Basis of preparationThe consolidated financial statements have been prepared on a historical cost basis as modified for the re-measurement at fair value of freehold land, certain financial investments (as detailed below in note 3.3(c)) and all derivative financial instruments. In addition, as more fully discussed below in note 3.3(h)(i), carrying values of recognised assets that are designated as hedged items in fair value hedges are adjusted to the extent of the fair value attributable to the risk being hedged. The consolidated financial statements are presented in US Dollars which is the Group’s functional currency and all values are rounded to the nearest thousand (US Dollars thousand) except where otherwise indicated.
Statement of compliance The consolidated financial statements of the Group have been prepared in accordance with International Financial Reporting Standards (IFRS) as issued by International Accounting Standards Board (IASB) and in conformity with the Bahrain Commercial Companies Law and the Central Bank of Bahrain and Financial Institutions Law.
53 NOTES TO THE CONSOLIDATED FINANCIAL STATEMENTS 31 December 2013
Ahli United BankAnnual Report 2013
(A) New Standards and Interpretations issued but not yet effectiveThe following new Standards and amendments have been issued by the International Accounting Standards Board (IASB) but are not yet mandatory for the year ended 31 December 2013:
• IAS 39 Novation of Derivatives and continuation of Hedge accounting - Amendments to IAS 39: effective for annual periods commencing 1 January 2014.
• IFRS 9 Financial instruments - Hedge accounting: the mandatory effective date is not yet specified.• Investment Entities - (Amendments to IFRS 10, IFRS 12 and IAS 27): effective for annual periods commencing 1 January 2014.• IAS 32 Offsetting Financial Assets and Financial Liabilities - Amendments to IAS 32: effective for annual periods commencing 1
January 2014.The management is considering the implications of these standards and amendments, their impact on the Group’s financial position and results and the timing of their adoption by the Group.
(B) New Standards and Interpretations issued and are effective(i) The Group has adopted the following new and amended International Accounting Standards/International Financial Reporting
Standards as of 1 January 2013:
- IAS 19 Employee Benefits: effective for annual periods commencing 1 January 2013.
The Group adopted the amended Standard- IAS-19 Employee Benefits issued by the IASB in 2011, mandatorily applicable with effect from 1 January 2013. The amended Standard requires:
- immediate recognition of actuarial gains and losses relating to ‘Defined Pension Benefit’ scheme through equity, thus removing the earlier available options of deferred recognition of such movements using ‘the corridor’ approach or immediate recognition through profit or loss.
- streamlining the presentation of changes in assets and liabilities arising from defined benefits plans, including requiring remeasurements of these to be presented in Other Comprehensive Income (OCI).
- enhancement of the disclosure requirements for defined benefit plans, providing detailed information about the characteristics of defined benefit plans and the risks that entities are exposed to through participation in those plans.
The change in accounting policy resulting from the application of IAS-19 ‘Employee Benefits’ (2011) has been effected in accordance with IAS 8, requiring the re-statement to be reflected from the earliest period presented. Accordingly, the impact of this change is reflected in note 21 (h).
(ii) The Group has adopted the following new and amended International Accounting Standards/International Financial Reporting Standards as of 1 January 2013 which did not have any impact on the financial position or performance of the Group.
IFRS 10 Consolidated Financial StatementsIFRS 11 Joint ArrangementsIAS 28 Investments in Associates and Joint Ventures
(iii) The Group has adopted the following new and amended International Accounting Standards/International Financial Reporting Standards as of 1 January 2013 and necessary additional disclosures arising from the adoption of these Standards have been made in the consolidated financial statements:
IAS 1 Financial Statement PresentationIFRS 12 Disclosure of Interest in Other Entities (Refer to note 2)IFRS 13 Fair Value Measurement (Refer to note 34)
(C) IFRS 9 “Financial Instruments”: Recognition and MeasurementIn 2012, the Group early adopted IFRS 9 “Financial Instruments”: Recognition and Measurement, in advance of its then mandatory effective date of 1 January 2015, as permitted by the Standard, to provide a better presentation of its performance and operations. The transition provisions under Para 7.2.2 of IFRS 9 require the Standard to be adopted from the beginning of the first reporting period in which the entity adopts the Standard. The transition to IFRS 9 resulted in the equity attributable to the owners of the Bank as at 1 January 2012 increasing by US$ 112.9 million.
3.2 Significant accounting judgements and estimatesThe preparation of the consolidated financial statements requires management to make judgements and estimates that affect the reported amounts of income, expenses, financial assets, liabilities, the accompanying disclosures and disclosure of contingent liabilities. Uncertainty about these assumptions and estimates could result in outcomes that require a material adjustment to the carrying amount of assets or liabilities affected in future periods.
JudgementsJudgements are made in the classification of financial instruments into fair value and amortised cost based on business model. Further goodwill and intangible assets with indefinite lives have been allocated to cash generating units for impairment testing. Judgements are also made in determination of the objective evidence that a financial asset is impaired.
54 NOTES TO THE CONSOLIDATED FINANCIAL STATEMENTS 31 December 2013
Ahli United BankAnnual Report 2013
3 ACCOUNTING POLICIES (continued)
3.2 Significant accounting judgements and estimates (continued)Business modelIn making an assessment of whether a business model’s objective is to hold assets in order to collect contractual cash flows, the Group considers at which level of its business activities such assessment should be made. Generally, a business model is a matter of fact which can be evidenced by the way business is managed and the information provided to management.
In determining whether its business model for managing financial assets is to hold assets in order to collect contractual cash flows, the Group considers:
• Management’s stated policies and objectives for the portfolio and the operation of those policies in practice; • Management’s evaluation of the performance of the portfolio; • Management’s strategy in terms of earning contractual interest revenues or generating capital gains.
EstimatesPension plansEstimates and assumptions are used in determining the Group’s pension liabilities. The cost of the defined benefit pension plan and other post-employment medical benefits and the present value of pension obligations are determined using actuarial valuations. An actuarial valuation involves making various assumptions that may differ from actual developments in the future. These include the determination of the discount rate, future salary increases, mortality rates and future pension increases.
Impairment losses on loans and advances, non-trading investments and other assetsEstimates are made regarding the amount and timing of future cash flows when measuring the level of provisions required for non-performing loans, portfolios of performing loans with similar risk characteristics where the risk of default has increased, as well as provisions for non-trading investments and other assets. These are more fully described in note 3.3 (g).
Fair value of financial instrumentsEstimates are also made in determining the fair values of financial assets and derivatives that are not quoted in an active market. Such estimates are necessarily based on assumptions about several factors involving varying degrees of uncertainty and actual results may differ resulting in future changes in such provisions.
Impairment of goodwill and intangible assetsImpairment exists when carrying value of an asset or cash generating unit (CGU) exceeds its recoverable amount, which is the higher of its fair value less costs of disposal and its value in use. The key assumptions used to determine the recoverable amount for the different CGUs, are disclosed and further explained in note 13.
The methodology and assumptions used for estimating future cash flows are reviewed regularly to reduce any differences between loss estimates and actual loss experience.
3.3 Summary of significant accounting policiesThe principal accounting policies applied in the preparation of these consolidated financial statements, besides those detailed in note 3.1 are set out below. These policies have been consistently applied to all the years presented.
(a) Investments in associates and joint ventureAssociate companies are companies in which the Group exercises significant influence but does not control. Significant influence is the power to participate in the financial and operating policy decisions of the investee, but is not control or joint control over those policies. The Group classifies an investment as “joint venture” when it is a party to a joint arrangement whereby the parties that have joint control of the arrangement have rights to the net assets of the joint venture. Investments in associate companies and joint ventures are accounted for using the equity method.
The reporting dates of the associates and joint venture and the Group are identical and the associates’ and joint venture’s accounting policies materially conform to those used by the Group for like transactions and events in similar circumstances. Adjustments are made to the consolidated financial statements to bring into line any dissimilar accounting policies that may exist.
(b) Foreign currency translation(i) Transactions and balancesTransactions in foreign currencies are initially recorded in the relevant functional currency at the rate of exchange prevailing on the date of the transaction.
Monetary assets and liabilities denominated in foreign currencies are translated into the functional currency at the rate of exchange ruling at the balance sheet date. Any resulting exchange differences are included in “trading income” in the consolidated statement of income.
Non-monetary assets and liabilities that are measured at historical cost in a foreign currency are translated using the exchange rates as at the dates of the initial transactions. Non-monetary investments classified as fair value through other comprehensive income (FVTOCI) measured at fair value in a foreign currency are translated using the exchange rates at the date when the fair value is determined and the differences are included in other comprehensive income as part of the fair value adjustment of the respective items, unless these items are designated as fair value through profit or loss (FVTPL) or are part of an effective hedging strategy, in which case it is recorded in the consolidated statement of income.
55 NOTES TO THE CONSOLIDATED FINANCIAL STATEMENTS 31 December 2013
Ahli United BankAnnual Report 2013
(ii) Group companiesAssets and liabilities of foreign subsidiaries whose functional currency is not US Dollars are translated into US Dollars at the rates of exchange prevailing at the balance sheet date. Income and expense items are translated at average exchange rates prevailing for the reporting period. Any exchange differences arising on translation are included in “foreign exchange translation reserve” forming part of other comprehensive income except to the extent that the translation difference is allocated to the non-controlling interest. On disposal of foreign operations, exchange differences relating thereto and previously recognised in other comprehensive income are recognised in the consolidated statement of income.
(c) Financial instrumentsThe classification of financial instruments at initial recognition depends on the purpose for which the financial instruments were acquired and their characteristics. All financial instruments are initially recognised at the fair value plus, for an item not recorded at FVTPL, transaction costs that are directly attributable to its acquisition or issue. Premiums and discounts are amortised on a systematic basis to maturity using the effective interest rate method and taken to interest income or interest expense as appropriate.
(i) Date of recognitionAll “regular way” purchases and sales of financial assets are recognised on the settlement date, i.e. the date that the Group receives or delivers the asset. Regular way purchases or sales are purchases or sales of financial assets that require delivery of assets within the timeframe generally established by regulation or convention in the market place.
(ii) Treasury bills and deposits with central banksTreasury bills and deposits with central banks are initially recognised at cost. Premiums and discounts are amortised to their maturity using the effective interest rate method.
(iii) Deposits with banks and other financial institutions and loans and advancesDeposits with banks and other financial institutions and loans and advances are financial assets with fixed or determinable payments and fixed maturities that are not quoted in an active market. After initial recognition, these are subsequently measured at amortised cost using the effective interest rate method, adjusted for effective fair value hedges, less any amounts written off and provision for impairment. The losses arising from impairment of these assets are recognised in the consolidated statement of income in “provision for loan losses and others” and in an impairment allowance account in the consolidated balance sheet. Amortised cost is calculated by taking into account any discount or premium on acquisition and fees that are an integral part of the effective interest rate. The amortisation is included in “interest income” in the consolidated statement of income.
(iv) Debt instrumentsDebt instruments are measured at amortised cost using the effective interest rate method if:
- the assets are held within a business model whose objective is to hold assets in order to collect contractual cash flows and- the contractual terms of the financial assets give rise on specified dates to cash flows that are solely payments of principal and
interest on the principal amount outstanding.If either of these two criteria is not met, the financial assets are classified and measured at fair value through the profit or loss (FVTPL). Additionally, even if the financial asset meets the amortised cost criteria the entity may choose at initial recognition to designate the financial asset at FVTPL based on business model.
The Group accounts for any changes in the fair value in the consolidated statement of income for assets classified as “FVTPL”. The change in value is not recognized for assets carried at cost or amortised cost.
(v) Equity investmentsInvestments in equity instruments are classified as FVTPL, unless the Group designates an equity investment that is not held for trading as Fair Value through Other Comprehensive Income (FVTOCI) on initial recognition. At initial recognition, the Group can make irrevocable election on an instrument by instrument basis to designate equity instrument as FVTOCI. If an equity investment is designated as FVTOCI, all gains and losses, except for dividend income, are recognised in other comprehensive income and are not subsequently included in the consolidated statement of income.
(vi) Other financial instrumentsA financial asset is classified as held for trading if:
- it has been acquired principally for the purpose of selling in the near term; - on initial recognition it is part of a portfolio of identified financial instruments that are managed together and for which there is a
recent actual pattern of short term profitability; or - it is a derivative and not designated and effective as a hedging instrument or a financial guarantee.Only financial assets that are measured at amortised cost are tested for impairment.
56 NOTES TO THE CONSOLIDATED FINANCIAL STATEMENTS 31 December 2013
Ahli United BankAnnual Report 2013
3 ACCOUNTING POLICIES (continued)
3.3 Summary of significant accounting policies (continued)(c) Financial instruments (continued)(vii) Derivatives (other than hedging instruments)Changes in fair values of the derivatives held for trading are included in the consolidated statement of income under “trading income”.
Derivatives embedded in other financial instruments are not separated from the host contract and the entire contract is considered in order to determine its classification. These financial instruments are classified as FVTPL and the changes in fair value of the entire hybrid contract are recognised in the consolidated statement of income.
(viii) Deposits and subordinated liabilities.These financial liabilities are carried at amortised cost, less amounts repaid.
(d) Derecognition of financial assets and financial liabilitiesA financial asset (or where applicable, a part of a financial asset or part of a group of similar financial assets) is derecognised where:
- the rights to receive cash flows from the asset have expired;- the Group has transferred its rights to receive cash flows from the asset or has assumed an obligation to pay the received cash
flows in full without material delay to a third party under a ‘pass-through’ arrangement; or- the Group has transferred its rights to receive cash flows from the asset and either (i) has transferred substantially all the risks
and rewards of the asset, or (ii) has neither transferred nor retained substantially all the risks and rewards of the asset, but has transferred control of the asset.
A financial liability is derecognised when the obligation under the liability is discharged, cancelled or expires.
(e) Repurchase agreementsWhere investments are sold subject to a commitment to repurchase them at a predetermined price, they remain on the consolidated balance sheet and the consideration received is included in “Borrowings under repurchase agreements”. The difference between the sale price and repurchase price is treated as interest expense and is accrued over the life of the agreement using the effective interest rate method.
(f) Determination of fair valueFair value is the price that would be received to sell an asset or paid to transfer a liability in an orderly transaction between market participants at the measurement date. The fair value measurement is based on the presumption that the transaction to sell an asset or transfer a liability takes place either in the principal market, or in the absence of a principal market, in the most advantageous market.
The fair value of financial instruments that are quoted in an active market is determined by reference to market bid prices respectively at the close of business on the balance sheet date.
The fair value of liabilities with a demand feature is the amount payable on demand.
The fair value of interest-bearing financial assets and financial liabilities that are not quoted in an active market and are not payable on demand is determined by a discounted cash flow model using the current market interest rates for financial instruments with similar terms and risk characteristics.
For equity investments that are not quoted in an active market, a reasonable estimate of the fair value is determined by reference to the current market value of another instrument that is substantially similar, or is determined using net present valuation techniques.
Investments in funds are stated at net asset values provided by the fund managers.
The fair value of unquoted derivatives is determined either by discounted cash flows or option-pricing models.
For the purpose of fair value disclosures, the Group has determined classes of assets and liabilities on the basis of the nature, characteristics and risks of the assets or liabilities.
For assets and liabilities that are recognised in the financial statements on a recurring basis, the group determines whether transfers have occurred between Levels in the hierarchy by re-assessing categorisation (based on the lowest level input that is significant to the fair value measurement as a whole) at the end of each reporting period disclosed in note 34.
(g) Impairment of financial assetsAn assessment is made at each balance sheet date to determine whether there is any objective evidence that a specific financial asset or a group of financial assets may be impaired. If such evidence exists, the estimated recoverable amount of that asset or a group of financial assets is determined and any impairment loss, based on the net present value of future anticipated cash flows, is recognised in the consolidated statement of income and credited to an allowance account.
57 NOTES TO THE CONSOLIDATED FINANCIAL STATEMENTS 31 December 2013
Ahli United BankAnnual Report 2013
Objective evidence that financial assets are impaired can include default or delinquency by a borrower, restructuring of a loan or advance by the Group on terms that the Group would not otherwise consider, indications that a borrower or issuer will enter bankruptcy, the disappearance of an active market for a security, or other observable data relating to a group of assets such as adverse changes in the payment status of borrowers or issuers in the group, or economic conditions that correlate with defaults in the group.
The present value of the estimated future cash flows for loans and other interest bearing financial assets is discounted at the financial asset’s original effective interest rate. If a loan has a variable interest rate, the discount rate for measuring any impairment loss is the current effective interest rate. The calculation of the present value of the estimated future cash flows of a collateralised financial asset reflects the cash flows that may result from foreclosure less costs for obtaining and selling the collateral, whether or not foreclosure is probable.
In addition to specific provisions against individually significant financial assets, the Group also makes collective impairment provisions on groups of financial assets, which although not identified as requiring a specific provision, have a greater risk of default than the risk at initial recognition. Financial assets are grouped on the basis of similar credit risk characteristics that are indicative of the debtors’ ability to pay all amounts due according to the contractual terms and the collective impairment provision is estimated for any such group where credit risk characteristics of the group of financial assets has deteriorated. Factors such as any deterioration in country risk, industry, technological obsolescence as well as identified structural weaknesses or deterioration in cash flows are taken into consideration and the amount of the provision is based on the historical loss pattern within each group, adjusted to reflect current economic changes.
Loans together with the associated allowance are written off when there is no realistic prospect of future recovery and all collateral has been realised or has been transferred to the Group. If, in a subsequent year, the amount of the estimated impairment loss increases or decreases because of an event occurring after the impairment was recognised, the previously recognised impairment loss is increased or reduced by adjusting the allowance account. If a write-off is later recovered, the recovery is credited to the ‘provision for loan losses and others’ in the consolidated statement of income.
(h) Hedge accountingThe Group enters into derivative instruments including futures, forwards, swaps and options to manage exposures to interest rate and foreign currency risks, including exposures arising from forecast transactions. In order to manage particular risks, the Group applies hedge accounting for transactions which meet the specified criteria. Derivatives are stated at fair value. Derivatives with positive market values are included in “Interest receivable and other assets” and derivatives with negative market values are included in “interest payable and other liabilities” in the consolidated balance sheet.
At inception of the hedge relationship, the Group formally designates and documents the relationship between the hedged item and the hedging instrument, including the nature of the risk, management objectives and strategy for undertaking the hedge. The methods that will be used to assess the effectiveness of the hedging relationship form part of the Group’s documentation.
Also at the inception of the hedge relationship, a formal assessment is undertaken to ensure the hedging instrument is expected to be highly effective in offsetting the designated risk in the hedged item. Hedges are formally assessed at each reporting date. A hedge is regarded as highly effective if the changes in fair value or cash flows attributable to the hedged risk during the period for which the hedge is designated were offset in a range of 80% to 125%. For situations where the hedged item is a forecast transaction, the Group assesses whether the transaction is highly probable and presents an exposure to variations in cash flows that could ultimately affect the consolidated statement of income.
For the purposes of hedge accounting, hedges are classified into two categories: (i) fair value hedges which hedge the exposure to changes in the fair value of a recognised asset or liability; and (ii) cash flow hedges which hedge exposure to variability in cash flows that is attributable to a particular risk associated with a recognised asset or liability or a forecasted transaction.
(i) Fair value hedges
For fair value hedges which meet the conditions for hedge accounting, any gain or loss from remeasuring the hedging instrument at fair value is recognised immediately in the consolidated statement of income. The hedged item is adjusted for fair value changes relating to the risk being hedged and the difference is recognised in the consolidated statement of income.
If the hedging instrument expires or is sold, terminated or exercised, or where the hedge no longer meets the criteria for hedge accounting, the hedge relationship is terminated. For hedged items recorded at amortised cost, the difference between the carrying value of the hedged item on termination and the value at which it would have been carried without being hedged is amortised over the remaining term of the original hedge. If the hedged item is derecognised, the unamortised fair value adjustment is recognised immediately in the consolidated statement of income.
58 NOTES TO THE CONSOLIDATED FINANCIAL STATEMENTS 31 December 2013
Ahli United BankAnnual Report 2013
3 ACCOUNTING POLICIES (continued)
3.3 Summary of significant accounting policies (continued)(h) Hedge accounting (continued)(ii) Cash flow hedgesFor cash flow hedges which meet the conditions for hedge accounting, the portion of the gain or loss on the hedging instrument which is determined to be an effective hedge is recognised initially in OCI. The ineffective portion of the fair value of the derivative is recognised immediately in the consolidated statement of income as “trading income”.
The gains or losses on effective cash flow hedges recognised initially in OCI are either transferred to the consolidated statement of income in the period in which the hedged transaction impacts the consolidated statement of income or included in the initial measurement of the related asset or liability.
For hedges which do not qualify for hedge accounting, any gains or losses arising from changes in the fair value of the hedging instrument are recognised in the consolidated statement of income for the year.
Hedge accounting is discontinued when the hedging instrument expires or is sold, terminated or exercised, or no longer qualifies for hedge accounting. In the case of cash flow hedges, the cumulative gain or loss on the hedging instrument recognised in OCI remains in OCI until the forecasted transaction occurs, unless the hedged transaction is no longer expected to occur, in which case the net cumulative gain or loss recognised in equity is transferred to the consolidated statement of income for the year.
(i) Offsetting financial instrumentsFinancial assets and financial liabilities are only offset and the net amount reported in the consolidated balance sheet when there is a currently enforceable legal right to offset the recognised amounts and the Group intends to settle on a net basis.
(j) Revenue recognitionRevenue is recognised to the extent that it is probable that the economic benefits will flow to the Group and the revenue can be reliably measured. The following specific recognition criteria must also be met before revenue is recognised:
(i) Interest income and expenseFor all interest bearing financial instruments, interest income or expense is recorded using the effective interest rate, which is the rate that exactly discounts estimated future cash payments or receipts through the expected life of the financial instrument or a short period, where appropriate, to the net carrying amount of the financial assets or financial liability. Interest that is 90 days or more overdue is excluded from income. Interest on impaired loans and advances and other financial assets is not recognised in consolidated statement of income.
(ii) Fees and commissions incomeCredit origination fees are treated as an integral part of the effective interest rate of financial instruments and are recognised over their lives, except when the underlying risk is sold to a third party at which time it is recognised immediately. Other fees and commissions income are recognised when earned.
(iii) Dividend incomeDividend income is recognised when the right to receive payment is established.
(k) Business combinations, goodwill and other intangible assetsBusiness combinations are accounted for using the purchase method of accounting. Assets and liabilities acquired are recognised at the acquisition date fair values with any excess of the cost of acquisition over the net assets acquired being recognised as goodwill. Changes in parent’s ownership interest in a subsidiary that do not result in loss of control are treated as transactions between equity holders and are reported in equity.
Goodwill acquired in a business combination is initially measured at cost being the excess of the cost of the business combination over the Group’s interest in the net fair value of the identifiable assets, liabilities and contingent liabilities acquired. Following initial recognition, goodwill is reviewed for impairment annually or more frequently if events or changes in circumstances indicate that the carrying value may be impaired. After initial recognition, goodwill is measured at cost less any accumulated impairment losses.
Intangible assets are measured on initial recognition at their fair values on the date of recognition. Following initial recognition, intangible assets are carried at originally recognised values less any accumulated impairment losses.
Impairment of goodwill and intangible assets with indefinite life is determined by assessing the recoverable amount of the cash-generating unit (or group of cash-generating units), to which the goodwill relates. Where the recoverable amount of the cash-generating unit (or group of cash-generating units) is less than the carrying amount, an impairment loss is recognised immediately in the consolidated statement of income.
59 NOTES TO THE CONSOLIDATED FINANCIAL STATEMENTS 31 December 2013
Ahli United BankAnnual Report 2013
For the purpose of impairment testing, goodwill and intangible assets with indefinite life acquired in a business combination is, from the acquisition date, allocated to each of the Group’s cash-generating units, or groups of cash-generating units, that are expected to benefit from the synergies of the combination, irrespective of whether other assets or liabilities of the Group are assigned to those units or groups of units. Each unit or group of units to which the goodwill is allocated:
- represents the lowest level within the Group at which the goodwill is monitored for internal management purposes; and- is not larger than a segment based on either the Group’s primary or the Group’s geographic segment reporting format
determined in accordance with IFRS 8 Operating Segments.(l) Premises and equipmentFreehold land is initially recognised at cost. After initial recognition, freehold land is carried at the revalued amount. The revaluation is carried out periodically by independent professional property valuers. Fair value is determined by reference to market-based evidence. The resultant revaluation surplus is recognised, as a separate component under equity. Revaluation deficit, if any, is recognised in the consolidated statement of income, except that a deficit directly offsetting a previously recognised surplus on the same asset is directly offset against the surplus in the revaluation reserve in equity.
Premises and equipment are stated at cost, less accumulated depreciation.
Depreciation on buildings and other premises and equipment is provided on a straight-line basis over their estimated useful lives.
The estimated useful lives of the assets for the calculation of depreciation are as follows:
Freehold buildings 40 to 50 yearsLeasehold land and buildings Over the lease period Other premises and equipment Up to 10 years
(m) Investment propertyLand and buildings held for the purpose of capital appreciation or for long term rental yields and not occupied by the Group is classified as investment properties. Investment properties are measured at cost less accumulated depreciation (based on an estimated useful life of 30-40 years using the straight line method) and accumulated impairment. Any gains or losses on the retirement or disposal of an investment property are recognised in the consolidated statement of income in the period of retirement or when sale is completed.
(n) Cash and cash equivalentsCash and cash equivalents comprise cash and balances with central banks, excluding mandatory reserve deposits, together with those deposits with banks and other financial institutions and treasury bills having an original maturity of three months or less.
(o) ProvisionsProvisions are recognised when the Group has a present obligation arising from a past event and the costs to settle the obligation are both probable and able to be reliably estimated.
(p) Employee benefitsDefined benefit pension planPension costs are recognised on a systematic basis so that the costs of providing retirement benefits to employees are evenly matched, so far as possible, to the service lives of the employees concerned. Remeasurements of the net defined benefit liability, which comprise actuarial gains and losses, the return on plan assets (excluding interest) and the effect of the asset ceiling (if any, excluding interest) are recognised immediately in OCI.
Defined contribution plansThe Group also operates a defined contribution plan, the costs of which are recognised in the period to which they relate.
(q) TaxesThere is no tax on corporate income in the Kingdom of Bahrain. Taxation on income from foreign entities is provided for in accordance with the fiscal regulations of the countries in which the respective Group entities operate.
Deferred taxation is provided for using the liability method on all temporary differences calculated at the rate at which it is expected to be payable. Deferred tax assets are only recognised if recovery is probable.
(r) Fiduciary assetsAssets held in trust or in a fiduciary capacity are not treated as assets of the Group and, accordingly, are not incorporated in the consolidated balance sheet.
(s) Non-controlling interestsNon-controlling interests represents the portion of profit or loss and net assets in the subsidiaries not attributable to the Bank’s equity shareholders. Any change in Group’s ownership interest in the subsidiary that does not result in a loss of control is accounted as an equity transaction.
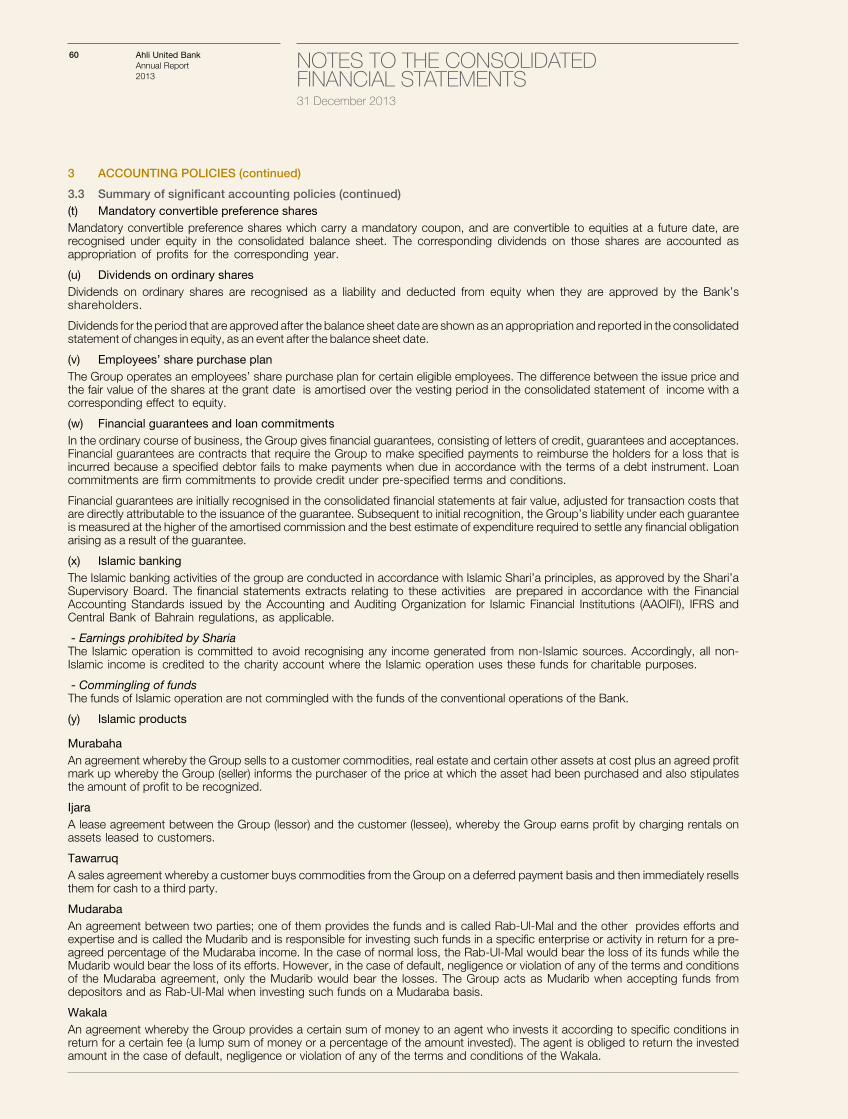
60 NOTES TO THE CONSOLIDATED FINANCIAL STATEMENTS 31 December 2013
Ahli United BankAnnual Report 2013
3 ACCOUNTING POLICIES (continued)
3.3 Summary of significant accounting policies (continued)(t) Mandatory convertible preference sharesMandatory convertible preference shares which carry a mandatory coupon, and are convertible to equities at a future date, are recognised under equity in the consolidated balance sheet. The corresponding dividends on those shares are accounted as appropriation of profits for the corresponding year.
(u) Dividends on ordinary sharesDividends on ordinary shares are recognised as a liability and deducted from equity when they are approved by the Bank’s shareholders.
Dividends for the period that are approved after the balance sheet date are shown as an appropriation and reported in the consolidated statement of changes in equity, as an event after the balance sheet date.
(v) Employees’ share purchase planThe Group operates an employees’ share purchase plan for certain eligible employees. The difference between the issue price and the fair value of the shares at the grant date is amortised over the vesting period in the consolidated statement of income with a corresponding effect to equity.
(w) Financial guarantees and loan commitmentsIn the ordinary course of business, the Group gives financial guarantees, consisting of letters of credit, guarantees and acceptances. Financial guarantees are contracts that require the Group to make specified payments to reimburse the holders for a loss that is incurred because a specified debtor fails to make payments when due in accordance with the terms of a debt instrument. Loan commitments are firm commitments to provide credit under pre-specified terms and conditions.
Financial guarantees are initially recognised in the consolidated financial statements at fair value, adjusted for transaction costs that are directly attributable to the issuance of the guarantee. Subsequent to initial recognition, the Group’s liability under each guarantee is measured at the higher of the amortised commission and the best estimate of expenditure required to settle any financial obligation arising as a result of the guarantee.
(x) Islamic bankingThe Islamic banking activities of the group are conducted in accordance with Islamic Shari’a principles, as approved by the Shari’a Supervisory Board. The financial statements extracts relating to these activities are prepared in accordance with the Financial Accounting Standards issued by the Accounting and Auditing Organization for Islamic Financial Institutions (AAOIFI), IFRS and Central Bank of Bahrain regulations, as applicable.
- Earnings prohibited by ShariaThe Islamic operation is committed to avoid recognising any income generated from non-Islamic sources. Accordingly, all non-Islamic income is credited to the charity account where the Islamic operation uses these funds for charitable purposes.
- Commingling of fundsThe funds of Islamic operation are not commingled with the funds of the conventional operations of the Bank.
(y) Islamic products
MurabahaAn agreement whereby the Group sells to a customer commodities, real estate and certain other assets at cost plus an agreed profit mark up whereby the Group (seller) informs the purchaser of the price at which the asset had been purchased and also stipulates the amount of profit to be recognized.
IjaraA lease agreement between the Group (lessor) and the customer (lessee), whereby the Group earns profit by charging rentals on assets leased to customers.
TawarruqA sales agreement whereby a customer buys commodities from the Group on a deferred payment basis and then immediately resells them for cash to a third party.
MudarabaAn agreement between two parties; one of them provides the funds and is called Rab-Ul-Mal and the other provides efforts and expertise and is called the Mudarib and is responsible for investing such funds in a specific enterprise or activity in return for a pre-agreed percentage of the Mudaraba income. In the case of normal loss, the Rab-Ul-Mal would bear the loss of its funds while the Mudarib would bear the loss of its efforts. However, in the case of default, negligence or violation of any of the terms and conditions of the Mudaraba agreement, only the Mudarib would bear the losses. The Group acts as Mudarib when accepting funds from depositors and as Rab-Ul-Mal when investing such funds on a Mudaraba basis.
WakalaAn agreement whereby the Group provides a certain sum of money to an agent who invests it according to specific conditions in return for a certain fee (a lump sum of money or a percentage of the amount invested). The agent is obliged to return the invested amount in the case of default, negligence or violation of any of the terms and conditions of the Wakala.
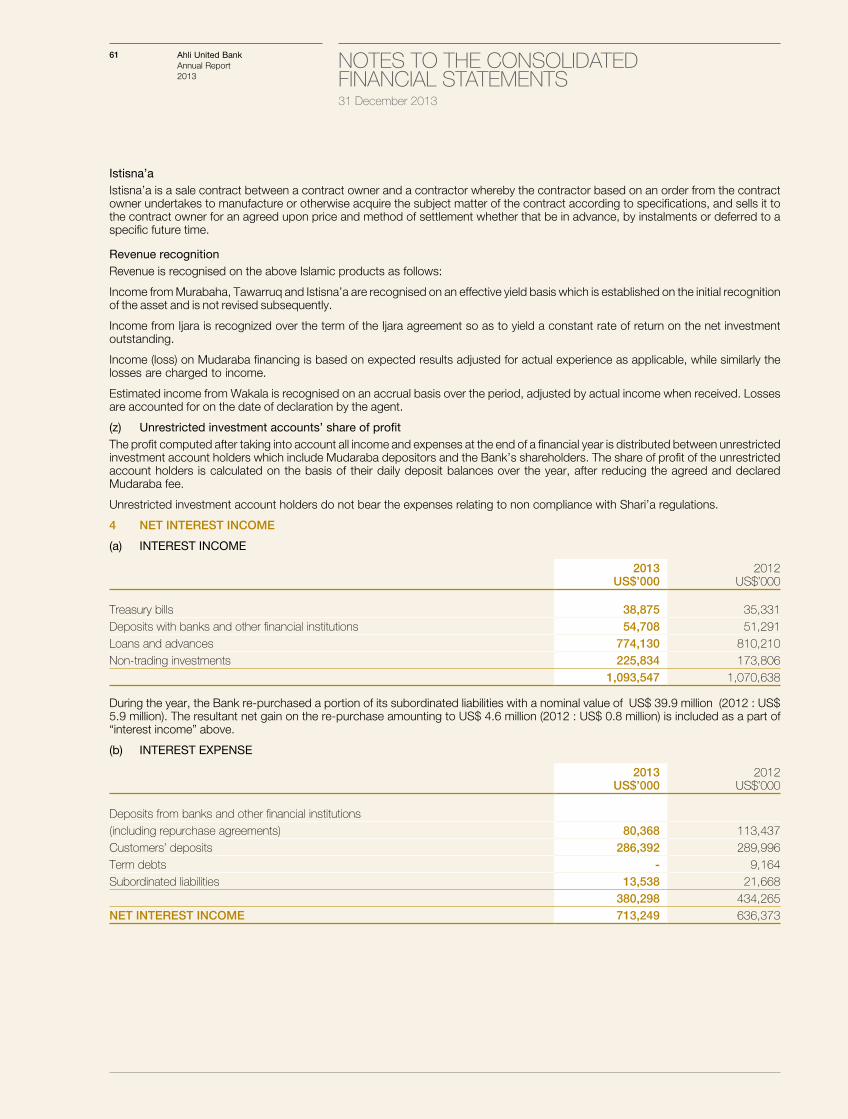
61 NOTES TO THE CONSOLIDATED FINANCIAL STATEMENTS 31 December 2013
Ahli United BankAnnual Report 2013
Istisna’aIstisna’a is a sale contract between a contract owner and a contractor whereby the contractor based on an order from the contract owner undertakes to manufacture or otherwise acquire the subject matter of the contract according to specifications, and sells it to the contract owner for an agreed upon price and method of settlement whether that be in advance, by instalments or deferred to a specific future time.
Revenue recognitionRevenue is recognised on the above Islamic products as follows:
Income from Murabaha, Tawarruq and Istisna’a are recognised on an effective yield basis which is established on the initial recognition of the asset and is not revised subsequently.
Income from Ijara is recognized over the term of the Ijara agreement so as to yield a constant rate of return on the net investment outstanding.
Income (loss) on Mudaraba financing is based on expected results adjusted for actual experience as applicable, while similarly the losses are charged to income.
Estimated income from Wakala is recognised on an accrual basis over the period, adjusted by actual income when received. Losses are accounted for on the date of declaration by the agent.
(z) Unrestricted investment accounts’ share of profitThe profit computed after taking into account all income and expenses at the end of a financial year is distributed between unrestricted investment account holders which include Mudaraba depositors and the Bank’s shareholders. The share of profit of the unrestricted account holders is calculated on the basis of their daily deposit balances over the year, after reducing the agreed and declared Mudaraba fee.
Unrestricted investment account holders do not bear the expenses relating to non compliance with Shari’a regulations.
4 NET INTEREST INCOME
(a) INTEREST INCOME
2013US$’000
2012US$’000
Treasury bills 38,875 35,331Deposits with banks and other financial institutions 54,708 51,291Loans and advances 774,130 810,210Non-trading investments 225,834 173,806
1,093,547 1,070,638
During the year, the Bank re-purchased a portion of its subordinated liabilities with a nominal value of US$ 39.9 million (2012 : US$ 5.9 million). The resultant net gain on the re-purchase amounting to US$ 4.6 million (2012 : US$ 0.8 million) is included as a part of “interest income” above.
(b) INTEREST EXPENSE
2013US$’000
2012US$’000
Deposits from banks and other financial institutions(including repurchase agreements) 80,368 113,437Customers’ deposits 286,392 289,996Term debts - 9,164Subordinated liabilities 13,538 21,668
380,298 434,265NET INTEREST INCOME 713,249 636,373
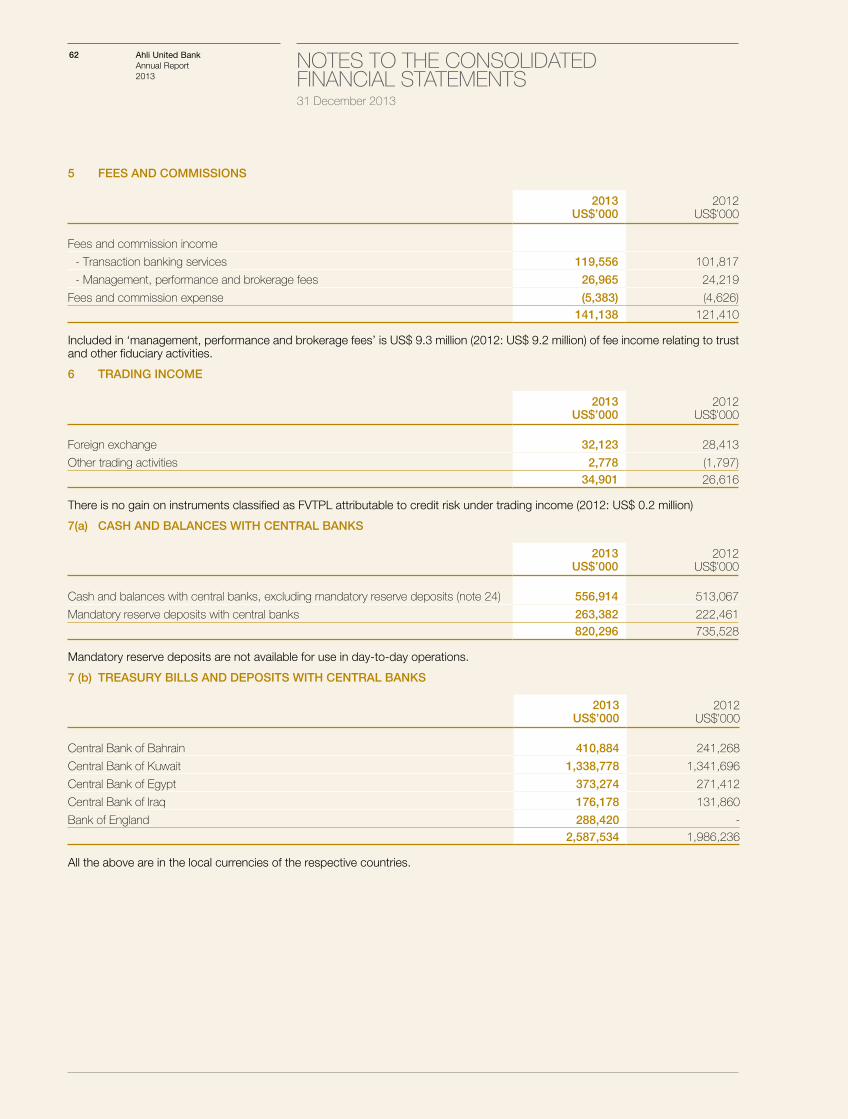
62 NOTES TO THE CONSOLIDATED FINANCIAL STATEMENTS 31 December 2013
Ahli United BankAnnual Report 2013
5 FEES AND COMMISSIONS
2013US$’000
2012US$’000
Fees and commission income
- Transaction banking services 119,556 101,817
- Management, performance and brokerage fees 26,965 24,219
Fees and commission expense (5,383) (4,626)141,138 121,410
Included in ‘management, performance and brokerage fees’ is US$ 9.3 million (2012: US$ 9.2 million) of fee income relating to trust and other fiduciary activities.
6 TRADING INCOME
2013US$’000
2012US$’000
Foreign exchange 32,123 28,413
Other trading activities 2,778 (1,797)34,901 26,616
There is no gain on instruments classified as FVTPL attributable to credit risk under trading income (2012: US$ 0.2 million)
7(a) CASH AND BALANCES WITH CENTRAL BANKS
2013US$’000
2012US$’000
Cash and balances with central banks, excluding mandatory reserve deposits (note 24) 556,914 513,067
Mandatory reserve deposits with central banks 263,382 222,461820,296 735,528
Mandatory reserve deposits are not available for use in day-to-day operations.
7 (b) TREASURY BILLS AND DEPOSITS WITH CENTRAL BANKS
2013US$’000
2012US$’000
Central Bank of Bahrain 410,884 241,268
Central Bank of Kuwait 1,338,778 1,341,696
Central Bank of Egypt 373,274 271,412
Central Bank of Iraq 176,178 131,860
Bank of England 288,420 -2,587,534 1,986,236
All the above are in the local currencies of the respective countries.
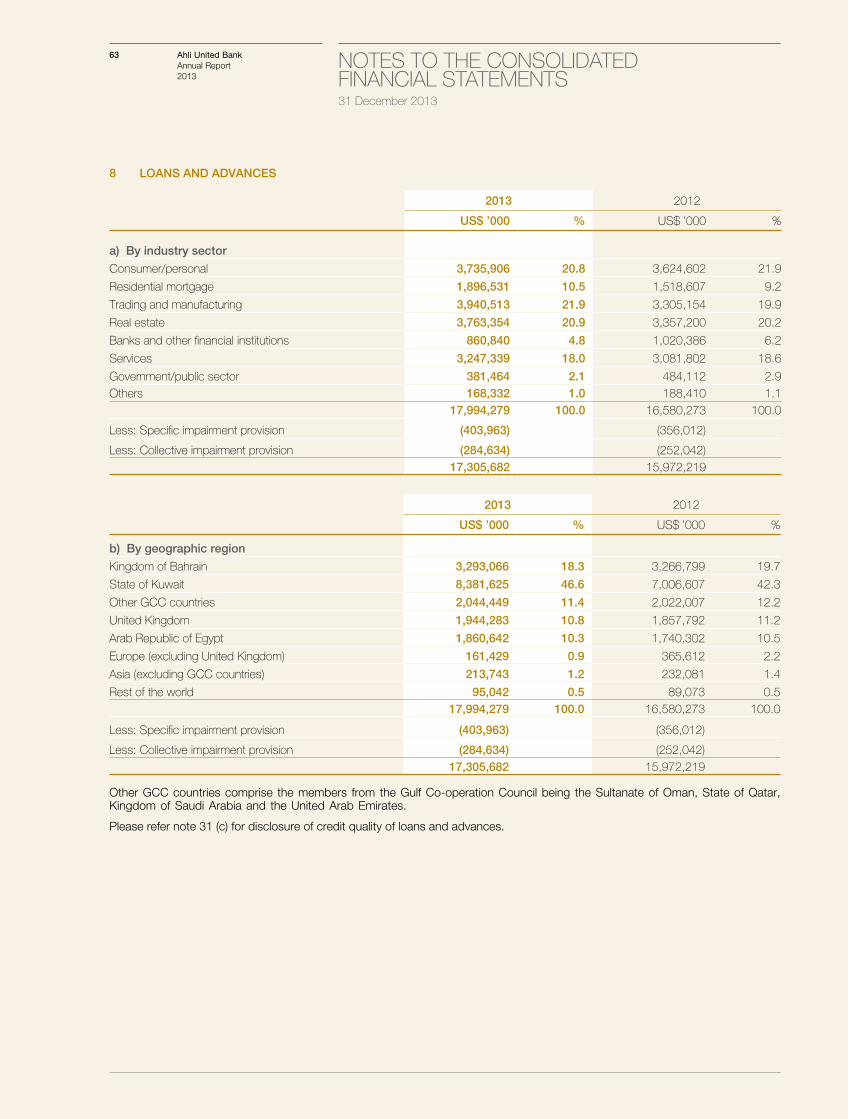
63 NOTES TO THE CONSOLIDATED FINANCIAL STATEMENTS 31 December 2013
Ahli United BankAnnual Report 2013
8 LOANS AND ADVANCES
2013 2012
US$ ’000 % US$ ’000 %
a) By industry sector
Consumer/personal 3,735,906 20.8 3,624,602 21.9
Residential mortgage 1,896,531 10.5 1,518,607 9.2
Trading and manufacturing 3,940,513 21.9 3,305,154 19.9
Real estate 3,763,354 20.9 3,357,200 20.2
Banks and other financial institutions 860,840 4.8 1,020,386 6.2
Services 3,247,339 18.0 3,081,802 18.6
Government/public sector 381,464 2.1 484,112 2.9Others 168,332 1.0 188,410 1.1
17,994,279 100.0 16,580,273 100.0
Less: Specific impairment provision (403,963) (356,012)
Less: Collective impairment provision (284,634) (252,042)17,305,682 15,972,219
2013 2012
US$ ’000 % US$ ’000 %
b) By geographic region
Kingdom of Bahrain 3,293,066 18.3 3,266,799 19.7
State of Kuwait 8,381,625 46.6 7,006,607 42.3
Other GCC countries 2,044,449 11.4 2,022,007 12.2
United Kingdom 1,944,283 10.8 1,857,792 11.2
Arab Republic of Egypt 1,860,642 10.3 1,740,302 10.5
Europe (excluding United Kingdom) 161,429 0.9 365,612 2.2
Asia (excluding GCC countries) 213,743 1.2 232,081 1.4
Rest of the world 95,042 0.5 89,073 0.517,994,279 100.0 16,580,273 100.0
Less: Specific impairment provision (403,963) (356,012)
Less: Collective impairment provision (284,634) (252,042)17,305,682 15,972,219
Other GCC countries comprise the members from the Gulf Co-operation Council being the Sultanate of Oman, State of Qatar, Kingdom of Saudi Arabia and the United Arab Emirates.
Please refer note 31 (c) for disclosure of credit quality of loans and advances.
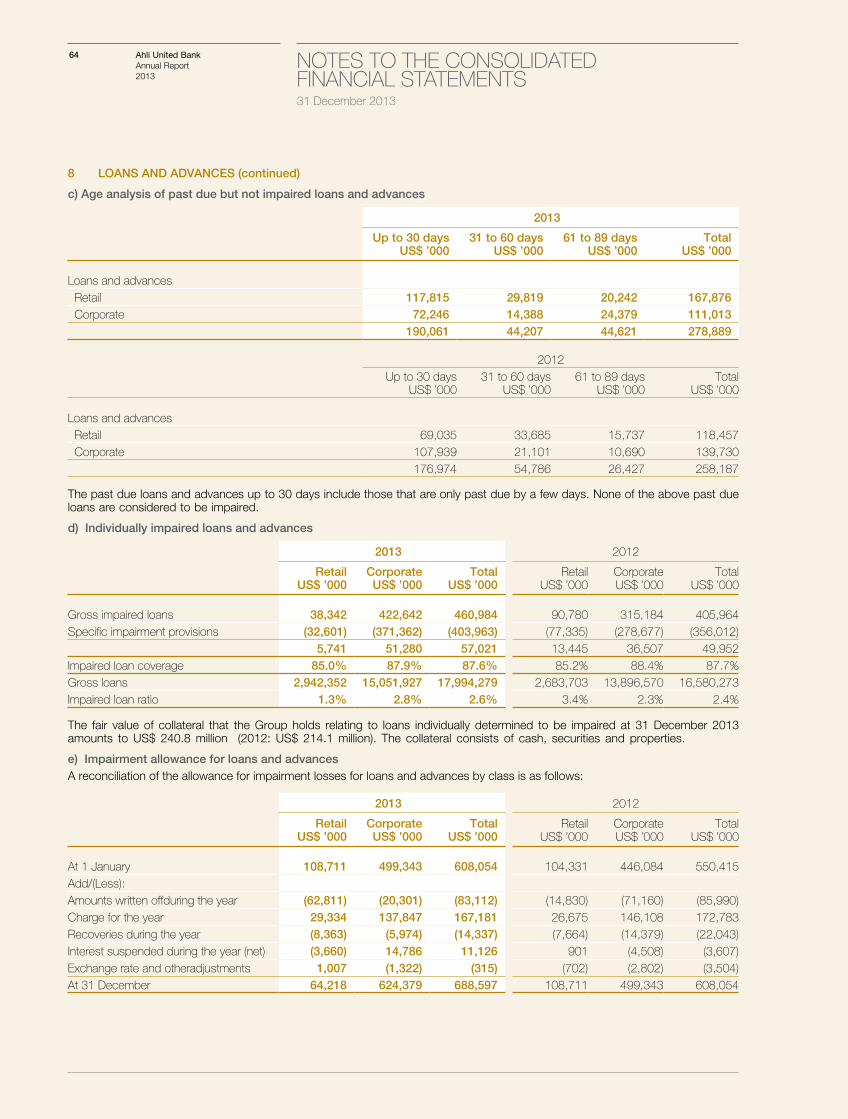
64 NOTES TO THE CONSOLIDATED FINANCIAL STATEMENTS 31 December 2013
Ahli United BankAnnual Report 2013
8 LOANS AND ADVANCES (continued)
c) Age analysis of past due but not impaired loans and advances
2013
Up to 30 daysUS$ ’000
31 to 60 daysUS$ ’000
61 to 89 daysUS$ ’000
TotalUS$ ’000
Loans and advances Retail 117,815 29,819 20,242 167,876 Corporate 72,246 14,388 24,379 111,013
190,061 44,207 44,621 278,889
2012Up to 30 days
US$ ’00031 to 60 days
US$ ’00061 to 89 days
US$ ’000Total
US$ ’000
Loans and advances Retail 69,035 33,685 15,737 118,457 Corporate 107,939 21,101 10,690 139,730
176,974 54,786 26,427 258,187
The past due loans and advances up to 30 days include those that are only past due by a few days. None of the above past due loans are considered to be impaired.
d) Individually impaired loans and advances
2013 2012
Retail US$ ’000
Corporate US$ ’000
Total US$ ’000
RetailUS$ ’000
CorporateUS$ ’000
TotalUS$ ’000
Gross impaired loans 38,342 422,642 460,984 90,780 315,184 405,964Specific impairment provisions (32,601) (371,362) (403,963) (77,335) (278,677) (356,012)
5,741 51,280 57,021 13,445 36,507 49,952Impaired loan coverage 85.0% 87.9% 87.6% 85.2% 88.4% 87.7%Gross loans 2,942,352 15,051,927 17,994,279 2,683,703 13,896,570 16,580,273Impaired loan ratio 1.3% 2.8% 2.6% 3.4% 2.3% 2.4%
The fair value of collateral that the Group holds relating to loans individually determined to be impaired at 31 December 2013 amounts to US$ 240.8 million (2012: US$ 214.1 million). The collateral consists of cash, securities and properties.
e) Impairment allowance for loans and advances A reconciliation of the allowance for impairment losses for loans and advances by class is as follows:
2013 2012
Retail US$ ’000
Corporate US$ ’000
Total US$ ’000
RetailUS$ ’000
CorporateUS$ ’000
TotalUS$ ’000
At 1 January 108,711 499,343 608,054 104,331 446,084 550,415Add/(Less):Amounts written offduring the year (62,811) (20,301) (83,112) (14,830) (71,160) (85,990)Charge for the year 29,334 137,847 167,181 26,675 146,108 172,783Recoveries during the year (8,363) (5,974) (14,337) (7,664) (14,379) (22,043)Interest suspended during the year (net) (3,660) 14,786 11,126 901 (4,508) (3,607)Exchange rate and otheradjustments 1,007 (1,322) (315) (702) (2,802) (3,504)At 31 December 64,218 624,379 688,597 108,711 499,343 608,054
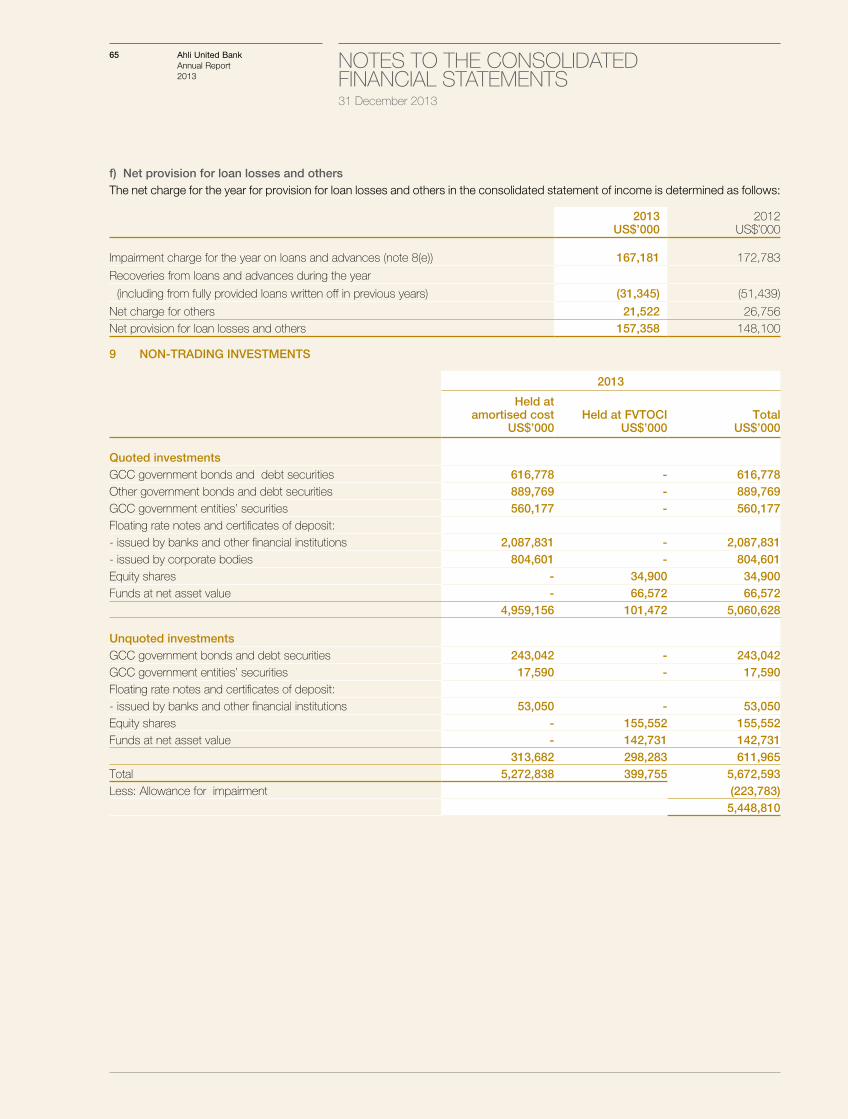
65 NOTES TO THE CONSOLIDATED FINANCIAL STATEMENTS 31 December 2013
Ahli United BankAnnual Report 2013
f) Net provision for loan losses and othersThe net charge for the year for provision for loan losses and others in the consolidated statement of income is determined as follows:
2013US$’000
2012US$’000
Impairment charge for the year on loans and advances (note 8(e)) 167,181 172,783
Recoveries from loans and advances during the year
(including from fully provided loans written off in previous years) (31,345) (51,439)
Net charge for others 21,522 26,756Net provision for loan losses and others 157,358 148,100
9 NON-TRADING INVESTMENTS
2013
Held at amortised cost
US$’000Held at FVTOCI
US$’000Total
US$’000
Quoted investmentsGCC government bonds and debt securities 616,778 - 616,778Other government bonds and debt securities 889,769 - 889,769GCC government entities’ securities 560,177 - 560,177Floating rate notes and certificates of deposit:- issued by banks and other financial institutions 2,087,831 - 2,087,831- issued by corporate bodies 804,601 - 804,601Equity shares - 34,900 34,900Funds at net asset value - 66,572 66,572
4,959,156 101,472 5,060,628
Unquoted investmentsGCC government bonds and debt securities 243,042 - 243,042GCC government entities’ securities 17,590 - 17,590Floating rate notes and certificates of deposit:- issued by banks and other financial institutions 53,050 - 53,050Equity shares - 155,552 155,552Funds at net asset value - 142,731 142,731
313,682 298,283 611,965Total 5,272,838 399,755 5,672,593Less: Allowance for impairment (223,783)
5,448,810
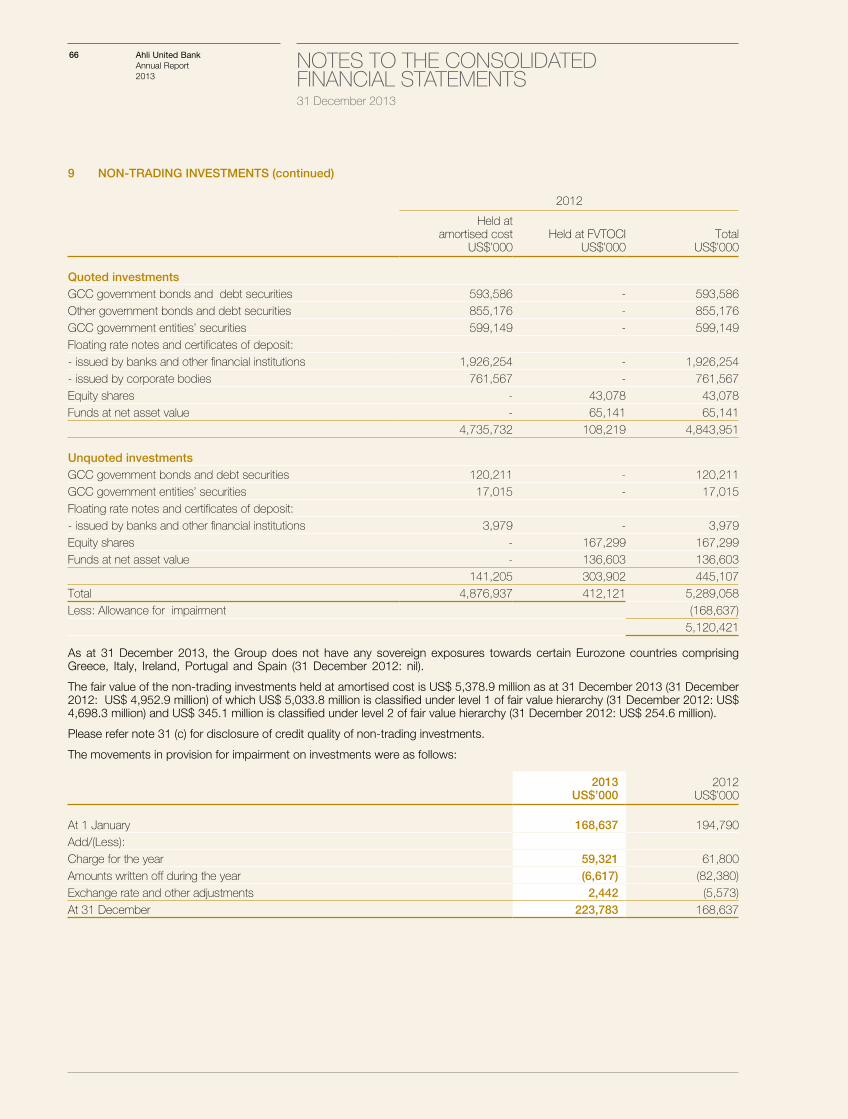
66 NOTES TO THE CONSOLIDATED FINANCIAL STATEMENTS 31 December 2013
Ahli United BankAnnual Report 2013
9 NON-TRADING INVESTMENTS (continued)
2012
Held at amortised cost
US$’000Held at FVTOCI
US$’000Total
US$’000
Quoted investmentsGCC government bonds and debt securities 593,586 - 593,586Other government bonds and debt securities 855,176 - 855,176GCC government entities’ securities 599,149 - 599,149Floating rate notes and certificates of deposit:- issued by banks and other financial institutions 1,926,254 - 1,926,254- issued by corporate bodies 761,567 - 761,567Equity shares - 43,078 43,078Funds at net asset value - 65,141 65,141
4,735,732 108,219 4,843,951
Unquoted investmentsGCC government bonds and debt securities 120,211 - 120,211GCC government entities’ securities 17,015 - 17,015Floating rate notes and certificates of deposit:- issued by banks and other financial institutions 3,979 - 3,979Equity shares - 167,299 167,299Funds at net asset value - 136,603 136,603
141,205 303,902 445,107Total 4,876,937 412,121 5,289,058Less: Allowance for impairment (168,637)
5,120,421
As at 31 December 2013, the Group does not have any sovereign exposures towards certain Eurozone countries comprising Greece, Italy, Ireland, Portugal and Spain (31 December 2012: nil).
The fair value of the non-trading investments held at amortised cost is US$ 5,378.9 million as at 31 December 2013 (31 December 2012: US$ 4,952.9 million) of which US$ 5,033.8 million is classified under level 1 of fair value hierarchy (31 December 2012: US$ 4,698.3 million) and US$ 345.1 million is classified under level 2 of fair value hierarchy (31 December 2012: US$ 254.6 million).
Please refer note 31 (c) for disclosure of credit quality of non-trading investments.
The movements in provision for impairment on investments were as follows:
2013US$’000
2012US$’000
At 1 January 168,637 194,790Add/(Less):Charge for the year 59,321 61,800Amounts written off during the year (6,617) (82,380)Exchange rate and other adjustments 2,442 (5,573)At 31 December 223,783 168,637
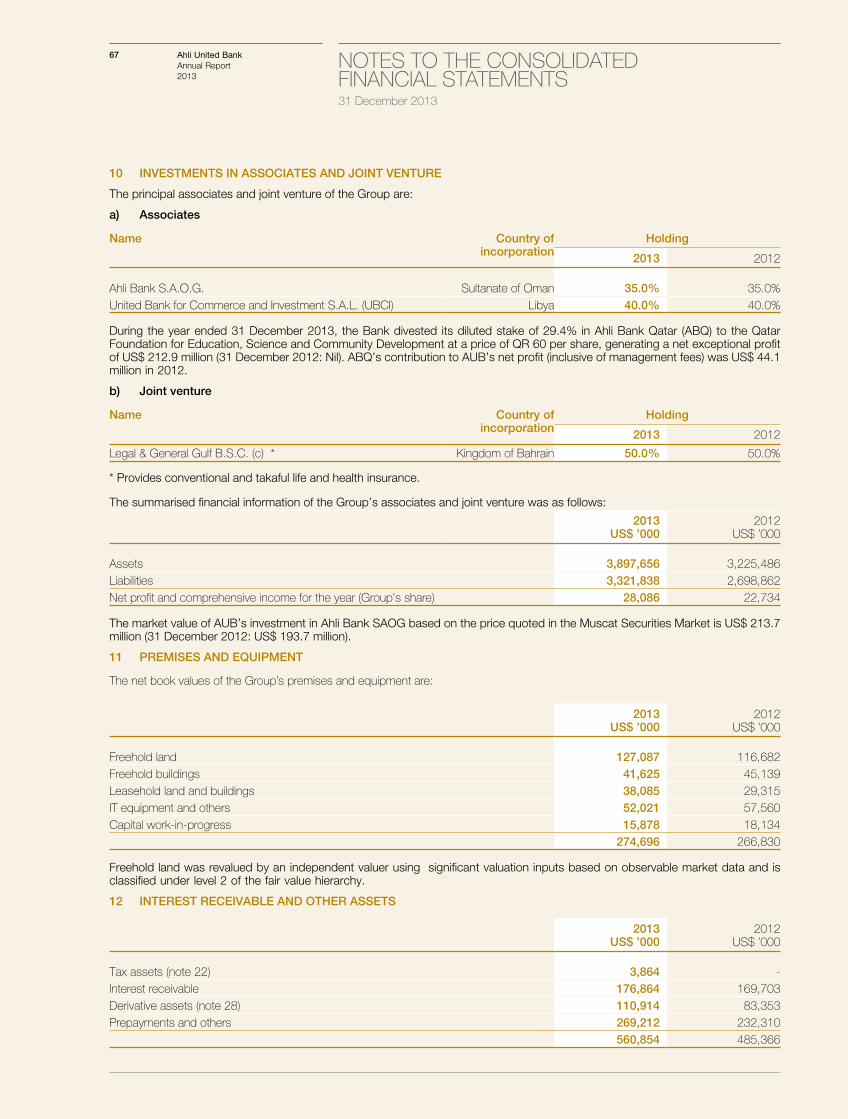
67 NOTES TO THE CONSOLIDATED FINANCIAL STATEMENTS 31 December 2013
Ahli United BankAnnual Report 2013
10 INVESTMENTS IN ASSOCIATES AND JOINT VENTURE
The principal associates and joint venture of the Group are:
a) Associates
Name Country of incorporation
Holding
2013 2012
Ahli Bank S.A.O.G. Sultanate of Oman 35.0% 35.0%United Bank for Commerce and Investment S.A.L. (UBCI) Libya 40.0% 40.0%
During the year ended 31 December 2013, the Bank divested its diluted stake of 29.4% in Ahli Bank Qatar (ABQ) to the Qatar Foundation for Education, Science and Community Development at a price of QR 60 per share, generating a net exceptional profit of US$ 212.9 million (31 December 2012: Nil). ABQ’s contribution to AUB’s net profit (inclusive of management fees) was US$ 44.1 million in 2012.
b) Joint venture
Name Country of incorporation
Holding
2013 2012
Legal & General Gulf B.S.C. (c) * Kingdom of Bahrain 50.0% 50.0%
* Provides conventional and takaful life and health insurance.
The summarised financial information of the Group’s associates and joint venture was as follows:
2013US$ ’000
2012US$ ’000
Assets 3,897,656 3,225,486Liabilities 3,321,838 2,698,862Net profit and comprehensive income for the year (Group’s share) 28,086 22,734
The market value of AUB’s investment in Ahli Bank SAOG based on the price quoted in the Muscat Securities Market is US$ 213.7 million (31 December 2012: US$ 193.7 million).
11 PREMISES AND EQUIPMENT
The net book values of the Group’s premises and equipment are:
2013US$ ’000
2012US$ ’000
Freehold land 127,087 116,682Freehold buildings 41,625 45,139Leasehold land and buildings 38,085 29,315IT equipment and others 52,021 57,560Capital work-in-progress 15,878 18,134
274,696 266,830
Freehold land was revalued by an independent valuer using significant valuation inputs based on observable market data and is classified under level 2 of the fair value hierarchy.
12 INTEREST RECEIVABLE AND OTHER ASSETS
2013US$ ’000
2012US$ ’000
Tax assets (note 22) 3,864 -Interest receivable 176,864 169,703Derivative assets (note 28) 110,914 83,353Prepayments and others 269,212 232,310
560,854 485,366
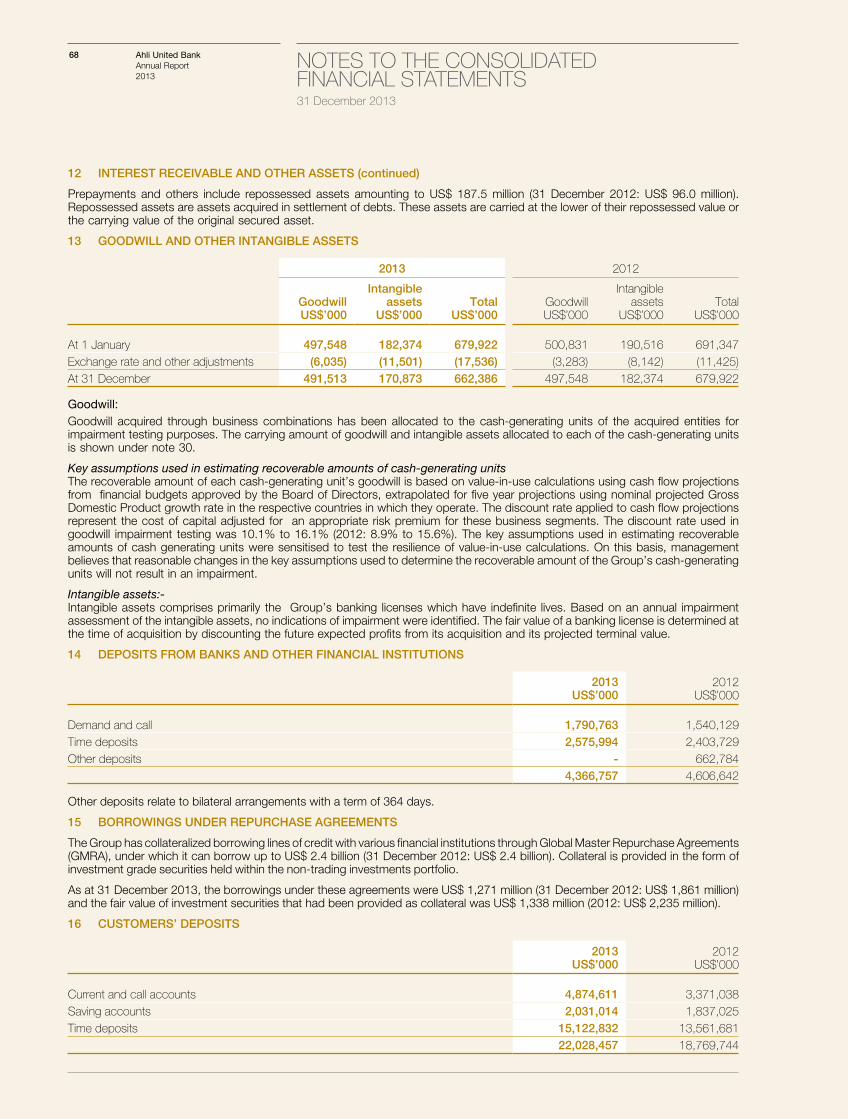
68 NOTES TO THE CONSOLIDATED FINANCIAL STATEMENTS 31 December 2013
Ahli United BankAnnual Report 2013
12 INTEREST RECEIVABLE AND OTHER ASSETS (continued)
Prepayments and others include repossessed assets amounting to US$ 187.5 million (31 December 2012: US$ 96.0 million). Repossessed assets are assets acquired in settlement of debts. These assets are carried at the lower of their repossessed value or the carrying value of the original secured asset.
13 GOODWILL AND OTHER INTANGIBLE ASSETS
2013 2012
GoodwillUS$’000
Intangible assets
US$’000Total
US$’000GoodwillUS$’000
Intangible assets
US$’000Total
US$’000
At 1 January 497,548 182,374 679,922 500,831 190,516 691,347Exchange rate and other adjustments (6,035) (11,501) (17,536) (3,283) (8,142) (11,425)At 31 December 491,513 170,873 662,386 497,548 182,374 679,922
Goodwill:Goodwill acquired through business combinations has been allocated to the cash-generating units of the acquired entities for impairment testing purposes. The carrying amount of goodwill and intangible assets allocated to each of the cash-generating units is shown under note 30.
Key assumptions used in estimating recoverable amounts of cash-generating units The recoverable amount of each cash-generating unit’s goodwill is based on value-in-use calculations using cash flow projections from financial budgets approved by the Board of Directors, extrapolated for five year projections using nominal projected Gross Domestic Product growth rate in the respective countries in which they operate. The discount rate applied to cash flow projections represent the cost of capital adjusted for an appropriate risk premium for these business segments. The discount rate used in goodwill impairment testing was 10.1% to 16.1% (2012: 8.9% to 15.6%). The key assumptions used in estimating recoverable amounts of cash generating units were sensitised to test the resilience of value-in-use calculations. On this basis, management believes that reasonable changes in the key assumptions used to determine the recoverable amount of the Group’s cash-generating units will not result in an impairment.
Intangible assets:-Intangible assets comprises primarily the Group’s banking licenses which have indefinite lives. Based on an annual impairment assessment of the intangible assets, no indications of impairment were identified. The fair value of a banking license is determined at the time of acquisition by discounting the future expected profits from its acquisition and its projected terminal value.
14 DEPOSITS FROM BANKS AND OTHER FINANCIAL INSTITUTIONS
2013US$’000
2012US$’000
Demand and call 1,790,763 1,540,129Time deposits 2,575,994 2,403,729Other deposits - 662,784
4,366,757 4,606,642
Other deposits relate to bilateral arrangements with a term of 364 days.
15 BORROWINGS UNDER REPURCHASE AGREEMENTS
The Group has collateralized borrowing lines of credit with various financial institutions through Global Master Repurchase Agreements (GMRA), under which it can borrow up to US$ 2.4 billion (31 December 2012: US$ 2.4 billion). Collateral is provided in the form of investment grade securities held within the non-trading investments portfolio.
As at 31 December 2013, the borrowings under these agreements were US$ 1,271 million (31 December 2012: US$ 1,861 million) and the fair value of investment securities that had been provided as collateral was US$ 1,338 million (2012: US$ 2,235 million).
16 CUSTOMERS’ DEPOSITS
2013US$’000
2012US$’000
Current and call accounts 4,874,611 3,371,038Saving accounts 2,031,014 1,837,025Time deposits 15,122,832 13,561,681
22,028,457 18,769,744
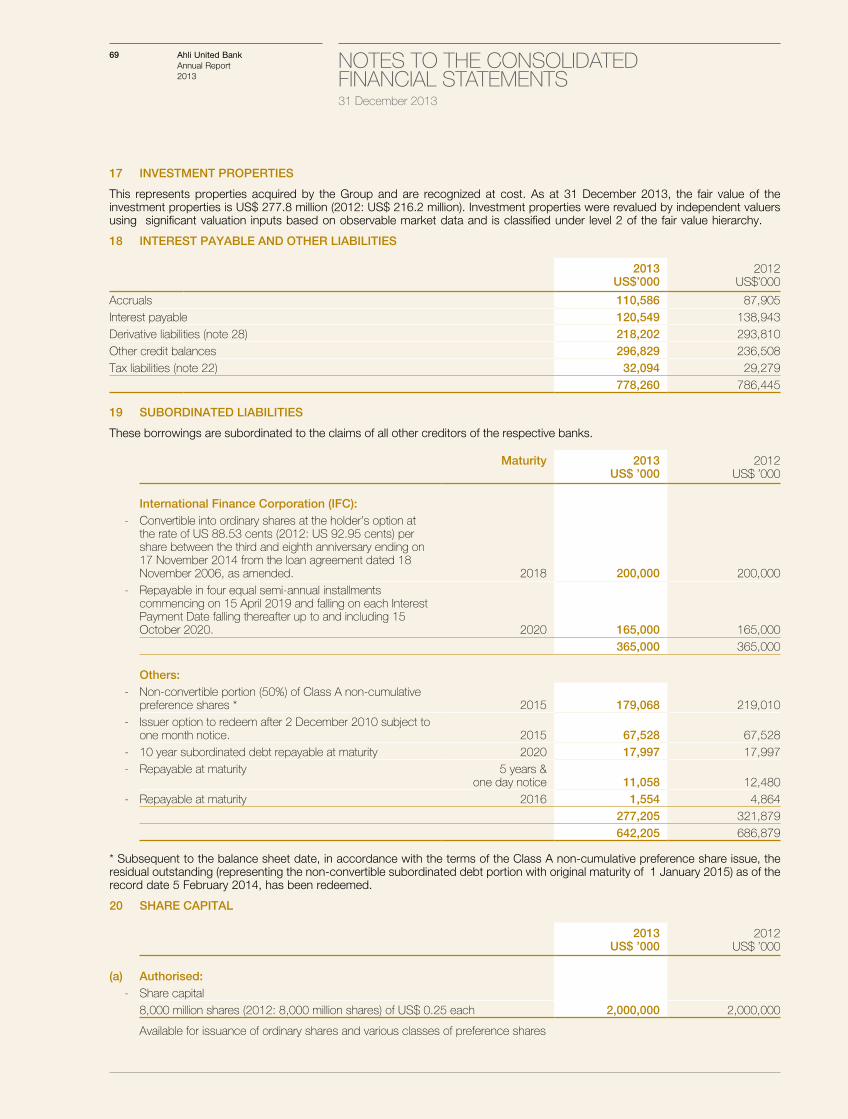
69 NOTES TO THE CONSOLIDATED FINANCIAL STATEMENTS 31 December 2013
Ahli United BankAnnual Report 2013
17 INVESTMENT PROPERTIES
This represents properties acquired by the Group and are recognized at cost. As at 31 December 2013, the fair value of the investment properties is US$ 277.8 million (2012: US$ 216.2 million). Investment properties were revalued by independent valuers using significant valuation inputs based on observable market data and is classified under level 2 of the fair value hierarchy.
18 INTEREST PAYABLE AND OTHER LIABILITIES
2013US$’000
2012US$’000
Accruals 110,586 87,905Interest payable 120,549 138,943Derivative liabilities (note 28) 218,202 293,810Other credit balances 296,829 236,508Tax liabilities (note 22) 32,094 29,279
778,260 786,445
19 SUBORDINATED LIABILITIES
These borrowings are subordinated to the claims of all other creditors of the respective banks.
Maturity 2013US$ ’000
2012US$ ’000
International Finance Corporation (IFC):- Convertible into ordinary shares at the holder’s option at
the rate of US 88.53 cents (2012: US 92.95 cents) per share between the third and eighth anniversary ending on 17 November 2014 from the loan agreement dated 18 November 2006, as amended. 2018 200,000 200,000
- Repayable in four equal semi-annual installments commencing on 15 April 2019 and falling on each Interest Payment Date falling thereafter up to and including 15 October 2020. 2020 165,000 165,000
365,000 365,000
Others:- Non-convertible portion (50%) of Class A non-cumulative
preference shares * 2015 179,068 219,010- Issuer option to redeem after 2 December 2010 subject to
one month notice. 2015 67,528 67,528- 10 year subordinated debt repayable at maturity 2020 17,997 17,997- Repayable at maturity 5 years &
one day notice 11,058 12,480- Repayable at maturity 2016 1,554 4,864
277,205 321,879642,205 686,879
* Subsequent to the balance sheet date, in accordance with the terms of the Class A non-cumulative preference share issue, the residual outstanding (representing the non-convertible subordinated debt portion with original maturity of 1 January 2015) as of the record date 5 February 2014, has been redeemed.
20 SHARE CAPITAL
2013US$ ’000
2012US$ ’000
(a) Authorised:- Share capital
8,000 million shares (2012: 8,000 million shares) of US$ 0.25 each 2,000,000 2,000,000
Available for issuance of ordinary shares and various classes of preference shares
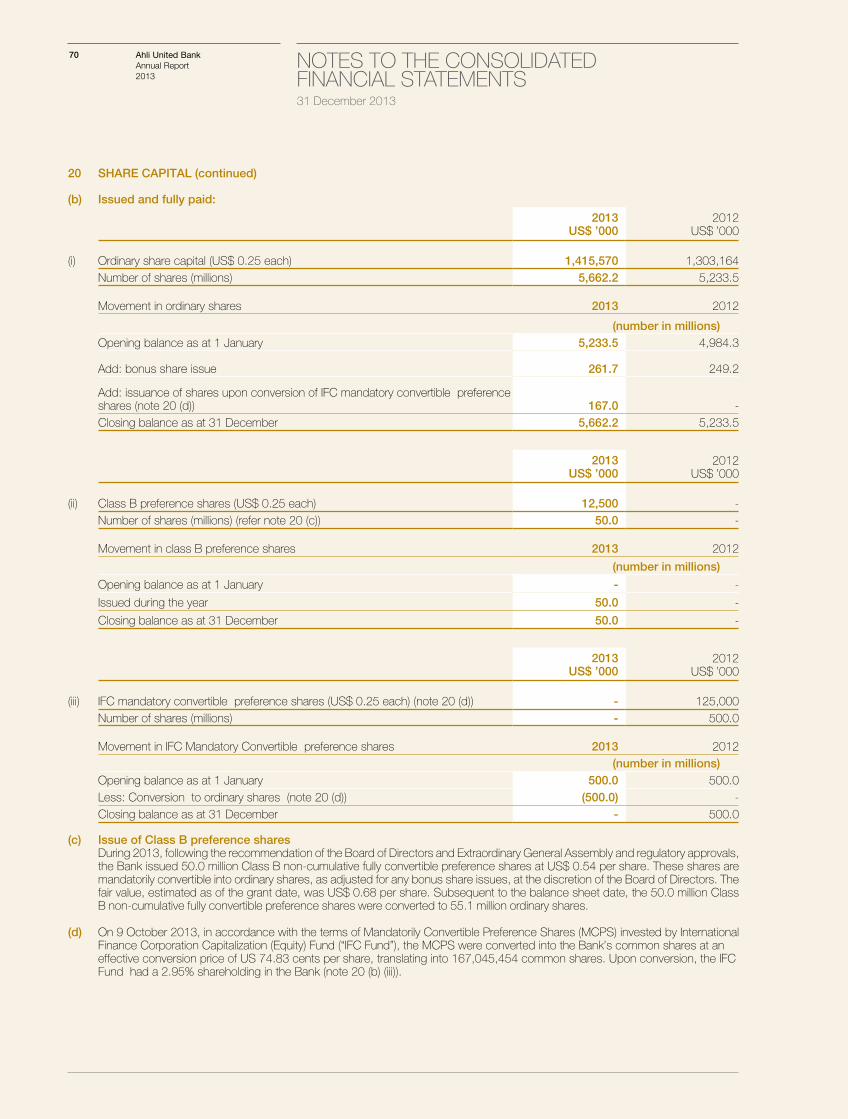
70 NOTES TO THE CONSOLIDATED FINANCIAL STATEMENTS 31 December 2013
Ahli United BankAnnual Report 2013
20 SHARE CAPITAL (continued)
(b) Issued and fully paid:
2013US$ ’000
2012US$ ’000
(i) Ordinary share capital (US$ 0.25 each) 1,415,570 1,303,164Number of shares (millions) 5,662.2 5,233.5
Movement in ordinary shares 2013 2012
(number in millions)Opening balance as at 1 January 5,233.5 4,984.3
Add: bonus share issue 261.7 249.2
Add: issuance of shares upon conversion of IFC mandatory convertible preference shares (note 20 (d)) 167.0 -Closing balance as at 31 December 5,662.2 5,233.5
2013US$ ’000
2012US$ ’000
(ii) Class B preference shares (US$ 0.25 each) 12,500 -Number of shares (millions) (refer note 20 (c)) 50.0 -
Movement in class B preference shares 2013 2012
(number in millions)
Opening balance as at 1 January - -
Issued during the year 50.0 -
Closing balance as at 31 December 50.0 -
2013US$ ’000
2012US$ ’000
(iii) IFC mandatory convertible preference shares (US$ 0.25 each) (note 20 (d)) - 125,000Number of shares (millions) - 500.0
Movement in IFC Mandatory Convertible preference shares 2013 2012(number in millions)
Opening balance as at 1 January 500.0 500.0Less: Conversion to ordinary shares (note 20 (d)) (500.0) -Closing balance as at 31 December - 500.0
(c) Issue of Class B preference sharesDuring 2013, following the recommendation of the Board of Directors and Extraordinary General Assembly and regulatory approvals, the Bank issued 50.0 million Class B non-cumulative fully convertible preference shares at US$ 0.54 per share. These shares are mandatorily convertible into ordinary shares, as adjusted for any bonus share issues, at the discretion of the Board of Directors. The fair value, estimated as of the grant date, was US$ 0.68 per share. Subsequent to the balance sheet date, the 50.0 million Class B non-cumulative fully convertible preference shares were converted to 55.1 million ordinary shares.
(d) On 9 October 2013, in accordance with the terms of Mandatorily Convertible Preference Shares (MCPS) invested by International Finance Corporation Capitalization (Equity) Fund (“IFC Fund”), the MCPS were converted into the Bank’s common shares at an effective conversion price of US 74.83 cents per share, translating into 167,045,454 common shares. Upon conversion, the IFC Fund had a 2.95% shareholding in the Bank (note 20 (b) (iii)).
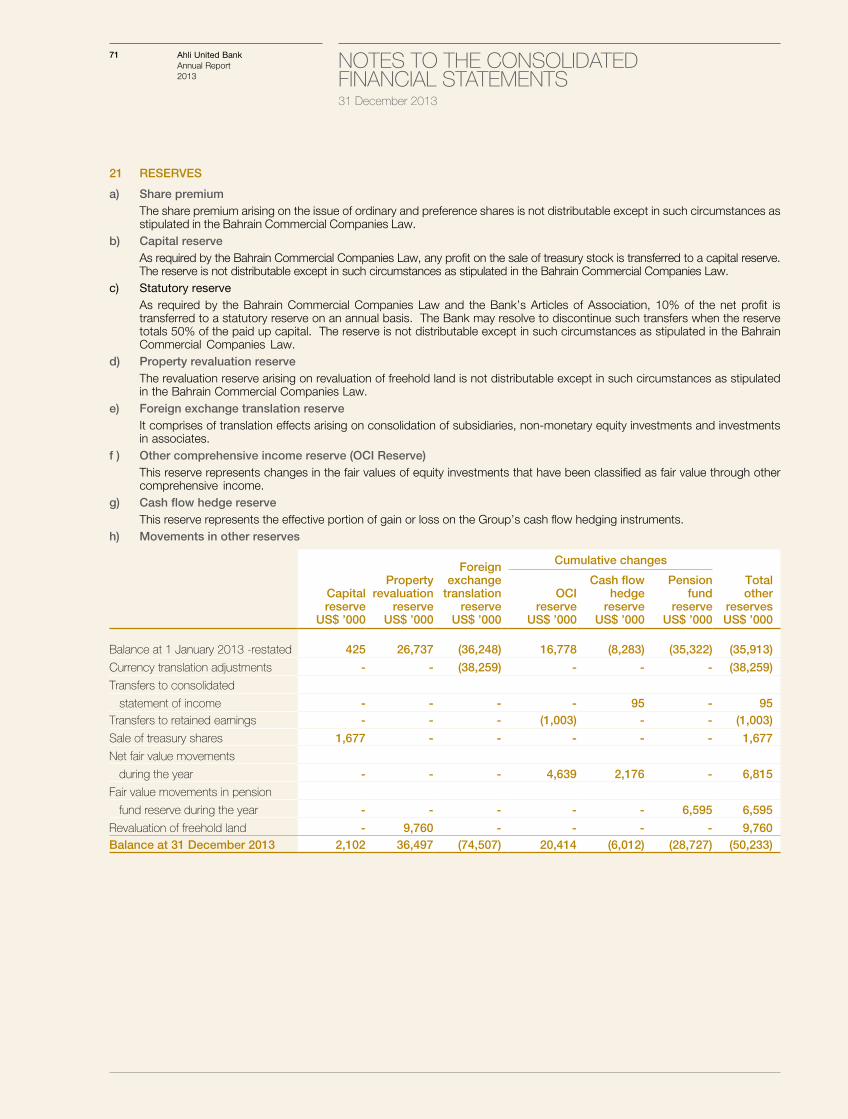
71 NOTES TO THE CONSOLIDATED FINANCIAL STATEMENTS 31 December 2013
Ahli United BankAnnual Report 2013
21 RESERVES
a) Share premiumThe share premium arising on the issue of ordinary and preference shares is not distributable except in such circumstances as stipulated in the Bahrain Commercial Companies Law.
b) Capital reserveAs required by the Bahrain Commercial Companies Law, any profit on the sale of treasury stock is transferred to a capital reserve. The reserve is not distributable except in such circumstances as stipulated in the Bahrain Commercial Companies Law.
c) Statutory reserveAs required by the Bahrain Commercial Companies Law and the Bank’s Articles of Association, 10% of the net profit is transferred to a statutory reserve on an annual basis. The Bank may resolve to discontinue such transfers when the reserve totals 50% of the paid up capital. The reserve is not distributable except in such circumstances as stipulated in the Bahrain Commercial Companies Law.
d) Property revaluation reserveThe revaluation reserve arising on revaluation of freehold land is not distributable except in such circumstances as stipulated in the Bahrain Commercial Companies Law.
e) Foreign exchange translation reserveIt comprises of translation effects arising on consolidation of subsidiaries, non-monetary equity investments and investments in associates.
f ) Other comprehensive income reserve (OCI Reserve)This reserve represents changes in the fair values of equity investments that have been classified as fair value through other comprehensive income.
g) Cash flow hedge reserveThis reserve represents the effective portion of gain or loss on the Group’s cash flow hedging instruments.
h) Movements in other reserves
Capitalreserve
US$ ’000
Propertyrevaluation
reserveUS$ ’000
Foreign exchange
translationreserve
US$ ’000
Cumulative changes
Totalother
reservesUS$ ’000
OCIreserve
US$ ’000
Cash flowhedge
reserveUS$ ’000
Pension fund
reserveUS$ ’000
Balance at 1 January 2013 -restated 425 26,737 (36,248) 16,778 (8,283) (35,322) (35,913)
Currency translation adjustments - - (38,259) - - - (38,259)
Transfers to consolidated
statement of income - - - - 95 - 95Transfers to retained earnings - - - (1,003) - - (1,003)
Sale of treasury shares 1,677 - - - - - 1,677
Net fair value movements
during the year - - - 4,639 2,176 - 6,815
Fair value movements in pension
fund reserve during the year - - - - - 6,595 6,595
Revaluation of freehold land - 9,760 - - - - 9,760Balance at 31 December 2013 2,102 36,497 (74,507) 20,414 (6,012) (28,727) (50,233)
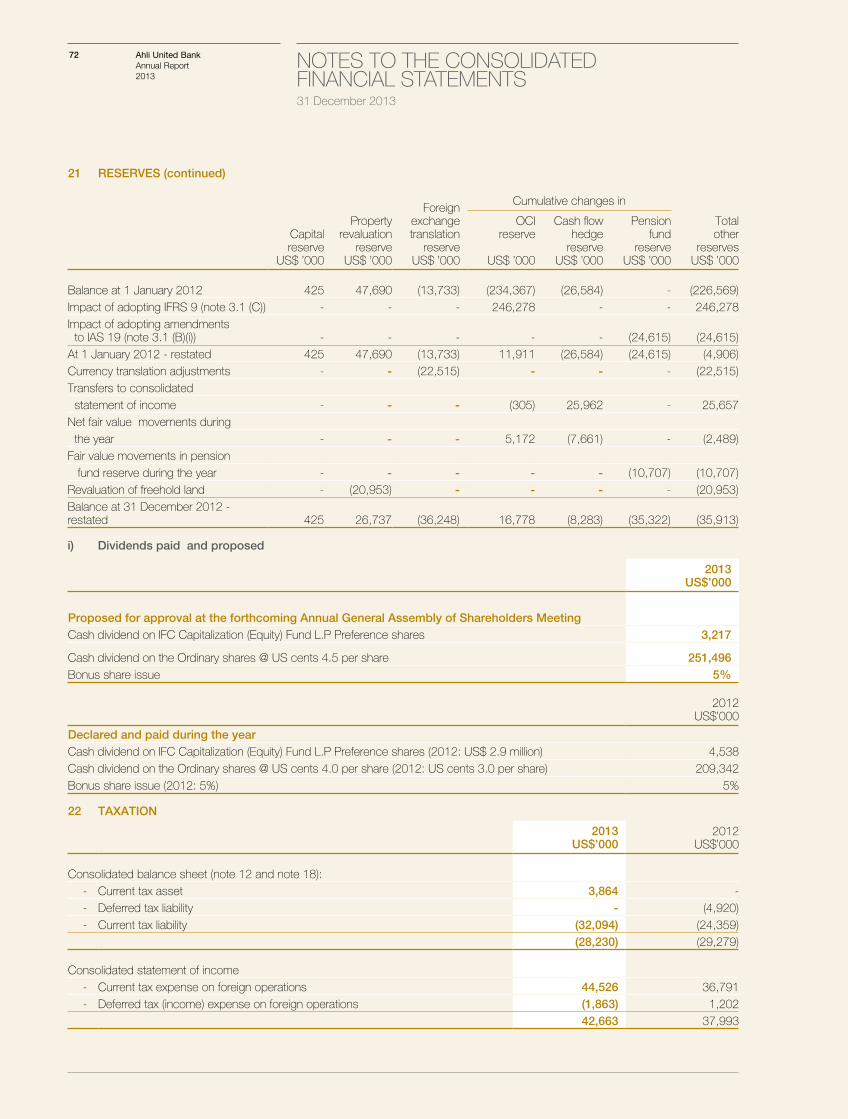
72 NOTES TO THE CONSOLIDATED FINANCIAL STATEMENTS 31 December 2013
Ahli United BankAnnual Report 2013
21 RESERVES (continued)
Capitalreserve
US$ ’000
Propertyrevaluation
reserveUS$ ’000
Foreign exchangetranslation
reserveUS$ ’000
Cumulative changes in
Totalother
reservesUS$ ’000
OCIreserve
US$ ’000
Cash flowhedge
reserveUS$ ’000
Pension fund
reserveUS$ ’000
Balance at 1 January 2012 425 47,690 (13,733) (234,367) (26,584) - (226,569)Impact of adopting IFRS 9 (note 3.1 (C)) - - - 246,278 - - 246,278Impact of adopting amendments to IAS 19 (note 3.1 (B)(i)) - - - - - (24,615) (24,615)At 1 January 2012 - restated 425 47,690 (13,733) 11,911 (26,584) (24,615) (4,906)Currency translation adjustments - - (22,515) - - - (22,515)Transfers to consolidated statement of income - - - (305) 25,962 - 25,657Net fair value movements during the year - - - 5,172 (7,661) - (2,489)Fair value movements in pension fund reserve during the year - - - - - (10,707) (10,707)Revaluation of freehold land - (20,953) - - - - (20,953)Balance at 31 December 2012 - restated 425 26,737 (36,248) 16,778 (8,283) (35,322) (35,913)
i) Dividends paid and proposed
2013US$’000
Proposed for approval at the forthcoming Annual General Assembly of Shareholders MeetingCash dividend on IFC Capitalization (Equity) Fund L.P Preference shares 3,217
Cash dividend on the Ordinary shares @ US cents 4.5 per share 251,496 Bonus share issue 5%
2012US$’000
Declared and paid during the yearCash dividend on IFC Capitalization (Equity) Fund L.P Preference shares (2012: US$ 2.9 million) 4,538 Cash dividend on the Ordinary shares @ US cents 4.0 per share (2012: US cents 3.0 per share) 209,342 Bonus share issue (2012: 5%) 5%
22 TAXATION
2013US$’000
2012US$’000
Consolidated balance sheet (note 12 and note 18):- Current tax asset 3,864 -- Deferred tax liability - (4,920)- Current tax liability (32,094) (24,359)
(28,230) (29,279)
Consolidated statement of income- Current tax expense on foreign operations 44,526 36,791- Deferred tax (income) expense on foreign operations (1,863) 1,202
42,663 37,993
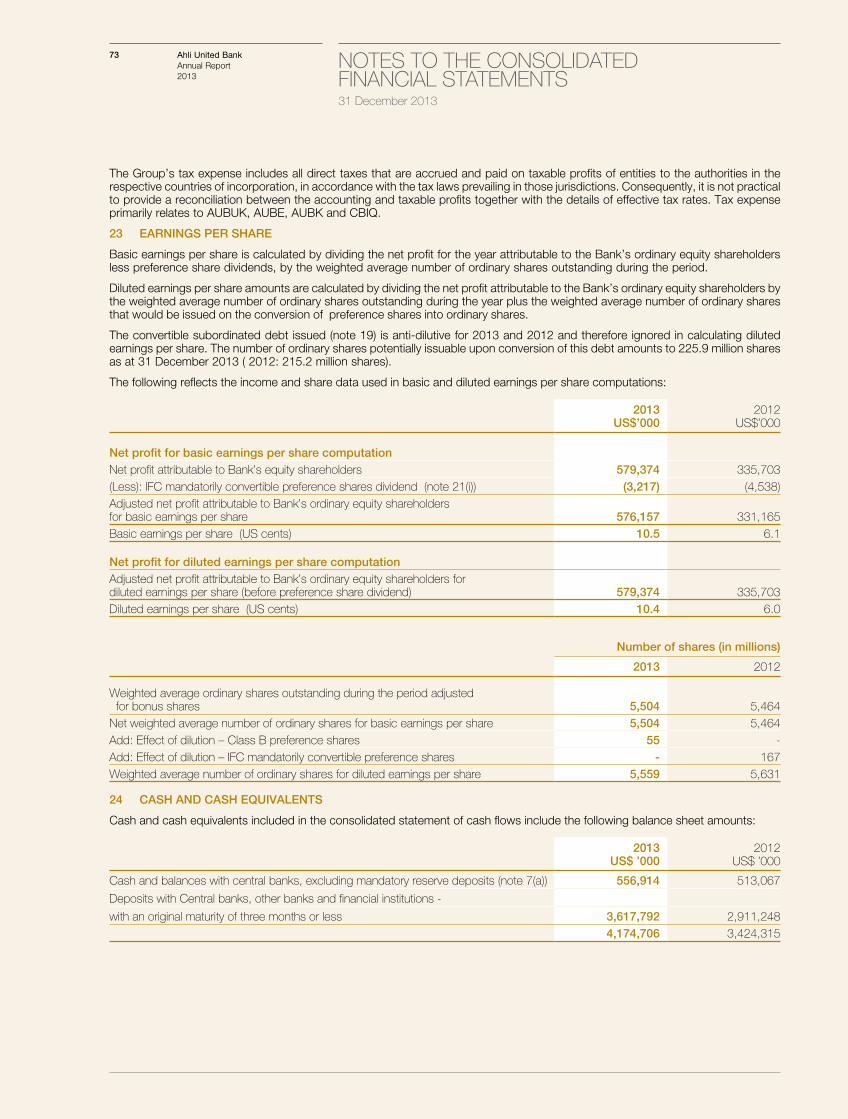
73 NOTES TO THE CONSOLIDATED FINANCIAL STATEMENTS 31 December 2013
Ahli United BankAnnual Report 2013
The Group’s tax expense includes all direct taxes that are accrued and paid on taxable profits of entities to the authorities in the respective countries of incorporation, in accordance with the tax laws prevailing in those jurisdictions. Consequently, it is not practical to provide a reconciliation between the accounting and taxable profits together with the details of effective tax rates. Tax expense primarily relates to AUBUK, AUBE, AUBK and CBIQ.
23 EARNINGS PER SHARE
Basic earnings per share is calculated by dividing the net profit for the year attributable to the Bank’s ordinary equity shareholders less preference share dividends, by the weighted average number of ordinary shares outstanding during the period.
Diluted earnings per share amounts are calculated by dividing the net profit attributable to the Bank’s ordinary equity shareholders by the weighted average number of ordinary shares outstanding during the year plus the weighted average number of ordinary shares that would be issued on the conversion of preference shares into ordinary shares.
The convertible subordinated debt issued (note 19) is anti-dilutive for 2013 and 2012 and therefore ignored in calculating diluted earnings per share. The number of ordinary shares potentially issuable upon conversion of this debt amounts to 225.9 million shares as at 31 December 2013 ( 2012: 215.2 million shares).
The following reflects the income and share data used in basic and diluted earnings per share computations:
2013US$’000
2012US$’000
Net profit for basic earnings per share computationNet profit attributable to Bank’s equity shareholders 579,374 335,703(Less): IFC mandatorily convertible preference shares dividend (note 21(i)) (3,217) (4,538)Adjusted net profit attributable to Bank’s ordinary equity shareholders for basic earnings per share 576,157 331,165Basic earnings per share (US cents) 10.5 6.1
Net profit for diluted earnings per share computationAdjusted net profit attributable to Bank’s ordinary equity shareholders for diluted earnings per share (before preference share dividend) 579,374 335,703Diluted earnings per share (US cents) 10.4 6.0
Number of shares (in millions)
2013 2012
Weighted average ordinary shares outstanding during the period adjusted for bonus shares 5,504 5,464Net weighted average number of ordinary shares for basic earnings per share 5,504 5,464Add: Effect of dilution – Class B preference shares 55 -Add: Effect of dilution – IFC mandatorily convertible preference shares - 167Weighted average number of ordinary shares for diluted earnings per share 5,559 5,631
24 CASH AND CASH EQUIVALENTS
Cash and cash equivalents included in the consolidated statement of cash flows include the following balance sheet amounts:
2013US$ ’000
2012US$ ’000
Cash and balances with central banks, excluding mandatory reserve deposits (note 7(a)) 556,914 513,067
Deposits with Central banks, other banks and financial institutions -
with an original maturity of three months or less 3,617,792 2,911,2484,174,706 3,424,315
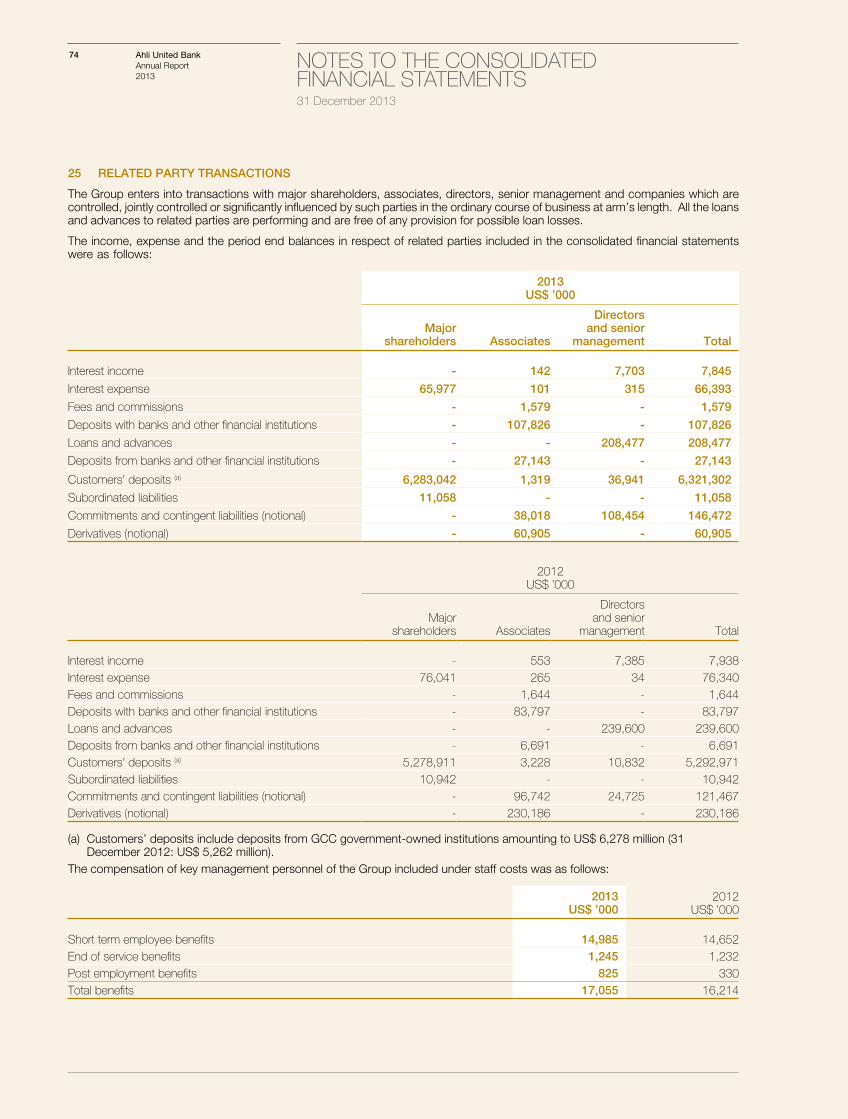
74 NOTES TO THE CONSOLIDATED FINANCIAL STATEMENTS 31 December 2013
Ahli United BankAnnual Report 2013
25 RELATED PARTY TRANSACTIONS
The Group enters into transactions with major shareholders, associates, directors, senior management and companies which are controlled, jointly controlled or significantly influenced by such parties in the ordinary course of business at arm’s length. All the loans and advances to related parties are performing and are free of any provision for possible loan losses.
The income, expense and the period end balances in respect of related parties included in the consolidated financial statements were as follows:
2013US$ ’000
Major shareholders Associates
Directorsand senior
management Total
Interest income - 142 7,703 7,845
Interest expense 65,977 101 315 66,393
Fees and commissions - 1,579 - 1,579
Deposits with banks and other financial institutions - 107,826 - 107,826
Loans and advances - - 208,477 208,477
Deposits from banks and other financial institutions - 27,143 - 27,143
Customers’ deposits (a) 6,283,042 1,319 36,941 6,321,302
Subordinated liabilities 11,058 - - 11,058
Commitments and contingent liabilities (notional) - 38,018 108,454 146,472
Derivatives (notional) - 60,905 - 60,905
2012US$ ’000
Major shareholders Associates
Directorsand senior
management Total
Interest income - 553 7,385 7,938Interest expense 76,041 265 34 76,340Fees and commissions - 1,644 - 1,644Deposits with banks and other financial institutions - 83,797 - 83,797Loans and advances - - 239,600 239,600Deposits from banks and other financial institutions - 6,691 - 6,691Customers’ deposits (a) 5,278,911 3,228 10,832 5,292,971Subordinated liabilities 10,942 - - 10,942Commitments and contingent liabilities (notional) - 96,742 24,725 121,467Derivatives (notional) - 230,186 - 230,186
(a) Customers’ deposits include deposits from GCC government-owned institutions amounting to US$ 6,278 million (31 December 2012: US$ 5,262 million).
The compensation of key management personnel of the Group included under staff costs was as follows:
2013US$ ’000
2012US$ ’000
Short term employee benefits 14,985 14,652End of service benefits 1,245 1,232Post employment benefits 825 330Total benefits 17,055 16,214
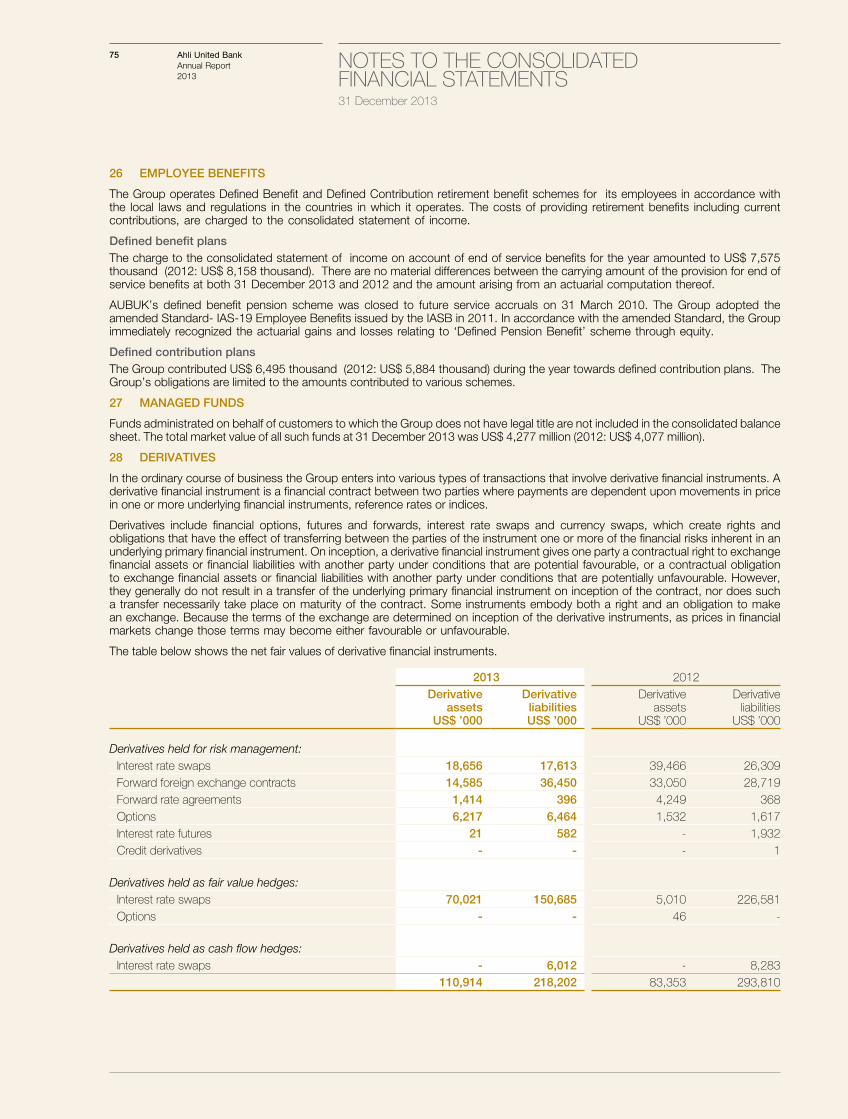
75 NOTES TO THE CONSOLIDATED FINANCIAL STATEMENTS 31 December 2013
Ahli United BankAnnual Report 2013
26 EMPLOYEE BENEFITS
The Group operates Defined Benefit and Defined Contribution retirement benefit schemes for its employees in accordance with the local laws and regulations in the countries in which it operates. The costs of providing retirement benefits including current contributions, are charged to the consolidated statement of income.
Defined benefit plansThe charge to the consolidated statement of income on account of end of service benefits for the year amounted to US$ 7,575 thousand (2012: US$ 8,158 thousand). There are no material differences between the carrying amount of the provision for end of service benefits at both 31 December 2013 and 2012 and the amount arising from an actuarial computation thereof.
AUBUK’s defined benefit pension scheme was closed to future service accruals on 31 March 2010. The Group adopted the amended Standard- IAS-19 Employee Benefits issued by the IASB in 2011. In accordance with the amended Standard, the Group immediately recognized the actuarial gains and losses relating to ‘Defined Pension Benefit’ scheme through equity.
Defined contribution plansThe Group contributed US$ 6,495 thousand (2012: US$ 5,884 thousand) during the year towards defined contribution plans. The Group’s obligations are limited to the amounts contributed to various schemes.
27 MANAGED FUNDS
Funds administrated on behalf of customers to which the Group does not have legal title are not included in the consolidated balance sheet. The total market value of all such funds at 31 December 2013 was US$ 4,277 million (2012: US$ 4,077 million).
28 DERIVATIVES
In the ordinary course of business the Group enters into various types of transactions that involve derivative financial instruments. A derivative financial instrument is a financial contract between two parties where payments are dependent upon movements in price in one or more underlying financial instruments, reference rates or indices.
Derivatives include financial options, futures and forwards, interest rate swaps and currency swaps, which create rights and obligations that have the effect of transferring between the parties of the instrument one or more of the financial risks inherent in an underlying primary financial instrument. On inception, a derivative financial instrument gives one party a contractual right to exchange financial assets or financial liabilities with another party under conditions that are potential favourable, or a contractual obligation to exchange financial assets or financial liabilities with another party under conditions that are potentially unfavourable. However, they generally do not result in a transfer of the underlying primary financial instrument on inception of the contract, nor does such a transfer necessarily take place on maturity of the contract. Some instruments embody both a right and an obligation to make an exchange. Because the terms of the exchange are determined on inception of the derivative instruments, as prices in financial markets change those terms may become either favourable or unfavourable.
The table below shows the net fair values of derivative financial instruments.
2013 2012Derivative
assetsUS$ ’000
DerivativeliabilitiesUS$ ’000
Derivativeassets
US$ ’000
Derivativeliabilities
US$ ’000
Derivatives held for risk management:Interest rate swaps 18,656 17,613 39,466 26,309Forward foreign exchange contracts 14,585 36,450 33,050 28,719Forward rate agreements 1,414 396 4,249 368Options 6,217 6,464 1,532 1,617Interest rate futures 21 582 - 1,932Credit derivatives - - - 1
Derivatives held as fair value hedges:Interest rate swaps 70,021 150,685 5,010 226,581Options - - 46 -
Derivatives held as cash flow hedges:Interest rate swaps - 6,012 - 8,283
110,914 218,202 83,353 293,810
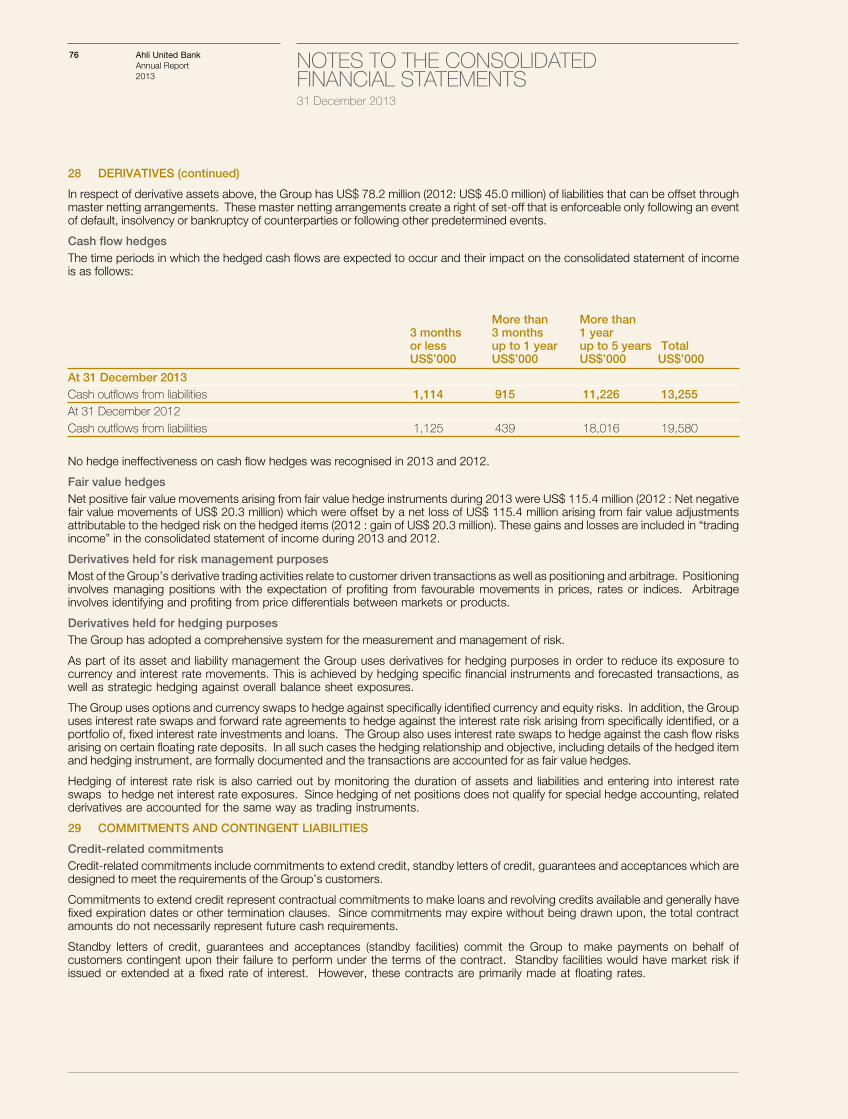
76 NOTES TO THE CONSOLIDATED FINANCIAL STATEMENTS 31 December 2013
Ahli United BankAnnual Report 2013
28 DERIVATIVES (continued)
In respect of derivative assets above, the Group has US$ 78.2 million (2012: US$ 45.0 million) of liabilities that can be offset through master netting arrangements. These master netting arrangements create a right of set-off that is enforceable only following an event of default, insolvency or bankruptcy of counterparties or following other predetermined events.
Cash flow hedgesThe time periods in which the hedged cash flows are expected to occur and their impact on the consolidated statement of income is as follows:
3 monthsor lessUS$’000
More than3 monthsup to 1 yearUS$’000
More than1 yearup to 5 yearsUS$’000
Total US$’000
At 31 December 2013Cash outflows from liabilities 1,114 915 11,226 13,255 At 31 December 2012Cash outflows from liabilities 1,125 439 18,016 19,580
No hedge ineffectiveness on cash flow hedges was recognised in 2013 and 2012.
Fair value hedgesNet positive fair value movements arising from fair value hedge instruments during 2013 were US$ 115.4 million (2012 : Net negative fair value movements of US$ 20.3 million) which were offset by a net loss of US$ 115.4 million arising from fair value adjustments attributable to the hedged risk on the hedged items (2012 : gain of US$ 20.3 million). These gains and losses are included in “trading income” in the consolidated statement of income during 2013 and 2012.
Derivatives held for risk management purposesMost of the Group’s derivative trading activities relate to customer driven transactions as well as positioning and arbitrage. Positioning involves managing positions with the expectation of profiting from favourable movements in prices, rates or indices. Arbitrage involves identifying and profiting from price differentials between markets or products.
Derivatives held for hedging purposesThe Group has adopted a comprehensive system for the measurement and management of risk.
As part of its asset and liability management the Group uses derivatives for hedging purposes in order to reduce its exposure to currency and interest rate movements. This is achieved by hedging specific financial instruments and forecasted transactions, as well as strategic hedging against overall balance sheet exposures.
The Group uses options and currency swaps to hedge against specifically identified currency and equity risks. In addition, the Group uses interest rate swaps and forward rate agreements to hedge against the interest rate risk arising from specifically identified, or a portfolio of, fixed interest rate investments and loans. The Group also uses interest rate swaps to hedge against the cash flow risks arising on certain floating rate deposits. In all such cases the hedging relationship and objective, including details of the hedged item and hedging instrument, are formally documented and the transactions are accounted for as fair value hedges.
Hedging of interest rate risk is also carried out by monitoring the duration of assets and liabilities and entering into interest rate swaps to hedge net interest rate exposures. Since hedging of net positions does not qualify for special hedge accounting, related derivatives are accounted for the same way as trading instruments.
29 COMMITMENTS AND CONTINGENT LIABILITIES
Credit-related commitmentsCredit-related commitments include commitments to extend credit, standby letters of credit, guarantees and acceptances which are designed to meet the requirements of the Group’s customers.
Commitments to extend credit represent contractual commitments to make loans and revolving credits available and generally have fixed expiration dates or other termination clauses. Since commitments may expire without being drawn upon, the total contract amounts do not necessarily represent future cash requirements.
Standby letters of credit, guarantees and acceptances (standby facilities) commit the Group to make payments on behalf of customers contingent upon their failure to perform under the terms of the contract. Standby facilities would have market risk if issued or extended at a fixed rate of interest. However, these contracts are primarily made at floating rates.
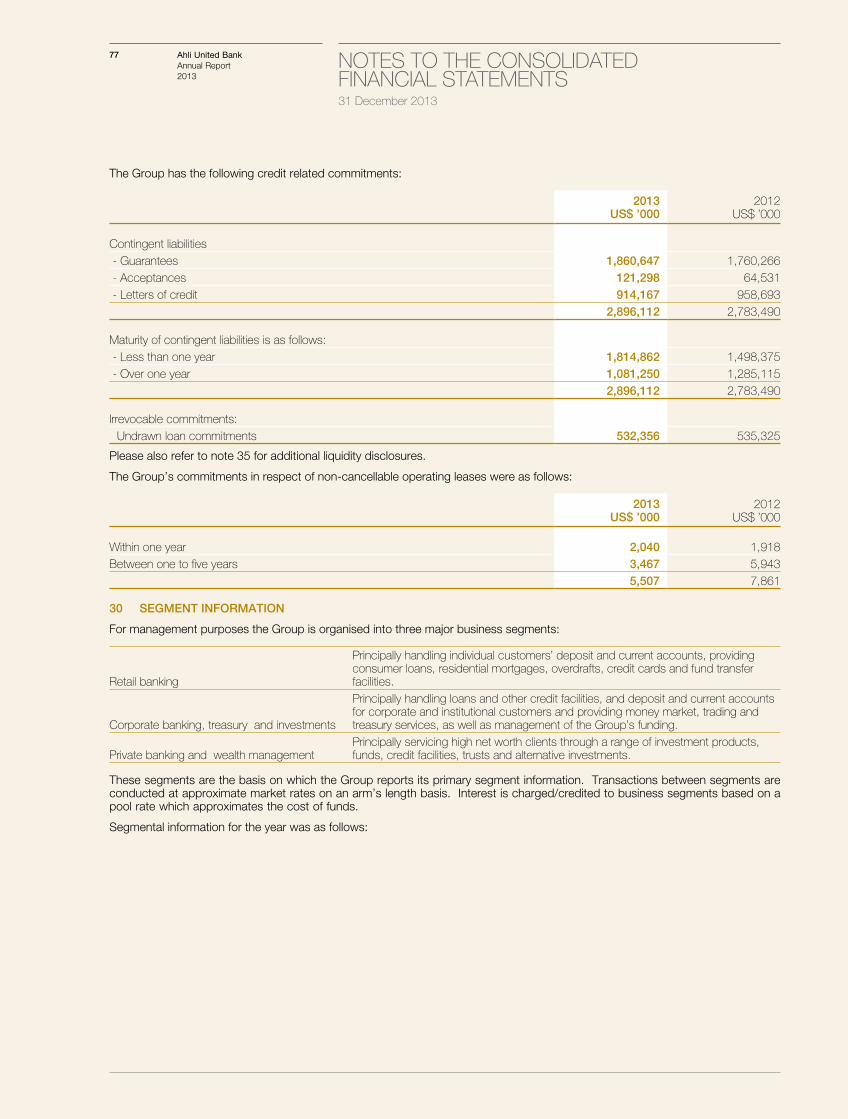
77 NOTES TO THE CONSOLIDATED FINANCIAL STATEMENTS 31 December 2013
Ahli United BankAnnual Report 2013
The Group has the following credit related commitments:
2013US$ ’000
2012US$ ’000
Contingent liabilities - Guarantees 1,860,647 1,760,266 - Acceptances 121,298 64,531 - Letters of credit 914,167 958,693
2,896,112 2,783,490
Maturity of contingent liabilities is as follows: - Less than one year 1,814,862 1,498,375 - Over one year 1,081,250 1,285,115
2,896,112 2,783,490
Irrevocable commitments:Undrawn loan commitments 532,356 535,325
Please also refer to note 35 for additional liquidity disclosures.
The Group’s commitments in respect of non-cancellable operating leases were as follows:
2013US$ ’000
2012US$ ’000
Within one year 2,040 1,918 Between one to five years 3,467 5,943
5,507 7,861
30 SEGMENT INFORMATION
For management purposes the Group is organised into three major business segments:
Retail banking
Principally handling individual customers’ deposit and current accounts, providing consumer loans, residential mortgages, overdrafts, credit cards and fund transfer facilities.
Corporate banking, treasury and investments
Principally handling loans and other credit facilities, and deposit and current accounts for corporate and institutional customers and providing money market, trading and treasury services, as well as management of the Group’s funding.
Private banking and wealth managementPrincipally servicing high net worth clients through a range of investment products, funds, credit facilities, trusts and alternative investments.
These segments are the basis on which the Group reports its primary segment information. Transactions between segments are conducted at approximate market rates on an arm’s length basis. Interest is charged/credited to business segments based on a pool rate which approximates the cost of funds.
Segmental information for the year was as follows:
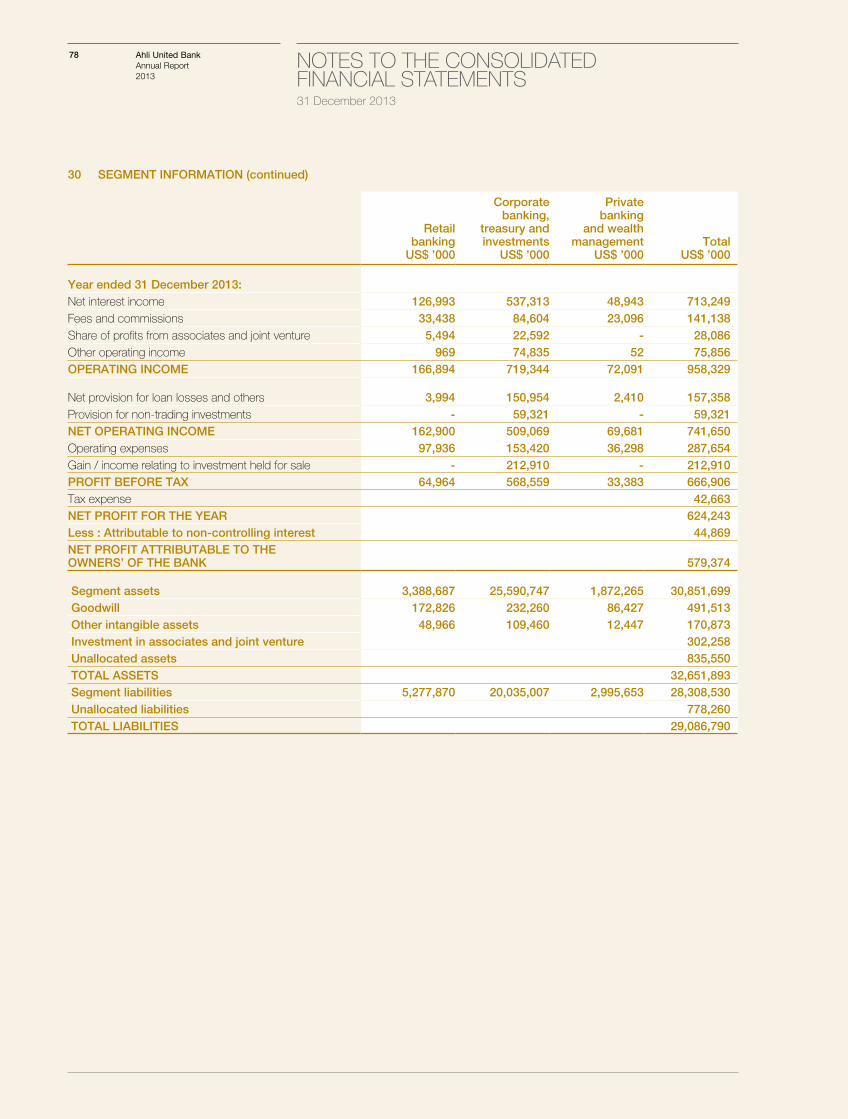
78 NOTES TO THE CONSOLIDATED FINANCIAL STATEMENTS 31 December 2013
Ahli United BankAnnual Report 2013
30 SEGMENT INFORMATION (continued)
Retailbanking
US$ ’000
Corporatebanking,
treasury andinvestments
US$ ’000
Privatebanking
and wealthmanagement
US$ ’000Total
US$ ’000
Year ended 31 December 2013:Net interest income 126,993 537,313 48,943 713,249Fees and commissions 33,438 84,604 23,096 141,138Share of profits from associates and joint venture 5,494 22,592 - 28,086Other operating income 969 74,835 52 75,856OPERATING INCOME 166,894 719,344 72,091 958,329
Net provision for loan losses and others 3,994 150,954 2,410 157,358Provision for non-trading investments - 59,321 - 59,321NET OPERATING INCOME 162,900 509,069 69,681 741,650Operating expenses 97,936 153,420 36,298 287,654Gain / income relating to investment held for sale - 212,910 - 212,910PROFIT BEFORE TAX 64,964 568,559 33,383 666,906Tax expense 42,663NET PROFIT FOR THE YEAR 624,243Less : Attributable to non-controlling interest 44,869NET PROFIT ATTRIBUTABLE TO THE OWNERS’ OF THE BANK 579,374
Segment assets 3,388,687 25,590,747 1,872,265 30,851,699 Goodwill 172,826 232,260 86,427 491,513 Other intangible assets 48,966 109,460 12,447 170,873 Investment in associates and joint venture 302,258 Unallocated assets 835,550 TOTAL ASSETS 32,651,893 Segment liabilities 5,277,870 20,035,007 2,995,653 28,308,530 Unallocated liabilities 778,260 TOTAL LIABILITIES 29,086,790
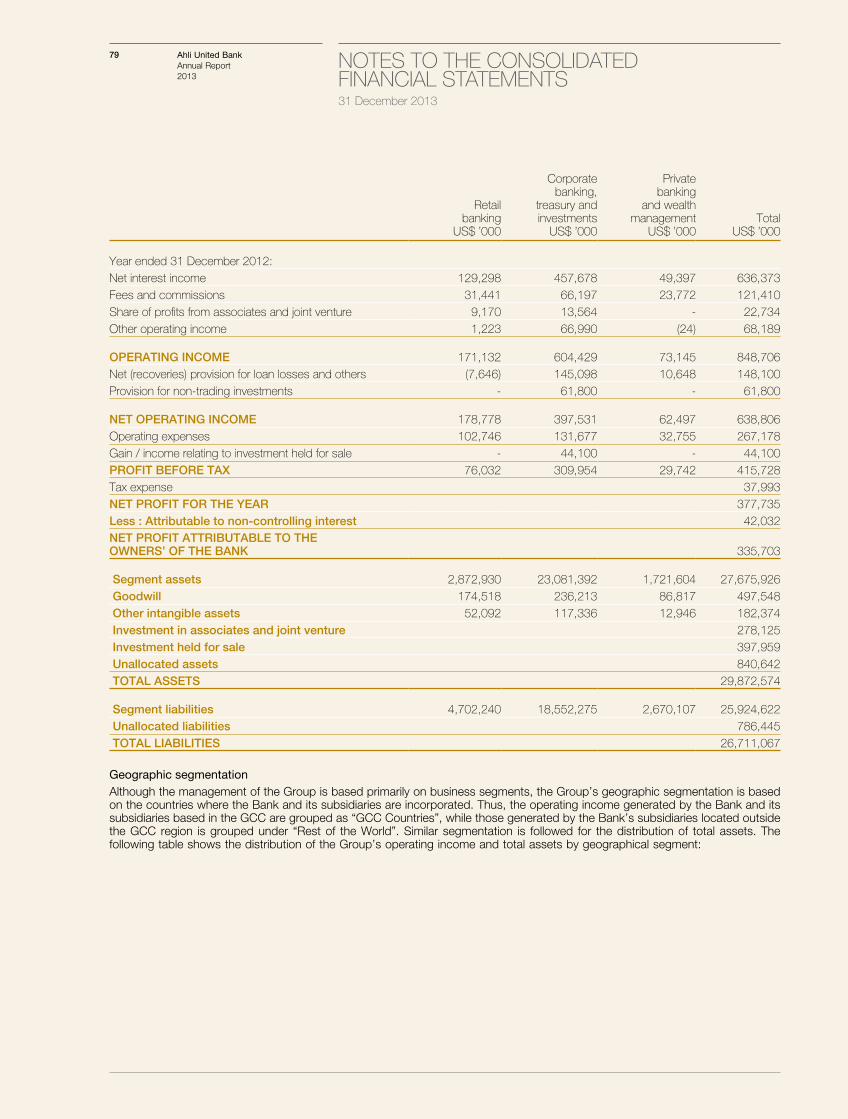
79 NOTES TO THE CONSOLIDATED FINANCIAL STATEMENTS 31 December 2013
Ahli United BankAnnual Report 2013
Retailbanking
US$ ’000
Corporatebanking,
treasury andinvestments
US$ ’000
Privatebanking
and wealthmanagement
US$ ’000Total
US$ ’000
Year ended 31 December 2012:Net interest income 129,298 457,678 49,397 636,373Fees and commissions 31,441 66,197 23,772 121,410Share of profits from associates and joint venture 9,170 13,564 - 22,734Other operating income 1,223 66,990 (24) 68,189
OPERATING INCOME 171,132 604,429 73,145 848,706Net (recoveries) provision for loan losses and others (7,646) 145,098 10,648 148,100Provision for non-trading investments - 61,800 - 61,800
NET OPERATING INCOME 178,778 397,531 62,497 638,806Operating expenses 102,746 131,677 32,755 267,178Gain / income relating to investment held for sale - 44,100 - 44,100PROFIT BEFORE TAX 76,032 309,954 29,742 415,728Tax expense 37,993NET PROFIT FOR THE YEAR 377,735Less : Attributable to non-controlling interest 42,032NET PROFIT ATTRIBUTABLE TO THE OWNERS’ OF THE BANK 335,703
Segment assets 2,872,930 23,081,392 1,721,604 27,675,926 Goodwill 174,518 236,213 86,817 497,548 Other intangible assets 52,092 117,336 12,946 182,374 Investment in associates and joint venture 278,125 Investment held for sale 397,959 Unallocated assets 840,642 TOTAL ASSETS 29,872,574
Segment liabilities 4,702,240 18,552,275 2,670,107 25,924,622 Unallocated liabilities 786,445 TOTAL LIABILITIES 26,711,067
Geographic segmentationAlthough the management of the Group is based primarily on business segments, the Group’s geographic segmentation is based on the countries where the Bank and its subsidiaries are incorporated. Thus, the operating income generated by the Bank and its subsidiaries based in the GCC are grouped as “GCC Countries”, while those generated by the Bank’s subsidiaries located outside the GCC region is grouped under “Rest of the World”. Similar segmentation is followed for the distribution of total assets. The following table shows the distribution of the Group’s operating income and total assets by geographical segment:
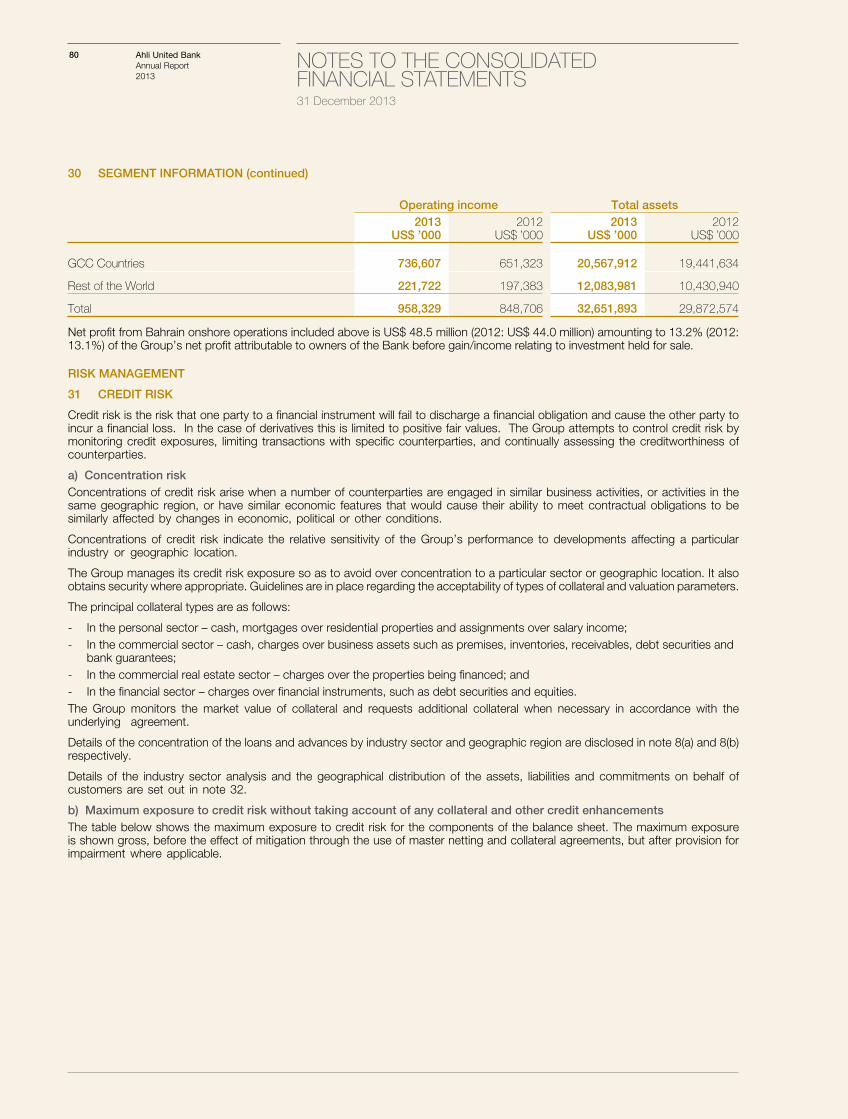
80 NOTES TO THE CONSOLIDATED FINANCIAL STATEMENTS 31 December 2013
Ahli United BankAnnual Report 2013
30 SEGMENT INFORMATION (continued)
Operating income Total assets2013
US$ ’0002012
US$ ’0002013
US$ ’0002012
US$ ’000
GCC Countries 736,607 651,323 20,567,912 19,441,634
Rest of the World 221,722 197,383 12,083,981 10,430,940
Total 958,329 848,706 32,651,893 29,872,574
Net profit from Bahrain onshore operations included above is US$ 48.5 million (2012: US$ 44.0 million) amounting to 13.2% (2012: 13.1%) of the Group’s net profit attributable to owners of the Bank before gain/income relating to investment held for sale.
RISK MANAGEMENT
31 CREDIT RISK
Credit risk is the risk that one party to a financial instrument will fail to discharge a financial obligation and cause the other party to incur a financial loss. In the case of derivatives this is limited to positive fair values. The Group attempts to control credit risk by monitoring credit exposures, limiting transactions with specific counterparties, and continually assessing the creditworthiness of counterparties.
a) Concentration riskConcentrations of credit risk arise when a number of counterparties are engaged in similar business activities, or activities in the same geographic region, or have similar economic features that would cause their ability to meet contractual obligations to be similarly affected by changes in economic, political or other conditions.
Concentrations of credit risk indicate the relative sensitivity of the Group’s performance to developments affecting a particular industry or geographic location.
The Group manages its credit risk exposure so as to avoid over concentration to a particular sector or geographic location. It also obtains security where appropriate. Guidelines are in place regarding the acceptability of types of collateral and valuation parameters.
The principal collateral types are as follows:
- In the personal sector – cash, mortgages over residential properties and assignments over salary income;- In the commercial sector – cash, charges over business assets such as premises, inventories, receivables, debt securities and
bank guarantees;- In the commercial real estate sector – charges over the properties being financed; and- In the financial sector – charges over financial instruments, such as debt securities and equities.The Group monitors the market value of collateral and requests additional collateral when necessary in accordance with the underlying agreement.
Details of the concentration of the loans and advances by industry sector and geographic region are disclosed in note 8(a) and 8(b) respectively.
Details of the industry sector analysis and the geographical distribution of the assets, liabilities and commitments on behalf of customers are set out in note 32.
b) Maximum exposure to credit risk without taking account of any collateral and other credit enhancementsThe table below shows the maximum exposure to credit risk for the components of the balance sheet. The maximum exposure is shown gross, before the effect of mitigation through the use of master netting and collateral agreements, but after provision for impairment where applicable.
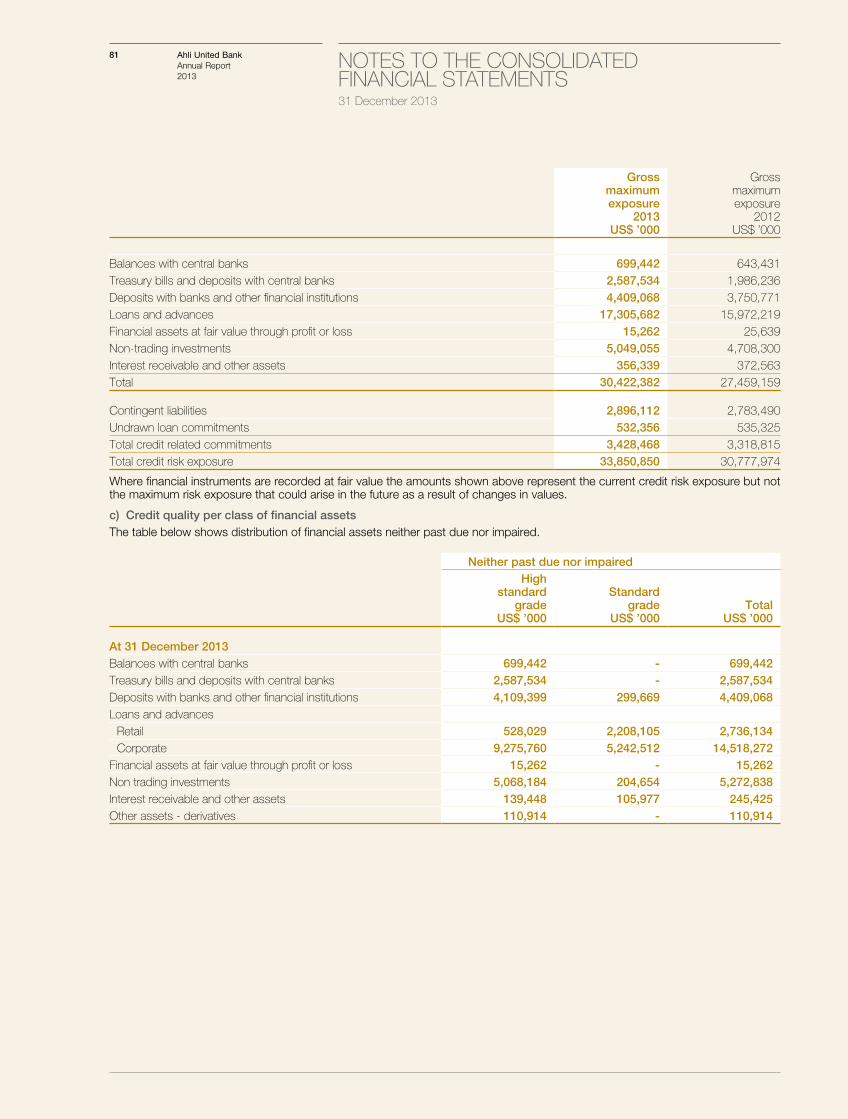
81 NOTES TO THE CONSOLIDATED FINANCIAL STATEMENTS 31 December 2013
Ahli United BankAnnual Report 2013
Grossmaximumexposure
2013US$ ’000
Grossmaximumexposure
2012US$ ’000
Balances with central banks 699,442 643,431 Treasury bills and deposits with central banks 2,587,534 1,986,236 Deposits with banks and other financial institutions 4,409,068 3,750,771 Loans and advances 17,305,682 15,972,219 Financial assets at fair value through profit or loss 15,262 25,639 Non-trading investments 5,049,055 4,708,300 Interest receivable and other assets 356,339 372,563 Total 30,422,382 27,459,159
Contingent liabilities 2,896,112 2,783,490 Undrawn loan commitments 532,356 535,325 Total credit related commitments 3,428,468 3,318,815 Total credit risk exposure 33,850,850 30,777,974
Where financial instruments are recorded at fair value the amounts shown above represent the current credit risk exposure but not the maximum risk exposure that could arise in the future as a result of changes in values.
c) Credit quality per class of financial assetsThe table below shows distribution of financial assets neither past due nor impaired.
Neither past due nor impairedHigh
standardgrade
US$ ’000
Standardgrade
US$ ’000Total
US$ ’000
At 31 December 2013Balances with central banks 699,442 - 699,442 Treasury bills and deposits with central banks 2,587,534 - 2,587,534 Deposits with banks and other financial institutions 4,109,399 299,669 4,409,068 Loans and advances
Retail 528,029 2,208,105 2,736,134 Corporate 9,275,760 5,242,512 14,518,272
Financial assets at fair value through profit or loss 15,262 - 15,262 Non trading investments 5,068,184 204,654 5,272,838 Interest receivable and other assets 139,448 105,977 245,425 Other assets - derivatives 110,914 - 110,914
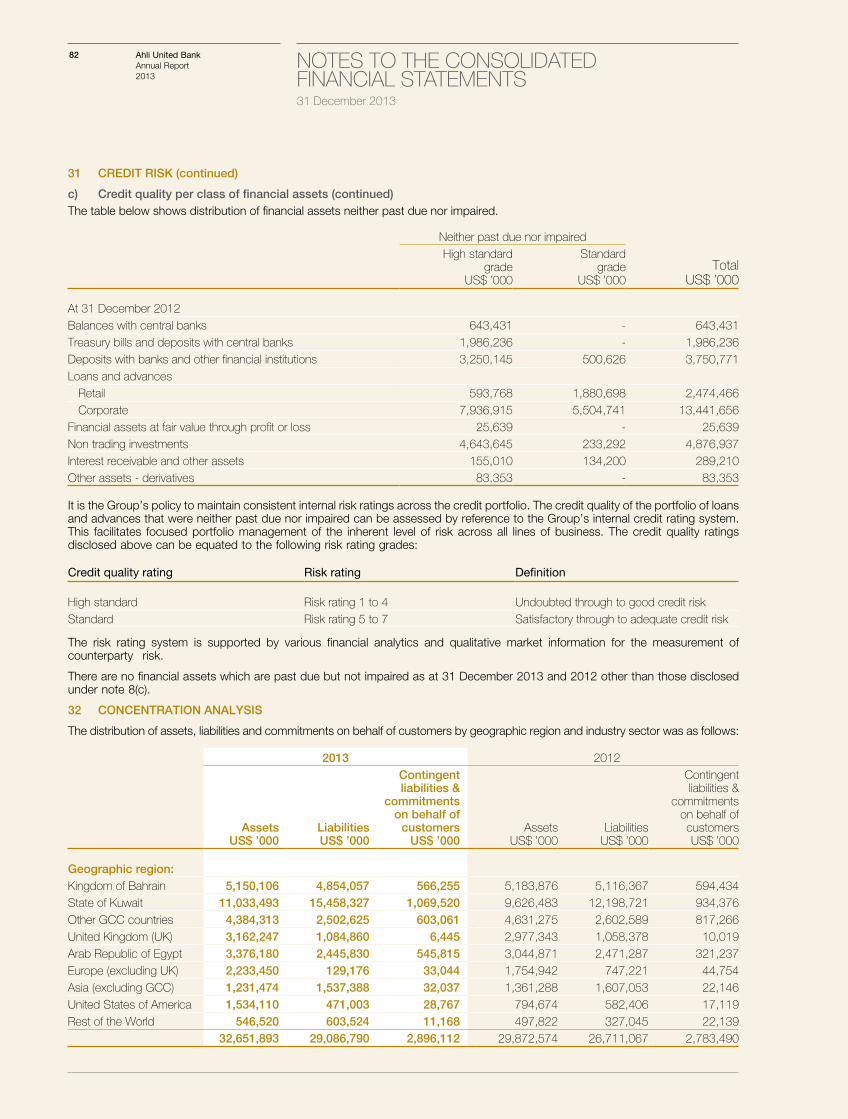
82 NOTES TO THE CONSOLIDATED FINANCIAL STATEMENTS 31 December 2013
Ahli United BankAnnual Report 2013
31 CREDIT RISK (continued)
c) Credit quality per class of financial assets (continued)The table below shows distribution of financial assets neither past due nor impaired.
Neither past due nor impairedHigh standard
gradeUS$ ’000
Standardgrade
US$ ’000Total
US$ ’000
At 31 December 2012Balances with central banks 643,431 - 643,431Treasury bills and deposits with central banks 1,986,236 - 1,986,236Deposits with banks and other financial institutions 3,250,145 500,626 3,750,771Loans and advances Retail 593,768 1,880,698 2,474,466 Corporate 7,936,915 5,504,741 13,441,656
Financial assets at fair value through profit or loss 25,639 - 25,639Non trading investments 4,643,645 233,292 4,876,937Interest receivable and other assets 155,010 134,200 289,210Other assets - derivatives 83,353 - 83,353
It is the Group’s policy to maintain consistent internal risk ratings across the credit portfolio. The credit quality of the portfolio of loans and advances that were neither past due nor impaired can be assessed by reference to the Group’s internal credit rating system. This facilitates focused portfolio management of the inherent level of risk across all lines of business. The credit quality ratings disclosed above can be equated to the following risk rating grades:
Credit quality rating Risk rating Definition
High standard Risk rating 1 to 4 Undoubted through to good credit riskStandard Risk rating 5 to 7 Satisfactory through to adequate credit risk
The risk rating system is supported by various financial analytics and qualitative market information for the measurement of counterparty risk.
There are no financial assets which are past due but not impaired as at 31 December 2013 and 2012 other than those disclosed under note 8(c).
32 CONCENTRATION ANALYSIS
The distribution of assets, liabilities and commitments on behalf of customers by geographic region and industry sector was as follows:
2013 2012
AssetsUS$ ’000
LiabilitiesUS$ ’000
Contingent liabilities &
commitmentson behalf of
customersUS$ ’000
AssetsUS$ ’000
LiabilitiesUS$ ’000
Contingent liabilities &
commitmentson behalf ofcustomersUS$ ’000
Geographic region:Kingdom of Bahrain 5,150,106 4,854,057 566,255 5,183,876 5,116,367 594,434 State of Kuwait 11,033,493 15,458,327 1,069,520 9,626,483 12,198,721 934,376 Other GCC countries 4,384,313 2,502,625 603,061 4,631,275 2,602,589 817,266 United Kingdom (UK) 3,162,247 1,084,860 6,445 2,977,343 1,058,378 10,019 Arab Republic of Egypt 3,376,180 2,445,830 545,815 3,044,871 2,471,287 321,237 Europe (excluding UK) 2,233,450 129,176 33,044 1,754,942 747,221 44,754 Asia (excluding GCC) 1,231,474 1,537,388 32,037 1,361,288 1,607,053 22,146 United States of America 1,534,110 471,003 28,767 794,674 582,406 17,119 Rest of the World 546,520 603,524 11,168 497,822 327,045 22,139
32,651,893 29,086,790 2,896,112 29,872,574 26,711,067 2,783,490
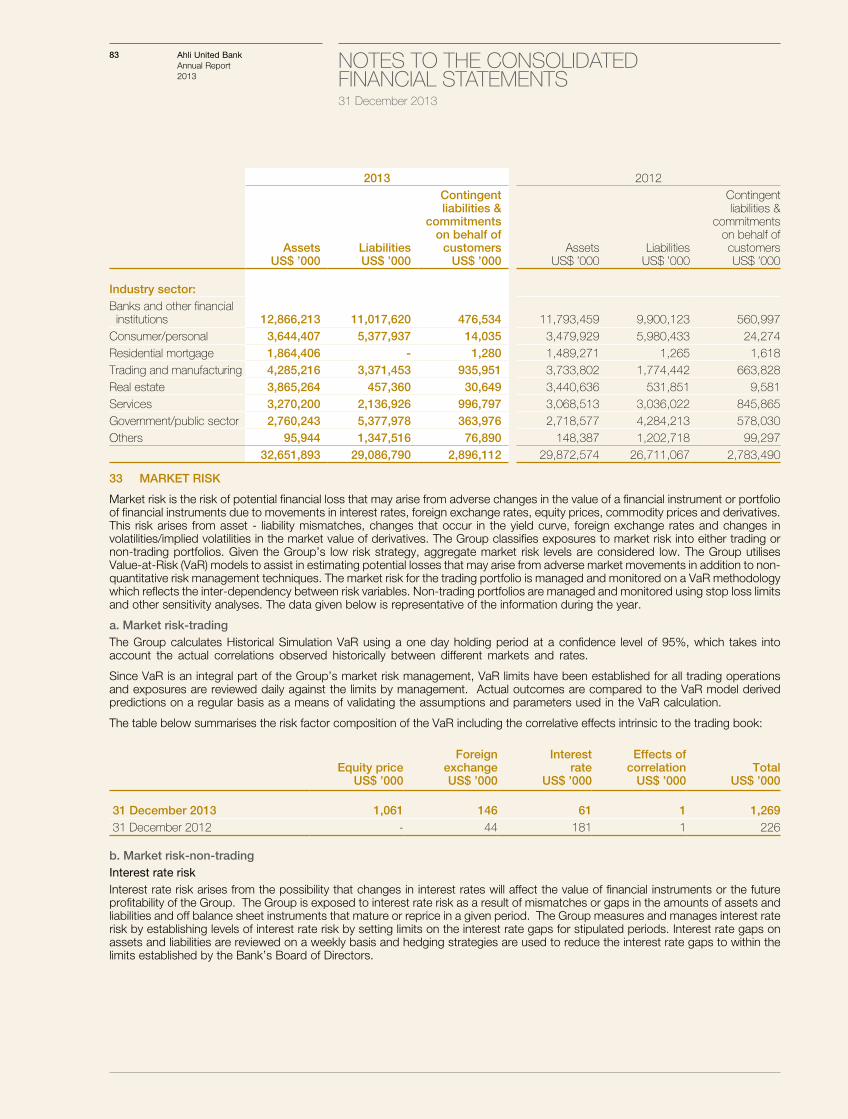
83 NOTES TO THE CONSOLIDATED FINANCIAL STATEMENTS 31 December 2013
Ahli United BankAnnual Report 2013
2013 2012
AssetsUS$ ’000
LiabilitiesUS$ ’000
Contingent liabilities &
commitmentson behalf of
customersUS$ ’000
AssetsUS$ ’000
LiabilitiesUS$ ’000
Contingent liabilities &
commitmentson behalf ofcustomersUS$ ’000
Industry sector:Banks and other financial institutions 12,866,213 11,017,620 476,534 11,793,459 9,900,123 560,997 Consumer/personal 3,644,407 5,377,937 14,035 3,479,929 5,980,433 24,274 Residential mortgage 1,864,406 - 1,280 1,489,271 1,265 1,618 Trading and manufacturing 4,285,216 3,371,453 935,951 3,733,802 1,774,442 663,828 Real estate 3,865,264 457,360 30,649 3,440,636 531,851 9,581 Services 3,270,200 2,136,926 996,797 3,068,513 3,036,022 845,865 Government/public sector 2,760,243 5,377,978 363,976 2,718,577 4,284,213 578,030 Others 95,944 1,347,516 76,890 148,387 1,202,718 99,297
32,651,893 29,086,790 2,896,112 29,872,574 26,711,067 2,783,490
33 MARKET RISK
Market risk is the risk of potential financial loss that may arise from adverse changes in the value of a financial instrument or portfolio of financial instruments due to movements in interest rates, foreign exchange rates, equity prices, commodity prices and derivatives. This risk arises from asset - liability mismatches, changes that occur in the yield curve, foreign exchange rates and changes in volatilities/implied volatilities in the market value of derivatives. The Group classifies exposures to market risk into either trading or non-trading portfolios. Given the Group’s low risk strategy, aggregate market risk levels are considered low. The Group utilises Value-at-Risk (VaR) models to assist in estimating potential losses that may arise from adverse market movements in addition to non-quantitative risk management techniques. The market risk for the trading portfolio is managed and monitored on a VaR methodology which reflects the inter-dependency between risk variables. Non-trading portfolios are managed and monitored using stop loss limits and other sensitivity analyses. The data given below is representative of the information during the year.
a. Market risk-trading The Group calculates Historical Simulation VaR using a one day holding period at a confidence level of 95%, which takes into account the actual correlations observed historically between different markets and rates.
Since VaR is an integral part of the Group’s market risk management, VaR limits have been established for all trading operations and exposures are reviewed daily against the limits by management. Actual outcomes are compared to the VaR model derived predictions on a regular basis as a means of validating the assumptions and parameters used in the VaR calculation.
The table below summarises the risk factor composition of the VaR including the correlative effects intrinsic to the trading book:
Equity priceUS$ ’000
Foreign exchangeUS$ ’000
Interest rate
US$ ’000
Effects of correlation
US$ ’000Total
US$ ’000
31 December 2013 1,061 146 61 1 1,269 31 December 2012 - 44 181 1 226
b. Market risk-non-tradingInterest rate riskInterest rate risk arises from the possibility that changes in interest rates will affect the value of financial instruments or the future profitability of the Group. The Group is exposed to interest rate risk as a result of mismatches or gaps in the amounts of assets and liabilities and off balance sheet instruments that mature or reprice in a given period. The Group measures and manages interest rate risk by establishing levels of interest rate risk by setting limits on the interest rate gaps for stipulated periods. Interest rate gaps on assets and liabilities are reviewed on a weekly basis and hedging strategies are used to reduce the interest rate gaps to within the limits established by the Bank’s Board of Directors.
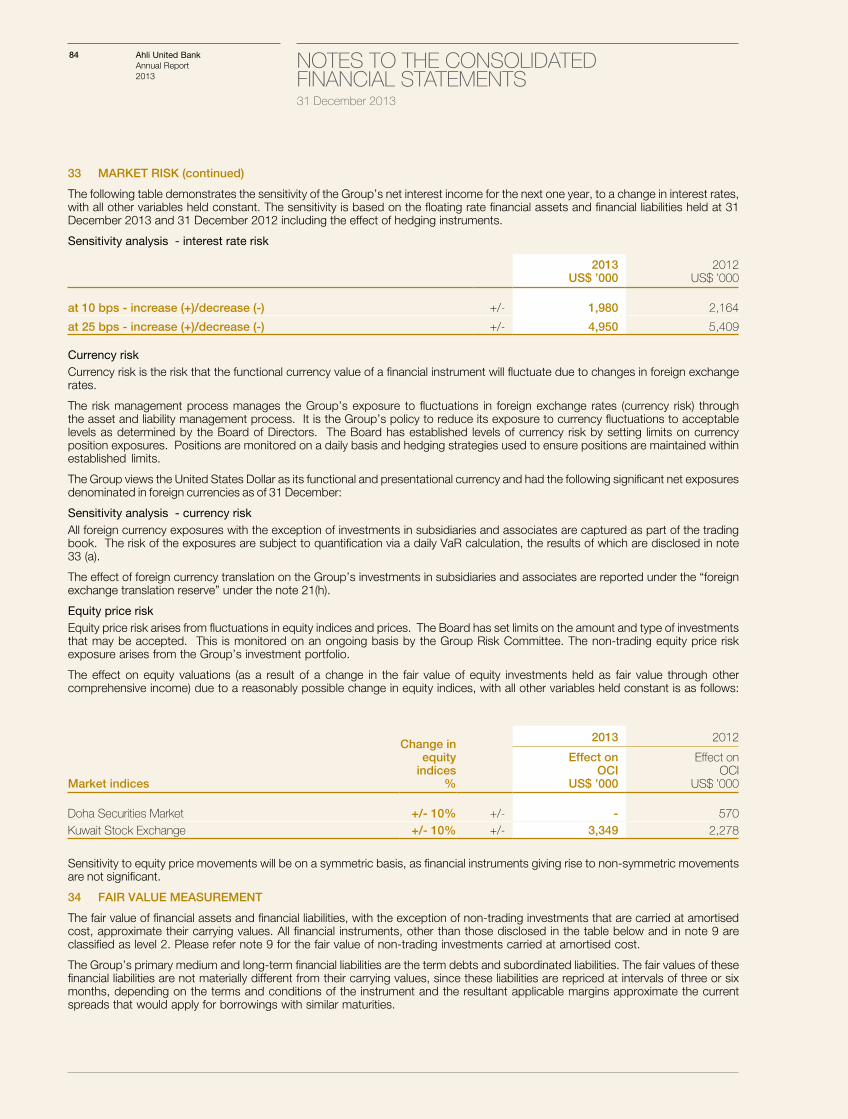
84 NOTES TO THE CONSOLIDATED FINANCIAL STATEMENTS 31 December 2013
Ahli United BankAnnual Report 2013
33 MARKET RISK (continued)
The following table demonstrates the sensitivity of the Group’s net interest income for the next one year, to a change in interest rates, with all other variables held constant. The sensitivity is based on the floating rate financial assets and financial liabilities held at 31 December 2013 and 31 December 2012 including the effect of hedging instruments.
Sensitivity analysis - interest rate risk
2013US$ ’000
2012US$ ’000
at 10 bps - increase (+)/decrease (-) +/- 1,980 2,164
at 25 bps - increase (+)/decrease (-) +/- 4,950 5,409
Currency riskCurrency risk is the risk that the functional currency value of a financial instrument will fluctuate due to changes in foreign exchange rates.
The risk management process manages the Group’s exposure to fluctuations in foreign exchange rates (currency risk) through the asset and liability management process. It is the Group’s policy to reduce its exposure to currency fluctuations to acceptable levels as determined by the Board of Directors. The Board has established levels of currency risk by setting limits on currency position exposures. Positions are monitored on a daily basis and hedging strategies used to ensure positions are maintained within established limits.
The Group views the United States Dollar as its functional and presentational currency and had the following significant net exposures denominated in foreign currencies as of 31 December:
Sensitivity analysis - currency riskAll foreign currency exposures with the exception of investments in subsidiaries and associates are captured as part of the trading book. The risk of the exposures are subject to quantification via a daily VaR calculation, the results of which are disclosed in note 33 (a).
The effect of foreign currency translation on the Group’s investments in subsidiaries and associates are reported under the “foreign exchange translation reserve” under the note 21(h).
Equity price riskEquity price risk arises from fluctuations in equity indices and prices. The Board has set limits on the amount and type of investments that may be accepted. This is monitored on an ongoing basis by the Group Risk Committee. The non-trading equity price risk exposure arises from the Group’s investment portfolio.
The effect on equity valuations (as a result of a change in the fair value of equity investments held as fair value through other comprehensive income) due to a reasonably possible change in equity indices, with all other variables held constant is as follows:
Market indices
Change in equityindices
%
2013 2012
Effect onOCI
US$ ’000
Effect onOCI
US$ ’000
Doha Securities Market +/- 10% +/- - 570 Kuwait Stock Exchange +/- 10% +/- 3,349 2,278
Sensitivity to equity price movements will be on a symmetric basis, as financial instruments giving rise to non-symmetric movements are not significant.
34 FAIR VALUE MEASUREMENT
The fair value of financial assets and financial liabilities, with the exception of non-trading investments that are carried at amortised cost, approximate their carrying values. All financial instruments, other than those disclosed in the table below and in note 9 are classified as level 2. Please refer note 9 for the fair value of non-trading investments carried at amortised cost.
The Group’s primary medium and long-term financial liabilities are the term debts and subordinated liabilities. The fair values of these financial liabilities are not materially different from their carrying values, since these liabilities are repriced at intervals of three or six months, depending on the terms and conditions of the instrument and the resultant applicable margins approximate the current spreads that would apply for borrowings with similar maturities.
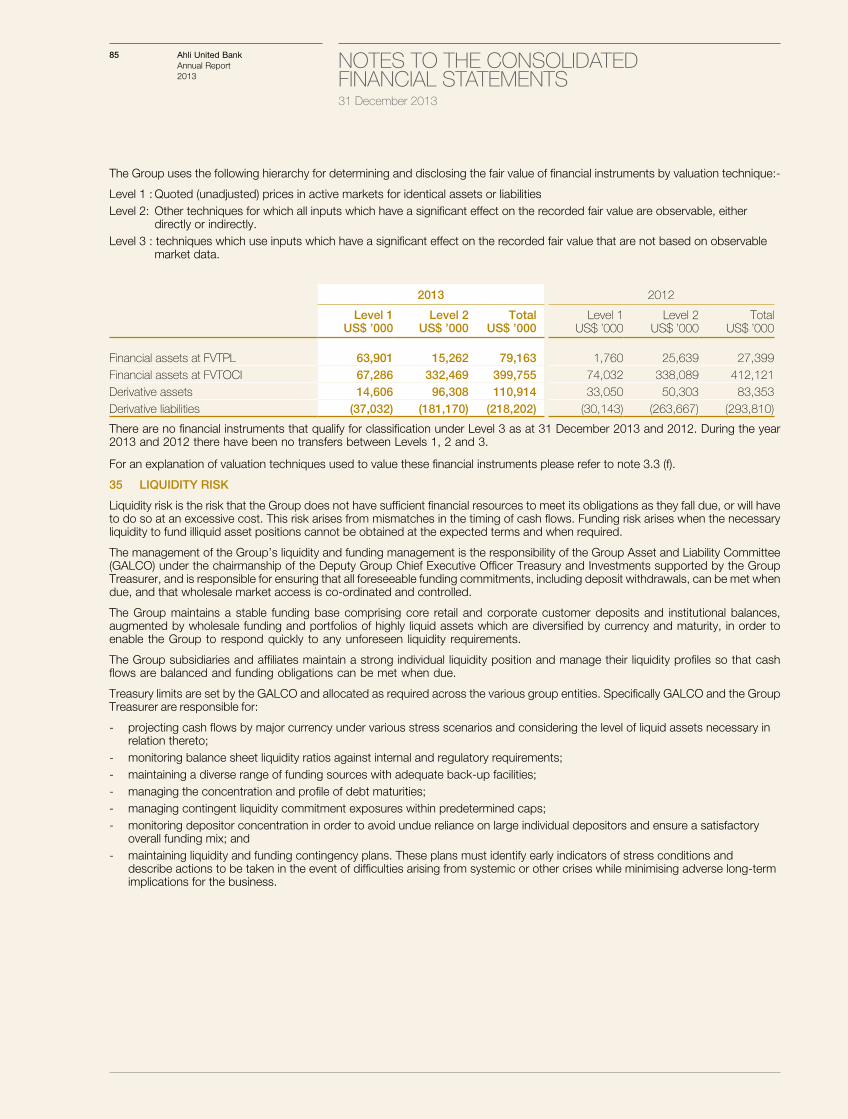
85 NOTES TO THE CONSOLIDATED FINANCIAL STATEMENTS 31 December 2013
Ahli United BankAnnual Report 2013
The Group uses the following hierarchy for determining and disclosing the fair value of financial instruments by valuation technique:-
Level 1 : Quoted (unadjusted) prices in active markets for identical assets or liabilities Level 2: Other techniques for which all inputs which have a significant effect on the recorded fair value are observable, either
directly or indirectly.Level 3 : techniques which use inputs which have a significant effect on the recorded fair value that are not based on observable
market data.
2013 2012
Level 1 US$ ’000
Level 2US$ ’000
TotalUS$ ’000
Level 1 US$ ’000
Level 2US$ ’000
TotalUS$ ’000
Financial assets at FVTPL 63,901 15,262 79,163 1,760 25,639 27,399 Financial assets at FVTOCI 67,286 332,469 399,755 74,032 338,089 412,121 Derivative assets 14,606 96,308 110,914 33,050 50,303 83,353 Derivative liabilities (37,032) (181,170) (218,202) (30,143) (263,667) (293,810)
There are no financial instruments that qualify for classification under Level 3 as at 31 December 2013 and 2012. During the year 2013 and 2012 there have been no transfers between Levels 1, 2 and 3.
For an explanation of valuation techniques used to value these financial instruments please refer to note 3.3 (f).
35 LIQUIDITY RISK
Liquidity risk is the risk that the Group does not have sufficient financial resources to meet its obligations as they fall due, or will have to do so at an excessive cost. This risk arises from mismatches in the timing of cash flows. Funding risk arises when the necessary liquidity to fund illiquid asset positions cannot be obtained at the expected terms and when required.
The management of the Group’s liquidity and funding management is the responsibility of the Group Asset and Liability Committee (GALCO) under the chairmanship of the Deputy Group Chief Executive Officer Treasury and Investments supported by the Group Treasurer, and is responsible for ensuring that all foreseeable funding commitments, including deposit withdrawals, can be met when due, and that wholesale market access is co-ordinated and controlled.
The Group maintains a stable funding base comprising core retail and corporate customer deposits and institutional balances, augmented by wholesale funding and portfolios of highly liquid assets which are diversified by currency and maturity, in order to enable the Group to respond quickly to any unforeseen liquidity requirements.
The Group subsidiaries and affiliates maintain a strong individual liquidity position and manage their liquidity profiles so that cash flows are balanced and funding obligations can be met when due.
Treasury limits are set by the GALCO and allocated as required across the various group entities. Specifically GALCO and the Group Treasurer are responsible for:
- projecting cash flows by major currency under various stress scenarios and considering the level of liquid assets necessary in relation thereto;
- monitoring balance sheet liquidity ratios against internal and regulatory requirements;- maintaining a diverse range of funding sources with adequate back-up facilities;- managing the concentration and profile of debt maturities;- managing contingent liquidity commitment exposures within predetermined caps;- monitoring depositor concentration in order to avoid undue reliance on large individual depositors and ensure a satisfactory
overall funding mix; and- maintaining liquidity and funding contingency plans. These plans must identify early indicators of stress conditions and
describe actions to be taken in the event of difficulties arising from systemic or other crises while minimising adverse long-term implications for the business.
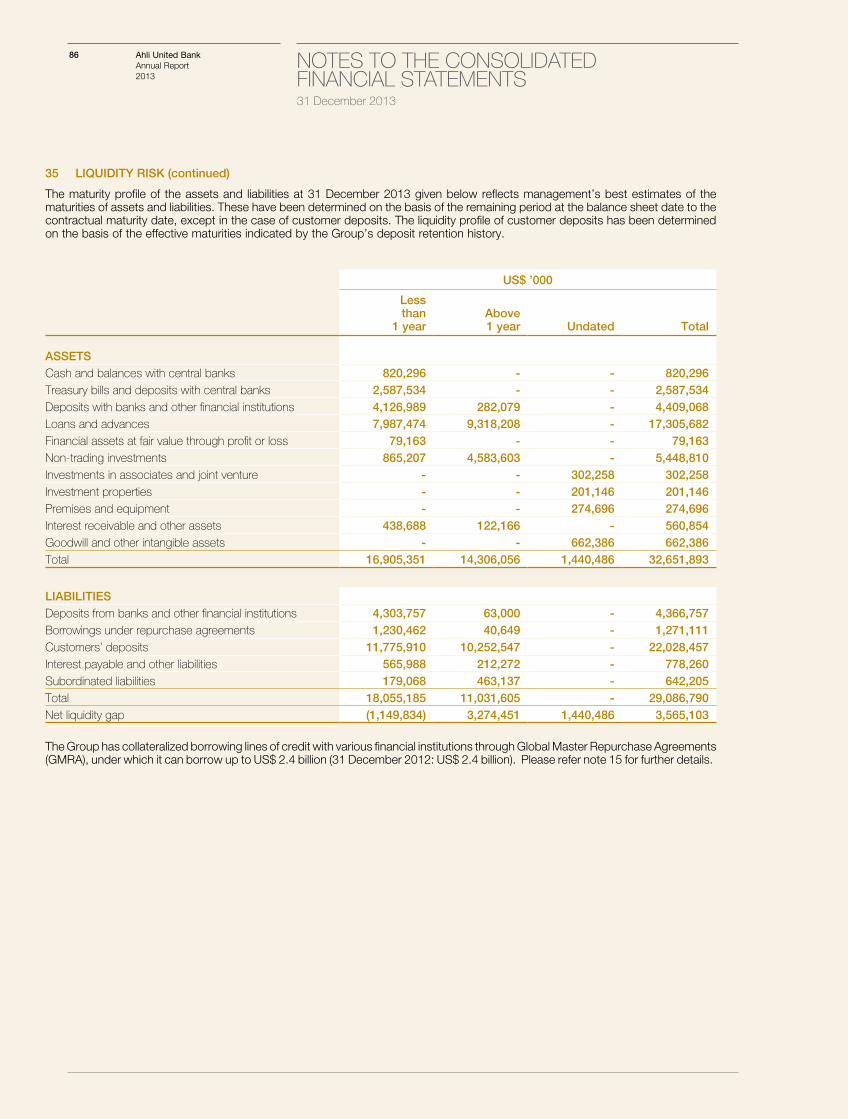
86 NOTES TO THE CONSOLIDATED FINANCIAL STATEMENTS 31 December 2013
Ahli United BankAnnual Report 2013
35 LIQUIDITY RISK (continued)
The maturity profile of the assets and liabilities at 31 December 2013 given below reflects management’s best estimates of the maturities of assets and liabilities. These have been determined on the basis of the remaining period at the balance sheet date to the contractual maturity date, except in the case of customer deposits. The liquidity profile of customer deposits has been determined on the basis of the effective maturities indicated by the Group’s deposit retention history.
US$ ’000
Lessthan
1 yearAbove1 year Undated Total
ASSETSCash and balances with central banks 820,296 - - 820,296 Treasury bills and deposits with central banks 2,587,534 - - 2,587,534 Deposits with banks and other financial institutions 4,126,989 282,079 - 4,409,068 Loans and advances 7,987,474 9,318,208 - 17,305,682 Financial assets at fair value through profit or loss 79,163 - - 79,163 Non-trading investments 865,207 4,583,603 - 5,448,810 Investments in associates and joint venture - - 302,258 302,258 Investment properties - - 201,146 201,146 Premises and equipment - - 274,696 274,696 Interest receivable and other assets 438,688 122,166 - 560,854 Goodwill and other intangible assets - - 662,386 662,386 Total 16,905,351 14,306,056 1,440,486 32,651,893
LIABILITIES Deposits from banks and other financial institutions 4,303,757 63,000 - 4,366,757 Borrowings under repurchase agreements 1,230,462 40,649 - 1,271,111 Customers’ deposits 11,775,910 10,252,547 - 22,028,457 Interest payable and other liabilities 565,988 212,272 - 778,260 Subordinated liabilities 179,068 463,137 - 642,205 Total 18,055,185 11,031,605 - 29,086,790 Net liquidity gap (1,149,834) 3,274,451 1,440,486 3,565,103
The Group has collateralized borrowing lines of credit with various financial institutions through Global Master Repurchase Agreements (GMRA), under which it can borrow up to US$ 2.4 billion (31 December 2012: US$ 2.4 billion). Please refer note 15 for further details.
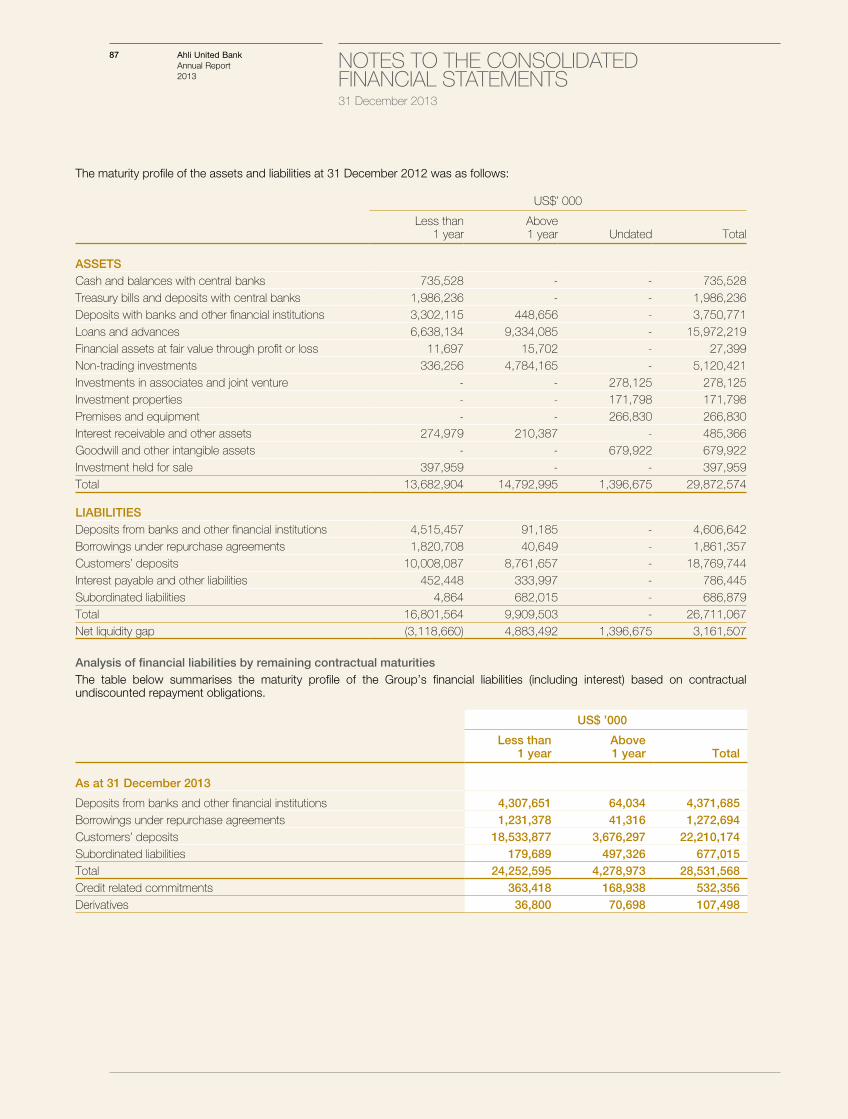
87 NOTES TO THE CONSOLIDATED FINANCIAL STATEMENTS 31 December 2013
Ahli United BankAnnual Report 2013
The maturity profile of the assets and liabilities at 31 December 2012 was as follows:
US$’ 000
Less than1 year
Above1 year Undated Total
ASSETSCash and balances with central banks 735,528 - - 735,528 Treasury bills and deposits with central banks 1,986,236 - - 1,986,236 Deposits with banks and other financial institutions 3,302,115 448,656 - 3,750,771 Loans and advances 6,638,134 9,334,085 - 15,972,219 Financial assets at fair value through profit or loss 11,697 15,702 - 27,399 Non-trading investments 336,256 4,784,165 - 5,120,421 Investments in associates and joint venture - - 278,125 278,125 Investment properties - - 171,798 171,798 Premises and equipment - - 266,830 266,830 Interest receivable and other assets 274,979 210,387 - 485,366 Goodwill and other intangible assets - - 679,922 679,922 Investment held for sale 397,959 - - 397,959 Total 13,682,904 14,792,995 1,396,675 29,872,574
LIABILITIES Deposits from banks and other financial institutions 4,515,457 91,185 - 4,606,642 Borrowings under repurchase agreements 1,820,708 40,649 - 1,861,357 Customers’ deposits 10,008,087 8,761,657 - 18,769,744 Interest payable and other liabilities 452,448 333,997 - 786,445 Subordinated liabilities 4,864 682,015 - 686,879 Total 16,801,564 9,909,503 - 26,711,067 Net liquidity gap (3,118,660) 4,883,492 1,396,675 3,161,507
Analysis of financial liabilities by remaining contractual maturitiesThe table below summarises the maturity profile of the Group’s financial liabilities (including interest) based on contractual undiscounted repayment obligations.
US$ ’000
Less than1 year
Above1 year Total
As at 31 December 2013
Deposits from banks and other financial institutions 4,307,651 64,034 4,371,685 Borrowings under repurchase agreements 1,231,378 41,316 1,272,694 Customers’ deposits 18,533,877 3,676,297 22,210,174 Subordinated liabilities 179,689 497,326 677,015 Total 24,252,595 4,278,973 28,531,568 Credit related commitments 363,418 168,938 532,356 Derivatives 36,800 70,698 107,498
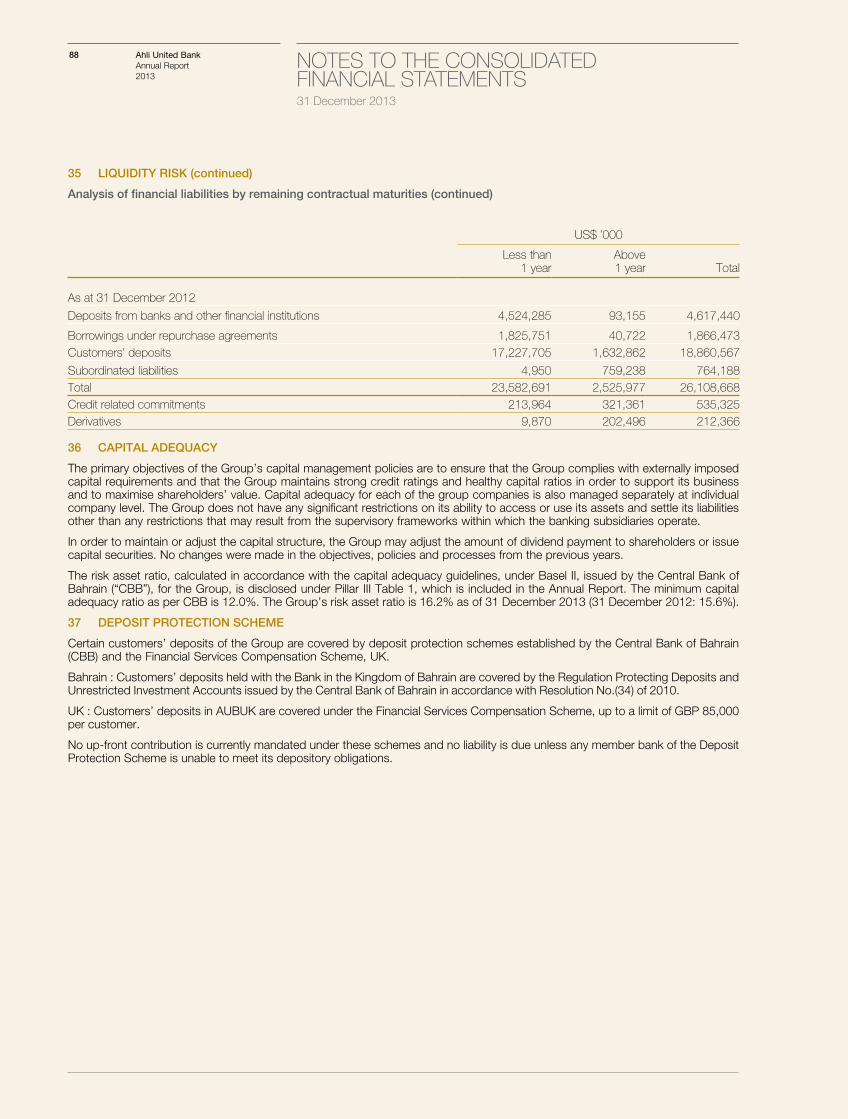
88 NOTES TO THE CONSOLIDATED FINANCIAL STATEMENTS 31 December 2013
Ahli United BankAnnual Report 2013
35 LIQUIDITY RISK (continued)
Analysis of financial liabilities by remaining contractual maturities (continued)
US$ ’000
Less than1 year
Above1 year Total
As at 31 December 2012
Deposits from banks and other financial institutions 4,524,285 93,155 4,617,440
Borrowings under repurchase agreements 1,825,751 40,722 1,866,473 Customers’ deposits 17,227,705 1,632,862 18,860,567
Subordinated liabilities 4,950 759,238 764,188 Total 23,582,691 2,525,977 26,108,668 Credit related commitments 213,964 321,361 535,325 Derivatives 9,870 202,496 212,366
36 CAPITAL ADEQUACY
The primary objectives of the Group’s capital management policies are to ensure that the Group complies with externally imposed capital requirements and that the Group maintains strong credit ratings and healthy capital ratios in order to support its business and to maximise shareholders’ value. Capital adequacy for each of the group companies is also managed separately at individual company level. The Group does not have any significant restrictions on its ability to access or use its assets and settle its liabilities other than any restrictions that may result from the supervisory frameworks within which the banking subsidiaries operate.
In order to maintain or adjust the capital structure, the Group may adjust the amount of dividend payment to shareholders or issue capital securities. No changes were made in the objectives, policies and processes from the previous years.
The risk asset ratio, calculated in accordance with the capital adequacy guidelines, under Basel II, issued by the Central Bank of Bahrain (“CBB”), for the Group, is disclosed under Pillar III Table 1, which is included in the Annual Report. The minimum capital adequacy ratio as per CBB is 12.0%. The Group’s risk asset ratio is 16.2% as of 31 December 2013 (31 December 2012: 15.6%).
37 DEPOSIT PROTECTION SCHEME
Certain customers’ deposits of the Group are covered by deposit protection schemes established by the Central Bank of Bahrain (CBB) and the Financial Services Compensation Scheme, UK.
Bahrain : Customers’ deposits held with the Bank in the Kingdom of Bahrain are covered by the Regulation Protecting Deposits and Unrestricted Investment Accounts issued by the Central Bank of Bahrain in accordance with Resolution No.(34) of 2010.
UK : Customers’ deposits in AUBUK are covered under the Financial Services Compensation Scheme, up to a limit of GBP 85,000 per customer.
No up-front contribution is currently mandated under these schemes and no liability is due unless any member bank of the Deposit Protection Scheme is unable to meet its depository obligations.
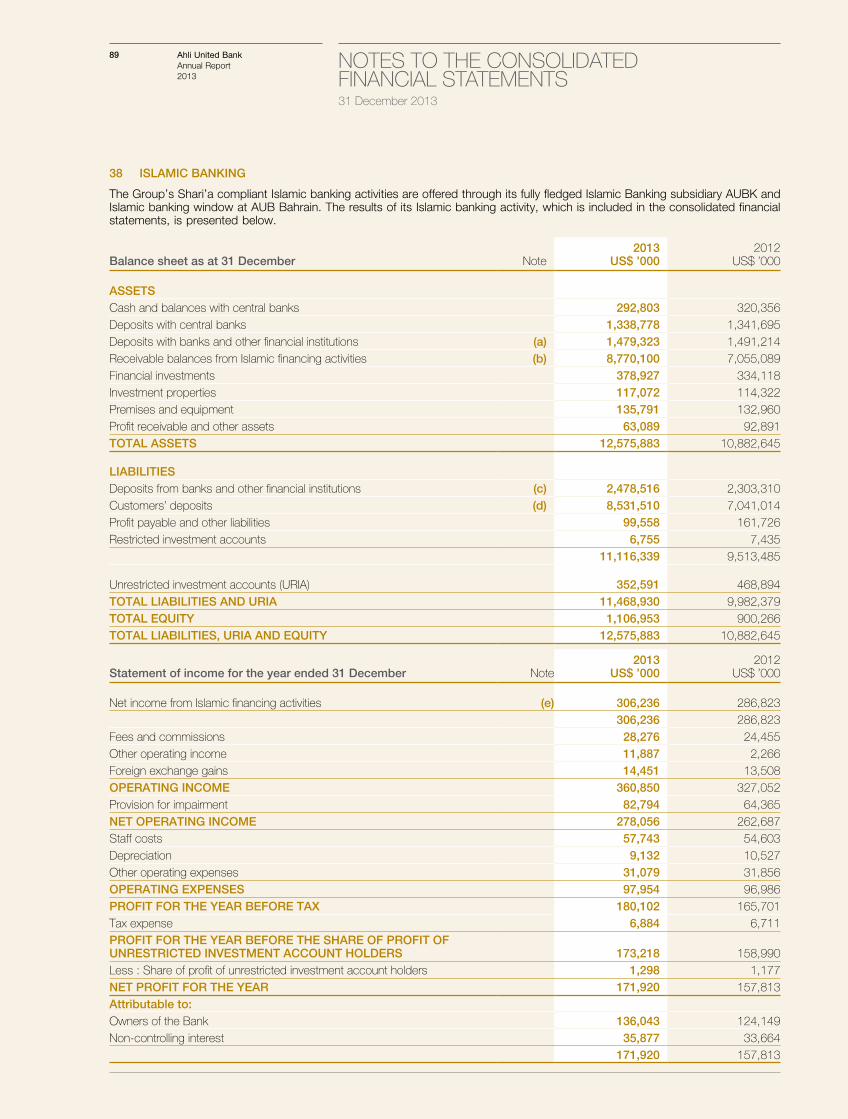
89 NOTES TO THE CONSOLIDATED FINANCIAL STATEMENTS 31 December 2013
Ahli United BankAnnual Report 2013
38 ISLAMIC BANKING
The Group’s Shari’a compliant Islamic banking activities are offered through its fully fledged Islamic Banking subsidiary AUBK and Islamic banking window at AUB Bahrain. The results of its Islamic banking activity, which is included in the consolidated financial statements, is presented below.
Balance sheet as at 31 December Note2013
US$ ’0002012
US$ ’000
ASSETSCash and balances with central banks 292,803 320,356 Deposits with central banks 1,338,778 1,341,695 Deposits with banks and other financial institutions (a) 1,479,323 1,491,214 Receivable balances from Islamic financing activities (b) 8,770,100 7,055,089 Financial investments 378,927 334,118 Investment properties 117,072 114,322 Premises and equipment 135,791 132,960 Profit receivable and other assets 63,089 92,891 TOTAL ASSETS 12,575,883 10,882,645
LIABILITIESDeposits from banks and other financial institutions (c) 2,478,516 2,303,310 Customers’ deposits (d) 8,531,510 7,041,014 Profit payable and other liabilities 99,558 161,726 Restricted investment accounts 6,755 7,435
11,116,339 9,513,485
Unrestricted investment accounts (URIA) 352,591 468,894 TOTAL LIABILITIES AND URIA 11,468,930 9,982,379 TOTAL EQUITY 1,106,953 900,266 TOTAL LIABILITIES, URIA AND EQUITY 12,575,883 10,882,645
Statement of income for the year ended 31 December Note2013
US$ ’0002012
US$ ’000
Net income from Islamic financing activities (e) 306,236 286,823 306,236 286,823
Fees and commissions 28,276 24,455 Other operating income 11,887 2,266 Foreign exchange gains 14,451 13,508 OPERATING INCOME 360,850 327,052 Provision for impairment 82,794 64,365 NET OPERATING INCOME 278,056 262,687 Staff costs 57,743 54,603 Depreciation 9,132 10,527 Other operating expenses 31,079 31,856 OPERATING EXPENSES 97,954 96,986 PROFIT FOR THE YEAR BEFORE TAX 180,102 165,701 Tax expense 6,884 6,711 PROFIT FOR THE YEAR BEFORE THE SHARE OF PROFIT OF UNRESTRICTED INVESTMENT ACCOUNT HOLDERS 173,218 158,990 Less : Share of profit of unrestricted investment account holders 1,298 1,177 NET PROFIT FOR THE YEAR 171,920 157,813 Attributable to:Owners of the Bank 136,043 124,149 Non-controlling interest 35,877 33,664
171,920 157,813
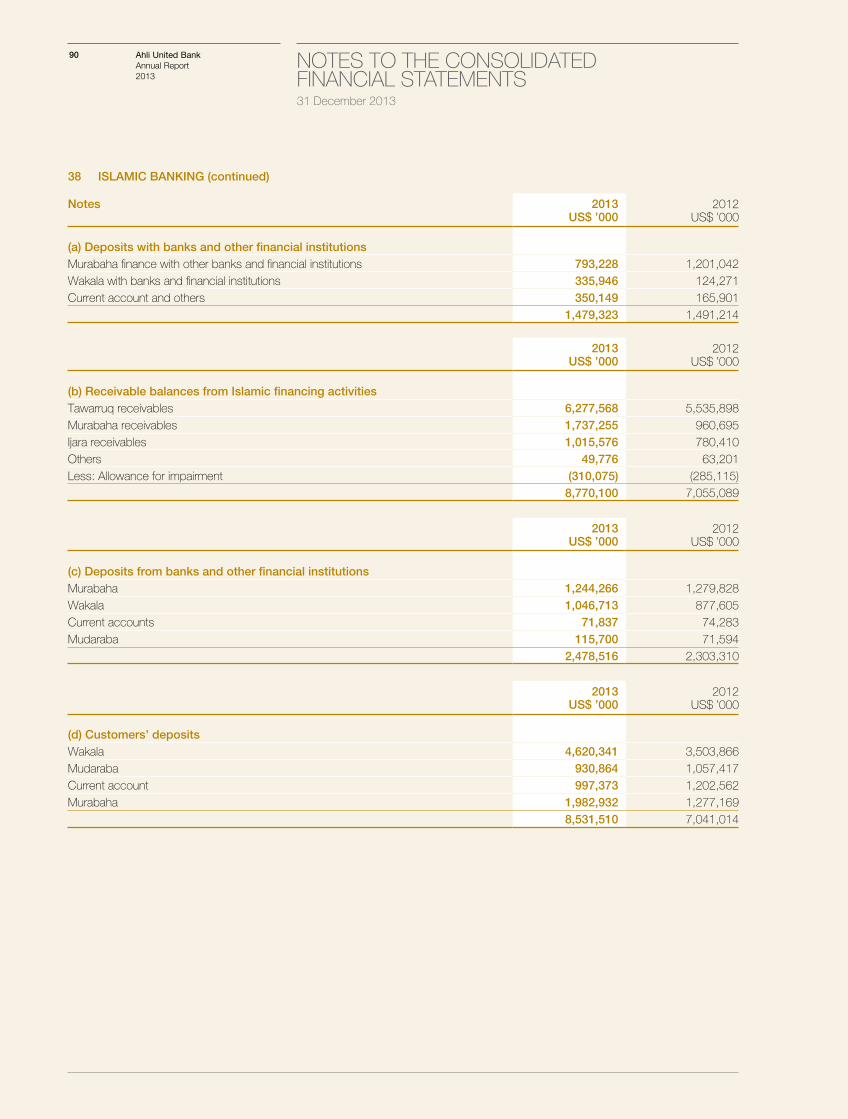
90 NOTES TO THE CONSOLIDATED FINANCIAL STATEMENTS 31 December 2013
Ahli United BankAnnual Report 2013
38 ISLAMIC BANKING (continued)
Notes 2013US$ ’000
2012US$ ’000
(a) Deposits with banks and other financial institutionsMurabaha finance with other banks and financial institutions 793,228 1,201,042 Wakala with banks and financial institutions 335,946 124,271 Current account and others 350,149 165,901
1,479,323 1,491,214
2013US$ ’000
2012US$ ’000
(b) Receivable balances from Islamic financing activities Tawarruq receivables 6,277,568 5,535,898 Murabaha receivables 1,737,255 960,695 Ijara receivables 1,015,576 780,410 Others 49,776 63,201 Less: Allowance for impairment (310,075) (285,115)
8,770,100 7,055,089
2013US$ ’000
2012US$ ’000
(c) Deposits from banks and other financial institutionsMurabaha 1,244,266 1,279,828 Wakala 1,046,713 877,605 Current accounts 71,837 74,283 Mudaraba 115,700 71,594
2,478,516 2,303,310
2013US$ ’000
2012US$ ’000
(d) Customers’ depositsWakala 4,620,341 3,503,866 Mudaraba 930,864 1,057,417 Current account 997,373 1,202,562 Murabaha 1,982,932 1,277,169
8,531,510 7,041,014
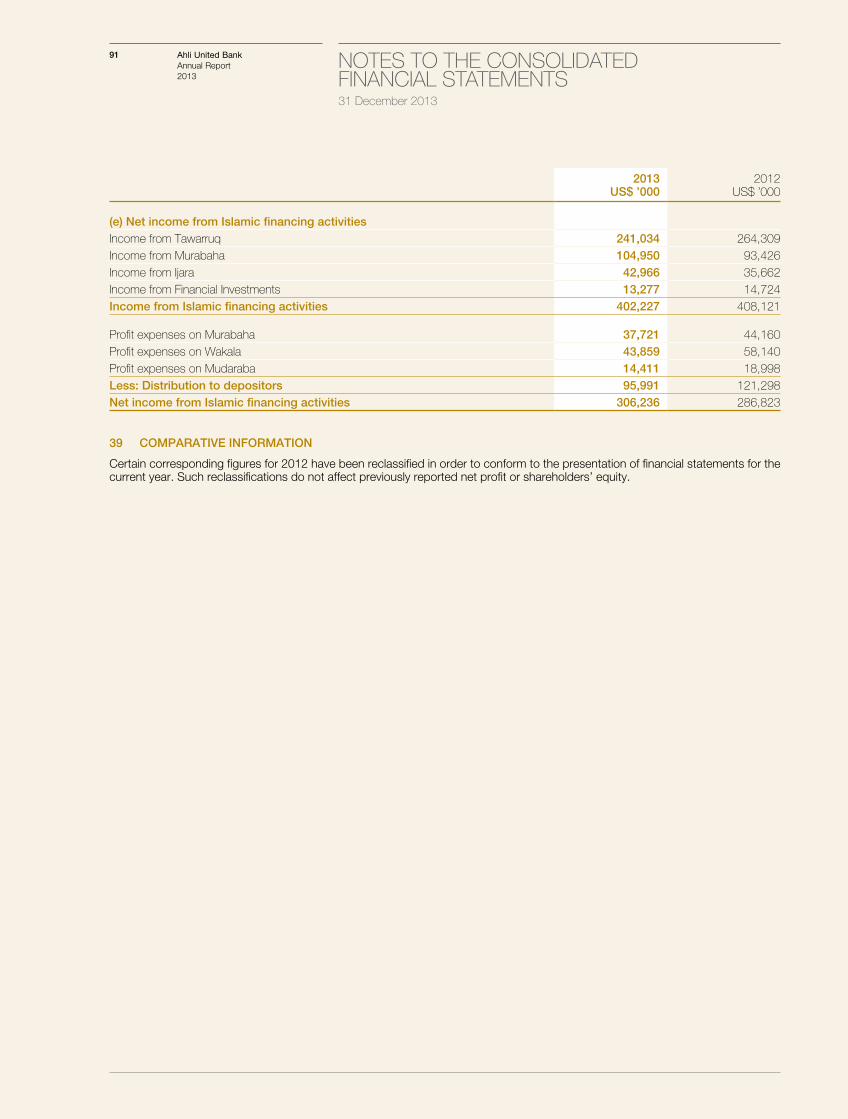
91 NOTES TO THE CONSOLIDATED FINANCIAL STATEMENTS 31 December 2013
Ahli United BankAnnual Report 2013
2013US$ ’000
2012US$ ’000
(e) Net income from Islamic financing activitiesIncome from Tawarruq 241,034 264,309 Income from Murabaha 104,950 93,426 Income from Ijara 42,966 35,662 Income from Financial Investments 13,277 14,724 Income from Islamic financing activities 402,227 408,121
Profit expenses on Murabaha 37,721 44,160 Profit expenses on Wakala 43,859 58,140 Profit expenses on Mudaraba 14,411 18,998 Less: Distribution to depositors 95,991 121,298 Net income from Islamic financing activities 306,236 286,823
39 COMPARATIVE INFORMATION
Certain corresponding figures for 2012 have been reclassified in order to conform to the presentation of financial statements for the current year. Such reclassifications do not affect previously reported net profit or shareholders’ equity.
92 NOTES TO THE CONSOLIDATED FINANCIAL STATEMENTS 31 December 2013
Ahli United BankAnnual Report 2013
92 Ahli United BankAnnual Report 2013
Pillar III Disclosures - Basel II 31 December 2013
Contents9393949596
104107107108108108108
Introduction to the Central Bank of Bahrain’s Basel II guidelinesPillar III quantitative & qualitative disclosures Capital structureGroup risk governance structureCredit risk managementMarket riskLiquidity risk and funding managementOperational riskInformation technology riskStrategic riskLegal, compliance, regulatory and reputational risksEnvironmental risk
93 Ahli United BankAnnual Report 2013
INTRODUCTION TO THE CENTRAL BANK OF BAHRAIN’S BASEL II GUIDELINES
The Central Bank of Bahrain (CBB) Basel II Guidelines, based upon the Bank of International Settlements (BIS) Revised Framework – ‘International Convergence of Capital Measurement and Capital Standards’, were introduced on 1 January 2008. Basel II is structured around three ‘Pillars’: Pillar I - Minimum Capital Requirements; Pillar II – the Supervisory Review Process and the Internal Capital Adequacy Assessment Process (ICAAP); and Pillar III - Market Discipline.
Group StructureThe public disclosures under this section have been prepared in accordance with the CBB Rules concerning Public Disclosure Module (“PD”), section PD-1: Annual Disclosure Requirements. The disclosures under this section are applicable to Ahli United Bank B.S.C. (the “Bank”), which is the parent bank incorporated in Bahrain. The Bank operates under a retail banking license issued by the CBB. The Bank and its subsidiaries (as detailed under note 2 to the audited consolidated financial statements) are collectively known as the “Group”.
Pillar I – Minimum Capital RequirementsPillar I deals with the basis for the computation of the regulatory capital ratio. It defines the various classes and the calculation of Risk Weighted Assets (RWAs) in respect of credit risk, market risk and operational risk, as well as deriving the regulatory capital base. The capital adequacy ratio is then calculated as the ratio of the Bank’s regulatory capital to its total RWAs. All Bahrain incorporated banks are currently required to maintain a minimum capital adequacy ratio of 12%. In addition, the CBB requires banks to maintain an additional 0.5% buffer above the minimum capital adequacy ratio.
The Group ensures that each subsidiary maintains sufficient capital levels for their respective legal and compliance purposes.
Credit riskBasel II provides three approaches to the calculation of credit risk regulatory capital. The Standardised approach which the Bank has adopted, requires banks to use external credit ratings to determine the risk weightings applied to rated counterparties, and groups other counterparties into broad categories and applies standardised risk weightings to these categories.
Market riskThe Bank has adopted the Standardised approach for determining the market risk capital requirement.
Operational riskUnder the basic indicator approach, which the Bank has adopted for operational risk, the regulatory capital requirement for operational risk is calculated by applying a co-efficient of 15 per cent to the average gross income for the preceding three financial years.
Pillar II – The Supervisory Review and Evaluation ProcessPillar II involves the process of supervisory review of a financial institution’s risk management framework and its capital adequacy.
Accordingly, this involves both, the Bank and its regulators taking a view on whether additional capital should be held against risks not covered in Pillar I. Part of the Pillar II process is the Internal Capital Adequacy Assessment Process (ICAAP) which is the Bank’s self assessment of risks not captured by Pillar I.
As part of the CBB’s Pillar II guidelines, each bank is required to be individually reviewed and assessed by the CBB with the intention of setting individual minimum capital adequacy ratios. The Bank is currently required to maintain a 12 per cent minimum capital adequacy ratio at group level.
Pillar III – Market DisciplineThe third pillar is related to market discipline and requires the Bank to publish detailed qualitative and quantitative information of its risk management and capital adequacy policies and processes to complement the first two pillars and the associated supervisory review process. The disclosures in this report are in addition to the disclosures set out in the audited consolidated financial statements of the Group for the year ended 31 December 2013.
PILLAR III QUANTITATIVE AND QUALITATIVE DISCLOSURES
For the purpose of computing regulatory minimum capital requirements, the Group follows the rules as laid out under the CBB Rulebook module PCD: Prudential Consolidation and Deduction Requirements, PCD-1 and PCD-2 and the Capital Adequacy (CA) Module. Accordingly,
a) All subsidiaries as per note 2 to the audited consolidated financial statements are consolidated on a line by line basis in accordance with International Financial Reporting Standards (IFRS). Non-controlling interest arising on consolidation is reported as part of Tier 1 capital;
b) Investments in associates as reported under note 10 to the audited consolidated financial statements are pro-rata consolidated for the purpose of regulatory minimum capital requirements and capital deducted from Tier 1 and 2. The prorated capital is included under Tier 1 and Tier 2 respectively as aggregation;
c) Goodwill is deducted from Tier 1 capital;d) Subordinated term debts, as reported under liabilities in the consolidated balance sheet, are reported as part of Tier 2 capital,
subject to maximum thresholds and adjusted for remaining life;
Pillar III Disclosures - Basel II 31 December 2013
93 Ahli United BankAnnual Report 2013
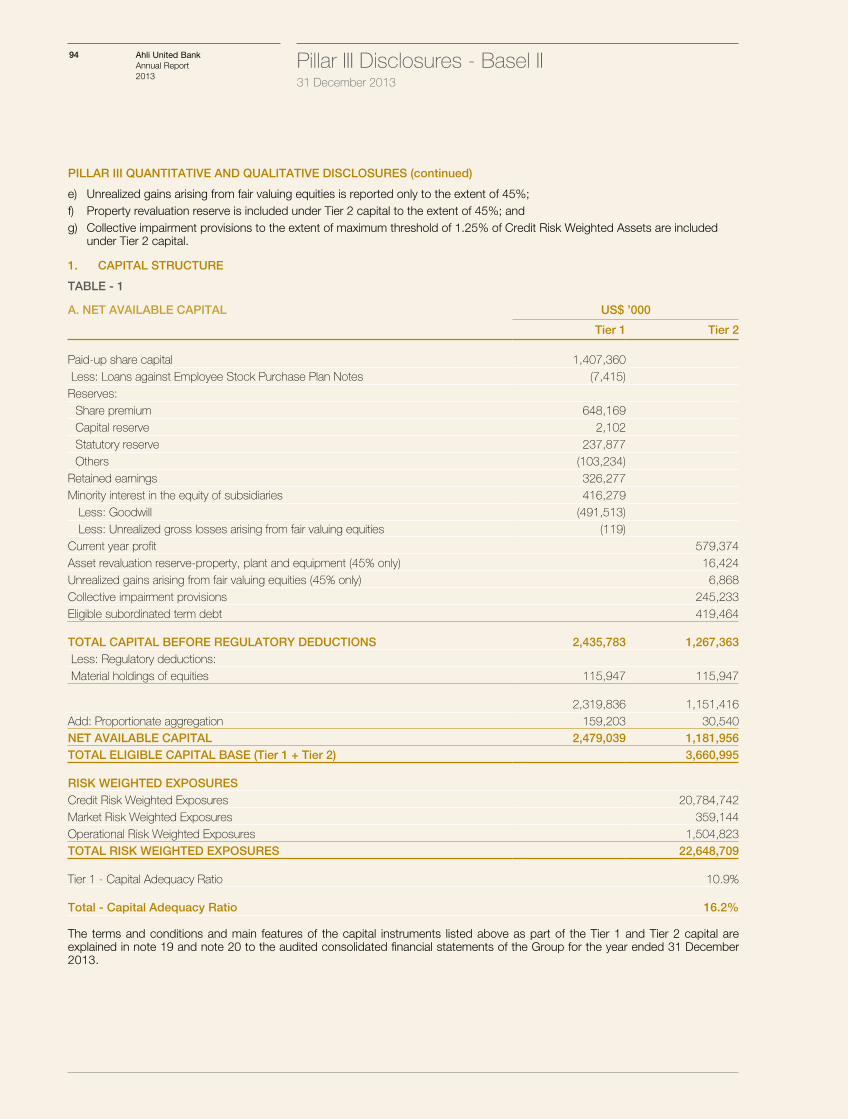
Pillar III Disclosures - Basel II 31 December 2013
94 Ahli United BankAnnual Report 2013
PILLAR III QUANTITATIVE AND QUALITATIVE DISCLOSURES (continued)
e) Unrealized gains arising from fair valuing equities is reported only to the extent of 45%;f) Property revaluation reserve is included under Tier 2 capital to the extent of 45%; andg) Collective impairment provisions to the extent of maximum threshold of 1.25% of Credit Risk Weighted Assets are included
under Tier 2 capital.
1. CAPITAL STRUCTURE
TABLE - 1
A. NET AVAILABLE CAPITAL US$ ’000
Tier 1 Tier 2
Paid-up share capital 1,407,360 Less: Loans against Employee Stock Purchase Plan Notes (7,415)Reserves:
Share premium 648,169Capital reserve 2,102Statutory reserve 237,877Others (103,234)
Retained earnings 326,277Minority interest in the equity of subsidiaries 416,279
Less: Goodwill (491,513) Less: Unrealized gross losses arising from fair valuing equities (119)
Current year profit 579,374Asset revaluation reserve-property, plant and equipment (45% only) 16,424Unrealized gains arising from fair valuing equities (45% only) 6,868Collective impairment provisions 245,233Eligible subordinated term debt 419,464
TOTAL CAPITAL BEFORE REGULATORY DEDUCTIONS 2,435,783 1,267,363 Less: Regulatory deductions: Material holdings of equities 115,947 115,947
2,319,836 1,151,416Add: Proportionate aggregation 159,203 30,540NET AVAILABLE CAPITAL 2,479,039 1,181,956TOTAL ELIGIBLE CAPITAL BASE (Tier 1 + Tier 2) 3,660,995
RISK WEIGHTED EXPOSURES Credit Risk Weighted Exposures 20,784,742Market Risk Weighted Exposures 359,144Operational Risk Weighted Exposures 1,504,823TOTAL RISK WEIGHTED EXPOSURES 22,648,709
Tier 1 - Capital Adequacy Ratio 10.9%
Total - Capital Adequacy Ratio 16.2%
The terms and conditions and main features of the capital instruments listed above as part of the Tier 1 and Tier 2 capital are explained in note 19 and note 20 to the audited consolidated financial statements of the Group for the year ended 31 December 2013.
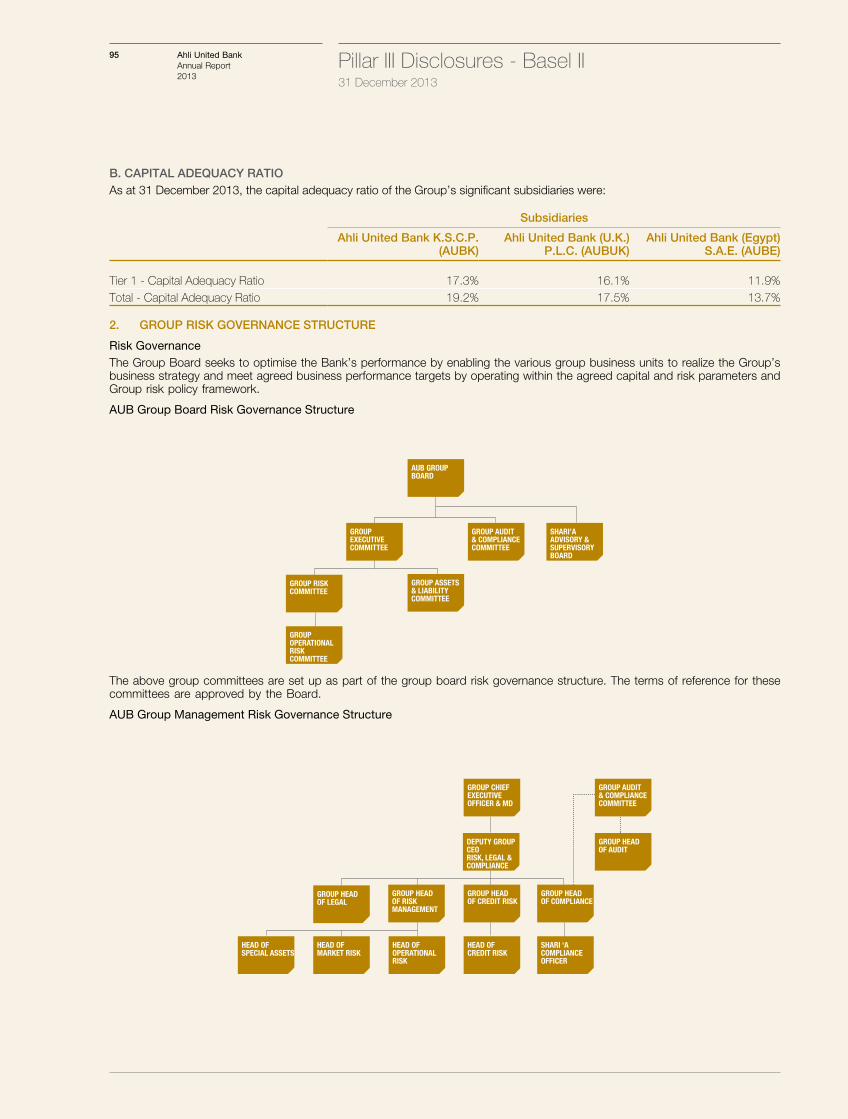
Pillar III Disclosures - Basel II 31 December 2013
95 Ahli United BankAnnual Report 2013
B. CAPITAL ADEQUACY RATIOAs at 31 December 2013, the capital adequacy ratio of the Group’s significant subsidiaries were:
Subsidiaries
Ahli United Bank K.S.C.P. (AUBK)
Ahli United Bank (U.K.) P.L.C. (AUBUK)
Ahli United Bank (Egypt) S.A.E. (AUBE)
Tier 1 - Capital Adequacy Ratio 17.3% 16.1% 11.9%Total - Capital Adequacy Ratio 19.2% 17.5% 13.7%
2. GROUP RISK GOVERNANCE STRUCTURE
Risk GovernanceThe Group Board seeks to optimise the Bank’s performance by enabling the various group business units to realize the Group’s business strategy and meet agreed business performance targets by operating within the agreed capital and risk parameters and Group risk policy framework.
AUB Group Board Risk Governance Structure
The above group committees are set up as part of the group board risk governance structure. The terms of reference for these committees are approved by the Board.
AUB Group Management Risk Governance Structure
AUB GROUPBOARD
SHARI’AADVISORY & SUPERVISORYBOARD
GROUP AUDIT & COMPLIANCECOMMITTEE
GROUP EXECUTIVECOMMITTEE
GROUP OPERATIONALRISK COMMITTEE
GROUP ASSETS & LIABILITYCOMMITTEE
GROUP RISKCOMMITTEE
GROUP CHIEFEXECUTIVE OFFICER & MD
DEPUTY GROUP CEORISK, LEGAL &COMPLIANCE
HEAD OFOPERATIONAL RISK
GROUP HEAD OF CREDIT RISK
GROUP HEAD OF COMPLIANCE
HEAD OFCREDIT RISK
SHARI ‘ACOMPLIANCEOFFICER
GROUP HEAD OF LEGAL
GROUP HEAD OF RISK MANAGEMENT
HEAD OFMARKET RISK
HEAD OFSPECIAL ASSETS
GROUP AUDIT& COMPLIANCECOMMITTEE
GROUP HEAD OF AUDIT
Pillar III Disclosures - Basel II 31 December 2013
96 Ahli United BankAnnual Report 2013
2. GROUP RISK GOVERNANCE STRUCTURE (continued)
The Board approves the risk parameters and the Group Risk Committee monitors the Group’s risk profile against these parameters.
The Deputy Group CEO – Risk, Legal and Compliance, under the delegated authority of the Group CEO & MD, supported by the Group Head of Risk Management and the Group Head of Credit Risk has responsibility for ensuring effective risk management and control. Within Group Risk Management, specialist risk-type heads and their teams are responsible for risk oversight and establishing appropriate risk control frameworks.
Internal Audit is responsible for the independent review of risk management and the Group’s risk control environment.
The Board and its Executive Committee receive quarterly risk updates including detailed risk exposures analysis reports.
The Board approves all risk policies as well as the Group risk framework on an annual basis.
The Group Audit Committee considers the adequacy and effectiveness of the Group risk control framework and receives quarterly updates on any control issues, regulatory and compliance related issues.
Systems and procedures are in place to identify, control and report on all major risks.
3. CREDIT RISK MANAGEMENT
Credit risk is the risk of financial loss if a customer or counterparty fails to meet an obligation under a contract. It arises principally from lending, trade finance and treasury activities. Credit risk also arises where assets are held in the form of debt securities, the value of which may fall.
The Group has policies and procedures in place to monitor and manage these risks and the Group Risk Management function provides high-level centralized oversight and management of credit risk. The specific responsibilities of Group Risk Management are to:
- Set credit policy, risk appetite for credit risk exposure to specific market sectors;- Control exposures to sovereign entities, banks and other financial institutions and set risk ratings for individual exposures. Credit
and settlement risk limits to counterparties in these sectors are approved and managed by Group Risk Management, to optimize the use of credit availability and avoid risk concentration;
- Control cross- border exposures, through the centralized setting of country limits with sub-limits by maturity and type of business;- Manage large credit exposures, ensuring that concentrations of exposure by counterparty, sector or geography remain within
internal and regulatory limits in relation to the Group’s capital base;- Maintain the Group’s Internal Risk Rating framework;- Manage watchlisted and criticised asset portfolios and recommend appropriate level of provisioning and write-offs;- Report to the Group Risk Committee, Audit Committee and the Board of Directors on all relevant aspects of the Group’s credit
risk portfolio. Regular reports include detailed analysis of:- risk concentrations- corporate and retail portfolio performance- specific higher-risk portfolio segments, e.g. real estate- individual large impaired accounts, and details of impairment charges- country limits, cross- border exposures
- Specialised management and control of all non-performing assets;- Manage and direct credit risk management systems initiatives; and- Interface, for credit- related issues, with external parties including the CBB, rating agencies, investment analysts, etc.
All credit proposals are subjected to a thorough comprehensive risk assessment which examines the customer’s financial condition and trading performance, nature of the business, quality of management and market position. In addition our internal risk rating model scores these quantitative and qualitative factors. The credit approval decision is then made and terms and conditions set. Exposure limits are based on the aggregate exposure to the counterparty and any connected entities across the AUB Group. All credit exposures are reviewed at least annually.
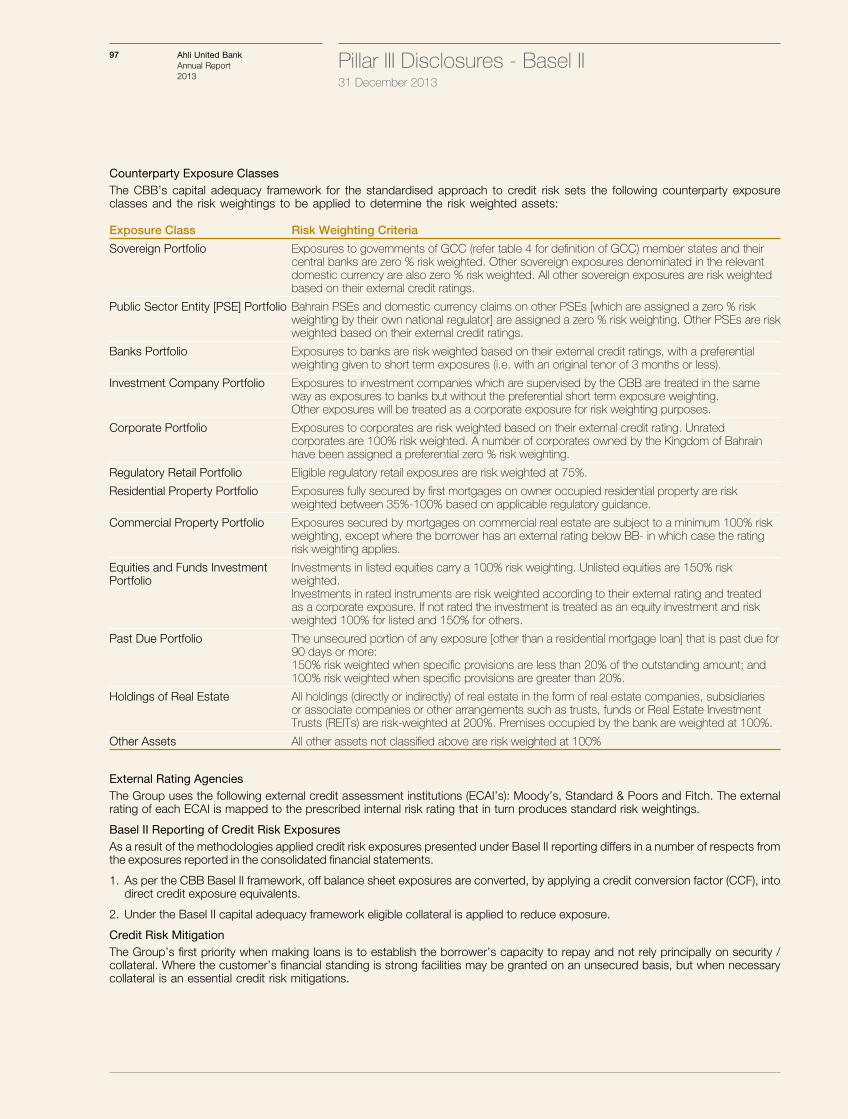
Pillar III Disclosures - Basel II 31 December 2013
97 Ahli United BankAnnual Report 2013
Counterparty Exposure ClassesThe CBB’s capital adequacy framework for the standardised approach to credit risk sets the following counterparty exposure classes and the risk weightings to be applied to determine the risk weighted assets:
Exposure Class Risk Weighting Criteria
Sovereign Portfolio Exposures to governments of GCC (refer table 4 for definition of GCC) member states and their central banks are zero % risk weighted. Other sovereign exposures denominated in the relevant domestic currency are also zero % risk weighted. All other sovereign exposures are risk weighted based on their external credit ratings.
Public Sector Entity [PSE] Portfolio Bahrain PSEs and domestic currency claims on other PSEs [which are assigned a zero % risk weighting by their own national regulator] are assigned a zero % risk weighting. Other PSEs are risk weighted based on their external credit ratings.
Banks Portfolio Exposures to banks are risk weighted based on their external credit ratings, with a preferential weighting given to short term exposures (i.e. with an original tenor of 3 months or less).
Investment Company Portfolio Exposures to investment companies which are supervised by the CBB are treated in the same way as exposures to banks but without the preferential short term exposure weighting.Other exposures will be treated as a corporate exposure for risk weighting purposes.
Corporate Portfolio Exposures to corporates are risk weighted based on their external credit rating. Unrated corporates are 100% risk weighted. A number of corporates owned by the Kingdom of Bahrain have been assigned a preferential zero % risk weighting.
Regulatory Retail Portfolio Eligible regulatory retail exposures are risk weighted at 75%.
Residential Property Portfolio Exposures fully secured by first mortgages on owner occupied residential property are risk weighted between 35%-100% based on applicable regulatory guidance.
Commercial Property Portfolio Exposures secured by mortgages on commercial real estate are subject to a minimum 100% risk weighting, except where the borrower has an external rating below BB- in which case the rating risk weighting applies.
Equities and Funds Investment Portfolio
Investments in listed equities carry a 100% risk weighting. Unlisted equities are 150% risk weighted.Investments in rated instruments are risk weighted according to their external rating and treated as a corporate exposure. If not rated the investment is treated as an equity investment and risk weighted 100% for listed and 150% for others.
Past Due Portfolio The unsecured portion of any exposure [other than a residential mortgage loan] that is past due for 90 days or more:150% risk weighted when specific provisions are less than 20% of the outstanding amount; and100% risk weighted when specific provisions are greater than 20%.
Holdings of Real Estate All holdings (directly or indirectly) of real estate in the form of real estate companies, subsidiaries or associate companies or other arrangements such as trusts, funds or Real Estate Investment Trusts (REITs) are risk-weighted at 200%. Premises occupied by the bank are weighted at 100%.
Other Assets All other assets not classified above are risk weighted at 100%
External Rating AgenciesThe Group uses the following external credit assessment institutions (ECAI’s): Moody’s, Standard & Poors and Fitch. The external rating of each ECAI is mapped to the prescribed internal risk rating that in turn produces standard risk weightings.
Basel II Reporting of Credit Risk ExposuresAs a result of the methodologies applied credit risk exposures presented under Basel II reporting differs in a number of respects from the exposures reported in the consolidated financial statements.
1. As per the CBB Basel II framework, off balance sheet exposures are converted, by applying a credit conversion factor (CCF), into direct credit exposure equivalents.
2. Under the Basel II capital adequacy framework eligible collateral is applied to reduce exposure.
Credit Risk Mitigation The Group’s first priority when making loans is to establish the borrower’s capacity to repay and not rely principally on security / collateral. Where the customer’s financial standing is strong facilities may be granted on an unsecured basis, but when necessary collateral is an essential credit risk mitigations.
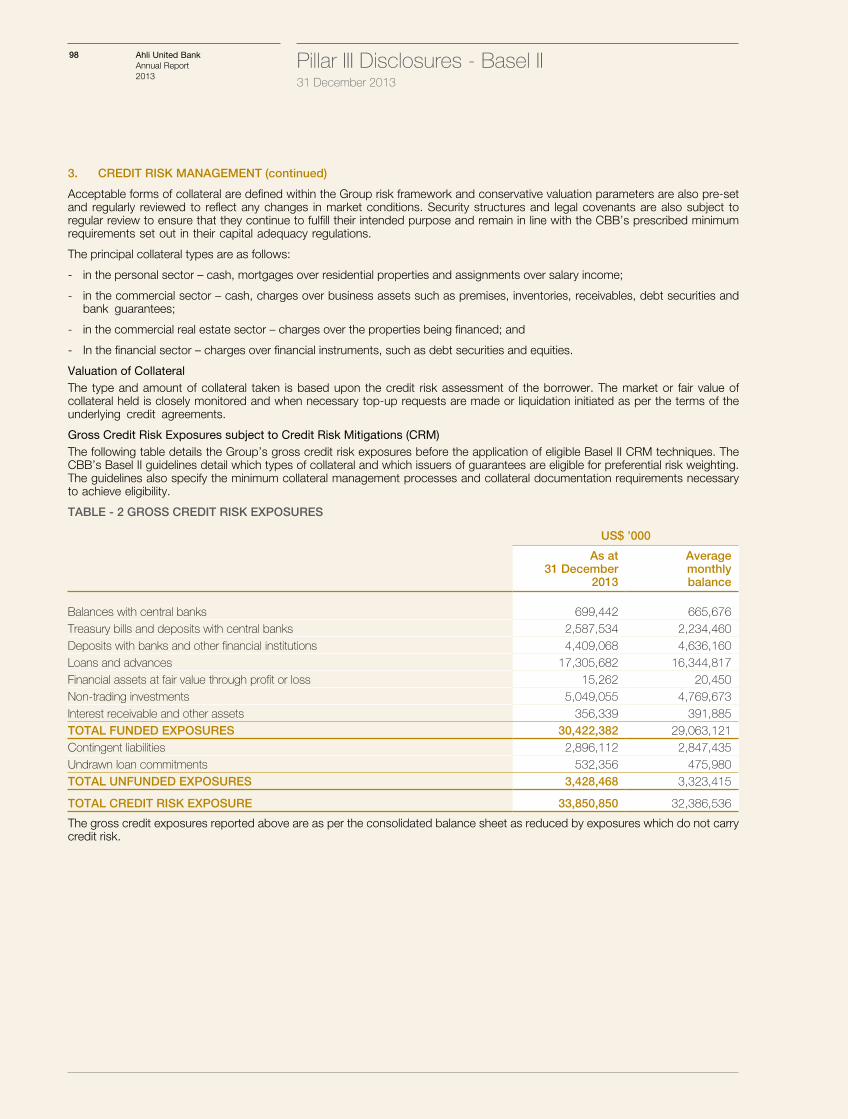
Pillar III Disclosures - Basel II 31 December 2013
98 Ahli United BankAnnual Report 2013
3. CREDIT RISK MANAGEMENT (continued)
Acceptable forms of collateral are defined within the Group risk framework and conservative valuation parameters are also pre-set and regularly reviewed to reflect any changes in market conditions. Security structures and legal covenants are also subject to regular review to ensure that they continue to fulfill their intended purpose and remain in line with the CBB’s prescribed minimum requirements set out in their capital adequacy regulations.
The principal collateral types are as follows:
- in the personal sector – cash, mortgages over residential properties and assignments over salary income;
- in the commercial sector – cash, charges over business assets such as premises, inventories, receivables, debt securities and bank guarantees;
- in the commercial real estate sector – charges over the properties being financed; and
- In the financial sector – charges over financial instruments, such as debt securities and equities.
Valuation of CollateralThe type and amount of collateral taken is based upon the credit risk assessment of the borrower. The market or fair value of collateral held is closely monitored and when necessary top-up requests are made or liquidation initiated as per the terms of the underlying credit agreements.
Gross Credit Risk Exposures subject to Credit Risk Mitigations (CRM)The following table details the Group’s gross credit risk exposures before the application of eligible Basel II CRM techniques. The CBB’s Basel II guidelines detail which types of collateral and which issuers of guarantees are eligible for preferential risk weighting. The guidelines also specify the minimum collateral management processes and collateral documentation requirements necessary to achieve eligibility.
TABLE - 2 GROSS CREDIT RISK EXPOSURES
US$ ’000
As at 31 December
2013
Averagemonthlybalance
Balances with central banks 699,442 665,676Treasury bills and deposits with central banks 2,587,534 2,234,460Deposits with banks and other financial institutions 4,409,068 4,636,160Loans and advances 17,305,682 16,344,817Financial assets at fair value through profit or loss 15,262 20,450Non-trading investments 5,049,055 4,769,673Interest receivable and other assets 356,339 391,885TOTAL FUNDED EXPOSURES 30,422,382 29,063,121Contingent liabilities 2,896,112 2,847,435Undrawn loan commitments 532,356 475,980TOTAL UNFUNDED EXPOSURES 3,428,468 3,323,415
TOTAL CREDIT RISK EXPOSURE 33,850,850 32,386,536
The gross credit exposures reported above are as per the consolidated balance sheet as reduced by exposures which do not carry credit risk.
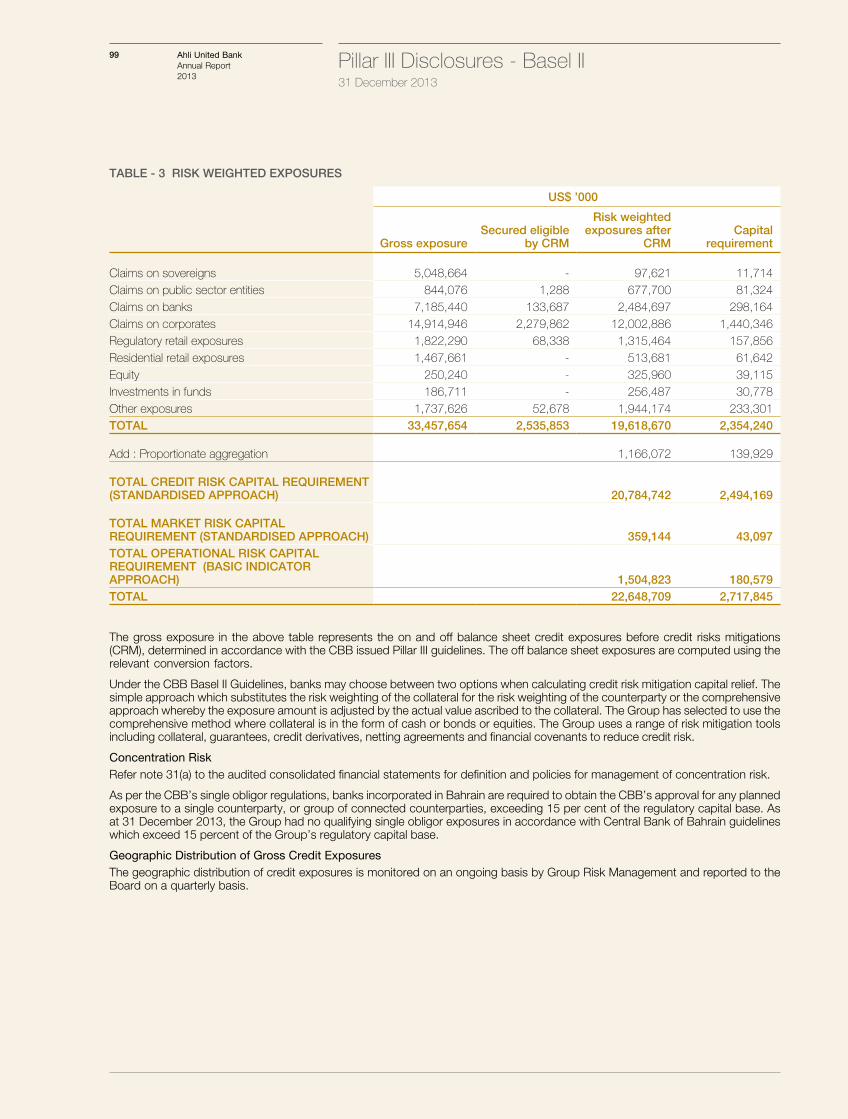
Pillar III Disclosures - Basel II 31 December 2013
99 Ahli United BankAnnual Report 2013
TABLE - 3 RISK WEIGHTED EXPOSURES
US$ ’000
Gross exposureSecured eligible
by CRM
Risk weighted exposures after
CRMCapital
requirement
Claims on sovereigns 5,048,664 - 97,621 11,714 Claims on public sector entities 844,076 1,288 677,700 81,324 Claims on banks 7,185,440 133,687 2,484,697 298,164 Claims on corporates 14,914,946 2,279,862 12,002,886 1,440,346 Regulatory retail exposures 1,822,290 68,338 1,315,464 157,856 Residential retail exposures 1,467,661 - 513,681 61,642 Equity 250,240 - 325,960 39,115 Investments in funds 186,711 - 256,487 30,778 Other exposures 1,737,626 52,678 1,944,174 233,301 TOTAL 33,457,654 2,535,853 19,618,670 2,354,240
Add : Proportionate aggregation 1,166,072 139,929
TOTAL CREDIT RISK CAPITAL REQUIREMENT (STANDARDISED APPROACH) 20,784,742 2,494,169
TOTAL MARKET RISK CAPITAL REQUIREMENT (STANDARDISED APPROACH) 359,144 43,097 TOTAL OPERATIONAL RISK CAPITAL REQUIREMENT (BASIC INDICATOR APPROACH) 1,504,823 180,579 TOTAL 22,648,709 2,717,845
The gross exposure in the above table represents the on and off balance sheet credit exposures before credit risks mitigations (CRM), determined in accordance with the CBB issued Pillar III guidelines. The off balance sheet exposures are computed using the relevant conversion factors.
Under the CBB Basel II Guidelines, banks may choose between two options when calculating credit risk mitigation capital relief. The simple approach which substitutes the risk weighting of the collateral for the risk weighting of the counterparty or the comprehensive approach whereby the exposure amount is adjusted by the actual value ascribed to the collateral. The Group has selected to use the comprehensive method where collateral is in the form of cash or bonds or equities. The Group uses a range of risk mitigation tools including collateral, guarantees, credit derivatives, netting agreements and financial covenants to reduce credit risk.
Concentration RiskRefer note 31(a) to the audited consolidated financial statements for definition and policies for management of concentration risk.
As per the CBB’s single obligor regulations, banks incorporated in Bahrain are required to obtain the CBB’s approval for any planned exposure to a single counterparty, or group of connected counterparties, exceeding 15 per cent of the regulatory capital base. As at 31 December 2013, the Group had no qualifying single obligor exposures in accordance with Central Bank of Bahrain guidelines which exceed 15 percent of the Group’s regulatory capital base.
Geographic Distribution of Gross Credit ExposuresThe geographic distribution of credit exposures is monitored on an ongoing basis by Group Risk Management and reported to the Board on a quarterly basis.
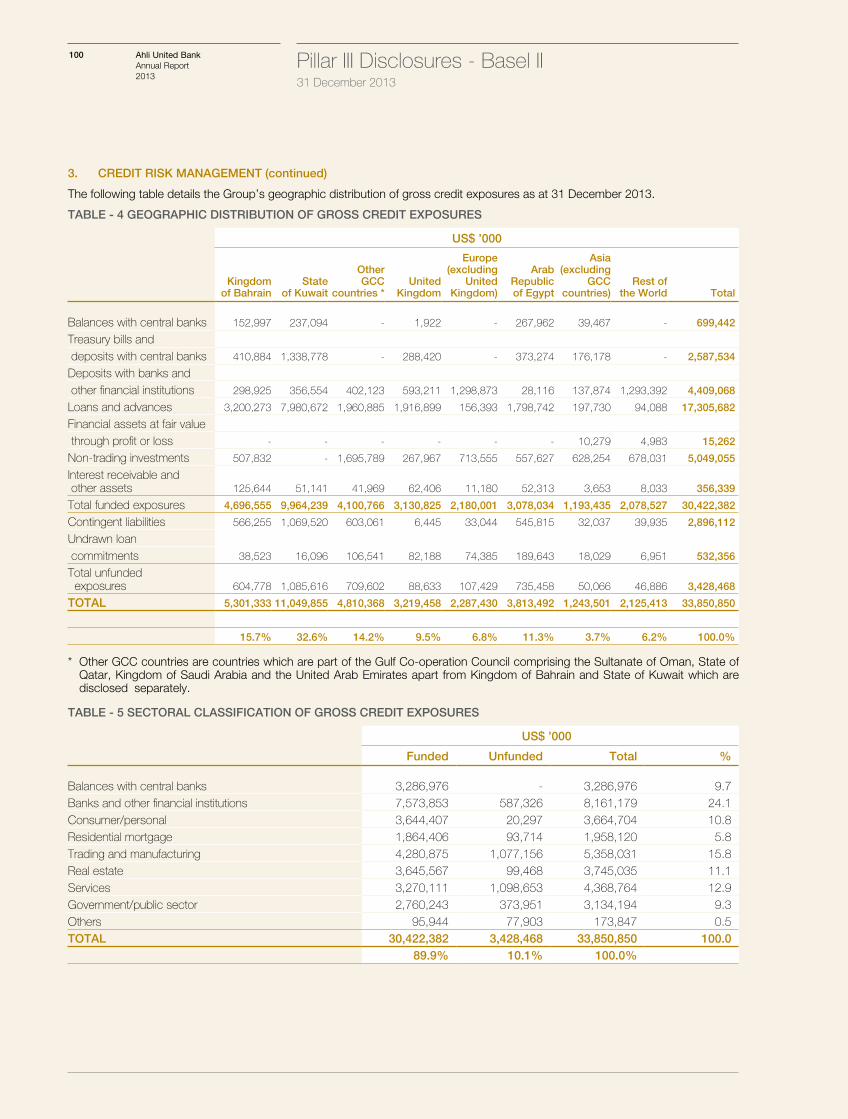
Pillar III Disclosures - Basel II 31 December 2013
100 Ahli United BankAnnual Report 2013
3. CREDIT RISK MANAGEMENT (continued)
The following table details the Group’s geographic distribution of gross credit exposures as at 31 December 2013.
TABLE - 4 GEOGRAPHIC DISTRIBUTION OF GROSS CREDIT EXPOSURES
US$ ’000
Kingdom of Bahrain
State of Kuwait
Other GCC
countries *United
Kingdom
Europe (excluding
United Kingdom)
Arab Republic of Egypt
Asia (excluding
GCC countries)
Rest of the World Total
Balances with central banks 152,997 237,094 - 1,922 - 267,962 39,467 - 699,442
Treasury bills and deposits with central banks 410,884 1,338,778 - 288,420 - 373,274 176,178 - 2,587,534
Deposits with banks and other financial institutions 298,925 356,554 402,123 593,211 1,298,873 28,116 137,874 1,293,392 4,409,068
Loans and advances 3,200,273 7,980,672 1,960,885 1,916,899 156,393 1,798,742 197,730 94,088 17,305,682
Financial assets at fair value through profit or loss - - - - - - 10,279 4,983 15,262
Non-trading investments 507,832 - 1,695,789 267,967 713,555 557,627 628,254 678,031 5,049,055
Interest receivable and other assets 125,644 51,141 41,969 62,406 11,180 52,313 3,653 8,033 356,339
Total funded exposures 4,696,555 9,964,239 4,100,766 3,130,825 2,180,001 3,078,034 1,193,435 2,078,527 30,422,382
Contingent liabilities 566,255 1,069,520 603,061 6,445 33,044 545,815 32,037 39,935 2,896,112
Undrawn loan commitments 38,523 16,096 106,541 82,188 74,385 189,643 18,029 6,951 532,356
Total unfunded exposures 604,778 1,085,616 709,602 88,633 107,429 735,458 50,066 46,886 3,428,468
TOTAL 5,301,333 11,049,855 4,810,368 3,219,458 2,287,430 3,813,492 1,243,501 2,125,413 33,850,850
15.7% 32.6% 14.2% 9.5% 6.8% 11.3% 3.7% 6.2% 100.0%
* Other GCC countries are countries which are part of the Gulf Co-operation Council comprising the Sultanate of Oman, State of Qatar, Kingdom of Saudi Arabia and the United Arab Emirates apart from Kingdom of Bahrain and State of Kuwait which are disclosed separately.
TABLE - 5 SECTORAL CLASSIFICATION OF GROSS CREDIT EXPOSURES
US$ ’000
Funded Unfunded Total %
Balances with central banks 3,286,976 - 3,286,976 9.7Banks and other financial institutions 7,573,853 587,326 8,161,179 24.1Consumer/personal 3,644,407 20,297 3,664,704 10.8Residential mortgage 1,864,406 93,714 1,958,120 5.8Trading and manufacturing 4,280,875 1,077,156 5,358,031 15.8Real estate 3,645,567 99,468 3,745,035 11.1Services 3,270,111 1,098,653 4,368,764 12.9Government/public sector 2,760,243 373,951 3,134,194 9.3Others 95,944 77,903 173,847 0.5TOTAL 30,422,382 3,428,468 33,850,850 100.0
89.9% 10.1% 100.0%
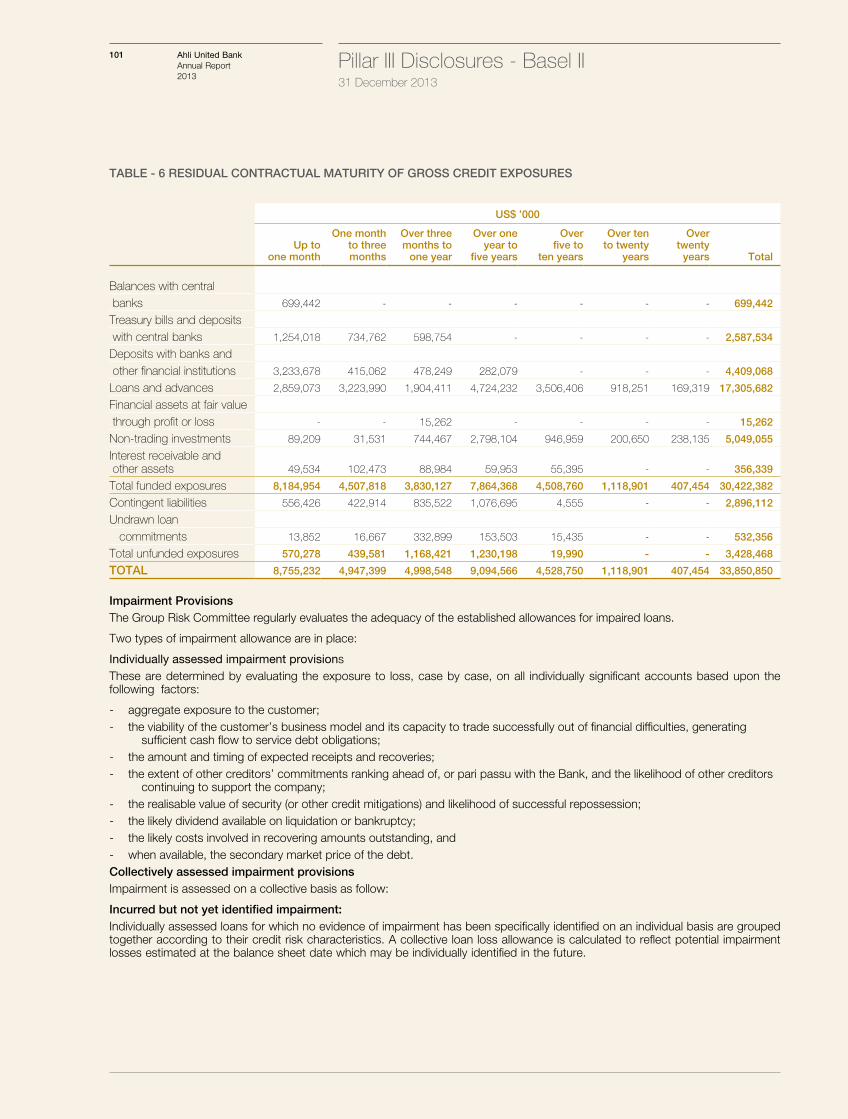
Pillar III Disclosures - Basel II 31 December 2013
101 Ahli United BankAnnual Report 2013
TABLE - 6 RESIDUAL CONTRACTUAL MATURITY OF GROSS CREDIT EXPOSURES
US$ ’000
Up toone month
One monthto threemonths
Over threemonths to
one year
Over oneyear to
five years
Overfive to
ten years
Over ten to twenty
years
Overtwenty
years Total
Balances with central banks 699,442 - - - - - - 699,442
Treasury bills and deposits with central banks 1,254,018 734,762 598,754 - - - - 2,587,534
Deposits with banks and other financial institutions 3,233,678 415,062 478,249 282,079 - - - 4,409,068
Loans and advances 2,859,073 3,223,990 1,904,411 4,724,232 3,506,406 918,251 169,319 17,305,682
Financial assets at fair value through profit or loss - - 15,262 - - - - 15,262
Non-trading investments 89,209 31,531 744,467 2,798,104 946,959 200,650 238,135 5,049,055
Interest receivable and other assets 49,534 102,473 88,984 59,953 55,395 - - 356,339
Total funded exposures 8,184,954 4,507,818 3,830,127 7,864,368 4,508,760 1,118,901 407,454 30,422,382
Contingent liabilities 556,426 422,914 835,522 1,076,695 4,555 - - 2,896,112
Undrawn loan commitments 13,852 16,667 332,899 153,503 15,435 - - 532,356
Total unfunded exposures 570,278 439,581 1,168,421 1,230,198 19,990 - - 3,428,468
TOTAL 8,755,232 4,947,399 4,998,548 9,094,566 4,528,750 1,118,901 407,454 33,850,850
Impairment ProvisionsThe Group Risk Committee regularly evaluates the adequacy of the established allowances for impaired loans.
Two types of impairment allowance are in place:
Individually assessed impairment provisionsThese are determined by evaluating the exposure to loss, case by case, on all individually significant accounts based upon the following factors:
- aggregate exposure to the customer;- the viability of the customer’s business model and its capacity to trade successfully out of financial difficulties, generating
sufficient cash flow to service debt obligations;- the amount and timing of expected receipts and recoveries;- the extent of other creditors’ commitments ranking ahead of, or pari passu with the Bank, and the likelihood of other creditors
continuing to support the company;- the realisable value of security (or other credit mitigations) and likelihood of successful repossession;- the likely dividend available on liquidation or bankruptcy;- the likely costs involved in recovering amounts outstanding, and- when available, the secondary market price of the debt.Collectively assessed impairment provisionsImpairment is assessed on a collective basis as follow:
Incurred but not yet identified impairment:Individually assessed loans for which no evidence of impairment has been specifically identified on an individual basis are grouped together according to their credit risk characteristics. A collective loan loss allowance is calculated to reflect potential impairment losses estimated at the balance sheet date which may be individually identified in the future.
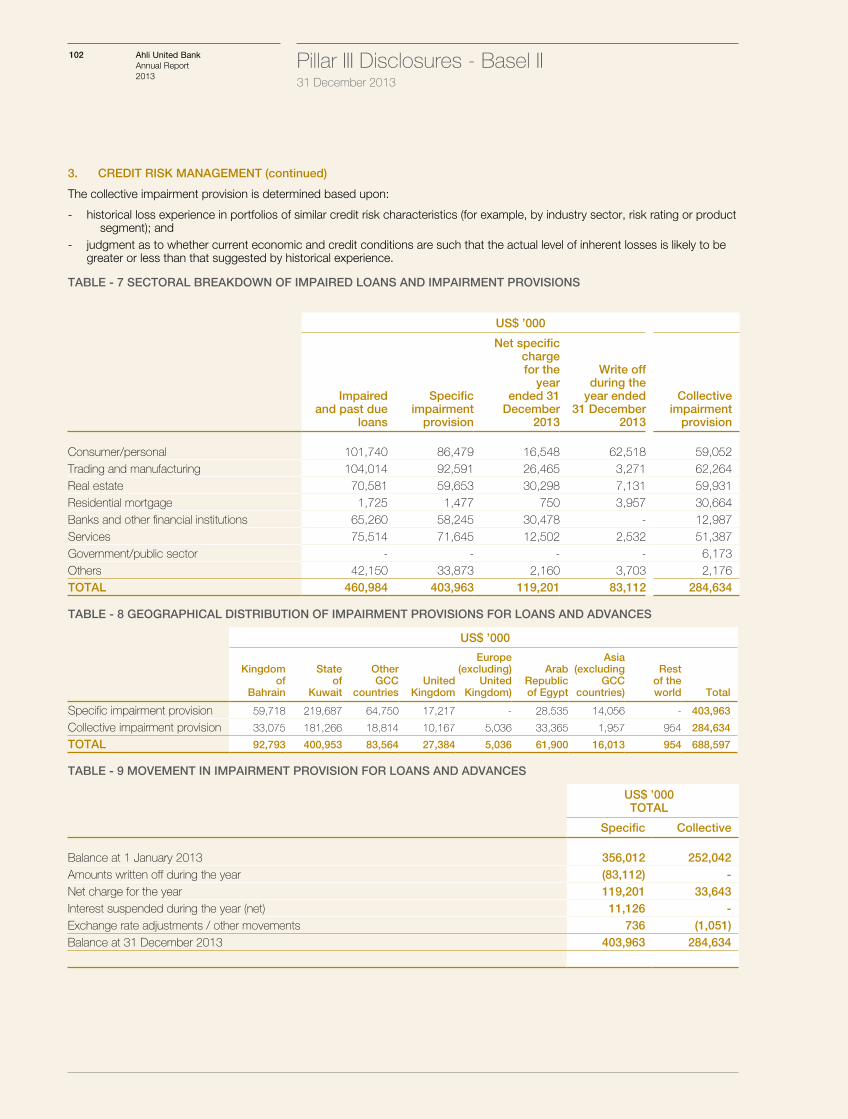
Pillar III Disclosures - Basel II 31 December 2013
102 Ahli United BankAnnual Report 2013
3. CREDIT RISK MANAGEMENT (continued)
The collective impairment provision is determined based upon:
- historical loss experience in portfolios of similar credit risk characteristics (for example, by industry sector, risk rating or product segment); and
- judgment as to whether current economic and credit conditions are such that the actual level of inherent losses is likely to be greater or less than that suggested by historical experience.
TABLE - 7 SECTORAL BREAKDOWN OF IMPAIRED LOANS AND IMPAIRMENT PROVISIONS
US$ ’000
Impaired and past due
loans
Specific impairment
provision
Net specific chargefor the
year ended 31 December
2013
Write offduring the
year ended 31 December
2013
Collective impairment
provision
Consumer/personal 101,740 86,479 16,548 62,518 59,052Trading and manufacturing 104,014 92,591 26,465 3,271 62,264Real estate 70,581 59,653 30,298 7,131 59,931Residential mortgage 1,725 1,477 750 3,957 30,664Banks and other financial institutions 65,260 58,245 30,478 - 12,987Services 75,514 71,645 12,502 2,532 51,387Government/public sector - - - - 6,173Others 42,150 33,873 2,160 3,703 2,176TOTAL 460,984 403,963 119,201 83,112 284,634
TABLE - 8 GEOGRAPHICAL DISTRIBUTION OF IMPAIRMENT PROVISIONS FOR LOANS AND ADVANCES
US$ ’000
Kingdom of
Bahrain
Stateof
Kuwait
OtherGCC
countriesUnited
Kingdom
Europe(excluding)
UnitedKingdom)
Arab Republic of Egypt
Asia(excluding
GCCcountries)
Rest of theworld Total
Specific impairment provision 59,718 219,687 64,750 17,217 - 28,535 14,056 - 403,963
Collective impairment provision 33,075 181,266 18,814 10,167 5,036 33,365 1,957 954 284,634
TOTAL 92,793 400,953 83,564 27,384 5,036 61,900 16,013 954 688,597
TABLE - 9 MOVEMENT IN IMPAIRMENT PROVISION FOR LOANS AND ADVANCES
US$ ’000TOTAL
Specific Collective
Balance at 1 January 2013 356,012 252,042Amounts written off during the year (83,112) -Net charge for the year 119,201 33,643Interest suspended during the year (net) 11,126 -Exchange rate adjustments / other movements 736 (1,051)Balance at 31 December 2013 403,963 284,634
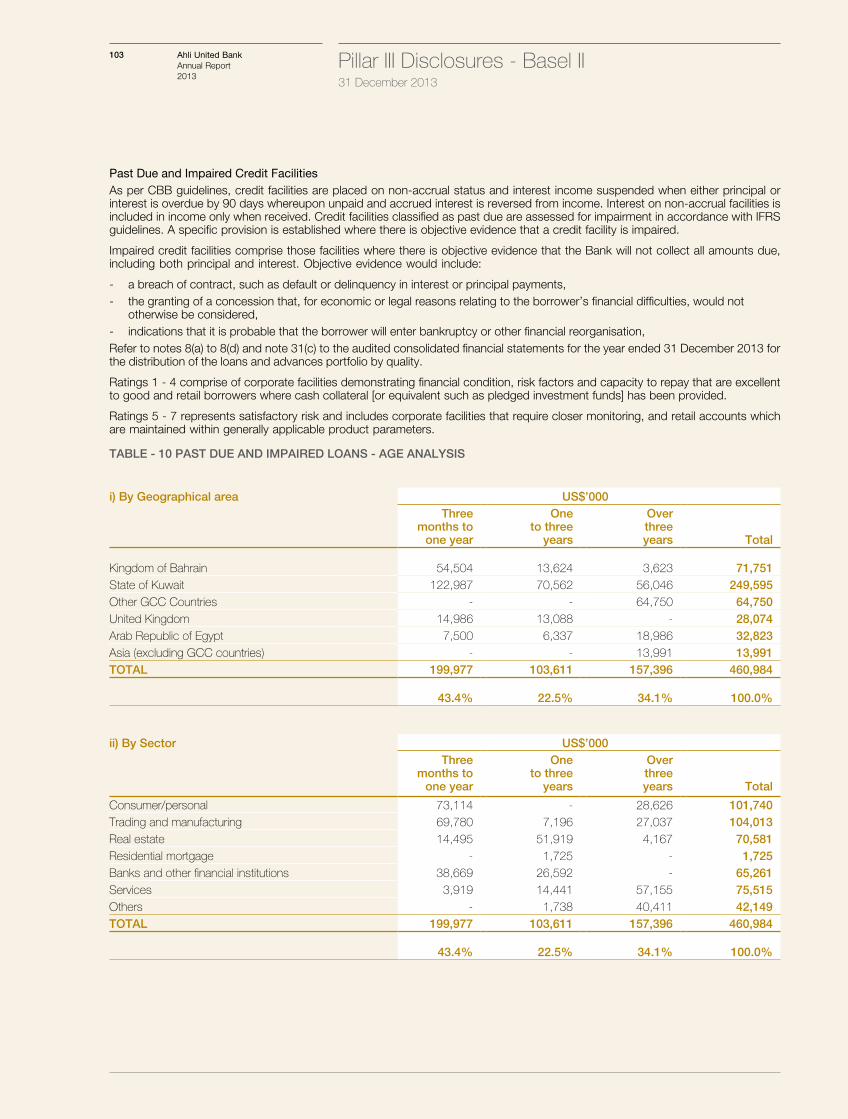
Pillar III Disclosures - Basel II 31 December 2013
103 Ahli United BankAnnual Report 2013
Past Due and Impaired Credit FacilitiesAs per CBB guidelines, credit facilities are placed on non-accrual status and interest income suspended when either principal or interest is overdue by 90 days whereupon unpaid and accrued interest is reversed from income. Interest on non-accrual facilities is included in income only when received. Credit facilities classified as past due are assessed for impairment in accordance with IFRS guidelines. A specific provision is established where there is objective evidence that a credit facility is impaired.
Impaired credit facilities comprise those facilities where there is objective evidence that the Bank will not collect all amounts due, including both principal and interest. Objective evidence would include:
- a breach of contract, such as default or delinquency in interest or principal payments, - the granting of a concession that, for economic or legal reasons relating to the borrower’s financial difficulties, would not
otherwise be considered, - indications that it is probable that the borrower will enter bankruptcy or other financial reorganisation, Refer to notes 8(a) to 8(d) and note 31(c) to the audited consolidated financial statements for the year ended 31 December 2013 for the distribution of the loans and advances portfolio by quality.
Ratings 1 - 4 comprise of corporate facilities demonstrating financial condition, risk factors and capacity to repay that are excellent to good and retail borrowers where cash collateral [or equivalent such as pledged investment funds] has been provided.
Ratings 5 - 7 represents satisfactory risk and includes corporate facilities that require closer monitoring, and retail accounts which are maintained within generally applicable product parameters.
TABLE - 10 PAST DUE AND IMPAIRED LOANS - AGE ANALYSIS
i) By Geographical area US$’000Three
months toone year
Oneto three
years
Over threeyears Total
Kingdom of Bahrain 54,504 13,624 3,623 71,751State of Kuwait 122,987 70,562 56,046 249,595Other GCC Countries - - 64,750 64,750United Kingdom 14,986 13,088 - 28,074Arab Republic of Egypt 7,500 6,337 18,986 32,823Asia (excluding GCC countries) - - 13,991 13,991TOTAL 199,977 103,611 157,396 460,984
43.4% 22.5% 34.1% 100.0%
ii) By Sector US$’000Three
months toone year
Oneto three
years
Over threeyears Total
Consumer/personal 73,114 - 28,626 101,740Trading and manufacturing 69,780 7,196 27,037 104,013Real estate 14,495 51,919 4,167 70,581Residential mortgage - 1,725 - 1,725Banks and other financial institutions 38,669 26,592 - 65,261Services 3,919 14,441 57,155 75,515Others - 1,738 40,411 42,149TOTAL 199,977 103,611 157,396 460,984
43.4% 22.5% 34.1% 100.0%
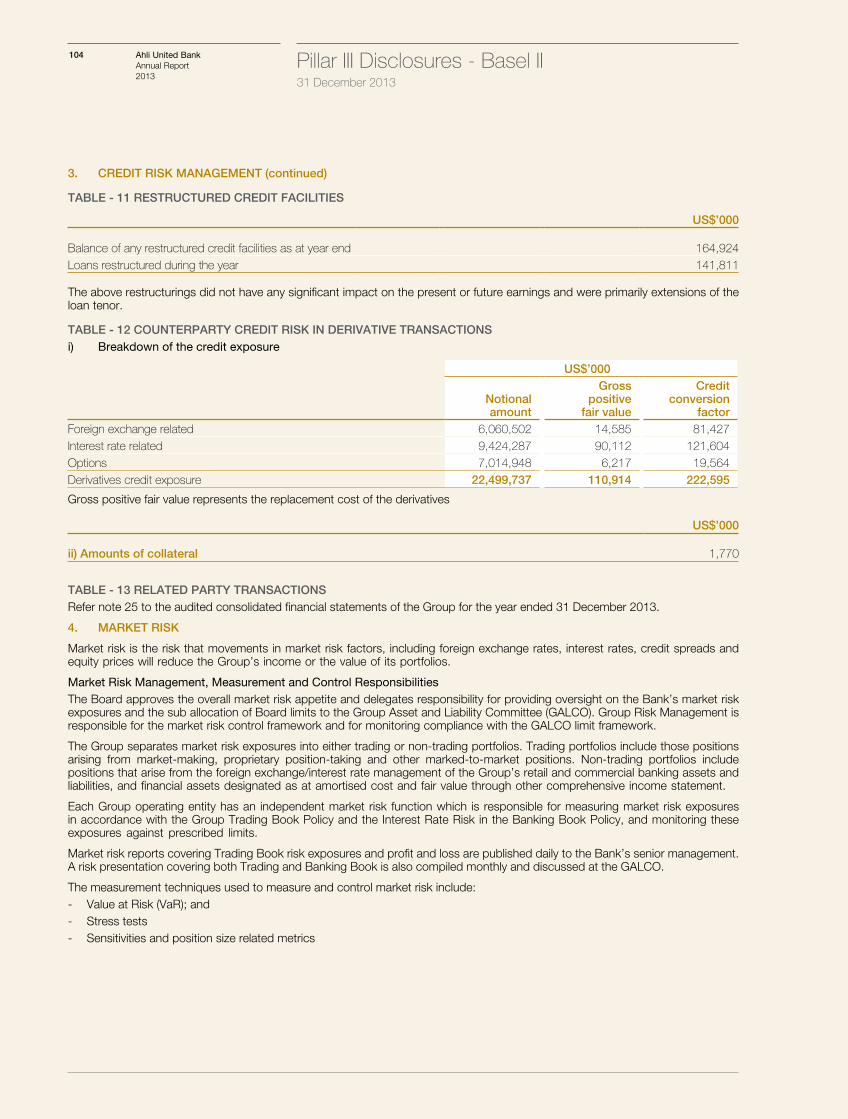
Pillar III Disclosures - Basel II 31 December 2013
104 Ahli United BankAnnual Report 2013
3. CREDIT RISK MANAGEMENT (continued)
TABLE - 11 RESTRUCTURED CREDIT FACILITIES
US$’000
Balance of any restructured credit facilities as at year end 164,924 Loans restructured during the year 141,811
The above restructurings did not have any significant impact on the present or future earnings and were primarily extensions of the loan tenor.
TABLE - 12 COUNTERPARTY CREDIT RISK IN DERIVATIVE TRANSACTIONSi) Breakdown of the credit exposure
US$’000
Notionalamount
Grosspositive
fair value
Creditconversion
factorForeign exchange related 6,060,502 14,585 81,427Interest rate related 9,424,287 90,112 121,604Options 7,014,948 6,217 19,564Derivatives credit exposure 22,499,737 110,914 222,595
Gross positive fair value represents the replacement cost of the derivatives
US$’000
ii) Amounts of collateral 1,770
TABLE - 13 RELATED PARTY TRANSACTIONSRefer note 25 to the audited consolidated financial statements of the Group for the year ended 31 December 2013.
4. MARKET RISK
Market risk is the risk that movements in market risk factors, including foreign exchange rates, interest rates, credit spreads and equity prices will reduce the Group’s income or the value of its portfolios.
Market Risk Management, Measurement and Control ResponsibilitiesThe Board approves the overall market risk appetite and delegates responsibility for providing oversight on the Bank’s market risk exposures and the sub allocation of Board limits to the Group Asset and Liability Committee (GALCO). Group Risk Management is responsible for the market risk control framework and for monitoring compliance with the GALCO limit framework.
The Group separates market risk exposures into either trading or non-trading portfolios. Trading portfolios include those positions arising from market-making, proprietary position-taking and other marked-to-market positions. Non-trading portfolios include positions that arise from the foreign exchange/interest rate management of the Group’s retail and commercial banking assets and liabilities, and financial assets designated as at amortised cost and fair value through other comprehensive income statement.
Each Group operating entity has an independent market risk function which is responsible for measuring market risk exposures in accordance with the Group Trading Book Policy and the Interest Rate Risk in the Banking Book Policy, and monitoring these exposures against prescribed limits.
Market risk reports covering Trading Book risk exposures and profit and loss are published daily to the Bank’s senior management. A risk presentation covering both Trading and Banking Book is also compiled monthly and discussed at the GALCO.
The measurement techniques used to measure and control market risk include:- Value at Risk (VaR); and - Stress tests- Sensitivities and position size related metrics
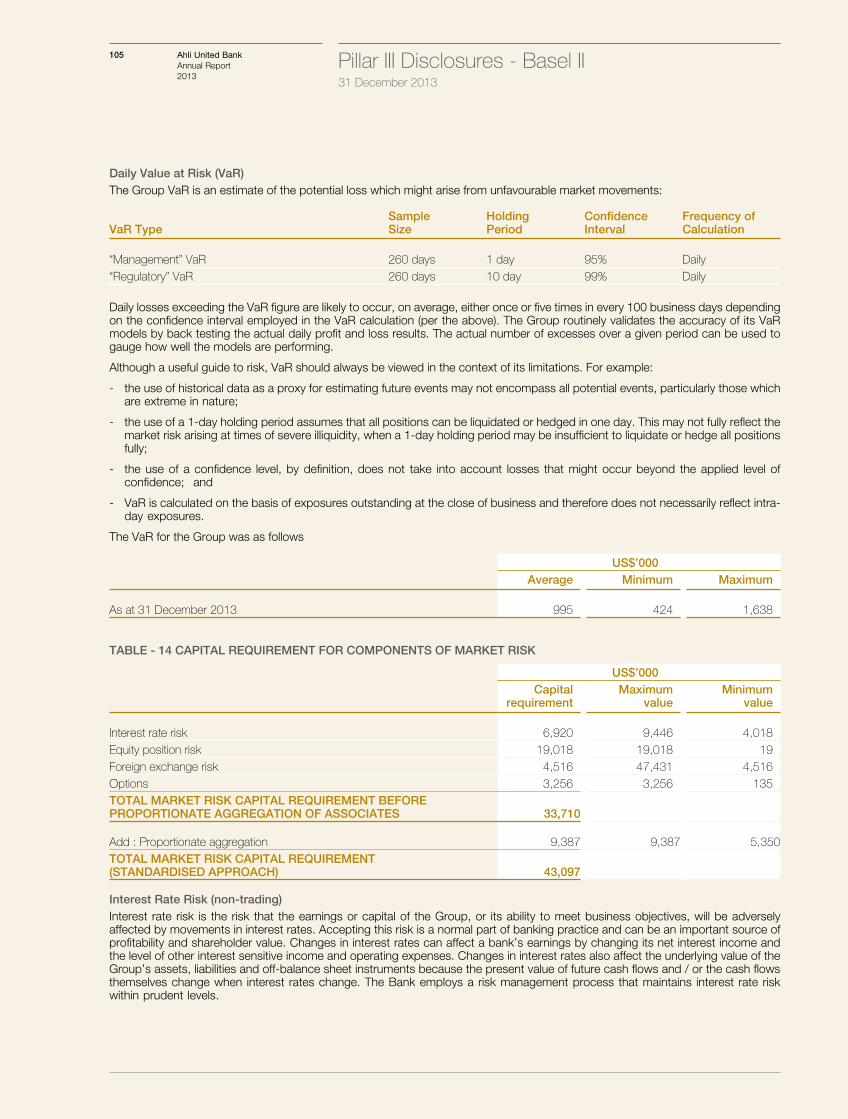
Pillar III Disclosures - Basel II 31 December 2013
105 Ahli United BankAnnual Report 2013
Daily Value at Risk (VaR)The Group VaR is an estimate of the potential loss which might arise from unfavourable market movements:
VaR TypeSampleSize
HoldingPeriod
ConfidenceInterval
Frequency of Calculation
“Management” VaR 260 days 1 day 95% Daily“Regulatory” VaR 260 days 10 day 99% Daily
Daily losses exceeding the VaR figure are likely to occur, on average, either once or five times in every 100 business days depending on the confidence interval employed in the VaR calculation (per the above). The Group routinely validates the accuracy of its VaR models by back testing the actual daily profit and loss results. The actual number of excesses over a given period can be used to gauge how well the models are performing.
Although a useful guide to risk, VaR should always be viewed in the context of its limitations. For example:
- the use of historical data as a proxy for estimating future events may not encompass all potential events, particularly those which are extreme in nature;
- the use of a 1-day holding period assumes that all positions can be liquidated or hedged in one day. This may not fully reflect the market risk arising at times of severe illiquidity, when a 1-day holding period may be insufficient to liquidate or hedge all positions fully;
- the use of a confidence level, by definition, does not take into account losses that might occur beyond the applied level of confidence; and
- VaR is calculated on the basis of exposures outstanding at the close of business and therefore does not necessarily reflect intra-day exposures.
The VaR for the Group was as follows
US$’000Average Minimum Maximum
As at 31 December 2013 995 424 1,638
TABLE - 14 CAPITAL REQUIREMENT FOR COMPONENTS OF MARKET RISK
US$’000Capital
requirementMaximum
valueMinimum
value
Interest rate risk 6,920 9,446 4,018Equity position risk 19,018 19,018 19Foreign exchange risk 4,516 47,431 4,516Options 3,256 3,256 135TOTAL MARKET RISK CAPITAL REQUIREMENT BEFORE PROPORTIONATE AGGREGATION OF ASSOCIATES 33,710
Add : Proportionate aggregation 9,387 9,387 5,350TOTAL MARKET RISK CAPITAL REQUIREMENT (STANDARDISED APPROACH) 43,097
Interest Rate Risk (non-trading)Interest rate risk is the risk that the earnings or capital of the Group, or its ability to meet business objectives, will be adversely affected by movements in interest rates. Accepting this risk is a normal part of banking practice and can be an important source of profitability and shareholder value. Changes in interest rates can affect a bank’s earnings by changing its net interest income and the level of other interest sensitive income and operating expenses. Changes in interest rates also affect the underlying value of the Group’s assets, liabilities and off-balance sheet instruments because the present value of future cash flows and / or the cash flows themselves change when interest rates change. The Bank employs a risk management process that maintains interest rate risk within prudent levels.
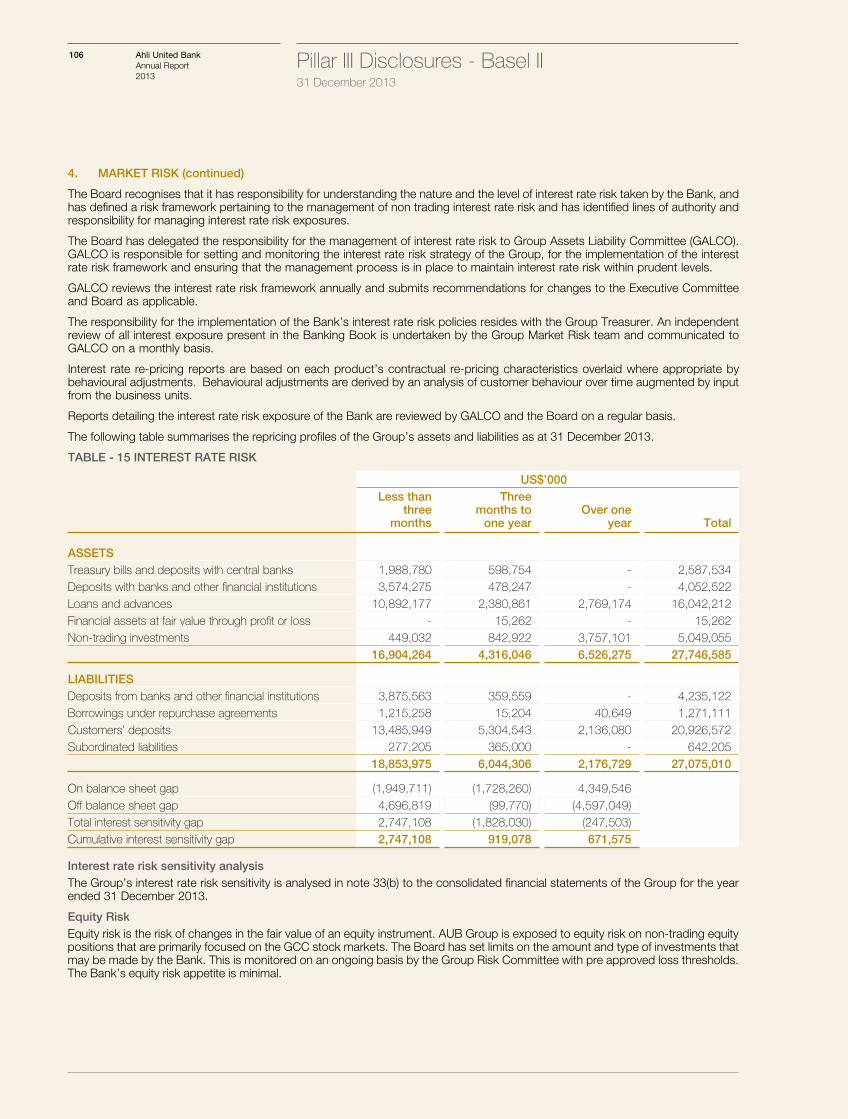
Pillar III Disclosures - Basel II 31 December 2013
106 Ahli United BankAnnual Report 2013
4. MARKET RISK (continued)
The Board recognises that it has responsibility for understanding the nature and the level of interest rate risk taken by the Bank, and has defined a risk framework pertaining to the management of non trading interest rate risk and has identified lines of authority and responsibility for managing interest rate risk exposures.
The Board has delegated the responsibility for the management of interest rate risk to Group Assets Liability Committee (GALCO). GALCO is responsible for setting and monitoring the interest rate risk strategy of the Group, for the implementation of the interest rate risk framework and ensuring that the management process is in place to maintain interest rate risk within prudent levels.
GALCO reviews the interest rate risk framework annually and submits recommendations for changes to the Executive Committee and Board as applicable.
The responsibility for the implementation of the Bank’s interest rate risk policies resides with the Group Treasurer. An independent review of all interest exposure present in the Banking Book is undertaken by the Group Market Risk team and communicated to GALCO on a monthly basis.
Interest rate re-pricing reports are based on each product’s contractual re-pricing characteristics overlaid where appropriate by behavioural adjustments. Behavioural adjustments are derived by an analysis of customer behaviour over time augmented by input from the business units.
Reports detailing the interest rate risk exposure of the Bank are reviewed by GALCO and the Board on a regular basis.
The following table summarises the repricing profiles of the Group’s assets and liabilities as at 31 December 2013.
TABLE - 15 INTEREST RATE RISK
US$’000Less than
threemonths
Threemonths to
one yearOver one
year Total
ASSETSTreasury bills and deposits with central banks 1,988,780 598,754 - 2,587,534Deposits with banks and other financial institutions 3,574,275 478,247 - 4,052,522Loans and advances 10,892,177 2,380,861 2,769,174 16,042,212Financial assets at fair value through profit or loss - 15,262 - 15,262Non-trading investments 449,032 842,922 3,757,101 5,049,055
16,904,264 4,316,046 6,526,275 27,746,585
LIABILITIES Deposits from banks and other financial institutions 3,875,563 359,559 - 4,235,122Borrowings under repurchase agreements 1,215,258 15,204 40,649 1,271,111Customers’ deposits 13,485,949 5,304,543 2,136,080 20,926,572Subordinated liabilities 277,205 365,000 - 642,205
18,853,975 6,044,306 2,176,729 27,075,010
On balance sheet gap (1,949,711) (1,728,260) 4,349,546Off balance sheet gap 4,696,819 (99,770) (4,597,049)Total interest sensitivity gap 2,747,108 (1,828,030) (247,503)Cumulative interest sensitivity gap 2,747,108 919,078 671,575
Interest rate risk sensitivity analysisThe Group’s interest rate risk sensitivity is analysed in note 33(b) to the consolidated financial statements of the Group for the year ended 31 December 2013.
Equity RiskEquity risk is the risk of changes in the fair value of an equity instrument. AUB Group is exposed to equity risk on non-trading equity positions that are primarily focused on the GCC stock markets. The Board has set limits on the amount and type of investments that may be made by the Bank. This is monitored on an ongoing basis by the Group Risk Committee with pre approved loss thresholds. The Bank’s equity risk appetite is minimal.
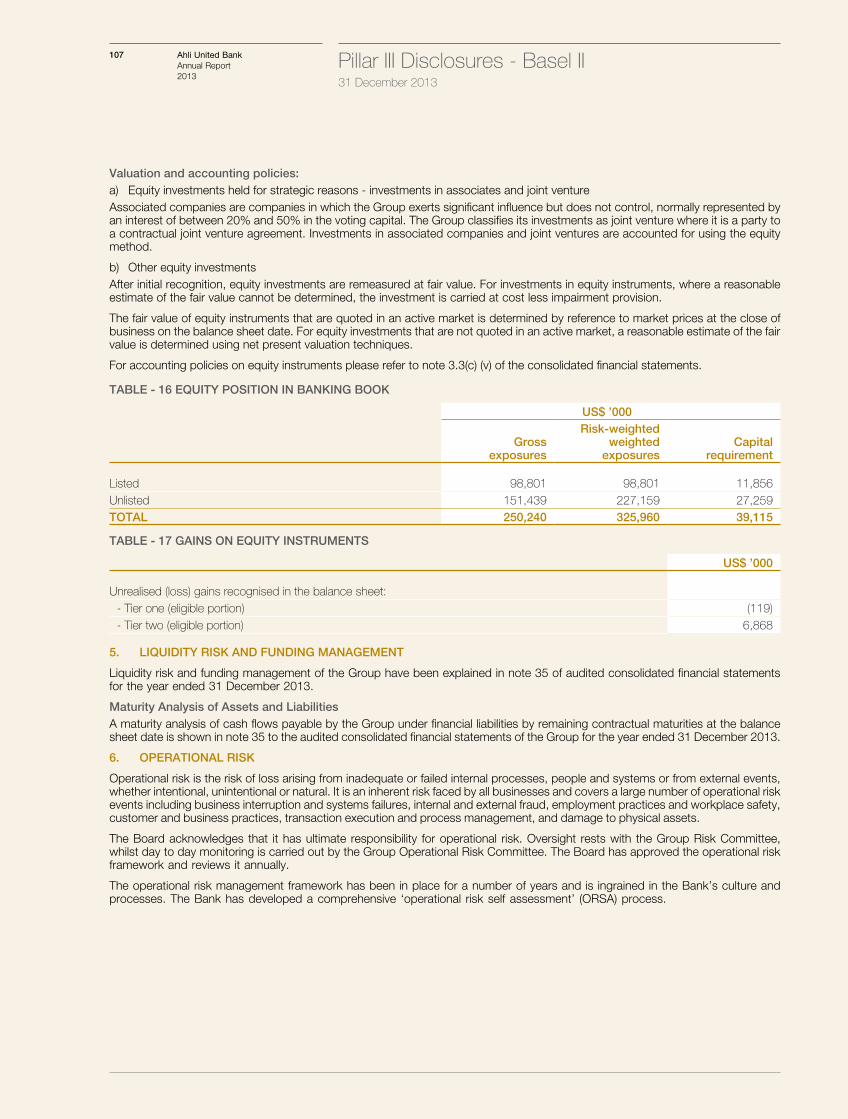
Pillar III Disclosures - Basel II 31 December 2013
107 Ahli United BankAnnual Report 2013
Valuation and accounting policies:a) Equity investments held for strategic reasons - investments in associates and joint ventureAssociated companies are companies in which the Group exerts significant influence but does not control, normally represented by an interest of between 20% and 50% in the voting capital. The Group classifies its investments as joint venture where it is a party to a contractual joint venture agreement. Investments in associated companies and joint ventures are accounted for using the equity method.
b) Other equity investmentsAfter initial recognition, equity investments are remeasured at fair value. For investments in equity instruments, where a reasonable estimate of the fair value cannot be determined, the investment is carried at cost less impairment provision.
The fair value of equity instruments that are quoted in an active market is determined by reference to market prices at the close of business on the balance sheet date. For equity investments that are not quoted in an active market, a reasonable estimate of the fair value is determined using net present valuation techniques.
For accounting policies on equity instruments please refer to note 3.3(c) (v) of the consolidated financial statements.
TABLE - 16 EQUITY POSITION IN BANKING BOOK
US$ ’000
Gross exposures
Risk-weightedweighted
exposuresCapital
requirement
Listed 98,801 98,801 11,856Unlisted 151,439 227,159 27,259TOTAL 250,240 325,960 39,115
TABLE - 17 GAINS ON EQUITY INSTRUMENTS
US$ ’000
Unrealised (loss) gains recognised in the balance sheet:- Tier one (eligible portion) (119)- Tier two (eligible portion) 6,868
5. LIQUIDITY RISK AND FUNDING MANAGEMENT
Liquidity risk and funding management of the Group have been explained in note 35 of audited consolidated financial statements for the year ended 31 December 2013.
Maturity Analysis of Assets and LiabilitiesA maturity analysis of cash flows payable by the Group under financial liabilities by remaining contractual maturities at the balance sheet date is shown in note 35 to the audited consolidated financial statements of the Group for the year ended 31 December 2013.
6. OPERATIONAL RISK
Operational risk is the risk of loss arising from inadequate or failed internal processes, people and systems or from external events, whether intentional, unintentional or natural. It is an inherent risk faced by all businesses and covers a large number of operational risk events including business interruption and systems failures, internal and external fraud, employment practices and workplace safety, customer and business practices, transaction execution and process management, and damage to physical assets.
The Board acknowledges that it has ultimate responsibility for operational risk. Oversight rests with the Group Risk Committee, whilst day to day monitoring is carried out by the Group Operational Risk Committee. The Board has approved the operational risk framework and reviews it annually.
The operational risk management framework has been in place for a number of years and is ingrained in the Bank’s culture and processes. The Bank has developed a comprehensive ‘operational risk self assessment’ (ORSA) process.
Pillar III Disclosures - Basel II 31 December 2013
108 Ahli United BankAnnual Report 2013
7. INFORMATION TECHNOLOGY RISK
All computer system developments and operations are centrally controlled and common systems are employed across the Group wherever possible. Information security is defined through the AUB Group Information Security framework and is executed through various information security processes and controls that support the framework. The Group follows an enterprise wide approach to business continuity to ensure that all identified critical operations, services and systems are recovered in time in the event of a disruption. The Business Continuity Policy is updated annually while the Disaster Recovery and Business Continuity capabilities are each tested twice per year and critical systems are continuously replicated at the disaster recovery site.
8. STRATEGIC RISK
The Board supported by Strategic Development Unit and the Group Finance manages strategic risk on an ongoing basis. The Board receives regular performance reports with details of strategic / regulatory issues as they arise.
9. LEGAL, COMPLIANCE, REGULATORY AND REPUTATIONAL RISKS
Protecting the Legal, Compliance, Regulatory and Reputational Risks of the Group is of paramount importance and all management and staff are expected to apply highest standards of business conduct and professional ethics at all times.
The Board approved policies, including AUB Group Reputation Risk policy, Communications Policy, Personal Account Dealing Policy, Compliance Policy, Anti Money Laundering policy, Banking Integrity Policy and Code of Business conduct policy, prescribes the required standards of ethical behavior and personal conduct for all staff (including the Bank’s Directors), and the Board exercises an oversight of these risks through various management functions, including Legal, Risk Management, Compliance, Human Resources and Internal Audit Department.
10. ENVIRONMENTAL RISK
The Bank recognises the importance of environmental and social issues within its risk framework, and has established a Social and Environmental Management System (SEMS) which details the policy, procedures and workflow that will be followed by the Bank and its subsidiaries / affiliates in respect of environmental risk.
The Bank continually endeavours to implement effective social and environmental management practices in all its activities, products and services with a focus on the applicable national laws on environmental, health, safety and social issues.
The Bank has adopted the Equator Principles (EP), a globally recognized benchmark for managing social and environmental risks in project finance. EP is an arrangement by financial institutions worldwide to adhere to the environmental, health and safety standards while financing projects.
As such the Bank will finance projects only when they are expected to be designed, built, operated and maintained in a manner consistent with the applicable national laws.


Ahli United Bank B.S.C.
Building 2495, Road 2832, Al-Seef DistrictP. O. Box 2424, Manama, Kingdom of Bahrain
Telephone: +973 17 585 858, Facsimile: +973 17 580 569
Email: [email protected], www.ahliunited.com